1. Introduction
The earth and its environment, being highly complex in nature, are difficult to understand through the use of only one technology. An integrated use of different technologies has been proven highly useful in a complex situation where problems cannot be identified through the use of a single technology, and thus a solution to the problem cannot be proposed. An assessment and identification of landslide and soil erosion areas is one of those complex situations where integral use of different technologies can be useful, especially in case of an urban park where managers and planners of such facilities are confronted with the difficulty of achieving a balance between preservation, sustainability, and future development of new attractions in the area [
1]. The World Tourism Organization (WTO) has emphasized the need of careful planning, managing, and the continuous monitoring of protected and conservation areas to ensure the long-term sustainability of a tourism operation within these areas [
2]. An absence of such an efficient and effective information system might contribute to the degradation of these areas and reduction of tourist activities [
3].
In addition to that, the Development Act of 2007 of Saskatchewan requires that all the municipalities of the province should identify areas prone to natural hazards before initiating any planning, rezoning, and development activities within the jurisdictions of the municipality [
4]. Risk assessment and analysis of these hazards is a complex phenomenon and perhaps cannot be done through the use of a single technology. Landslides as defined by Cruden (1991), is “the movement of a mass of rock, debris or earth down a slope” [
5], and can occur due to the instability of soil, caused by a variety of natural phenomena including erosion, excessive moisture, shocks and vibrations, overdevelopment, and deforestation [
6]. These landslides can cause extensive damage to environment and infrastructure. They are a potential source of distress for both residents and the local government. Landslide susceptibility and hazard mapping are thus crucial to save lives, to reduce the cost of repairs and to mitigate other effects caused by the disaster. Different techniques have been used for landslide susceptibility and hazard mapping. Safaei et al. (2010) while summarizing and comparing these methods, argue that the use of geospatial technologies including GIS and remote sensing tools and methods, can significantly improve efficiency of the mapping process [
7]. Geological parameters such as lithological conditions, structural variations, can greatly influence the occurrence of landslides [
8]. The project area is dominated by vertisolic soils with fine textured clayey deposits having a unique shrink-swell characteristics [
9]. The area is vulnerable to soil erosion and landslides because of minimal or no presence of hard rocks to stabilize the land surface. Thus, Digital Elevation Model (DEM) derived geomorphological parameters such as slope, aspect, surface roughness and elevation are among the determining factors for identification of areas prone to landslides [
10]. The probability of landslide occurrence has a direct relationship with the slope, as it increases with the slope [
11]. Soeters and van Westen (1996) argue that slopes greater than 35° have a high probability of debris avalanche and areas of slope less than 15° are relatively more stable [
12]. Similarly, landslide-prone areas have higher surface roughness as compared with the neighbouring areas [
13]. Thus in this case, these two parameters—i.e., slope and surface roughness—can provide sufficient basis for the identification of landslide prone areas.
Traditional techniques for identification of areas prone to landslides involve labour intensive surveys posing a safety risk to the surveyors, especially in the inaccessible areas. Though aerial photographs and satellites images can effectively be used for land-cover and land-use mapping, however, they provide limited elevation information and thus cannot be used to develop an accurate digital elevation model. High-resolution remote sensing imageries draped over contour maps can be used for slope analysis, but the accuracy of such analysis depends upon the accuracy of the contour information. Traditionally, historical contour maps do not have the required spatial resolution, limiting the use of aerial photographs for slope analysis [
14]. These limitations can be resolved through the use of point cloud LiDAR (Light Detection and Ranging) data as it allows a better exploitation of surface morphology and can be used to develop an accurate three-dimensional surface model (DSM). Sub-meter vertical accuracies can be achieved from the point cloud (LiDAR) data offering an advantage over most of the surface datasets collected in the past [
15]. Thus, it can effectively be used for identification of landslide prone areas [
16].
Water flowing in a river has a natural tendency to cause erosion along its banks and cut through the underlying surface. Thus, it can form a canyon over time while flowing along a steep slope in the regions where the soil is intermingled with relatively harder layers. The areas along the cliff of the canyon and along the banks of the river passing though it can be prone to landslide and soil erosion. Some of these canyons are declared as conservation areas, and national/provincial parks are attracting visitors for their excursion activities. One of such canyons exists along Moose Jaw River just south of the Moose Jaw, Saskatchewan, Canada and is known as Wakamow Valley. The area is prone to natural hazards including flooding, slumping and slope instability resulting in landslides and soil erosion. Snow melt during spring season or heavy precipitation can cause flood conditions, increasing the potential risk of these hazards.
An integrated use of remote sensing and GIS technologies can provide an effective solution to this problem and has been explored in this study. Remote sensing technologies including high-resolution aerial photographs and point cloud LiDAR data can play a major role in the identification of these areas. While high-resolution aerial photographs can be used for identification and classification of land-use features, point cloud LiDAR data can be used to create a Digital Elevation Model (DEM) of the area and to generate elevation contours within the project area. This information is highly useful for identification and assessment of areas prone to natural hazards. Similarly, Geographic Information System (GIS) offers a unique advantage to storing, retrieving, and updating additional information obtained through ground truth surveys and other resources.
The canyon-shaped Wakamow Valley has a unique and distinctive ecosystem. The valley, being in the flood zone, is prone to additional ecological stress and requires regular monitoring and maintenance. Hence, it is best suited for this study. It also offers an additional advantage as the information collected through this can effectively be used by the city of Moose Jaw and the Wakamow Conservation Authority for management and future development of the area. This study is an attempt to demonstrate the usefulness of the integrated use of the remote sensing and GIS technologies for assessment of the areas prone to landslide and soil erosion in an urban park.
2. Materials and Methods
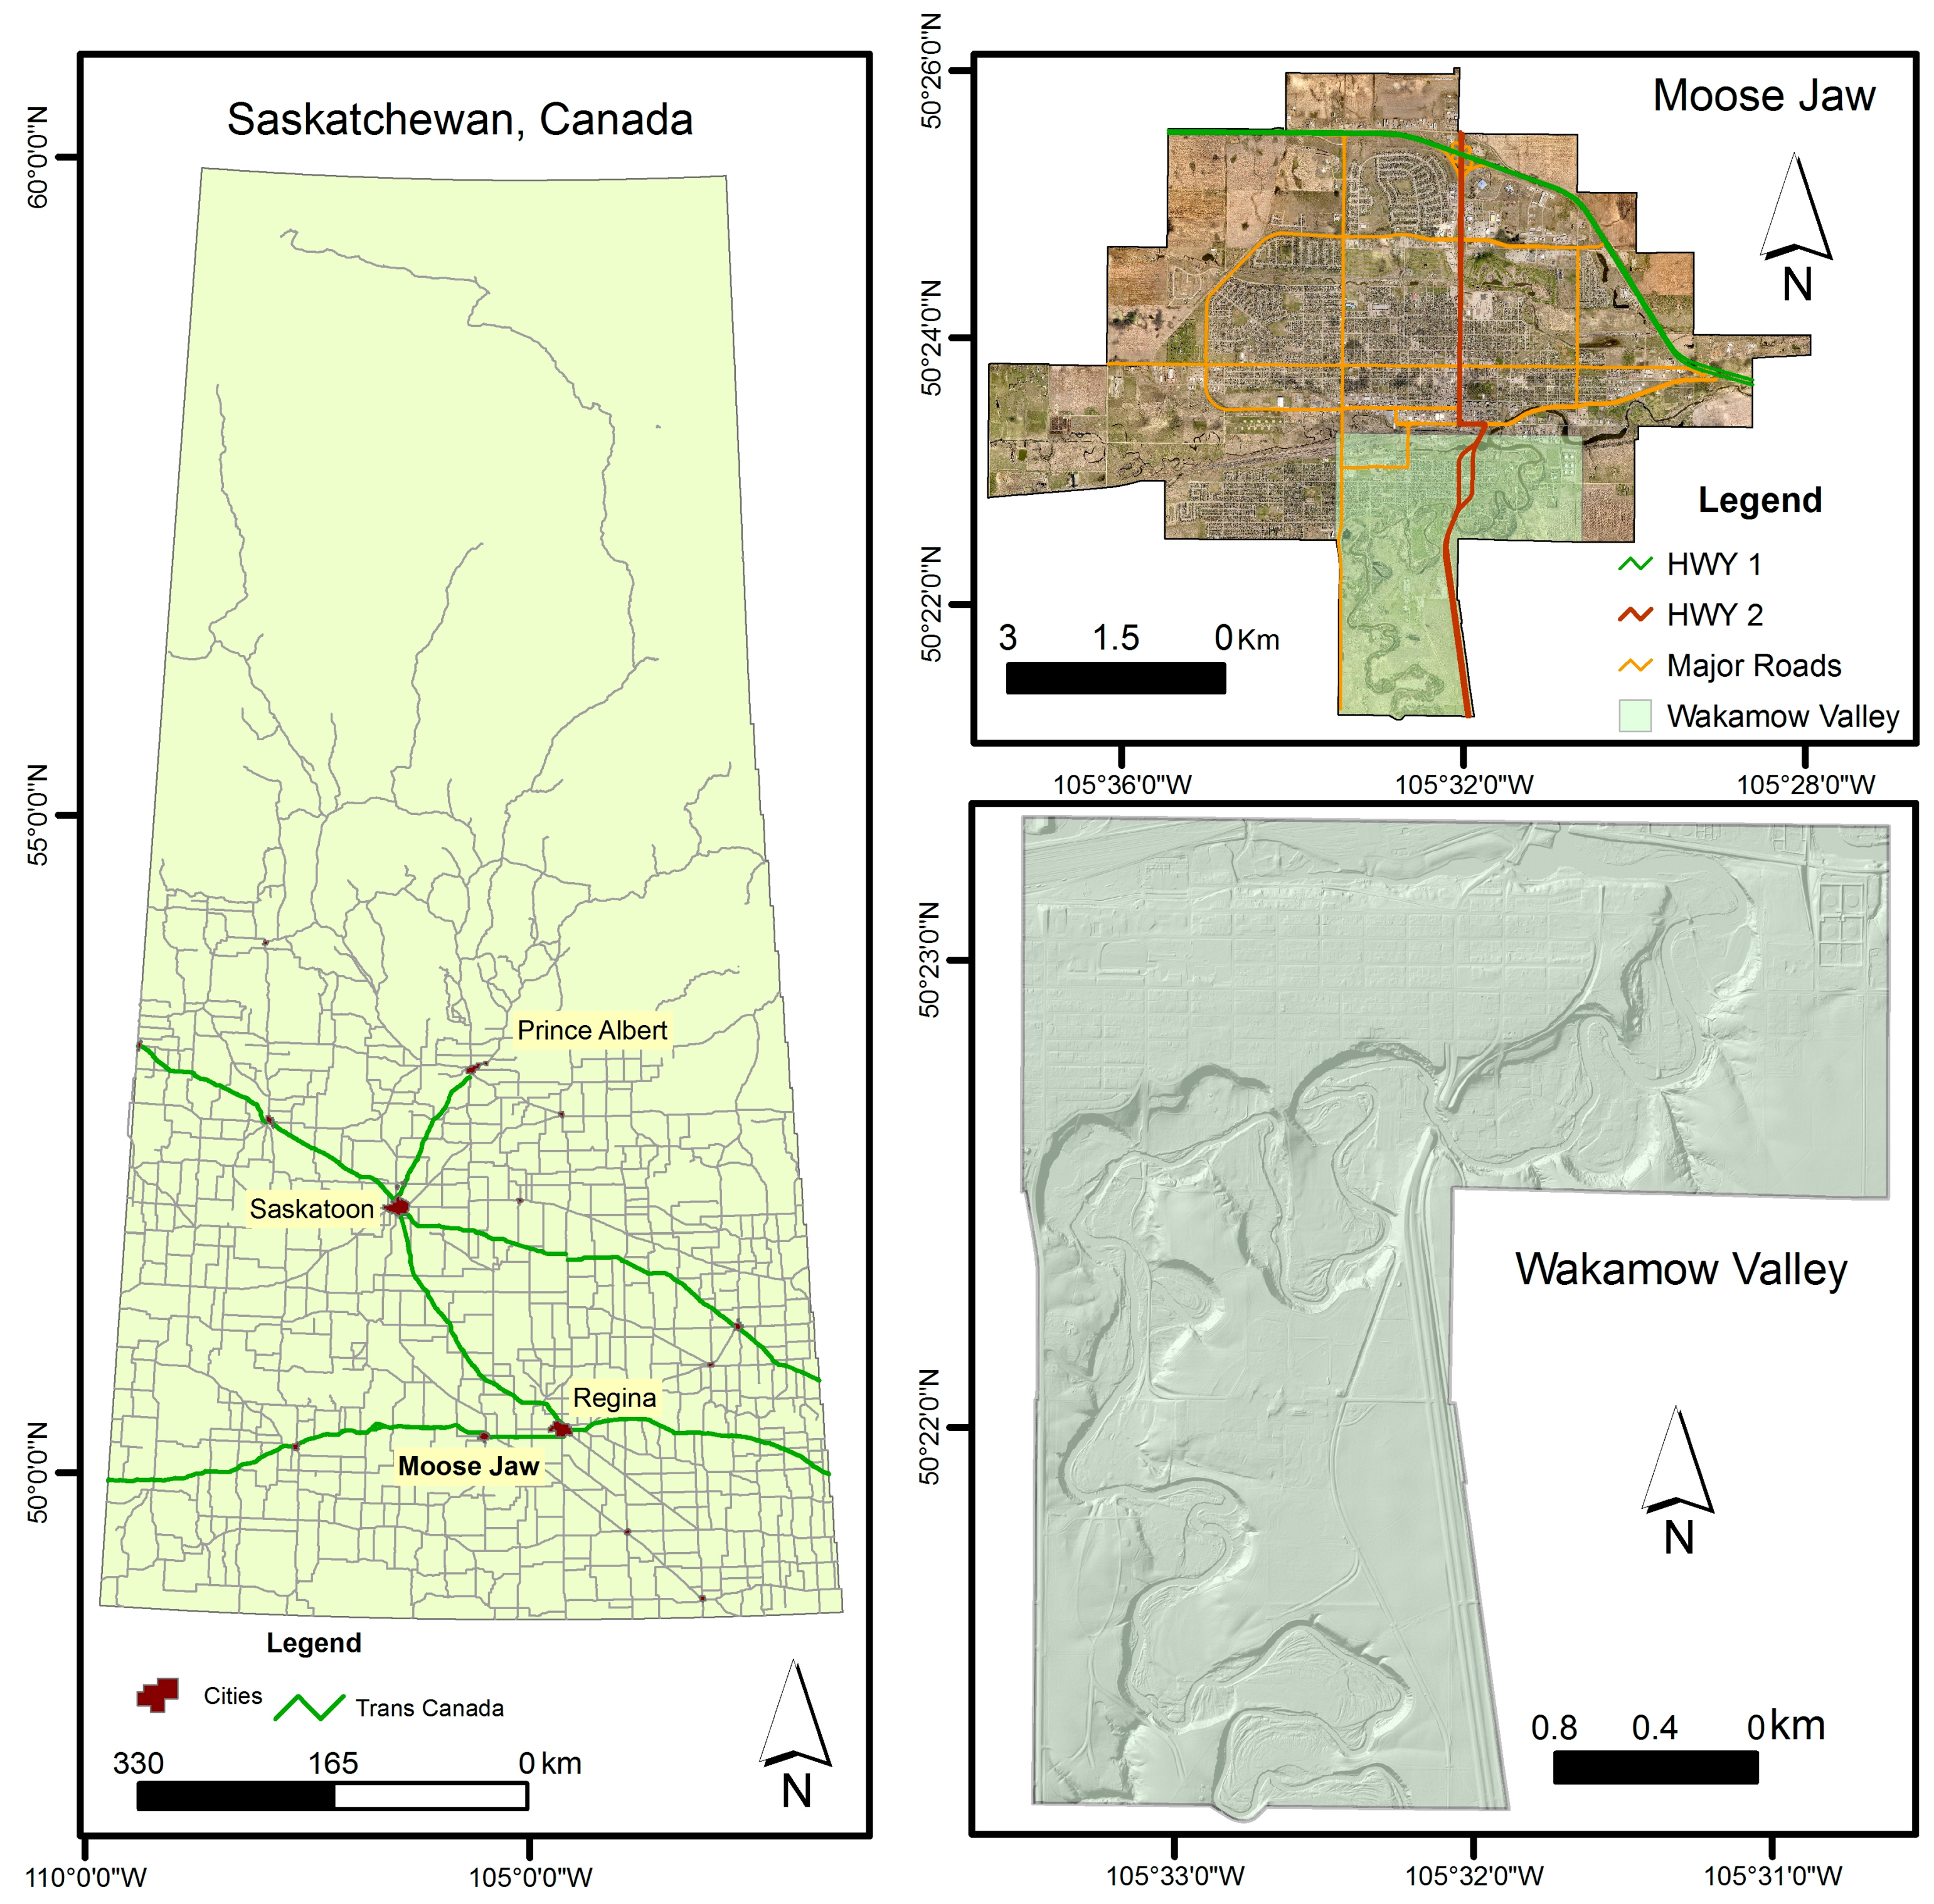
This study was focused on Wakamow Valley Park located in a mid-sized city Moose Jaw, Saskatchewan, Canada as shown in
Figure 1. The Moose Jaw city is situated along Moose Jaw River at the intersection of Highway 2 and Trans-Canada Highway 1, approx. 80 km west of Capital City Regina. It is best known as a retirement, historical, and tourist city. Moose Jaw River which is also known as the river of turns, while winding through the city, has created a canyon-shaped area in the south end of the city. This canyon-shaped area offers a unique and distinct ecosystem, and is prone to natural hazards such as landslides and soil erosion. This four-season urban park and a conservation area comprise about 500 acres of parkland including 20 km of the trail [
17]. It is a natural habitat for a wide variety of flora and fauna, including more than 190 bird species [
17].
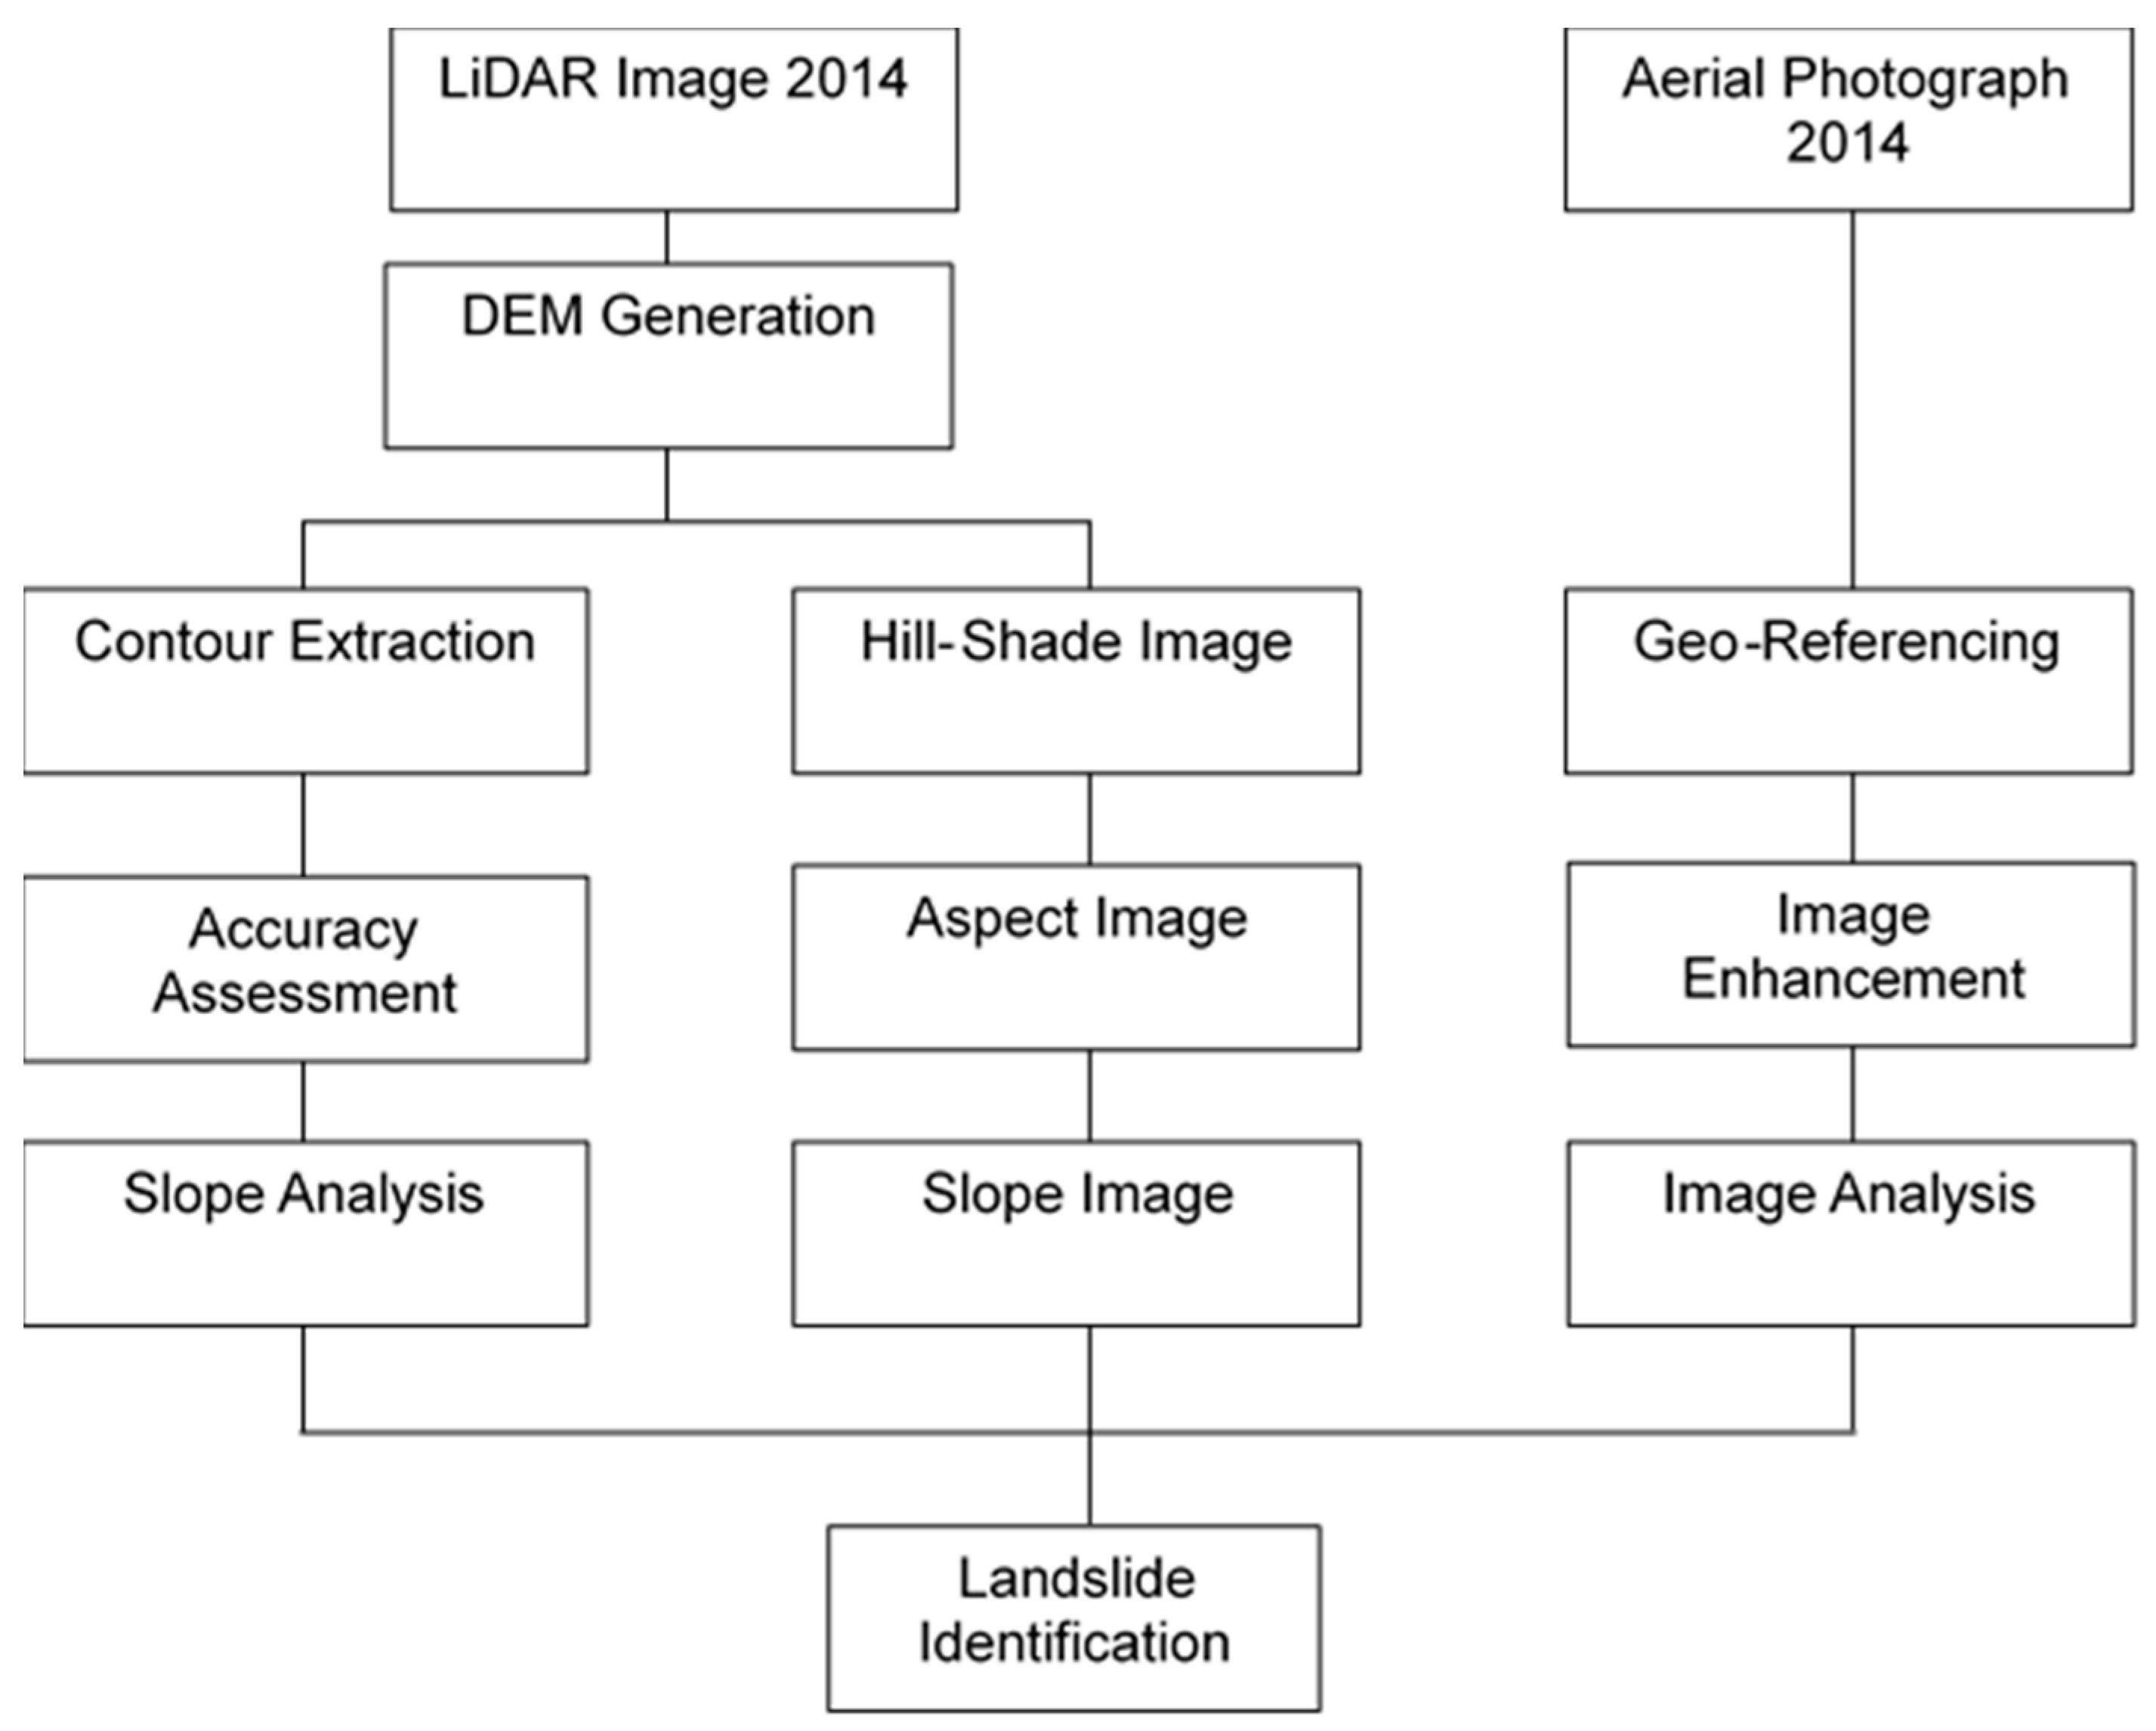
The areas susceptible to landslides and soil erosion were identified through slope analysis using point cloud LiDAR data. It is an increasingly popular technique which is being widely used for analysis and mapping of landslides over a traditional labour extensive field survey [
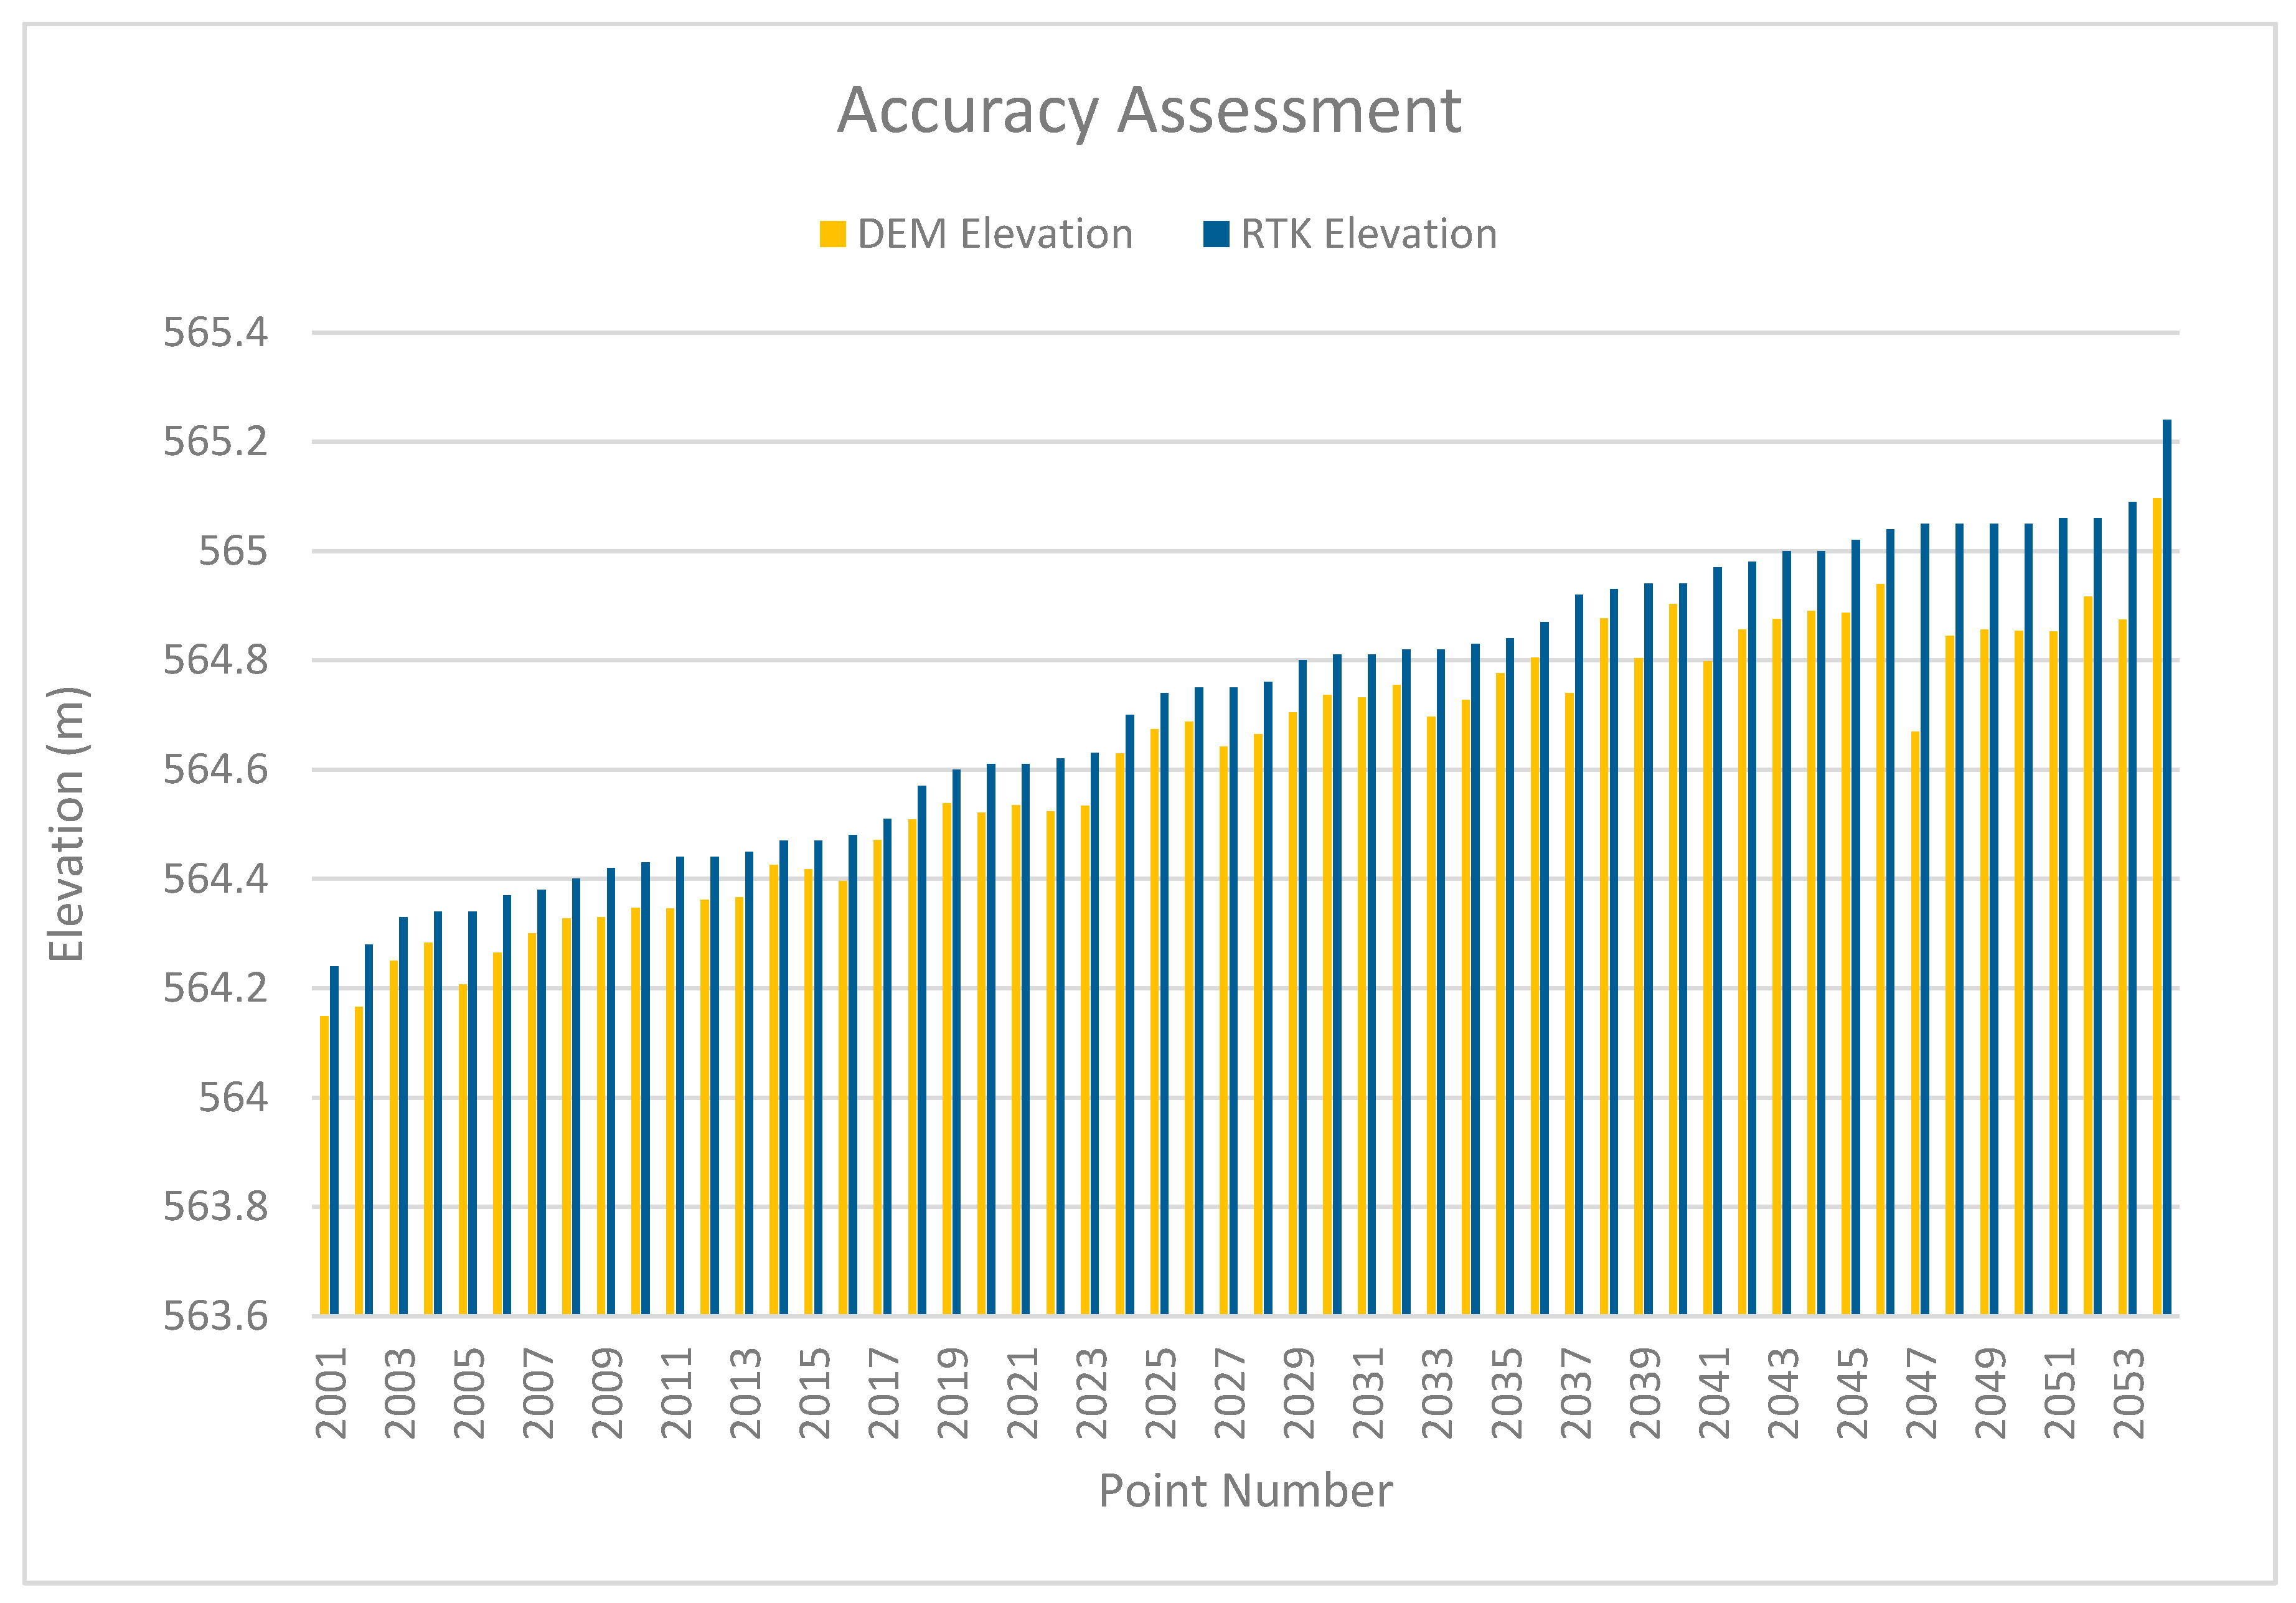
18]. It is well documented that high-resolution satellite and aerial photographs are not providing sufficient information which is normally required for slope analysis. This research used 2014 high-density point cloud (LiDAR) data acquired through airborne LiDAR system. A LiDAR driven Digital Elevation Model (DEM) of the project area, provided by the city of Moose Jaw was used to extract elevation information and further analysis. Elevation contours with quarter meter interval were extracted from the LiDAR-drived DEM. The vertical accuracy of the contour lines was verified using several well-distributed Ground Control Points (GCP) [
19] collected through a survey grade handheld Trimble 6000 Series GeoXH GPS device. A standard method of collecting Global Position System (GPS) values in a relatively open area for up to 15 min was used to collect GCP coordinates. Post-processing differential corrections were applied to improve the measurement accuracy of the GCPs. The GPS coordinates were compared with information obtained from the LiDAR-derived contours for accuracy assessment. Fifty-four well-distributed GCP, when compared with the corresponding elevation contours, showed a maximum Root Mean Square (RMS) error of 0.08 m which is within acceptable accuracy range for slope analysis. The results of this comparison are summarized in
Figure 2. These elevation contours were used for slope analysis of the area and to create a slope map. The areas having a slope greater than 35° were selected for further analysis. Similarly, an aspect image was created to determine the slope orientation and surface roughness within the selected area. High-resolution aerial photograph of 2014 draped over the slope image was used to create a base map for further analysis.
This study followed the findings of Soeters and van Westen [
12] to identify landslide or avalanche prone areas using slope and surface roughness. An area having a slope greater than 35° was used to identify the main scrap along the cliff side and classification of infrastructure under a serious threat of landslides. Similarly, the toes of landslide prone areas were also identified from the base map. The landslide prone areas having its toe along the Moose Jaw River can be classified as high-risk landslide areas as the flow of river water can cause soil erosion triggering landslides. River boundary was extracted from the high-resolution aerial photographs using onscreen digitization process. Research suggests that an automatic image processing tool for demarcation of the water–land boundary cannot be used for aerial photographs [
20], whereas onscreen digitization is a viable and proven method for feature extraction from high-resolution aerial photographs [
21].
Slope analysis was also carried out along the banks of the Moose Jaw River for identification of areas prone to soil erosion along the river caused by the river flow. Erosion caused by the other factors is beyond the scope of this study. A river profile showing changes in the elevation along the river was used for the assessment of water flow. It was observed through ground truth surveys that water flow increases in the areas where river elevation profile shows major changes. The increase in water flow exerts extra pressure on its banks around river bends where the slope is causing an obstruction to the river flow. The polygons/areas along the river bend where river profile indicated major changes and intersected with the river banks having a slope greater than 35° were considered an obstruction to the river flow. Such areas can be classified as areas prone to soil erosion. The overall methodology adopted for this project is explained in
Figure 3.
3. Results and Discussion
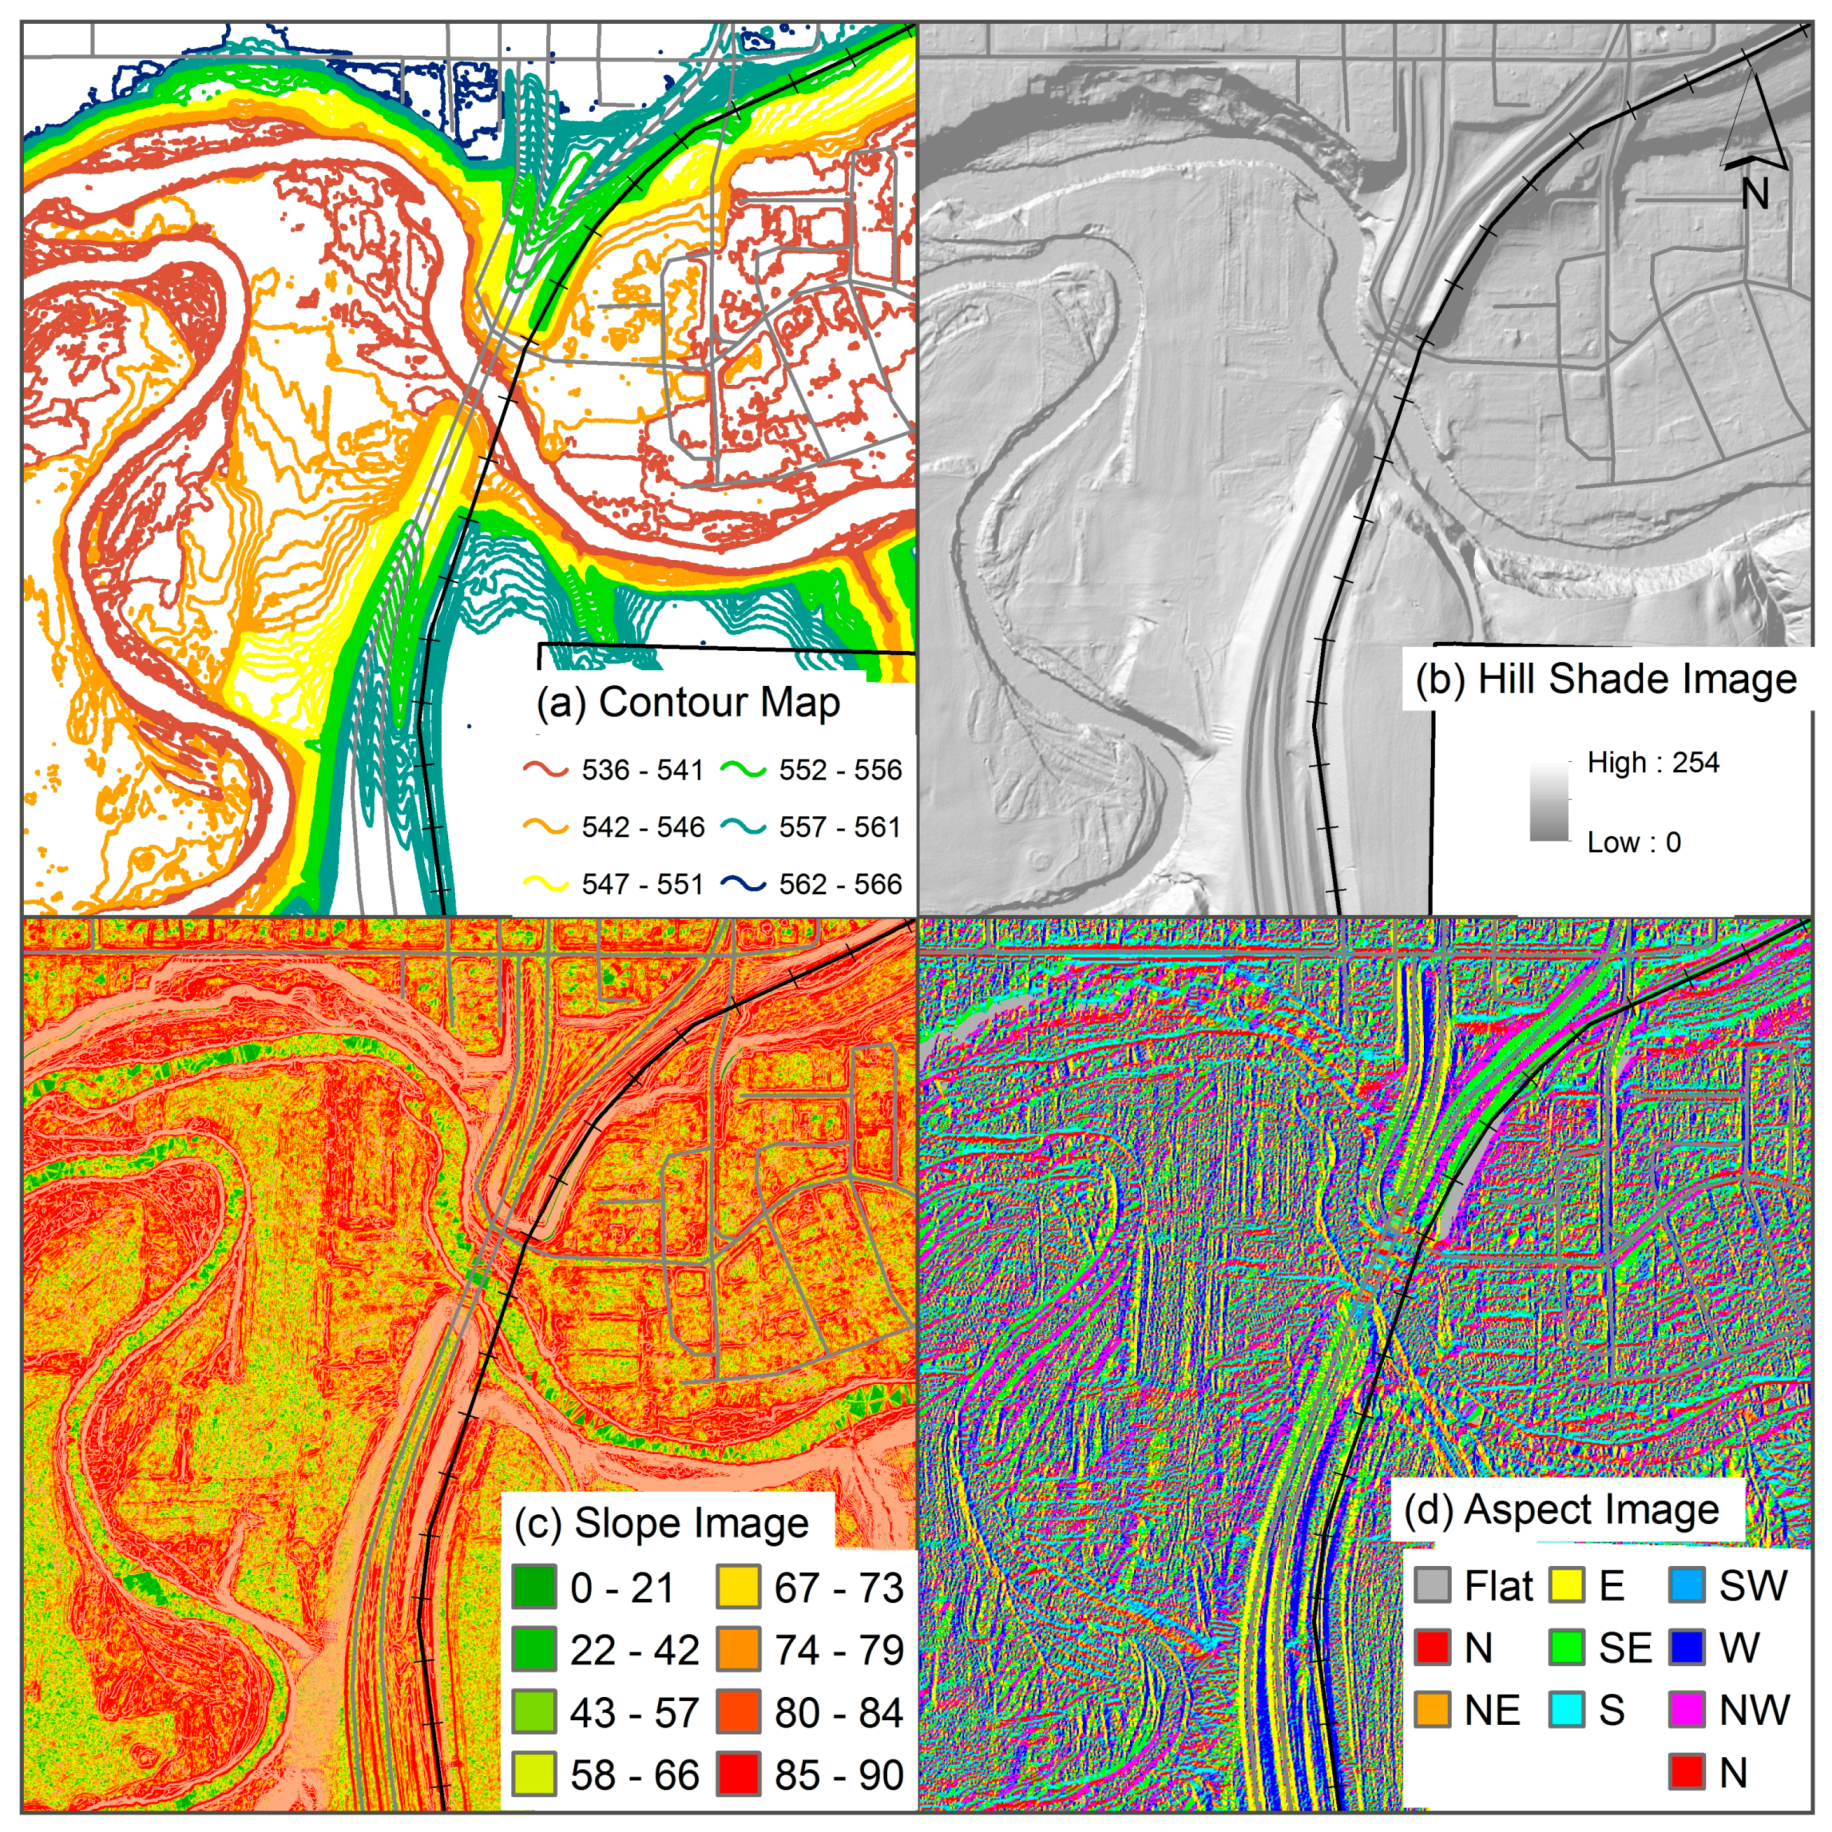
Four base maps were created for identification of the areas prone to natural hazards and are shown in
Figure 4. A contour map with a contour interval of 0.25 m, a hill shade image, slope image, and an aspect map are shown in
Figure 4a–d, respectively. A classification of the contour maps shows elevation ranging from 536 m to 565.5 m, indicating elevation changes of 29.5 m within the project area. The slope map shows the maximum slope of 76° in some areas as shown in red color, whereas the least slope or no slope is shown in green color. Similarly, an aspect map represents a 3D perspective of the project area and was used for identification of main scraps (head) and toes of the landslide prone areas.
Results of the slope analysis along with the land-use/land-cover information are shown in
Figure 5. A high-resolution aerial photograph of 2014 draped over the aspect image was used as a base map. Areas having a slope greater than 35° were classified as landslide prone areas and are shown as landslide layer in the map. As discussed earlier, the accuracy of the elevation contours was validated using a handheld GPS device and was found within acceptable of RMS error of 0.08 m. This error will be translated into a maximum of 0.2° error in slope angles. However, the calculated slope in the areas prone to landslides was generally much higher than 35° and thus will not affect the accuracy of the hazard assessment. Elevation changes along the cliff side were also computed, and a sheer drop of up to 20 m was recorded in landslide prone zones along walls of the canyon within the landslide prone area. The length of the main scrap was calculated as 8 km, whereas the length of the toe along the Moose Jaw River was 5.3 km and is shown magenta and red linear features in
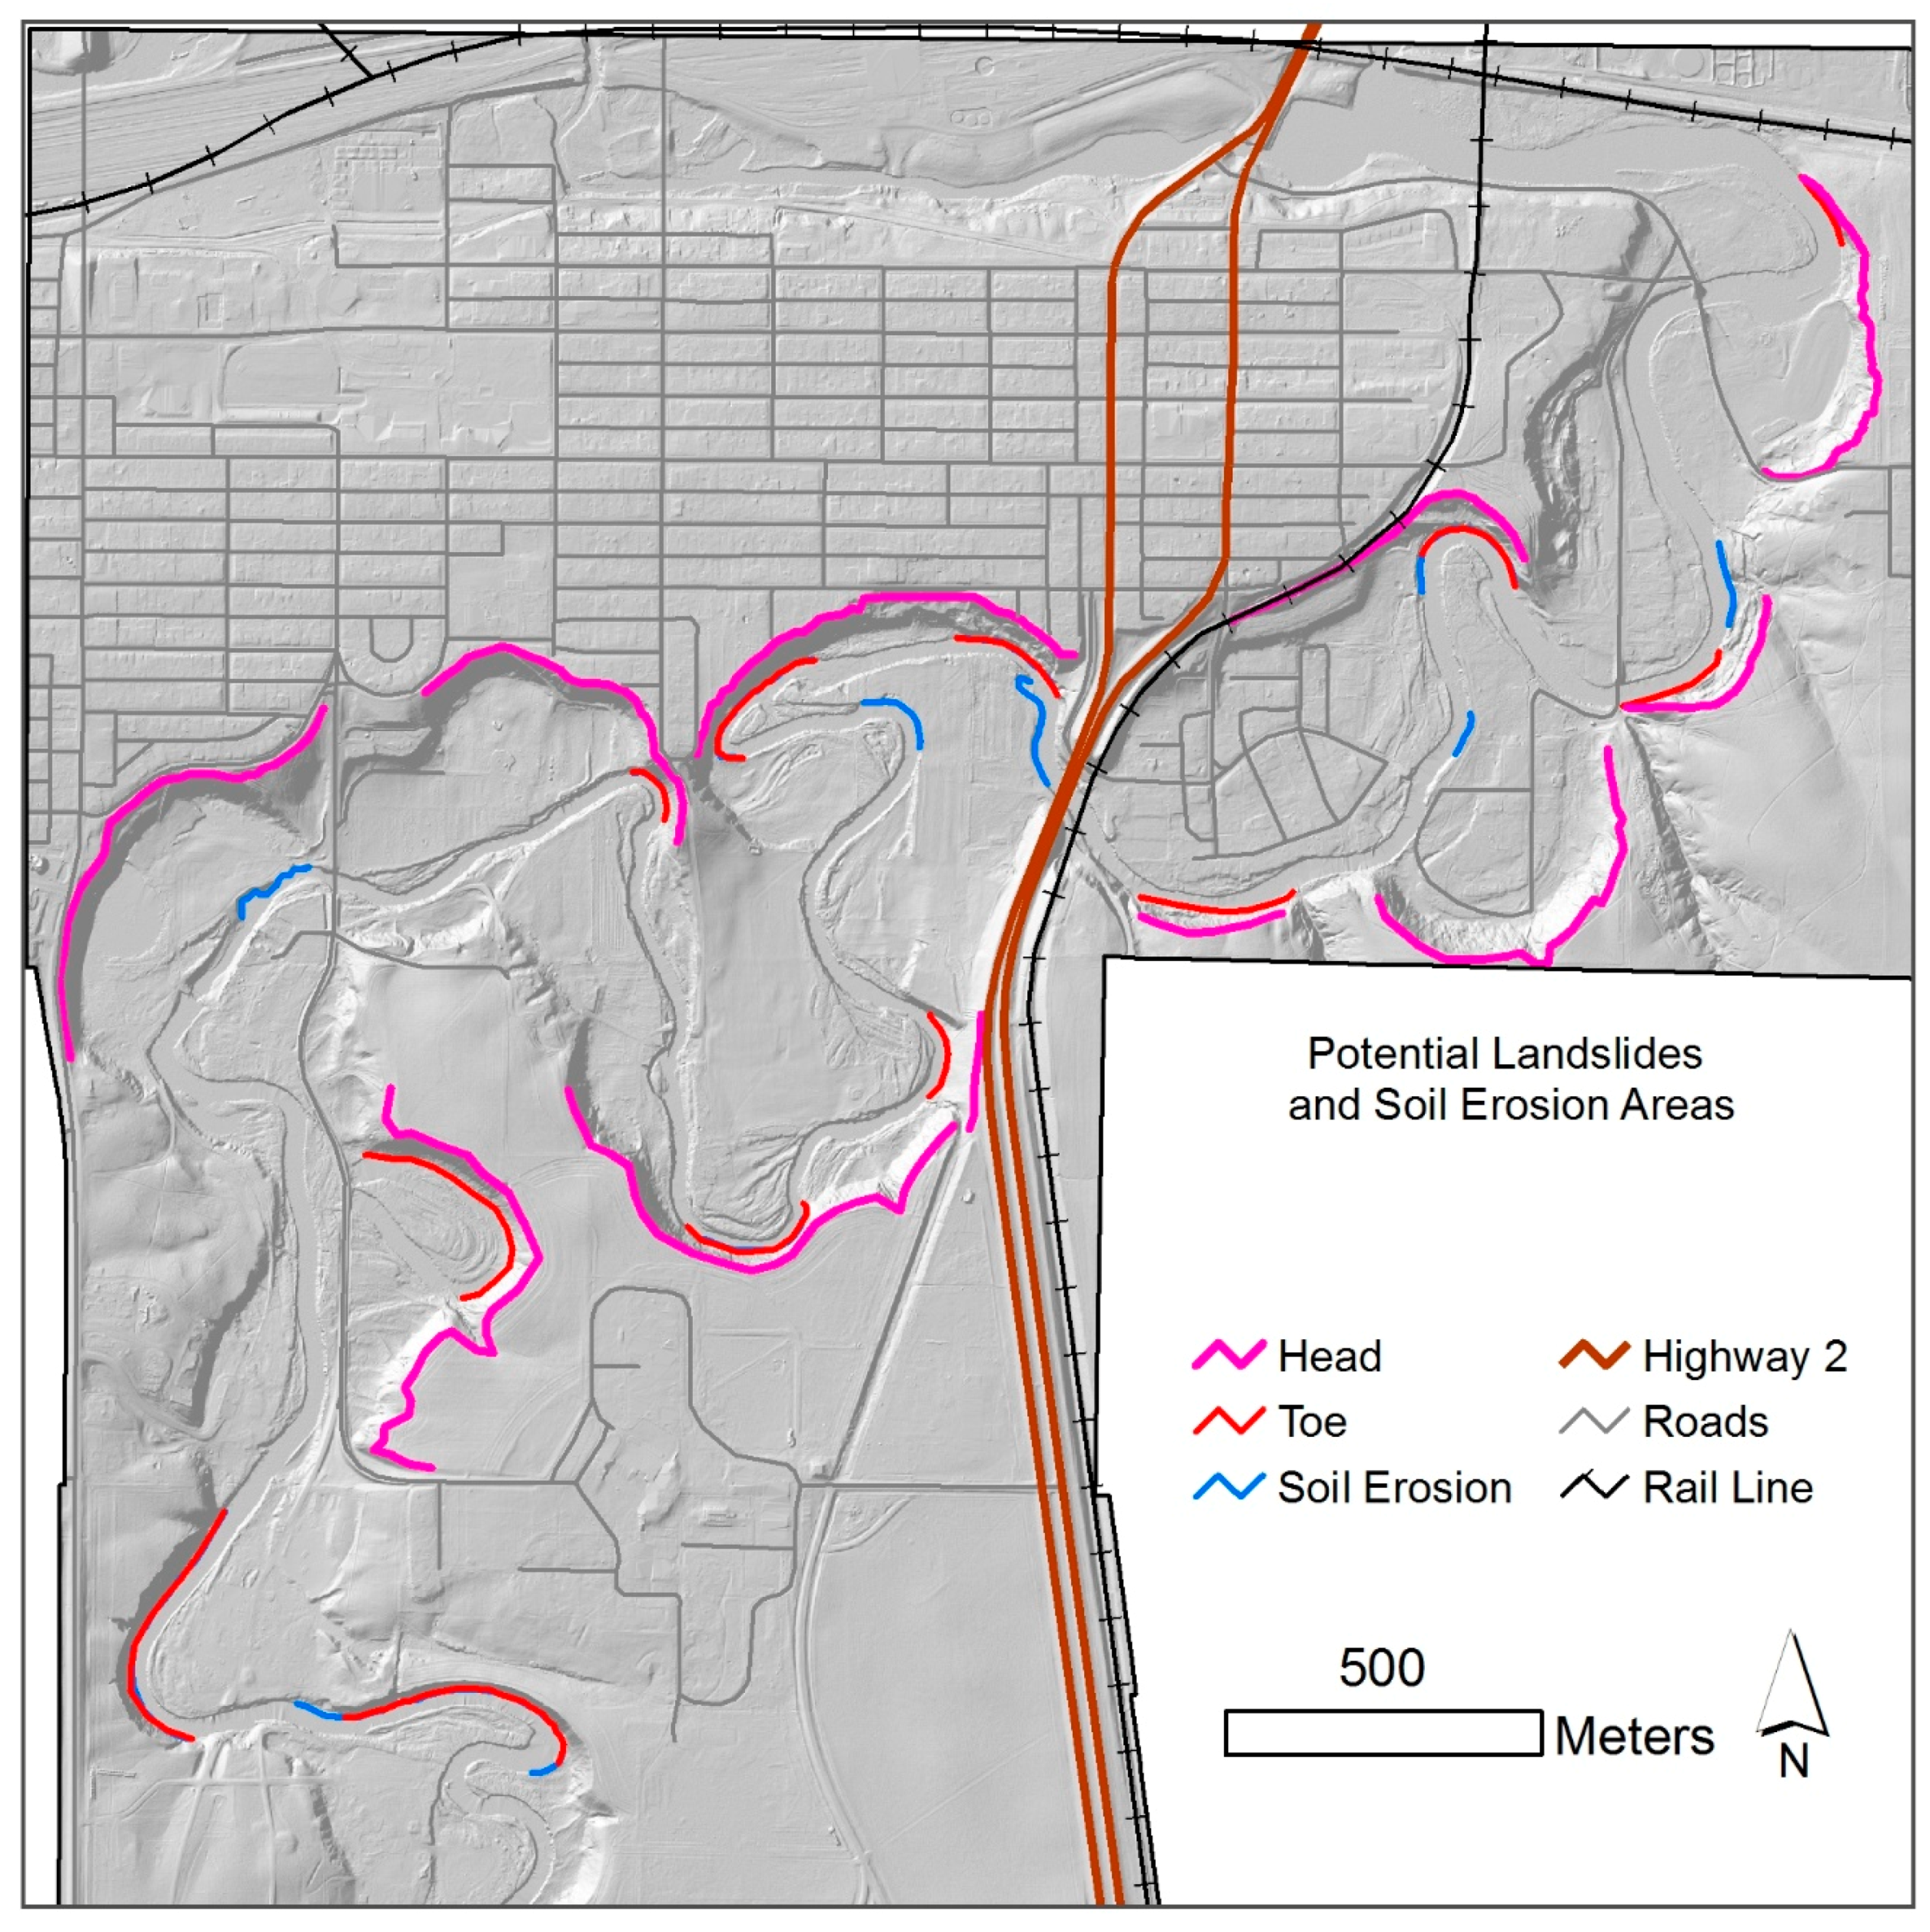
Figure 5. As water flow causes soil erosion along its banks and thus an area within the landslide zone having its toe as a bank of the Moose Jaw River was classified as a suspected high-risk landslide area. The entire toe area is considered a high-risk soil erosion area and is shown in red color. Similarly, areas along the river bends where water is flowing at a faster rate and banks having a slop greater than 35° degrees were classified as potential zones prone to soil erosion. These areas are represented as a soil erosion layer as shown in blue color in
Figure 5. The total length of the potential soil erosion along the banks of the river was calculated as 4.8 km.
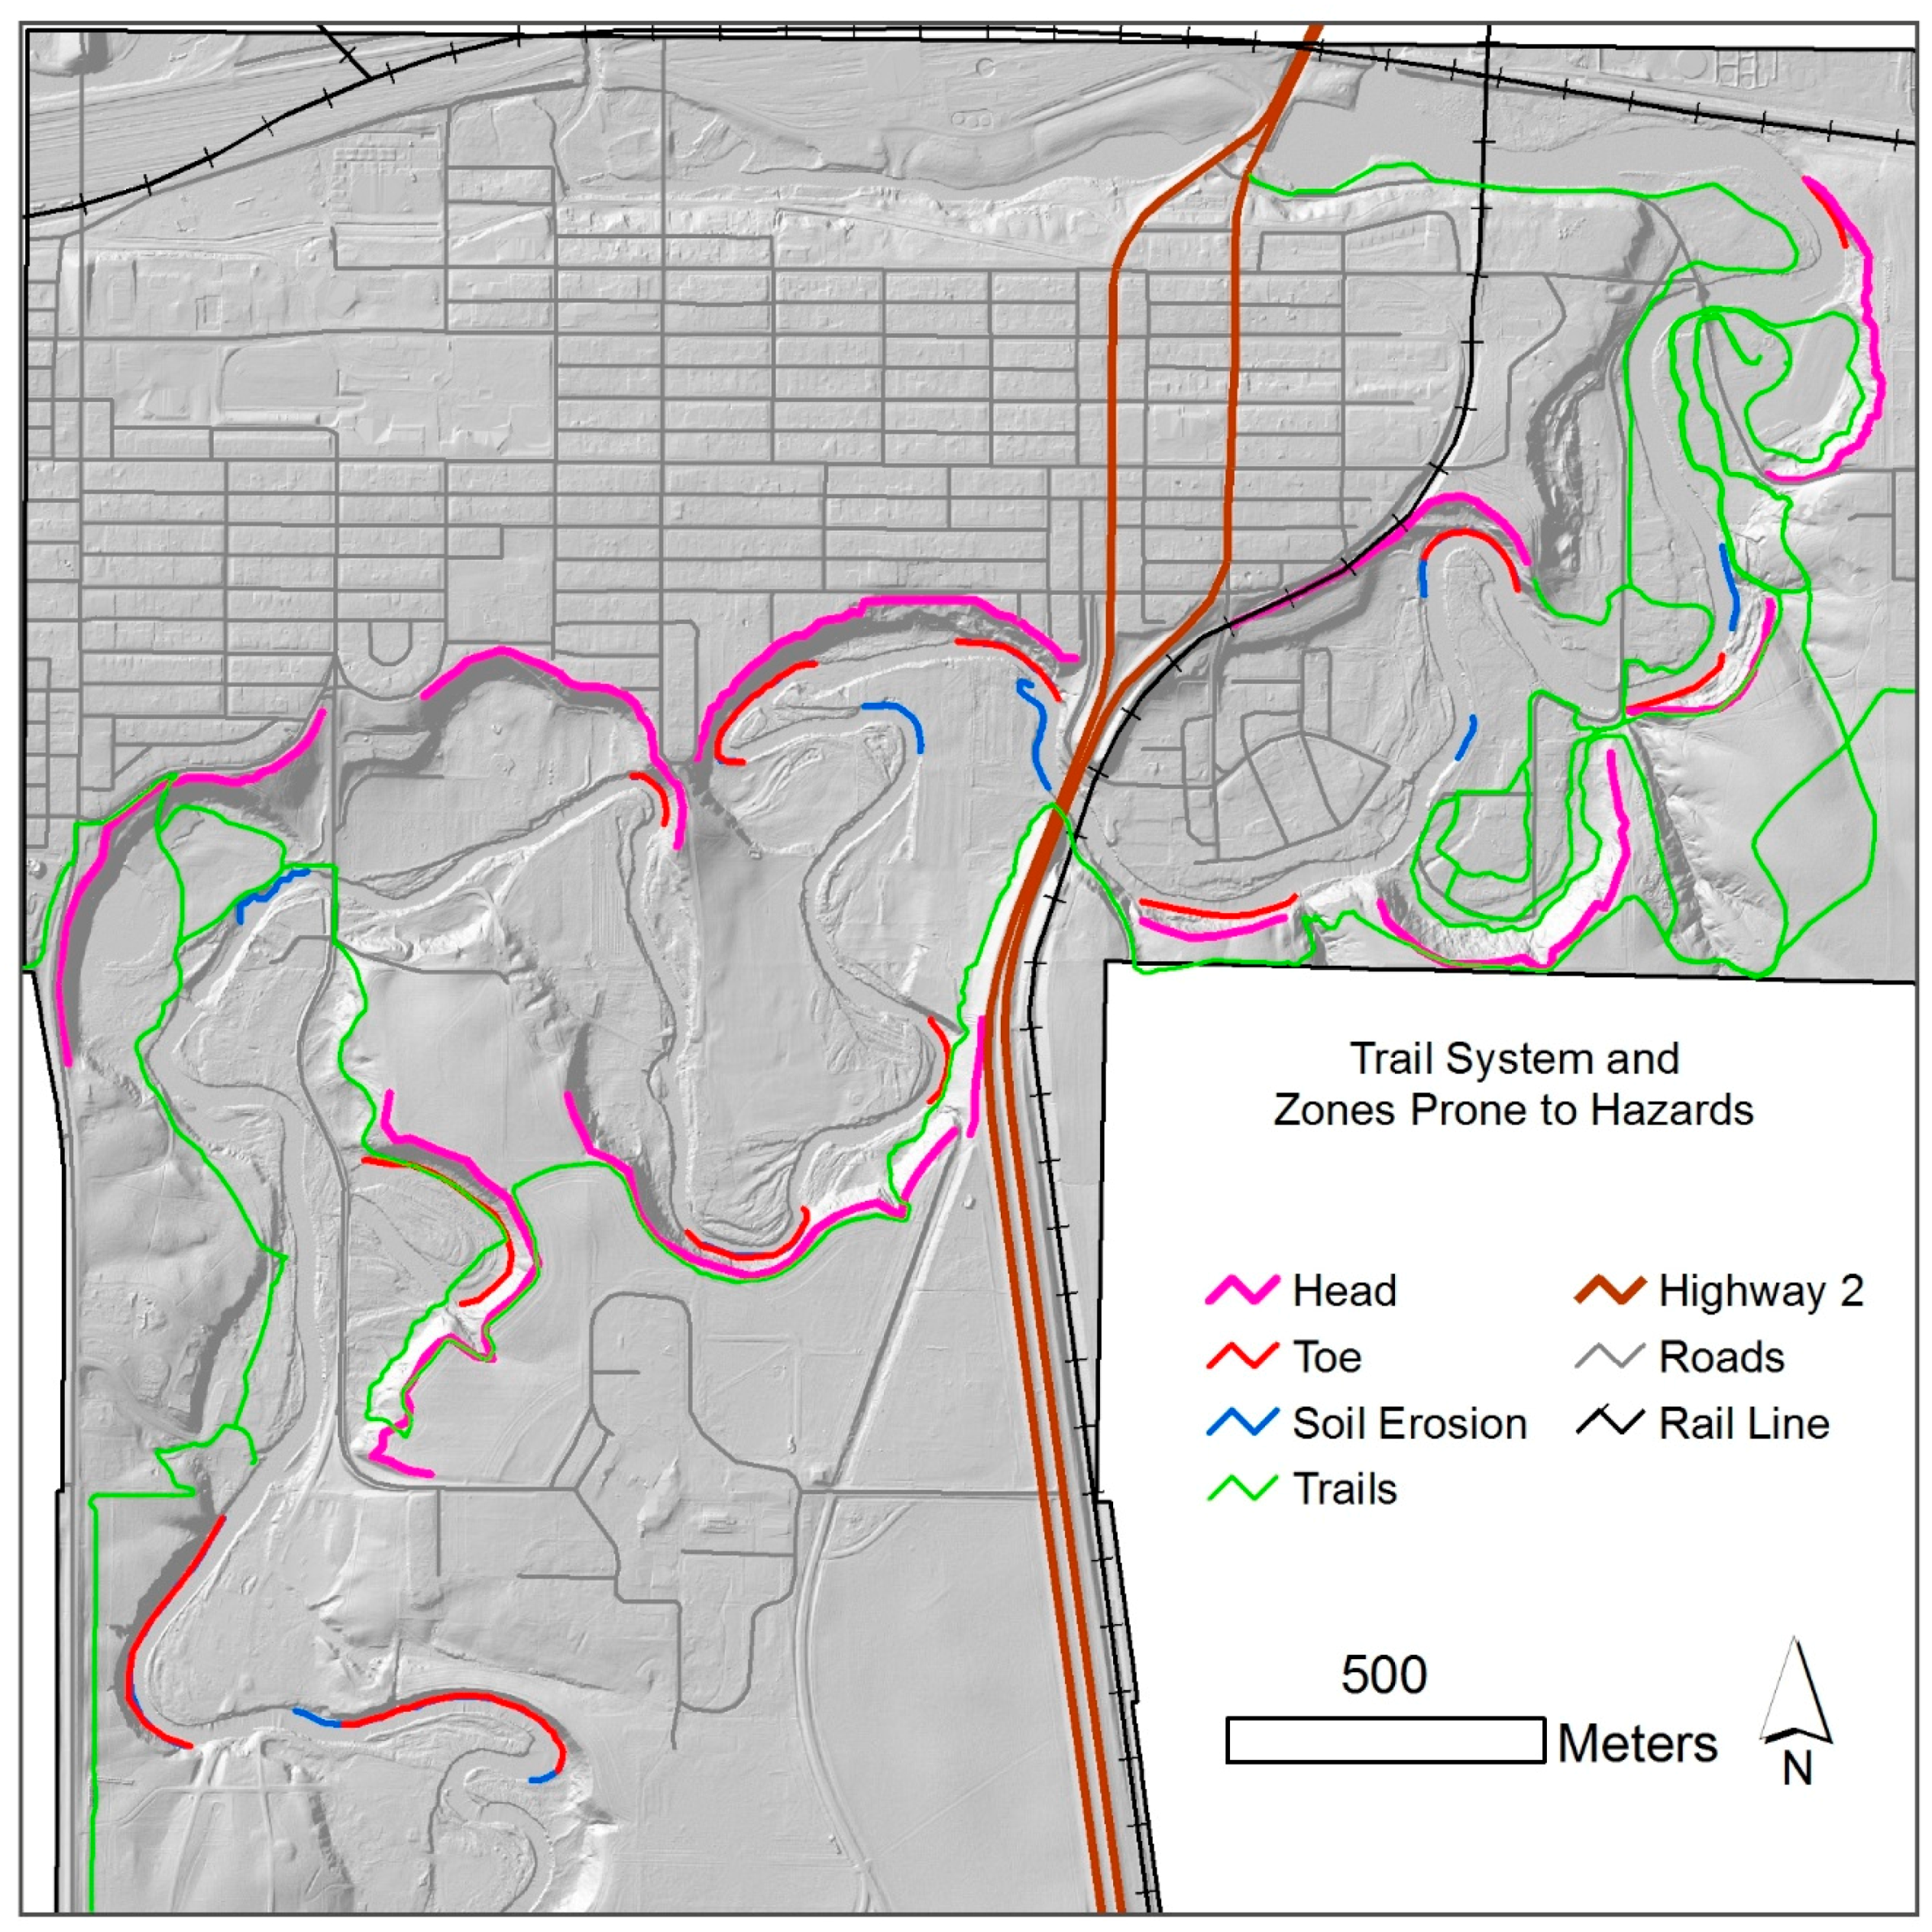
The information extracted through slope analysis was used for risk analysis of the infrastructure within the project area or in the close vicinity of the Wakamow Valley. Trail system within the Wakamow Valley was extracted from the high-resolution aerial photographs of 2014. A geospatial analysis of the trail system and the areas prone to natural hazards indicated that the 2.5 km of the trails lay within the danger zone. The trail system within the area along with the potential landslide and soil erosion areas is shown in
Figure 6. These trails are needed to be monitored on a regular basis for effective management of the Wakamow Valley. Regular monitoring and preventive maintenance of the areas prone to natural hazards can drastically reduce the costly repairs in case of any disaster. This information is also critical for public safety using the park facilities for recreational purpose.
Acquisition of aerial photographs and LiDAR data is a costly and expensive business and cannot be done on a regular basis. Once the hazardous zones are identified, regular monitoring can be done using traditional surveying techniques.
