Citizen Science for Urban Forest Management? Predicting the Data Density and Richness of Urban Forest Volunteered Geographic Information

1
School for Environment and Sustainability, University of Michigan, 500 S State St, Ann Arbor, MI 48109, USA
2
Management Department, College of Business, San Francisco State University, 1600 Holloway Ave, San Francisco, CA 94132, USA
3
Department of Geography and Urban Studies, Temple University, 1801 N Broad St, Philadelphia, PA 19122, USA
*
Author to whom correspondence should be addressed.
Urban Sci. 2017, 1(3), 30; https://doi.org/10.3390/urbansci1030030
Submission received: 22 July 2017
/
Revised: 13 September 2017
/
Accepted: 15 September 2017
/
Published: 19 September 2017
(This article belongs to the Special Issue Crowdsourcing Urban Data)
Abstract
:Volunteered geographic information (VGI) has been heralded as a promising new data source for urban planning and policymaking. However, there are also concerns surrounding uneven levels of participation and spatial coverage, despite the promotion of VGI as a means to increase access to geographic knowledge production. To begin addressing these concerns, this research examines the spatial distribution and data richness of urban forest VGI in Philadelphia, Pennsylvania and San Francisco, California. Using ordinary least squares (OLS), general linear models (GLM), and spatial autoregressive models, our findings reveal that sociodemographic and environmental indicators are strong predictors of both densities of attributed trees and data richness. Although recent digital urban tree inventory applications present significant opportunities for collaborative data gathering, innovative research, and improved policymaking, asymmetries in the quantity and quality of the data may undermine their effectiveness. If these incomplete and uneven datasets are used in policymaking, environmental justice issues may arise.
1. Introduction
Volunteered geographic information (VGI) has expanded rapidly in recent years [1]. Defined by Elwood et al., as “geographic information acquired and made available to others through the voluntary activity of individuals or groups” [2], (p. 575), VGI is an outgrowth of recent technological trends. The early twenty-first century proliferation of Web-based collaborative and social media tools has yielded new opportunities for research. Recent Web 2.0 applications enable participants to take advantage of locative technologies such as global positioning systems to generate their own georeferenced content and data. A number of recent innovative projects have emerged to leverage participation in user-generated content to develop datasets that are reliable and accurate enough to support knowledge development and potentially serve as a tool to influence public policy decision-making processes [3]. As an example of this movement, Web-based VGI applications that provide a collaborative platform for crowdsourced urban tree inventories have been launched in a number of American cities through partnership efforts between government entities, nonprofits, and businesses. These Web 2.0 technologies that allow user-generated content, use by non-experts, and interoperability present significant opportunities for citizens and policy practitioners to engage in collaborative data gathering activities, and the availability of data has spurred innovative new research [2]. This paper examines the spatial distribution of tree mapping efforts and the richness of data contributed to VGI urban tree mapping applications in two study areas, Philadelphia, Pennsylvania and San Francisco, California, USA. This research contributes to recent interest in the implications of the democratization of data-gathering operations, and the use of data-driven computational approaches to influence policy decisions [4,5]. We specifically address how interpretations of urban forestry analysis and ecosystem services calculations may help to shape decision-making processes and approaches to community engagement, especially surrounding urban environmental amenities, and ultimately improve the environmental and social conditions of urban residents. Equity concerns ground the paper, as both unequal participation in and representation by urban forest VGI represent digital divide issues [2], and given the many benefits provided by urban forests, if uneven representation results in uneven management, environmental injustice can ensue.
As a pressing matter of public policy, asymmetries in Internet access and the adoption of digital technology have been known for quite some time, and recent work suggests that, perhaps counterintuitively, significant portions of the urban population do not utilize the Internet at all, let alone Web 2.0 technologies. Broadband adoption (and therefore broadband use) is strongly correlated with socioeconomic markers and clusters of poverty [6,7], such as race, ethnicity, education, age, and income [8,9,10,11,12]. Studies on the persistent inequality in broadband adoption serve as the motivation for policy interventions such as the federal broadband initiatives of the Obama Presidential Administration.
A prevailing assumption in any data model centered on public inputs is that the public be in a position to provide them. An increase in data availability has the potential to improve upon traditional sources of geographic information [2,13] and increase equitable participation [14]; however, some caveats have been offered. In addition to issues raised about factors of data input, including the validity of crowdsourced data [2,15,16,17], a growing body of literature addresses the potential digital divide surrounding VGI technology [1,2,14,16,18], and similar concerns have emerged about the challenges inherent in the adoption of VGI by policymakers [19]. We expand previous theoretical explorations of the considerations influencing the quality and usefulness of VGI data for policymakers by empirically addressing potential information asymmetries in crowdsourced urban spatial data.
This paper is concerned with a specific example of VGI, namely local efforts at mapping urban forests in two major cities. A crucial aspect of evaluating VGI is their accuracy. How and whether VGI comport to reality is, of course, an important concern in their future. This paper leaves aside the question of whether VGI are providing an accurate representation of existing urban forests, and instead focuses on where and how VGI is collected. We assess the observations made by volunteers in order to probe where these observations are made and under what local conditions. For instance, to what extent do the physical attributes of place influence whether or not data are collected and therefore greater numbers of trees are mapped? In addition, in the case of tree maps, much of the information comes from anonymous, private contributors. Little can be said about the motivations of participants. That said, trees are rooted, as it were, in place. So it is possible to assess whether trees are more likely to be mapped in areas with varying sociodemographic characteristics. Our starting points, then, are the point locations of trees, how many of these are voluntarily provided to publicly accessible data gathering sites by various unknown private users, and where the highest concentrations of detailed data about species, size, and condition are located.
The paper begins by presenting an overview of tree point data in both study areas, then assesses whether sociodemographic and environmental indicators predict characteristics of data richness and densities of attributed trees. The results are used to explore theoretical challenges in the design of geotechnology applications, potential causes in discrepancies in the process of data gathering, and interpret quantitative modeling of urban environments. Given that one of the intended purposes of VGI tree applications is to influence decision-making processes surrounding urban environmental amenities, the conclusion discusses the potential for VGI to influence place-based policy decisions.
2. Literature Review: VGI, Planning, and Urban Forests
Along with the exponential growth in academic research on VGI, practicing planners and public officials have become interested in the potential to use VGI tools in attempts to make planning more participatory [3,20,21,22,23], reflecting earlier and continuing interests in public participation geographic information systems (GIS) (PPGIS) [22,23]. The hopes and concerns surrounding VGI in the planning community are similar to those presented in academic discourse. Planners recognize that official data often does not include information about marginalized citizens and neighborhoods, resulting in their needs not being considered when making urban policy deliberations [4]. VGI is seen as a potential remedy to this issue, but there remain concerns surrounding the barriers to participation in VGI creation that may result in further exclusion [4,5,22,24,25].
The use of VGI applications to analyze the distribution of trees in urban areas by policy practitioners would rely upon both coverage of trees and richness of data to inform decision-making processes. Where tree representation is plentiful and data are rich, policy practitioners could take a greater interest in these areas [1], so VGI has the potential to perpetuate and contribute to existing inequalities in investment of public funds and resources. In the example of Philly TreeMap, where empty tree pits are plotted separately, representation of tree pits may facilitate interest in future tree plantings. Furthermore, data on problem/hazardous trees, tree pests, and diseases potentially contribute to better tree management and care. On the other hand, policy practitioners’ inability to assess urban tree coverage in areas where representation is lacking could contribute to less urban greening activity and reduced quality of tree care in these neighborhoods. In both cities, the VGI tree mapping efforts focus upon street and park trees that are publicly managed. These concerns over uneven coverage and data richness influencing management decisions raise environmental justice concerns, given the many social and ecological benefits of urban forests.
Akin to issues in participatory planning at large, there remain questions as to the level that which VGI would be considered by actual decision-makers [20,21,24]. Johnson and Seiber [19] identify cost of the technology, questionable accuracy, and formality of non-expert data, and jurisdictional issues as three considerations for local governments to take into account. Despite these concerns, successful pilot studies of VGI as a participatory planning tool have been conducted in Finland, Norway [20], and Ecuador [21]. VGI urban forest inventories represent one of the many ways in which the technology could be used as a participatory planning tool in the United States.
The San Francisco Urban Forest Map [26] is an interactive Web-based map database of trees in San Francisco. The mission of the Urban Forest Map is “to build technology that improves information sharing, communicates the value of the urban forest, and engages communities in creating greener, more livable urban environments [26]”. Implemented by Autodesk, Inc. (San Rafael, CA, USA), in May 2007, in partnership with local government entities and nonprofits, the project sets the ambitious goal of mapping every tree in San Francisco. After creating free accounts, users are able to enter and modify trees as points on a map with species, condition and planting site information. The option of modifying the contributions of other users, similar to Wikipedia, helps to lend validity to the contributions. The site allows for estimations of the monetary values of the environmental benefits of trees in terms of storm water retention and filtration, air pollution reduction, energy conservation and carbon dioxide removed from the atmosphere. PhillyTreeMap [27] was launched in 2010 by Azavea, a Philadelphia-based software design and development firm, with funding from the United States Department of Agriculture (USDA). PhillyTreeMap has similar properties to the San Francisco Urban Forest Map, along with similar goals in documenting the City’s urban forest and publicizing the suite of benefits it offers. Both cities’ VGI tree maps now utilize Azavea’s Opentreemap software, along with more than thirty other cities, counties, and states, largely in the United States and Canada.
According to the San Francisco Urban Forest Map, the data gathered by the application can be used to help urban foresters to better manage trees, allow climatologists to study the effects of urban forests on climates, and allow researchers to learn about the role of trees in urban ecosystems, building upon previous analyses of San Francisco’s urban forest [28]. Previous analyses of Philadelphia’s urban forest have been based on sampling performed in 1996 [29] and using remotely sensed imagery to describe tree canopy cover [30]. Although both of these methods are valuable to urban forest managers, VGI has the potential to improve urban forest managers’ ability to make informed decisions to maximize benefits and evaluate programs and policies by increasing the amount of available information [31]. This is essential because, like many other cities, Philadelphia and San Francisco are pursuing aggressive tree planting campaigns.
3. Materials and Methods
3.1. Study Areas
The City and County of Philadelphia share boundaries, with a population of 1,560,297 residents, making it the largest city in Pennsylvania [32]. In the mid- to late-twentieth century, Philadelphia experienced decline and abandonment when, in the wake of deindustrialization and other economic and social changes, businesses and middle class residents moved from urban areas to suburban locales. As a result, the city experienced an erosion of the tax base [33]. While the trend of population loss has more recently reversed, the legacy of these processes is seen in the high concentrations of poverty in in the urban core of the city, and a high degree of economic inequality across the greater metropolitan area [32,34]. Philadelphia County is also racially diverse, with an African American population of approximately 44 percent, compared to the state of Pennsylvania average of 11 percent; and a Hispanic population of approximately 13 percent, compared to a state average of nearly 6 percent. Non-Hispanic whites make up approximately 37 percent of the population of Philadelphia County [32]. The most recent estimate of Philadelphia’s urban forest using high resolution remotely sensed imagery found that 20 percent of the City was covered by tree canopy [30].
The City and County of San Francisco share boundaries, with a population of 825,863 residents [32]. Demographically, the area is very different to Philadelphia, with a much more affluent population (median household income (all values in US Dollars) of $72,947 compared to $36,947 in Philadelphia in 2012) and a higher level of educational attainment (51.4 percent of residents above the age of 25 with a bachelor’s degree or higher, compared to 22.6 percent in Philadelphia in 2012). While San Francisco is also racially diverse, the diversity is distributed differently in a large Asian population (32.6 percent), compared to the large African American population in Philadelphia. The demise of industry and waves of suburbanization also greatly reduced the population of San Francisco from the 1950s onward, but this trend reversed beginning in 1980, and San Francisco together with New York, formed the only two major American cities that had rebounded to their historic 1950 population levels by 2000 [35]. This demographic and economic growth was spurred by San Francisco’s place at the leading edge of information technology and creativity, evidenced by its number one ranking in Richard Florida’s first creativity index [35]. “The City” is also home to several participatory urban planning digital applications [3] that might make residents more comfortable with urban forest VGI technologies. The most recent estimate of San Francisco’s urban forest using sampling plots found that 11.9 percent of the city was covered by tree canopy [28].
These differences make Philadelphia and San Francisco compelling case studies for comparison. Namely, San Francisco County is fairly affluent and potentially not representative of the diversity found in the greater Bay Area. On the other hand, many parts of Philadelphia County are far less affluent, and more racially and ethnically diverse than the surrounding counties in the metropolitan area. Within the larger economy-wide changes over the latter half of the twentieth century that have shaped urban physical landscapes and human livelihoods—including the transition from manufacturing to a more high-tech economy that is focused on professional services [36]—the two cities have fared differently. Philadelphia has a history of industrial decline, and now is working towards renewal, with higher education, healthcare and biotechnology, telecommunications, and financial services emerging as top industries. Contrarily, while San Francisco was also subject to these same economy-wide changes, proximity to Silicon Valley and emphasis on innovation and technology ventures has allowed the economy to revitalize much faster than in the case of Philadelphia.
3.2. Data
This analysis includes several types of data from multiple sources. Most important were the tree map data for both study locations, which was downloaded on October 2013. Other than the point location of the trees entered into the websites, several other important pieces of information were included in this dataset. The first of these was the contributor of the data point for each tree, which was used to determine the trees entered by individuals (considered VGI trees) and those entered by organizations such as city government agencies or urban forest groups (considered authoritative data and not VGI). Second, the different pieces of additional information entered for each tree (species, diameter at breast height, height, canopy height, condition, pit width, pit length, type of pit, canopy condition, presence or absence of power lines, presence or absence of sidewalk damage, additional comments, and photos) could assist in management of the trees for which they were provided. They were used here to create an index of the total number of additional data points per tree which was averaged to give a measure of data richness at the block group level for both all trees and VGI trees. It is important to note that the representation of VGI trees and the associated attributes do not necessarily mean that local residents were involved in data collection. While the trees entered by municipal agencies and community groups were removed from analysis, there are still no assurances that the individual names associated with VGI trees belong to those who live nearby. Unfortunately, the websites do not provide information on how the VGI data were collected, raising the possibility that organized mapping events and other citizen science strategies such as “bioblitzes” are driving the distribution of urban forest VGI. While we cannot be sure about where contributors come from, we can be sure of the locations that are represented, and for that reason we compare demographic and environmental variables to VGI data density and richness to assess the evenness of representation.
Demographic data and boundaries were downloaded from the 2010 United States Census. The choice of demographic variables for analysis is based on an existing precedent in environmental justice and similar equity examinations, especially those regarding urban forest distribution and the digital divide that have found race and class to be strong predictors of urban form and function [5,37,38]. It includes: income (median household income), education (percentage of the population age 25 or above with a high school diploma), age (percentage of population over age 65), and ethnicity (percentage of African American, Latino, and Asian residents).
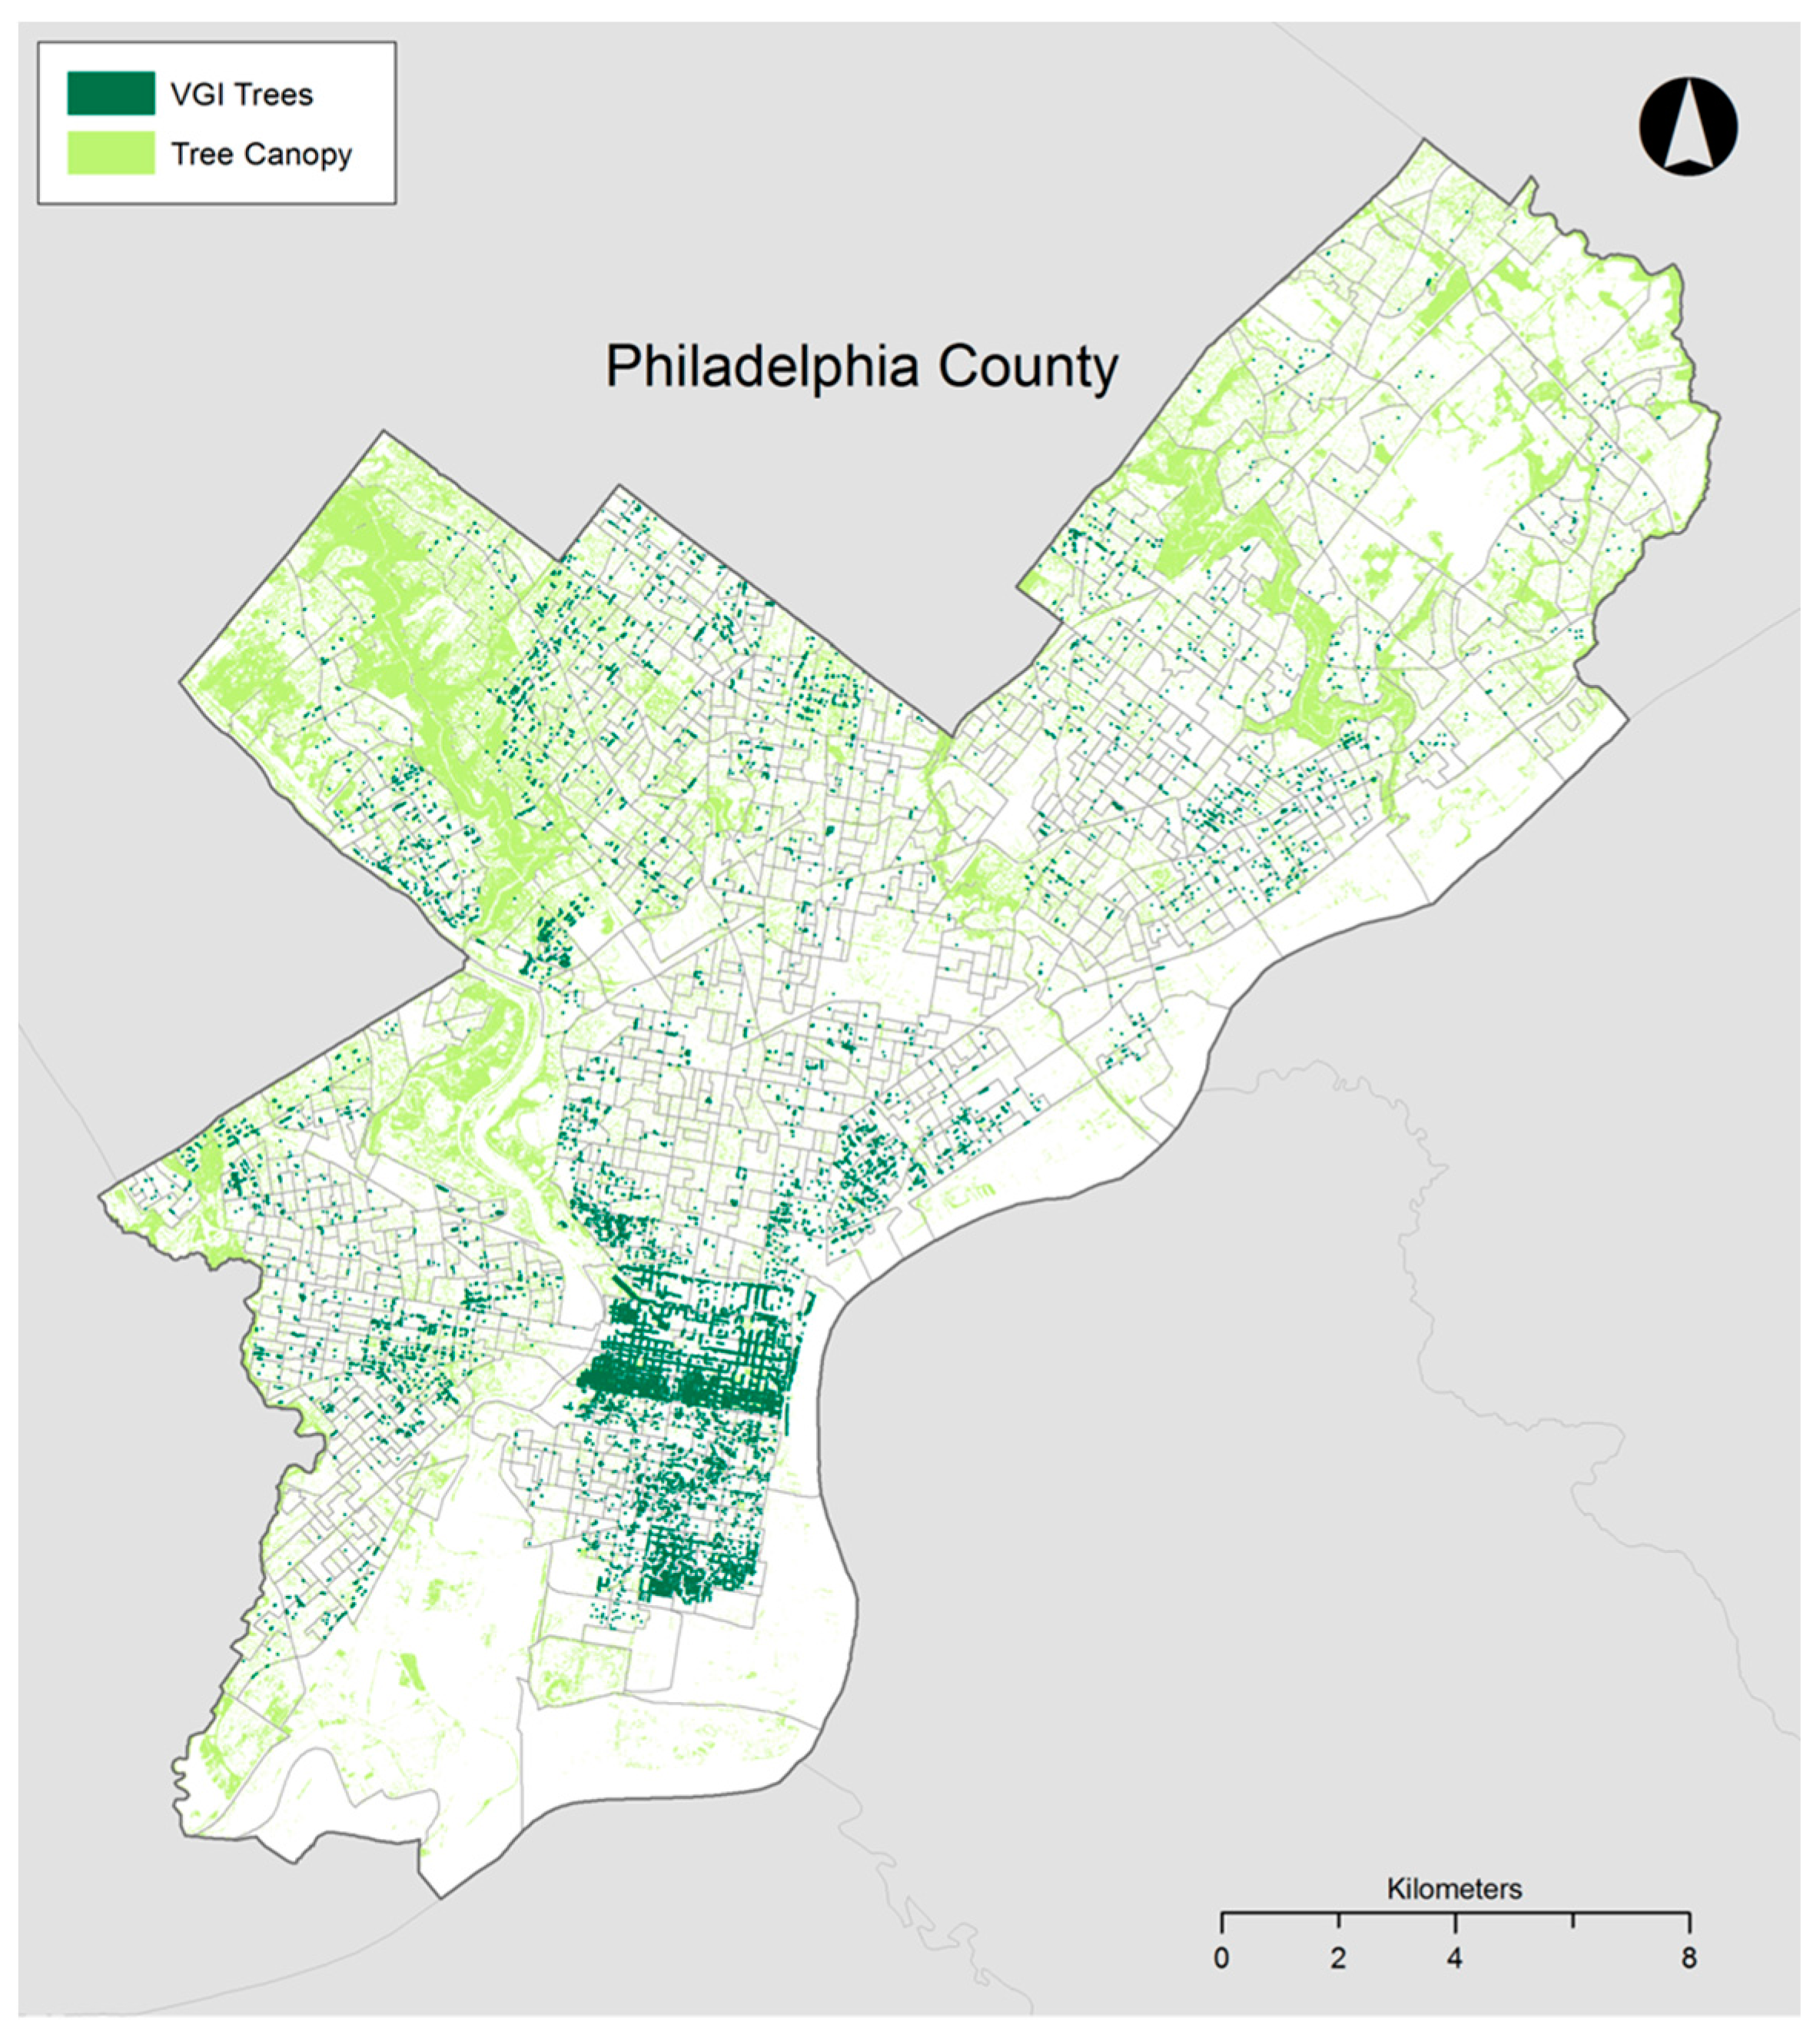
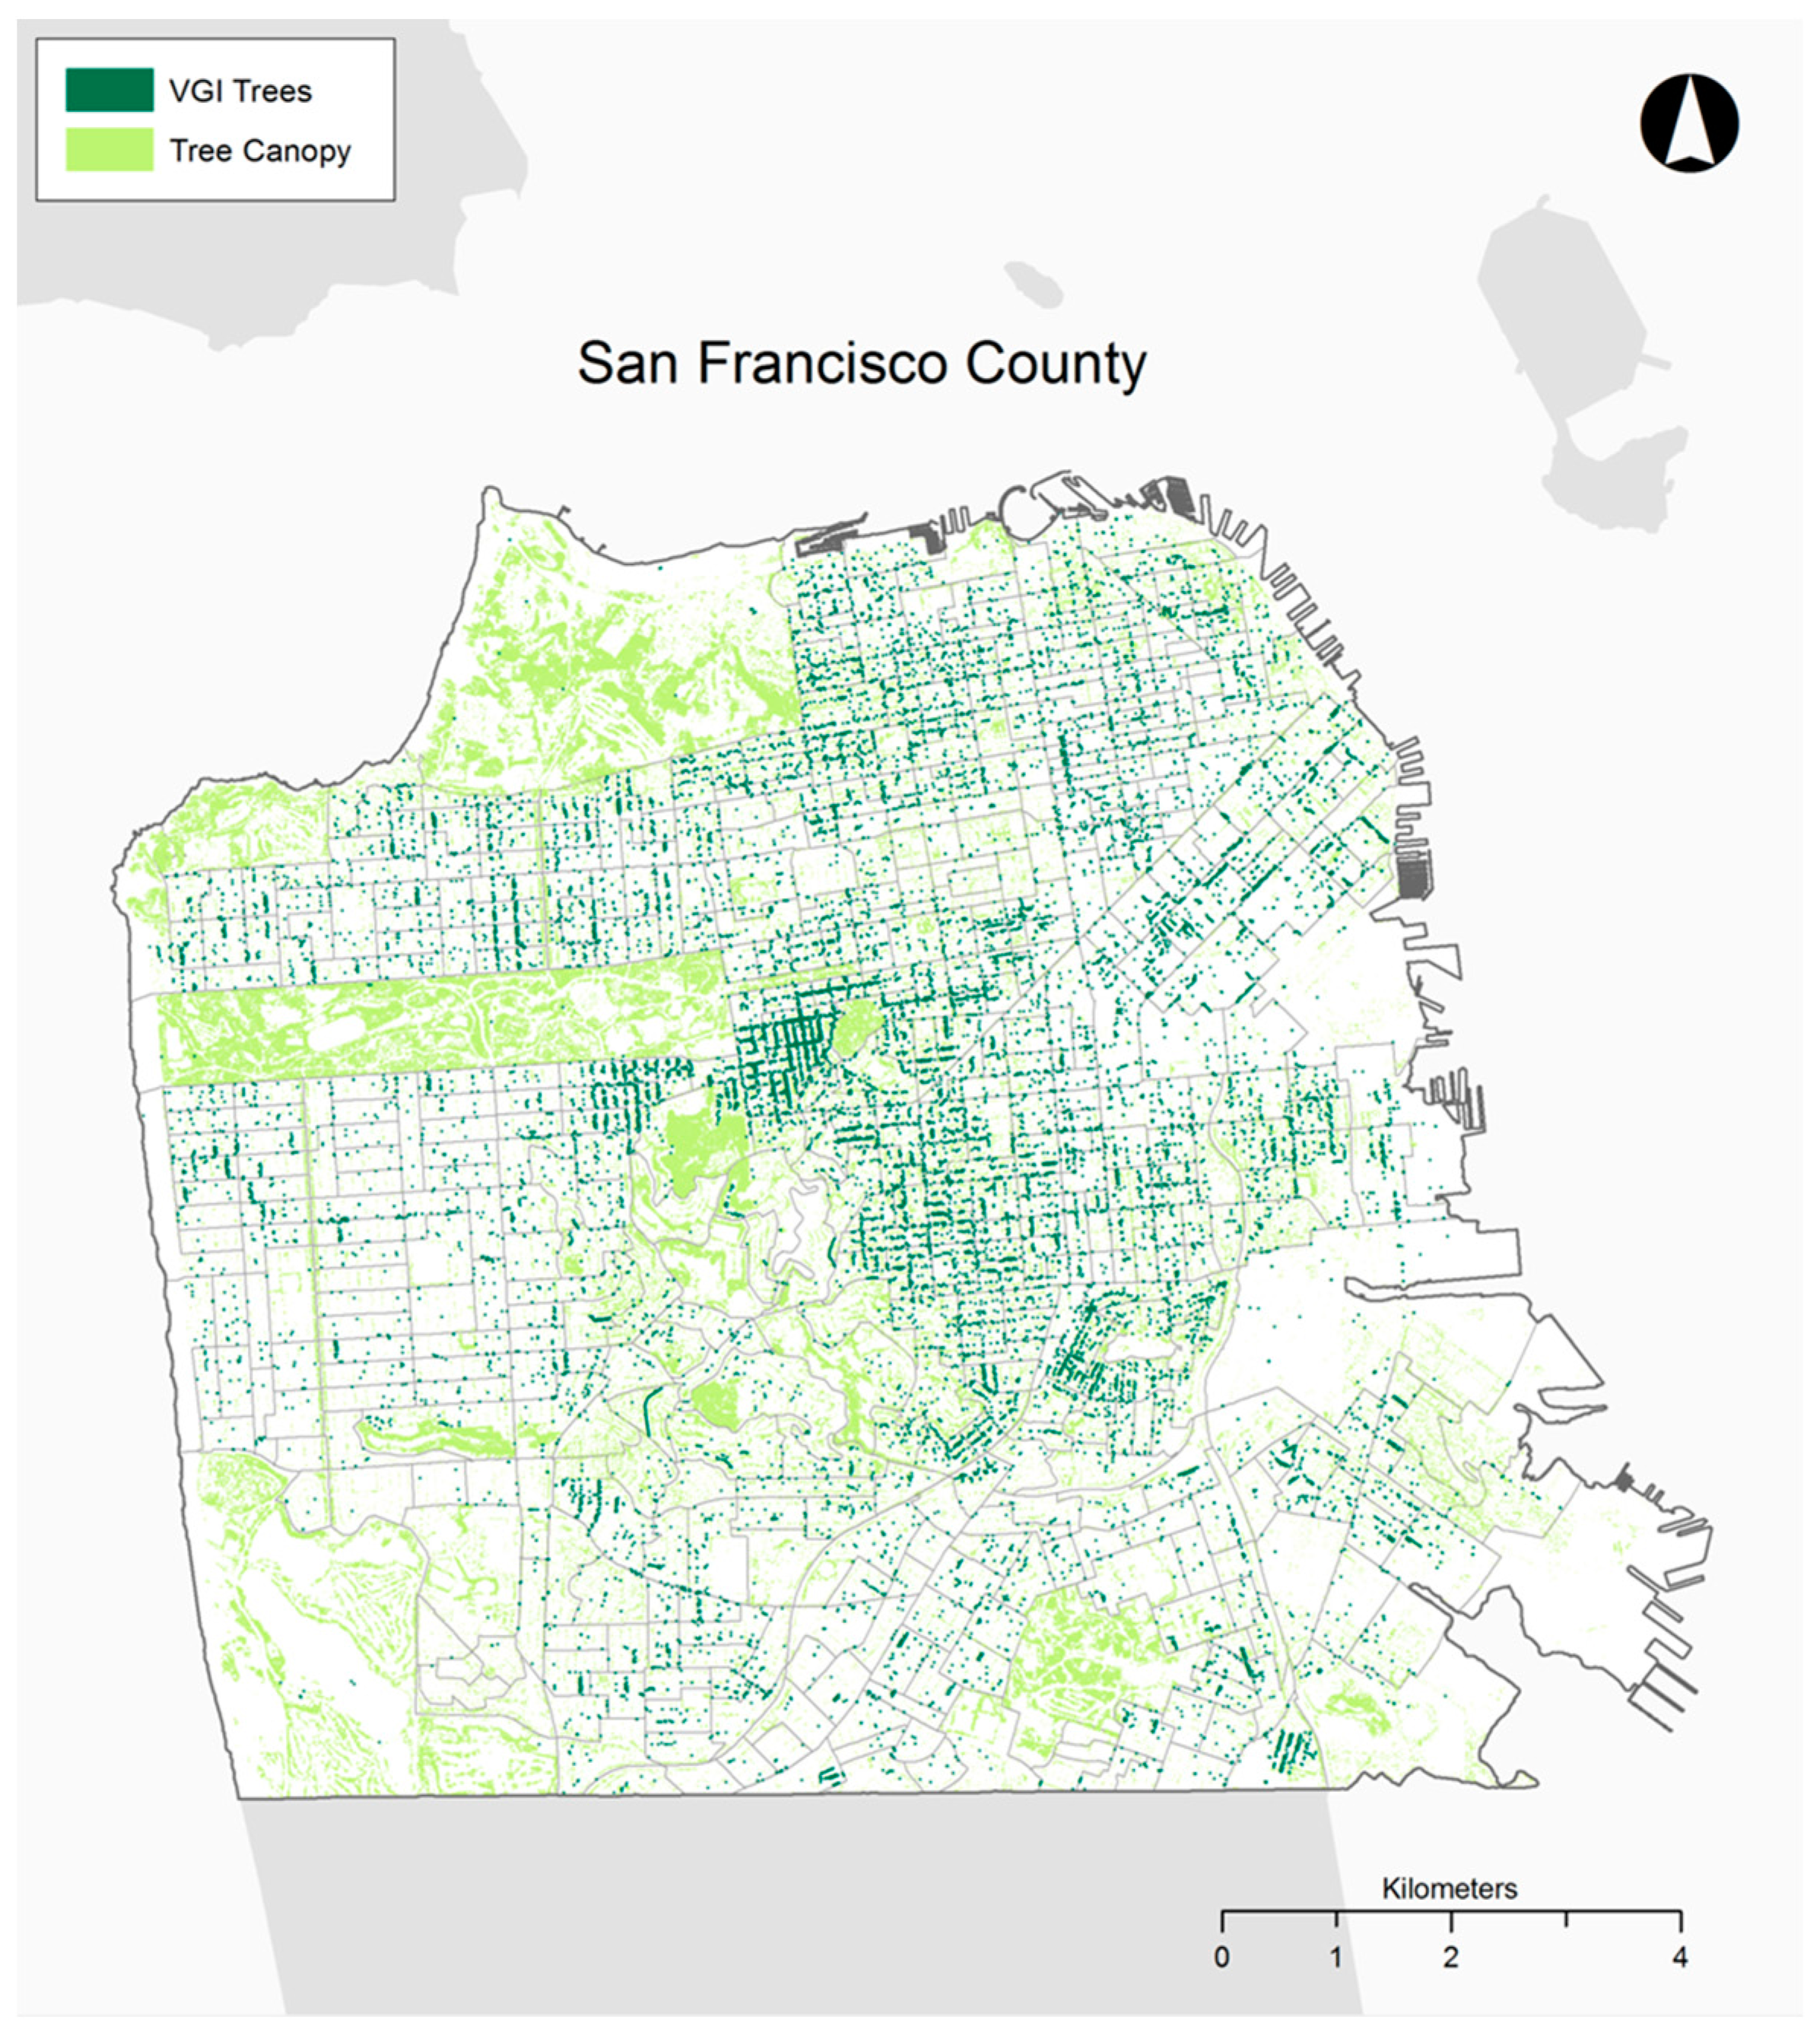
Environmental variables were also included in the model as predictors of VGI tree locations. The most important of these environmental variables is the estimation of tree canopy from high resolution remotely-sensed data for both locations, a 1-m land cover raster derived from Light Detection and Ranging (LiDAR) data [30] for Philadelphia in 2008, and a combination of 3-m, 1-meter, and 15.24-cm tree canopy rasters from 2010 derived from LiDAR data and aerial photography for San Francisco (unfortunately the data set does not include the percentage of coverage from each data source). Including the percentage of tree canopy per block group as an explanatory variable helps to remove the possibility that there are simply more VGI trees where there are more physical trees. This tree canopy coverage data, overlaid with the tree points downloaded from each location’s urban forest map, are shown in Figure 1 and Figure 2, for Philadelphia and San Francisco, respectively. Building footprint data were also obtained from the County Planning Department for both study sites (2007 data for Philadelphia and 2010 data for San Francisco) as an environmental variable, yielding the highest building elevation per block group. The two measures provide a control for density of local urban forests and for the density of the surrounding urban fabric. Other environmental variables such as mean slope, percent impervious surface cover, and population density were considered, but in line with previous research [38,39,40], they were found to be highly correlated with the percentage of tree canopy and for this reason were not included in the analysis.
3.3. Methods
This paper assessed whether asymmetries exist in data gathered through participatory urban forest mapping. These effects are modeled in two ways. Firstly, using the point data for trees mapped through the efforts described above, VGI trees are modeled in Philadelphia and San Francisco. The points are aggregated to counts by United States Census Block Groups, which are the finest level of spatial aggregation to which the measures we use are available. These models provide a gauge of data density. Secondly, we assess whether there are asymmetries in data richness, measured by the number of attributes entered for each tree, aggregated to a mean index of data richness for VGI trees (VGI tree index) in each block group.
Our question is whether physical, environmental, and sociodemographic measures might predict where VGI trees are contributed and/or the richness of data contributions (the VGI tree index). Overall, the assumptions follow the aforementioned literature on technological adoption discussed in the introduction. Specifically, the hypotheses are: trees will be better represented in areas that are relatively affluent (using median household income as a measure), elderly residents (measured in percentage of residents over 65 years old) and lower educational levels (measured as percentage of block group residents over 25 without high a school diploma) will be negatively correlated with our measures of VGI data density and richness, and the percentage of minority racial and ethnic status (specifically of Latino, African American, and Asian populations) will have negative relationships with our dependent variables as well. The local density of the urban forest is controlled for (by including the percentage tree canopy by block group), which is hypothesized to have a positive effect on the density of volunteered tree observations. We also control for the density of local urban fabric by including maximum building height as a proxy measure, where a negative relationship with the density of urban forest VGI is hypothesized. Finally, the block groups comprising the major parks in each study location were omitted from the analyses, as these block groups contain a high percentage of tree canopy that is not intended as the target for VGI tree mapping efforts, which instead focus upon street trees. Removing major parks resulted in 1333 and 578 block groups in the analysis for Philadelphia and San Francisco, respectively.
As is often the case with count data, the distribution of tree counts in both cities, and the derivative measures calculated from them, were found to be dramatically skewed, with false truncations at zero [41]. Typically count data have this pattern for which linear regression techniques are not generally viable options for examining correlations between these distributions and demographic and environmental neighborhood characteristics [42]. The two cities were not entirely similar, however. In Philadelphia, general linear models were fit using Poisson distribution with log link, treating the different dependent variables (count of VGI trees and average VGI tree index) as count data. The independent variables (median household income, percentage of residents over 65 years old, percentage of residents over 25 without a high school diploma, percentage of Latino, African American and Asian residents, percentage tree canopy, and maximum building height) were also distributed in a non-normal fashion, requiring square root transformations to make them suitable for inclusion in regression analyses.
In San Francisco, the counts of VGI trees were modeled as above, fitting the data based on log-linked Poisson distributions using general linear models. The VGI tree index’s distribution was less skewed when root squared, allowing for ordinary least squares (OLS) regression analysis to be performed.
Given the spatial nature of the data analyzed, the independence of observations and error terms in the four regression models presented a concern. The spatial clustering expressed in Tobler’s first law of geography, where increased proximity leads to increased relatedness [43], could lead to incorrect interpretations of model outcomes. Due to these concerns, tests were performed to detect spatial autocorrelation using the queen contiguity-based method to define the spatial weights matrix. The Moran’s I statistic revealed the presence of statistically significant positive spatial autocorrelation in three of four models, with the exception being the VGI tree index for San Francisco. This led to the construction of spatial autoregressive (SAR) models. Spatial error and spatial lag models are the two main options for incorporating spatial autocorrelation into regression equations [37,43,44]. Spatial error models associate the autocorrelation with the error term, while spatial lag models associate it with the dependent variable. The choice between models was based upon the robust Lagrange multiplier statistic [43], which was higher for the spatial lag in the three regression models exhibiting spatial autocorrelation issues, leading to its use here.
4. Results
The VGI data density and richness measures developed are shown in Table 1. As of October 2013, the Phillytreemap dataset contained 56,406 trees, of which 2947 were considered VGI trees. The VGI tree index was higher for all trees than VGI trees (1.6 compared to 1.4). Out of 1333 block groups, 1031 had a tree entered and 680 had a VGI tree. This helps to explain the average percentage of all trees that were VGI trees of 23.3 at the block group level.
At the same time, the San Francisco Open Tree Map consisted of 88,121 trees, of which 24,376 were considered VGI trees. The VGI tree index was higher for all trees than VGI trees (2.2 compared to 1.8). Out of 578 block groups, only three contained no trees and only eight contained no VGI trees. The mean percentage of VGI trees at the block group level was 31.8.
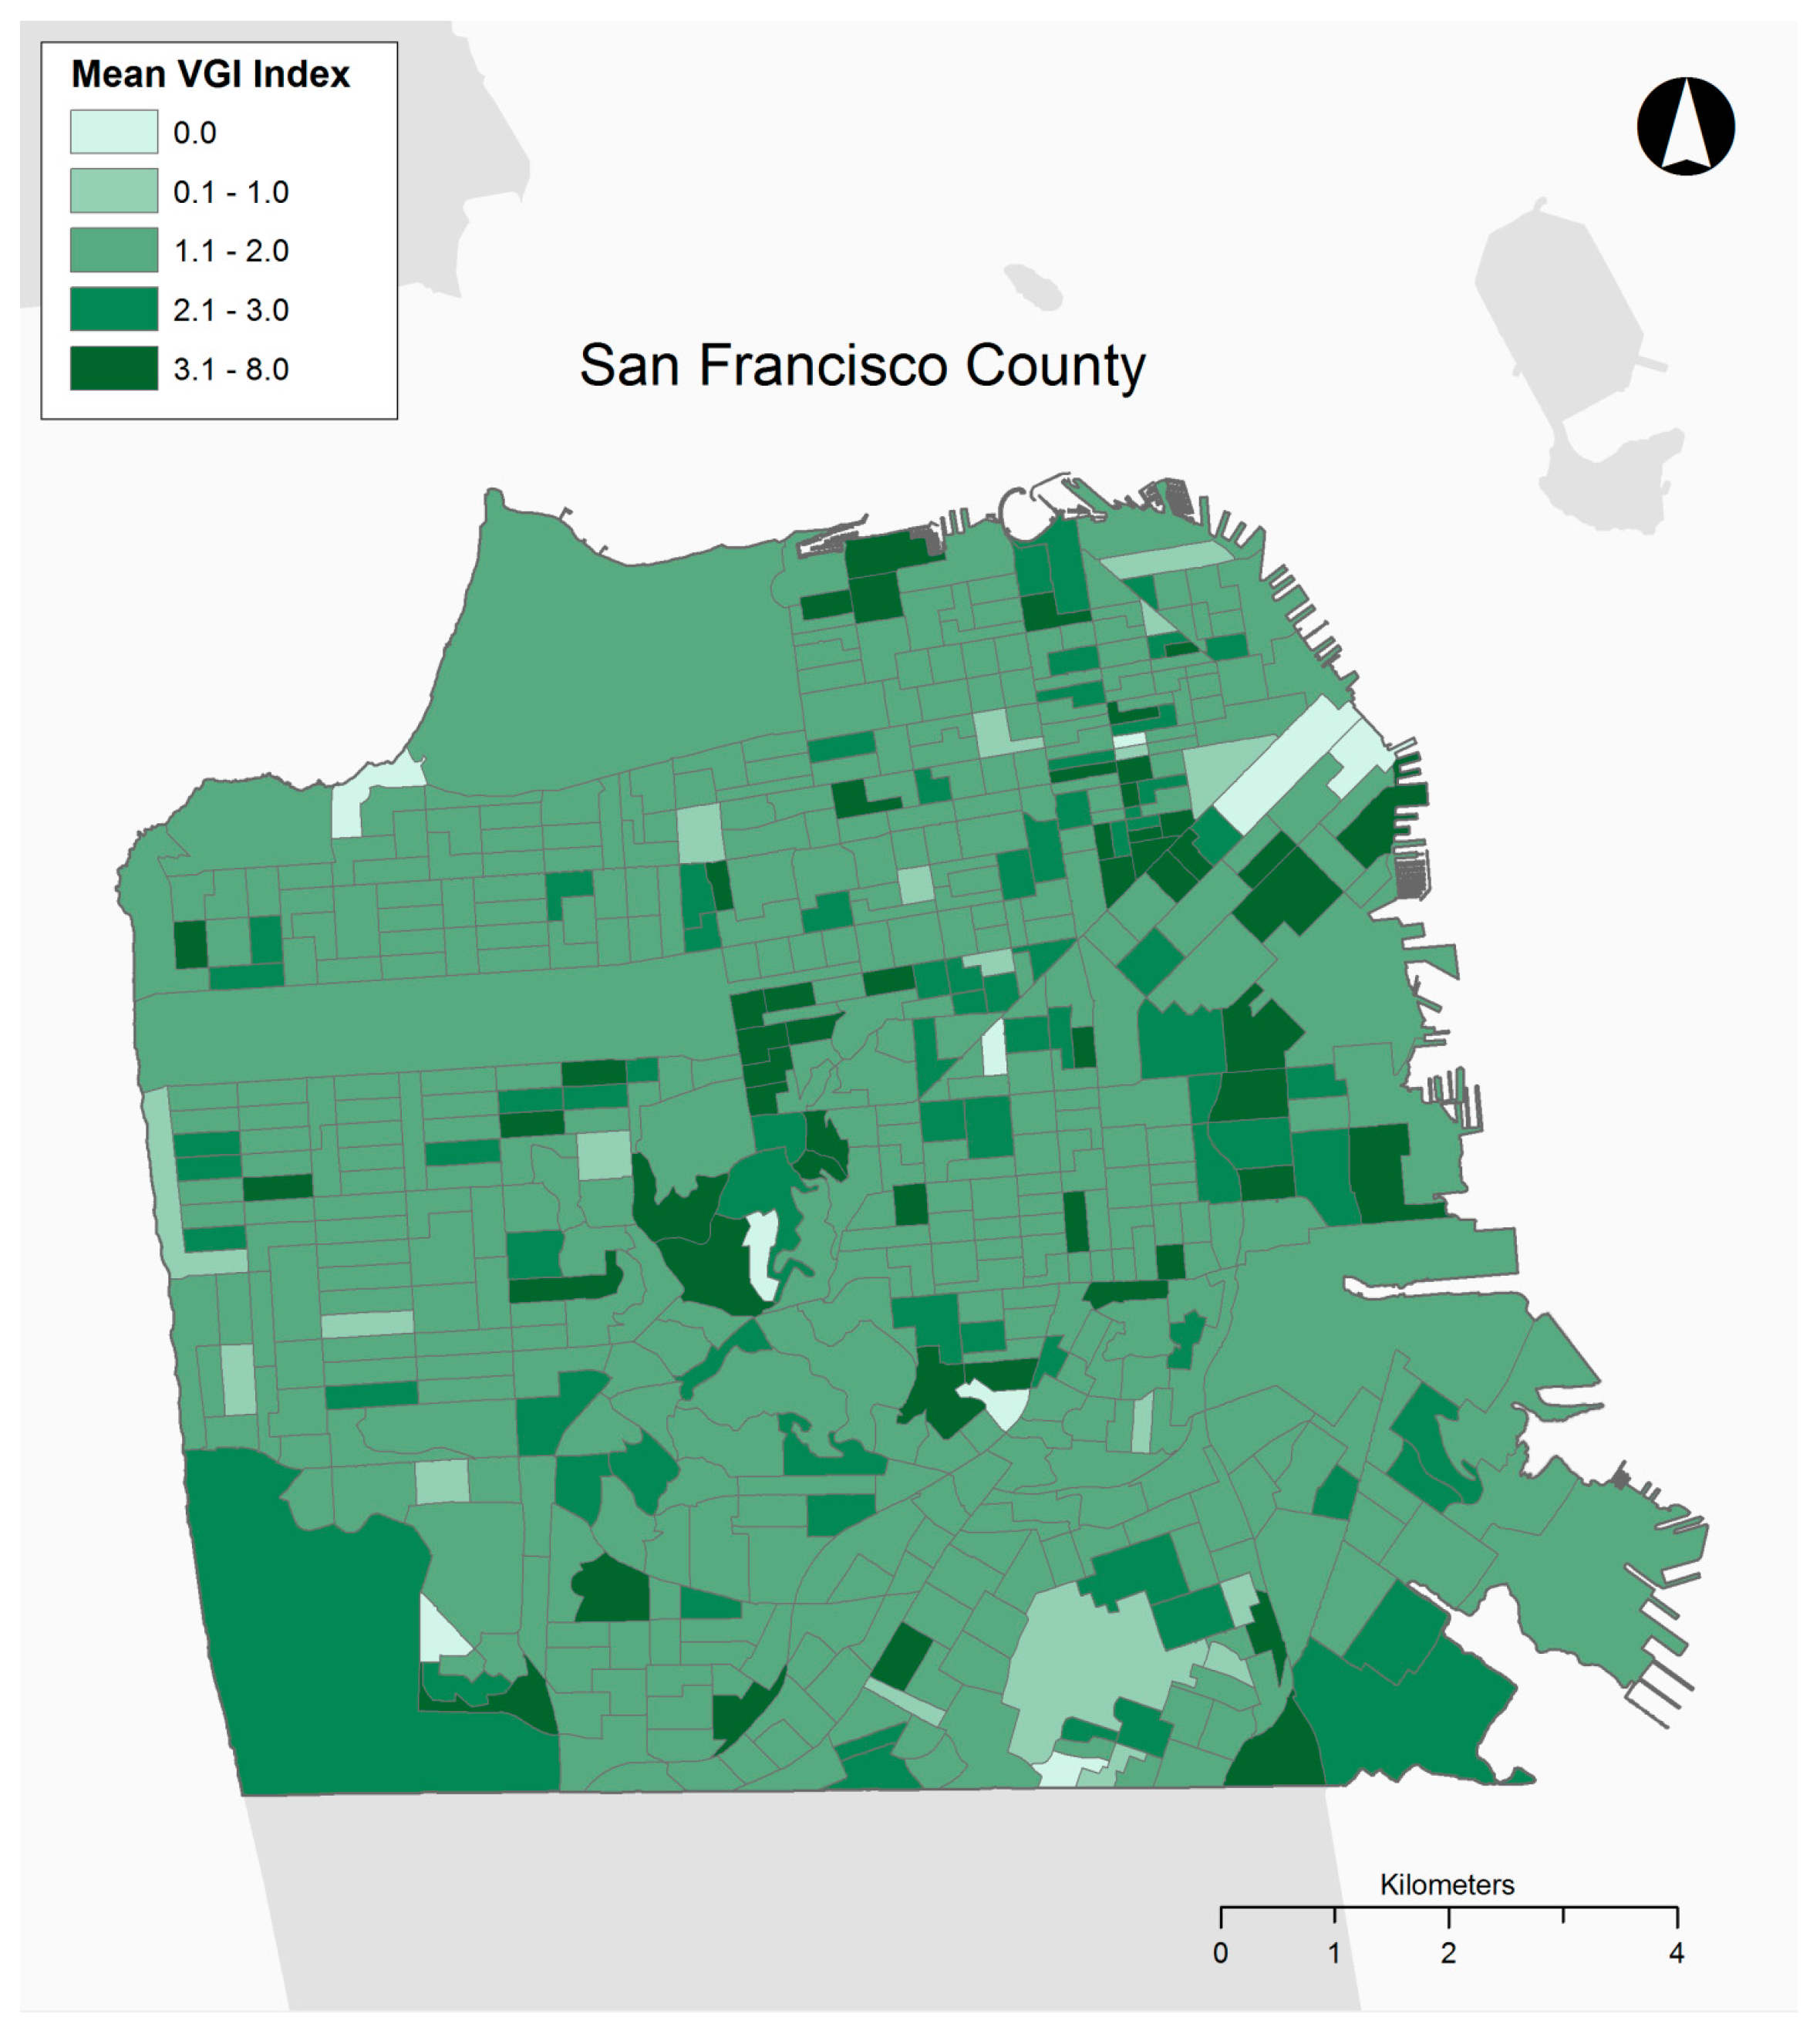
The raw numbers for the two study sites reveal disparities between the amount and type of contributions to each tree mapping website. San Francisco has a greater number of total trees and proportion of trees considered to be VGI contributed by citizens. The VGI tree index was greater for both all trees and VGI trees alone, revealing that San Francisco residents entered more trees and more information about them. This could be the result of the San Francisco website being active for three years longer than Philadelphia’s or it might be explained by other factors such as the level of promotion of the websites or preferences for urban trees. Finally, as shown in Figure 3 and Figure 4, representing the average VGI tree index per block group for Philadelphia and San Francisco, the data richness measure was also clustered spatially, suggesting that neighborhoods are contributing data differently in both locations.
The descriptive statistics for the explanatory variables in both locations are shown in Table 2. The differences highlighted between the two cities previously are evidenced by the differences in income, education and ethnicity between them. Philadelphia’s tree canopy, at the block group level, was 3.5 percent greater than San Francisco’s, which serves to invalidate the concern that more trees were entered in San Francisco simply due to a greater number of trees. The greater variances in the percentage of African American and Latino residents in Philadelphia and Asian residents in San Francisco suggest that these demographic characteristics have bimodal distributions, evidencing a high level of spatial segregation.
The results from the Poisson regressions in Philadelphia are shown in Table 3. First, all of the models were highly statistically significant, with extremely high chi squares. As the independent variables have all undergone square root transformations to approach normality, the following discussion will focus upon the signs that they carried in the regression rather than their magnitude. All of the explanatory variables were significant at the p < 0.01 level for both models. The model explaining the count of VGI trees per block group showed mostly expected results, with median household income, percentage of residents over the age of 65, and maximum building elevation having positive effects. Percentage over 25 without high school diplomas, percentage of African American, Latino, and Asian residents, and tree canopy percentage all had negative effects. Finally, the model for the VGI tree index shows that median household income and percentage of residents over the age of 65 had positive effects, and percentage over 25 without high school diplomas, the percentage of Latino, African American, and Asian residents, the percentage of tree canopy, and the maximum building elevation all had negative effects.
Several patterns emerge when looking at these explanations of VGI urban forest contributions in Philadelphia. First, median household income is a positive influence in both models; Secondly, the percentage of tree canopy per block group is negative for all models, suggesting that Philadelphia residents are not necessarily documenting trees where they are more prevalent in the city. Finally, the results for the three minority population groups are negative across both models, suggesting that more trees are being contributed with greater levels of data richness in areas with fewer racialized minorities.
The results from the San Francisco regression models are shown in Table 4, revealing that relationships between demographics and raw VGI tree count data are highly significant, with high chi-square tests. As the independent variables have all undergone square root transformations to normalize them, as was the case with the Philadelphia models above, their most salient aspects are the signs that they carried in the regression rather than their magnitudes. In the predictive model for the raw count of VGI trees, several hypothesized effects are evident. The density of observations is positively predicted by income, percent tree canopy, and density of the urban fabric. Additionally, the VGI count is negatively correlated with low levels of education, proportion of aged residents, and percent Latino. Unhypothesized effects are also present. The raw count of VGI trees is negatively correlated with percent Asian and positively correlated with percent black. The overall goodness of fit is statistically significant.
The other model analyzing predictors of VGI data richness (VGI tree index)—that was fit using OLS regression—is more ambiguous, with a very modest r2 score of 0.2. In both cases, a great deal of variance in the dependent variables is unaccounted for by the model. Beyond this, the OLS model testing data richness found more modest results. A positive relationship with income and tree canopy percentage, and a negative relationship with all three racial/ethnic categories, where the explanatory variables achieved statistical significance at p < 0.05, were revealed.
The general pattern among both models generated from the San Francisco dataset is that VGI has a strong, positive relationship with income, tree canopy, and density of the urban fabric. Quite unlike Philadelphia, percent African American is a positive predictor of VGI contributions and the richness of their data. For raw VGI counts, VGI appears to have a negative relationship with education and age, but the relationships lose their significance when predicting VGI data richness. The relationship between VGI and either percent Asian and percent Latino is ambiguous.
The results of the SAR models are shown in Table 5. As discussed previously, all of the models with the exception of the VGI tree index for San Francisco had positive and significant test statistics for spatial autocorrelation (Moran’s I), which led to the construction of spatial lag models. In comparison with the general linear models (GLM) models, the Aikake’s information criterion decreased for all three models, suggesting that the SAR models improved results and incorrect interpretations might be drawn from examining only the GLM results. The only explanatory variable that was significant across the three models was median household income, the positive sign associated with this predictor suggests that environmental injustices may be present if more urban forest VGI data density and richness is higher in more affluent areas. The percentage of Latino residents has a statistically significant negative relationship with VGI data density in Philadelphia, once again suggesting the presence of environmental injustice. Finally, as with the GLM models, the percentage of tree canopy per block group in Philadelphia has a negative relationship with urban forest data density and richness.
5. Discussion
This research serves as an initial exploration of the potential strengths and weaknesses of VGI as a collaborative urban planning tool. Through an examination of the spatial distribution and the data richness of volunteered data generated by tree mapping efforts in Philadelphia and San Francisco, our analyses conclude that sociodemographic and environmental indicators are predictive of characteristics of both densities of attributed trees and data richness. Contributing to the recent call for research on the implications of the democratization of data gathering operations through crowdsourcing [5], these findings suggest potential differentials in digital literacy and citizenship by neighborhood type, raising concerns about a potential digital divide in the utilization of VGI tree mapping applications.
Minorities that were more spatially segregated (African Americans and Latinos in Philadelphia, Asians in San Francisco) were less likely to have urban forest VGI contributed in their neighborhoods, raising concerns about both the accessibility of this technology and possible negative implications if it is used by policy practitioners to manage urban forests. When accounting for spatial autocorrelation, median household income was still a positive predictor of urban forest VGI data density and richness, even when controlling for urban tree canopy. Environmental justice researchers, arguing that access to amenities such as urban forests is an integral component of environmental justice along with earlier foci on hazards and disamenities, have documented the relationships between affluence, whiteness and increased urban tree canopy coverage for many years [37,38,45,46,47]. A recent study of seven major U.S. cities (including Philadelphia) [48] found a positive relationship between income and urban tree canopy in each city. Such results suggest that less affluent neighborhoods have fewer trees both on the ground and in VGI representations. In the extreme case, VGI has the potential to deepen rather than ameliorate differentials in place-based resources devoted to certain locales through policy decisions if neighborhoods where a large portion of trees are unrepresented are neglected due to their lack of representation in urban forest VGI datasets. The uneven representation in VGI coverage extends beyond urban forests [1,14,16], and may reinforce inequalities in representation from traditional data sources, where marginalized groups and areas are not always counted [1,2,4,21,49]. While there are concerns around privacy and surveillance by both the state and capital with the growing amount of digital traces generated through VGI and other sources [1,2,17], documenting the presence and condition of urban trees seems to provide a positive increase in legibility. Despite the democratizing rhetoric around VGI and other Web 2.0 technologies [14], this research highlights their potential to reinforce rather than break down barriers in terms of representation and potential negative urban environmental consequences.
While this research has highlighted potential strengths and weaknesses of VGI, limitations and opportunities for further research include the following. The urban forest VGI data are a rich source of often unavailable data for policy practitioners [31], and can reduce some of the costs [50] associated with municipal field surveys, however, the question remains as to whether they actually being used. Interviews with local governments and urban forest stewardship groups could help to answer this important question. Furthermore, qualitative research could help in understanding the usefulness of urban forest VGI to managers and practitioners, and incorporate practitioner priorities in the design of future platforms to ensure that the most important data are being collected, allowing VGI to act as a supplement or even a replacement for traditional field and remotely sensed data.
While the TreeMap data allow for the distinction between authoritative and VGI tree inputs to the websites, who is actually entering the data, and why, is not yet fully understood. Qualitative research with contributors could help in understanding the motivations behind VGI participation. In light of this limitation, future research may examine VGI longitudinally to determine what type of neighborhoods are early adopters, which lag, and what are the correlates of each. Furthermore, the differences in both data distribution and the effects of demographic and environmental factors between the two locations make clear the need to examine how and why VGI is generated differentially, rather than drawing geographic generalizations. These heterogeneous results regarding urban forest VGI which highlight the importance of local analysis are similar to those regarding London’s Open Street Map found by Haklay et al. [51]. The many other cities that have implemented the Open Tree Map platform should be investigated to see how patterns of urban forest VGI representation vary across sites and how such spatial variations can be explained by local dynamics and histories. Additionally, designers of geotechnology applications should seek to find ways to make technology accessible and perhaps incentivize use.
Geospatial Web 2.0 applications will continue to proliferate in coming years, presenting substantial opportunities for collaborative data gathering, innovative research, and improved policymaking; however, asymmetries in the quantity and quality of the data may undermine their effectiveness. The predictors of the uneven production of the spatial data in VGI applications appear to reflect previous research on, and may be interpreted as yet another expression of, the digital divide. We hope that this initial exploration of the potential of urban forest VGI as a collaborative urban planning tool will help to increase digital citizenship, improve urban forest management, and promote awareness of this powerful new technology. To be clear, despite the concerns expressed regarding the spatial distribution of contributions to urban forest VGI maps and their richness in Philadelphia and San Francisco, this paper is not a condemnation of tree mapping websites, their creators and contributors, or VGI in general. Rather, attention is called to the need to ensure that these technologies are employed and utilized in manners that increase equality. There is great potential to increase data richness and the equity of coverage if care is taken. To borrow Eric Darier’s paraphrase of Foucault “not everything is bad, but everything is dangerous [52] (p. 603).”
Acknowledgments
We would like to acknowledge the resources of the Spatial Analysis Lab in the Department of Geography and Urban Studies at Temple University, which were utilized during the writing of this paper.
Author Contributions
Alec Foster analyzed the Philadelphia data. Charles Kaylor analyzed the San Francisco data. Ian M. Dunham designed the maps. All three authors wrote the paper. Alec Foster revised the paper.
Conflicts of Interest
The authors declare no conflict of interest.
References
- Elwood, S. Geographic information science: Emerging research on the societal implications of the geospatial web. Prog. Hum. Geogr. 2009, 34, 349–357. [Google Scholar] [CrossRef]
- Elwood, S.; Goodchild, M.F.; Sui, D.Z. Researching Volunteered Geographic Information: Spatial Data, Geographic Research, and New Social Practice. Ann. Assoc. Am. Geogr. 2012, 102, 571–590. [Google Scholar] [CrossRef]
- Desouza, K.C.; Bhagwatwar, A. Citizen Apps to Solve Complex Urban Problems. J. Urban Technol. 2012, 19, 107–136. [Google Scholar] [CrossRef]
- Adams, D. Volunteered Geographic Information: Potential Implications for Participatory Planning. Plan. Pract. Res. 2013, 28, 464–469. [Google Scholar] [CrossRef]
- Foster, A.; Dunham, I.M. Volunteered geographic information, urban forests, & environmental justice. Comput. Environ. Urban Syst. 2014. [Google Scholar] [CrossRef]
- Mossberger, K.; Tolbert, C.J.; Bowen, D.; Jimenez, B. Unraveling Different Barriers to Internet Use: Urban Residents and Neighborhood Effects. Urban Aff. Rev. 2012, 48, 771–810. [Google Scholar] [CrossRef]
- Tsai, H.Y.S.; Larose, R. Broadband Internet adoption and utilization in the inner city: A comparison of competing theories. Comput. Human Behav. 2015, 51, 344–355. [Google Scholar] [CrossRef]
- Horrigan, J. Broadband Adoption and Use in America; OBI Working Paper Series; Federal Communications Commission: Washington, DC, USA, 2010.
- Savage, S.J. United States Demand for Internet Access. Rev. Netw. Econ. 2004, 3, 228–247. [Google Scholar] [CrossRef]
- Economics and Statistics Administration (ESA); National Telecommunications and Information Administration (NTIA). Exploring the Digital Nation: Computer and Internet Use at Home; U.S. Department of Commerce: Washington, DC, USA, 2011.
- Pick, J.B.; Sarkar, A.; Johnson, J. United States digital divide: State level analysis of spatial clustering and multivariate determinants of ICT utilization. Socioecon. Plann. Sci. 2015, 49, 16–32. [Google Scholar] [CrossRef]
- Katz, V.; Gonzalez, C. Community variation in low-income Latino families’ technology adoption and integration. Am. Behav. Sci. 2016, 60, 59–80. [Google Scholar] [CrossRef]
- Coleman, D.; Georgiadou, Y.; Labonte, J. Volunteered Geographic Information: the nature and motivation of produsers. Int. J. 2009, 4, 332–358. [Google Scholar] [CrossRef]
- Crutcher, M.; Zook, M. Placemarks and waterlines: Racialized cyberscapes in post-Katrina Google Earth. Geoforum 2009, 40, 523–534. [Google Scholar] [CrossRef]
- Girres, J.-F.; Touya, G. Quality Assessment of the French OpenStreetMap Dataset. Trans. GIS 2010, 14, 435–459. [Google Scholar] [CrossRef]
- Haklay, M. How good is volunteered geographical information? A comparative study of OpenStreetMap and Ordnance Survey datasets. Environ. Plan. B Plan. Des. 2010, 37, 682–703. [Google Scholar] [CrossRef]
- Connors, J.; Lei, S.; Kelly, M. Citizen science in the age of neogeography: Utilizing volunteered geographic information for environmental monitoring. Ann. Assoc. Am. Geogr. 2012, 102, 1267–1289. [Google Scholar] [CrossRef]
- Sui, D.; Elwood, S.; Goodchild, M. Volunteered geographic information, the exaflood, and the growing digital divide. In Crowdsourcing Geographic Knowledge: Volunteered Geographic Information (VGI) in Theory and Practice; Sui, D., Elwood, S., Goodchild, M., Eds.; Springer: New York, NY, USA, 2013; pp. 1–12. [Google Scholar]
- Johnson, P.A.; Siber, R.E. Situating the adoption of VGI by goverment. In Crowdsourcing Geographic Knowledge Volunteered Geographic Information (VGI) in Theory and Practice; Sui, D., Elwood, S., Goodchild, M., Eds.; Springer: New York, NY, USA, 2013; pp. 65–81. [Google Scholar]
- Knudsen, A.S. The role of Volunteered Geographic Information in participatory planning: Examples from Denmark and Finland. Geoforum Perspektiv 2012, 11, 35–46. [Google Scholar]
- Atzmanstorfer, K.; Resl, R.; Eitzinger, A.; Izurieta, X. The geocitizen approach: Community-based spatial planning. Cartogr. Geogr. Inf. Sci. 2014, 41, 248–259. [Google Scholar] [CrossRef] [PubMed]
- Brown, G.; Kelly, M.; Whitall, D. Which “public”? Sampling effects in public participation GIS (PPGIS) and volunteered geographic information (VGI) systems for public lands management. J. Environ. Plan. Manag. 2014, 57, 190–214. [Google Scholar] [CrossRef]
- Ertiö, T.-P. Participatory Apps for Urban Planning—Space for Improvement. Plan. Pract. Res. 2015, 30, 303–321. [Google Scholar] [CrossRef]
- Twitchen, C.; Adams, D. Increasing Levels of Public Participation in Planning Using Web 2.0 Technology; Birmingham City University: Birmingham, UK, 2011. [Google Scholar]
- Desouza, K.C.; Bhagwatwar, A. Technology-Enabled Participatory Platforms for Civic Engagement: The Case of U.S. Cities. J. Urban Technol. 2014, 21, 25–50. [Google Scholar] [CrossRef]
- San Francisco Urban Forest Map. Available online: http://urbanforestmap.org/ (accessed on 14 November 2013).
- PhillyTreeMap. Available online: http://www.phillytreemap.org/ (accessed on 11 August 2012).
- Nowak, D.J.; Hoehn, R.E.I.; Crane, D.E.; Stevens, J.C.; Walton, J.T. Assessing Urban Forest Effects and Values: San Francisco’s Urban Forest; U.S. Department of Agriculture, Forest Service, Northern Research Station: Newtown Square, PA, USA, 2007. [Google Scholar]
- Nowak, D.J.; Hoehn, R.E.I.; Crane, D.E.; Stevens, J.C.; Walton, J.T. Assessing Urban Forest Effects and Values: Philadelphia’s Urban Forest; U.S. Department of Agriculture, Forest Service, Northern Research Station: Newtown Square, PA, USA, 2007. [Google Scholar]
- O’Neil-Dunne, J. A Report on the City of Philadelphia’s Existing and Possible Tree Canopy; USDA Forest Service: Washington, DC, USA, 2011.
- Kielbaso, J.J. Management of Urban Forests in the United States. In Ecology, Planning, and Management of Urban Forests: International Perspectives; Carreiro, M.M., Song, Y.-C., Wu, J., Eds.; Springer: Dordrecht, The Netherlands, 2008; pp. 240–258. [Google Scholar]
- U.S. Census Bureau Annual Estimates of the Resident Population: 1 April 2010 to 1 July 2014. Available online: https://factfinder.census.gov/faces/nav/jsf/pages/index.xhtml (accessed on 1 October 2015).
- Adams, C.; Bartelt, D.; Elesh, D.; Goldstein, I. Restructuring the Philadelphia Region; Temple University Press: Philadelphia, PA, USA, 2008. [Google Scholar]
- U.S. Census Bureau Household Income Inequality within U.S. Counties: 2006–2010. Available online: http://www.census.gov/prod/2012pubs/acsbr10-18.pdf (accessed on 1 October 2015).
- Hu, R. San Francisco’s Urban Transformations since the 1980s; Berkeley Institute of Urban and Regional Development: Sydney, Australia, 2009. [Google Scholar]
- Rondinelli, D.A. Making Metropolitan Areas Competitive and Sustainable in the New Economy. J. Urban Technol. 2001, 8, 1–21. [Google Scholar] [CrossRef]
- Landry, S.M.; Chakraborty, J. Street trees and equity: Evaluating the spatial distribution of an urban amenity. Environ. Plan. A 2009, 41, 2651–2670. [Google Scholar] [CrossRef]
- Heynen, N.C.; Lindsey, G. Correlations of Urban Forest Canopy Cover: Implications for Local Public Works. Public Work. Manag. Policy 2003, 8, 33–47. [Google Scholar] [CrossRef]
- Pham, T.-T.-H.; Apparicio, P.; Séguin, A.-M.; Landry, S.; Gagnon, M. Spatial distribution of vegetation in Montreal: An uneven distribution or environmental inequity? Landsc. Urban Plan. 2012, 107, 214–224. [Google Scholar] [CrossRef]
- Locke, D.H.; Landry, S.M.; Grove, J.M.; Chowdhury, R.R.; Florida, S.; Ave, E.F.; Station, F.; Service, U.F. What’s scale got to do with it? Models for urban tree canopy. J. Urban Ecol. 2016, 1–16. [Google Scholar] [CrossRef]
- Coxe, S.; West, S.G.; Aiken, L.S. The Analysis of Count Data: A Gentle Introduction to Poisson Regression and Its Alternatives. J. Pers. Assess. 2009, 91, 121–136. [Google Scholar] [CrossRef] [PubMed]
- Gardner, W.; Mulvey, E.P.; Shaw, E.C. Regression analyses of counts and rates: Poisson, overdispersed Poisson, and negative binomial models. Psychol. Bull. 1995, 118, 392–404. [Google Scholar] [CrossRef] [PubMed]
- Chakraborty, J. Revisiting Tobler’s First Law of Geography: Spatial Models for Assessing Environmental Justice and Health Risk Disparities. In Geospatial Analysis of Environmental Health; Maantay, J.A., McLafferty, S., Eds.; Springer: Dordrecht, The Netherlands, 2011; ISBN 978-94-007-0328-5. [Google Scholar]
- Raddatz, L.; Mennis, J. Environmental Justice in Hamburg, Germany. Prof. Geogr. 2013, 65, 495–511. [Google Scholar] [CrossRef]
- Iverson, L.R.; Cook, E.A. Urban forest cover of the Chicago region and its relation to household density and income. Urban Ecosyst. 2000, 4, 105–124. [Google Scholar] [CrossRef]
- Pedlowski, M.A.; Carneiro Da Silva, V.A.; Adell, J.J.C.; Heynen, N.C. Urban forest and environmental inequality in Campos dos Goytacazes, Rio de Janeiro, Brazil. Urban Ecosyst. 2003, 6, 9–20. [Google Scholar] [CrossRef]
- Gatrell, J.; Jensen, R. Growth through greening: Developing and assessing alternative economic development programmes. Appl. Geogr. 2002, 22, 331–350. [Google Scholar] [CrossRef]
- Schwarz, K.; Fragkias, M.; Boone, C.G.; Zhou, W.; McHale, M.; Grove, J.M.; O’Neil-Dunne, J.; McFadden, J.P.; Buckley, G.L.; Childers, D.; et al. Trees grow on money: Urban tree canopy cover and environmental justice. PLoS ONE 2015, 10, e0122051. [Google Scholar] [CrossRef] [PubMed]
- Hall, J.P.; Ipsen, C.; Kurth, N.K.; Chambless, C.; McCormick, S.; Goe, R. Under-representation of certain disability groups by the American Community Survey (ACS). Disabil. Health J. 2017. [Google Scholar] [CrossRef] [PubMed]
- Berland, A.; Lange, D.A. Google Street View shows promise for virtual street tree surveys. Urban For. Urban Green. 2017, 21, 11–15. [Google Scholar] [CrossRef]
- Haklay, M.; Basiouka, S.; Antoniou, V.; Ather, A. How Many Volunteers Does it Take to Map an Area Well? The Validity of Linus’ Law to Volunteered Geographic Information. Cartogr. J. 2010, 47, 315–322. [Google Scholar] [CrossRef]
- Darier, É. Environmental governmentality: The case of Canada’s green plan. Environ. Politics 1996, 5, 585–606. [Google Scholar] [CrossRef]
Figure 1.
Philadelphia tree canopy and all tree points.

Figure 2.
San Francisco tree canopy and all tree points.

Figure 3.
Philadelphia mean VGI index (the mean number of attributes per VGI tree in each block group).
Figure 3.
Philadelphia mean VGI index (the mean number of attributes per VGI tree in each block group).
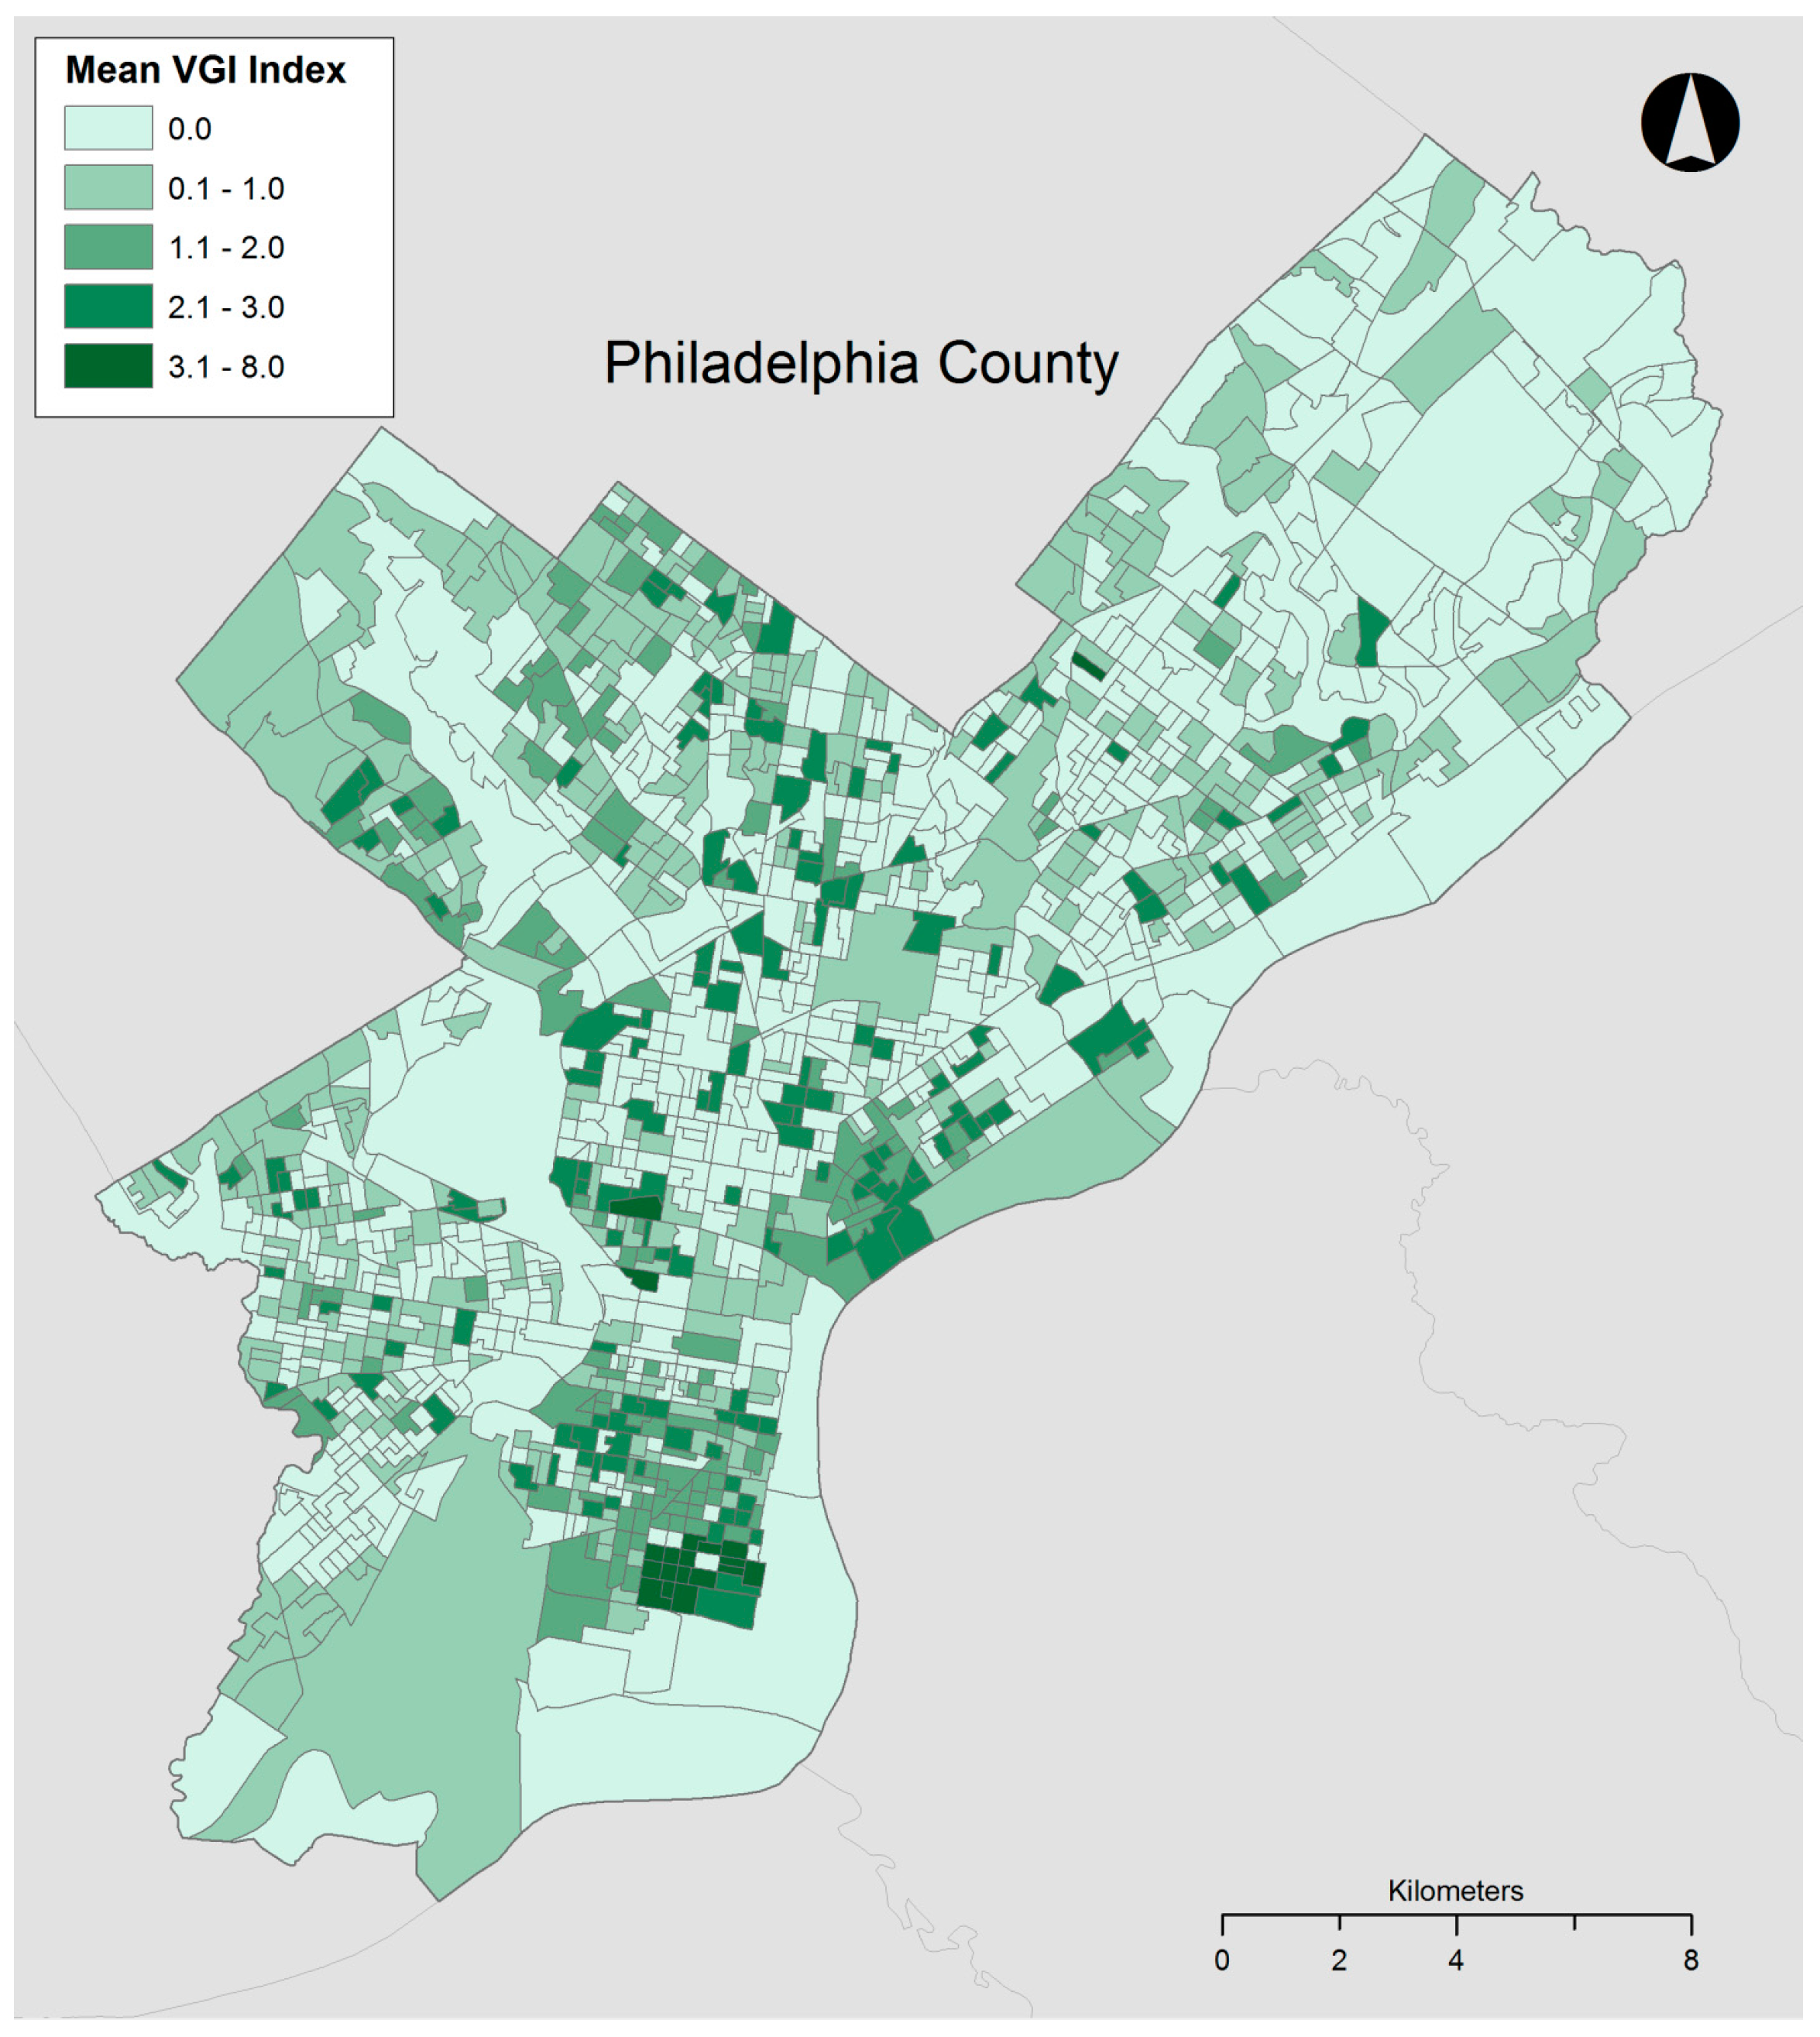
Figure 4.
San Francisco mean VGI index (the mean number of attributes per VGI tree in each block group).
Figure 4.
San Francisco mean VGI index (the mean number of attributes per VGI tree in each block group).

Table 1.
Tree counts.
| Raw Count | Philadelphia | San Francisco |
|---|---|---|
| All trees | 56,406 | 88,121 |
| VGI trees | 2947 | 24,376 |
| Percent VGI trees | 5.2 | 2.8 |
| All tree index | 1.6 | 2.2 |
| VGI tree index | 1.4 | 1.8 |
Table 2.
Descriptive statistics of covariates.
| Measure | Philadelphia Mean | Philadelphia Standard Deviation (SD) | San Francisco Mean | San Francisco SD |
|---|---|---|---|---|
| Percent No High School(HS) diploma | 34.5 | 14.7 | 14.2 | 9.8 |
| Median Househole Income(HHI) | $43,607 | $21,948 | $83,438 | $36,687 |
| Percent 65+ | 11.7 | 6.8 | 13.8 | 7.1 |
| Percent Latino | 12.9 | 19.2 | 15.1 | 13.2 |
| Percent Black | 47.3 | 36.8 | 5.6 | 8.9 |
| Percent Asian | 5.8 | 8.3 | 33.1 | 20.3 |
| Tree canopy percent | 13.1 | 9.7 | 9.6 | 6.7 |
| Maximum building height (in feet) | 183 | 99 | 99 | 51 |
Table 3.
Philadelphia analytical models.
| Measure | VGI Trees | VGI Tree Index |
|---|---|---|
| Constant | 0.753 | 3.359 |
| Percent no HS diploma | −0.081 | −49 |
| Median HHI | 0.003 | 0.001 |
| Percent 65+ | 0.13 | 0.078 |
| Percent Latino | −0.05 | −0.072 |
| Percent Black | −0.021 | −0.04 |
| Percent Asian | −0.146 | −0.035 |
| Tree canopy percent | −1.064 | −0.207 |
| Maximum building height (in feet) | 0.019 | −0.036 |
| Model fit Chi-square (ChiSq) | 434.859 | 1423.802 |
| Goodness of fit (ChiSq) | 9469.287 | 17,554.913 |
| Moran‘s I | 0.143177 | 0.317909 |
| Deviance | 6184.889 | 17,679.559 |
| Robust Lagrange multiplier (RLM) (lag) | 19.4099 | 293.4201 |
| Robust Lagrange multiplier (error) | 6.3048 | 2.0709 |
| Aikake’s Information Criterion Corrected(AICc) | 1870.04 | 10,239.6 |
| N | 1333 |
Note: all p < 0.01 except for RLM (error): VGI trees < 0.05, VGI index > 0.1.
Table 4.
San Francisco analytical models.
| Measure | VGI Trees | VGI Tree Index |
|---|---|---|
| Constant | 3.7775 * | 1.0664 |
| Percent no HS diploma | −0.0175 * | −0.01 |
| Median HHI | 0.0008 * | 0.0004 * |
| Percent 65+ | −0.0490 * | −0.0048 |
| Percent Latino | −0.0035 * | 0.0273 * |
| Percent Black | 0.0525 * | 0.0152 * |
| Percent Asian | −0.0930 * | 0.0061 * |
| Tree canopy percent | 0.0059 * | 0.0018 * |
| Maximum building height (in feet) | 0.9903 * | 0.0232 |
| F | 3.17068 * | |
| Standard Error (SE) | 0.967 | |
| Model fit (ChiSq) | 1768 * | |
| Goodness of fit (ChiSq) | 18,535 * | |
| Moran‘s I | 0.398663 * | 0.037491 |
| Deviance | 14,119.045 | |
| Robust Lagrange multiplier (lag) | 40.2516 | 0.546 |
| Robust Lagrange multiplier (error) | 5.6659 | 1.0107 |
| AICc | 5841.19 | 397.198 |
| n | 578 |
Note: * indicates p < 0.5.
Table 5.
Spatial autoregressive models.
| Measure | Philadelphia VGI Trees | Philadelphia VGI Tree Index | San Francisco VGI Trees |
|---|---|---|---|
| Weight | 0.351944 * | 0.506655 * | 0.57514 * |
| Constant | 0.27875 * | 7.3821 * | 4.68175 |
| Percent no HS diploma | 0.012815 | −0.134049 | −0.588474 |
| Median HHI | 0.001311 * | 0.0135612 * | 0.0379647 * |
| Percent 65+ | 0.01282 | 0.538844 | −0.361221 |
| Percent Latino | −0.01638 * | −0.257161 | 0.63453 |
| Percent Black | −0.00493 | −0.169201 | 1.77735 |
| Percent Asian | −0.01227 | −0.125237 | −1.0292 |
| Tree canopy percent | −0.28562 * | −9.90599 * | 23.4969 |
| Maximum building height | 0.001185 | −0.115847 | −0.353712 |
| r2 | 0.137205 | 0.239742 | 0.321754 |
| Log Likelihood | −885.527 | −5006.44 | −2843.9 |
| AICc | 1791.05 | 10,032.9 | 5707.8 |
Note: * indicates p < 0.1.
© 2017 by the authors. Licensee MDPI, Basel, Switzerland. This article is an open access article distributed under the terms and conditions of the Creative Commons Attribution (CC BY) license (http://creativecommons.org/licenses/by/4.0/).
Share and Cite
MDPI and ACS Style
Foster, A.; Dunham, I.M.; Kaylor, C. Citizen Science for Urban Forest Management? Predicting the Data Density and Richness of Urban Forest Volunteered Geographic Information. Urban Sci. 2017, 1, 30. https://doi.org/10.3390/urbansci1030030
AMA Style
Foster A, Dunham IM, Kaylor C. Citizen Science for Urban Forest Management? Predicting the Data Density and Richness of Urban Forest Volunteered Geographic Information. Urban Science. 2017; 1(3):30. https://doi.org/10.3390/urbansci1030030
Chicago/Turabian StyleFoster, Alec, Ian M. Dunham, and Charles Kaylor. 2017. "Citizen Science for Urban Forest Management? Predicting the Data Density and Richness of Urban Forest Volunteered Geographic Information" Urban Science 1, no. 3: 30. https://doi.org/10.3390/urbansci1030030