An Integrated Modeling Approach Combining Multifractal Urban Planning with a Space Syntax Perspective


1
Department of Spatial Planning and Environment, University of Groningen, 9700AV Groningen, The Netherlands
2
Department of Civil Engineering, Western Norway University of Applied Sciences, 5020 Bergen, Norway
3
Department of Urbanism, TU Delft, 2628 BL Delft, The Netherlands
*
Author to whom correspondence should be addressed.
Urban Sci. 2017, 1(4), 37; https://doi.org/10.3390/urbansci1040037
Submission received: 25 October 2017
/
Revised: 20 November 2017
/
Accepted: 27 November 2017
/
Published: 1 December 2017
(This article belongs to the Special Issue Urban Modeling and Simulation)
Abstract
:The United Nations Paris agreement of 2015 highlighted the need for urban planning to prevent and contain urban sprawl so as to reduce trip lengths through an efficient distribution of agglomerations and a well-balanced urban pattern distribution, all while considering travel behavior and accessibility to green areas, services, and facilities on different temporal scales. For the Vienna-Bratislava metropolitan region, our integrated modeling approach uses a combination of multifractal spatial modeling along with a space syntax perspective. Multifractal strategies are intrinsically multiscalar and adhere to five planning principles: hierarchical (polycentric) urban development to manage urban sprawl; sustainable transit-oriented development; locally well-balanced urban pattern and functions distribution to enhance vital urban systems, local centers, and neighborhoods; penetration of green areas into built-up areas; and the preservation of large interconnected networks of green areas to conserve biodiversity. Adding space syntax modeling to a multifractal strategy integrates how space relates to functional patterns based on centrality, thus applying a socio-spatial perspective. In this paper, we used the following workflow for an integrated modeling approach: (1) Space syntax to identify the urban systems’ hierarchy and so determine a spatial strategy regionally; (2) Fractalopolis to create a multifractal development plan for potential urbanization; and (3) Space syntax to design a strategic urban master plan for locating new housing and facilities vis-à-vis socioeconomic factors.

1. Introduction
In many countries worldwide, urban planning is confronted with the challenge and consequences of urban sprawl. For decades now in Western Europe and North America, the phenomenon of urban sprawl has arisen due to a combination of more affordable housing in peri-urban areas and the desirability of residential areas close to green areas, which has also resulted in an increase in trip length to jobs and other facilities [1,2,3,4]. In Latin America, Africa, or Asia, urban sprawl is additionally caused by the pressure of population growth and informal settlements [5,6]. The phenomenon of urban sprawl partly follows a self-organizing, emergent, bottom-up logic, where decisions, made on a small scale, result in a scattered urban fabric and therefore a scattered urban system. Urban sprawl results in social costs such as social segregation and long travel distances to reach jobs for low-income inhabitants, in economic costs due to increasing gasoline prices, and in environmental costs due to an increase in energy use, which contributes to global warming and environmental pollution. Moreover, maintaining an efficient and well-functioning public transport system is costly and difficult in metropolitan areas with low-density urban sprawl.
In the search for ways to limit urban sprawl, Neuman [7] reflects that the classic response has been compact urban forms in order to improve urban livability. The discourse for sustainable urban forms is usually led by the compact city concept [8], which advocates high building density and short distances. The compact city form has been promoted throughout Europe [9], and in North America [7] to tackle problems of unsustainability. The advantages of compact urban development are short distances between various buildings that serve similar purposes. This, it is argued, creates a smaller ecological footprint [10]. Schwanen and colleagues [11] have shown in a study in the Netherlands that compact developments have a negative effect on the ecological footprint caused by the daily mobility patterns of individual motorized transport, which is linked to traffic congestion. This may encourage suburbanization of households to lower-density areas in the long term because of travel-time considerations. Usually, households in Western Europe optimize their residential choice with respect to accessibility to various types of amenities [11]. Contrary to this, many compact developments in North America and Western Europe are mostly residential and distant from a city or town. This necessitates daily travel for shopping, work, and entertainment. These kinds of residential compact developments then contribute to urban sprawl. In this, they resemble, in their disfunctionality, their planned unit development and residential subdivision predecessors, except that they are now compact [7]. Rådberg [10] brings to this debate that, in the compact city, there can be a lack of green spaces on different scales. Breheny [12] questions whether compact urban development in general can hinder decentralization and the implementation of green land reserves in an urban system. Green areas are key for recreation, leisure, and the urban microclimate. In short, the compact city does not fully correspond to its promoted small ecological footprint.
To limit urban sprawl, the New Urbanism debate suggests an urban form of a Decentralized Concentration [9,13] that provides proximity and accessibility to services and facilities, and that reduces commuting distance and commuting time [14,15]. Concentrated decentralization stimulates the use of public transport [11]. This is reminiscent of the Clustered Development Concept as suggested by Barton [16]. From the perspective of public transport, Transit-Oriented Development (TOD) creates spatial-functional clusters around public transport hubs to make trip lengths efficient for daily needs. Another approach is the Urban Network concept [17], which tailors efficient trip lengths according to different kinds of transport modes. From a market-driven perspective, Christaller’s Central Place Theory [18] implies different-sized centers, where services, goods, and supply are located. The concept of polycentrism, which implies that a metropolitan area consists of several different centers having a significant interconnection and complementarity [19], is also a factor. All these concepts have one thing in common, which is that they embrace an inherent hierarchical ordering principle with a clear center and subcenters.
Different reflections and academic research about how to contain and prevent urban sprawl have led to a modified Christallerian concept reminiscent of polycentrism, with an inherent hierarchical ordering principle [1,2,20]. This has subsequently led to the development of the multiscale, multifractal simulation model “Fractalopolis” [2,20,21] as a GIS-based software application. In line with considerations for a solution to containing urban sprawl and advocating sustainable development across scales, we thought it interesting to combine a multifractal-modeling approach with a space syntax approach.
Organization of the Paper and Method
In this paper, we show that this combination of models can be a powerful tool for decision-making support in designing strategic regional and urban development plans. This paper is organized as follows. First, we give an overview of the theoretical basis for a multifractal concept in planning, followed by a description and explanation of the multifractal simulation model Fractalopolis. We then explain its accessibility rules and population model. Next, we introduce space syntax, and how we combine Fractalopolis with space syntax. In addition, then we focus on the application example and apply the combined approach to the Vienna-Bratislava metropolitan region to develop real-world scenarios. Finally, through a discussion of sustainable and unsustainable fractal models, we critically reflect on the integrated modeling approach we have presented. This discussion leads to a new framework for a planning support system for sustainable development across scales.
2. From Theory to Application
Urbanization is a complex, partly self-organizing interaction between the built environment and activities in society. On the one hand, economic, social, and individual preferences influence how urbanization patterns evolve. On the other, the shape, form, and structure of the built environment influence the choices people make. It has been shown that the spatial organization of urban patterns is rather consistent with fractal ordering principles [22,23,24,25,26,27,28,29]. In natural systems, like bronchi or trees, fractality often refers to optimization. Alexander [30] and Salingaros [31] have published research contributing to the idea of fractals as linked to urban planning. This led us to consider how fractal logic could be made operational for urban planning [2] (see Figure 1). To illustrate this, the example we chose refers to a Sierpiński carpet, which was inspired by the theoretical reasoning found in Christaller’s Central Place Theory [18] and Calthorpe’s Transit-Oriented Development (TOD) [17]. Using the example of a Sierpiński carpet, the key idea is then that fractal measurements become norms for planning. Arlinghaus [32] had already provided evidence that there was a link between Christaller’s hierarchical spatial-administrative model and fractals. Christaller’s Central Place Theory has been criticized for its uniform distribution of hierarchical centers. Indeed, his model does not incorporate a topographical approach. Krugman [33] thinks of Christaller’s system as a description of self-organization.
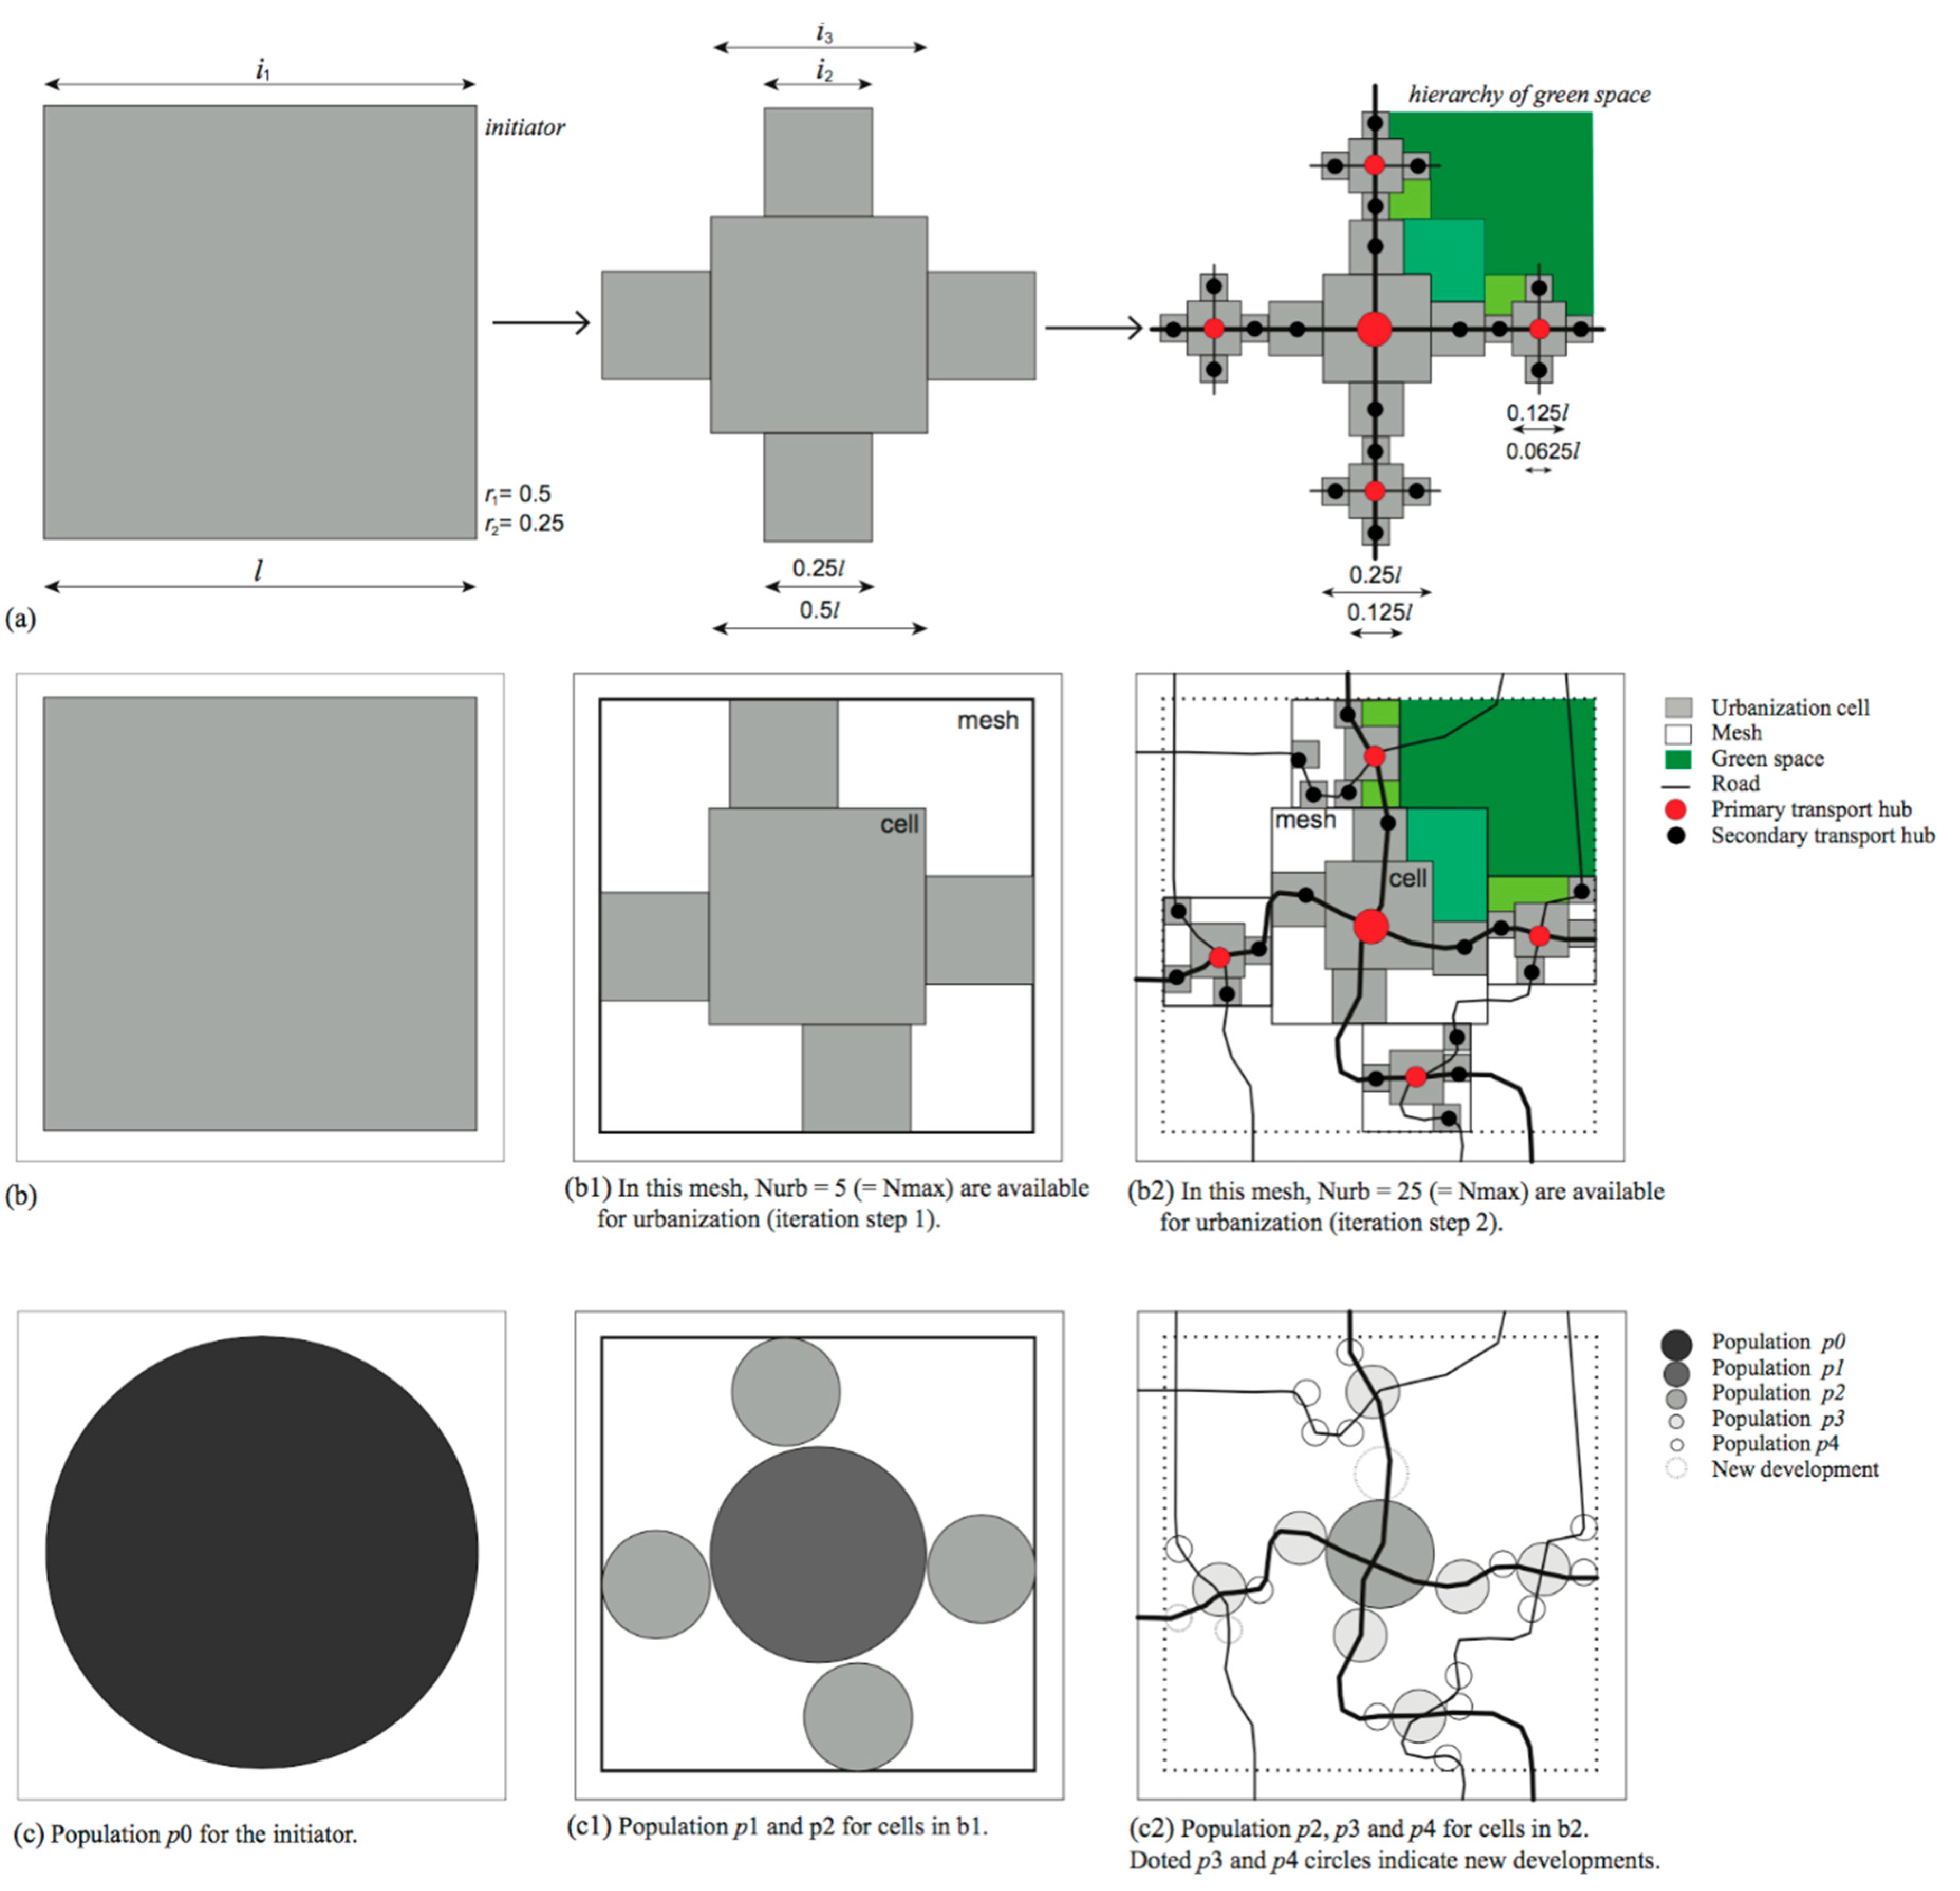
Using multifractal logic, we can introduce a hierarchy of settlements on a regional scale and centers and subcenters on an urban scale (Figure 1). This is reminiscent of Christaller’s idea of different-sized centers with a specific hierarchical centrality in terms of size, population density, transport, and distributed functions as an ordering principle. The advantage of using multifractal logic is that it makes the generation of a geometric figure consisting of elements of different sizes possible (Figure 1). In contrast, monofractal or unifractal-only logic permits geometric figures with elements of the same size to be generated. Thus, multifractal logic is closer to the logic of the built environment. Previous studies have shown that, using fractal logic on a regional scale, either a Fournier dust or a Sierpiński carpet is very useful. On an urban scale, however, a Sierpiński carpet [2] or, when a higher densification is intended, monofractal logic is advantageous [34] for developing urban planning scenarios.
Our example of a multifractal Sierpiński is reminiscent of decentralized centralization logic, similar to polycentrism with a hierarchical ordering principle. This multifractal center hierarchy is in line with Christallerian logic (Figure 1b). The nested logic is supportive of interconnected green lanes to support biodiversity and avoid the fragmentation of the open landscape (Figure 1b). Note that vital centers are decisively affected by population density and well-distributed functions (Figure 1c).
2.1. The Multifractal Planning Model Fractalopolis
Moving from theory to application, the multifractal model Fractalopolis was developed and made operational as a GIS-based software application [2,20,21]. The simulation model makes it possible to use multifractal logic to develop planning scenarios. It is made up of a spatial model (Figure 1) interlinked with a functional model with accessibility rules, including temporal settings for potential frequentation of shops and services, and leisure facilities, a population model, and, on a local scale, a lacunarity rule to preserve a view of the landscape.
The model not only makes the identification and evaluation of potential urbanization zones possible, but it also enables a strategic development design or master plan for regional and urban planning. With Fractalopolis, we can design strategies that address intensive or soft urban development along with urban transformation within the model’s cells, or we can set aside areas where no development is permitted. For the simulation, we predefine the number and sizes of cells generated recurrently for each iteration step by using an Iterative Function System (IFS). With the Iterative Function System, the fractal rule for urbanization is defined. Thus, different fractal dimensions D can be introduced for different iteration steps, linked either to regional or urban logic. For illustrative purposes, we will use the example of a Sierpiński carpet for the following application example.
Once the number of cells and corresponding sizes are defined, the determined generator is applied to each cell generated at the previous iteration step (0, 1, 2, …, n). The number of cells is determined by the reduction factors r1, r2, …, rn. Iteration reduces the size of cells, which corresponds to a multiscale modeling approach. For each iteration step, a more diverse spatial hierarchy emerges with an increasing number of smaller cells per iteration (Figure 1). Thus, throughout the design of the development plan across scales, potential transformation areas are stepwise more concentrated within the boundaries of the step-by-step increase in the numbers of smaller cells. Each set of cells is inherently linked to its predecessor cell, representing a nested logic. This allows for high spatial efficiency and makes it possible to manage urban sprawl across scales. Based on our example in Figure 1, the sizes of the cells can be calculated for each iteration step as follows:
The generated urban centers of the various hierarchical levels may have the same size, while belonging to a different hierarchical level. A binary coding system is attributed to the different-sized centers to distinguish the centers. For Table 1, the coding system has been used as applied in Figure 2.
In line with the real-world situation, and respecting expert knowledge of intentional urban development, the cells can be manually repositioned at each iteration step within the generated area boundary “mesh” (Figure 1). This “mesh” is defined by the cell iterated in the previous iteration step: For example, cells generated at iteration step 2 can be freely repositioned within the boundary area of a cell generated at iteration step 1 (Figure 1). Cells at iteration levels 1 or 2 may include non-developable areas. In the course of iteration, the cells become smaller in size (Table 1) and therefore can be positioned in such a way so as to avoid areas that are prohibited for development, for example, UNESCO world heritage areas.
To be concise, a functional model then serves to complete this morphological model. In this paper, we focus on the accessibility rules for shops, services, and leisure, as well as the population model. Fractalopolis also includes a “lacunarity” rule on a local scale (neighborhood), which was discussed by Yamu and Frankhauser [2].
2.1.1. Accessibility to Shops, Services, and Leisure Amenities
The accessibility rules represent the potential frequentation by inhabitants vis-à-vis different temporal scales. The shops and services are distinguished according to their type and temporal scale (Table 2). For the GIS-based software application, geo-referenced points with a code represent shops and services, including their potential frequentation (daily, weekly, monthly, rarely). For rarely and monthly temporal settings, the number and diversity of shops and services are important. This has been discussed in depth by Yamu and Frankhauser [2].
In addition, for weekly potential frequentation, we introduce the use of clusters [35,36]. The attractiveness of a cluster is evaluated by the number and diversity of different types of shops and services. The higher the diversity of shops and services, the better the evaluation of accessibility to them. The user of the software application sets up a geo-referenced database, where types of amenities, including their potential frequentation and distance, are defined.
On the basis of the accessibility evaluation, multiple clusters can be present. For evaluation purposes, one highly accessible cluster scores more highly than two moderately accessible ones, two equally accessible clusters are deemed better than just one, and a single very highly accessible cluster is more beneficial than a very accessible cluster plus one that is not very accessible. Formally, the rule is defined as follows:
- a set of cells: i = (1, 2, f, k);
- a set of clusters of shops and services in cluster j is nj;
- the diversity of the businesses (number of different types of businesses) in cluster j is δj;
- the distance (measured over the network) between cell i and cluster j is dij;
- accessibility from cell i to cluster j is Aij.
The operator μw evaluates the accessibility of the cell i to the set of service clusters visited weekly.
Calculating Aij and involves applying Zimmermann’s aggregation operator [36]. For the definition of the functions , and see Tannier and colleagues [35].
Aggregation Rules: For synthetic evaluations of suitability for each potential urbanization cell, two sets of aggregation rules have been defined [1,2]. As seen below, the equation for a synthetic accessibility A can be flexibly weighted for any spatial system and temporal scale, for example, daily, weekly, monthly, or rarely. Our example shows an accessibility evaluation for a potential daily frequentation of amenities.
- synthetic evaluation Ac,d of accessibility for a potential daily frequentation for a city;
- daily shopping and services is sd;
- leisure for daily frequentation is ld;
- morphological rule is m.
For our application example, the following weights have been introduced:
The next rule set combines all potential accessibility frequentations (Ac,d = daily, Ac,w = weekly, Ac,m = monthly, Ac,r = rarely) for a city. Of course, this rule set is applicable for diverse functional levels represented as urban centers, for example, cities, towns, villages, and hamlets. For our application example for a synthetic accessibility of a city Ac, this yields:
Again, the weights are flexible for a best fit for any spatial system under scrutiny. Weights represent the relative importance of each type of facility for the inhabitants, according to the functional level of the urban center under consideration. Weights have to be chosen to reinforce, to a greater or lesser degree, the functional hierarchy of the spatial system modeled [1]. In our example, the weights for a city have been equally chosen in Equation (7), for example, daily and weekly shopping is equally as important as the opera for the inhabitants of Vienna.
2.1.2. Population
For spatial development, density is an important criterion that influences the location of shops and services, therefore playing a role in the decision-making process involved in choice of location. Thus, the previously discussed frequentation and accessibility rule set is completed by a population model that uses the iterative logic of the spatial multifractal model and distributes a given or intended population across the different cells, while taking into account the nested logic of the generator (see Figure 1). The population model is weighted accordingly to the chosen reduction factors (here, r1 and r2) and the Iterated Function System settings (Figure 3). This in turn explains how the population model is inherently linked to the multifractal spatial model and its iteration logic. With each iteration step, the number of cells increases, while the overall cell surface coverage decreases. The sum of the population of all cells decreases for each of the following iteration steps, because a ratio of the population is allocated in the “cut-off” areas from the previous iteration step (“lacunae” areas, see Figure 1). The underlying logic is to develop scenarios with an efficient population distribution in line with amenities and leisure across scales. Let us assume that, in the first step, the ratio of the initial population p is applied to the whole development area. Using our Sierpiński logic from Figure 1a, this population is now dispatched between the main cell (a1) and subordinated cells (4a2) representing one city and four towns. The link between the multifractal logic and the population model is for the reduction factor r1 a population of and for r2 a population of . Consequently, for the first iteration step, the urban population for potential development areas p(1)urb reads:
where
By strictly applying multifractal logic for the urban population, we would obtain in the second iteration step for :
However, for a real-world application, this seems rather rigid. The commutability properties of multifractals allow potential cells for development with different spatial hierarchical ranking—where one cell represents a town and another cell a village, for example—to have the same population number calculated in the model. In order to avoid this effect, the model lets us weaken the strict iterative population distribution rule by manually changing the distribution factors. This makes it possible to adjust the population model to any spatial system for each iteration step.
2.1.3. GIS-Based Software Application
The Fractalopolis model, it should be remembered, serves to identify potential development areas by evaluating accessibility to facilities and leisure across scales. This provides information about the “attractiveness” and “efficiency” of an area on a regional, urban, and neighborhood level so as to design strategic development plans. In order to avoid excessive land consumption, it seems desirable to take into account the existing road network when developing scenarios, and therefore ensuring from the very beginning good accessibility to various services, shopping facilities, and leisure areas in relation to the intended population. Each cell of the multifractal simulation model contains information about streets, facilities, and land use. In the course of designing strategic development plans, flexible weights for accessibility evaluation of functions and green areas allows us to adjust the model to the real-world situation or in relation to intentions for future development strategies.
In light of the bottom-up versus top-down debate in urban planning, this model uses its iteration logic, at first, not only top-down, following a “hierarchical decomposition” logic according to the logic of iteration of fractals, but also then allows for a bottom-up readjustment of each cell for each iteration step through a recalculation of the subordinated iteration steps. To illustrate this, we provide the example of a development plan that has been designed using 8 iteration steps: A manual readjustment of simulation cells in line with potential development areas was made at all iteration steps.
Fractalopolis supports the development of planning strategies for urban growth and infill development. For scenario development, new amenities, roads, and green areas can be added to different GIS layers in the computer application. Thus, an evaluation comparison between an existing situation and the suggested development plan is possible. Furthermore, the model can be used to identify potential shrinkage. At this point, it is mostly spatial structures and amenities with the lowest evaluation values that will undergo either revitalization or renaturation.
3. Towards an Integrated Modeling Approach: Combining Fractalopolis with a Space Syntax Perspective
Space syntax [37,38] adds a configurational description of urban structure to the Fractalopolis model. This method makes it possible to calculate configurational spatial relationships in built environments and to link these to social activity patterns of utilization. Space syntax utilizes graph theory to describe and quantify how easily accessible and navigable any space is. It allows us to develop an understanding of how urban space networks relate to the social, economic, and cognitive factors that shape them, and how they are affected by them [39,40]. Space syntax, as a geometric accessibility analysis to measure spatial changes based on the theory of urban morphology, has been widely applied since the 1980s.
Space syntax works with two concepts of centrality: “integration” (to-movement) and “choice” (through-movement). Integration measures the topological distance from each street segment to all others within a certain radius. In other words, how many turns need to be made from one street segment to reach all other street segments? The integration measurement is thus able to predict the use of a street. The easier its accessibility, the more integrated and thus the more popular a street is for citizens. Choice measures the frequency of how likely it would be for a street segment to be part of a particular path between all possible pairs of starting points and endpoints within a certain radius. Choice captures how often, on average, a location may be used in trips from all places to all others in the city [41]. This has an influence on land use, location choices, and mode of transportation [42].
Space syntax can measure those spatial features of cities that deliver a street network, which is then either sustainable or not. The spatial layout of the street network influences building density and the degree of function mixture: the higher the spatial centrality at various scale levels, the higher the building density and the degree of function mixture. Centrality, especially on a local scale, is linked to the number of people who use sustainable transportation modes, such as walking, bicycling, and public transport [43,44]. Likewise, the higher the spatial integration at all scale levels, the higher the building density. The spatial structure of the road network matters when it comes to indicating whether and to what extent each planning and design proposal generates the use of sustainable transportation modes. Space syntax can be used to design strategic development plans by testing socioeconomic effects on various street alternatives and to indicate to what extent each proposal generates a sustainable means of transportation or not. In short, in spite of some unresolved methodological problems [22,45,46], space syntax, as a static model that indicates dynamics, has gained a considerable amount of scholarly recognition over the years, backed up by empirical evidence [47].
For our sample application, we use the potential through-movement measurement choice to couple information from both models, Fractalopolis and space syntax. Briefly, space syntax’s choice is a dynamic measurement that indicates the movement flow through the built environment by means of accessibility [48]. Fractalopolis indicators of accessibility make it possible to evaluate the potential frequentation of facilities and leisure for different temporal scales. Both intrinsically refer to the dynamics of a spatial system. For the sample application “Vienna-Bratislava Metropolitan Region”, space syntax is used in two ways. It is used (1) on a regional scale to identify the region’s spatial hierarchy. It can do this because space syntax’s underlying logic is the concept of centrality, represented by accessibility measurements: the higher the amount of highly accessible (“central”) streets in an urban system, the higher its overall centrality and therefore its hierarchical rank in the region. It also indicates the degree and number of various functions in an urban system. This is reminiscent of Christaller’s Central Place Theory. In addition, it is used (2) on a local scale to develop and evaluate scenarios for sustainable means of transportation, and to identify optimization strategies for the street network and location of functions. Thinking along the lines of the idea of locations, a link to location theory [18,49,50] can easily be made, because the level of ease of accessibility is made evident if the functions are well located.
4. Sample Application and Results: Vienna-Bratislava Metropolitan Region
For this research, we chose the Vienna-Bratislava metropolitan region. Both capitals, Vienna and Bratislava, are located along the Danube River at a distance of approximately 60 km from each other. The rationale for choosing this cross-border study is based on the two capitals’ spatial proximity, and the region’s fragmented and irregular spatial pattern. The fragmented pattern was triggered due to the artificial separation of both the Vienna and Bratislava regions by the former Iron Curtain. Current planning efforts are geared to re-establishing one homogeneous spatial and economic cohesion region in the limelight of “Central Europe”.
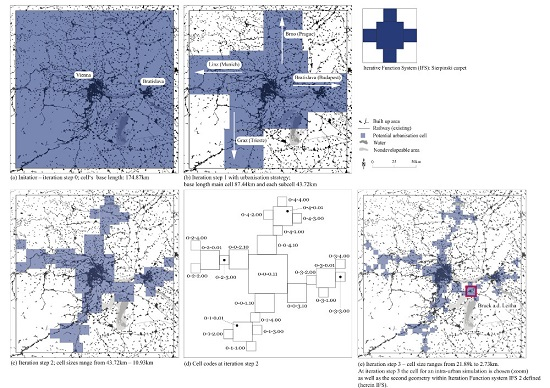
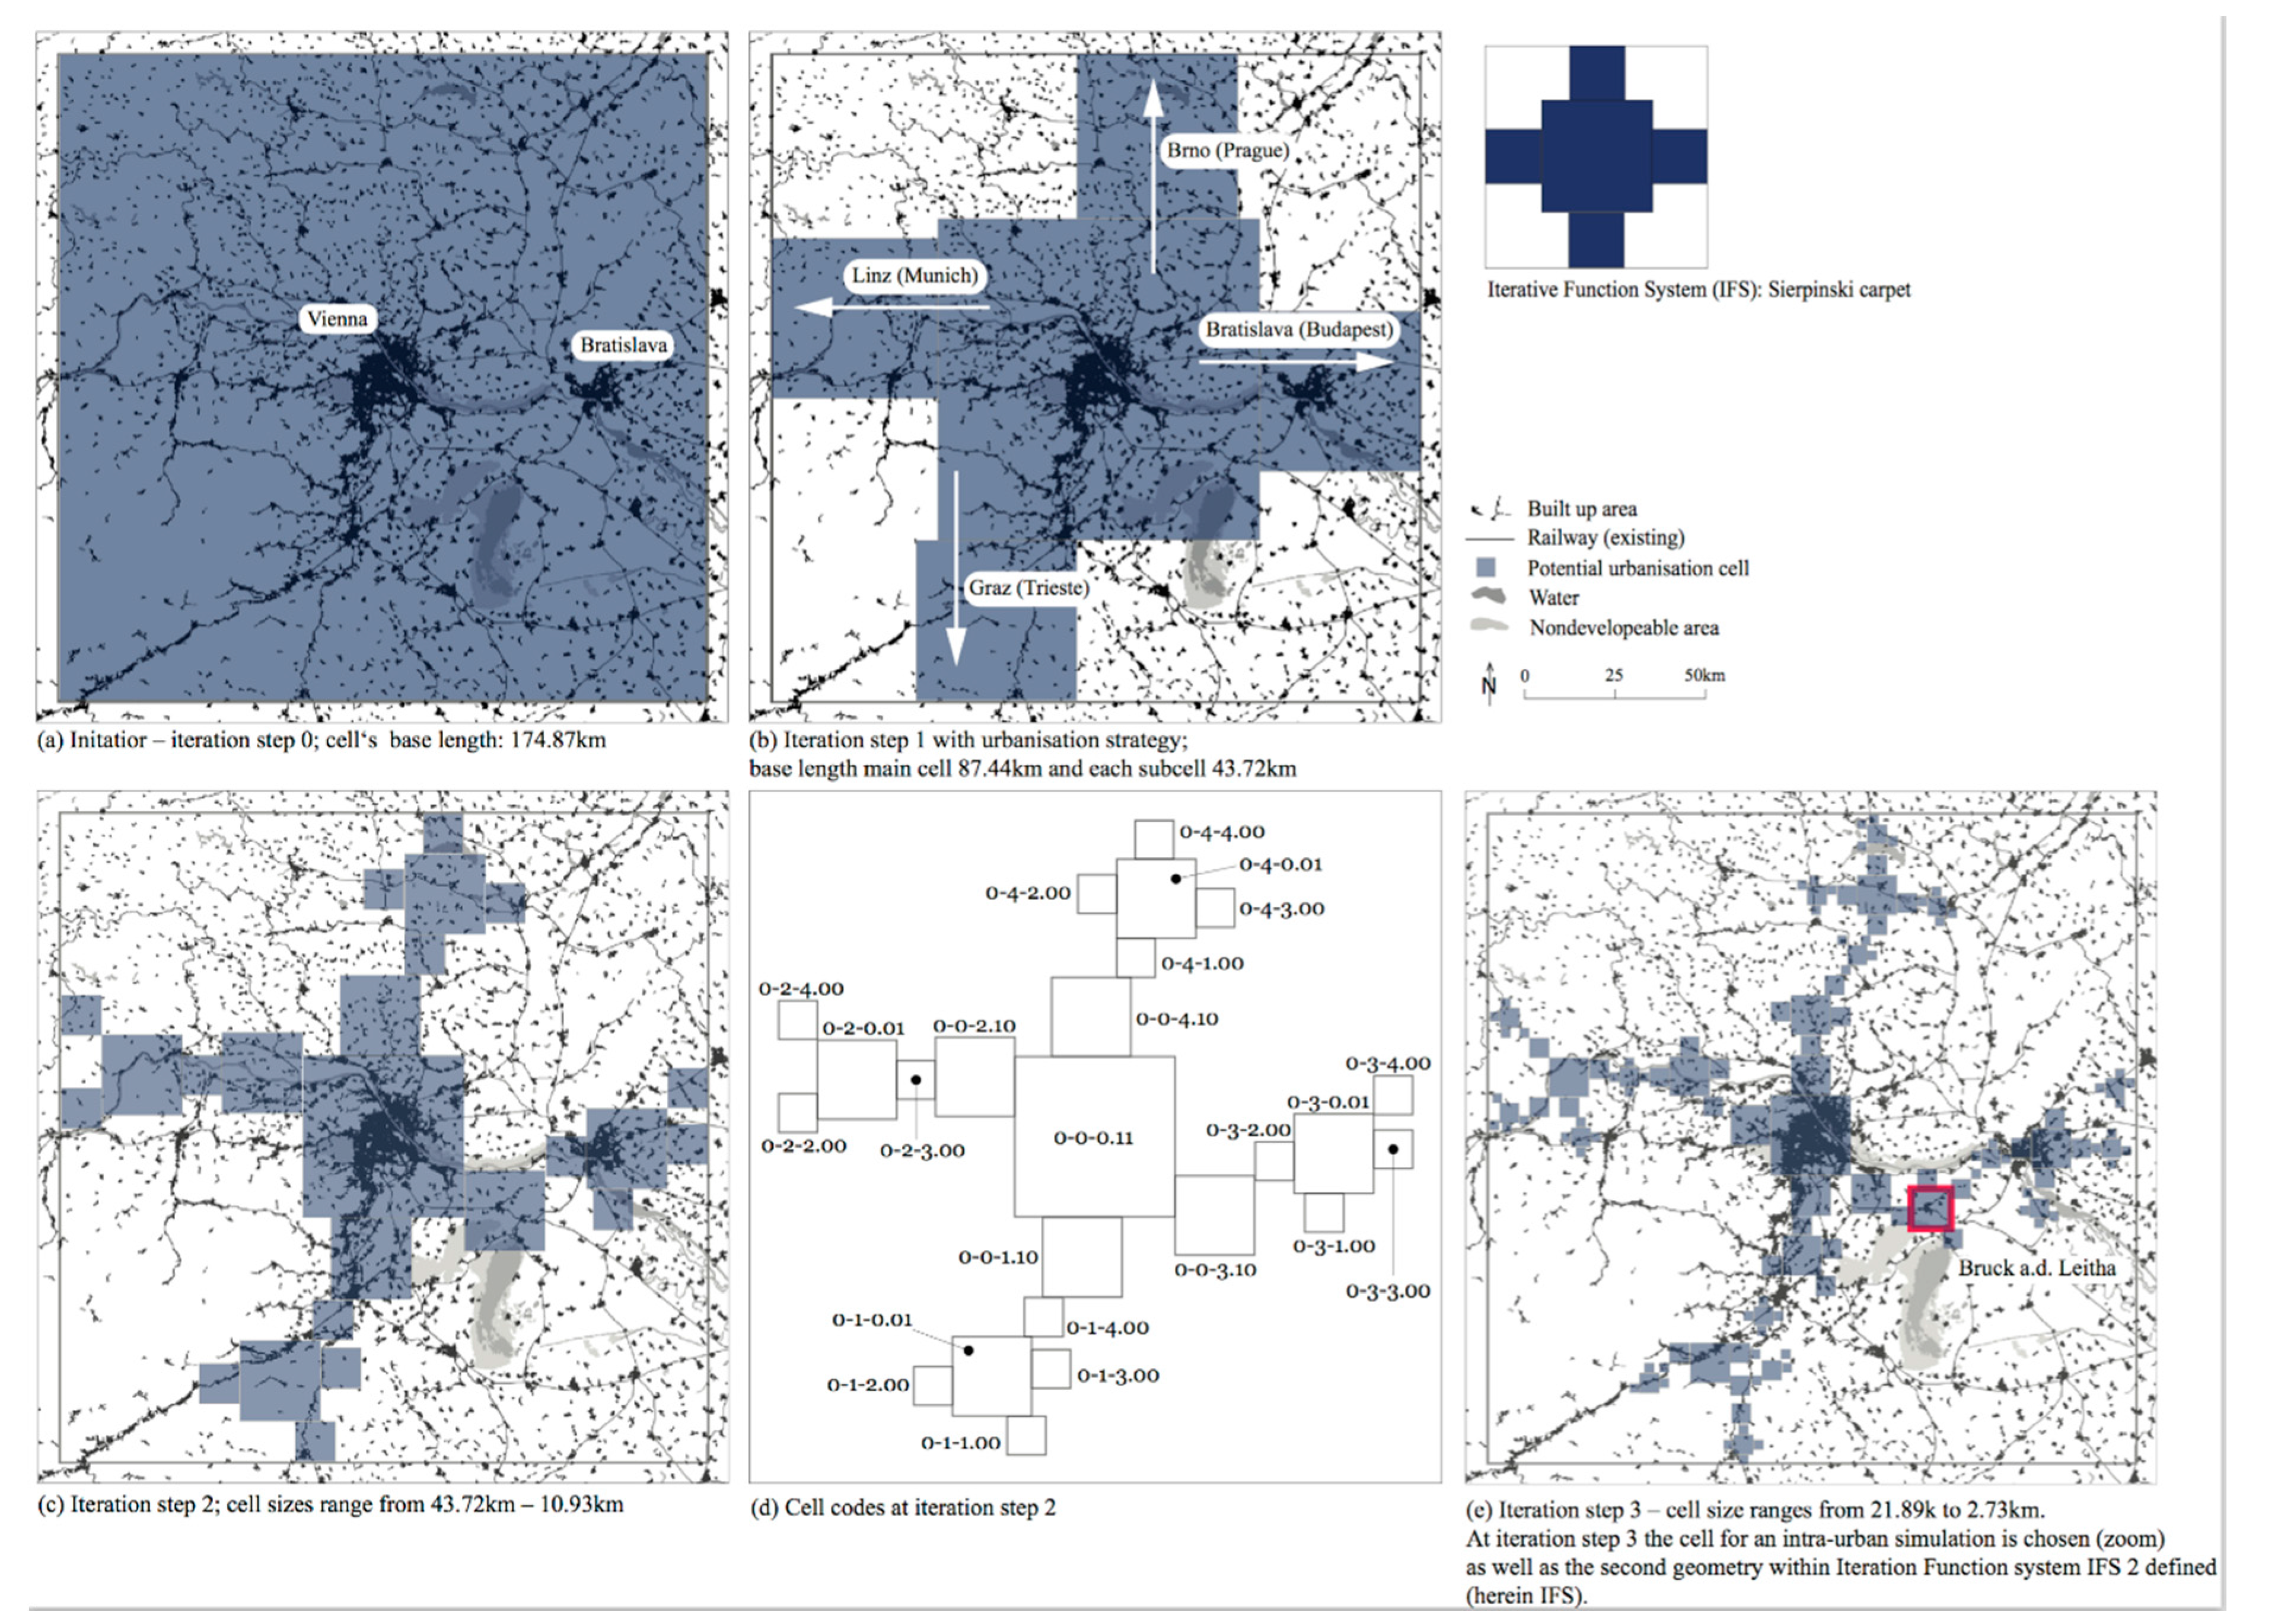
The region lacks a well-balanced agglomeration hierarchy, and urban sprawl exists along “Vienna’s tail,” south of the city. Thus, designing a regional cross-border strategic development plan with a local scenario would be a test for knitting together both formerly separated regions. Our aim was to discover whether an integrated modeling approach, combining both models, would add value to the design of sustainable strategic development plans, in view of optimized spatial pattern and functions distribution, along with a means of sustainable transportation. To illustrate our methodological approach, we therefore designed, tested, and evaluated a scenario supporting the design of a development plan across scales. For our sample application, we chose as a fractal reference model a multifractal Sierpiński carpet with a fractal dimension D of 1.36, as illustrated in Figure 1. We would like to point out that there are a variety of reference models with different fractal dimensions D possible for developing scenarios, as previously discussed by Yamu and Frankhauser [2]. The reference model used here supports an axis-based development incorporating the logic of an agglomeration hierarchy on a regional scale, for example, by identifying development potentials along existing rail and historic trading routes. This is reminiscent of the idea of a Transit-Oriented Development (TOD) and the Copenhagen Fingerplan.
For our application example, a study area was chosen that has a size of 30,625 km2. For the multifractal planning model Fractalopolis, we assembled a GIS database with 22,839 entry points for amenities, and 67,368 entry points for leisure and green space. In addition to the basic database that included information about morphology, street network, water, forests, parks, agricultural land, and restricted zones for development (e.g., UNESCO world heritage), public transportation and population was added. For the space syntax model, we used a hybrid model comprised of open-source data for the road network on the regional scale and a manually implemented axial map on the local scale. In general, in gathering the information, several data sources were combined, manually edited, and finalized.
First, in order to design the strategic development plan, we analyzed the regional road network using the space syntax method. We applied the measurements of normalized choice high metrics (“NACH high metrics”) and normalized choice low metrics (“NACH low metrics”). Both analyses provided us with information about the region’s spatial hierarchy and a potential development strategy (Figure 4). NACH high metrics (Figure 4a) depicts the region’s main routes for individual motorized transportation and the regional route hierarchy, which are both continuous and fragmented in our study area. Based on this information, and taking into consideration existing railway routes, we decided on an axis-oriented scenario strategy along major historic and contemporary routes in order to design the development plan. This was determined by the fractal reference model “Sierpiński carpet” as illustrated in Figure 1, which enabled us to design an axis-oriented scenario as described above. The development strategy chosen strengthens the major spatial axis to Prague, Munich, Trieste, and Budapest (Figure 5). This is reminiscent of the Finger Plan for Copenhagen’s metropolitan areas, which has, as its backbone, Transit-Oriented Development (TOD). The chosen strategy spatially, socially, and economically strengthens and revitalizes these areas to create a future sustainable region. In addition, NACH low metrics (Figure 4b) highlights various sizes of urban centers in the region. This information about urban centrality, coupled with the analytical results from NACH high metrics (Figure 4a), provided us with information about which town or village in the region was predestined for urban development so as to create a “stepping stone” between the two anchor cities Vienna and Bratislava. The intention was to revitalize towns and villages on a local scale, trigger the establishment of an agglomeration hierarchy on a regional scale, and manage urban sprawl generally through an efficient spatial pattern and functions distribution, along with sustainable means of transportation.
In Figure 4a, the road network colored in red depicts areas where the roads are located in-between or that go through various neighborhoods of different-sized urban systems. The vital walking- and cycling-friendly local centers and neighborhoods are colored in red in Figure 4b. Comparing NACH high metrics and NACH low metrics analyses (Figure 4a,b), a sustainable neighborhood or village exists when the main routes go through or transect the village or neighborhood. Such an urban area generates a sustainable means of transportation. When placing a metro, tram, or railway station in these kinds of areas, the access for users is high. When the main routes transit, or orbit, or go around villages or neighborhoods, this generates private car dependency. The used space syntax radii are in line with a scaling principle. The distance parameters (2 km, region-wide) are in accordance with different iteration steps and therefore with the scales of the nested spatial system of the fractal planning model.
Second, using a fractal planning method, we designed the strategic development plan (Figure 5) and evaluated each cell’s accessibility using the aggregation rules with its temporal scales (Section 2.1.1). Furthermore, we compared the existing population with the calculated model population per cell (Table 3). When designing the strategic development plan, the model was used in a normative way. The aggregated evaluation in our sample application ranged between the normalized values 0.37 and 0.75. In addition, we took the regional and local topography and non-developable areas into consideration.
It is important to remember that, here, multifractal planning strategy adheres to the following planning principles [1,2]: hierarchical (polycentric) urban development to manage urban sprawl; transit-oriented development to incorporate sustainable means of transportation; locally well-balanced pattern and function distribution to enhance vital urban systems, local centers, and neighborhoods; penetration of green areas into built-up areas across several nested scales for leisure and microclimate; and the preservation of large interconnected networks of natural and green areas to conserve biodiversity.
Hierarchical polycentric development is inherently interwoven with different population densities for different-sized urban systems. This, in turn, is linked with an overall population for each urban system. In our sample application, the population model translates a predefined hierarchical pattern distribution into population numbers for each iteration step. When comparing existing and model populations for each cell, we can observe that the region’s hierarchy is shallow with two peaks, Vienna and Bratislava. It is interesting that cell 0-0-1.10 covering old historic towns and partly sprawling areas has a higher existing population number than the model proposes.
In the third step, we chose the town Bruck an der Leitha for iteration step 3 (Figure 5d) for our sample local application. This town fits in well with the idea of creating a stepping stone between Vienna and Bratislava, because it is strategically located in the region. For Bruck an der Leitha, the space syntax analysis depicts a high-ranked road orbiting the town (Figure 4a) and a walkable, bikeable central core (Figure 4b). Furthermore, a railway station exists with a well-established train connection to Vienna and Bratislava.
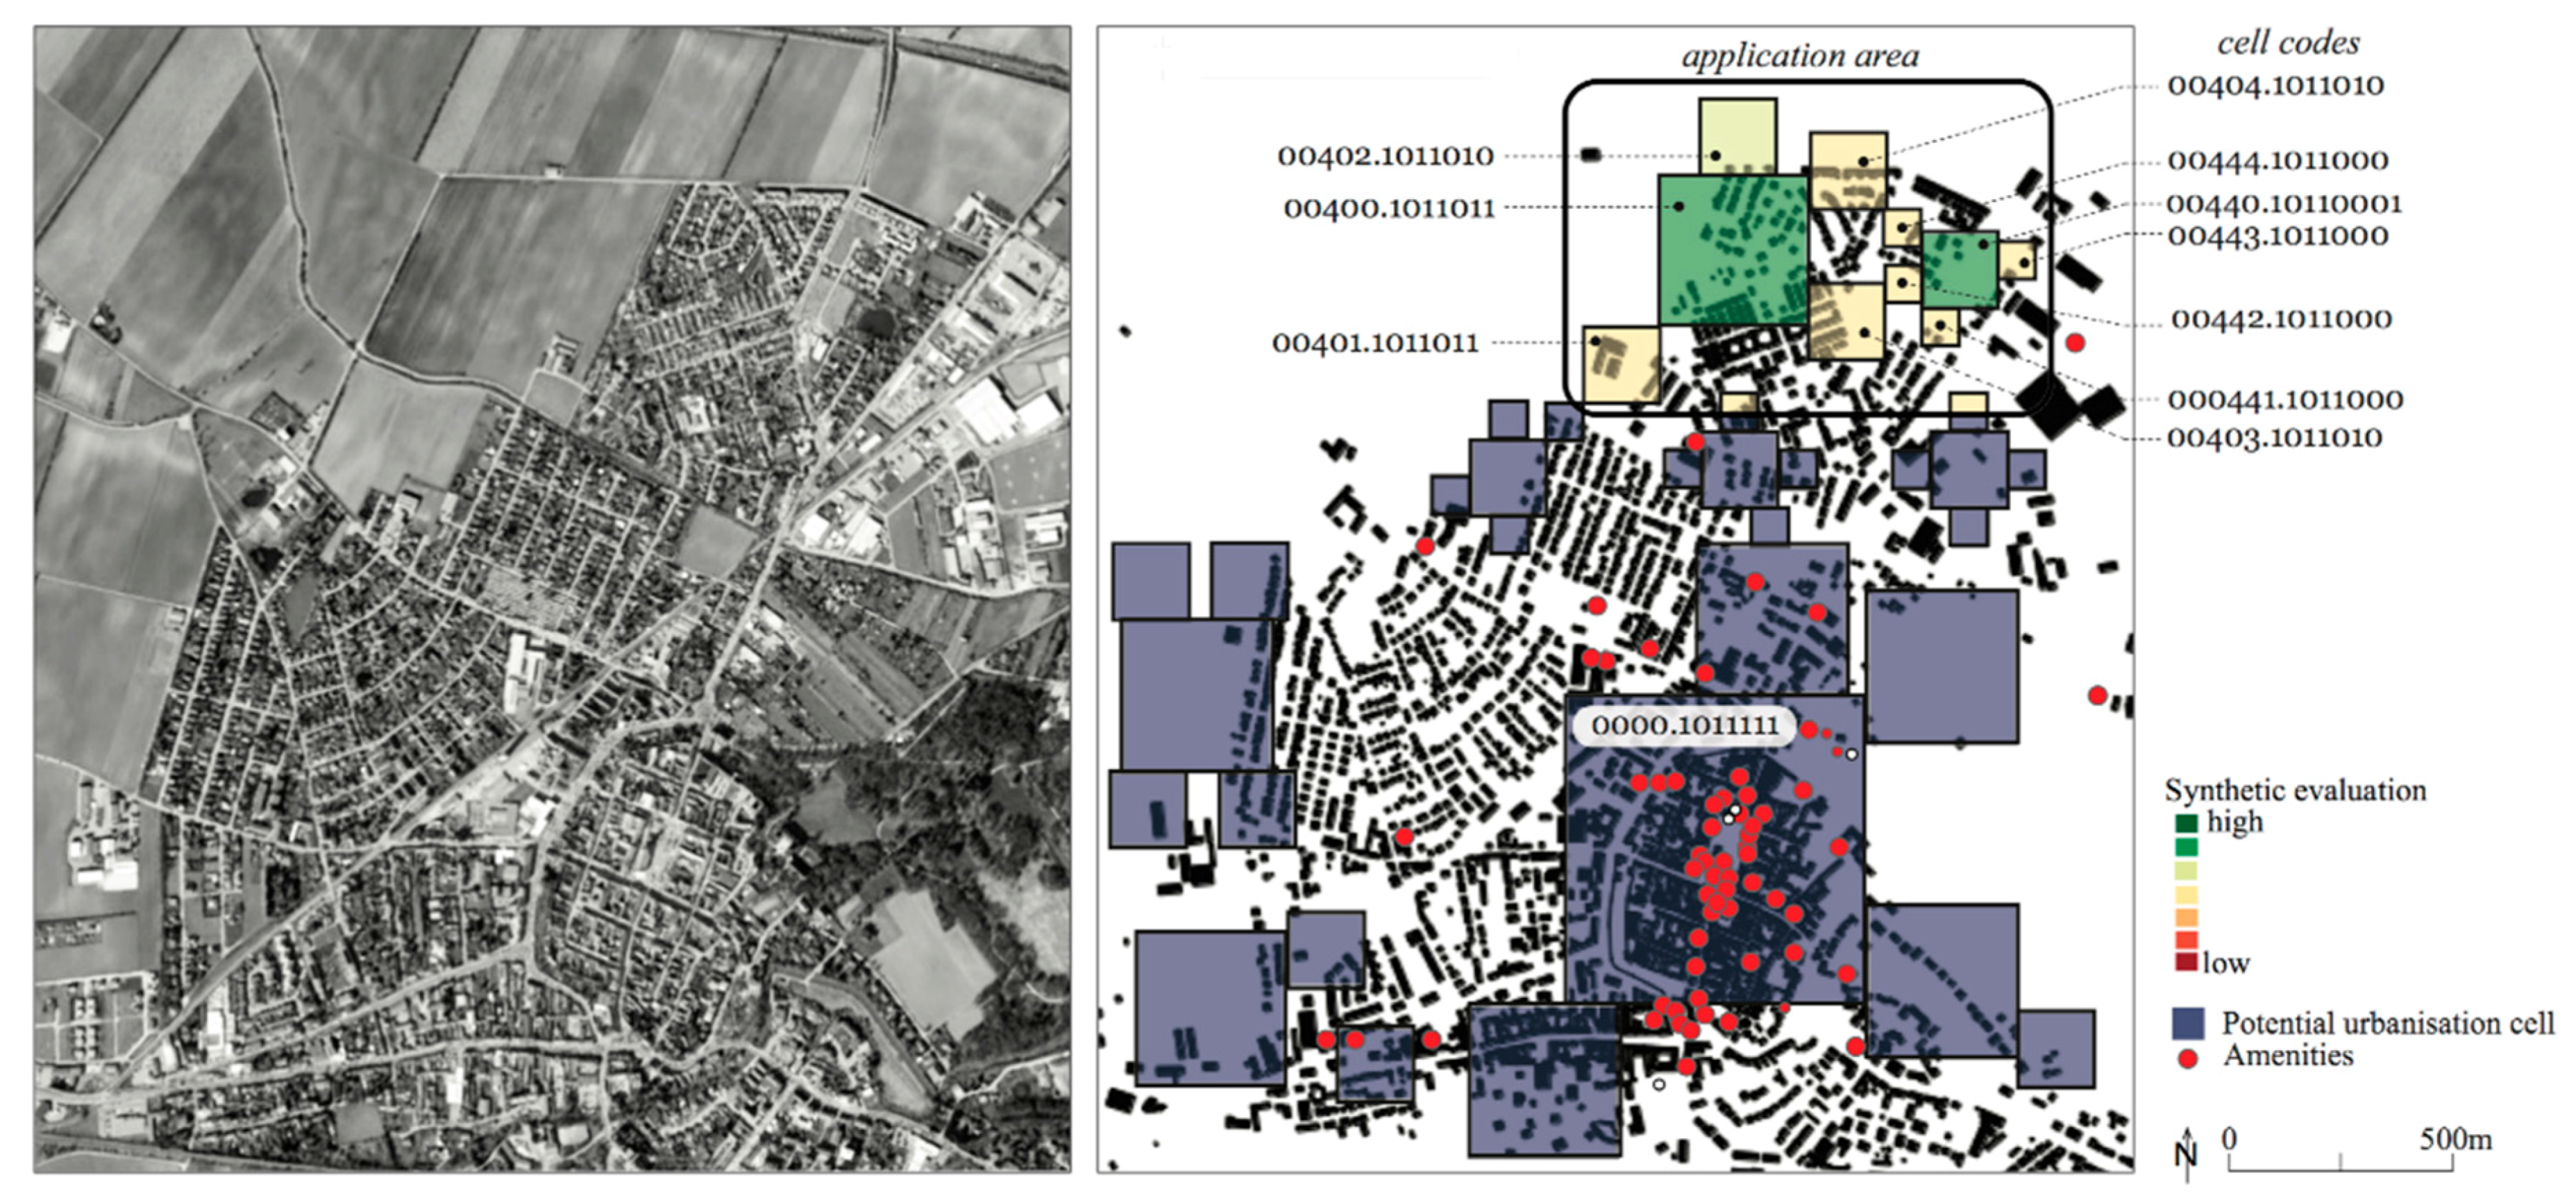
As a test area for our local sample application, we chose a neighborhood north of the historic core at the urban fringe. This neighborhood entails good accessibility to weekly, and low accessibility to daily functions, evaluated using the street network. The synthetic evaluation of suitability ranges from good to intermediate (Figure 6, Table 4). To adjust the multifractal model to the locally existing real-world situation of Bruck an der Leitha, the model underwent a distance d calibration for daily functions: 0–600 m for µ(d) = 1 and 600–1200 m for µ(d) = 1–0. In general, neighborhoods increase their attractiveness when daily amenities are present. In order to attract daily and weekly functions, a certain population density is crucial. Causality-wise, a neighborhood has the potential for active land use (shops) and inhabitants if the neighborhood’s street network is town-wide and locally highly accessible with good connections. This will also support a sustainable means of transportation, such as walking and cycling.
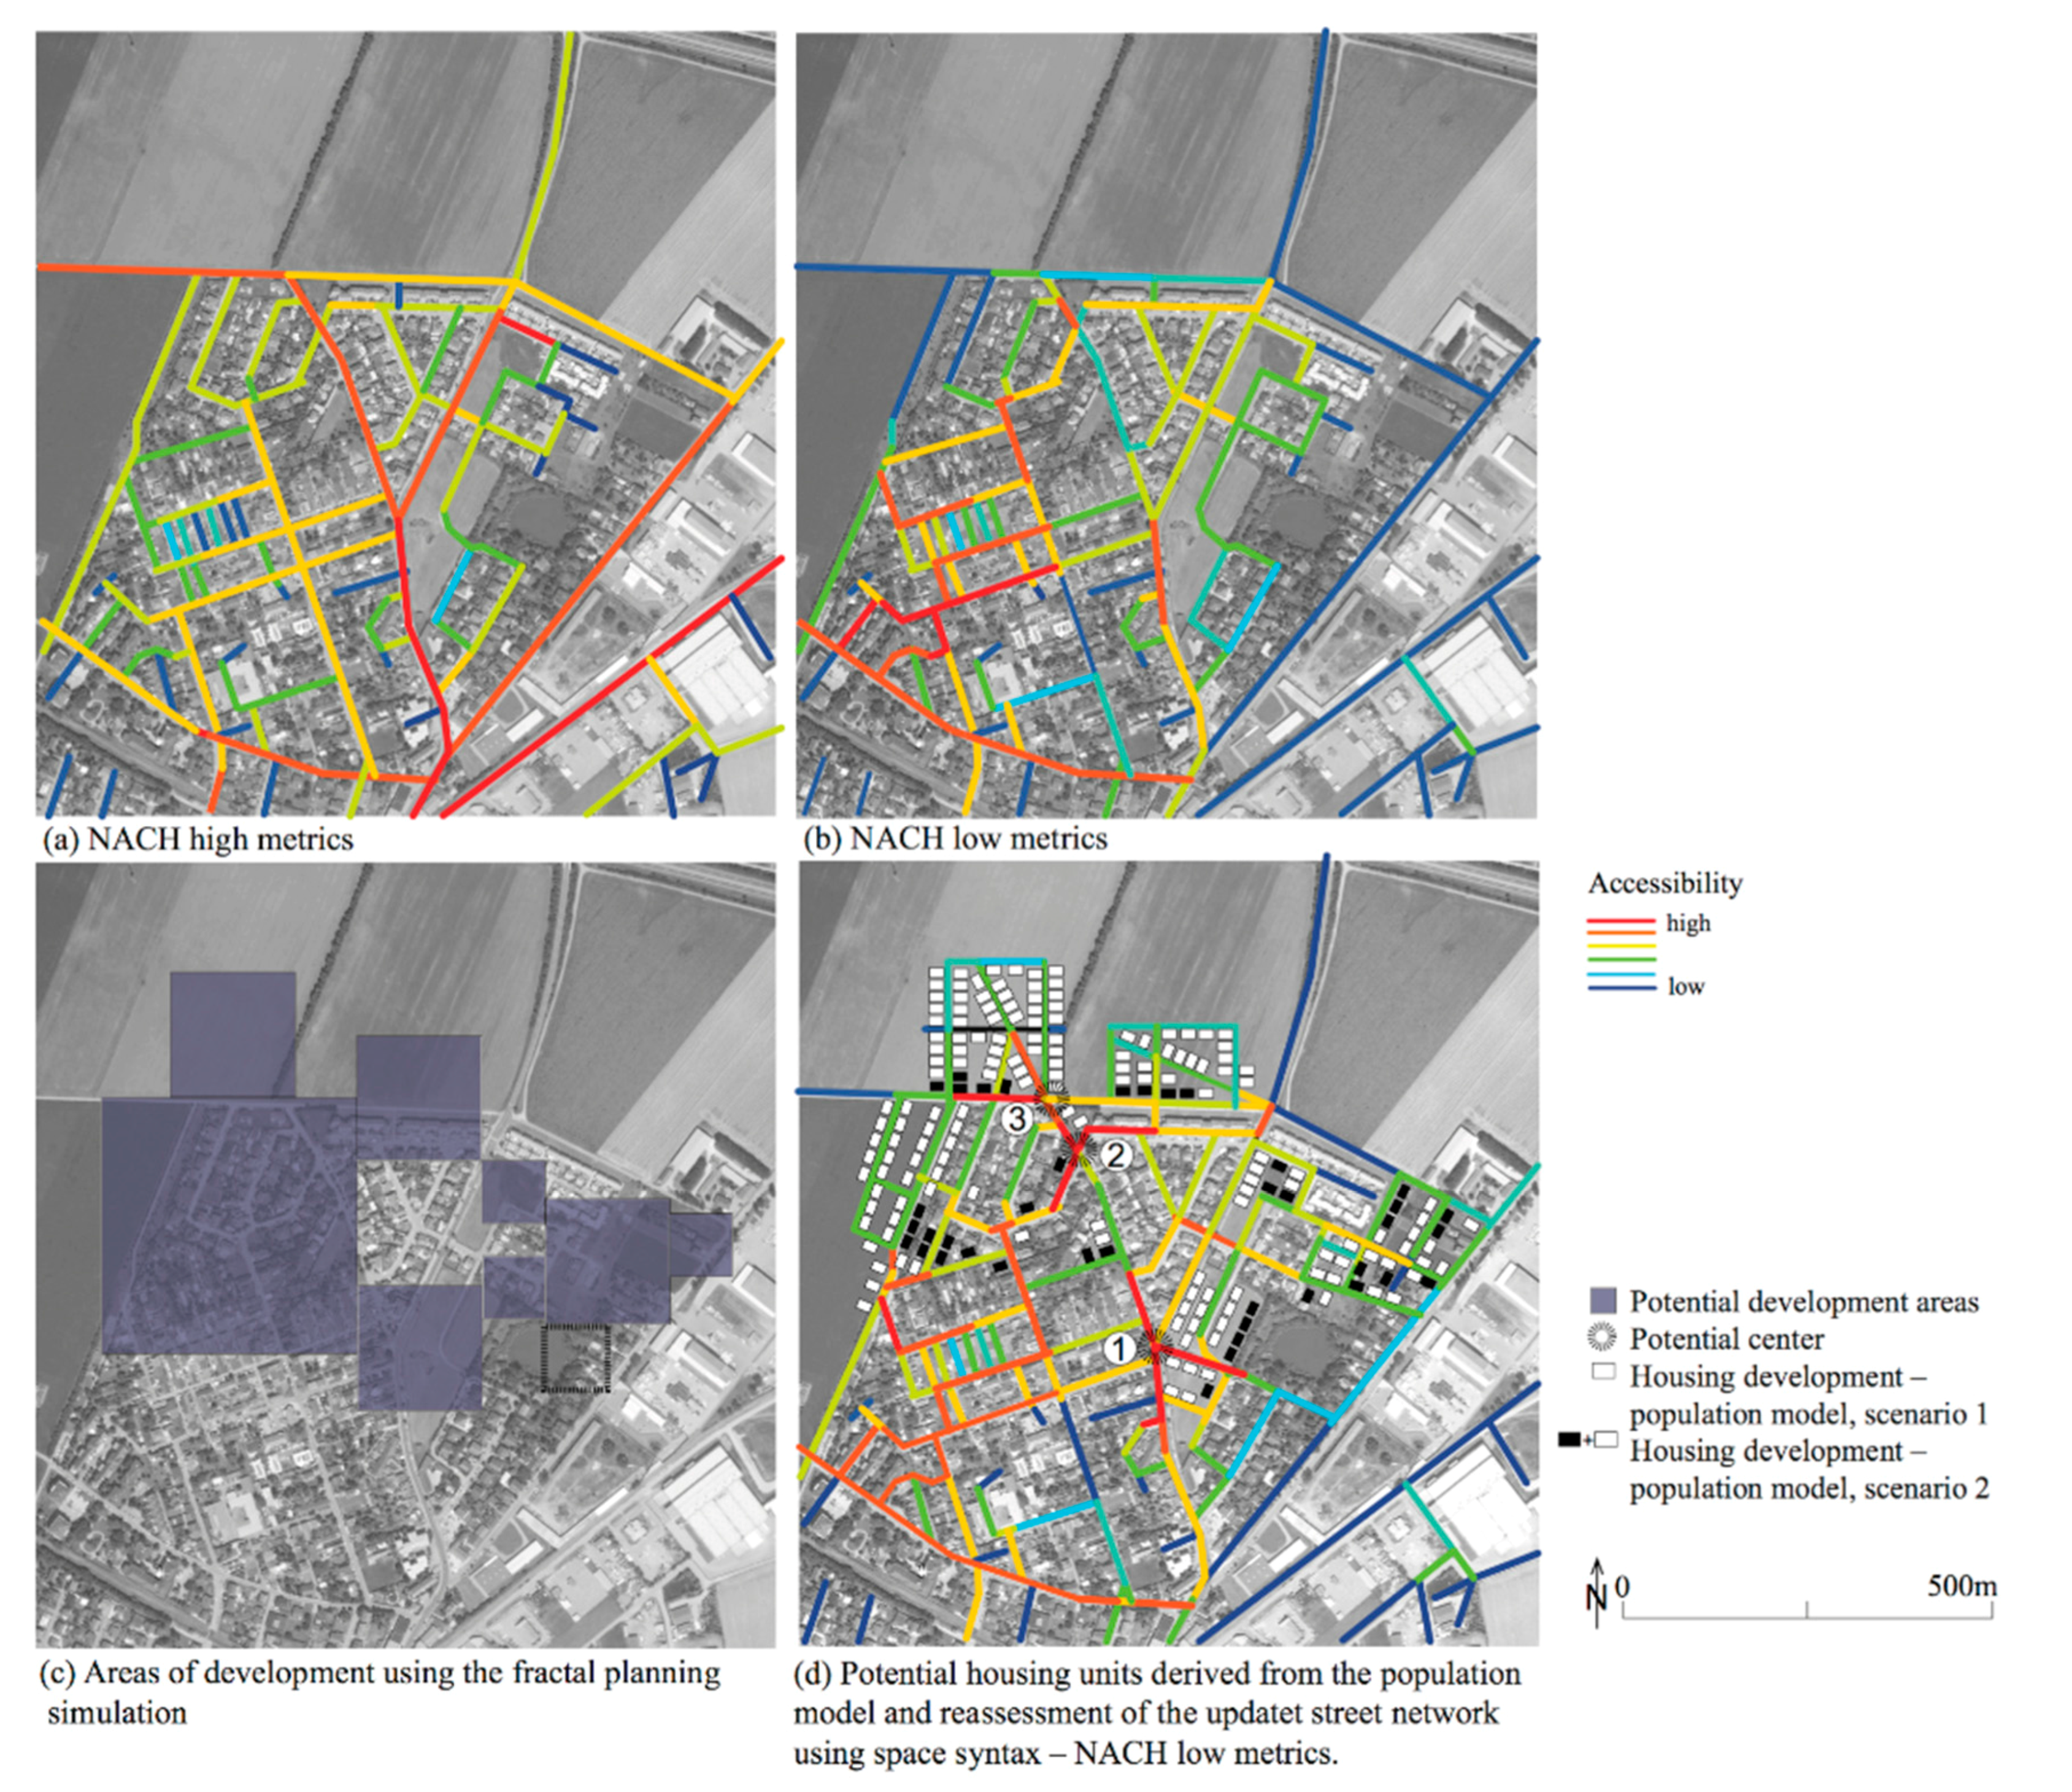
For the neighborhood under scrutiny, the space syntax NACH high metrics analysis for the existing situation shows that the neighborhood is highly accessible. Important town-wide through-roads (street segments in red, Figure 7a) provide good connections for this neighborhood to other neighborhoods, towns, and villages within close proximity. The NACH low metrics analysis representing the potential for pedestrian movement highlights a scattered street network with low accessibility in the neighborhood core (Figure 7b). In the next step, we imposed the multifractal planning strategy on the test area (Figure 7b). We translated the model’s population numbers per cell into housing units per cell taking into consideration existing local housing typologies, making a total of 131 buildings (Population Scenario 1, Figure 7d). Due to the problem of population data availability and aggregation we identified, a “user population” was integrated into the model allowing us to manually define a certain starting population for the iterative procedure on an urban scale. This “user population” was, for instance, able to reflect predicted migration flows. We simulated a combined scenario of urban growth and infill development. Two options were carried out, Scenario 1 with 131 housing units and Scenario 2 with 170 housing units (Figure 7d). To make the newly introduced housing units easily accessible, we introduced 34 new street segments and analyzed the updated street network using the NACH low metrics measurement. Figure 7d shows a street network that is more accessible for pedestrians compared to the existing street network (Figure 7b), along with the generation of potentially 3 locations that could develop into a new local center. Location 1 has the highest, location 3 the second highest, and location 2 the third highest accessibility values (Table 5, Figure 7d). These locations are suitable for active land use, because they collect town-wide and local movement. This can be identified when juxtaposing NACH high metrics and NACH low metrics analyses (Figure 7a,b).
The more dense, fine-grained, spatially integrated, and well-connected the street and road network is, on various scale levels, the shorter the walking distances between urban functions; the higher the density of the built mass, the easier it is to maintain a public transportation network, and the less it contributes to urban sprawl into the country side. Hence, a sustainable neighborhood is dependent on the spatial structure of the road and street network, which is the socio-spatial armature of the built environment.
5. Results
We can summarize that the use of multifractal planning logic combined with space syntax contributes to the subsequent initial understanding of the spatial layout in terms of describing whether and how metropolitan areas might be developed in a sustainable manner. The evaluation shows that Fractalopolis works at a regional scale as a normative model supporting the identification and constraints on and opportunities for designing a strategic development plan. At an urban scale the model works more as an interactive decision support model in real time for identifying in greater detail potential cells for urbanization. Combining Fractalopolis with space syntax can be a powerful tool for designing strategic development plans. For our research, we used space syntax in two ways: one, to obtain information about the region’s spatial hierarchy and the potential development strategy on a regional scale and, two, on a local scale, to refine the Fractalopolis cell-based approach to design town-wide well-connected, walkable, and bicycle-friendly neighborhoods, and to create vital local centers for active land use. This has been shown and applied to our example application, the Vienna-Bratislava metropolitan region.
6. Conclusions and Directions for Further Research
We set out to answer the research question: How can we find a solution for managing urban sprawl across scales, which incorporates an efficient distribution of spatial agglomerations, and generates an optimal pattern and functions distribution to resolve the contradiction between compact urban form and urban sprawl? To this research question, we added the premise that sustainable means of transportation have to be included in the solution-finding process. In order to answer this question and show a potential approach, we turned to an integrated modeling approach that combines the multifractal planning model Fractalopolis with the geometric accessibility model space syntax.
It should be noted that a multifractal planning strategy must adhere to the following planning principles [1,2]: hierarchical (polycentric) urban development to manage urban sprawl; transit-oriented development to incorporate sustainable means of transportation; locally well-balanced urban pattern and functions distribution to enhance vital urban systems, local centers, and neighborhoods; penetration of green areas into built-up areas across several nested scales for leisure and microclimate; and the preservation of large interconnected networks of natural and green areas to conserve biodiversity. The multiscale logic of Fractalopolis provides a nested logic allowing for an interlinked accessibility evaluation of the road network, combined with scaling. Furthermore, the model facilitates the design of strategic development plans and the development of scenarios that take into account the Leitbild of Sustainability. The model’s algorithm addresses the closest possibilities for amenities and natural areas/urban green areas according to potential frequentation rates, for example, a hypermarket for weekly shopping or a small park in the neighborhood for daily walks. The interactive multiscale tool performs consistently across scales. Due to the flexibility and interactivity of parameter input in the GIS-based software application, the user can adjust the model’s parameters to any existing spatial system.
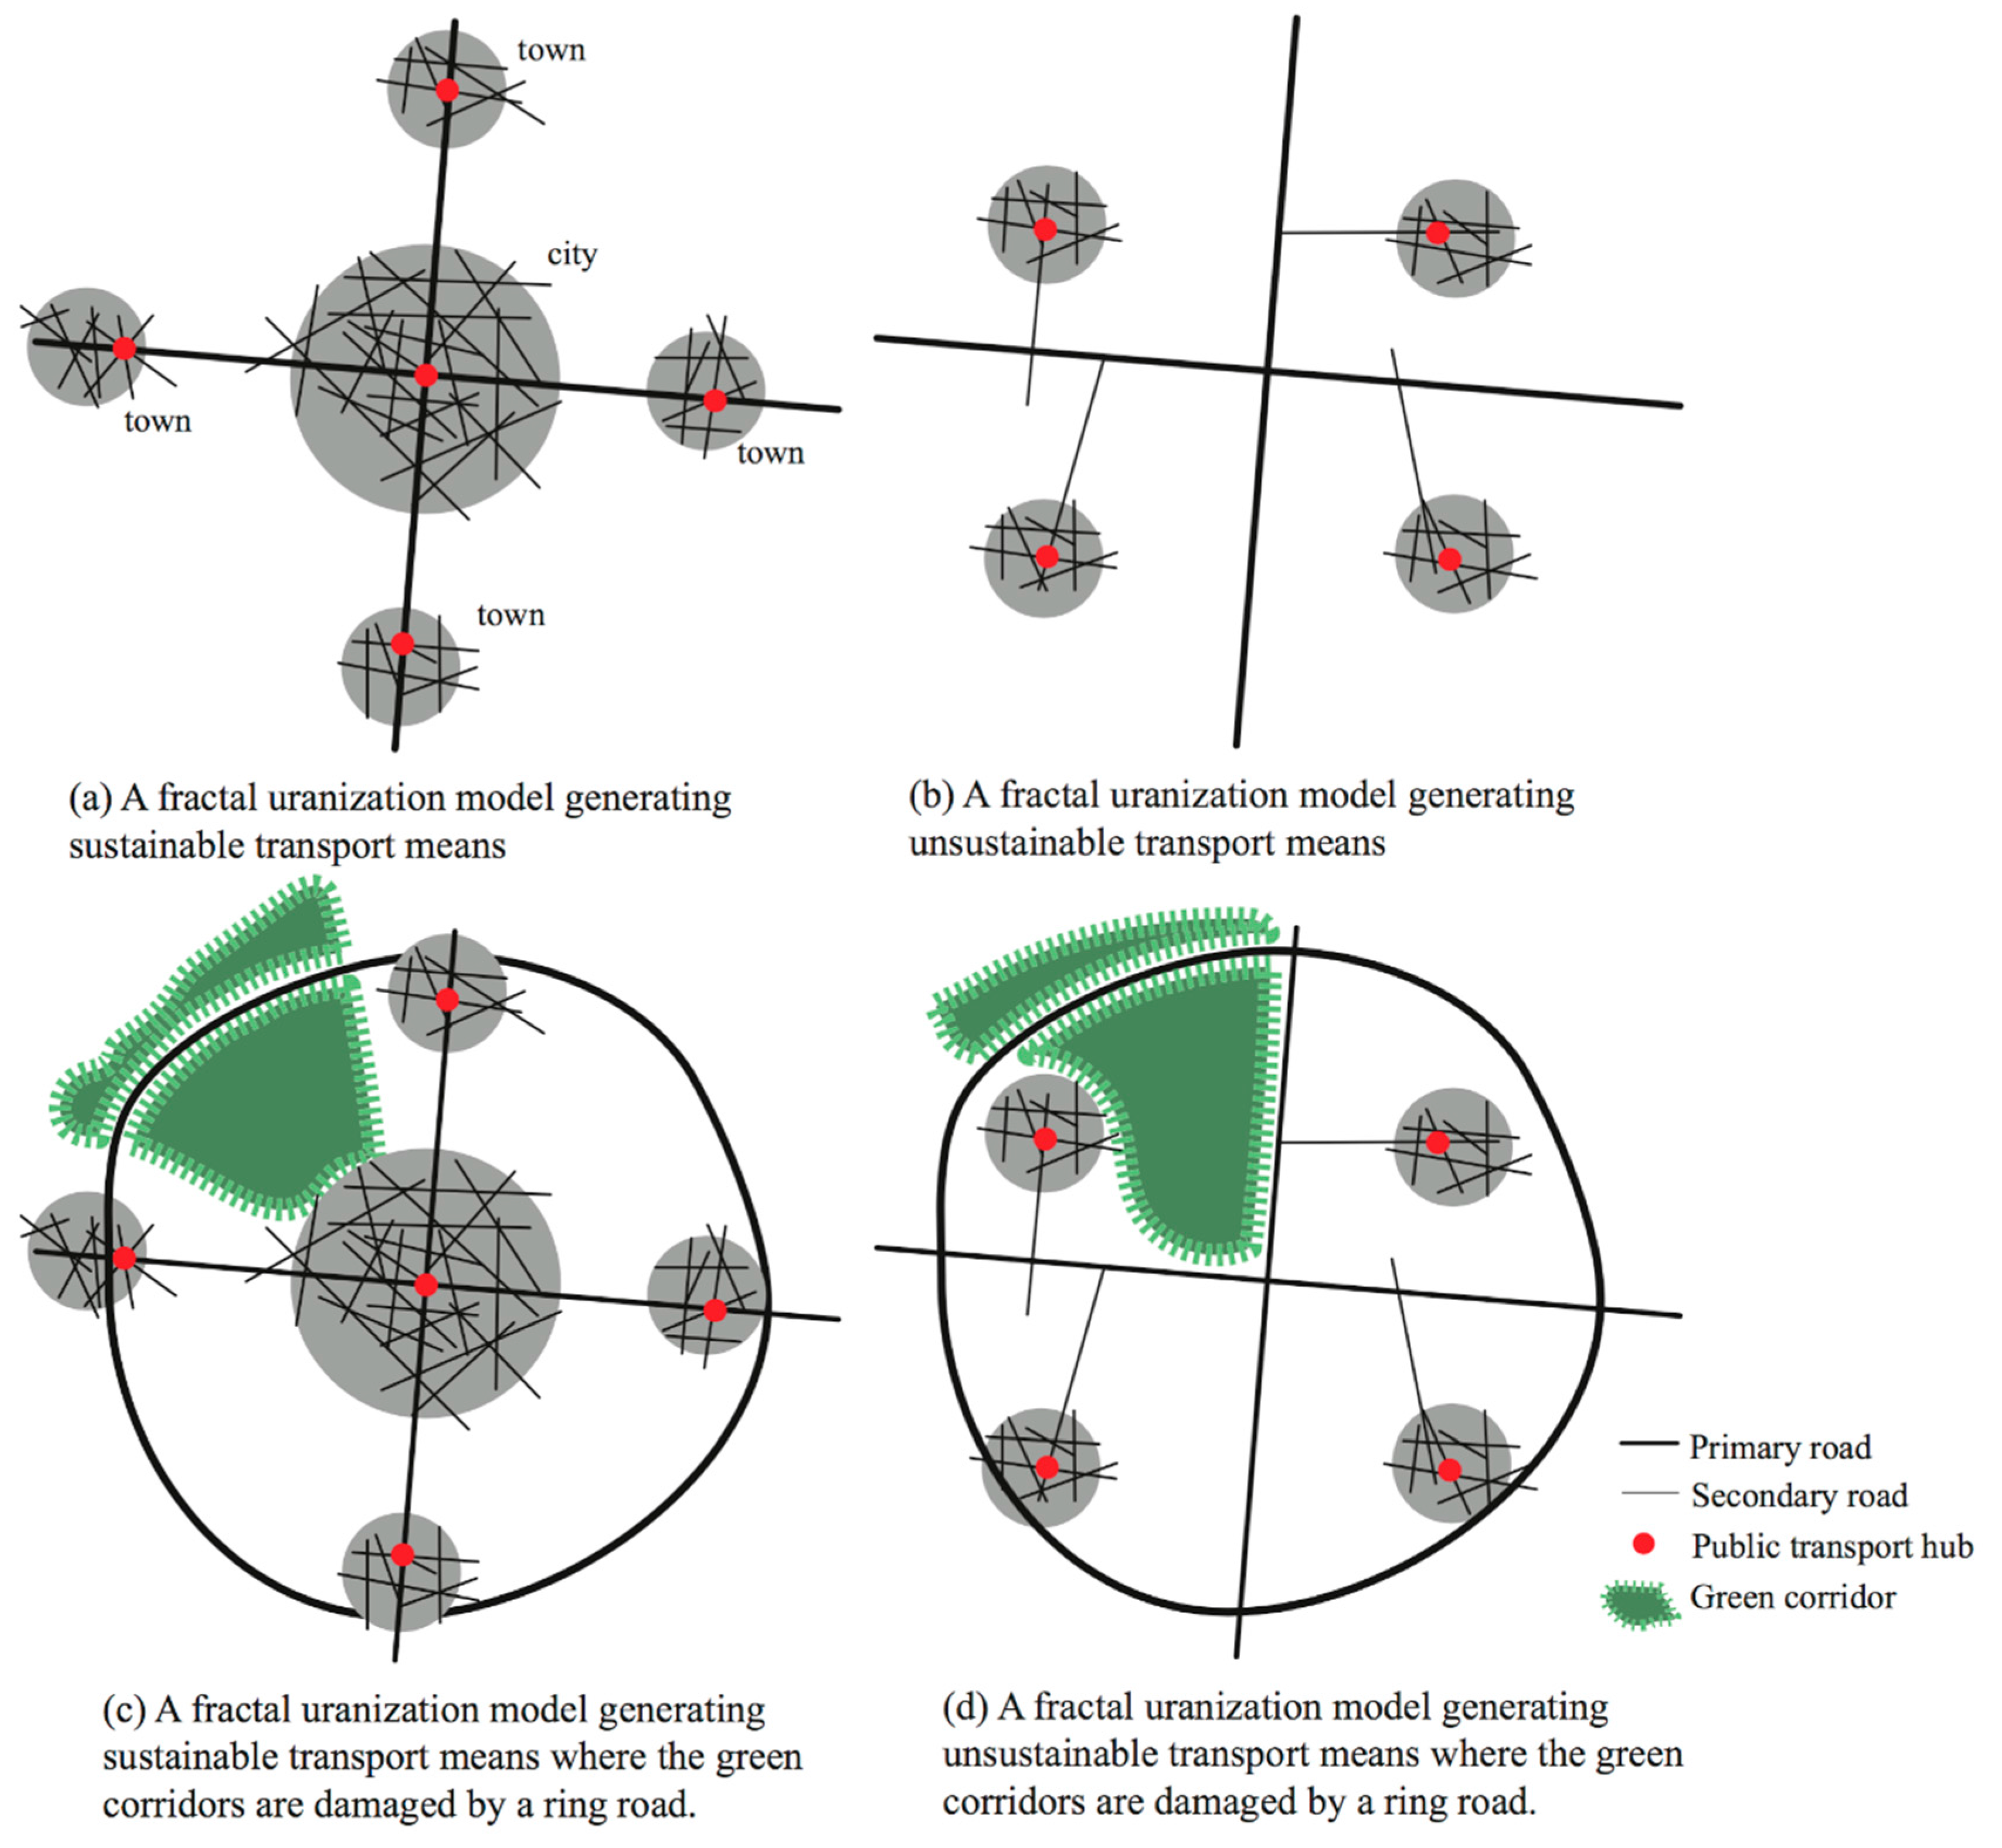
Figure 8 below shows some simple spatial principles of the transportation network on two scale levels in a metropolitan area. The thick lines represent the main route network, whereas the thin lines represent the local street network. As research has shown, the spatial structure of the street and road networks influences the flow of movement and the location of economic activities [48]. Likewise, the spatial structure of the street and road network influences the degree of building density, land use diversity, and the degree of street life [44]. Therefore, the spatial structure of the street and road networks matters for urbanized areas.
The two examples at the top of Figure 8 show the spatial principles of a sustainable and an unsustainable transportation network. When the main routes are well integrated with the local street network, users inside urban areas and villages with these kinds of spatial features tend to choose sustainable means of transportation. Often these kinds of built environments tend to have a large variety of functions, a high degree of walkability, and a balanced high density between the floor space and ground space index in the built mass. The number of people in the streets tends to be high in these areas. Often a large variety of shops tend to be located along the main routes in order to attract transiting travellers as well as local residents. The green areas are located adjacent to the urbanized areas. When this is the case, we call it a sustainable fractal model (Figure 8a). When the main routes are located outside the various neighborhoods and villages, this generates private car dependency, mono-functional dwelling areas, and sprawl into the countryside. This model can be termed an unsustainable fractal planning model (Figure 8b). Sustaining an efficient public transportation model can be costly, and the time used for travelling on it is much higher than in the sustainable fractal model.
When incorporating a ring road in these two examples (Figure 8c,d), the way in which a ring road is connected to the local street network will influence whether and to what extend the metropolitan area will have a sustainable urbanization pattern. When a ring road goes through local areas, urban centers can be strengthened in the existing neighborhoods/villages. The green areas will be broken up, but creating green bridges or locating a ring road underground to maintain continuous green corridors can resolve this. When a ring runs outside the various neighborhoods/villages, it contributes to private-car dependency, monofunctional areas, and low-density urban sprawl into the countryside. The green areas will be broken up. As shown in the two examples below in Figure 8, a ring road imposed upon the sustainable fractal model can maintain a sustainable urbanization pattern, as opposed to when a ring road is imposed upon the unsustainable fractal model.
When undertaking a comparable study, the application of Fractalopolis in combination with space syntax would be useful, combined with a linked sensitivity analysis to identify the potential uncertainties of the results obtained, in comparison to different spatial systems. For example, an application of this integrated modeling approach, as presented here, on new towns planned in their entirety, such as Almere and Lelystad in the Netherlands, could shed some light on their degree of sustainable urbanization pattern. Often the critique is that these new towns generate private car dependency, lack of street life, and a fragmented urban fabric. Maybe the answer as to why this is could be found in the spatial fractal structure.
Acknowledgments
This research is based on C. Yamu’s PhD thesis, in which the Fractalopolis model was made fully operational and applied for the first time. The development of the Fractalopolis model was further linked to research carried out within the framework of the research project Vilmodes, under the PREDIT 4 program financed by the French Ministry of Environment and Sustainable Development and by the Environment and Energy Management Agency (ADEME).
Author Contributions
C. Yamu conceived, designed, performed the experiments and analyzed the data; C. Yamu and A. van Nes wrote the paper.
Conflicts of Interest
The authors declare no conflict of interest.
References
- Frankhauser, P.; Tannier, C.; Vuidel, G.; Houot, H. An integrated multifractal modeling to urban and regional planning. Comput. Environ. Urban Syst. 2018, 67, 132–146. [Google Scholar] [CrossRef]
- Yamu, C.; Frankhauser, P. Spatial accessibility to amenities, natural areas and urban green spaces: Using a multiscale, multifractal simulation model for managing urban sprawl. Environ. Plan. B 2015, 42, 1054–1078. [Google Scholar] [CrossRef]
- Gault, G.; Bedeau, L. Le Français et Leur Habitat. 2007. Available online: https://www.tns-sofres.com/sites/default/files/150207_ville.pdf (accessed on 27 November 2017).
- Guo, J.; Bhat, C. Residential Location Modeling: Accommodating Sociodemographic, School Quality Accessibility Effects; Department of Civil Engineering, University of Texas: Austin, TX, USA, 2002; Available online: http://www.caee.utexas.edu/prof/bhat/home.html (accessed on 27 November 2017).
- Davis, M. Planet of Slums; Verso Press: London, UK, 2006; ISBN 9781844670222. [Google Scholar]
- UN-Habitat. Planning and Design for Sustainable Urban Mobility: Global Report on Human Settlements 2013; Routledge: New York, NY, USA, 2013; ISBN 978-92-1-132568-3. [Google Scholar]
- Neuman, M. The Compact City Fallacy. J. Plan. Res. 2005, 25, 11–26. [Google Scholar] [CrossRef]
- Jacobs, J. The Death and Life of Great American Cities; Random House: New York, NY, USA, 1961; ISBN 0-679-74195-X. [Google Scholar]
- Jenks, M.; Burton, E.; Williams, K. The Compact City: A Sustainable Urban Form? E & FN Spon: London, UK, 1996; ISBN 0-419-21300-7. [Google Scholar]
- Rådberg, J. Towards a Theory of Sustainability and Urban Quality. A New Method for Typological Urban Classification. In Proceedings of the Conference of the International Association for People-Environment Studies—IAPS 14, Stockholm, Sweden, 30 July–3 August 1996; pp. 384–392. Available online: https://iaps.architexturez.net/system/files/pdf/1202bm1044.content.pdf (accessed on 27 November 2017).
- Schwanen, T.; Dijst, M.; Dieleman, F.M. Policies for urban form and their impact on travel: The Netherlands experience. Urban Stud. 2004, 41, 579–603. [Google Scholar] [CrossRef]
- Breheny, M. Centrists, Decentrists and Compromisers: Views on the Future Urban Form. In The Compact City: A Sustainable Urban Form? Jenks, M., Burton, E., Williams, K., Eds.; E&FN Spon: London, UK, 1996; pp. 13–35. ISBN 0-419-21300-7. [Google Scholar]
- Urban Task Force. Towards an Urban Renaissance; E & FN Spon: London, UK, 1999; ISBN 1-85112-165-X. [Google Scholar]
- Gordon, P.; Richardson, H. Are Compact Cities a Desirable Planning Goal? J. Am. Plan. Assoc. 1997, 63, 95–106. [Google Scholar] [CrossRef]
- Levinson, D.M.; Kumara, A. The rational locator: Why travel times have remained stable. J. Am. Plan. Assoc. 1994, 60, 319–332. [Google Scholar] [CrossRef]
- Barton, H. A health map for urban planners. Towards a conceptual model for healthy sustainable settlements. Built Environ. 2005, 31, 339–355. [Google Scholar] [CrossRef]
- Calthorpe, P. The Next American Metropolis. Ecology, Community and the American Dream; Princeton Architectural Press: Princeton, NJ, USA, 1993; ISBN 1-878271-68-7. [Google Scholar]
- Christaller, W. Die zentralen Orte in Süddeutschland. In Eine Ökonomisch-Geographische Untersuchung über die Gesetzmäßigkeit der Verbreitung und Entwicklung der Siedlungen mit Städtischer Funktion; Fischer: Jena, Germany, 1933. [Google Scholar]
- Davoudi, S. Polycentricity in European Spatial Planning: From an Analytical to a Normative Agenda. Eur. Plan. Stud. 2003, 11, 979–999. [Google Scholar] [CrossRef]
- Czerkauer-Yamu, C. Strategic Planning for the Development of Sustainable Metropolitan Areas Using a Multiscale Decision Support System. The Vienna Case. Ph.D. Thesis, Université de Besançon/Université de Franche-Comté, Besançon, Germany, 2012. [Google Scholar]
- Yamu, C. Eine multifraktale Planungsmethode für eine nachhaltige Stadt- und Regionalentwicklung. In Jahrbuch Raumplanung. Technische Universität Wien. Band 1; Bröthaler, J., Getzner, M., Giffinger, R., Hamedinger, A., Voigt, A., Eds.; NWV Verlag: Vienna, Austria, 2013; pp. 53–67. [Google Scholar]
- Batty, M. The New Science of Cities; MIT Press: Cambridge, MA, USA, 2013; ISBN 978-0-262-01952-1. [Google Scholar]
- Batty, M.; Longley, P. The fractal simulation of urban structure. Environ. Plan. A 1986, 18, 1143–1179. [Google Scholar] [CrossRef]
- Batty, M.; Longley, P. Fractal Cities. A Geometry of Form and Function; Academic Press: London, UK, 1994; ISBN 0-12-455570-5. [Google Scholar]
- Batty, M.; Xie, Y. Self-organized criticality and urban development. Discrete Dyn. Nat. Soc. 1999, 31, 109–124. [Google Scholar] [CrossRef]
- Pumain, D.; Tannier, C. Fractals in Urban Geography: A theorEtical Outline and Empirical Example. 2005. Available online: https://cybergeo.revues.org/3275 (accessed on 9 November 2017).
- Shen, G. Fractal dimension and fractal growth of urbanized areas. Int. J. Geogr. Inf. Sci. 2002, 16, 437–519. [Google Scholar] [CrossRef]
- Thomas, I.; Frankhauser, P.; Biermacki, C. The morphology of built-ip landscapes in Wallonia, Belgium: A classification using fractal indices. Landsc. Urban Plan. 2008, 84, 99–115. [Google Scholar] [CrossRef]
- Thomas, I.; Frankhauser, P.; Badariotti, D. Comparing the fractality of European urban neighbourhoods: Do national contexts matter? J. Geogr. Syst. 2012, 14, 189–208. [Google Scholar] [CrossRef]
- Alexander, C. A city is not a tree. Design 1966, 206, 1–17. [Google Scholar]
- Salingaros, N. Principles of Urban Structure; Techne Press: Delft, The Netherlands, 2005; ISBN 90-8594-001-X. [Google Scholar]
- Arlinghaus, C. Fractals take a Central Place. Geograf. Ann. 1985, 67, 83–88. [Google Scholar] [CrossRef]
- Krugman, P. The Self-Organizing Economy; Blackwell Publishers: Malden, MA, USA, 1996; ISBN 1-55786-698-8. [Google Scholar]
- Murcio, R.; Masucci, A.P.; Arcaute, E.; Batty, M. Multifractal to monofractal evolution of the London street network. Phys. Rev. 2015, 92, 062130-1–062130-12. [Google Scholar] [CrossRef] [PubMed]
- Tannier, C.; Vuidel, G.; Houot, H.; Frankhauser, P. Spatial accessibility to amenities in fractal and non-fractal urban patterns. Environ. Plan. B 2012, 39, 801–819. [Google Scholar] [CrossRef]
- Zimmerman, H.J.; Zysno, P. Decisions and evaluations by hierarchical aggregation of information. Fuzzy Sets Syst. 1983, 10, 243–260. [Google Scholar] [CrossRef]
- Hillier, B.; Hanson, J. The Social Logic of Space; Cambridge University Press: Cambridge, UK, 1984; ISBN 0-521-36784-0. [Google Scholar]
- Hillier, B. Space Is the Machine: A Configurational Theory of Architecture; Cambridge University Press: Cambridge, UK, 1996. [Google Scholar]
- Hillier, B.; Turner, A.; Yang, T.; Park, H.T. Metric and topo-geometric properties of urban street networks. In Proceedings of the 6th International Space Syntax Symposium, Istanbul, Turkey, 12–15 June 2007. [Google Scholar]
- Van Nes, A.; Yamu, C. Space Syntax: A method to measure urban space related to social, economic and cognitive factors. In The Virtual and the Real in Urban Planning and Design: Perspectives, Practices and Application; Yamu, C., Poplin, A., Devisch, O., De Roo, G., Eds.; Routledge: New York, NY, USA, 2017; pp. 136–150. ISBN 978-1-138-28348-0. [Google Scholar]
- Blanchard, P.; Volchenkov, D. Mathematical Analysis of Urban Spatial Networks; Springer: Berlin/Heidelberg, Germany, 2009; ISBN 978-3-540-87828-5. [Google Scholar]
- Van Nes, A.; Lopez, M. Micro scale spatial relationship in urban studies: The relationship between private and public space and its impact on street life. In Proceedings of the 6th International Symposium, Istanbul, September 2007; Available online: http://www.spacesyntaxistanbul.itu.edu.tr/papers/longpapers/023%20-%20VanNes%20Lopez.pdf (accessed on 27 November 2017).
- Van Nes, A.; Stolk, E. Degrees of sustainable location of railway stations: Integrating Space syntax and Node place value model railway stations in the province Noord-Holland’s strategic plan for 2010–2040. In Proceedings of the 8th International Space Syntax Symposium, Santiago, Chile, 3–6 January 2012. [Google Scholar]
- Ye, Y.; Van Nes, A. Quantitative tools in urban morphology: Combining Space Syntax, spacematrix and mixed-use index in a GIS framework. Urban Morphol. 2014, 18, 97–118. [Google Scholar]
- Ratti, C. Space Syntax: Some inconsistencies. Environ. Plan. B 2004, 31, 487–499. [Google Scholar] [CrossRef]
- Wang, J.; Zhu, Q.; Mao, Q. The three dimensional extension of space syntax. In Proceedings of the 6th International Space Syntax Symposium, Istanbul, Turkey, 12–15 June 2007; pp. 048-01–048-016. [Google Scholar]
- Raford, N. Social and Technical Challenges to the Adoption of Space Syntax Methodologies as a Planning Support System (PSS) in American Urban Design. J. Space Syntax 2010, 1, 230–245. [Google Scholar]
- Hillier, B.; Burdett, R.; Peponis, J.; Penn, A. Creating life: Or, does architecture determine anything? Archit. Behav. 1987, 3, 223–250. [Google Scholar]
- Von Thünen, J.H. Der Isolierte Staat in Beziehung auf Landwirtschaft und Nationalökonomie; Perthes: Hamburg, Germany, 1826. [Google Scholar]
- Weber, A. Über den Standort der Industrien; Translated as Alfred Weber’s Theory of the Location of Industries; University of Chicago: Chicago, IL, USA, 1929. [Google Scholar]
Figure 1.
(a) a theoretical multifractal Sierpiński (b) with different-sized centers representing urban growth along a street network axis with public transport hubs; (c) population distribution according to the multifractal Sierpiński’s spatial hierarchy.
Figure 1.
(a) a theoretical multifractal Sierpiński (b) with different-sized centers representing urban growth along a street network axis with public transport hubs; (c) population distribution according to the multifractal Sierpiński’s spatial hierarchy.

Figure 2.
Coding system of the spatial model at iteration steps 0–3.
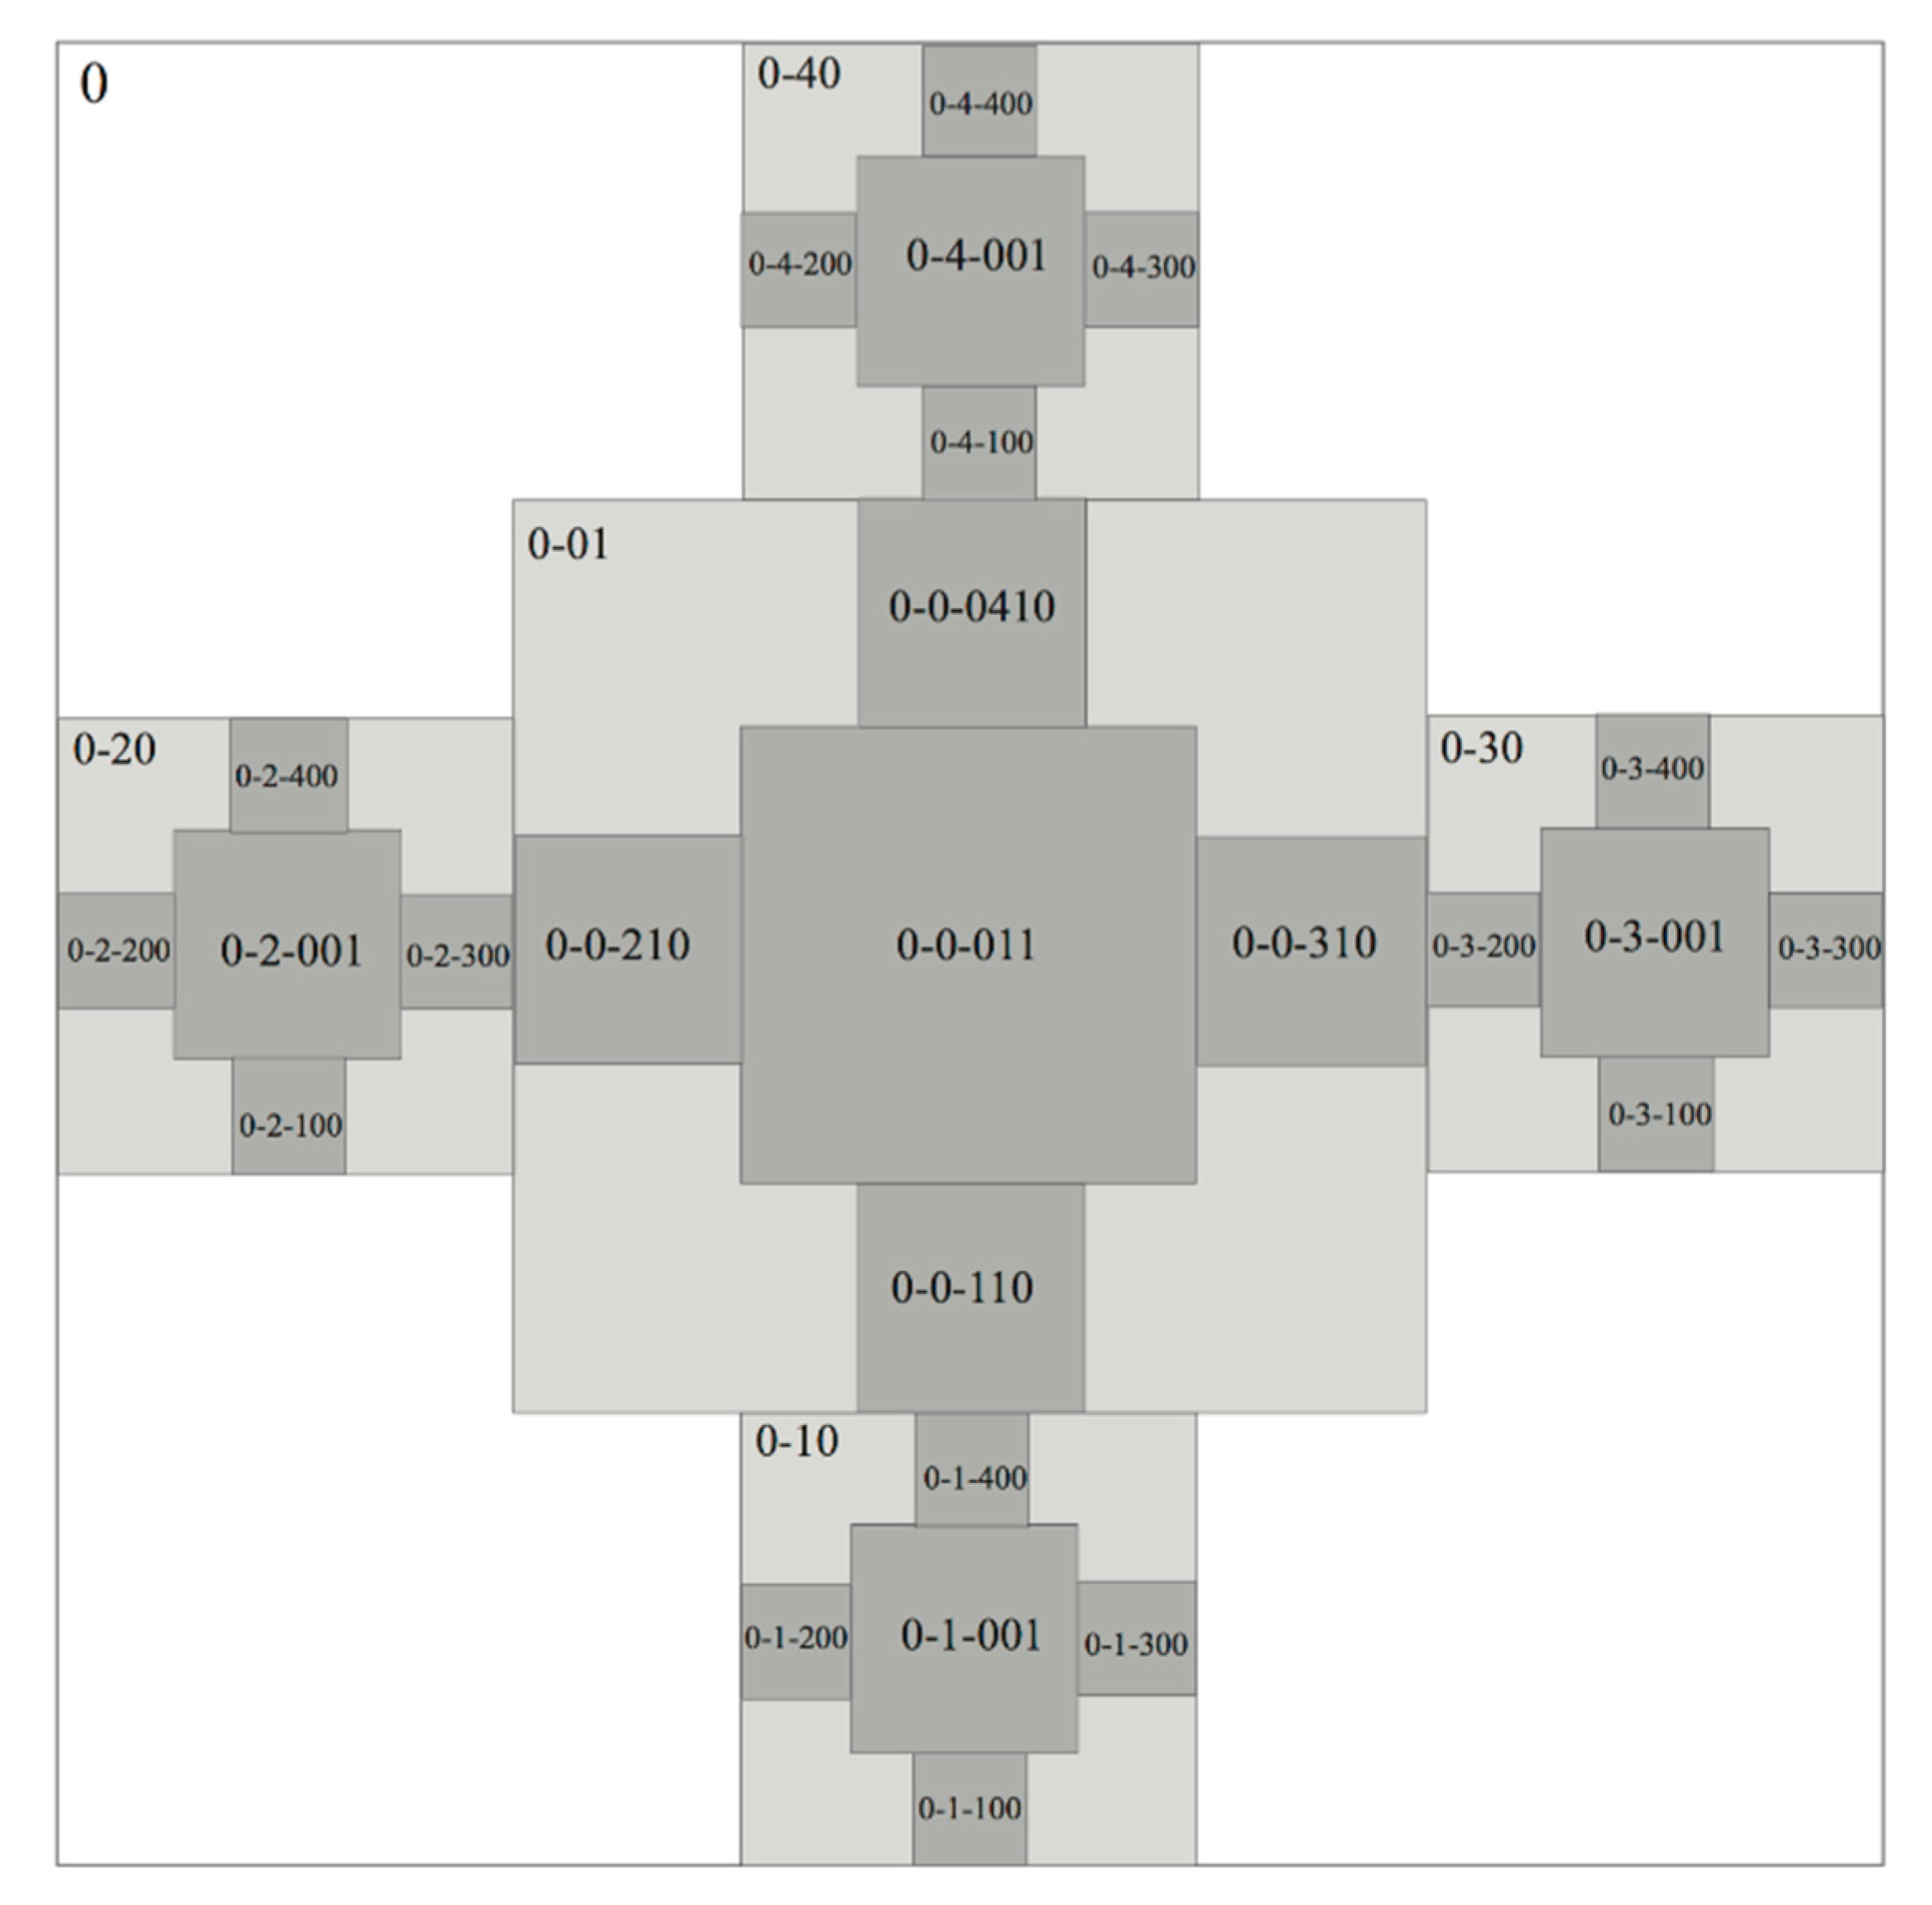
Figure 3.
Screenshot of Fractalopolis software.
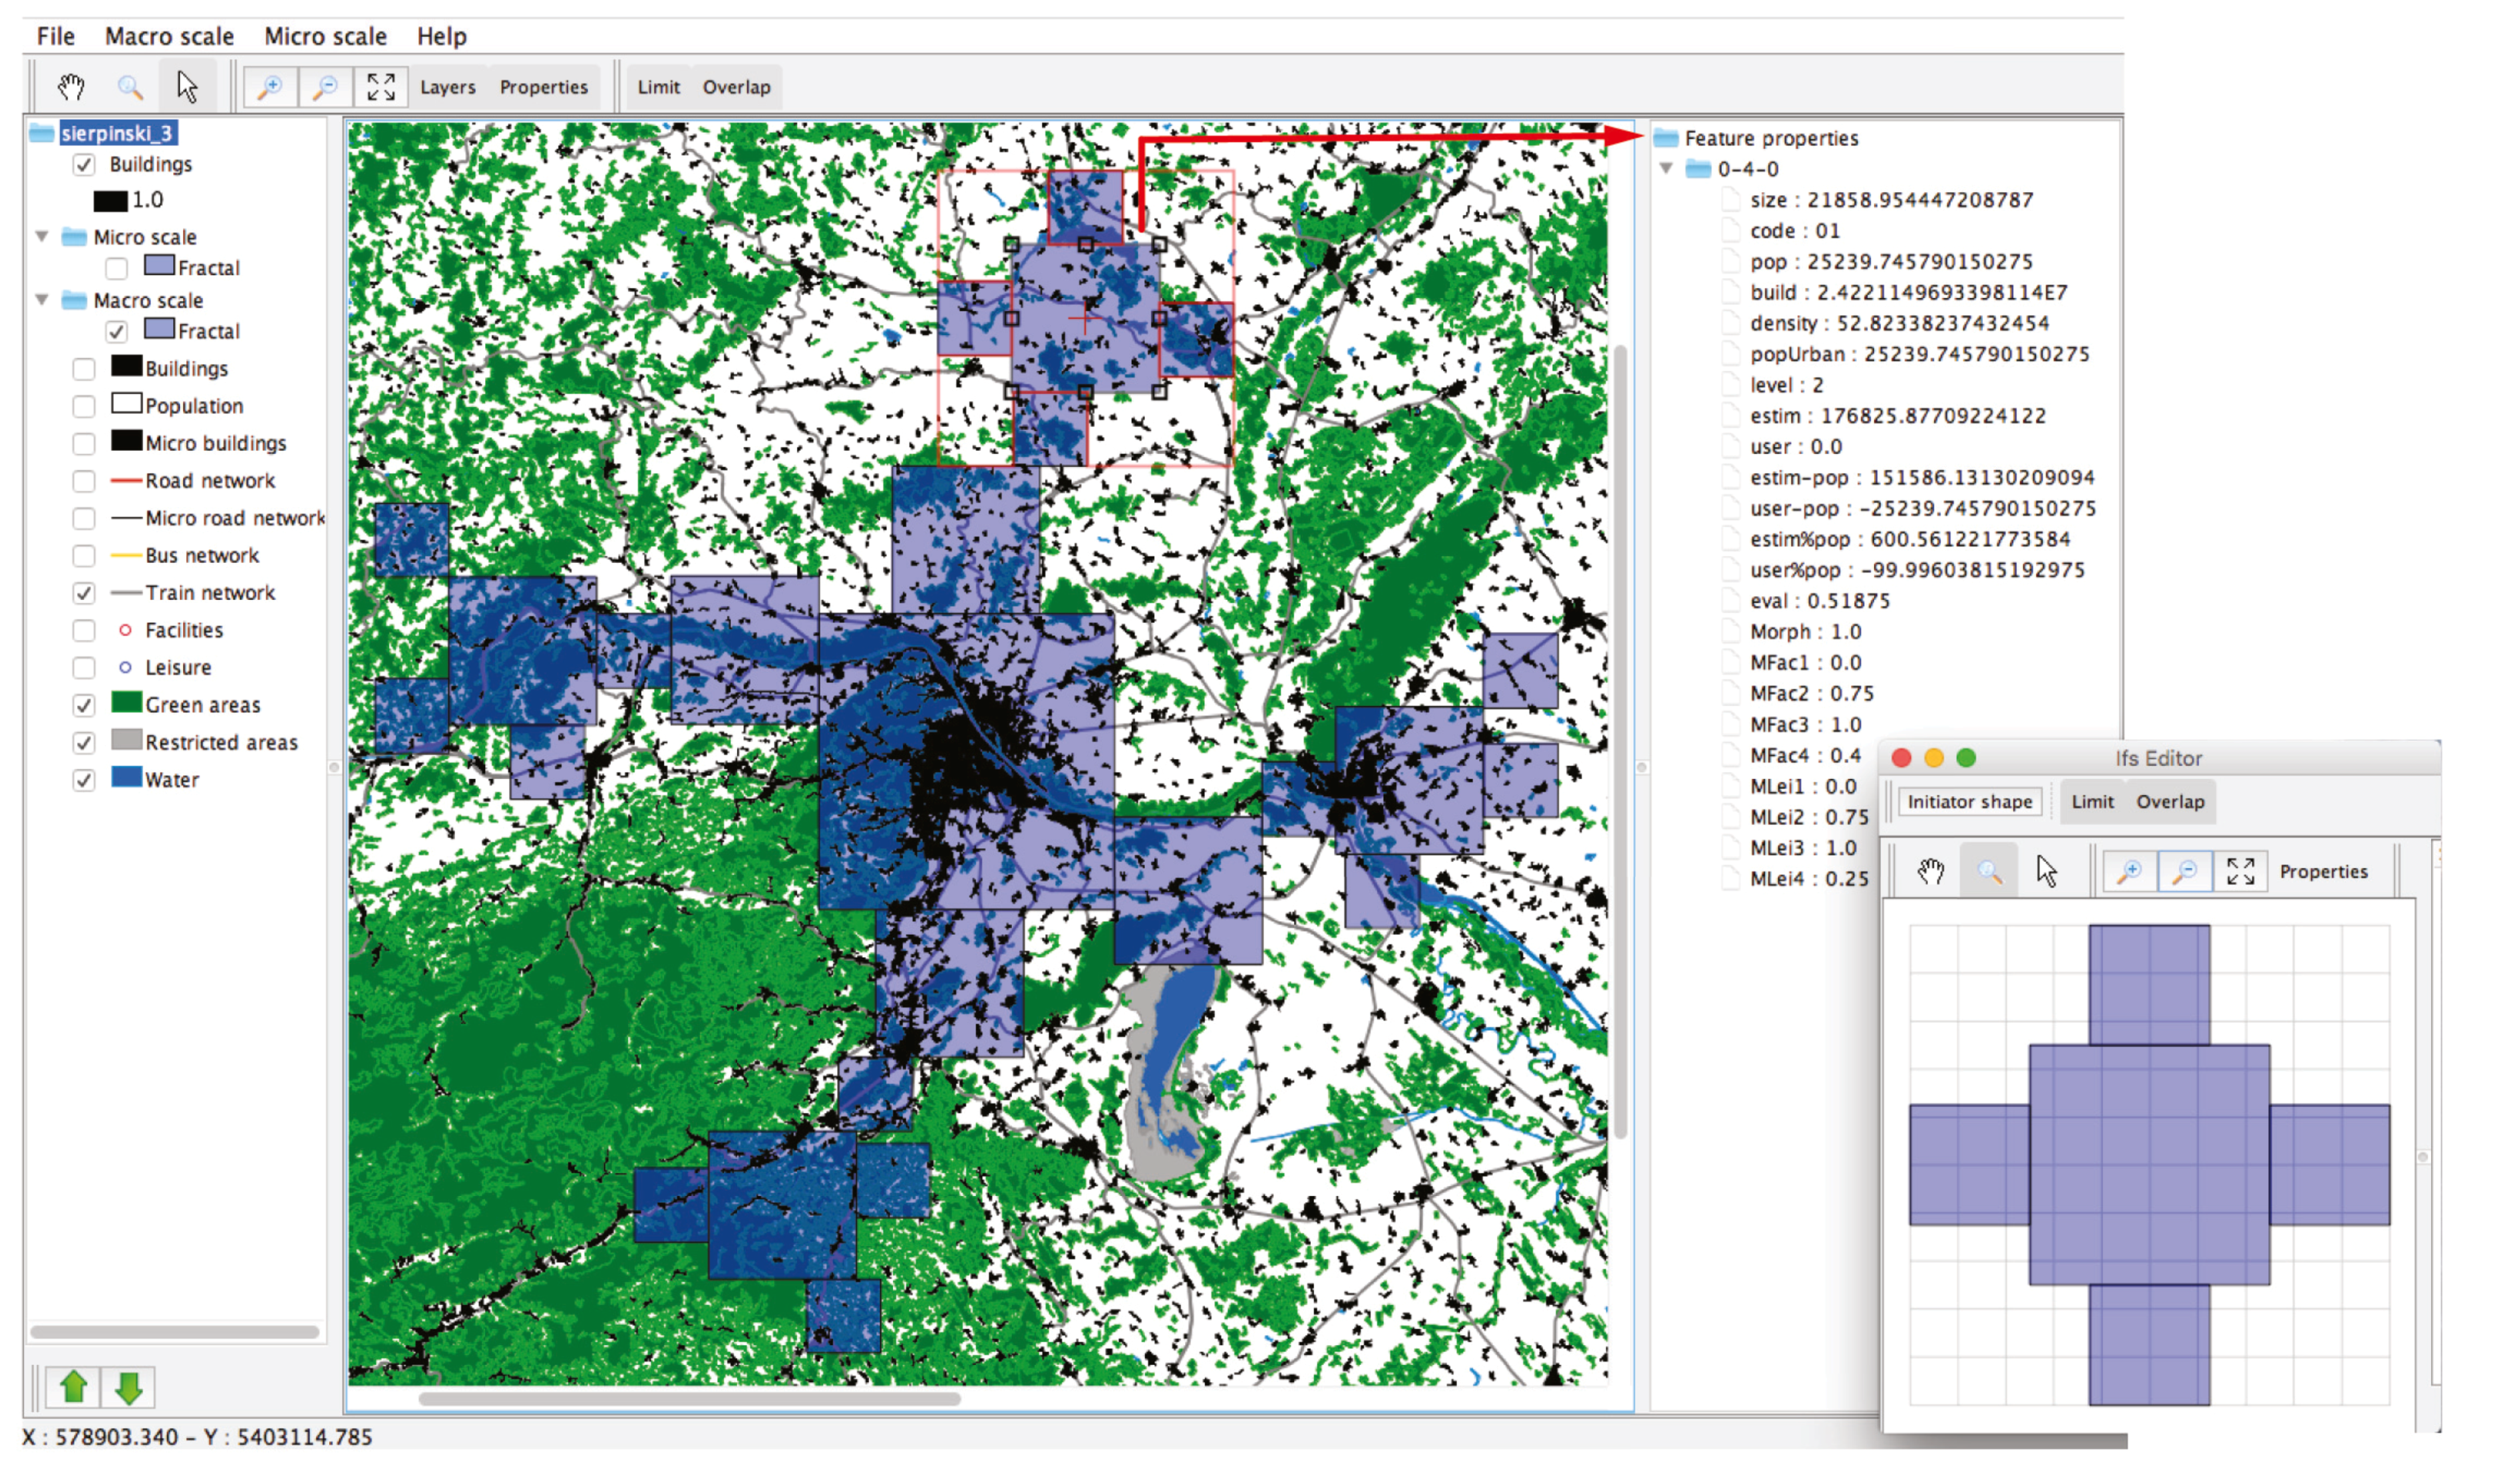
Figure 4.
Geometric accessibility analysis using the road network: (a) Normalized choice high metrics determines the overall spatial strategy implemented for developing scenarios on a regional scale; and (b) normalized choice low metrics—2000 m depicts local centers.
Figure 4.
Geometric accessibility analysis using the road network: (a) Normalized choice high metrics determines the overall spatial strategy implemented for developing scenarios on a regional scale; and (b) normalized choice low metrics—2000 m depicts local centers.
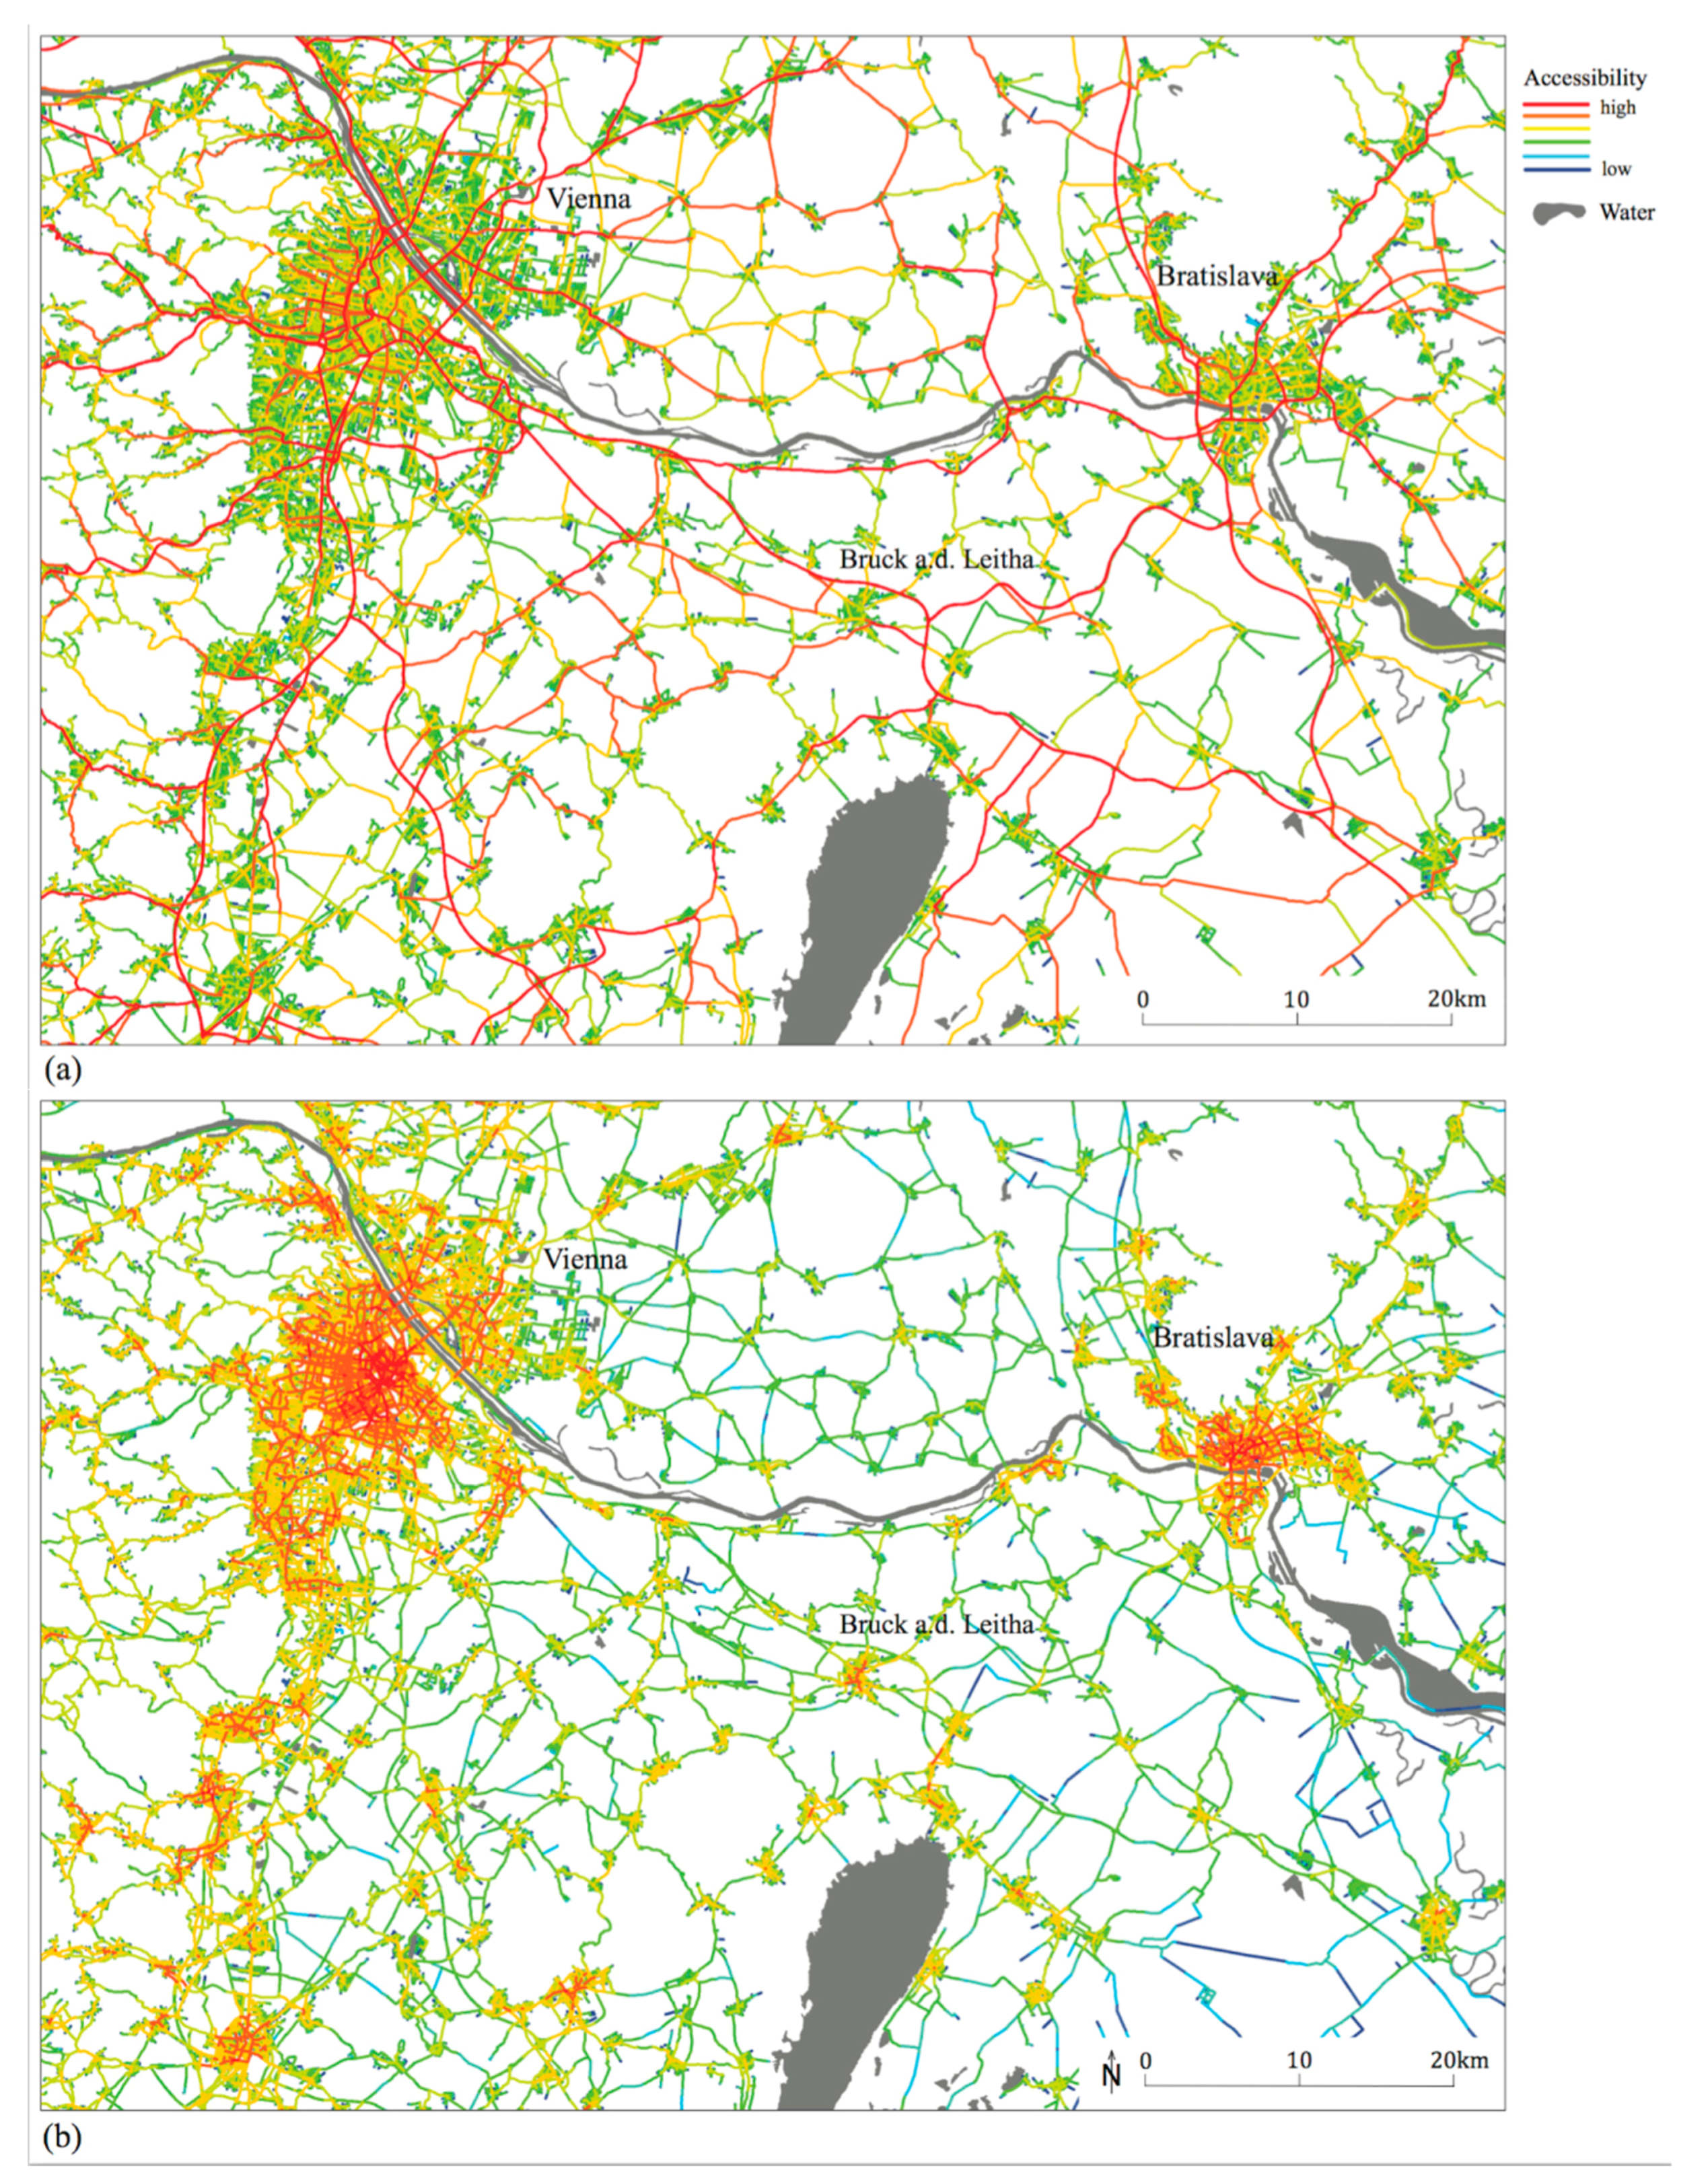
Figure 5.
Designing a strategic development plan: iteration steps 0–3. For illustrative purposes, we have deactivated the street network layer.
Figure 5.
Designing a strategic development plan: iteration steps 0–3. For illustrative purposes, we have deactivated the street network layer.

Figure 6.
The strategic development plan on an urban scale at iteration Step 7; aggregated accessibility evaluation for selected cells in the application area (image left: google earth).
Figure 6.
The strategic development plan on an urban scale at iteration Step 7; aggregated accessibility evaluation for selected cells in the application area (image left: google earth).

Figure 7.
An integrated modeling approach on a local scale: (a) NACH high metric radius depicts highly accessible roads penetrating the neighborhood’s core: (b) NACH low metric radius 800 m highlights an unsustainable street network for pedestrian movement; (c) the multifractal planning logic includes potential residential development; and (d) NACH low metrics indicates a street network with higher accessibility and potential locations for a local center with new functions. (Background image: google earth).

Figure 8.
Schemes showing some spatial fractural principles in the relationship between the local street network in neighborhoods or villages and the larger metropolis. The image, top left, is reminiscent of the logic used in our multifractal planning logic for designing a strategic development plan and development scenario for creating sustainable means of mobility.


Table 1.
Sample cells according to their hierarchical level, size, and surface percentage: iteration steps 0–2.
Table 1.
Sample cells according to their hierarchical level, size, and surface percentage: iteration steps 0–2.
| Cell Code | Hierarchical Level | Cell Base Length [km] | Cell Surface [km2] | Surface Percentage [%] |
|---|---|---|---|---|
| 0 | 1 | 175 | 30,625 | 100 |
| 0-01 | 2 | 87.50 | 7656 | 25 |
| 0-010 | 3 | 43.75 | 1914 | 6.25 |
| 0-0-011 | 3 | 43.75 | 1914 | 6.25 |
| 0-0-110 | 4 | 21.86 | 478 | 1.56 |
| 0-1-001 | 4 | 21.86 | 478 | 1.56 |
| 0-1-100 | 5 | 10.94 | 120 | 0.39 |
Table 2.
Sample types and potential frequentation, including distance function as used for this sample application.
Table 2.
Sample types and potential frequentation, including distance function as used for this sample application.
| Distance d on the Road Network Linked to Potential Frequentation of Amenities | Services and Shopping | Leisure Amenities | Transportation |
|---|---|---|---|
| 0–20 km μ(d) = 1 | Central public administration | Ski resort | Railway |
| Opera, theater, museum | Forests | ||
| 20–40 km μ(d) = 1–0 | Hospital and health care center | Alluvial forests | |
| University | |||
| 0–3 km μ(d) = 1 | Local public administration | Weekly recreation areas | Railway, bus, bicycling |
| Bank | Swimming pool | ||
| 3–10 km μ(d) = 1–0 | Supermarket | Tennis court | |
| Secondary school | Football field | ||
| 0–600 μ(d) = 1 | Corner shop | Small playground | Bicycling, walking |
| Bakery | Neighborhood park | ||
| 600–1200 m μ(d) = 1–0 | Cash machine | Small sports field | |
| Primary school, Kindergarten |
Table 3.
Evaluation of each cell at iteration step 2 (coding for each cell can be found in Figure 5).
Table 3.
Evaluation of each cell at iteration step 2 (coding for each cell can be found in Figure 5).
| Cell Code at Iteration Step 2 | Cell Base Length [km] | Synthetic Evaluation of Suitability | Population Census [pop.] | Model Population [est.] |
|---|---|---|---|---|
| Metropolitan Region Vienna | ||||
| 0-0-0.11 | 43.72 | 0.75 | 1,894,808 | 1,637,562 |
| 0-0-1.10 | 21.86 | 0.66 | 144,124 | 85,174 |
| 0-0-2.10 | 21.86 | 0.66 | 36,818 | 85,174 |
| 0-0-3.10 | 21.86 | 0.73 | 33,651 | 85,174 |
| 0-0-4.10 | 21.86 | 0.67 | 22,686 | 85,174 |
| Metropolitan Region Bratislava | ||||
| 0-3-0.01 | 21.86 | 0.57 | 339,628 | 176,826 |
| 0-3-1.00 | 10.93 | 0.51 | 7449 | 9197 |
| 0-3-2.00 | 10.93 | 0.73 | 114,091 | 9197 |
| 0-3-3.00 | 10.93 | 0.50 | 12,378 | 9197 |
| 0-3-4.00 | 10.93 | 0.37 | 10,986 | 9197 |
Table 4.
Suitability evaluation and comparison between the existing population and the model population. Due to the roughness of governmental data, the existing population numbers are dubious on a local scale for some cells. This shows the common phenomena of a clash between aggregated data and scale. Furthermore, the high impact of the morphological rule can be identified when analyzing the synthetic evaluation.
| Cell Code at Iteration Step 7 | Cell Base Length [km] | Synthetic Evaluation of Suitability | Population Census [pop.] | Model Population [est.] | Population Delta [Δ] |
|---|---|---|---|---|---|
| Historic core | |||||
| 00000.1011111 | 683.1 | 0.74 | 1516 | 884 | 632 |
| Application area | |||||
| 00400.1011011 | 341.5 | 0.74 | 70.76 | 61 | 9.76 |
| 00401. 1011010 | 170.8 | 0.49 | 00 | 10.79 | −10.79 |
| 00403.1011010 | 170.8 | 0.49 | 32.23 | 10.79 | 21.44 |
| 00404.1011010 | 170.8 | 0.47 | 0 | 10.79 | −10.79 |
| 00402.1011010 | 170.8 | 0.59 | 0 | 10.79 | −10.79 |
| 00440.1011001 | 170.8 | 0.74 | 9.35 | 9.24 | 0.11 |
| 00444.1011000 | 85.39 | 0.48 | 2.61 | 1.64 | 0.97 |
| 00442.1011000 | 85.39 | 0.49 | 0 | 1.64 | −1.64 |
| 00441.1011000 | 85.39 | 0.48 | 2.20 | 1.64 | 0.56 |
| 00443.1011000 | 85.39 | 0.48 | 4.60 | 1.64 | 2.96 |
Table 5.
Means of syntactic measurements for the existing street network and the locations for a potential local center with shops.
Table 5.
Means of syntactic measurements for the existing street network and the locations for a potential local center with shops.
| NACH High Metrics | NACH Low Metrics | |||||
|---|---|---|---|---|---|---|
| Potential location for a new local center | 1 | 2 | 3 | 1 | 2 | 3 |
| Existing street network | 4.95 | 4.37 | 4.63 | 2.0 | 1.9 | 1.40 |
| Scenario | 4.94 | 4.49 | 4.68 | 2.41 | 2.24 | 2.32 |
© 2017 by the authors. Licensee MDPI, Basel, Switzerland. This article is an open access article distributed under the terms and conditions of the Creative Commons Attribution (CC BY) license (http://creativecommons.org/licenses/by/4.0/).
Share and Cite
MDPI and ACS Style
Yamu, C.; Van Nes, A. An Integrated Modeling Approach Combining Multifractal Urban Planning with a Space Syntax Perspective. Urban Sci. 2017, 1, 37. https://doi.org/10.3390/urbansci1040037
AMA Style
Yamu C, Van Nes A. An Integrated Modeling Approach Combining Multifractal Urban Planning with a Space Syntax Perspective. Urban Science. 2017; 1(4):37. https://doi.org/10.3390/urbansci1040037
Chicago/Turabian StyleYamu, Claudia, and Akkelies Van Nes. 2017. "An Integrated Modeling Approach Combining Multifractal Urban Planning with a Space Syntax Perspective" Urban Science 1, no. 4: 37. https://doi.org/10.3390/urbansci1040037