Urbanisation-Induced Land Cover Temperature Dynamics for Sustainable Future Urban Heat Island Mitigation


1
Geography and Environment, The University of Southampton, University Road, Southampton SO17 1BJ, UK
2
UWA School of Agriculture and Environment, The University of Western Australia, Crawley, WA 6009, Australia
*
Author to whom correspondence should be addressed.
Urban Sci. 2017, 1(4), 38; https://doi.org/10.3390/urbansci1040038
Submission received: 20 November 2017
/
Revised: 28 November 2017
/
Accepted: 29 November 2017
/
Published: 2 December 2017
(This article belongs to the Special Issue Urban Heat Island and Mitigation Technologies—Impact and Mitigation)
Abstract
:Urban land cover is one of the fastest global growing land cover types which permanently alters land surface properties and atmospheric interactions, often initiating an urban heat island effect. Urbanisation comprises a number of land cover changes within metropolitan regions. However, these complexities have been somewhat neglected in temperature analysis studies of the urban heat island effect, whereby over-simplification ignores the heterogeneity of urban surfaces and associated land surface temperature dynamics. Accurate spatial information pertaining to these land cover change—temperature relationships across space is essential for policy integration regarding future sustainable city planning to mitigate urban heat impacts. Through a multi-sensor approach, this research disentangles the complex spatial heterogeneous variations between changes in land cover (Landsat data) and land surface temperature (MODIS data), to understand the urban heat island effect dynamics in greater detail for appropriate policy integration. The application area is the rapidly expanding Perth Metropolitan Region (PMR) in Western Australia (WA). Results indicate that land cover change from forest to urban is associated with the greatest annual daytime and nighttime temperature change of 0.40 °C and 0.88 °C respectively. Conversely, change from grassland to urban minimises temperature change at 0.16 °C and 0.77 °C for annual daytime and nighttime temperature respectively. These findings are important to consider for proposed developments of the city as such detail is not currently considered in the urban growth plans for the PMR. The novel intra-urban research approach presented can be applied to other global metropolitan regions to facilitate future transition towards sustainable cities, whereby urban heat impacts can be better managed through optimised land use planning, moving cities towards alignment with the 2030 sustainable development goals and the City Resilience Framework (CRF).
1. Introduction
Rapid global urbanisation has resulted in more than half of the world’s population (54.5% in 2016) currently residing in cities and this is expected to increase by 2.5 billion by 2050 or 66% of the world’s population [1,2]. To accommodate the large increase in urban population, the urban area is expected to triple by 2030 based on current trends (2000 baseline of 652,825 km2) increasing global urban area from 0.5 to 0.9% of total land area [3,4,5]. Urbanisation of natural land is recognised as the most extreme cumulative effect of land cover change which leads to a multitude of socio-economic and physical consequences that include amenity provision efficiency, ecological degradation and the Urban Heat Island (UHI) effect [6,7,8,9,10].
The UHI effect is considered one of the major problems posed to humans in the 21st century; urbanisation is permanently altering the atmospheric energy exchange and modifying local and regional climate, negatively influencing city sustainability and liveability [11,12]. The UHI is defined by increased atmospheric and surface temperatures over surfaces covered by manmade urban materials (e.g., asphalt) which have modified the thermal bulk properties (heat capacity and thermal conductivity) and surface radiative properties (albedo and emissivity) compared to that experienced by natural surfaces such as vegetation and bare soil. UHIs are characterised into three categories: Surface Urban Heat Island (SUHI), Canopy Layer Heat Island (CLHI) and Boundary Layer Heat Island (BLHI). SUHI refers to the relative heat of urban surfaces compared to surrounding areas, whilst CLHI and BLHI denote atmospheric warming from the surface to mean building height (CLHI) and above the canopy layer (BLHI) [13,14]. The higher temperatures experienced over urban areas, described as the UHI effect, have been associated with adverse health impacts [15,16], increased energy consumption and emissions [17], water usage escalation [18], and economic expenditure [19]. For example, Goggins et al. (2012) found that in Hong Kong a 1 °C rise in temperature above 29 °C was associated with a 4.1% increase in mortality within areas obtaining a high UHI, in comparison to a 0.7% increase in locations with a low UHI. Consequently, global cities including London [20], New York [21] and Tokyo [22] have introduced development standards to mitigate exacerbation of the UHI effect, aligned with the C40 Cities Climate Leadership Group’s (C40 CCLG) guide for cool cities, as a critical facet in managing city environmental risk [23,24].
The magnitude of the UHI effects varies both spatially and temporally. For example, northern cities of the USA (e.g., Washington, DC) were found to require less energy (net benefit) due to additional warming from urban surfaces mitigating past energy consumption as a result of colder climates. Contrastingly, southern cities (e.g., Dallas) utilised more energy (net deficit) as a consequence of UHI within warmer climates [17]. Similarly, research from Romanian [25], Chinese [26] and Asian cities [27] established more pronounced daytime SUHIs, whilst Italian [28], other Chinese [29,30] and USA [31] cities established both more distinct nighttime surface and atmospheric UHIs. Identifying the localised spatio-temporal impacts of urban expansion on the UHI effect is therefore essential to help prevent further socio-ecological impacts and inform targeted policies for sustainable future development [17,32,33,34].
One approach to assess the impact of urban and rural land cover on the magnitude of the UHI is the use of in-situ ground observations (e.g., weather station data) of air temperature [35,36,37,38,39,40,41]. For example, the city of Melbourne analysed temperature differences between one Central Business District (CBD) and three non CBD weather stations in determining a UHI effect and associated socio-economic impacts across the city [19]. However, in-situ ground observations such as weather stations preclude collection of comprehensive temperature data over highly heterogeneous urban areas negating targeted policy application (e.g., [8,35,36,37,38]). Over the last two decades, Earth Observation (EO) has provided a key tool in monitoring Land Surface Temperature (LST) using instruments that contain thermal spectral wavebands such as: the Moderate Resolution Imaging Spectroradiometer (MODIS; Terra and Aqua) (e.g., [42]), Landsat Thematic Mapper (TM) (e.g., [43,44,45]), the geostationary Spinning Enhanced Visible and Infrared Imager (SEVIRI) (e.g., [46]) and the Advanced Along-Track Scanning Radiometer (AATSR) (e.g., [28]). An advantage of satellites is their capability for near global coverage, high temporal and moderate spatial resolution that resolve point-based data generalisations and interpolative processing (e.g., [39]). Urban areas affect both air temperature and LST. Air temperature represents the urban canopy layer whereas LST pertains to the association of land-cover types with the Surface Heat Island (SHI), depicting the SUHI [14]. To derive air temperature from LST additional factors including surface properties, atmospheric conditions and solar angles are incorporated to calculations (assuming local data is available during satellite overpass) [8,47]. Therefore, temperature directly extracted from satellite imagery enables universal comparison, averting issues associated with scaling to air temperature over large spatial extents, typically used within UHI studies [8,26,28,30,48].
Previous EO and traditional studies have considered cross-sectional (temporally static land cover map) or longitudinal (temporally dynamic series of land cover maps) homogenous urban land cover areas in relation to surface temperature, yet such research has limitations. Cross-sectional studies either ignore the temporal component of urbanisation on LST [49,50] or assume a consistent urban area over the study period [5,48,51]. Longitudinal studies classify land cover over multiple periods but often disregard valuable spatial information through comparison of global temperature indices (e.g., the Urban Heat Island Intensity (UHII)) across years and do not quantify changes in land cover that are associated with temperature change [30,52,53,54,55]. Transformation of land during urbanisation encompasses a broad range of changes within metropolitan regions which are frequently excluded from temperature analysis, and this needs consideration to address the aforementioned limitations. For example, whilst Xie et al. (2012) and Hu et al. (2015) identified urban to represent the greatest increase in land cover, their analysis focused on the difference between averaged land cover temperatures producing singular metropolitan values that is unable to identify which land cover change induced the greatest temperature change [26,56]. Exclusion of the holistic impact of land cover change on temperature, alongside the universal assumption of urban homogeneity, which disregards the variability between high and low albedo urban land covers obtaining diverse thermal characteristics, has precluded targeted policies in mitigating changes that most influence surface temperature across metropolitan regions [5,30,48,49,50,52,53,54,57].
Perth, the state capital city of Western Australia (WA) has observed rapid outward urban land cover expansion of 201.10 km2 between 2003 and 2013; eclipsing all major Australian, USA and UK cities in terms of suburban development [10,58,59]. In this research, we consequently use the Perth Metropolitan Region (PMR) as a critical case study for assessing the holistic impact of land cover change on temperature; an identified pre-requisite for effective land cover change policy targeting. The aim of this study is to provide a novel investigation into the spatio-temporal characteristics of the UHI at a sub-metropolitan level (i.e., the dynamics of the UHI within the city limits). Specific objectives are to (1) explore the complexities of the UHI effect and (2) identify the associations between land cover and temperature change, both at the intra-urban scale. The former permits quantified evidence for inclusion in future development policies whilst the latter provides a novel approach to spatio-temporally assess the association of individual land cover alterations from various land cover types (e.g., bare earth, grassland and forest) to urban (low and high albedo) on LST. In this paper we document a detailed approach to disentangle the spatial and temporal intra-urban disparities of the UHI effect. Our findings illustrate the novelty of the analyses undertaken and we demonstrate the transferability of the process to other metropolitan regions globally.
2. Study Area
The PMR has experienced sustained rapid urban development during the 21st century coinciding with a booming resource sector [10,60]. Rapid outward expansion of the PMR has caused sustainability concerns due to large-scale conversion of natural land to impervious surfaces [61,62]. Changes of this nature alter the energy balance (Supplementary S1) increasing the storage of long wave radiation compared to surrounding non-urbanised areas forming the UHI effect [7] (Figure 1).
The strategic guide for the long term (2050) development of Perth, produced by the Western Australian Planning Commissions (WAPC), specifies sustainability as a key strategy and reducing the UHI as one of sixteen aspirations under the strategy for the Planning Commission, State and Local Government [62]. Furthermore, future land rezoning must meet strategic urban planning objectives, rather than in response to individual requests under the key strategy to improve use of existing and proposed urban land supply [62]. Other Australian State capitals including Sydney, Melbourne and Adelaide are involved with the Urban Climates Project identifying effects of the UHI for integration into planning and design guidelines [63]. However, current global UHI methodologies frequently provide singular metropolitan temperature comparison values for cities, which are inappropriate for assessing land-cover temperature change relationships at the intra-urban scale [30,52,53,54,55]. Such limitations in current UHI measurement approaches prevent effective UHI mitigation and future sustainable rezoning policy formulations required at the sub-metropolitan level, as defined by the State, Planning Commission and Local Government strategies [62].
Perth currently lacks investigation into the causes and consequences of the UHI effect. Ranked consistently as Australia’s fastest growing capital city in terms of population between 2007 and 2014, the majority of urban development occurred as outward low-density suburban expansion [10,58,59]. Between 1990 and 2015 the urban area of the PMR increased by 45.3% (320.34 km2), with a 37.4% increase since 2000 (279.80 km2) [10]. Perth’s rapid urban expansion can be accredited to Australia’s 21st century mineral and energy boom, contributing 95% of the WA’s export earnings between 2010 and 2011 with the state’s value of mineral and petroleum resources increasing from AUD 4.7 billion in 1996 to a peak of AUD 121.6 billion mid-2013 [64]. Given the spatial and temporal dynamics of Perth’s changing urban environment, the metropolitan region provides a unique national and globally important case study in spatio-temporally quantifying the intra-urban complexities of rapidly expanding impervious surface areas and the association with LST [11].
3. Data and Methodology
3.1. Land Cover Data
Land Cover (LC) estimates derived from cloud-free Landsat surface reflectance imagery were obtained from MacLachlan et al. (2017) ([65]) for the years 2003 (accuracy: 80.33%, kappa coefficient: 0.72) and 2013 (accuracy: 79.00%, kappa coefficient: 0.70) [65]. These land cover images were classified by MacLachlan et al. (2017) ([10]) into six land cover types; high reflectance urban (e.g., concrete), low reflectance urban (e.g., asphalt), forest, water, grassland and bare earth [10]. Two urban land cover classes were defined to reduce spectral confusion between spectrally similar classes and to better represent urban heterogeneity that influences surface thermal properties [10]. Unique values were attributed to Landsat (30 × 30 m2) land cover types in 2003 and 2013, with subtraction permitting identification of land cover change aggregated to a MODIS pixel. MODIS pixels which obtained a change in land cover greater than all other changes within the pixel and the change to land cover dominated (>50%) the MODIS pixel were identified (Figure 2a). A three-year temperature average of selected years (2002–2004 and 2012–2014) reduced natural inter-annual variation (e.g., Supplementary S3), solely for the land cover change-LST analysis in line with Zhang et al. (2012), Imhoff et al. (2010) and Hu et al. (2015) to create seasonal and annual composite temperature images for 2003 and 2013 (Figure 3b) [26,48,66].
3.2. MODIS Temperature Data
To assess the association between urban expansion and land cover change on LST within the PMR daily raw MODIS Terra LST data (MOD11A1, collection 5; [67]) were used. MODIS LST data provides both daytime (local time: 10:30 h) and nighttime (local time: 22:30 h) 1 km2 LST, with the longest consistent record of surface temperature data overcoming temporal and swath restrictions of satellites such as Landsat and the Advanced Spaceborne Thermal Emission and Reflection Radiometer (ASTER) that revisit every 16 days with swaths of 185 km and 60 km respectively providing reduced opportunities for cloud free imagery and precluding complete metropolitan region coverage [51,68]. Independent validation has found MODIS LST to obtain an average accuracy of −0.34 K (standard deviation 0.61 K) agreeing with the stated accuracy of 1 K and in most cases 0.5 K (Supplementary S2) [69]. Annual and seasonal; Summer (December–February), Autumn (March–May), Winter (June–August) and Spring (September–November) composites for coincident land cover data of MODIS LST diurnal and nocturnal data were generated on a per pixel basis through consideration of valid pixels only for 2003 and 2013.
3.3. Establishing a UHI Effect
Extraction of the underlying land cover from classified Landsat data per MODIS pixel permitted temperature sub pixel analysis [26]. Dominant land cover, representing >50% of a MODIS pixel, was compared against MODIS LST (Figure 3a).
The association between urban area and LST was established through the Surface UHI Intenisty (SUHII) which compares the temperature of urban surfaces to that of surfaces comprising of different land cover types [11,26,70,71]:
where is the surface temperature of a MODIS pixel defined as being urban and is the temperature of an alternative land cover type (e.g., forest) to be differenced from urban. This formula can be applied either as a global average or on a per pixel basis. The former takes the average temperature of all urban pixels compared to the average temperature of all comparison land cover pixels (e.g., forest) producing a single output value (e.g., [71]). The later considers the average temperature of the comparison land cover (e.g., forest) compared to that of each individual urban pixel, permitting a mapped distribution of the SUHII (e.g., [70]). In order to identify the mean variation of land cover temperature across the PMR in relation to low urban albedo, the SUHII was calculated as both a static average and between year SUHII difference on a per pixel basis. The former compares the average urban land cover temperature to each land cover type (e.g., urban compared to bare earth) for both 2003 and 2013 consistent with Haashemi et al. (2016) and Wang et al. (2015) [42,71]. The later compares the difference between the SUHII on a per pixel basis between 2003 and 2013, where the SUHII is the difference between individual urban (high and low albedo) and the average forest temperature for both 2003 and 2013, permitting identification of SUHII spatial-temporal variation.
4. Results
4.1. Spatial and Temporal Dynamics of UHI
4.1.1. Land Cover and LST
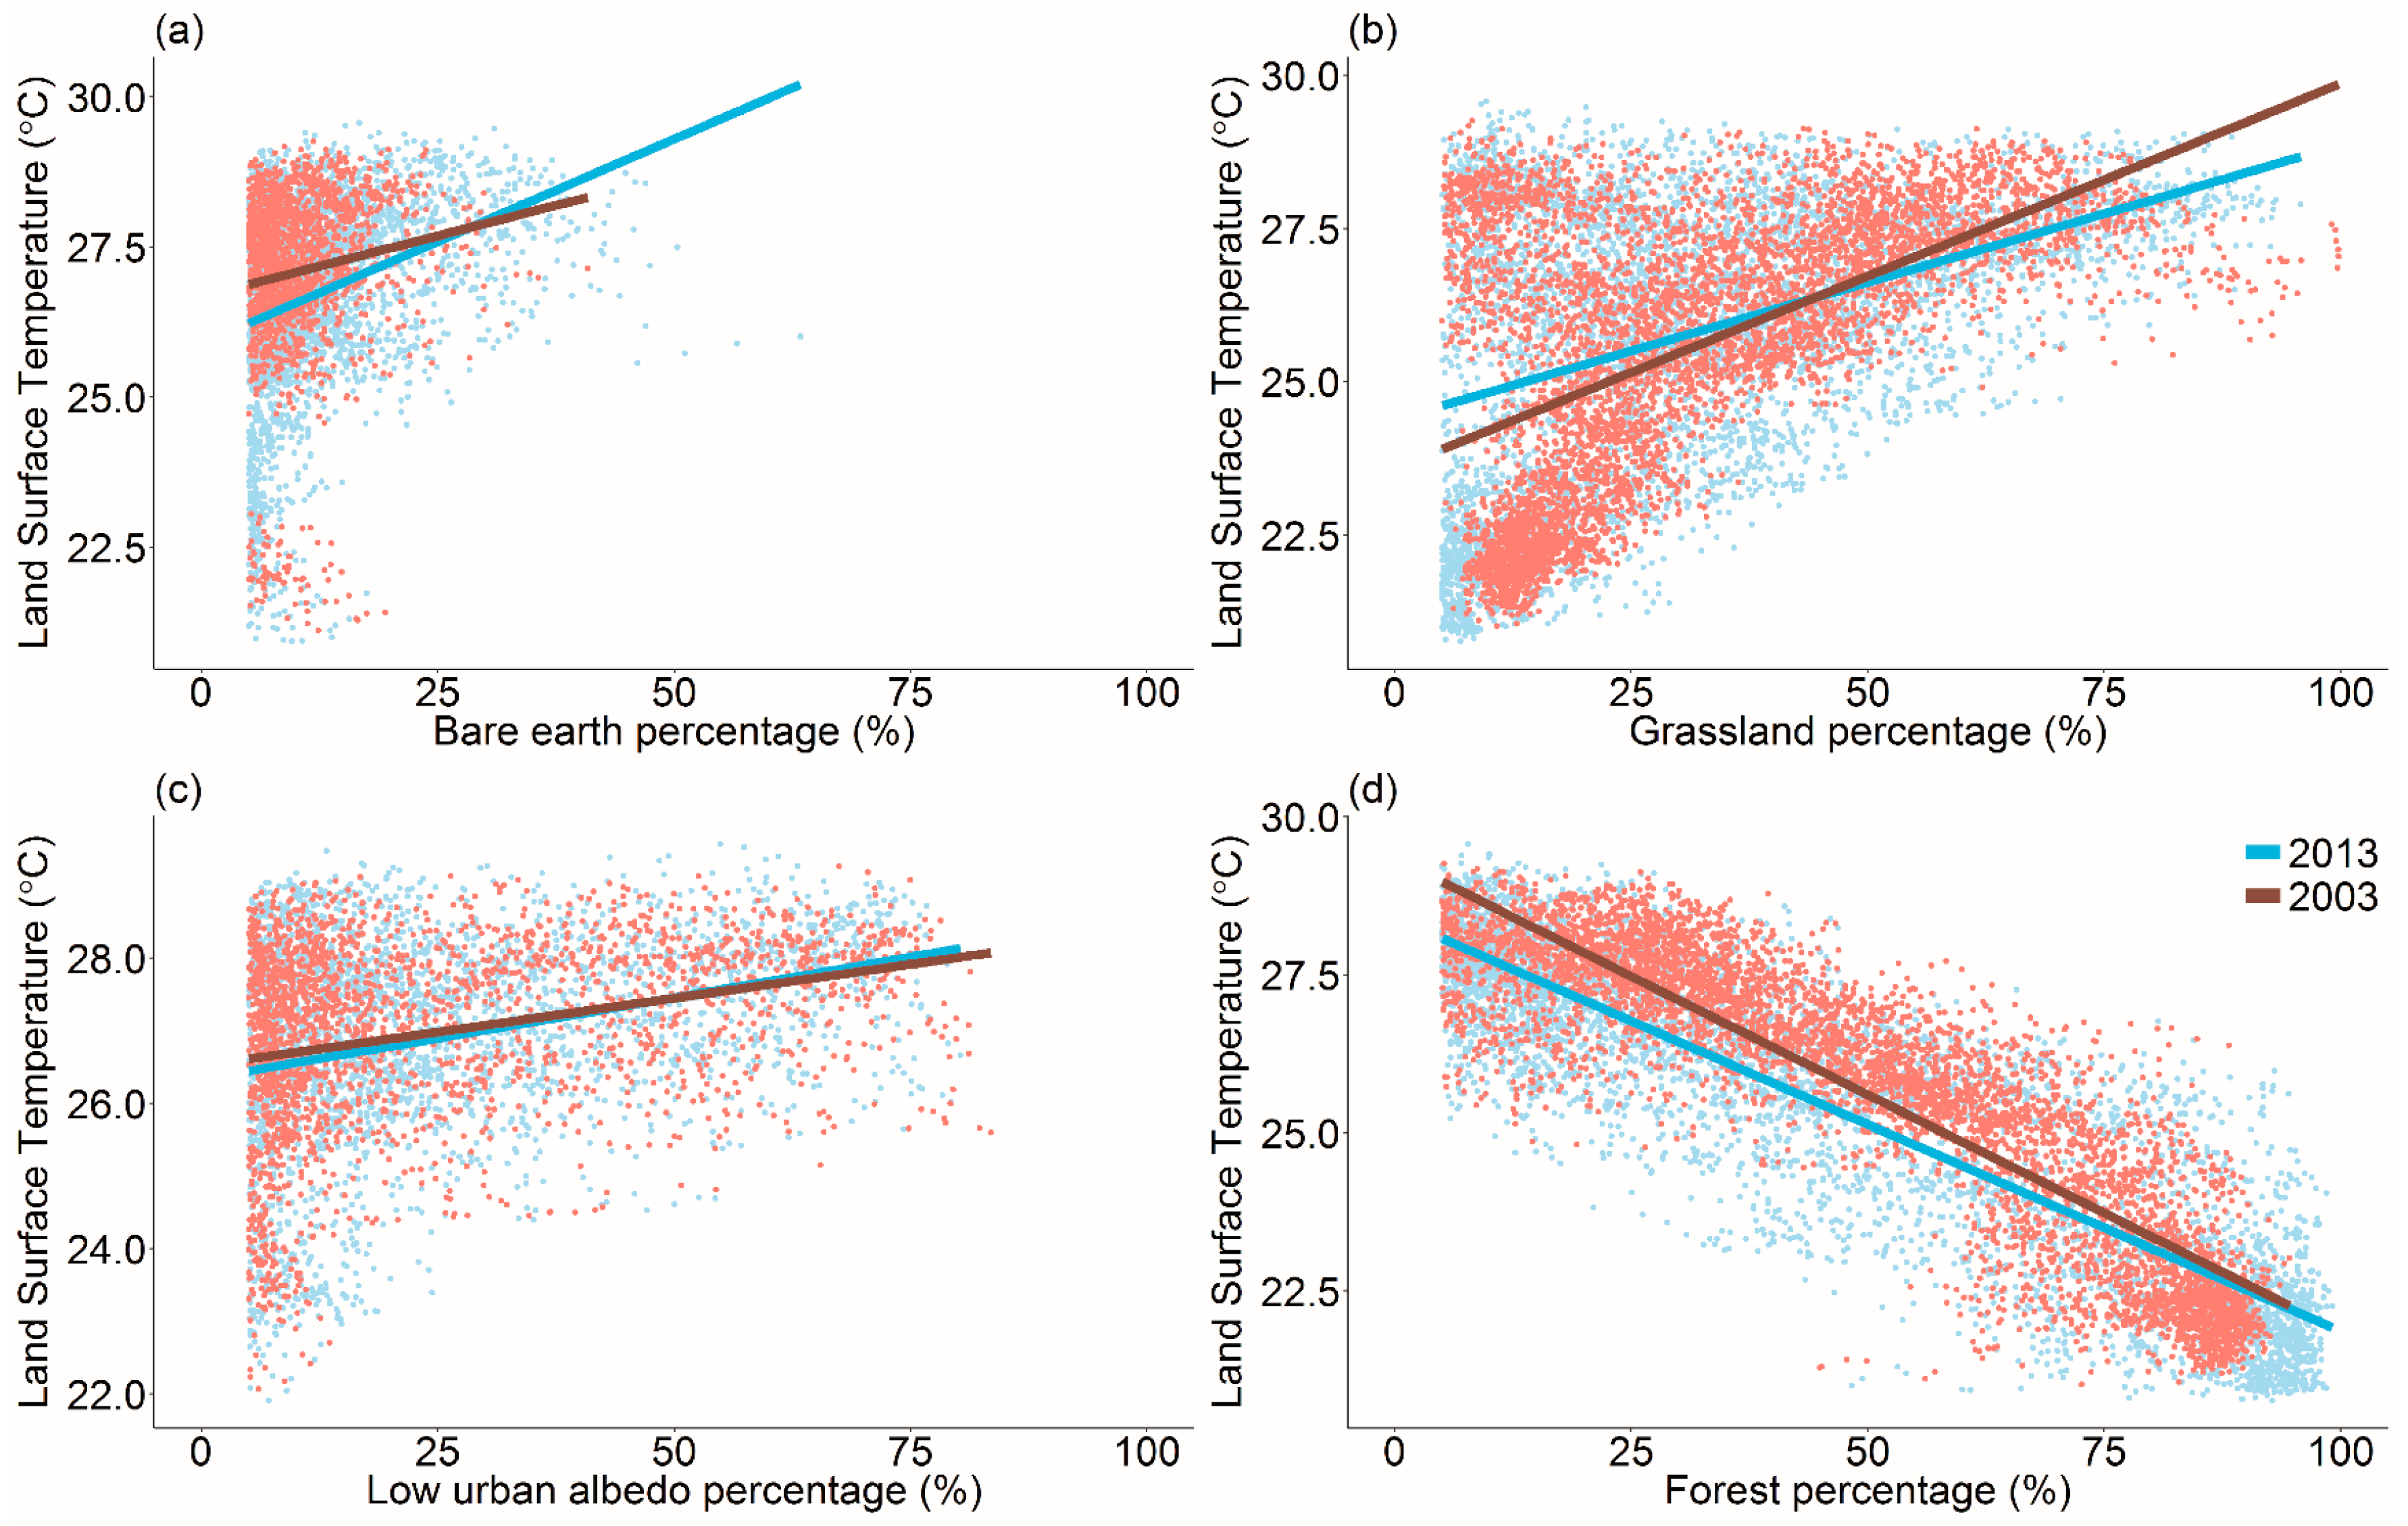
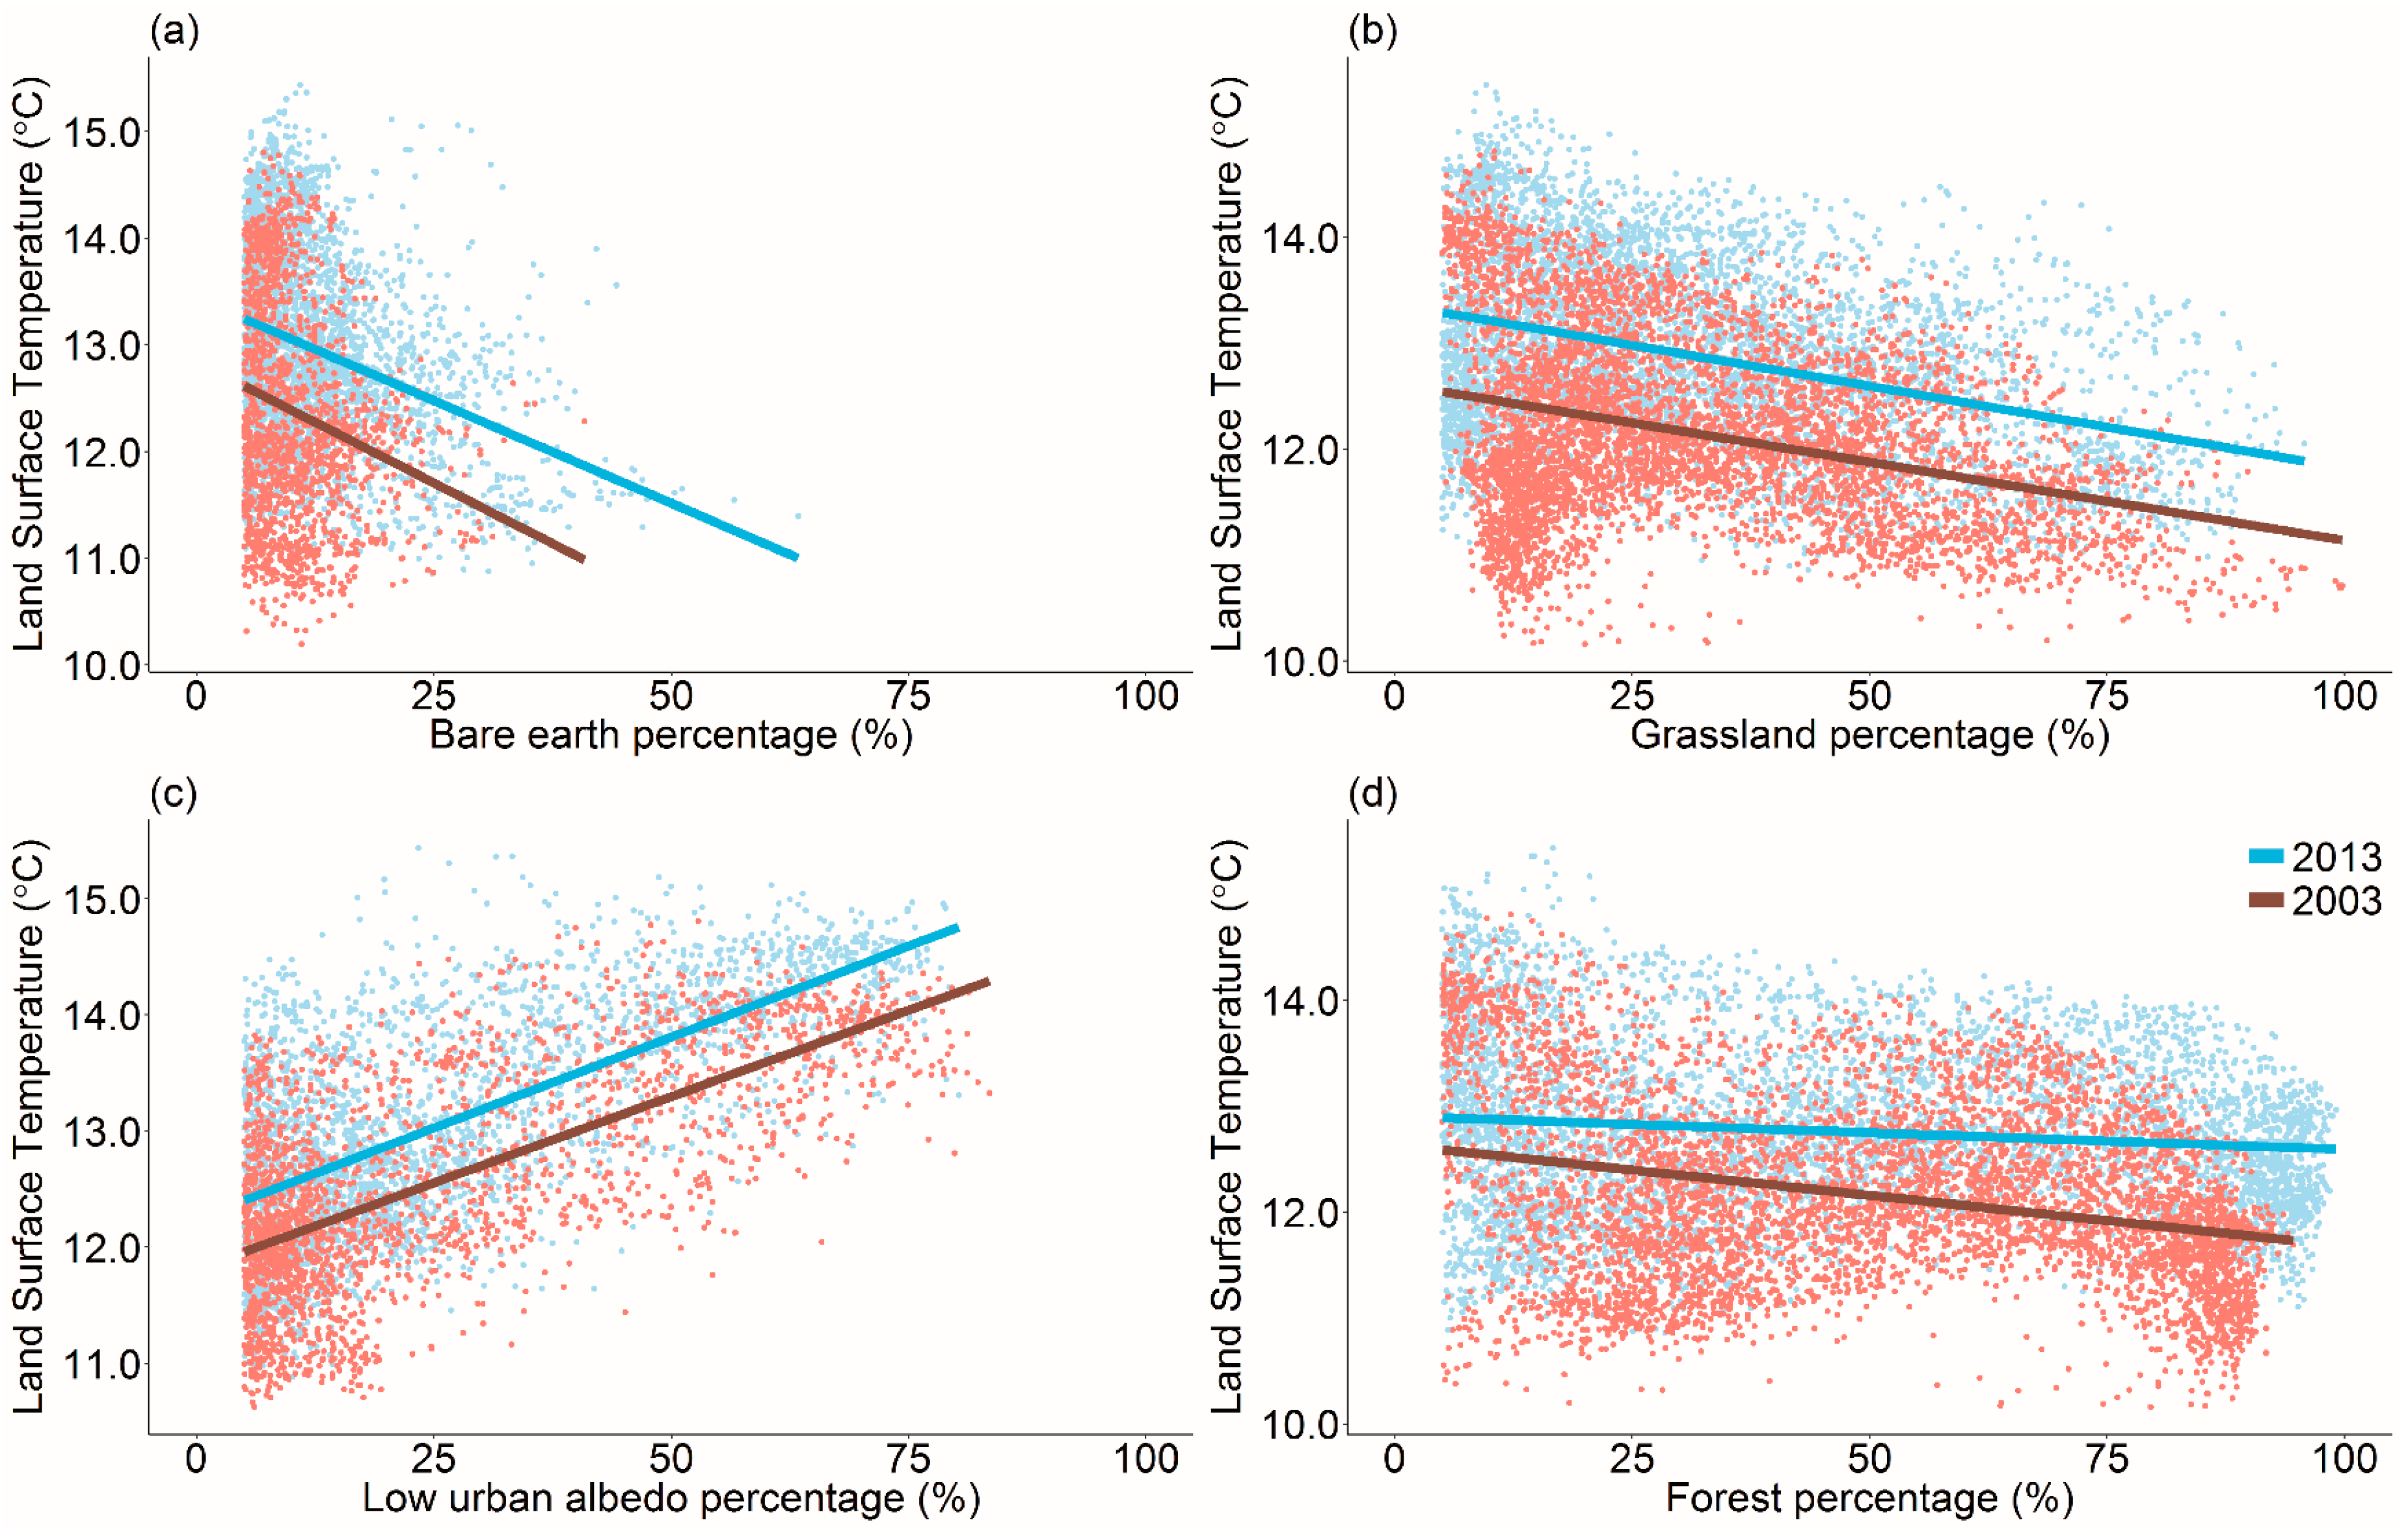
A comparison between land cover percentage for four land cover types (bare earth, grassland, low urban albedo and forest) and temperature exhibits the relationship between land cover and annual LST during the daytime (Figure 4) and nighttime (Figure 5). (Due to the limited number of high albedo urban (91) and water pixels (25) that dominate a MODIS pixel, these land cover types were excluded from this analysis.) Land cover percentage per MODIS pixel and temperature values were spatially averaged using a 3 × 3 kernel, with the linear regression trend subsequently calculated (e.g., [26,72]). Annual daytime variation indicates higher temperatures are associated with an increasing percentage of bare earth, grassland and low urban albedo, whilst additional forested percentage per MODIS pixel is associated with lower LST, consistent between 2003 and 2013 [26]. During nighttime all trends are reversed excluding low urban albedo land cover that is associated with higher LST. Data in 2013 was nocturnally warmer than 2003, however a three year averaging of later land cover-temperature association analysis reduced natural inter-annual variation (e.g., [26,48,66]).
4.1.2. Temporality of the SUHII
To further investigate the association between urban land cover and surface temperature, the average SUHII was computed for classified land cover data for both day and night LST by season and year for 2003 and 2013 (Table 1). Diurnal SUHII of low albedo urban was consistently most pronounced in comparison to forest land cover. This is likely due to vegetated areas increasing localised evapotranspiration that cools the local climate resulting in lower LST [51] (Table 1, Figure 4d). However, inter-annual seasonal variations were evident owing to the natural variation of land cover types (Supplementary S3).
Low urban albedo land cover is representative of suburban locations whilst high urban albedo cover is commonly located within the CBD and industrial sites [10,73]. The WAPC specify that the majority of new development within the PMR has occurred as low-density suburban growth, with low urban albedo land cover increasing 20.39 km2 compared to only 7.59 km2 of high urban albedo land cover between 2000 and 2015 [62]. Diurnal high albedo locations generate additional anthropogenic heat from population movement and economic activity whilst dormant suburban locations contain greater vegetation cover (associated with higher Normalised Difference Vegetation (NDVI) values) that shades and cools the environment (e.g., [28,74]). The SUHII is more prominent in spring and summer over autumn and winter across all land covers owing to temperature being tied to the seasonality of climatic factors (e.g., sunlight hours, precipitation and wind) (Supplementary S3) [75,76].
In comparison, all land covers (excluding water due to its high heat capacity) are nocturnally cooler than low urban albedo (Table 1) [55]. During nighttime the absence of solar radiation precludes evaporation and transpiration from vegetation (grassland and forest land covers); the latter due to stomata closure based on the inability to photosynthesize [77] (Figure 5d). Similarly, the low thermal inertia of bare earth and grassland results in rapid cooling of these land cover types [78] (Figure 5a,b). However, low urban albedo surfaces are able to absorb and retain a large proportion of the shortwave radiation during the daytime which is re-emitted at long wavelengths at nighttime, and provide the only land cover to consistently increase nocturnal LST with percentage coverage (Figure 5c) [79]. Contrastingly, high urban albedo surfaces reflect a greater proportion of solar radiation, negating thermal storage and resulting in lower nighttime surface temperatures [80]. In the absence of direct incoming solar radiation, the surface properties (e.g., heat capacity and thermal conductivity) and low cooling rate subdues the nocturnal effect of seasonality which is consistent with the findings of Peng et al. (2012) and Imhoff et al. (2010) who identified nocturnal seasonal amplitudes of less than 1 °C [27,48,81].
4.1.3. Spatiality of the SUHII
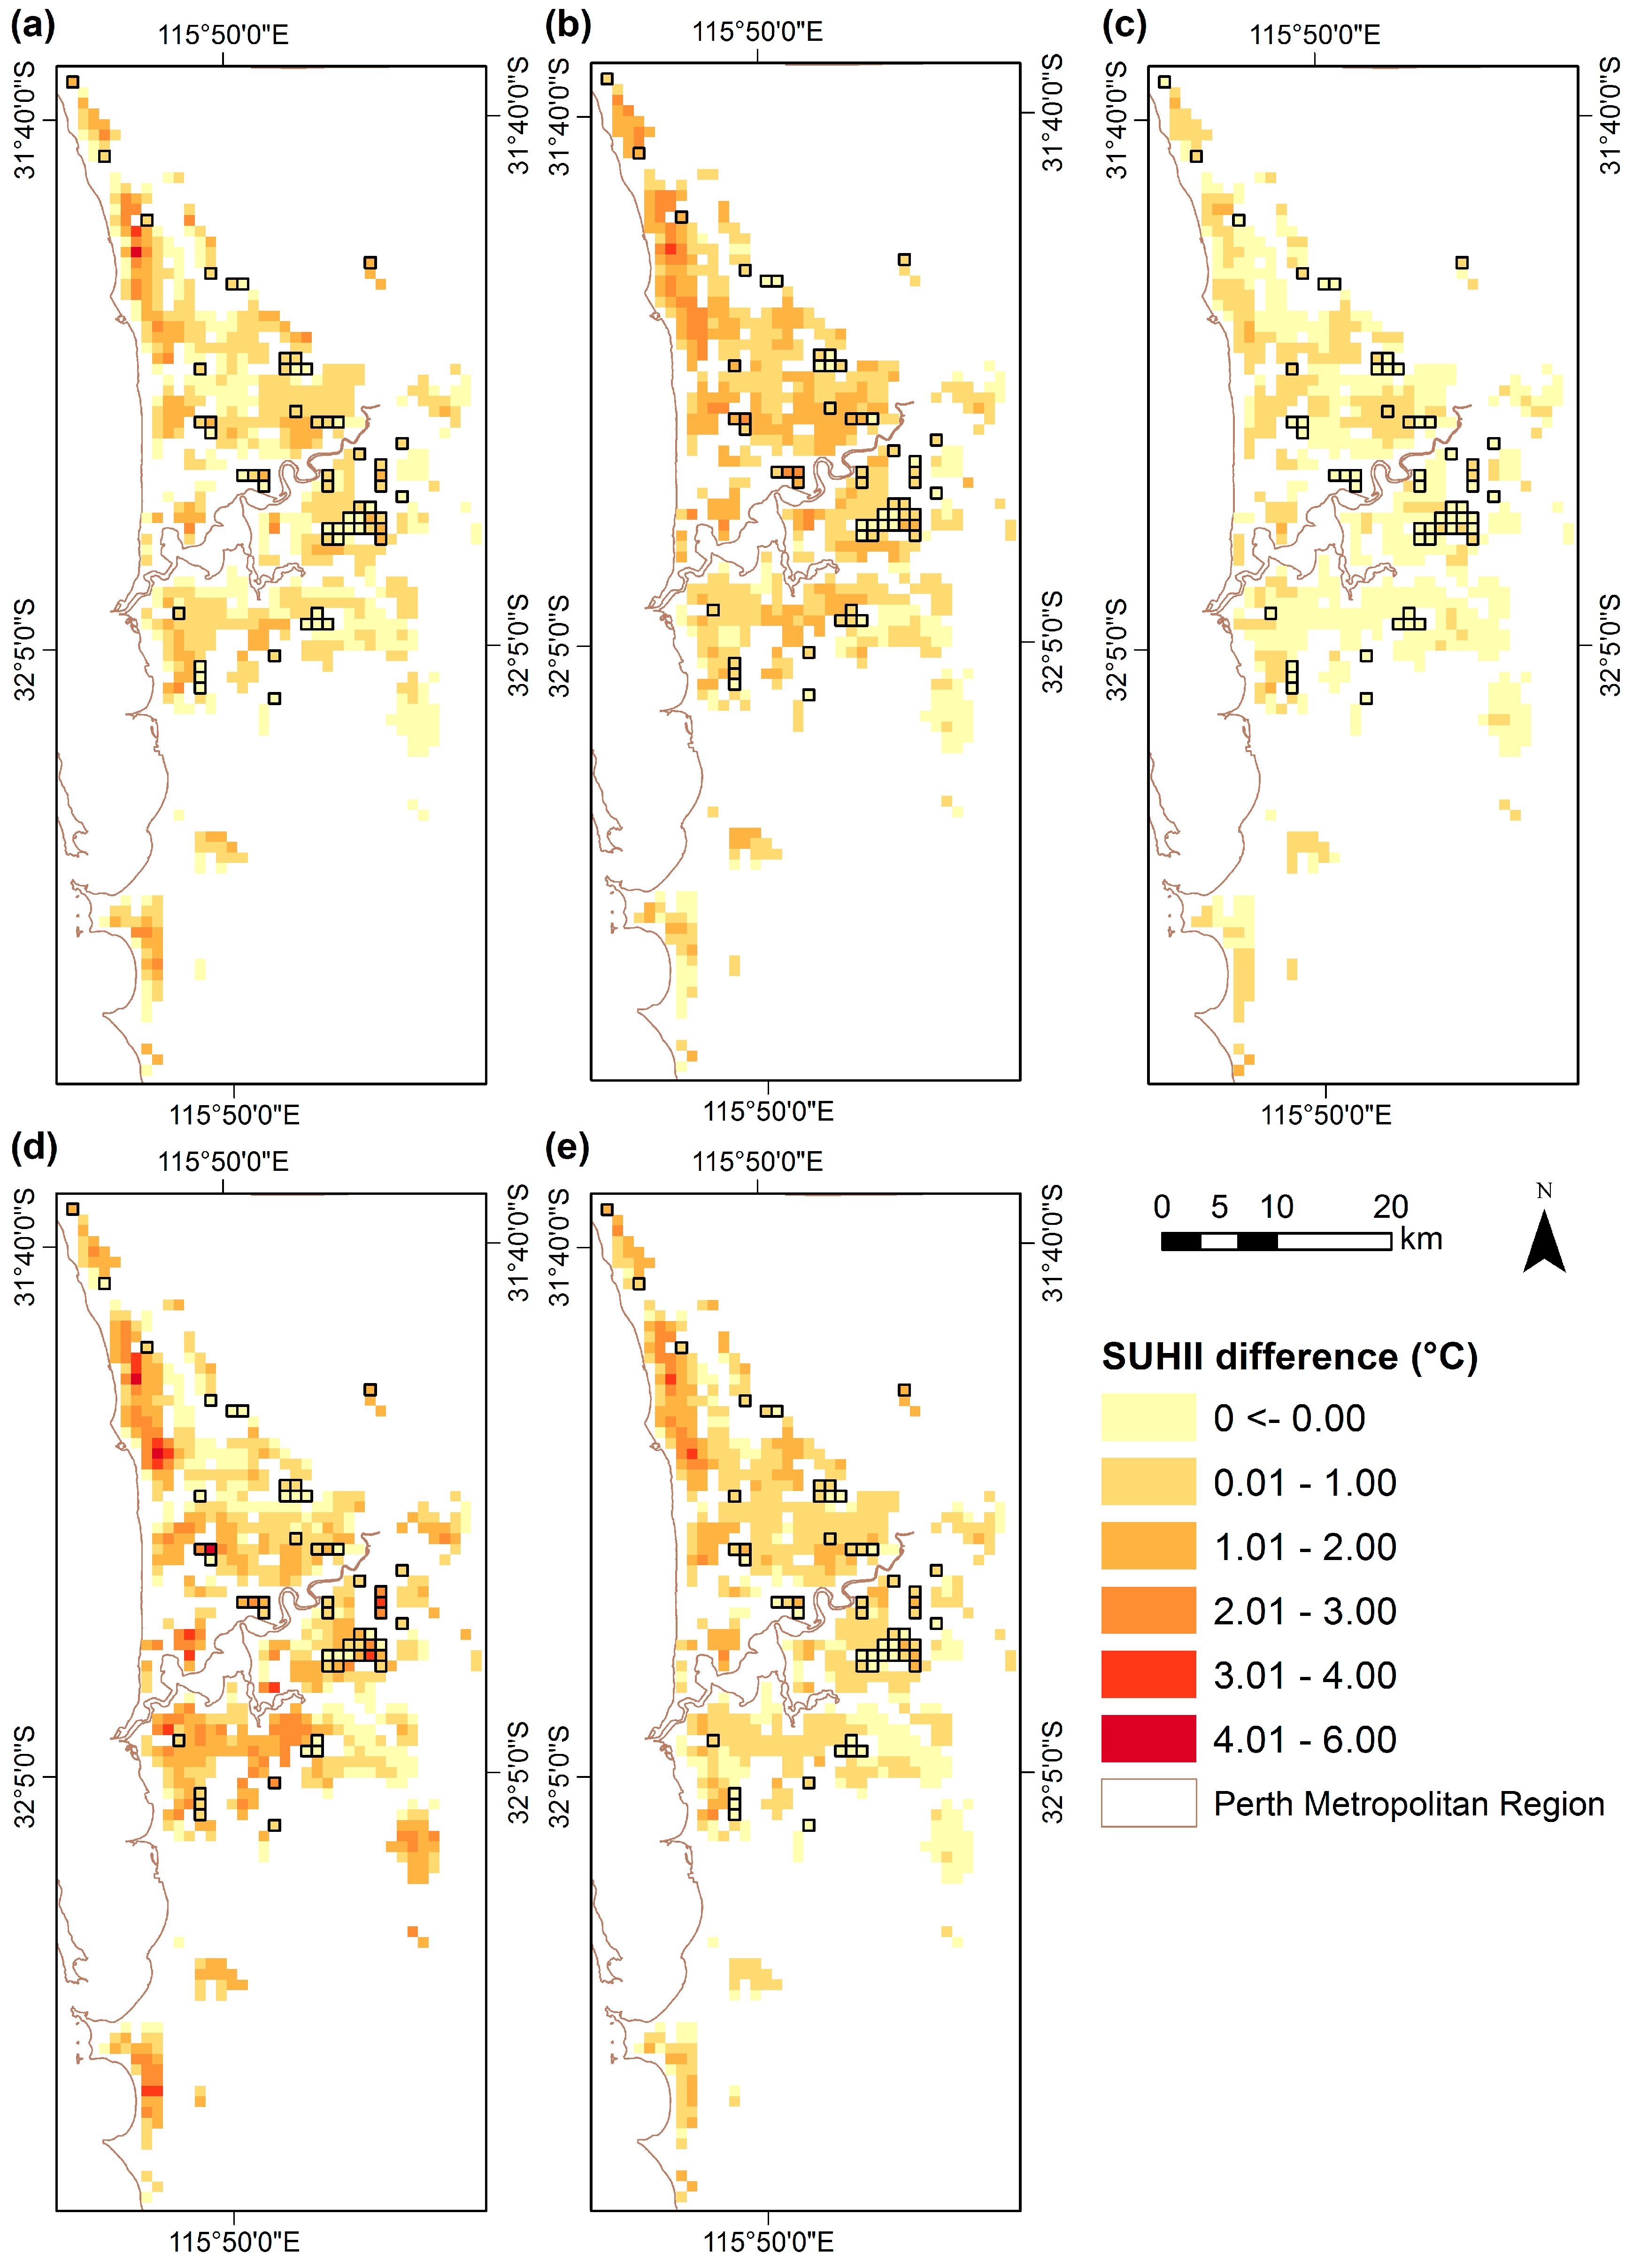
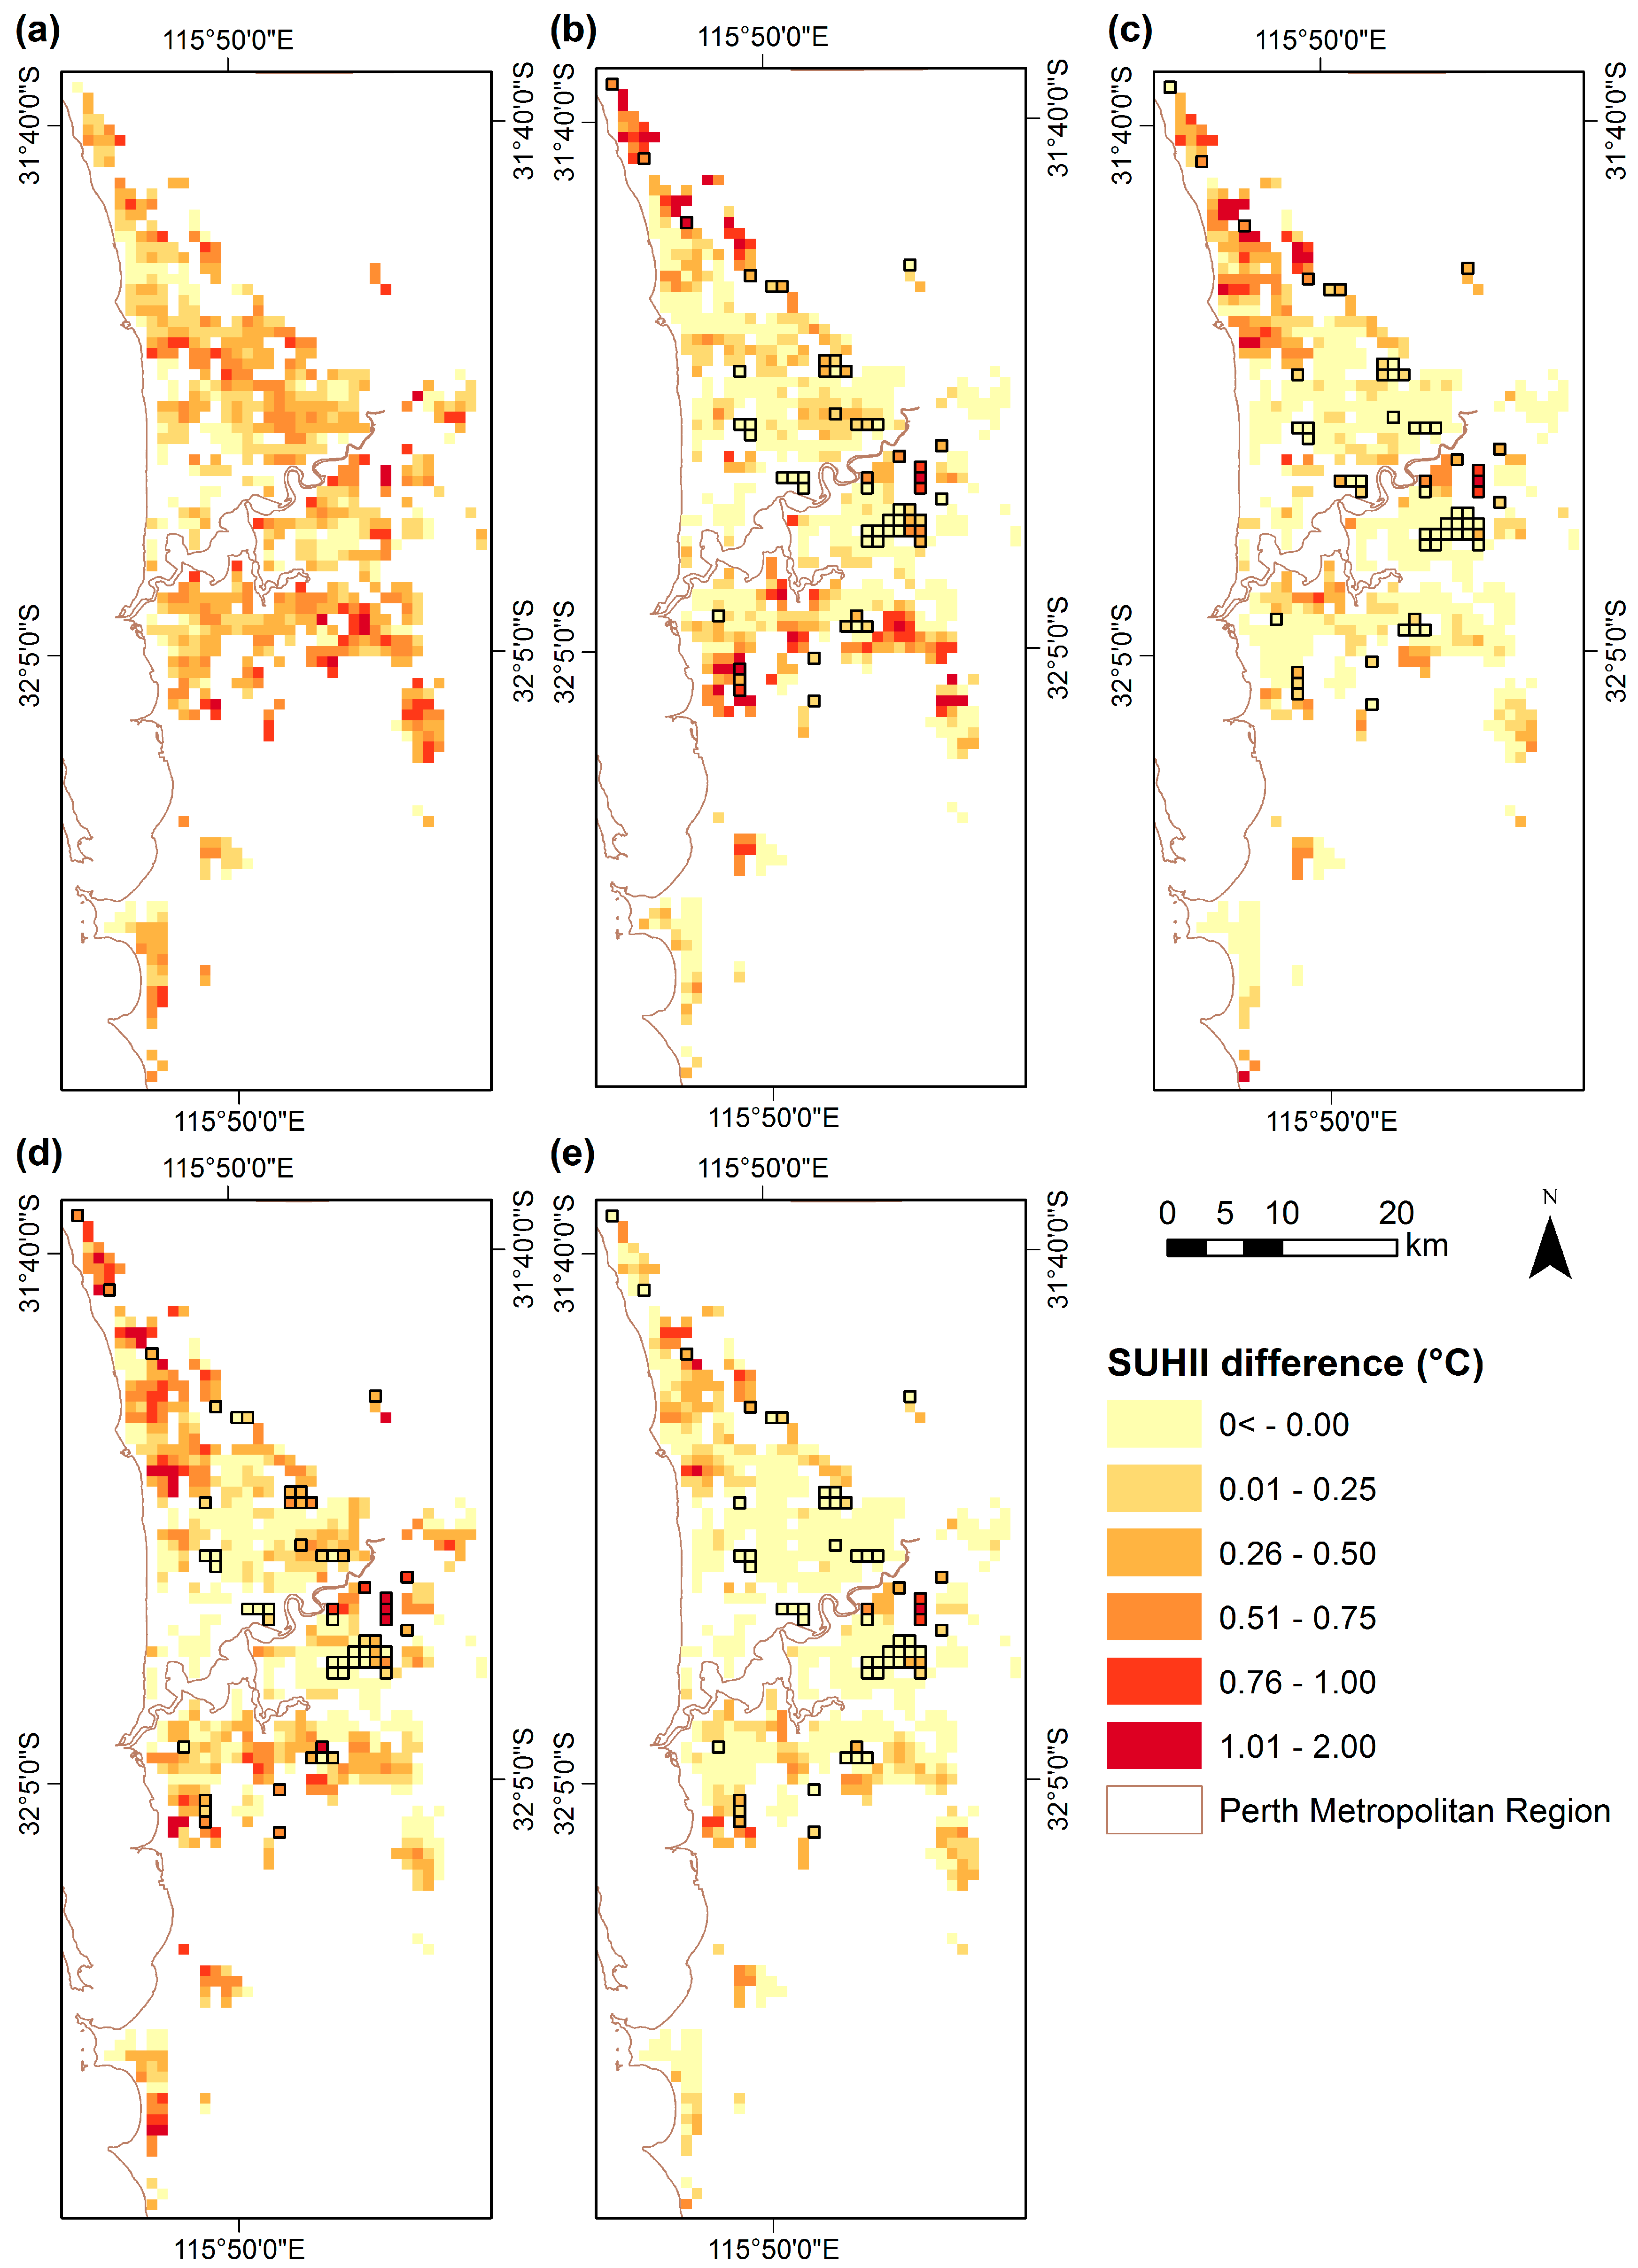
Spatially explicit differences are identified when considering a per pixel methodology in order to identify the change in SUHII between 2003 and 2013. The SUHII was computed for both 2003 and 2013, comparing both low and high urban albedo land cover to the average forest LST on a per pixel basis, with the per pixel SUHII then differenced for annual and seasonal day (Figure 6) and night (Figure 7) LST. The results indicate that the daytime SUHII difference has increased across the metropolitan region, whilst the nighttime SUHII difference is most pronounced in outer urban pixels associated with land cover change (Figure 2). Nevertheless analysis of this nature, commonly seen throughout UHI research (e.g., [49,70,82]) fails in practicality through sole specification of differences in land cover temperature. Consequently planning authorities are currently unable to base development decisions on appropriate land cover change that results in minimal SUHII exacerbation. In this regard the subsequent land cover change methodology permits credible targeted land cover change policies in effective mitigation of land cover change that is most associated with surface temperature.
4.2. Land Cover Change and LST
Dominant land cover change from 2003 to 2013 was compared to both the daytime and nighttime LST difference. Of the conversion from all land cover types investigated, forest to low urban albedo and grassland to bare earth produced the most pronounced daytime land cover surface temperature associations (Table 2). These observations were replicated with nighttime surface temperature, with the addition of grassland to forest land cover change (Table 2). Forest to low urban albedo consistently produced the highest nighttime temperature association (annual: 0.88 °C) across all seasons and that of daytime winter (0.58 °C) and spring (0.85 °C), with only bare earth to low urban albedo in summer (0.31 °C) and autumn (0.72 °C) obtaining higher values.
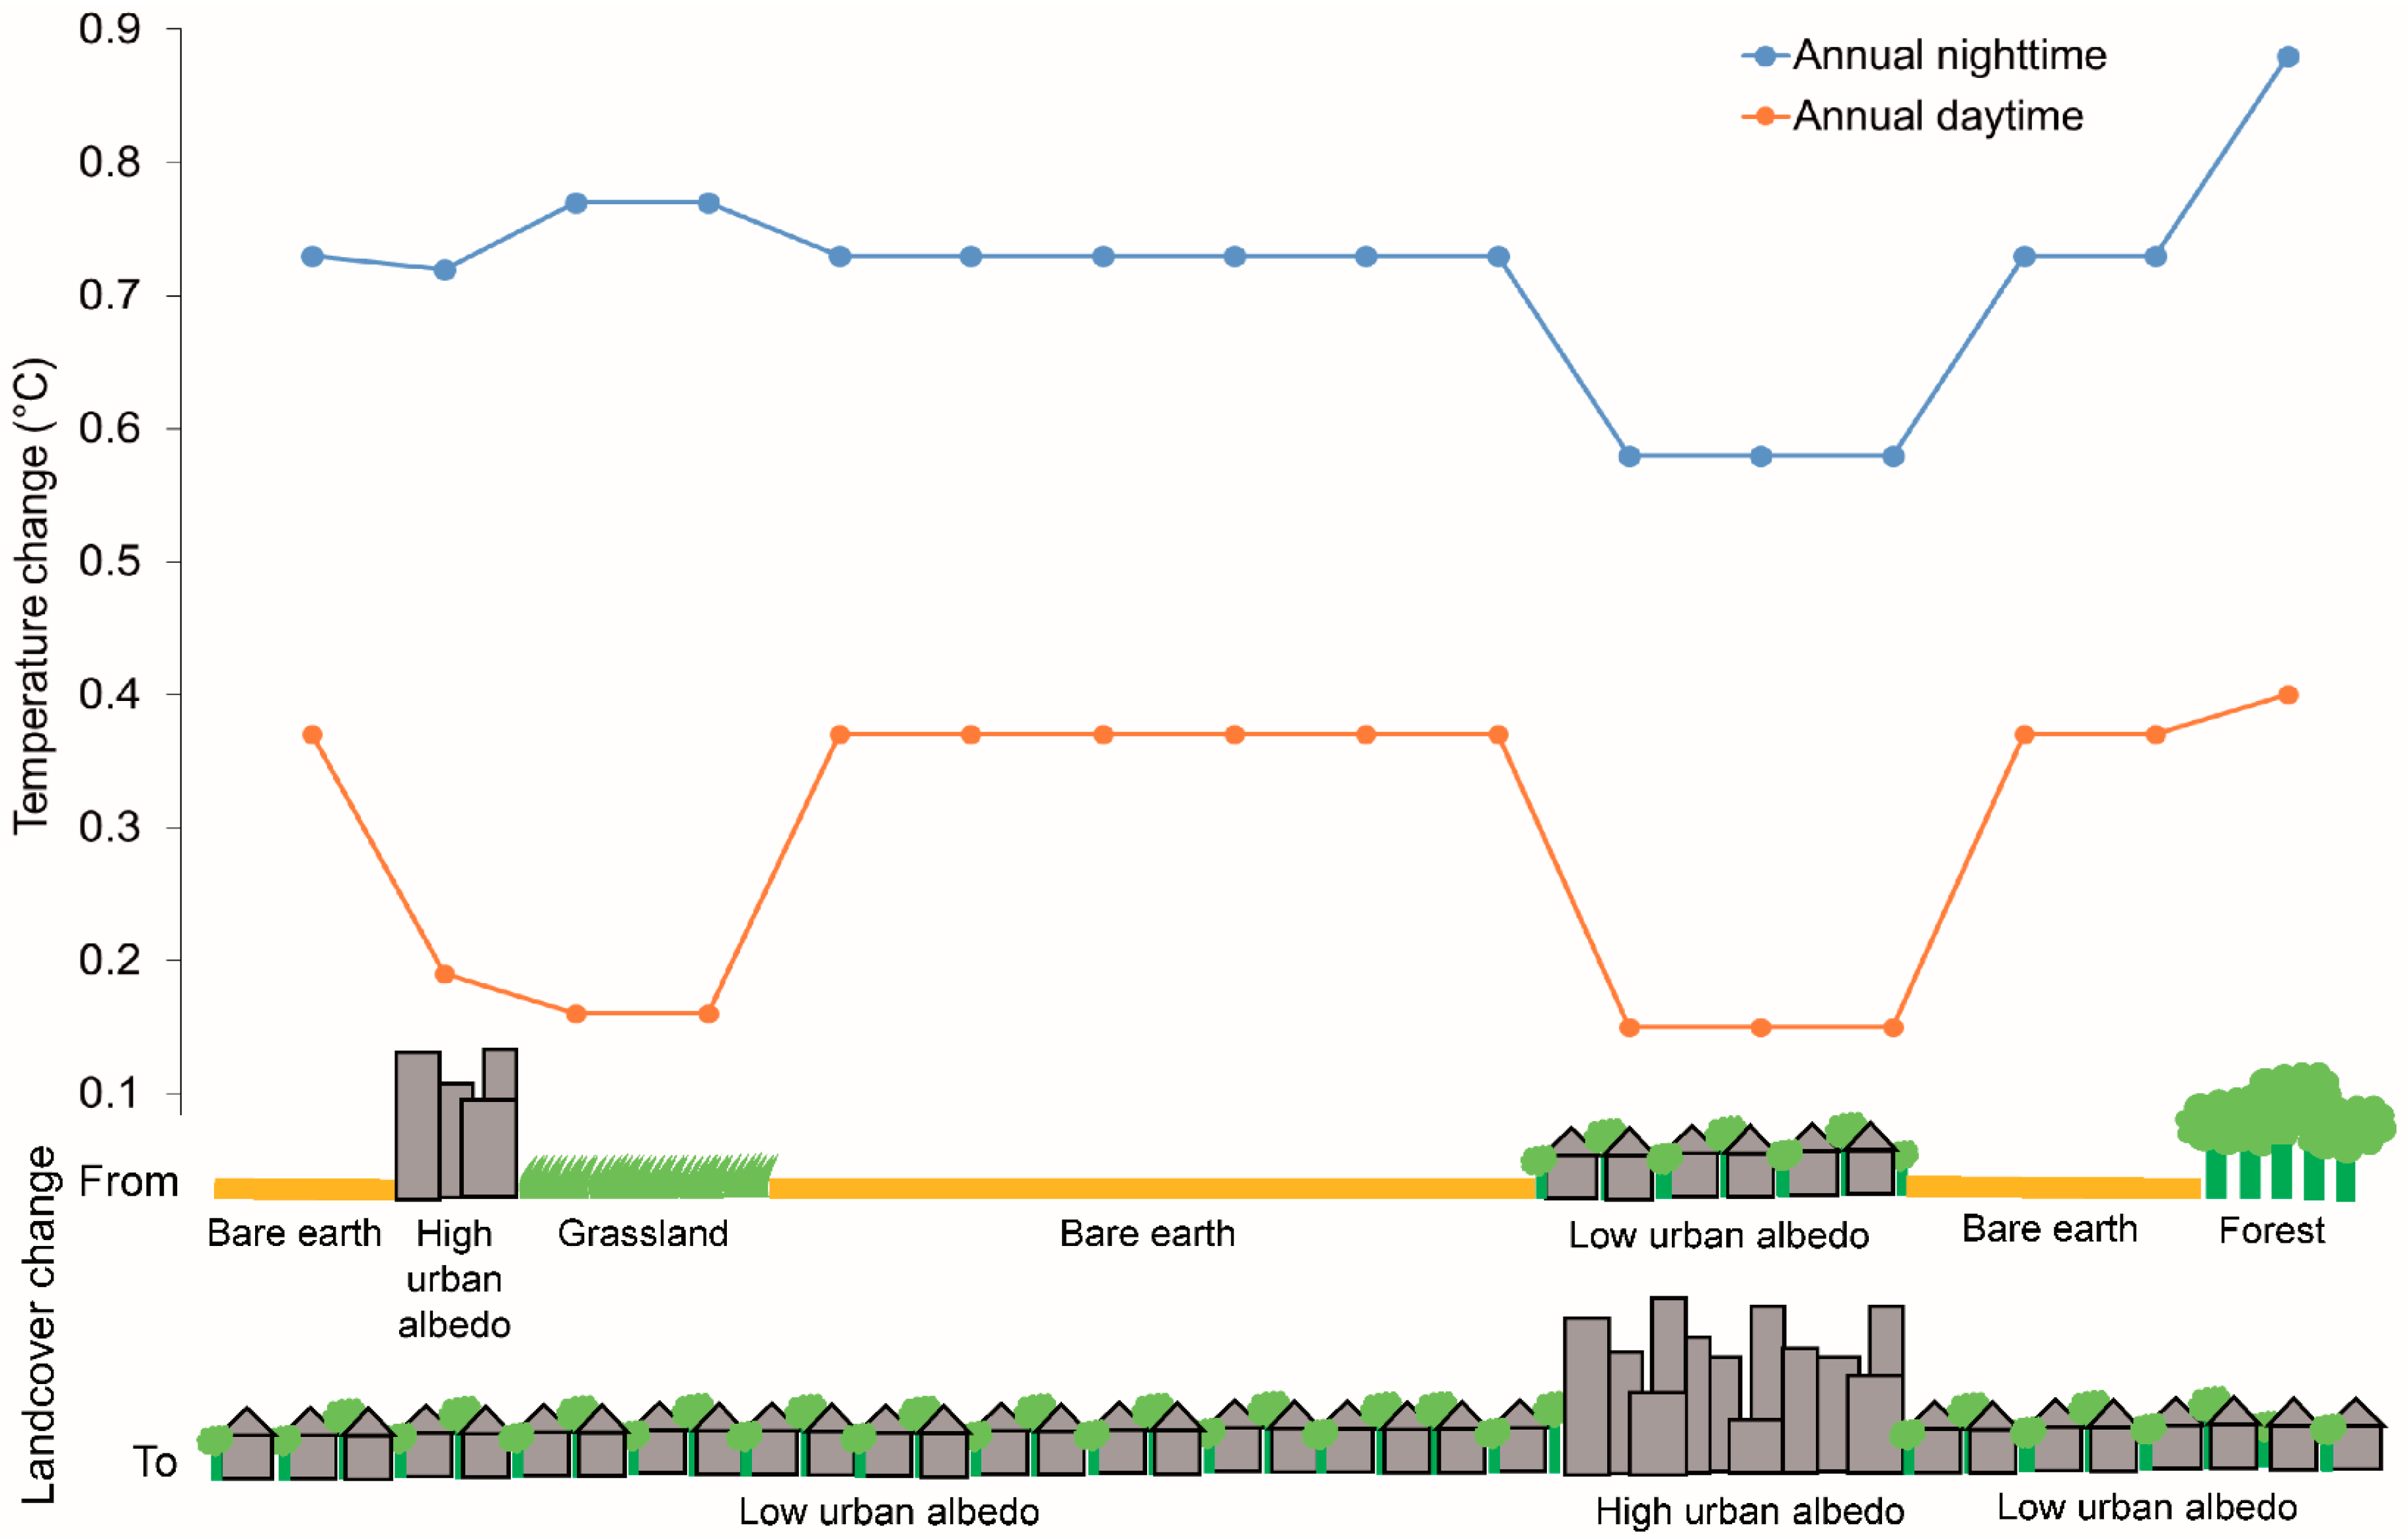
Figure 8 (cross section from Figure 1) illustrates a diverse range of land cover changes intersecting the PMR in an applied example. Here, land cover change from forest to low urban albedo produced the largest associated change in both daytime and nighttime temperature of 0.40 °C and 0.37 °C respectively. During daytime, change from bare earth to low urban albedo produced the second most associated temperature change (0.37 °C), whilst during nighttime conversion from grassland produced a marginally higher average value of 0.77 °C (bare earth 0.73 °C). The least overall land cover associated temperature change was from low urban albedo to high urban albedo, with values of 0.19 °C and 0.72 °C for daytime and nighttime respectively.
5. Discussion
Identifying the impact of land cover change on the UHI effect is essential in ensuring sustainable and strategic future planning decisions and alignment with global (e.g., C40 CCLG, 2030 sustainable development goals and CRF), national (e.g., Cooperative Research Centre-Low Carbon Living (CRC-LCL)) and other metropolitan frameworks (e.g., Tokyo, New York and London) [11,12,20,21,22,23,24,32,63]. In this study, SUHII analysis identified higher low urban albedo daytime temperatures in comparison to water and forest, whilst low urban albedo was persistently warmer at nighttime than all other land covers, consistent with results from Jingjintang, China [19,30]. Our research has advanced UHI analysis to explicitly establish the association between land cover change and LST.
The effects of urbanisation on LST to enhance understanding of the urban climate are commonly investigated as the difference in temperature between land cover types in both temporally static [49,50] and dynamic studies [30,52,53,54,55]. Whilst the latter considers changes in urban area over time, both can simplistically divide land cover into urban and non-urban [83]. The land cover change methodology implemented here spatially disaggregates metropolitan SUHII values permitting localised intra-urban land cover-temperature associations as opposed to singular (e.g., Table 2) and spatially explicit values (e.g., Figure 6 and Figure 7). The association between land cover change and temperature directly influences policy applications through refinement of future development zones that will minimise exacerbation of the UHI effect. Information of this sort is critical in future land use planning facilitating improved UHI management and future sustainability.
Here we have shown the association between land cover change and LST between 2003 and 2013 across the PMR, with conversion of grassland to bare earth associated with the maximum average annual daytime increase in LST (0.44 °C) based on an average increase of 24.86% per MODIS pixel and 73.87 km2 over the complete metropolitan region; the largest land cover change type. Of all conversion to low urban albedo land cover originating from forest obtained the largest associated increased in LST whilst conversion from grassland had the lowest overall association for both low and high urban albedo. While the coarse spatial resolution of MODIS LST negates identification of exact and specific land cover associated UHI change, analysis of this nature overcomes temporal and swath limitations of ASTER and Landsat temperature data for complete metropolitan region coverage.
Integration of EO data such as the land cover change approach implemented here permits quantification of areal land cover change that directly influences land surface temperature whilst considering urban heterogeneity (e.g., high and low urban albedo) enabling future sustainable development mitigating negative socio-environmental outcomes of the UHI effect [15,16,18,57,84,85,86,87,88]. For example, Coutts et al. (2016) advised a local Melbourne municipality on locations of thermal hotspots from EO data for targeted cooling through urban greening [89]. Using EO derived land cover data in this manner aids in understanding the dynamics of the urban environment that alter local and regional climate and increase vulnerability of city systems in line with the CRF [33]. This is particularly important owing to the range of health, energy, water and economic savings that can be attributed to an increase in temperature of only 1 °C; such as an observed monthly increase of 290 gallons in water per single family household in the Phoenix metropolitan area and overall estimated economic expenditure of $300 million (AUD) per annum by the city of Melbourne in the first global UHI economic quantification [18,19].
As for the PMR, ‘Perth and Peel @ 3.5 million’, the strategic metropolitan land use planning framework for local planning schemes describes the unprecedented levels of urban expansion within the region [62]. Future urban development is guided by Directions 2031 [90] amending the Metropolitan Region Scheme (MRS) and local planning schemes [91,92,93,94]. Within these guiding planning documents only ‘Perth and Peel @ 3.5 million’ lists reduction of the UHI in current urban areas as one of 50 implementing strategies in achieving the Directions 2031 vision themes of a liveable, prosperous, accessible, sustainable and responsible future [62,90]. Inclusion of temperature EO data would permit identification of sustainable future urban development locations (e.g., land cover types) that would minimise the UHI impact. The WAPC aims to achieve 47% of future development as infill by 2050, refinement of current or proposed development zones based on land cover change with minimal temperature association such as grassland would mitigate exacerbation of the UHI effect. Consideration of land cover associated temperature change in this manner would contribute to both the sustainability and improvement of current and future land supply key strategies specified within the local Directions 2031 visions whilst aligning with national (CRC-LCL) and international (C40 CCLG, 2030 sustainable development goals and CRF) frameworks [24,32,63,90].
The freely available EO data and reproducible methodology implemented within this research could be applied to other global cities in credibly mitigating future unsustainable land cover changes which exacerbate temperature differences and associated socio-economic consequences. This is especially pertinent to developing countries that frequently have broader planning considerations including environmental hazards, amenity centers and current infrastructure, permitting improved decision making whilst maximising often limited financial resources [73,95,96].
6. Conclusions
Quantification of urbanisation induced land cover change and associated temperature is essential in order to sustainably expand global cities in accommodating the predicted 2.5 billion additional urban dwellers by 2050. Current temperature UHI studies ignore the complexity of surface temperature dynamics producing singular or per pixel values comparing temperature differences between urban and other land cover types for complete metropolitan areas resulting in inappropriate policy incorporation. Landsat data provides the longest time series of medium resolution imagery to monitor urban growth, whilst MODIS obtains the longest time series of daily surface temperature data covering complete metropolitan regions. In this research, comparison between land cover change and MODIS temperature data for the PMR indicates that change from grassland to bare earth is associated with the greatest overall annual daytime increase in temperature (0.44 °C), whilst conversion from forest to low urban albedo is associated with the greatest nighttime temperature change (0.88 °C) and greatest daytime change (0.40 °C) in conversion to a low urban albedo surface. Whilst these changes may be context specific (to the PMR) the approach presented provides a novel advancement for investigating spatial and temporal intra-urban effects in cities around the world.
Incorporating land cover change UHI considerations into future development decisions is important in order to reduce exacerbation of temperature that has been associated with poor health outcomes, increased energy and water usage and economic expenditure. Recently launched and future EO sensors such as the Visible Infrared Imaging Radiometer Suite (VIIRS) on board the Suomi National Polar-orbiting Partnership (SNPP) satellite will further enhance land cover change analysis. VIIRS will extend the global MODIS LST record through daily data collection at an improved spatial resolution (750 m) permitting further optmisation of land cover change for sustainable city planning in mitigating socio-economic issues associated with poorly planned urban development.
Supplementary Materials
The following are available online at www.mdpi.com/2413-8851/1/4/38/S1. Further urban heat island detail, MODIS land surface temperature detail and seasonal land cover variation are outlined in the Supplementary Material. The classified Landsat data reported in this paper are archived at the Pangea open access data publisher for earth and environmental science (DOI: 10.1594/PANGAEA.871017). S1. Urban Heat Island concept, S2. MODIS Land Surface Temperature data, S3. Seasonal land cover temperature variation.
Acknowledgments
This work was supported by the Economic and Social Research Council (grant number ES/J500161/1). We would like to thank the University of Western Australia for continued collaborative support, the World University Network (WUN) for facilitating institutional visits, the United States Geological Survey (USGS) for providing Landsat surface reflectance imagery and the Goddard Space Flight Center for MODIS land surface temperature imagery.
Author Contributions
All authors assisted in conceiving and designing the experiments lead by Andrew MacLachlan; Andrew MacLachlan performed the experiments and analysed the data; Eloise Biggs, Gareth Roberts and Bryan Boruff contributed materials/analysis tools; Andrew MacLachlan wrote the paper with input and revisions from Eloise Biggs, Gareth Roberts and Bryan Boruff.
Conflicts of Interest
The authors declare no conflict of interest.
References
- United Nations, Department of Economic and Social Affairs. World Urbanization Prospects: The 2014 Revision, Highlights. 2014. Available online: https://esa.un.org/unpd/wup/publications/files/wup2014-report.pdf (accessed on 1 December 2017).
- United Nations. The World’s Cities in 2016: Data Booklet. 2016. Available online: http://www.un.org/en/development/desa/population/publications/pdf/urbanization/the_worlds_cities_in_2016_data_booklet.pdf (accessed on 1 December 2017).
- Seto, K.C.; Güneralp, B.; Hutyra, L.R. Global forecasts of urban expansion to 2030 and direct impacts on biodiversity and carbon pools. Proc. Natl. Acad. Sci. USA 2012, 109, 16083–16088. [Google Scholar] [CrossRef] [PubMed]
- Angel, S.; Parent, J.; Civco, D.L.; Blei, A.; Potere, D. The dimensions of global urban expansion: Estimates and projections for all countries, 2000–2050. Prog. Plan. 2011, 75, 53–107. [Google Scholar] [CrossRef]
- Zhou, D.; Zhang, L.; Hao, L.; Sun, G.; Liu, Y.; Zhu, C. Spatiotemporal trends of urban heat island effect along the urban development intensity gradient in China. Sci. Total Environ. 2016, 544, 617–626. [Google Scholar] [CrossRef] [PubMed]
- Cai, Y.; Zhang, H.; Zheng, P.; Pan, W. Quantifying the Impact of Land use/Land Cover Changes on the Urban Heat Island: A Case Study of the Natural Wetlands Distribution Area of Fuzhou City, China. Wetlands 2016, 36, 285–298. [Google Scholar] [CrossRef]
- Howard, L. The Climate of London; Cambridge University Press: London, UK, 1988. [Google Scholar]
- Hu, L.; Brunsell, N.A. A new perspective to assess the urban heat island through remotely sensed atmospheric profiles. Remote Sens. Environ. 2015, 158, 393–406. [Google Scholar] [CrossRef]
- Xie, Q.; Zhou, Z. Impact of Urbanization on Urban Heat Island Effect Based on TM Imagery in Wuhan, China. Environ. Eng. Manag. J. 2015, 14, 647–655. [Google Scholar]
- MacLachlan, A.; Biggs, E.; Roberts, G.; Boruff, B. Urban Growth Dynamics in Perth, Western Australia: Using Applied Remote Sensing for Sustainable Future Planning. Land 2017, 6, 9. [Google Scholar] [CrossRef]
- Rizwan, A.M.; Dennis, L.Y.C.; Liu, C. A review on the generation, determination and mitigation of Urban Heat Island. J. Environ. Sci. 2008, 20, 120–128. [Google Scholar] [CrossRef]
- Revi, A.; Satterthwaite, D.E.; Aragón-Durand, F.; Corfee-Morlot, J.; Kiunsi, R.; Pelling, M.; Roberts, D.; Solecki, W. Climate Change 2014: Impacts, Adaptation, and Vulnerability. Part A: Global and Sectoral Aspects. Contribution of Working Group II to the Fifth Assessment Report of the Intergovernmental Panel on Climate Change. 2014. Available online: https://kclpure.kcl.ac.uk/portal/en/publications/towards-transformative-adaptation-in-cities%280fabac74-a5fc-4956-b551-f9d391ec363c%29/export.html (accessed on 1 December 2017).
- Yuan, F.; Bauer, M.E. Comparison of impervious surface area and normalized difference vegetation index as indicators of surface urban heat island effects in Landsat imagery. Remote Sens. Environ. 2007, 106, 375–386. [Google Scholar] [CrossRef]
- Schwarz, N.; Schlink, U.; Franck, U.; Großmann, K. Relationship of land surface and air temperatures and its implications for quantifying urban heat island indicators—An application for the city of Leipzig (Germany). Ecol. Indic. 2012, 18, 693–704. [Google Scholar] [CrossRef]
- Goggins, W.B.; Chan, E.Y.Y.; Ng, E.; Ren, C.; Chen, L. Effect modification of the association between short-term meteorological factors and mortality by urban heat islands in Hong Kong. PLoS ONE 2012, 7, e38551. [Google Scholar] [CrossRef] [PubMed]
- Smargiassi, A.; Goldberg, M.S.; Plante, C.; Fournier, M.; Baudouin, Y.; Kosatsky, T. Variation of daily warm season mortality as a function of micro-urban heat islands. J. Epidemiol. Commun. Health 2009, 63, 659–664. [Google Scholar] [CrossRef] [PubMed]
- Lowe, S.A. An energy and mortality impact assessment of the urban heat island in the US. Environ. Impact Assess. Rev. 2016, 56, 139–144. [Google Scholar] [CrossRef]
- Guhathakurta, S.; Gober, P. The impact of the Phoenix Urban Heat Island on residential water use. J. Am. Plan. Assoc. Am. Plan. Assoc. Chicagti. 2007, 73, 317–329. [Google Scholar] [CrossRef]
- AECOM Australia. Economic Assessment of the Urban Heat Island Effect. 2012. Available online: https://www.melbourne.vic.gov.au/SiteCollectionDocuments/eco-assessment-of-urban-heat-island-effect.pdf (accessed on 1 December 2017).
- Mayor of London. London’s Response to Climate Change. 2016. Available online: https://www.london.gov.uk/what-we-do/planning/london-plan/current-london-plan/london-plan-chapter-five-londons-response (accessed on 1 December 2017).
- Mayor Bill de Blasio. Transforming New York City’s Buildings for a Low-Carbon Future. 2014. Available online: https://www1.nyc.gov/assets/sustainability/downloads/pdf/publications/TWGreport_04212016.pdf (accessed on 1 December 2017).
- Governor of Tokyo. Tokyo Metropolitan Environmental Master Plan. 2008. Available online: https://www.kankyo.metro.tokyo.jp/en/attachement/Master-Plan%28Outline%29.pdf (accessed on 1 December 2017).
- C40 Cities. Good Practice Guide: Cool Cities. Available online: http://c40-production-images.s3.amazonaws.com/good_practice_briefings/images/4_C40_GPG_CCN.original.pdf?1456788797 (accessed on 1 December 2017).
- C40Cities. Climate Action in Megacities: C40 Cities Baseline and Opportunities; ARUP: London, UK, 2011. [Google Scholar]
- Cheval, S.; Dumitrescu, A. The summer surface urban heat island of Bucharest (Romania) retrieved from MODIS images. Theor. Appl. Climatol. 2014, 631–640. [Google Scholar] [CrossRef]
- Hu, Y.; Jia, G.; Hou, M.; Zhang, X.; Zheng, F.; Liu, Y. The cumulative effects of urban expansion on land surface temperatures in metropolitan Jingjintang, China Yonghong. J. Geophys. Res. Atmos. Res. 2015, 9932–9943. [Google Scholar] [CrossRef]
- Tran, H.; Uchihama, D.; Ochi, S.; Yasuoka, Y. Assessment with satellite data of the urban heat island effects in Asian mega cities. Int. J. Appl. Earth Obs. Geoinf. 2006, 8, 34–48. [Google Scholar] [CrossRef]
- Fabrizi, R.; Bonafoni, S.; Biondi, R. Satellite and ground-based sensors for the Urban Heat Island analysis in the city of Rome. Remote Sens. 2010, 2, 1400–1415. [Google Scholar] [CrossRef]
- Sheng, L.; Lu, D.; Huang, J. Impacts of land-cover types on an urban heat island in Hangzhou, China. Int. J. Remote Sens. 2015, 36, 1584–1603. [Google Scholar] [CrossRef]
- Zhou, D.; Zhao, S.; Zhang, L.; Sun, G.; Liu, Y. The footprint of urban heat island effect in China. Nat. Sci. Reports 2015, 5, 11160–11171. [Google Scholar] [CrossRef] [PubMed]
- Kenward, A.; Yawitz, D.; Sanford, T. Slug Summer in the City: Hot and Getting Hotter. 2014. Available online: http://assets.climatecentral.org/pdfs/UrbanHeatIsland.pdf (accessed on 1 December 2017).
- Osborn, D.; Cutter, A.; Ullah, F. Universal Sustainable Development Goals: Understanding the Transformational Challenge for Developed Countries. 2015. Available online: https://sustainabledevelopment.un.org/content/documents/1684SF_-_SDG_Universality_Report_-_May_2015.pdf (accessed on 1 December 2017).
- The Rockefeller Foundation. City Resilience Framework—100 Resilient Cities; ARUP: New York, NY, USA, 2015. [Google Scholar]
- Bhatta, B. Analysis of Urban Growth and Sprawl from Remote Sensing Data; Springer: London, UK, 2010. [Google Scholar]
- Gallo, K.; Xian, G. Application of spatially gridded temperature and land cover data sets for urban heat island analysis. Urban Clim. 2014, 8, 1–10. [Google Scholar] [CrossRef]
- Guo, Y.; Gasparrini, A.; Armstrong, B.; Li, S.; Tawatsupa, B.; Tobias, A.; Lavigne, E.; De Sousa Zanotti Stagliorio Coelho, M.; Leone, M.; Pan, X.; et al. Global Variation in the Effects of Ambient Temperature on Mortality. Epidemiology 2014, 25, 781–789. [Google Scholar] [CrossRef] [PubMed]
- Tan, J.; Zheng, Y.; Tang, X.; Guo, C.; Li, L.; Song, G.; Zhen, X.; Yuan, D.; Kalkstein, A.J.; Li, F.; et al. The urban heat island and its impact on heat waves and human health in Shanghai. Int. J. Biometeorol. 2010, 54, 75–84. [Google Scholar] [CrossRef] [PubMed]
- Earl, N.; Simmonds, I.; Tapper, N. Weekly cycles in peak time temperatures and urban heat island intensity. Environ. Res. Lett. 2016, 11, 1–10. [Google Scholar] [CrossRef]
- Hattis, D.; Ogneva-Himmelberger, Y.; Ratick, S. The spatial variability of heat-related mortality in Massachusetts. Appl. Geogr. 2012, 33, 45–52. [Google Scholar] [CrossRef]
- Knight, S.; Smith, C.; Roberts, M. Mapping Manchester’s urban heat island. Weather 2010, 65, 188–193. [Google Scholar] [CrossRef]
- Giorgio, G.A.; Ragosta, M.; Telesca, V. Climate variability and industrial-suburban heat environment in a mediterranean area. Sustainability. 2017, 9, 775. [Google Scholar] [CrossRef]
- Wang, J.; Huang, B.; Fu, D.; Atkinson, P. Spatiotemporal Variation in Surface Urban Heat Island Intensity and Associated Determinants across Major Chinese Cities. Remote Sens. 2015, 7, 3670–3689. [Google Scholar] [CrossRef]
- Rinner, C.; Hussain, M. Toronto’s urban heat island-exploring the relationship between land use and surface temperature. Remote Sens. 2011, 3, 1251–1265. [Google Scholar] [CrossRef]
- Sobrino, J.A.; Jiménez-Muñoz, J.C.; Paolini, L. Land surface temperature retrieval from LANDSAT TM 5. Remote Sens. Environ. 2004, 90, 434–440. [Google Scholar] [CrossRef]
- Jimenez-Munoz, J.C.; Sobrino, J.A.; Skokovic, D.; Mattar, C.; Cristobal, J. Land surface temperature retrieval methods from Landsat-8 thermal infrared sensor data. IEEE Geosci. Remote Sens. Lett. 2014, 11, 1840–1843. [Google Scholar] [CrossRef]
- Blasi, M.G.; Liuzzi, G.; Masiello, G.; Serio, C.; Telesca, V.; Venafra, S. Surface parameters from seviri observations through a kalman filter approach: Application and evaluation of the scheme to the southern Italy. Tethys 2016, 2016, 1–19. [Google Scholar] [CrossRef]
- Kim, D.-Y.; Han, K.-S. Remotely sensed retrieval of midday air temperature considering atmospheric and surface moisture conditions. Int. J. Remote Sens. 2013, 34, 247–263. [Google Scholar] [CrossRef]
- Imhoff, M.L.; Zhang, P.; Wolfe, R.E.; Bounoua, L. Remote sensing of the urban heat island effect across biomes in the continental USA. Remote Sens. Environ. 2010, 114, 504–513. [Google Scholar] [CrossRef]
- Tomlinson, C.J.; Chapman, L.; Thornes, J.E.; Baker, C.J. Derivation of Birmingham’s summer surface urban heat island from MODIS satellite images. Int. J. Climatol. 2012, 32, 214–224. [Google Scholar] [CrossRef]
- Li, J.; Song, C.; Cao, L.; Zhu, F.; Meng, X.; Wu, J. Impacts of landscape structure on surface urban heat islands: A case study of Shanghai, China. Remote Sens. Environ. 2011, 115, 3249–3263. [Google Scholar] [CrossRef]
- Cao, X.; Onishi, A.; Chen, J.; Imura, H. Quantifying the cool island intensity of urban parks using ASTER and IKONOS data. Landsc. Urban Plan. 2010, 96, 224–231. [Google Scholar] [CrossRef]
- Kikon, N.; Singh, P.; Singh, S.K.; Vyas, A. Assessment of urban heat islands (UHI) of Noida City, India using multi-temporal satellite data. Sustain. Cities Soc. 2016, 22, 19–28. [Google Scholar] [CrossRef]
- Zhou, D.; Zhao, S.; Liu, S.; Zhang, L.; Zhu, C. Surface urban heat island in China’s 32 major cities: Spatial patterns and drivers. Remote Sens. Environ. 2014, 152, 51–61. [Google Scholar] [CrossRef]
- Zhang, H.; Qi, Z.F.; Ye, X.Y.; Cai, Y.B.; Ma, W.C.; Chen, M.N. Analysis of land use/land cover change, population shift, and their effects on spatiotemporal patterns of urban heat islands in metropolitan Shanghai, China. Appl. Geogr. 2013, 44, 121–133. [Google Scholar] [CrossRef]
- Zhao, G.; Dong, J.; Liu, J.; Zhai, J.; Cui, Y.; He, T.; Xiao, X. Different Patterns in Daytime and Nighttime Thermal Effects of Urbanization in Beijing-Tianjin-Hebei Urban Agglomeration. Remote Sens. 2017, 9, 121. [Google Scholar] [CrossRef]
- Xie, Q.; Zhou, Z.; Teng, M.; Wang, P. A multi-temporal Landsat TM data analysis of the impact of land use and land cover changes on the urban heat island effect. J. Food Agric. Environ. 2012, 10, 22–25. [Google Scholar]
- Deilami, K.; Kamruzzaman, M.; Hayes, J. Correlation or Causality between Land Cover Patterns and the Urban Heat Island Effect? Evidence from Brisbane, Australia. Remote Sens. 2016, 8, 716. [Google Scholar] [CrossRef]
- Kelly, J.F.; Weidmann, B.; Walsh, M. The Housing We’d Choose. 2011. Available online: https://grattan.edu.au/wp-content/uploads/2014/04/090_cities_report_housing_market.pdf (accessed on 1 December 2017).
- U.S. Department of Commerce. 2013 Housing Profile: United States; U.S. Census Bureau: Washinton, DC, USA, 2013.
- Australian National Accounts 1988–2015; ABS: Belconnen, ACT, Australia, 2015.
- Dhakal, S.P. Glimpses of Sustainability in Perth. Western Australia: Capturing and Communicating the Adaptive Capacity of an Activist Group. Cons. J. Sustain. Dev. 2014, 11, 167–182. [Google Scholar]
- Perth and Peel @ 3.5 Million; Western Australian Planning Commission: Perth, Australia, 2015.
- Boland, J.; Philipp, C. Monitoring the Urban Climatic Trends and Impacts; Urban Climates Research: Adelaide, Australia, 2013. [Google Scholar]
- Department of Mines and Petroleum. Western Australian Mineral and Petroleum Statistics Digest 1984–2015; Government of Western Australia: Perth, Australia, 2015; pp. 1984–2015.
- MacLachlan, A.; Biggs, E.; Roberts, G.; Boruff, B. Classified earth observation data between 1990 and 2015 for the Perth Metropolitan Region, Western Australia using the Import Vector Machine algorithm. 2017. [Google Scholar]
- Zhang, P.; Imhoff, M.L.; Bounoua, L.; Wolfe, R.E. Exploring the influence of impervious surface density and shape on urban heat islands in the northeast United States using MODIS and Landsat. Can. J. Remote Sens. 2012, 38, 441–451. [Google Scholar]
- Wan, Z. MODIS Land Surface Temperature Products Users’ Guide; University of California: Santa Barbara, CA, USA, 2006. [Google Scholar]
- Fu, P.; Weng, Q. Consistent land surface temperature data generation from irregularly spaced Landsat imagery. Remote Sens. Environ. 2016, 184, 175–187. [Google Scholar] [CrossRef]
- Wan, Z. New refinements and validation of the collection-6 MODIS land-surface temperature/emissivity product. Remote Sens. Environ. 2013, 140, 36–45. [Google Scholar] [CrossRef]
- Li, Y.; Zhang, H.; Kainz, W. Monitoring patterns of urban heat islands of the fast-growing Shanghai metropolis, China: Using time-series of Landsat TM/ETM+ data. Int. J. Appl. Earth Obs. Geoinf. 2012, 19, 127–138. [Google Scholar] [CrossRef]
- Haashemi, S.; Weng, Q.; Darvishi, A.; Alavipanah, S. Seasonal Variations of the Surface Urban Heat Island in a Semi-Arid City. Remote Sens. 2016, 8, 352. [Google Scholar] [CrossRef]
- Smith, S.W. The Scientist and Engineer’s Guide to Digital Singal Procssing; California Technical Publishing: San Diego, CA, USA, 2003. [Google Scholar]
- MacLachlan, A.; Roberts, G.; Biggs, E.; Boruff, B. Subpixel land-cover classification for improved urban area estimates using Landsat. Int. J. Remote Sens. 2017, 38, 5763–5792. [Google Scholar] [CrossRef]
- Kennewell, C.; Shaw, B.J. Perth, Western Australia. Cities 2008, 25, 243–255. [Google Scholar] [CrossRef]
- Oke, T.R. The energetic basis of the urban heat island. Q. J. R. Meteorol. Soc. 1982, 108, 1–24. [Google Scholar] [CrossRef]
- Xu, D.; Chen, R. Comparison of urban heat island and urban reflection in Nanjing City of China. Sustain. Cities Soc. 2017, 31, 26–36. [Google Scholar] [CrossRef]
- Daley, M.J.; Phillips, N.G. Interspecific variation in nighttime transpiration and stomatal conductance in a mixed New England deciduous forest. Tree Physiol. 2006, 26, 411–419. [Google Scholar] [CrossRef] [PubMed]
- Weng, Q.; Lu, D.; Schubring, J. Estimation of land surface temperature-vegetation abundance relationship for urban heat island studies. Remote Sens. Environ. 2004, 89, 467–483. [Google Scholar] [CrossRef]
- Zhao, S.; Zhou, D.; Liu, S. Data concurrency is required for estimating urban heat island intensity. Environ. Pollut. 2016, 208, 118–124. [Google Scholar] [CrossRef] [PubMed]
- Sharifi, E.; Lehmann, S. Comparative Analysis of Surface Urban Heat Island Effect in Central Sydney. J. Sustain. Dev. 2014, 7, 23–34. [Google Scholar] [CrossRef]
- Peng, S.; Piao, S.; Ciais, P.; Friedlingstein, P.; Ottle, C.; Bréon, F.-M.; Nan, H.; Zhou, L.; Myneni, R.B. Surface urban heat island across 419 global big cities. Environ. Sci. Technol. 2012, 46, 696–703. [Google Scholar] [CrossRef] [PubMed]
- Shen, H.; Huang, L.; Zhang, L.; Wu, P.; Zeng, C. Long-term and fine-scale satellite monitoring of the urban heat island effect by the fusion of multi-temporal and multi-sensor remote sensed data: A 26-year case study of the city of Wuhan in China. Remote Sens. Environ. 2016, 172, 109–125. [Google Scholar] [CrossRef]
- Shastri, H.; Barik, B.; Ghosh, S.; Venkataraman, C.; Sadavarte, P. Flip flop of Day-night and Summer-Winter Surface Urban Heat Island Intensity in India. Sci. Rep. 2017, 7, 1–8. [Google Scholar] [CrossRef] [PubMed]
- Orru, H.; Andersson, C.; Ebi, K.L.; Langner, J.; Åström, C.; Forsberg, B. Impact of climate change on ozone-related mortality and morbidity in Europe. Eur. Respir. J. 2013, 41, 285–294. [Google Scholar] [CrossRef] [PubMed]
- Environment Protection Agency. Reducing Urban Heat Islands: Compendium of Strategies—Urban Heat Island Basics; U.S. Environmental Protection Agency: Washington, CO, USA, 2012.
- Burnett, R.T.; Brook, J.R.; Yung, W.T.; Dales, R.E.; Krewski, D. Association between ozone and hospitalization for respiratory diseases in 16 Canadian cities. Environ. Res. 1997, 72, 24–31. [Google Scholar] [CrossRef] [PubMed]
- Szyszkowicz, M.; Rowe, B.H. Respiratory Health Conditions and Ambient Ozone: A Case-Crossover Study Insights in Chest Diseases. iMedPub J. 2016, 1, 1–5. [Google Scholar]
- Goudarzi, G.; Geravandi, S.; Foruozandeh, H.; Babaei, A.A.; Alavi, N.; Niri, M.V.; Khodayar, M.J.; Salmanzadeh, S.; Mohammadi, M.J. Cardiovascular and respiratory mortality attributed to ground-level ozone in Ahvaz, Iran. Environ. Monit. Assess. 2015, 187, 487–498. [Google Scholar] [CrossRef] [PubMed]
- Coutts, A.M.; Harris, R.J.; Phan, T.; Livesley, S.J.; Williams, N.S.G.; Tapper, N.J. Thermal infrared remote sensing of urban heat: Hotspots, vegetation, and an assessment of techniques for use in urban planning. Remote Sens. Environ. 2016, 186, 637–651. [Google Scholar] [CrossRef]
- Directions 2031 and beyond: Metropolitan Planning beyond the Horizon; Western Australian Planning Commission: Perth, Australia, 2010.
- Central Sub-Regional Planning Framework; Western Australian Planning Commission: Perth, Australia, 2015.
- North-West Sub-Regional Planning Framework; Western Australian Planning Commission: Perth, WA, Australia, 2015.
- North-East Sub-Regional Planning Framework; Western Australian Planning Commission: Perth, WA, Australia, 2015.
- South Metropolitan Peel Planning Framework; Western Australian Planning Commission: Perth, WA, Australia, 2015.
- Marfai, M.A.; Sekaranom, A.B.; Ward, P. Community responses and adaptation strategies toward flood hazard in Jakarta, Indonesia. Nat. Hazards 2014, 75, 1127–1144. [Google Scholar] [CrossRef]
- Suryahadi, A.; Sumarto, S. Poverty and Vulnerability in Indonesia before and after the Economic Crisis. Asian Econ. J. 2003, 17, 45–64. [Google Scholar] [CrossRef]
Figure 1.
A cross section illustrating the UHI effect in Perth, WA, using 2015 average annual daytime temperature derived from tMODIS Terra LST product (MOD11A1) (a) in relation to the percent urban (b) and other land cover (c) area, per MODIS pixel based on classified Landsat imagery, graphically displayed (d) with WA identified in (e) and Perth city (f).
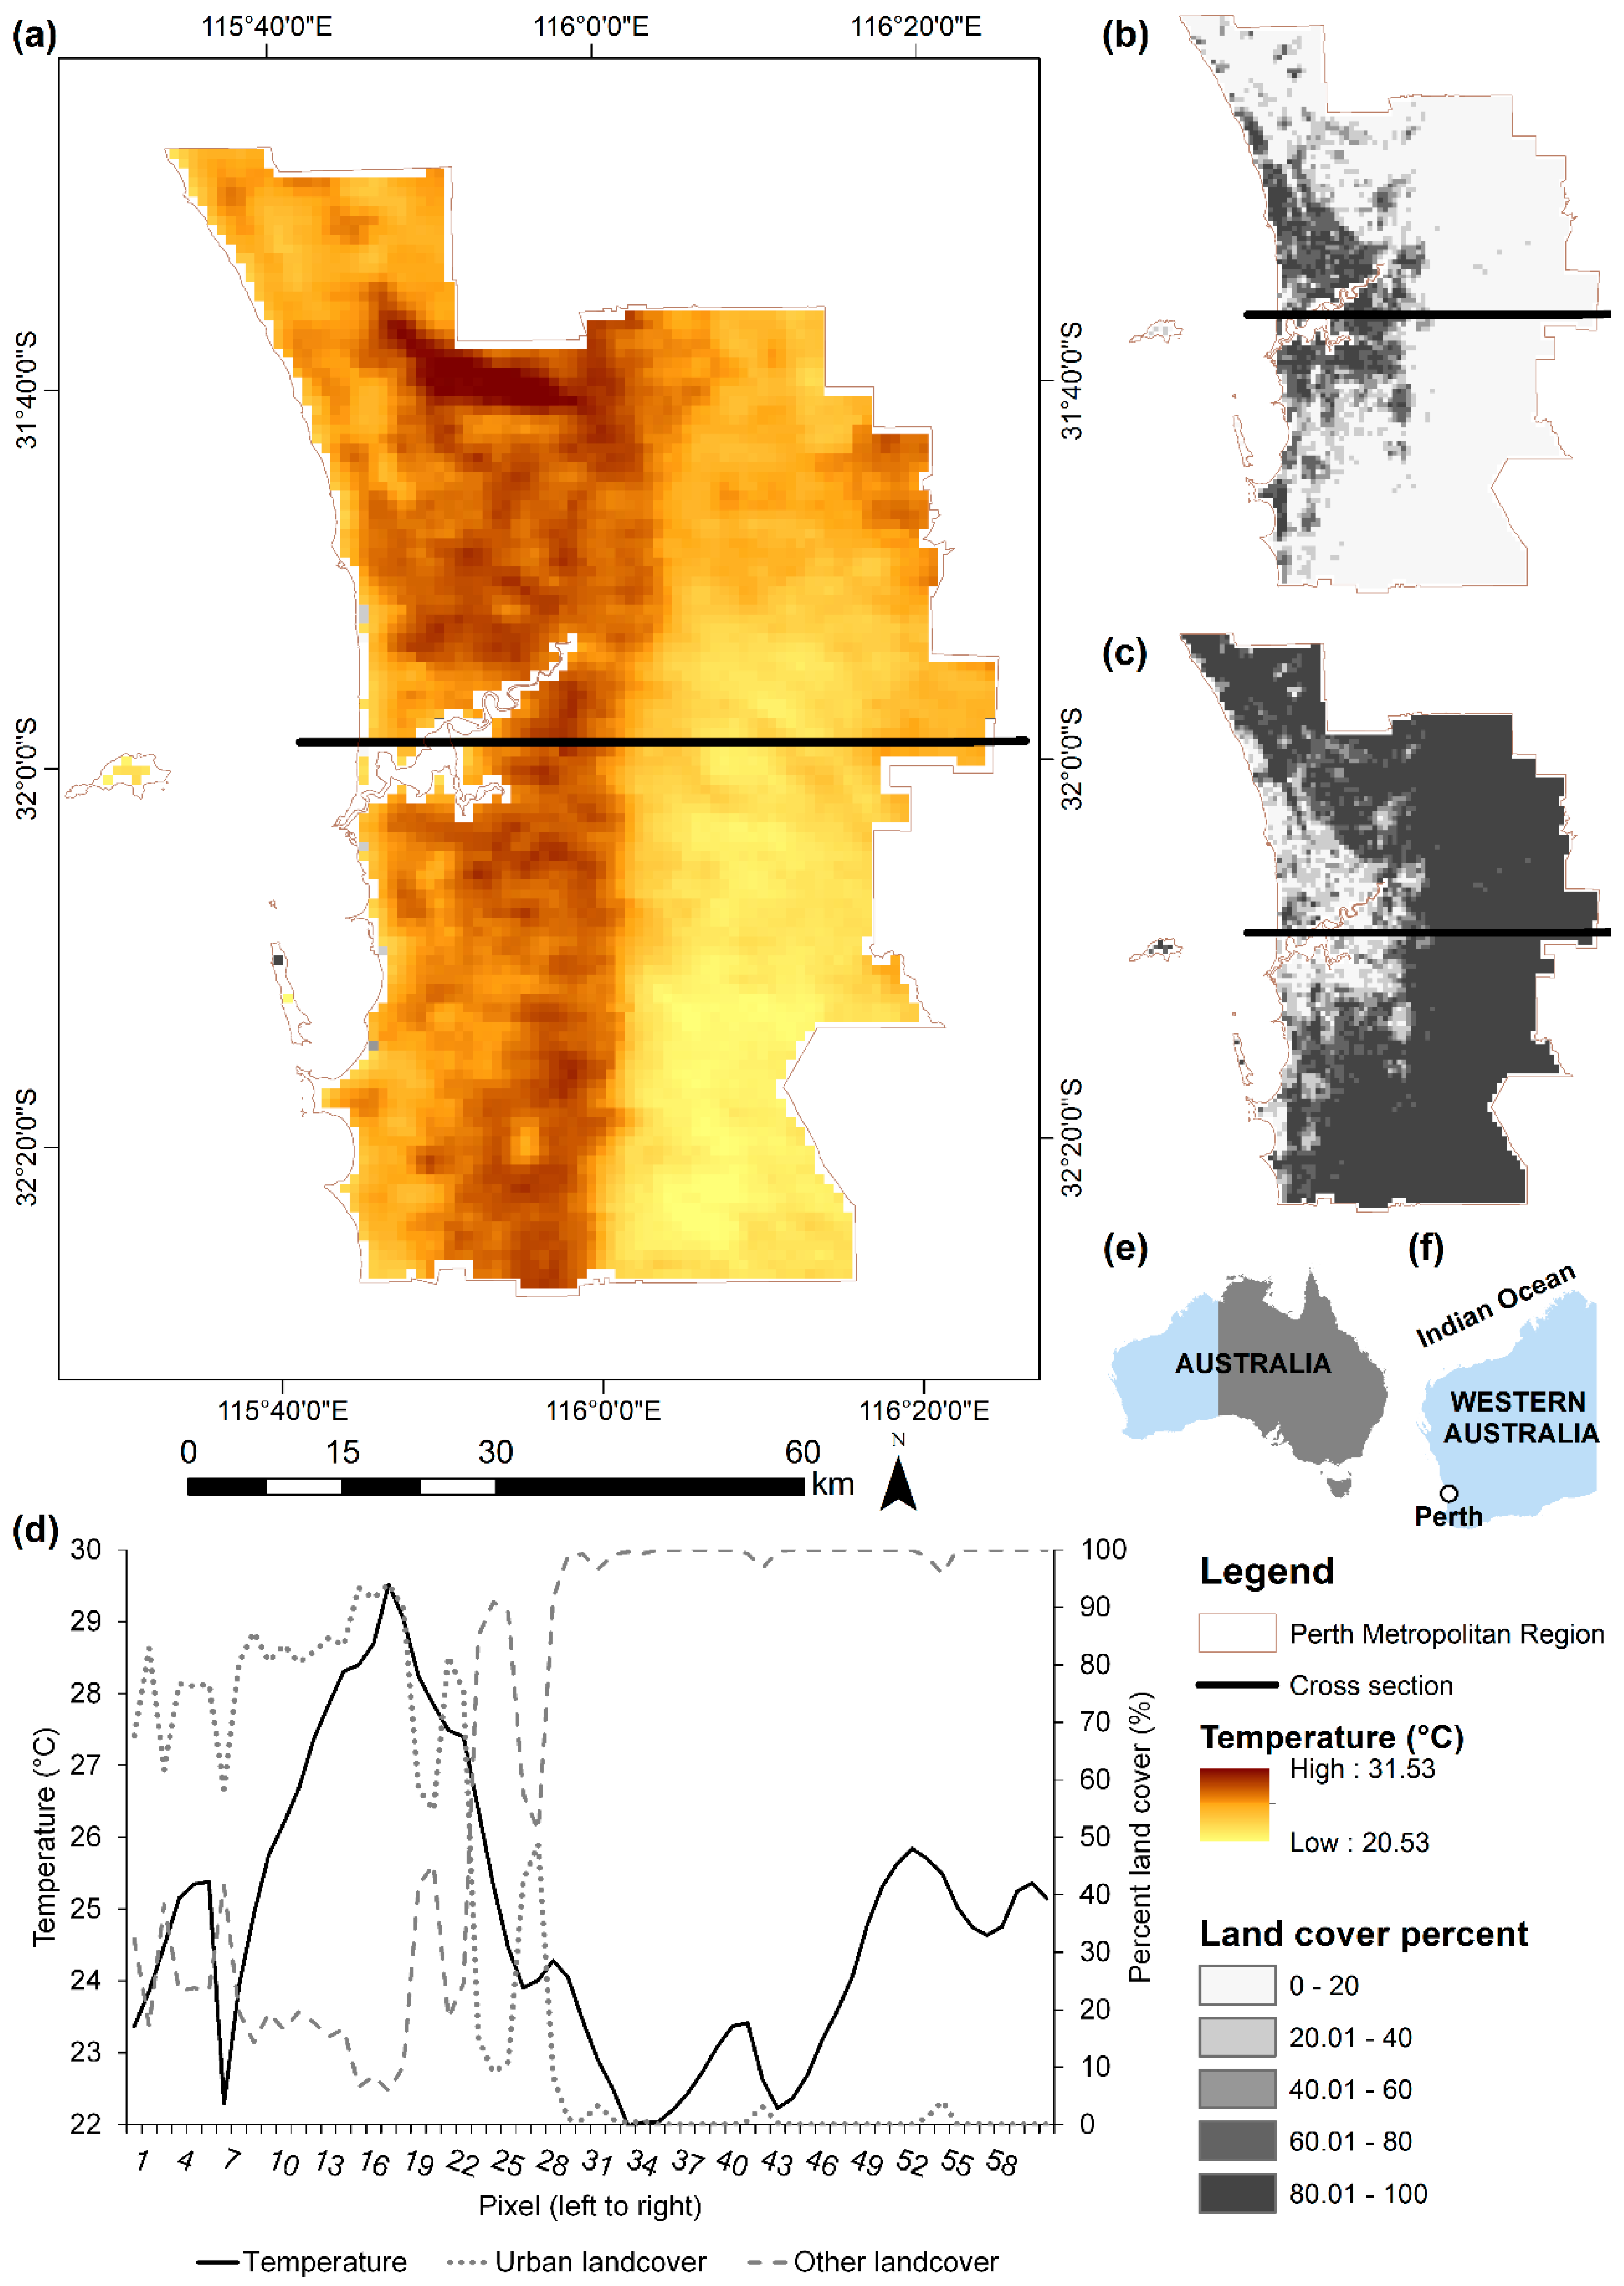
Figure 2.
Land cover change meeting the criteria of (1) greater than all other changes within a MODIS pixel and (2) the change to land cover dominates (>50%) the 2013 MODIS pixel. Change is derived between 2003 and 2013 from classified Landsat data aggregated to MODIS resolution, where white pixels do not meet the criteria (a), alongside static land cover maps from 2003 (b) and 2013 (c).
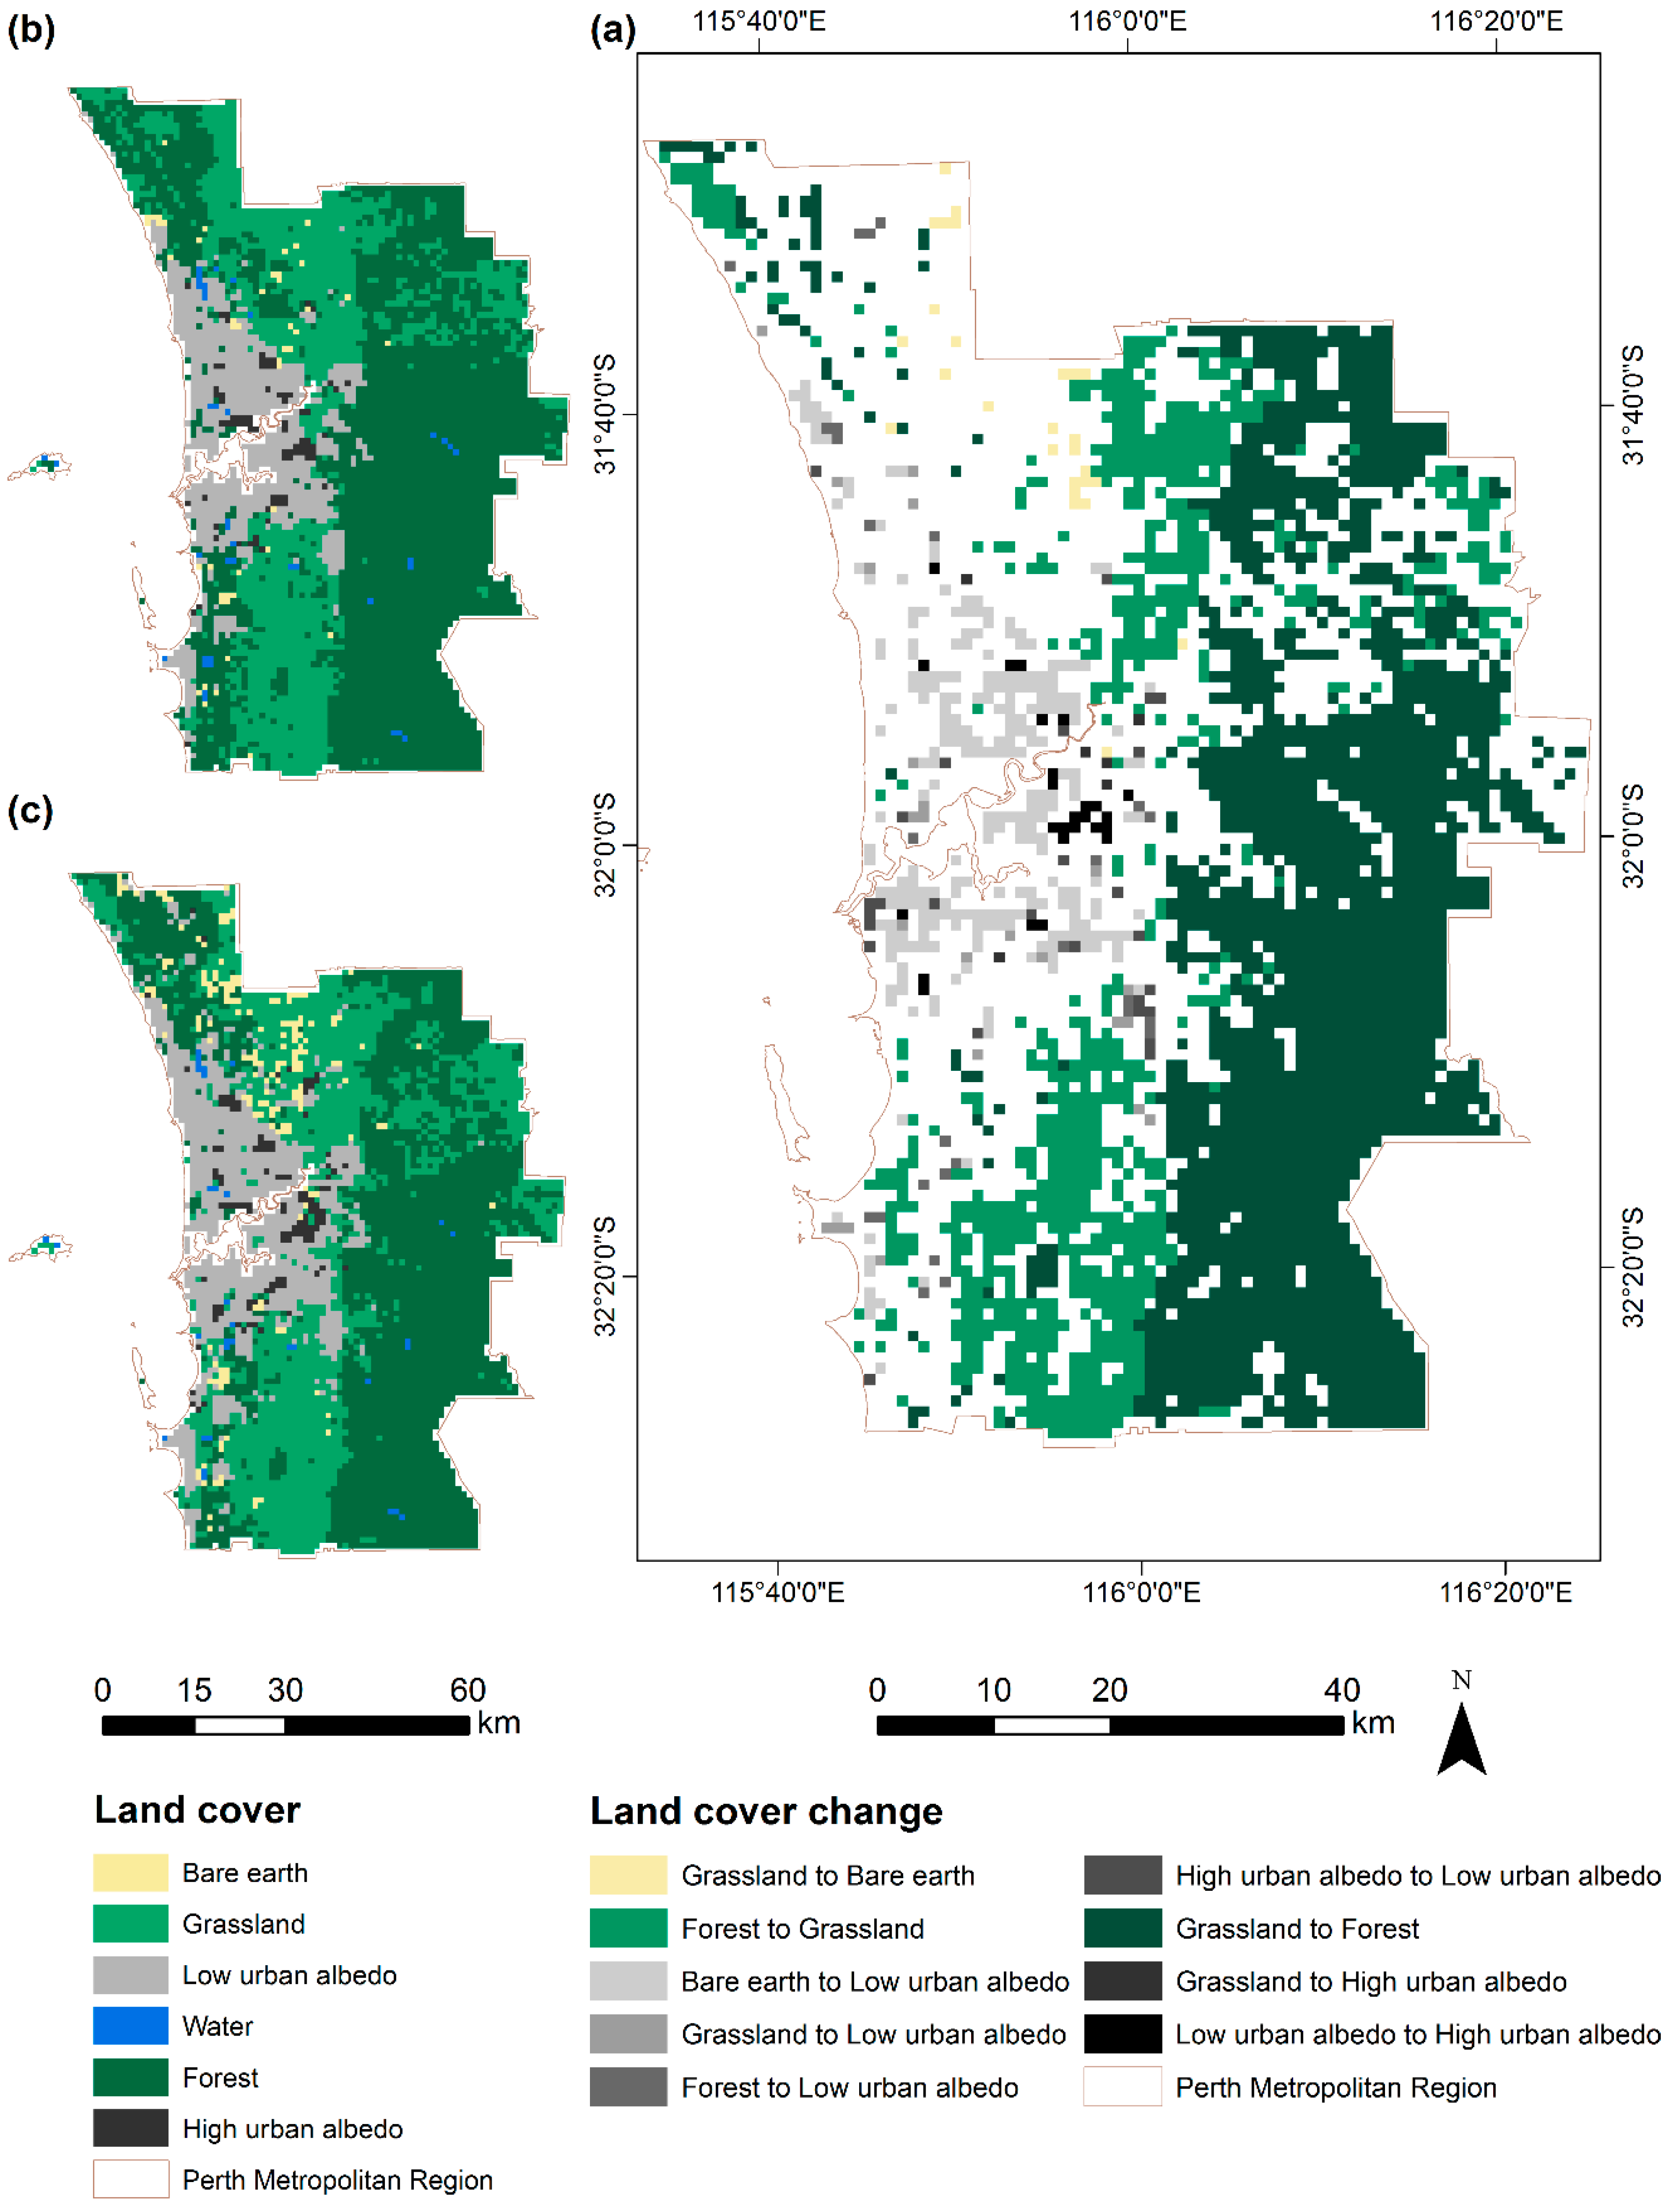
Figure 3.
Summary of methodological procedures for: (a) SUHII and (b) land cover temperature change.
Figure 3.
Summary of methodological procedures for: (a) SUHII and (b) land cover temperature change.
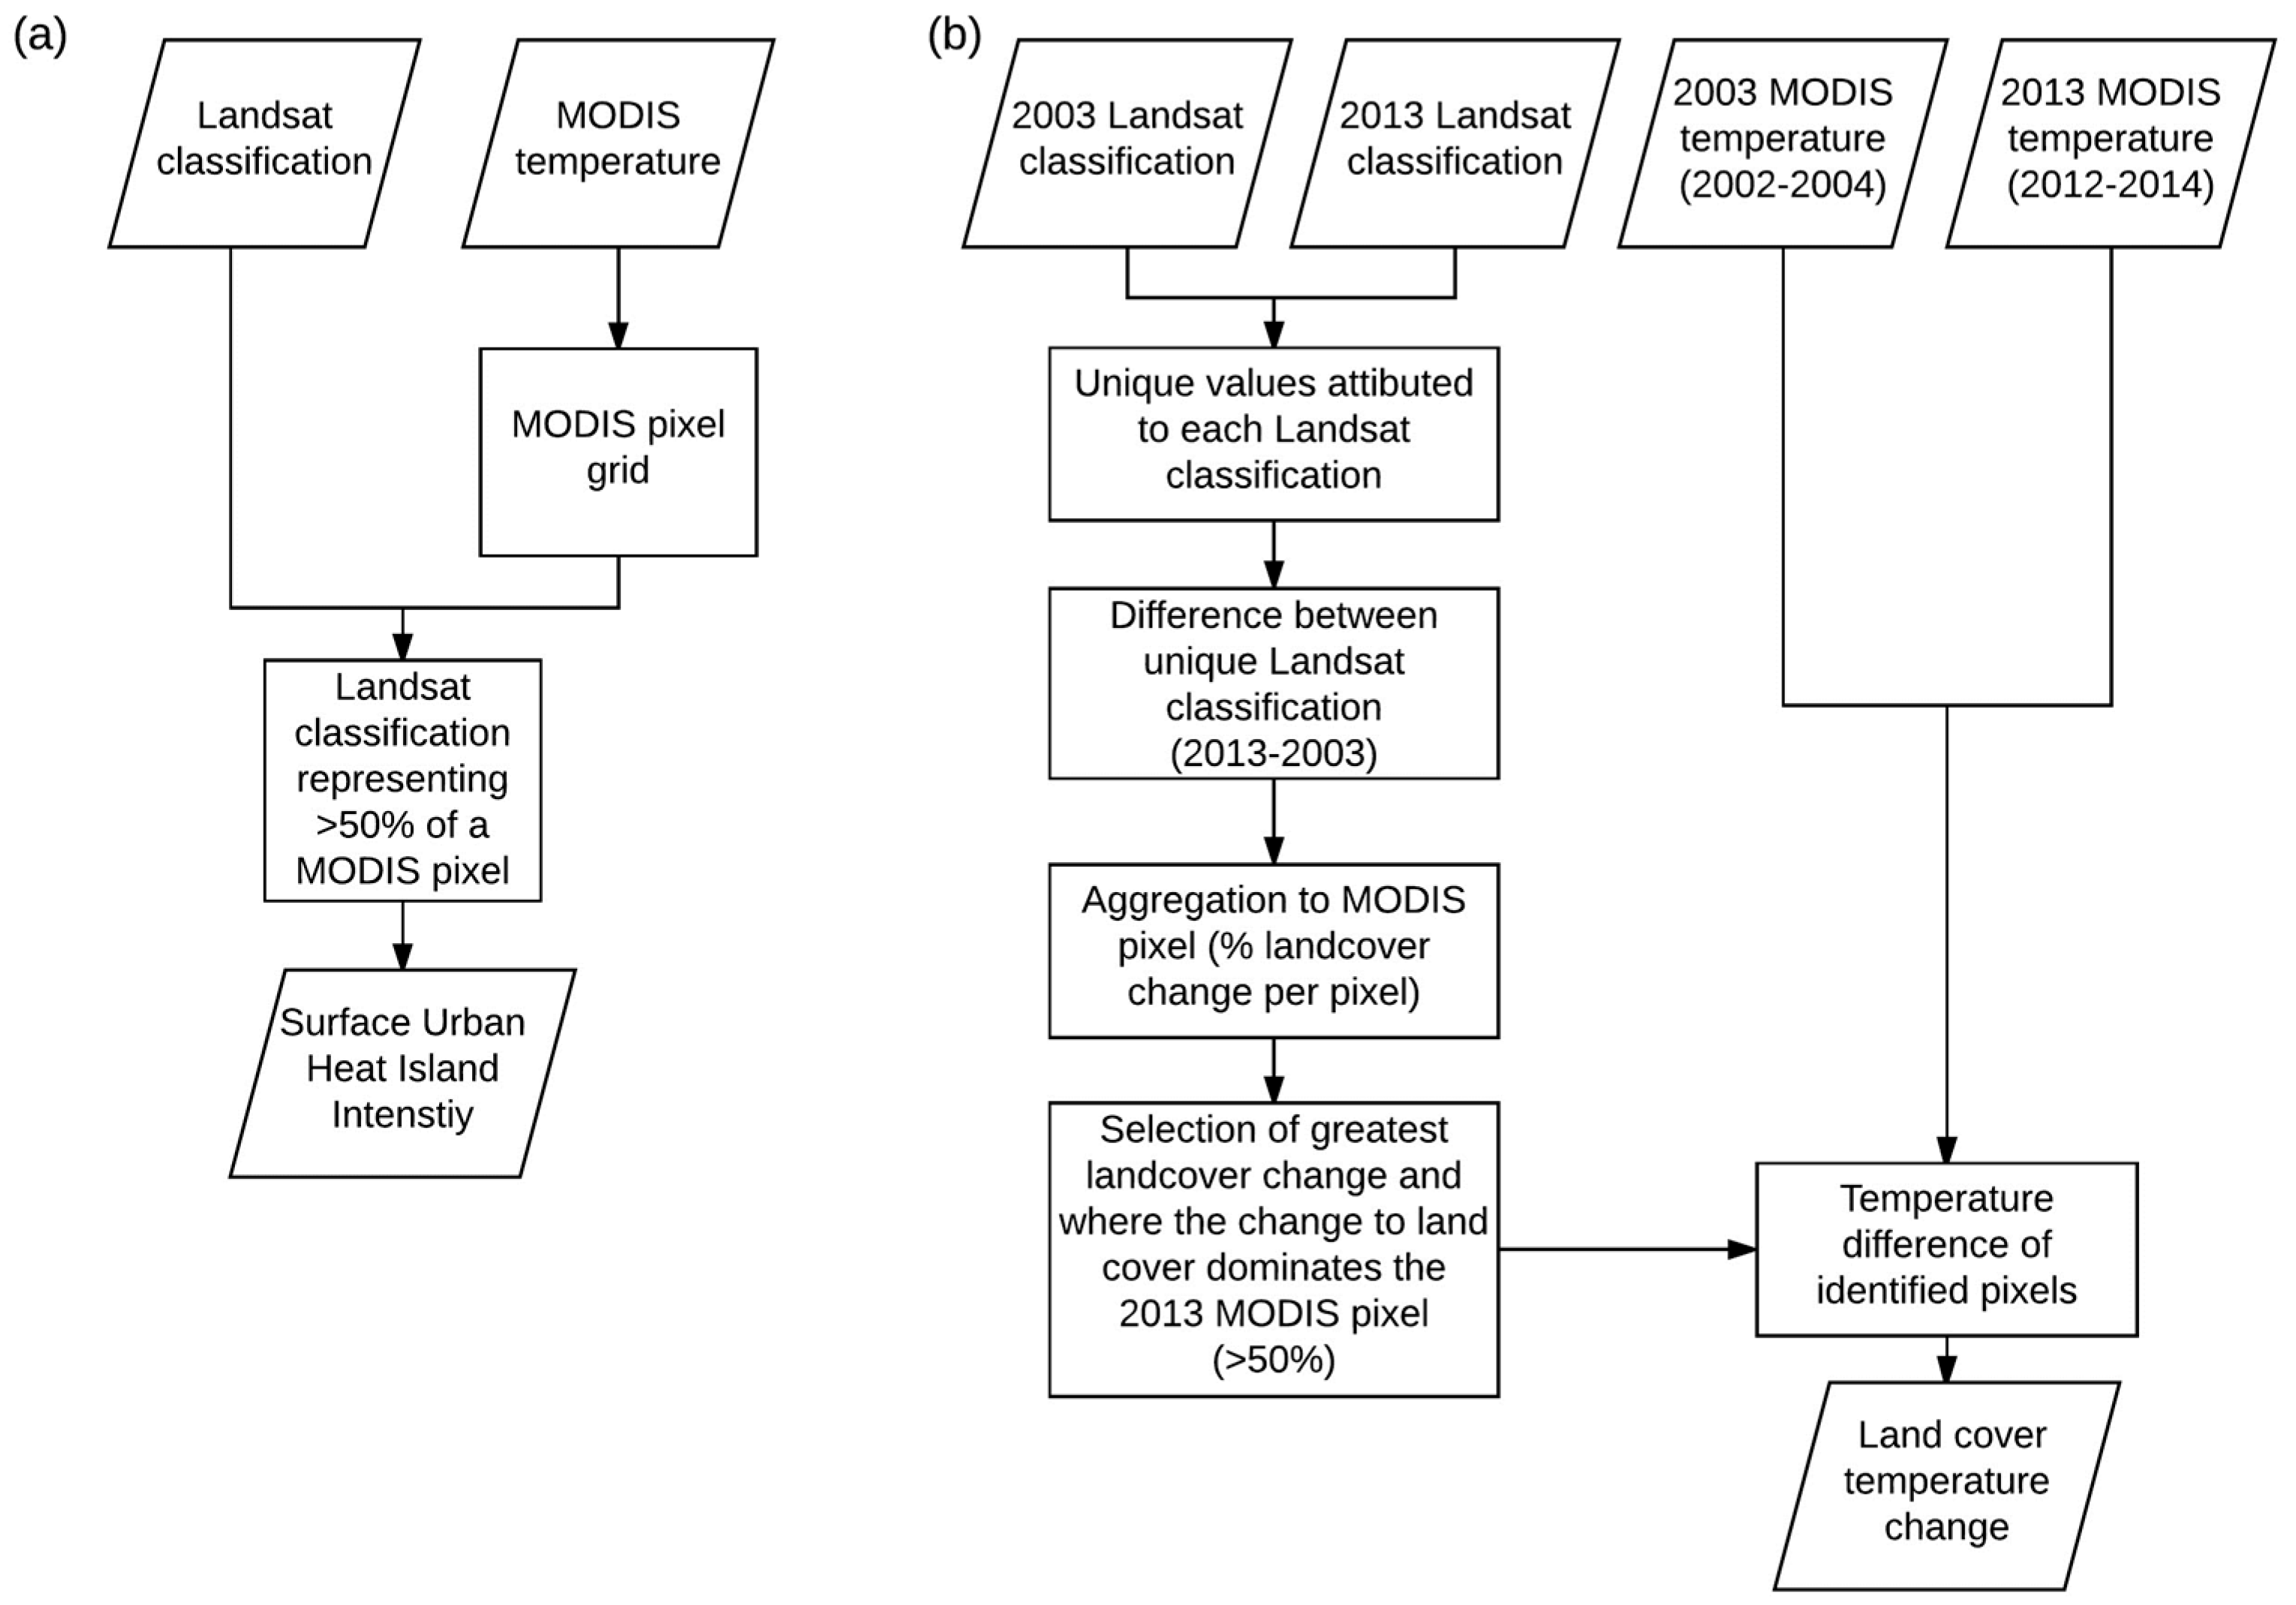
Figure 4.
The 2003 and 2013 percentage land cover within a MODIS pixel and the average annual daytime LST in 2003 and 2013 for: (a) Bare earth (b) Grassland (c) Low urban albedo and (d) Forest, with points (lighter colours) representing individual values of each year. All linear trends are statistically significant at p < 0.05.

Figure 5.
The 2003 and 2013 percentage land cover within a MODIS pixel and average annual nighttime LST for 2003 and 2013 for: (a) Bare earth (b) Grassland (c) Low urban albedo and (d) Forest, with points (lighter colours) representing individual values of each year. All linear trends are statistically significant at p < 0.05.

Figure 6.
The spatial distribution of the difference in daytime SUHII for pixels that remained urban between 2013 and 2003 for: (a) summer (b) autumn (c) winter (d) spring and (e) annual. Urban (low and high albedo) and forest MODIS pixels are identified where a single Landsat land cover class composes >50% of a MODIS pixel. Black outlined MODIS pixels represent high urban albedo.

Figure 7.
The spatial distribution of the difference in nighttime SUHII for pixels that remained urban between 2013 and 2003 for: (a) summer (b) autumn (c) winter (d) spring and (e) annual. Urban (low and high albedo) and forest MODIS pixels are identified where a single Landsat land cover class composed >50% of a MODIS pixel. Black outlined MODIS pixels represent high urban albedo.

Figure 8.
Land cover and average annual day and night time LST change between 2003 and 2013 for the cross section identified in Figure 1, excluding pixels of no change.
Figure 8.
Land cover and average annual day and night time LST change between 2003 and 2013 for the cross section identified in Figure 1, excluding pixels of no change.

Table 1.
Day and night time SUHII and standard deviation (in brackets) between Low Urban albedo (UL) and land cover classes: Bare Earth (BE), Grassland (G), Water (W), Forest (F) and High Urban albedo (UH). Combined urban of both Low and High urban albedo (U) was also separately compared to Forest (F).
| Time of Day | Season | Year | UL vs. BE (°C) | UL vs. G (°C) | UL vs. W (°C) | UL vs. F (°C) | UL vs. UH (°C) | U vs. F (°C) |
|---|---|---|---|---|---|---|---|---|
| Day time | Summer | 2003 | −0.29 (1.94) | −2.81 (1.94) | 3.26 (1.94) | 3.50 (1.94) | −1.10 (1.94) | 3.56 (1.92) |
| 2013 | −1.74 (2.02) | −1.98 (2.02) | 4.21 (2.02) | 3.98 (2.02) | −1.22 (2.02) | 4.08 (2.01) | ||
| Autumn | 2003 | −0.26 (1.10) | −0.88 (1.10) | 1.10 (1.10) | 2.65 (1.10) | −0.56 (1.10) | 2.68 (1.09) | |
| 2013 | 0.06 (1.05) | −0.16 (1.05) | 1.91 (1.05) | 3.47 (1.05) | −0.36 (1.05) | 3.51 (1.03) | ||
| Winter | 2003 | 0.74 (0.66) | 1.06 (0.66) | 1.22 (0.66) | 2.79 (0.66) | −0.11 (0.66) | 2.78 (0.66) | |
| 2013 | 0.55 (0.62) | 0.91 (0.62) | 1.41 (0.62) | 2.66 (0.62) | 0.16 (0.62) | 2.65 (0.63) | ||
| Spring | 2003 | 0.93 (1.76) | 1.49 (1.76) | 3.50 (1.76) | 4.43 (1.76) | −1.49 (1.76) | 4.53 (1.77) | |
| 2013 | 0.55 (1.73) | 2.02 (1.73) | 4.49 (1.73) | 5.16 (1.73) | −1.28 (1.73) | 5.27 (1.75) | ||
| Annual | 2003 | 0.20 (1.30) | −0.15 (1.30) | 2.29 (1.30) | 3.32 (1.30) | −0.73 (1.30) | 3.36 (1.29) | |
| 2013 | −0.04 (1.28) | 0.36 (1.28) | 2.94 (1.28) | 3.86 (1.28) | −0.52 (1.28) | 3.91 (1.27) | ||
| Night time | Summer | 2003 | 1.23 (0.62) | 1.88 (0.62) | −0.13 (0.62) | 1.09 (0.62) | 0.07 (0.62) | 1.09 (0.63) |
| 2013 | 1.32 (0.64) | 1.73 (0.64) | 0.05 (0.64) | 1.31 (0.64) | 0.11 (0.64) | 1.30 (0.64) | ||
| Autumn | 2003 | 1.45 (0.75) | 1.88 (0.75) | 0.67 (0.75) | 1.44 (0.75) | 0.01 (0.75) | 1.44 (0.76) | |
| 2013 | 1.90 (0.69) | 1.87 (0.69) | 0.24 (0.69) | 1.44 (0.69) | 0.21 (0.69) | 1.42 (0.70) | ||
| Winter | 2003 | 1.05 (0.68) | 1.35 (0.68) | −0.47 (0.68) | 1.33 (0.68) | 0.21 (0.68) | 1.32 (0.69) | |
| 2013 | 1.58 (0.65) | 1.37 (0.65) | −0.31 (0.65) | 1.25 (0.65) | 0.43 (0.65) | 1.21 (0.66) | ||
| Spring | 2003 | 1.62 (0.73) | 2.09 (0.73) | −0.63 (0.73) | 1.76 (0.73) | 0.10 (0.73) | 1.76 (0.73) | |
| 2013 | 1.96 (0.73) | 1.75 (0.73) | −0.18 (0.73) | 1.82 (0.73) | 0.13 (0.73) | 1.81 (0.72) | ||
| Annual | 2003 | 1.49 (0.72) | 1.92 (0.72) | 0.01 (0.72) | 1.56 (0.72) | −0.06 (0.72) | 1.56 (0.73) | |
| 2013 | 1.94 (0.67) | 1.72 (0.67) | −0.12 (0.67) | 1.39 (0.67) | 0.16 (0.67) | 1.37 (0.67) |
Table 2.
Average land cover associated LST change between 2003 and 2013 for the greatest land cover change within a MODIS pixel and the change to land cover that dominates the pixel (>50%). Classes are represented as: Bare Earth (BE), Grassland (G), Forest (F), Low Urban albedo (UL) and High Urban albedo (UH).
| Time of Day | Season | F to UL (°C) | G to UL (°C) | BE to UL (°C) | UH to UL (°C) | F to G (°C) | G to F (°C) | G to BE (°C) | UL to UH (°C) | G to UH (°C) |
|---|---|---|---|---|---|---|---|---|---|---|
| Day | Summer | 0.13 | −0.14 | 0.31 | 0.11 | −0.55 | −0.17 | 0.05 | 0.20 | 0.00 |
| Autumn | 0.35 | 0.32 | 0.72 | 0.45 | 0.19 | −0.10 | 0.65 | 0.62 | 0.66 | |
| Winter | 0.58 | 0.46 | 0.44 | 0.41 | 0.51 | 0.40 | 0.42 | 0.35 | 0.19 | |
| Spring | 0.85 | 0.47 | 0.39 | 0.46 | 0.39 | 0.12 | 0.39 | 0.29 | 0.51 | |
| Annual | 0.40 | 0.16 | 0.37 | 0.19 | 0.08 | 0.00 | 0.44 | 0.15 | −0.02 | |
| Night | Summer | 1.09 | 1.09 | 1.03 | 1.06 | 0.94 | 0.92 | 0.95 | 0.86 | 0.90 |
| Autumn | 0.32 | 0.25 | 0.26 | 0.21 | 0.15 | 0.21 | 0.44 | 0.19 | 0.12 | |
| Winter | 0.54 | 0.45 | 0.27 | 0.38 | 0.24 | 0.65 | 0.18 | 0.09 | 0.04 | |
| Spring | 1.13 | 1.04 | 0.98 | 0.96 | 0.96 | 0.96 | 1.00 | 0.78 | 0.75 | |
| Annual | 0.88 | 0.77 | 0.73 | 0.72 | 0.70 | 0.80 | 0.80 | 0.58 | 0.47 |
© 2017 by the authors. Licensee MDPI, Basel, Switzerland. This article is an open access article distributed under the terms and conditions of the Creative Commons Attribution (CC BY) license (http://creativecommons.org/licenses/by/4.0/).
Share and Cite
MDPI and ACS Style
MacLachlan, A.; Biggs, E.; Roberts, G.; Boruff, B. Urbanisation-Induced Land Cover Temperature Dynamics for Sustainable Future Urban Heat Island Mitigation. Urban Sci. 2017, 1, 38. https://doi.org/10.3390/urbansci1040038
AMA Style
MacLachlan A, Biggs E, Roberts G, Boruff B. Urbanisation-Induced Land Cover Temperature Dynamics for Sustainable Future Urban Heat Island Mitigation. Urban Science. 2017; 1(4):38. https://doi.org/10.3390/urbansci1040038
Chicago/Turabian StyleMacLachlan, Andrew, Eloise Biggs, Gareth Roberts, and Bryan Boruff. 2017. "Urbanisation-Induced Land Cover Temperature Dynamics for Sustainable Future Urban Heat Island Mitigation" Urban Science 1, no. 4: 38. https://doi.org/10.3390/urbansci1040038