The Integration of Socio-Economic Indicators in the CASBEE-UD Evaluation System: A Case Study


1
GRIDD-ÉTS École de Technologie Supérieure, 1100 Notre Dame W, Montréal, QC H3C 1K3, Canada
2
STEPPE-ÉTS École de Technologie Supérieure, 1100 Notre Dame W, Montréal, QC H3C 1K3, Canada
*
Author to whom correspondence should be addressed.
Urban Sci. 2018, 2(1), 28; https://doi.org/10.3390/urbansci2010028
Submission received: 28 December 2017
/
Revised: 2 March 2018
/
Accepted: 16 March 2018
/
Published: 19 March 2018
Abstract
:The use of tools to measure the degree of sustainability of cities is the approach that receives the most attention in developed countries. However, studies of evaluation tools at the neighborhood level reveal that there are many weaknesses in the most widely-used evaluation systems (LEED-ND, BREEAM Communities, CASBEE-UD). There are ambiguities and gaps in weighting and in scoring and in most cases, there is no mechanism for local adaptability and participation. The purpose of this study is to provide an overview of the current situation by highlighting the strengths and weaknesses of these evaluation tools in order to integrate social and economic aspects for the improvement of the CASBEE-UD (neighborhood level) evaluation tool. The selection of socio-economic aspects was made through the use of a multi criteria Analysis Hierarchical Process (AHP) and a Geographic Integration System (GIS). The results of this case study indicate that most evaluation tools need to be revised because most do not include socio-economic aspects. We have demonstrated that applying the CASBEE-UD assessment tool integrated with socio-economic aspects to four boroughs in the City of Montreal can measure success by addressing the objectives of sustainable development.
1. Introduction
The importance of the issue of sustainability in general and in particular of sustainable urban planning in communities, has emerged as one of the key issues for authorities and experts. In recent years, there have been various collaborations in the field of construction towards environmental objectives and sustainable development [1]. The construction sector has a major role in creating these changes at a huge cost in the consumption of non-renewable resources. According to data released by leading research institutes (World Commission on Environment and Development (WCED) [2] and the European Environment Agency (EEA, 2009) [3], the construction industry uses about 40% of the world’s energy and 40% of its natural resources (raw materials and others) and produces 25% of the world’s waste. Planners have recognized that the activities developed for the production and transformation of the built environment influence and determine the survival of natural systems. There is now a consensus on the importance and need to find strategies to mitigate these activities and to gradually increase the benefits of cities for their residents [4]. These corrective strategies reinforce the development of new models to replace existing ones in order to reorient city transformation activities and techniques towards sustainability and to ensure that the expectations of the local community are respected [5,6]. The core interests of the stakeholders in a building market are highly diverse, oftentimes conflicting and therefore their attitudes towards sustainable construction and an environmental labeling tool could vary significantly [5]. In recent years, several collaborative initiatives in orienting construction activities towards environmental or sustainable development objectives have been established [1]. Several countries and institutions (United States, European Community, United Kingdom, Hong Kong (China), Japan, etc.) have developed new benchmarking methods for monitoring the sustainability status of their cities or neighborhoods. As a part of these initiatives, they have encouraged the utilization of tools to ensure that their cities strive for sustainability.
Evaluation systems are an example of policy tools that support the development of the “green” market. They also offer communities ways in which to become more sustainable, as well as to assess (and possibly improve) their level of sustainability.
Although there is a satisfactory amount of information on assessment tools at the neighborhood scale, relatively few studies have been conducted at this level [6,7]. It is therefore crucial that the scope of sustainability assessment systems shifts from the energy performance of individual buildings to the “broader” aspects of site-related urban assessment, as it is the cities/neighborhoods as a whole that have a more or less sustainable behavior [8]. Jane Jacobs (2010) [9], supported by New Urbanism, says that “a sustainable way of life should effortlessly be derived from the way we design our sustainable neighborhoods, because green developments in neighborhoods benefit the community and the individual” [6,7]. In general, green neighborhood developments respect historical resources and the existing community fabric; they strive to preserve open spaces and encourage access to parks to maintain or improve the character of a neighborhood, including its streets, houses, workplaces, shops and public spaces. There is an implicit assumption in Jacobs’ approach t that these factors affecting urban life are somehow fixed and can be predetermined [9].
Three sets of certifications have been developed recently at the neighborhood level: LEED-ND (2014) developed by the Green Building Council in the US, BRE Global BREEAM Communities (2014) developed by the British Organization BRE Global and CASBEE-UD (2014) developed by the IBEC Institute for strengthening the Environment and Promoting Energy Conservation in Japan [1,10,11].
These tools were designed to assess the level of urban projects’ sustainability in their cities, assessing sustainability first at the scale of the buildings and later at the neighborhood and city levels [8]. These evaluation systems are the three best-known and most-used but they exhibit several weaknesses, especially on the socio-economic front [12].
A common feature of all these evaluation tools is that they must be created by specific requests, coming from different actors or groups of actors or in response to particular contexts. Their reliance on being developed for unique situations results in two contradictory phenomena. On the one hand, there seems to be no universal method or tool that would be applicable and usable in any context, encompassing all the issues. On the other hand, they seem to be seeking a common measure for all. The search for guidelines intended to be global and valid for all, initiated by political demands that are often very general, results in directives that are not sufficiently operational. These directives give recommendations on themes but no orientation towards the devices or the paths leading to the development of concrete projects. In many cases, they require prior or even expert knowledge of users and so they are difficult to understand for most actors. This situation justifies the fact that the sustainable development approach will have to be interpreted locally, as each tool will have to adapt to a specific context.
In urban and neighborhood contexts, where different forces and entities influence the decision-making process, it is essential to add the social and economic aspects to sustainability assessment [4,13,14]. In a study done in three areas of the United Kingdom, Turcu and Catalina (2013) [15] found that the integration of socio-economic indicators with the traditional approaches to the evaluation of sustainability can better evaluate these areas in the urban context. They conclude that indicators are not isolated pieces of information but manifestations of underlying local processes and interconnections that can be mapped and that have the potential to broaden our understanding of local sustainability. Along the same lines, White and Lee (2009) [16] used operational research to demonstrate that the integration of socio-economic indicators in a holistic approach improve urban sustainability.
Aim of the Study and Justifications for Using the CASBEE-UD Assessment Tool
The main aim of this study is the development of an appropriate methodological approach based on the integration of socio-economic aspects into the CASBEE-UD evaluation tool and its application in four boroughs of the city of Montreal. Using the multi-criteria Analytic Hierarchy Process (AHP), we determine the improvements made by the new tool by simultaneously applying the original CASBEE-UD and the new tool integrated with these indicators.
We selected this evaluation system based on the following four reasons: (1) There are no indicators in its structure with which to evaluate the social and economic dimensions and it does not include obligatory credits; (2) The CASBEE-UD includes a variety of tools for different phases of project development: planning, design, completion, operation and renovation. This structure is present at all levels of a city-wide building plan [1,13]; (3) The CASBEE-UD not only considers the built environment but also all of the external environment [17]; and (4) the whole evaluation process acquires a different character than that of other evaluation tools; it uses an additive/weighting approach that allows the addition of points obtained in all the performance areas [1,13,18].
This article is structured as follows: Section 2 presents a review of the relevant literature, Section 3 presents the methodology, which is followed by a presentation of the results in Section 4. These results are discussed in Section 5, along with the conclusions and recommendations for future work.
2. Scope of the Study
Urban neighborhoods, as defined by the users or participants are important spaces in which a local community can be given identity and secure a meaningful voice in assessing the sustainability of redevelopment processes and projects [14,19]. However, at these places where many social and economic factors interact, the concept of neighborhood is ambiguous and in several cases its limits are never standardized [9]. For example, Galster [20] argues that the neighborhood could encompass four different zones, from the smallest block to the entire city sector. Galster, 2001 lists a number of attributes to help select neighborhood size, for example, the structural characteristics of non-residential buildings (size, building materials, housing density, the demographic composition of residents (age, race, class, family status), environmental characteristics (presence of water, greenery, degree of pollution), social-interactive aspects (number/type of neighbors, participation in local activities) and sentimental characteristics (identification with place, historical significance) [20]. The main characteristic of integration of all these aspects is the neighborhood, which represents a spatially-limited area. However, its size depends on the way it is homogeneous and its dimensions. In this respect, Coulton et al. [21] have indicated a number of measures to help planners to select a neighborhood’s area. For example, a neighborhood can be selected by considering a homogeneous area in relation to structural aspects of housing (the type of buildings, their layout); this would be smaller than the homogeneous area determined by environmental features (e.g., pollution levels) but larger than the area where one interacts with neighbors or feels an attachment [21].
In terms of the social and economic dimensions, a neighborhood is a place where many stakeholders have a role in decision making. The social dimension not only includes the interactions between the governmental and non-governmental organizations involved in decision-making but also a set of norms, laws and regulations that interact with one another. Spangenberg (2002), cited by Sharifi and Murayama (2014) [1], argues that this social dimension also has the potential to facilitate links between the other dimensions and thus to complement them. A neighborhood is a fundamental part of a city and a good starting point for creating a truly sustainable community. As mentioned by Choguill, 2008, cited by Sharifi and Murayama, 2013 [18], the importance of neighborhoods as a front line in the battle for sustainability is highlighted by initiatives to pave the way for improving the contextualization of brownfields to the rest of a city. These initiatives make it possible to grasp tangible urban environmental issues that clearly exceed the size of a single building or even a city block. The need for coordinated urbanization and mobility, the creation of multi-member dense clusters and the search for a better quality of urban life can be addressed through concrete solutions [22,23,24]. It is in this perspective that the concept of the “sustainable neighborhood” has emerged, namely the realization of urban centers, dense and mixed, whose overall quality meets a thorough vision of sustainability. However, a number of parameters are needed to apply the concept of sustainable neighborhood [25]. As affirmed by Luederitz (2013) [24], “in a sustainable neighborhood, we must respect the principles of sustainable neighborhood and take into account the mitigation of the impact on the less fortunate.” This is in the concept of sustainable neighborhood that we need to take into account in the current situation [26]. It seems obvious, as Katukiza and McFarlane—cited by Luederitz, 2013 [24,27]—suggest, that basic needs must be taken into account. According to the United Nations report of 2011 [2], more than one third of the urban population of the developing world lives in informal settlements. This issue must be a fundamental element of a set of principles for the sustainable development of urban neighborhoods.
2.1. Evolution of the Evaluation Systems
The central objective of most assessment tools is to act as a decision support tool [17]. They are mainly used to guide stakeholders towards goals that meet the expectations of the local community [25]. All of these approaches use indicators as criteria to generate relevant information. To a large extent the effectiveness of a sustainability assessment depends on the robustness and rigor of the evaluation method. A research framework consisting of indicators based on irrelevant or poorly-defined criteria can misinform and mislead policymakers [1,26,28]. Despite the relatively short history of these tools, the evaluation of neighborhood sustainability (NSA = Neighborhood Sustainability Assessment) has received considerable attention from the scientific community. To date, most studies have focused on the theoretical and unrealistic aspects [1,17,28].
The CASBEE evaluation system was developed in 2004 by the Japan Sustainable Consortium (JSBC) and involved committees in the academic, industrial and governmental sectors. The CASBEE family covers the scales of both buildings and neighborhoods. It is an independent assessment tool developed to help improve sustainability in town planning. CASBEE-UD not only uses building concepts, it also uses concepts related to the external environment of the entire site. The interior of the buildings is excluded. However, the family of products includes CASBEE “CASBEE urban area + Buildings,” which allows the use of CASBEE-UD with assessment at the building scale (including interiors) [10,29].
BREEAM, launched in 1990, was the first BEA tool in the world (Prior et al., 2001 cited by USGBC [30]) and is the most widely used tool for assessing the environmental performance of buildings in the UK. It has been increasingly accepted in the sector as offering practice in environmental design and management [28]. It was launched as a credit award system for new office buildings and today it offers various tools to assess different types of buildings (Table 1). BREEAM was developed to reduce environmental impact, ensure the best environmental practices in design, operation and management and to increase awareness of the impacts of buildings on the environment. Versions of its tools are continuously evolving. LEED was established in 1998 by the United States Green Building Council (USGBC) through a consensus process involving many stakeholders, with the objective of transforming the market for green buildings (Zimmerman and Kibert, 2007—cited by Sharifi and Murayama, 2014 [12]). Design team members can track their progress towards earning a LEED rating throughout the course of a project, without the need for special consultants. The LEED system is well-grounded in science and relates to the market in which it operates (Table 1). LEED can now assess eight different types of buildings. A new version for New Constructions was launched in April 2009: LEED v. 4 (USGBC 2014). Other evaluation methods are used in some other countries, some of which have also been used outside their native country. The two best known are SBTool (International) and Green Star (Australia). SBTool is the software implementation of the Sustainable Building Challenge (SBC) assessment method that has been under development as the Green Building Challenge process since 1996 by a group of 14 countries. The unique feature of SBTool is that it was designed from the outset to reflect the different priorities, technologies, building traditions and cultural values of different regions and countries (Gu et al., 2006, IISBE 2007 cited by [WCED] [2]). Green Star (Australia) was launched in 2003 by the Green Building Council of Australia (GBCA). Developed to establish a common rating tool with which to measure the environmental consciousness and awareness in the green building design and construction industry, as with BREEAM, GBCA focuses on a building’s life-cycle impacts. Rating tools are under development for a range of building types and phases (LEED-ND 2017) (Table 1). All evaluation tools seek to measure the degree of sustainability of cities or of parts of them, as well as the degree of sustainability performance of each project. The assessment themes, criteria and indicators used by evaluation systems are not common to urban assessment tools, however. We therefore offer a brief description of what is meant by terms like “theme,” “criterion,” and “indicator,” as these are the main subjects of concern for sustainability. Each theme contains one or more criteria that are “parameters used to assess the contribution of a project to achieve the required objective” [1]. Each criterion, in turn, has one or more indicators that are variables providing accurate measurements. This can be better explained by an example: “Resources and the environment is one of the main themes that includes “energy” as a criterion that can be measured by indicators” [28]. Each evaluation tool presents a theme and for each theme there is a defined number of criteria. Each criterion is assigned a weight according to the relative importance it has within the sum of the criteria. These are percentages of the total number of indicators, regardless of the number of points awarded to each of them after the application of the weighting factor. Considering the CASBEE-UD, the weighting coefficients applied to the criteria and the percentage of maximum points available for the themes are different from those of LEED and BREEAM. A study of the criteria used by LEED-ND, CASBEE-UD and BREEAM Communities, conducted by Sharifi and Murayama (2014) [1,17], showed that the distribution of the criteria and the allocation of the points that each theme receives is different for each tool and that CASBEE-UD has fewer social aspects than the other two tools.” All three evaluation tools considered are based on the principles of intelligent growth and include related criteria on development in the filling and redevelopment of brownfields (Table 1).
2.2. Weaknesses of these Evaluation Systems
The literature demonstrates that these tools need to be refined. The most significant weaknesses found with these evaluation tools or systems are: (1) Sustainability Coverage; (2) Inclusion of Prerequisites; (3) Adaptation to the Setting (Location); (4) Participation of Stakeholders and Citizens; (5) Placement of the Actors in the Project Phases; (6) Presentation of Results; and (7) Application of the evaluation tool to Different Contexts [3,18,27,28].
For sustainability coverage, developers can use a more sustainable approach while improving the resilience of neighborhoods by contributing to a strong local economy that is (relatively) autonomous and has good infrastructure [28,31]. These aspects—local economy and good infrastructure—are highlighted in a study on the relationship between urbanization and sustainable urbanization, led by Brandt and Svendsen (2013) [31]. They are particularly important when addressing affordable housing needs to support inclusive communities. The health of local social networks, mixed-use neighborhoods and the local economy are key indicators of the ability of an area to adapt to various social and economic changes (e.g., gentrification) regardless of their inhabitants. In one of the few studies on the subject, Saynajoki et al., 2012—cited by Sharifi and Murayama, 2014 [1]—found that some of the indicators used in NSA tools are not very relevant for assessing a community’s health.
None of these tools has a mechanism for assessing the performance of governmental and non-governmental institutions in a neighborhood. In addition, other key criteria such as governance, decentralization, legal frameworks and instruments, information systems, research and education to institutionalize sustainable development are neglected. As these tools evolve, institutional sustainability criteria are expected to be included in sustainability lists to address the issue of governance and the need for more efficient administrative procedures [4,32]. All of these dimensions should be taken into account for sustainable development (Valentin and Spangenberg, 2000 cited by Sharifi and Murayama, 2013 [18]). The evaluation of sustainability is considered the latest generation of impact assessment tools and can be defined as “a process that directs decision making towards sustainability” [18].
Therefore, context-specific criteria should be included in sustainability assessment, as well as the appropriate weights to be assigned to the values of the relevant specific communities. Unlike BREEAM and LEED, CASBEE uses a complex scoring and weighting system to balance value-addressing issues with the number of measures available [18]. This scoring and weighting is done using a mixture of qualitative and quantitative measures [17,18]. These weightings are more complex than those of LEED, BREEAM, or Green Star and make it impossible to work on the value of each indicator until the final score has been determined. The weighting coefficients are determined by questionnaire surveys of the various users of the tool, such as designers, owners, operators and related officials. The weighting coefficients can be modified to suit local conditions such as climate, as well as to reflect local priorities and policies (IBEC 2010). Each criterion is composed of 5 levels, scored between 1 (lowest) and 5 (highest). However, this structure does not give the possibility to differentiate the points available, because the pointing levels 1 and 5 are always the only designated points. In many cases, because of this problem, one or more levels are designated as inapplicable without giving a reason [18]. This could impose an additional economic burden on the developer but it is the only way to ensure the viability and reliability of the assessment results [18].
In terms of adaptation to the location, evaluation systems should be adaptable to the type of development and to any specific questions relevant to the site [1]. For example, Cappuyns and Kessen (2012) [19] examined the relevance of using the LEED-ND assessment tool at the neighborhood level in England and in Germany. BREEAM Communities has been used in several countries in the European Community. The CASBEE-UD has been used almost exclusively within Japan and only by some Japanese cities. The Japanese government has now imposed this evaluation tool for all major projects. We found that the only country that has used CASBEE-UD in Europe is Spain, in a project to revitalize a neighborhood in Barcelona (Universitat Politècnica de Catalunya). Other criticisms are the lack of citizen participation in proposing a project, because they are written exclusively by experts [28]. The importance of the participation of different political and academic actors and of the community during the various stages of planning is widely recognized (Khakee, 1998 cited by Sharifi and Murayama, 2014 [1]). By focusing on the inseparability of planning and evaluation, this perspective suggests that the evaluation should be a discussion among all the actors who are somehow affected by the assessment and should take the form of negotiations rather than pursuing a solution to a problem [28]. Finally, citizens can participate by providing feedback that planners can use for system updates [33]. As for the use of such assessments, planners and developers can decide which changes are needed to bring about the desired economic development in alignment with environmental limits and social needs. The evaluation results can potentially be used by different stakeholders, including planners, designers, local authorities, real estate developers and residents. A sustainability assessment must provide an adequate and reliable picture of the situation in the field. It has the potential to guide decisions for planning, to guide the evaluation of actions and assess the degree of progress towards sustainable development as well as to educate residents [12]. The assessment report should be simple and transparent and must provide an adequate and reliable snapshot of the situation on the ground to avoid any unfounded decisions.
The results should be analyzed to assess their ability to meet specified goals. BREEAM Communities and LEED-ND have a similar way of presenting their final assessment. The only difference between them is that in BREEAM Communities, projects that fail to acquire minimal thresholds are labelled accordingly. In most cases, certified projects receive a label based on the rankings they have achieved. CASBEE-UD, meanwhile, to some extent addresses the deficiencies identified by presenting the results of each theme. In addition, it offers scales (weak, good, very good, excellent) that can be used to highlight certain performances [17,28]. Although the tools are tailored to the priorities and conditions of their respective countries, differences in climate parameters, in social and economic conditions and in types of developments are essential to make evaluation tools customizable [29,34]. However, this may not be possible due to various constraints. In such situations, the adopted evaluation tool should be adapted and customized using the benchmarks and appropriate weightings as part of the assessment [35]. When there are significant differences in scope, planners should be aware that one size does not fit all. A more personalized and customized tool with additional information may be required.
3. Research Design
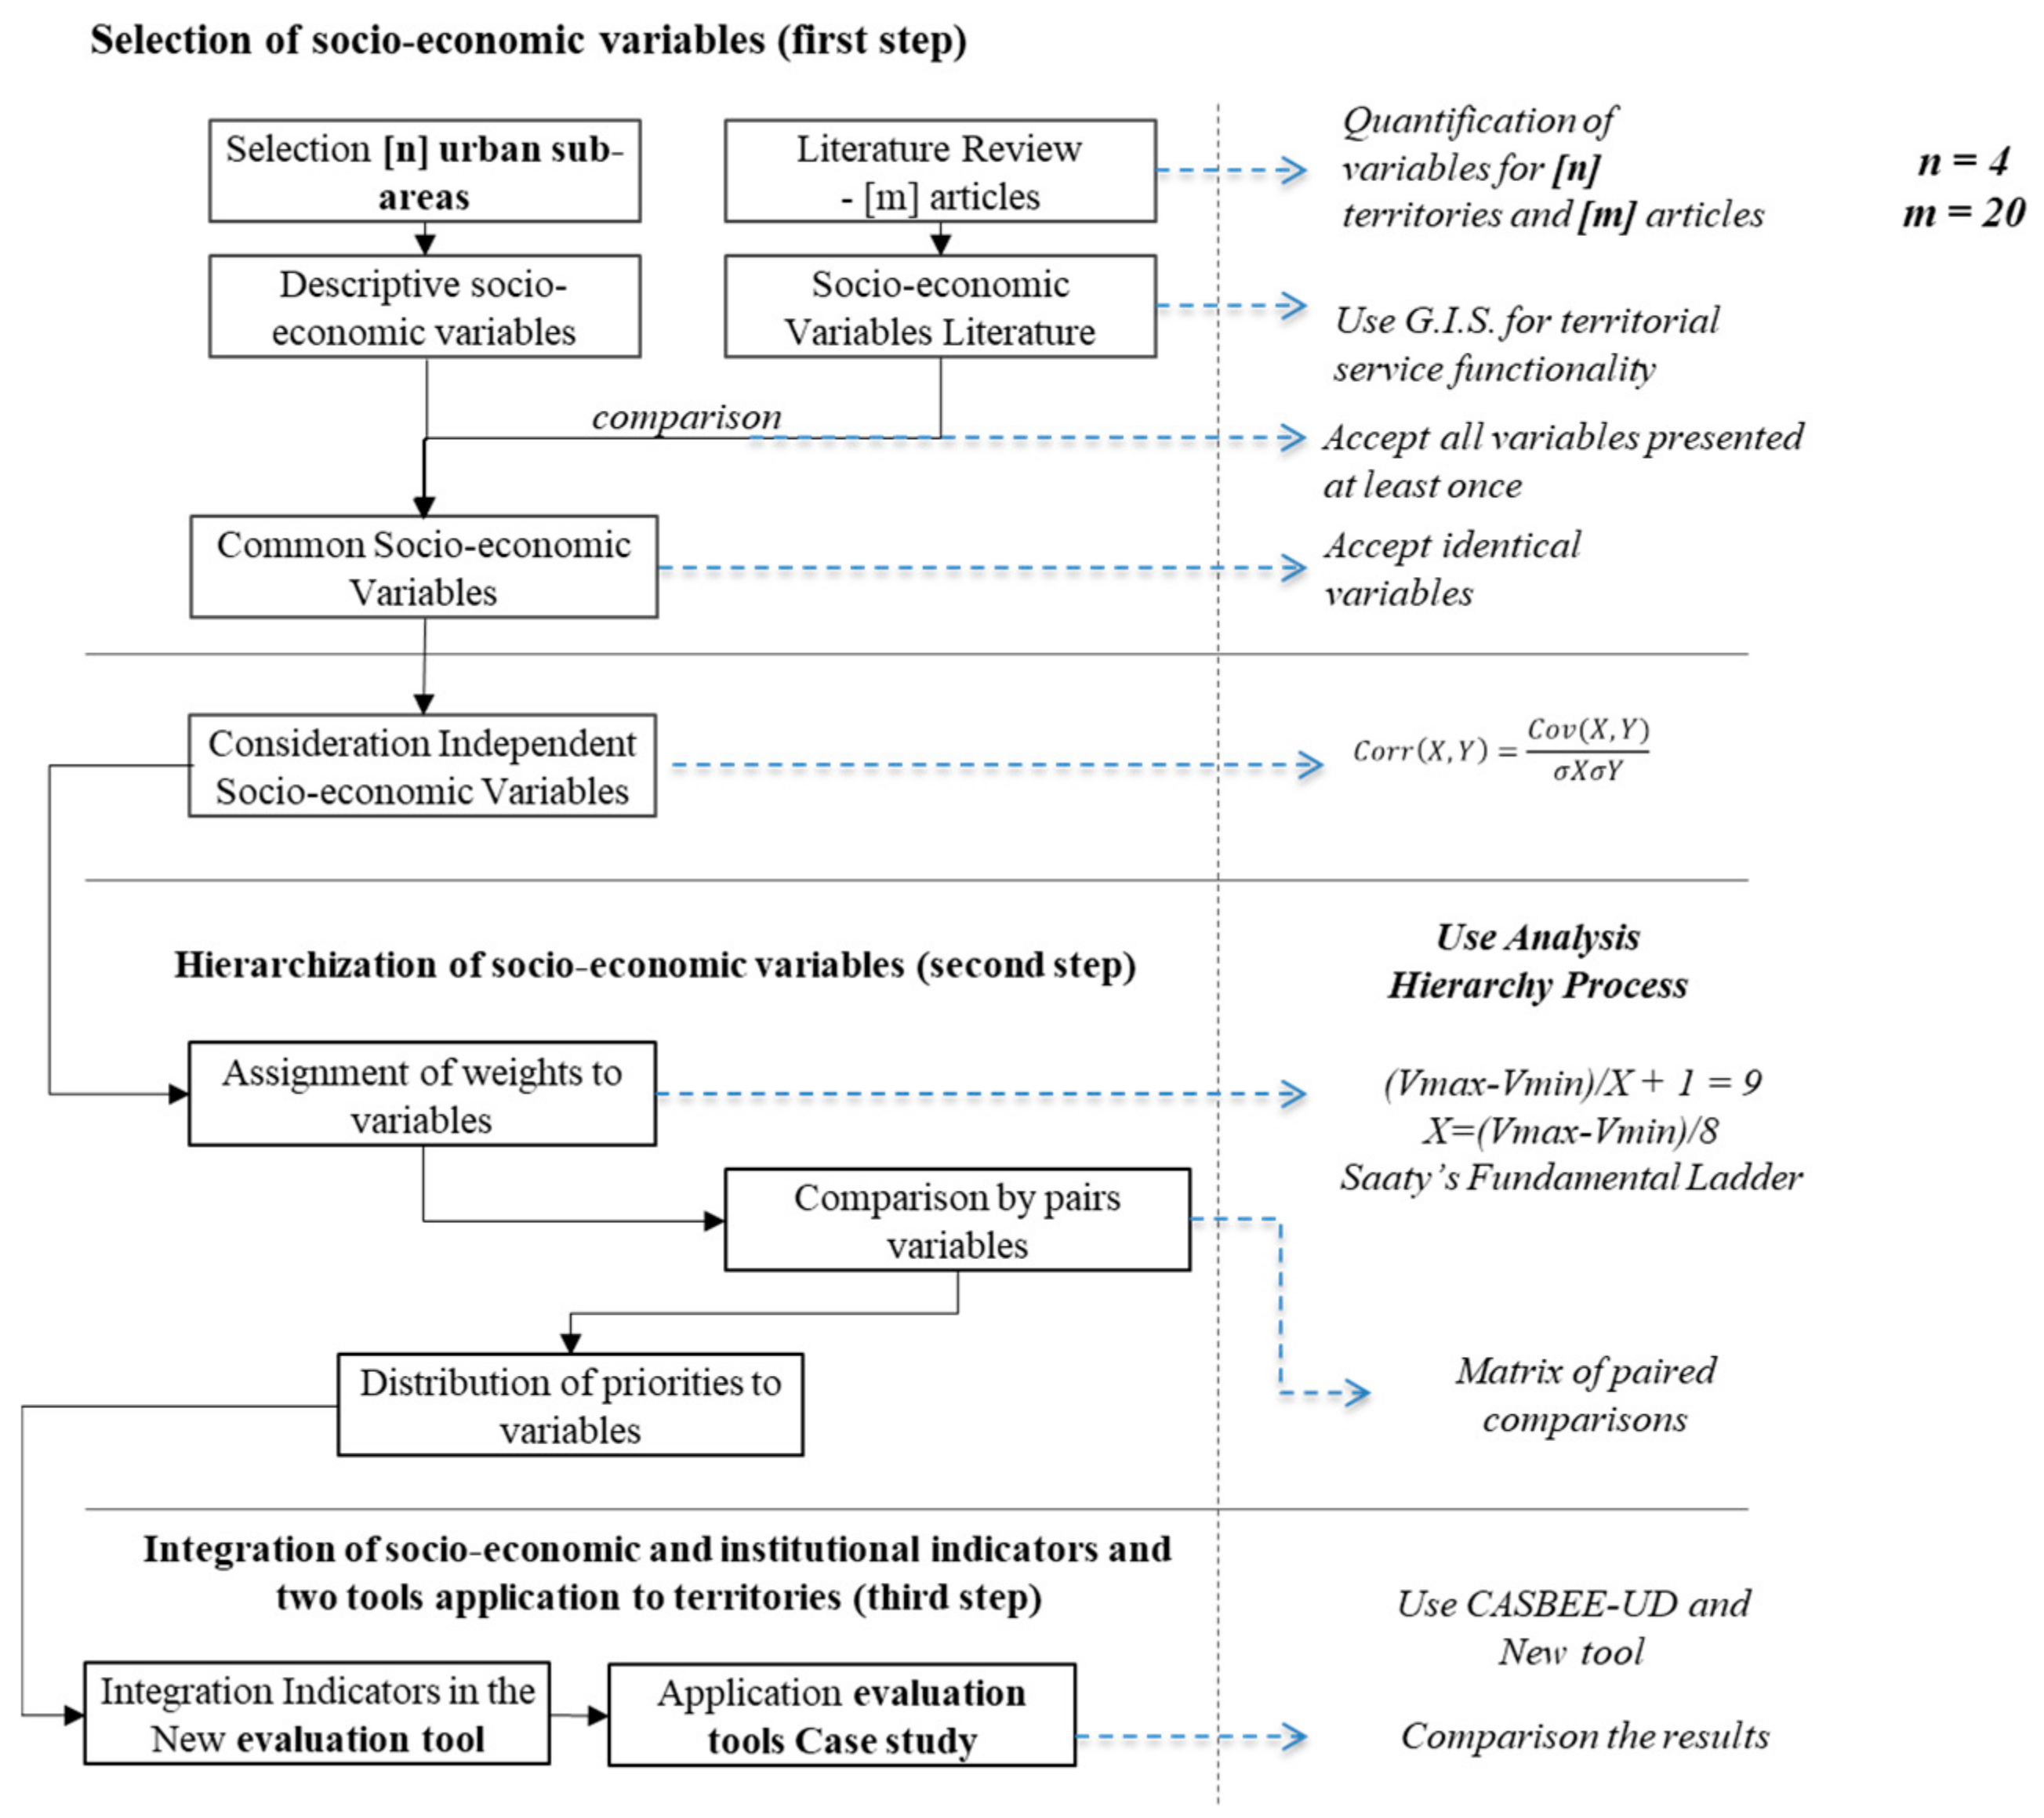
The proposed methodological approach consists of three steps (Figure 1).
In Step 1, two lists of socio-economic variables are established: variables from the data from the four selected boroughs (as detailed in Section 4), identified using statistical analysis and variables selected by reviewing the literature. Similarly, using district maps and the GIS, the territorial dimensions associated with the service functionality were identified. The GIS is composed of different layers of geographic reference information and is a technology applied to view and analyze data from a geographic perspective (ESRI), allowing the desired information to be viewed on a map. An AHP model was applied to synthesize the geographic information to select data to meet priorities that would satisfy citizens’ preferences. This information includes criteria that are based on territorial characteristics and the location of functions essential for citizens’ quality of life. This approach is a way to represent the true diversity and distribution of the services within a territory.
Socio-economic indicators were identified by means of a tool for decision support based on a multi-criteria AHP [36]. The AHP makes it possible to determine the cost-benefit ratio of a project, including the less-tangible advantages and disadvantages of its implementation. Using the AHP, we applied an equation to weigh, prioritize and integrate our criteria into the CASBEE-UD certification system. This phase offers the possibility of assigning points and dividing them into the three selected dimensions. Next, the Pearson’s Correlation Coefficient was computed, putting one indicator next to another, as shown below.
where Cov(X, Y) denotes the covariance of the variables X and Y, and σX and σY denote the standard deviations. These results offered minimum values that eventually allowed us to remove some indicators from the final list (−0.5/0.0 and 0.0/0.5). We then accepted all of the strongly correlated variables between −1/−0.5 and 0.5/1.0.
Step 2 is where we prioritize the socio-economic indicators using the multi-criteria analytic hierarchy process (AHP). The variables were first calculated and then standardized, using Equation (2), before being used in the hierarchical analysis process.
Equation for Standardization Criteria:
where X is the scaling factor for converting a set of numbers with a maximum attainable value and a minimum attainable value of Vmax and Vmin, respectively, to express the comparison of pairs of two generic numbers of a set on a scale between 1 (indifference) and 9 (maximum prevalence). The difference between the maximum (Vmax) and the minimum (Vmin) values denotes the highest prevalence, so it must be equal to 9. In other words, (Vmax − Vmin)/X + 1 = 9. Thus, the pairwise comparison between Vi and Vj, with Vi greater than or equal to Vj, is equal to (Vi − Vj)/X − 1, with X = (Vmax − Vmin)/8; if Vi = Vj, then (Vmax − Vmin)/X + 1 = 1. This is a scaling factor X that scales the numbers of a set to express the pairwise comparison according to Saaty’s semantic scale, which ranges from 1 to 9 [36]. In our case, (Vmax) was the maximum cited value of the total number of criteria and (Vmin) was the minimum cited value of the total number of criteria.
Step 3 has two parts. The socio-economic indicators found in the second stage are included in the CASBEE-UD in the first part and then both tools, CASBEE-UD and CASBEE-UD with the new indicators of the selected territory are applied. The new results were then compared.
To integrate the indicators in the CASBEE-UD evaluation tool, we first chose to integrate only those indicators associated with economic and social dimensions. After choosing our indicators, a number of performance indicators were defined based on the objectives of the territories and values selected in the first step.
We propose that this type of approach leads to innovative solutions, both through the application of technological developments and by redefining the governance process. This creative dimension is integral to the philosophy of this type of project. It also has proven to be a successful factor in the implementation of an increasing number of sustainability criteria.
3.1. The Analytic Hierarchy Process (AHP)
The AHP approach is divided into four stages [36]: prioritization of the indicators by importance, constructing a matrix based on the pair-wise comparison of those indicators, determination of the weights associated with each indicator using an eigenvector calculation method and finally checking the consistency of the results.
3.2. Prioritization of Indicators by Importance
This step establishes the priorities between indicators belonging to the same criterion, according to the principle of importance. Let [I1, I2, ..., Ii ..., In] be the set of indicators whose weighting coefficient is sought. According to the principle of prioritization, [I1] is more important than [I2] which is more important than [Ii−1] which is more important than [Ii]. At the end, [In] is the least important indicator.
3.3. Comparison of Indicators by Importance
To establish preferences, a scale of values must be chosen to specify the degree of importance of one indicator over another. We adopt the value scale of 1 to 9 [36], making it possible to introduce the decision-maker’s judgments in a closer approximation to reality. The comparison between all the indicators gives the following matrix and Equation (3):
where [aij] is the intensity of the importance of [Ii] on [Ij] and [wi] is the weighting coefficient associated with [Ii].
3.4. Determining the Weights Associated with Each Indicator
In this step, we calculate the vector of the weighting coefficients W = {w1 ... w2 ... wn}. We divide each [aij] by the sum of the values of the corresponding column and then calculate an average per line. Each coefficient [wi] is then obtained by Equation (4). The sum of the [wi] values must be equal to 1:
where [ail] is the intensity of the importance, [akl] is sum of the values of the corresponding column and [n] represents the total number of coefficients.
Assigning weightings to the variables begins with using the Saaty scale to standardize the variables and then integrating them in the pairwise comparison matrix. The weights of the indicators are determined by the values of the calculated indicators. For example, for the criterion “accessibility,” the weights of the indicators are calculated by Equation (4).
3.5. Verification of the Consistency of the Result
A great advantage of the AHP is that it calculates a coherence index, which in turn makes it possible to evaluate the calculations made. In other words, it allows to verify if the scale values (1–9) assigned by the decision maker are coherent or not. It also provides a measure of the probability that the matrix was completed purely at random. For example, if the ratio (CR) equals 0.20, this means that there is a 20% chance that the decision maker has answered the questions in a purely random way. We define the vectors:
[λ1 ... λi ... λn] and [λ′1 ... λ′i ... λ′n] by Equations (5) and (6)
The consistency index (CI) is then:
To compute the consistency ratio (CR), the consistency index is divided by a value the Random Index (RI) depending on the number of indicators (or the matrix size) (n) given by Table 2:
Weight assignment is considered acceptable if the CR is less than 0.1. If not, the procedure must be applied again.
3.6. Aggregation of Indicators
A complete aggregation of indicators was selected for this study. All of the performance indicators are combined in a mathematical formula to obtain a single value for each criterion. The linear addition method (also known as the weighted sum method) is used here, one of the most widely-used aggregation methods [37,38]. It assigns a performance score to each [PIi] indicator that will be multiplied by a weighting coefficient [wi]. The sum over [n] indicators gives an aggregate performance result, expressed in an overall score according Equation (7):
where PCj is the performance score for criterion Cj, PIi is the performance score for indicator Ii of criterion Cj and wi is the weighting coefficient for indicator Ii of criterion Cj.
The application of the AHP relies on the determination of the matched comparison matrix to determine the priority vector. The calculation of the value of each index of the matrix is determined by the ratio of the occurrence indicators.
4. Results
4.1. Study Context
The study area is comprised of four boroughs in the city of Montreal (Canada): Ahuntsic-Cartierville, Plateau Mont-Royal, Southwest and Lachine (Figure 2). These boroughs have different economic, environmental and urban characteristics. The respective governments of the boroughs selected for this case study have for the past 20 years been investing in significant urban changes (revitalization of industrial wastelands, enhancement of the existing built environment and new urban developments). The data includes social variables (residents, workers, students, accessibility, site security, historical components, inclusion/integration levels, etc.) and economic indicators (vehicle ownership, incomes, job types, buildings, job diversification, etc.). The database comes from the 2016 official population census (Statistics Canada) and each borough’s own data. Spatial data were obtained from Montreal’s land use maps and street maps. Spatial data was also analyzed using GIS software. All data were prioritized with the use of AHP.
4.2. Step 1: Search for Independent Variables
In this step, we prepared data which shaped the variables and influencing factors that contribute to socio-economic aspects in each borough.
Definition and calculation of independent variables:
Population Density. Population is a source to provide thresholds for providing services and amenities. This variable does not indicate much by itself, but when used as a rate like density, it can be very helpful for imaging neighborhood conditions. A population map of official 2016 census data was prepared. This map overlays each borough in a GIS environment. Population density was calculated by dividing each neighborhood’s population by its area. This variable gives the average density of each neighborhood’s population (Statistics Canada) [39].
Green Pedestrian Margin. Green Pedestrian Margin helps to make a neighborhood attractive for pedestrians and cyclists, as well as for residents and workers. To calculate this variable, we first determined the area from an existing map (in hectare measurement) and then divided it by the total street kilometers to find the average value of streets per ha/km (City of Montreal) [40].
Land Use Diversity. People generally select the closest facility in their locality. This selection preference covers the fact that some services like post offices mostly cover special areas. However, people may travel to other facilities due to differences in quality or uniqueness like cinemas, specialty shops and recreational facilities. In this study, we selected each service and other facilities with an area greater than 250 (m2) and calculated the average distance from neighborhood homes to these services within a radius of 500 (m) and of 1000 (m) (City of Montreal existing maps) [40].
Historical Activity. This aspect is based on the presence of traditional activities (for example cabinetmaker, glazier, shoemaker, framer, luthier). The variable is calculated from the total number of each type of historical activity, divided by the total number of jobs in each borough, thereby determining the percentage of each type of activity (Statistics Canada) [39].
Government Inquiries. This variable is an indication of issues that are important to citizen and often controversial. These may include issues such as government structure, treatment of minorities, events of considerable public interest or economic issues. This variable indicates the number of inquiries made in each neighborhood (Borough’s Government) [40].
Housing Diversity. Based on the characteristics of housing construction in each borough, this variable makes it possible to determine the age of each house and the milestones that a borough has gone through in its policies of urban expansion. This variable is calculated from each type of housing divided by the total number of residences. This variable thus indicates the percentage of each type of residence. (City of Montreal maps) [40].
In the context of statistical analysis, we selected variables independent of socio-economic aspects. We extracted independent variables from 20 articles in the literature and from data of the four selected boroughs (Table 3). We selected any variables that were quoted at least once. Comparing the two lists of variables, we then selected 31 equivalent variables (Column 3—Table 3). After calculating the Pearson coefficient, a list of final variables was obtained (Column 4—Table 3).
Indeed, all of the selected variables have a correlation and influence the criteria used in the CASBEE-UD. For example, all of the variables related to transportation can be used to evaluate both active transportation and public transportation. However, we believe that transport must be evaluated as a whole, so that the tool will be able to be used in more situations. The other variables that we have chosen to integrate into the CABEE-UD are those that have a connection to the accessibility of the site. As shown in our analysis of the tools in the context section, we observed (see Table 1—Breakdown of evaluation tool Credit Categories) that in the CASBEE-UD only 3% of the points are related to this aspect. For example, variables such as street intersections and distance to services, which have a connection to neighborhood accessibility, show the effectiveness of supporting a sustainable neighborhood. Calculating the correlation coefficient between such variables and the road system reveals that this system has a strong correlation with street density, intersection density and mean batch density and negative correlation with the average block length.
The road system also indicates that it has a strong correlation with the proximity of a public transport station and a correlation with the green areas (Column 4—Table 3). Obviously, density is strongly correlated with the proportion of apartments and the diversity of the housing stock (Column 4—Table 3).
The most representative weighting scores for socio-economic variables are indicated in Table 3. For example, distance to the station, population density, public transport options and land use.
Other key variables are also included: the number of jobs, the number and type of activities in the neighborhoods and job diversity these variables have scores ranging from 0.962 to 0.856 and influence a neighborhood’s sustainability assessment. The water surface variable appears to have less impact on a neighborhood assessment score, as its score is only 0.622. (Column 4—Table 3). Other variables that have a positive effect on the evaluation are those related to heritage conservation; cultural and historical environments have a score ranging from 0.8 to 0.531. As for the calculation of the correlation coefficient with respect to land use, the correlation of distance from the shopping areas is high at 0.883 and even more so for the local primary school, 0.893, while the distance correlations with green space and with industry are slightly lower at 0.794 and 0.741, respectively (Column 4—Table 3).
As explained earlier, after the calculation of the Pearson coefficient, we chose to only use those variables that were highly correlated and thus only considered variables with a minimum score of 0.8. Table 4 contains the list of these selected variables.
4.3. Step 2: Hierarchization of Socio-Economic Variables
Having identified the final indicators of the socio-economic aspects, we apply the multi-criteria method (the AHP) to determine the weights for each dimension (criteria) and indicator (sub-criteria). This step is fundamental for the identification of the points for each dimension and to know the importance of each indicator in the alternatives (dimensions). The application of the AHP relies on the determination of the paired comparison matrix to determine the priority vector. The calculation of the value of each index of the matrix is determined by the ratio of the occurrences of the best indicators. For the calculation of priorities (indicators that need to be prioritized in order to understand their distribution in the CASBEE-UD), both with regard to the criteria and sub-criteria and with regard to the possible solutions, we used the average geometric method. The opinions expressed in the literature were examined and the criteria and sub-criteria for the two alternatives (CASBEE-UD and CASBEE-UD with integrated indicators) were added in order to construct a matrix of paired cumulative comparisons on which to apply the method. The geometric mean was then used to obtain the priority vector as presented in the methodology section. To calculate the weight of the criteria, we used the analysis conducted through the review of the literature and data from the four boroughs. Our approach differs from the conventional approach that usually relies on expert consultation to obtain their opinions and thereby determine the criteria prioritization. Instead, we identified the importance of criteria (prioritization) based on their occurrence in the literature. The selected articles necessarily had to deal with the three dimensions of sustainable development (environmental, social and economic) in an urban planning context (brownfields, new developments, etc.). The results obtained from the 20 articles and the boroughs’ statistical data were then placed in order of preference for each criterion. Then, utilizing the fact that each criterion based on its given position could obtain a maximum score of 24 (top of preferences) or 1 (bottom of preferences) we obtained the score indicators listed in Table 5.
For each variable initially selected, the process development was as follows:
- (1)
- Determine the number of references in which the variable appears;
- (2)
- Build the relationship matrix (Equation (3));
- (3)
- Calculate the weight to be associated with each of the variables (Equation (4)).
This hierarchical classification allows us to proceed with the normalization of our variables. As described in the methodology section, this normalization was accomplished using the AHP method. We obtained the normalization presented in Table 6 by utilizing Equation (2):
The standardized variables were introduced into a matrix of paired criteria comparisons. Using the prioritization matrix, we obtained the weights of our indicators, thereby allowing us to divide them into their dimensions in order to integrate them into the new CASBEE-UD evaluation tool.
After calculating the weights of the variables with Equation (3) we determined the weight for each variable with Equation (4). The resulting weights of each variable are given in Table 7.
The consistency of the results was verified by comparing them with the table of coefficient values (RI) and utilizing Equations (5) and (6). The consistency calculation makes it possible to determine if the weights assigned to each variable are considered acceptable according to the scale of the values’ comparison.
Employing Equation (7) allowed us to obtain the performance values of all of the variables. At this point we added other variables that already exist in the structure of CASBEE-UD to our previously-selected variables. The aggregation of these variables then allowed us to assemble the thematic fields and neighborhood settings presented in Table 8.
Table 8 contains all the variables that we have taken into account, both the new variables (in bold) and those that were already present in the structure of the CASBEE-UD. We integrate these new variables into the social dimension and the economic dimension. After the aggregation of all the variables we integrated them and applied both tools to the selected territory.
4.4. Step 3: Integration and Application of the Two Tools to the Territories
As shown in Table 8, we classified the indicators in their respective dimensions before integrating them into the CASBEE-UD evaluation tool. We then applied this new tool to each of the four boroughs. From the literature, it is clear that evaluation systems look for some sort of common measure [1,7,17]. In the interest of standardization, it is important to ensure that all certification steps are measured in the same way to offer reliable, consistent information to urban development decision makers.
To determine the allocation of points for each dimension, for our new evaluation tool we assigned points that reflect local expectations that the areas to be improved are of roughly equal importance. Out of a 100-pt scale, we assigned 30 points for the environment and 30 for the social aspects and shared another 30 points for the economic aspects between 10 points for aspects strictly related to finance and employment and 20 points to account for the economics of the land use and the built environment, such as mixed use and compact development (Table 9).Transport was assigned the last 10 points and while we added indicators to evaluate all types of transport, it has the same number of points as established by the CASBEE-UD.
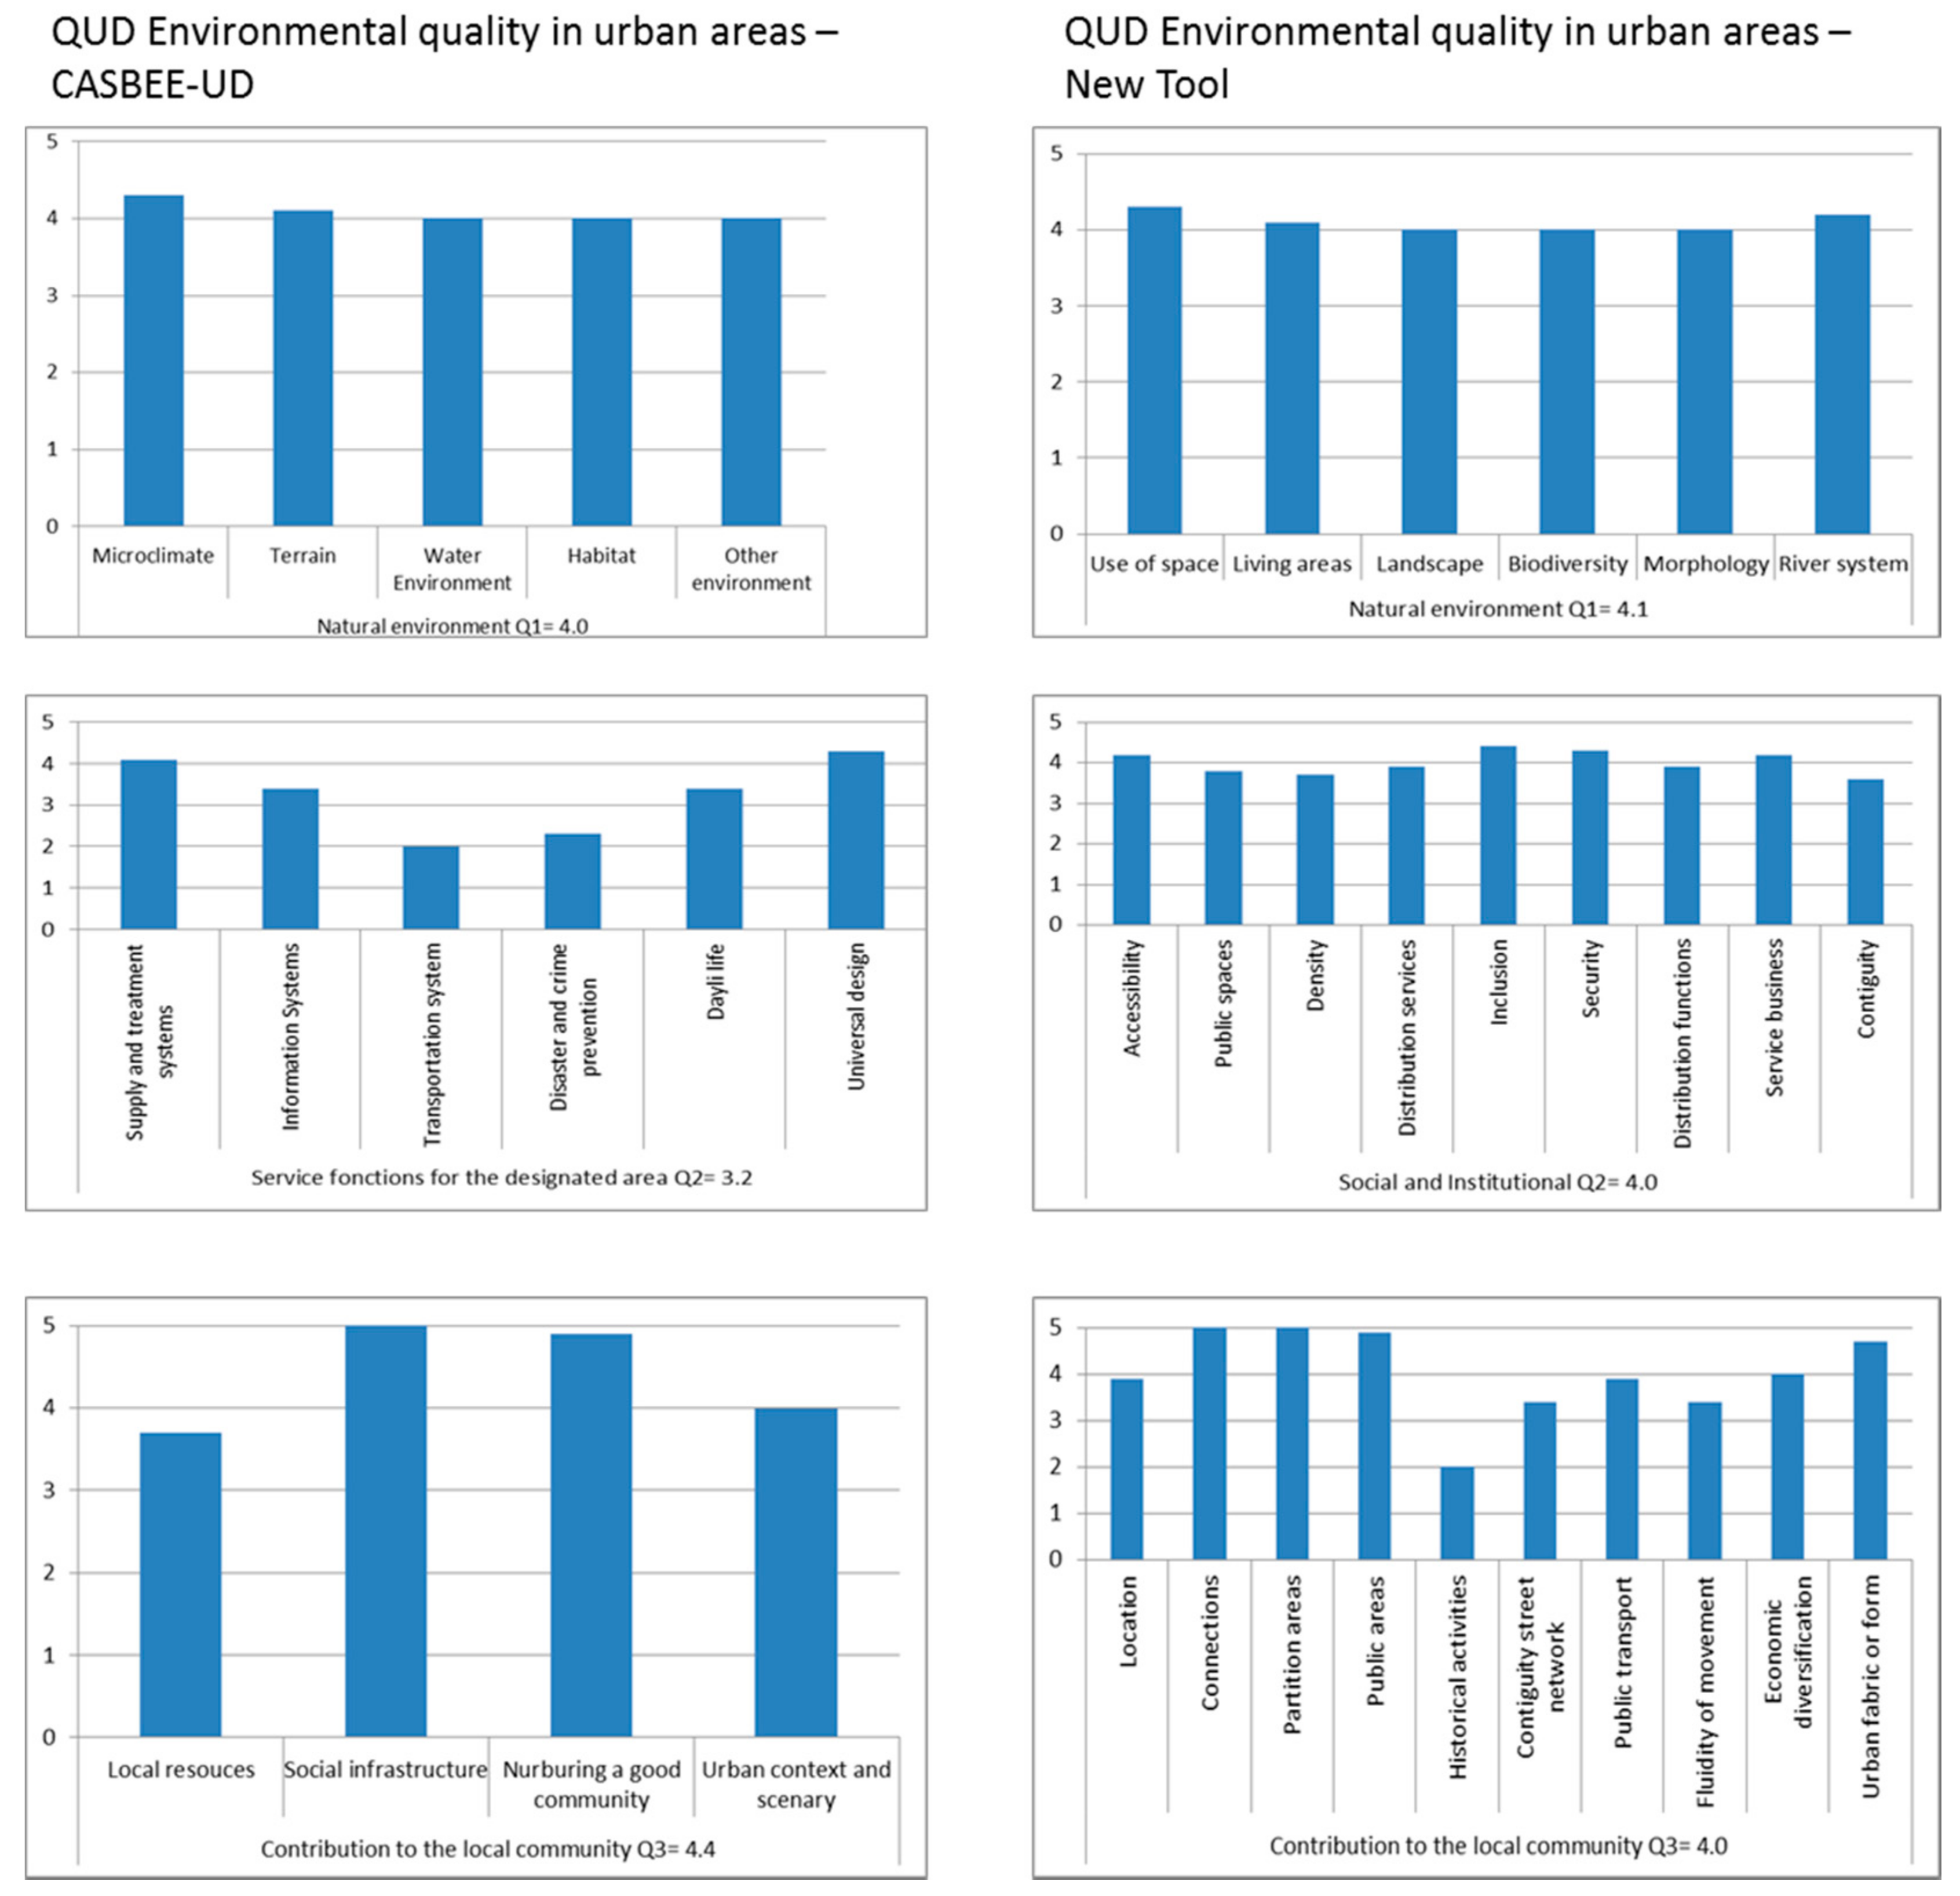
After applying the standard to the four city boroughs, we can observe the differences between the two assessment tools. As the charts in Figure 3 and Figure 4 indicate, the tools evaluate each theme differently, according to the indicators contained in each tool.
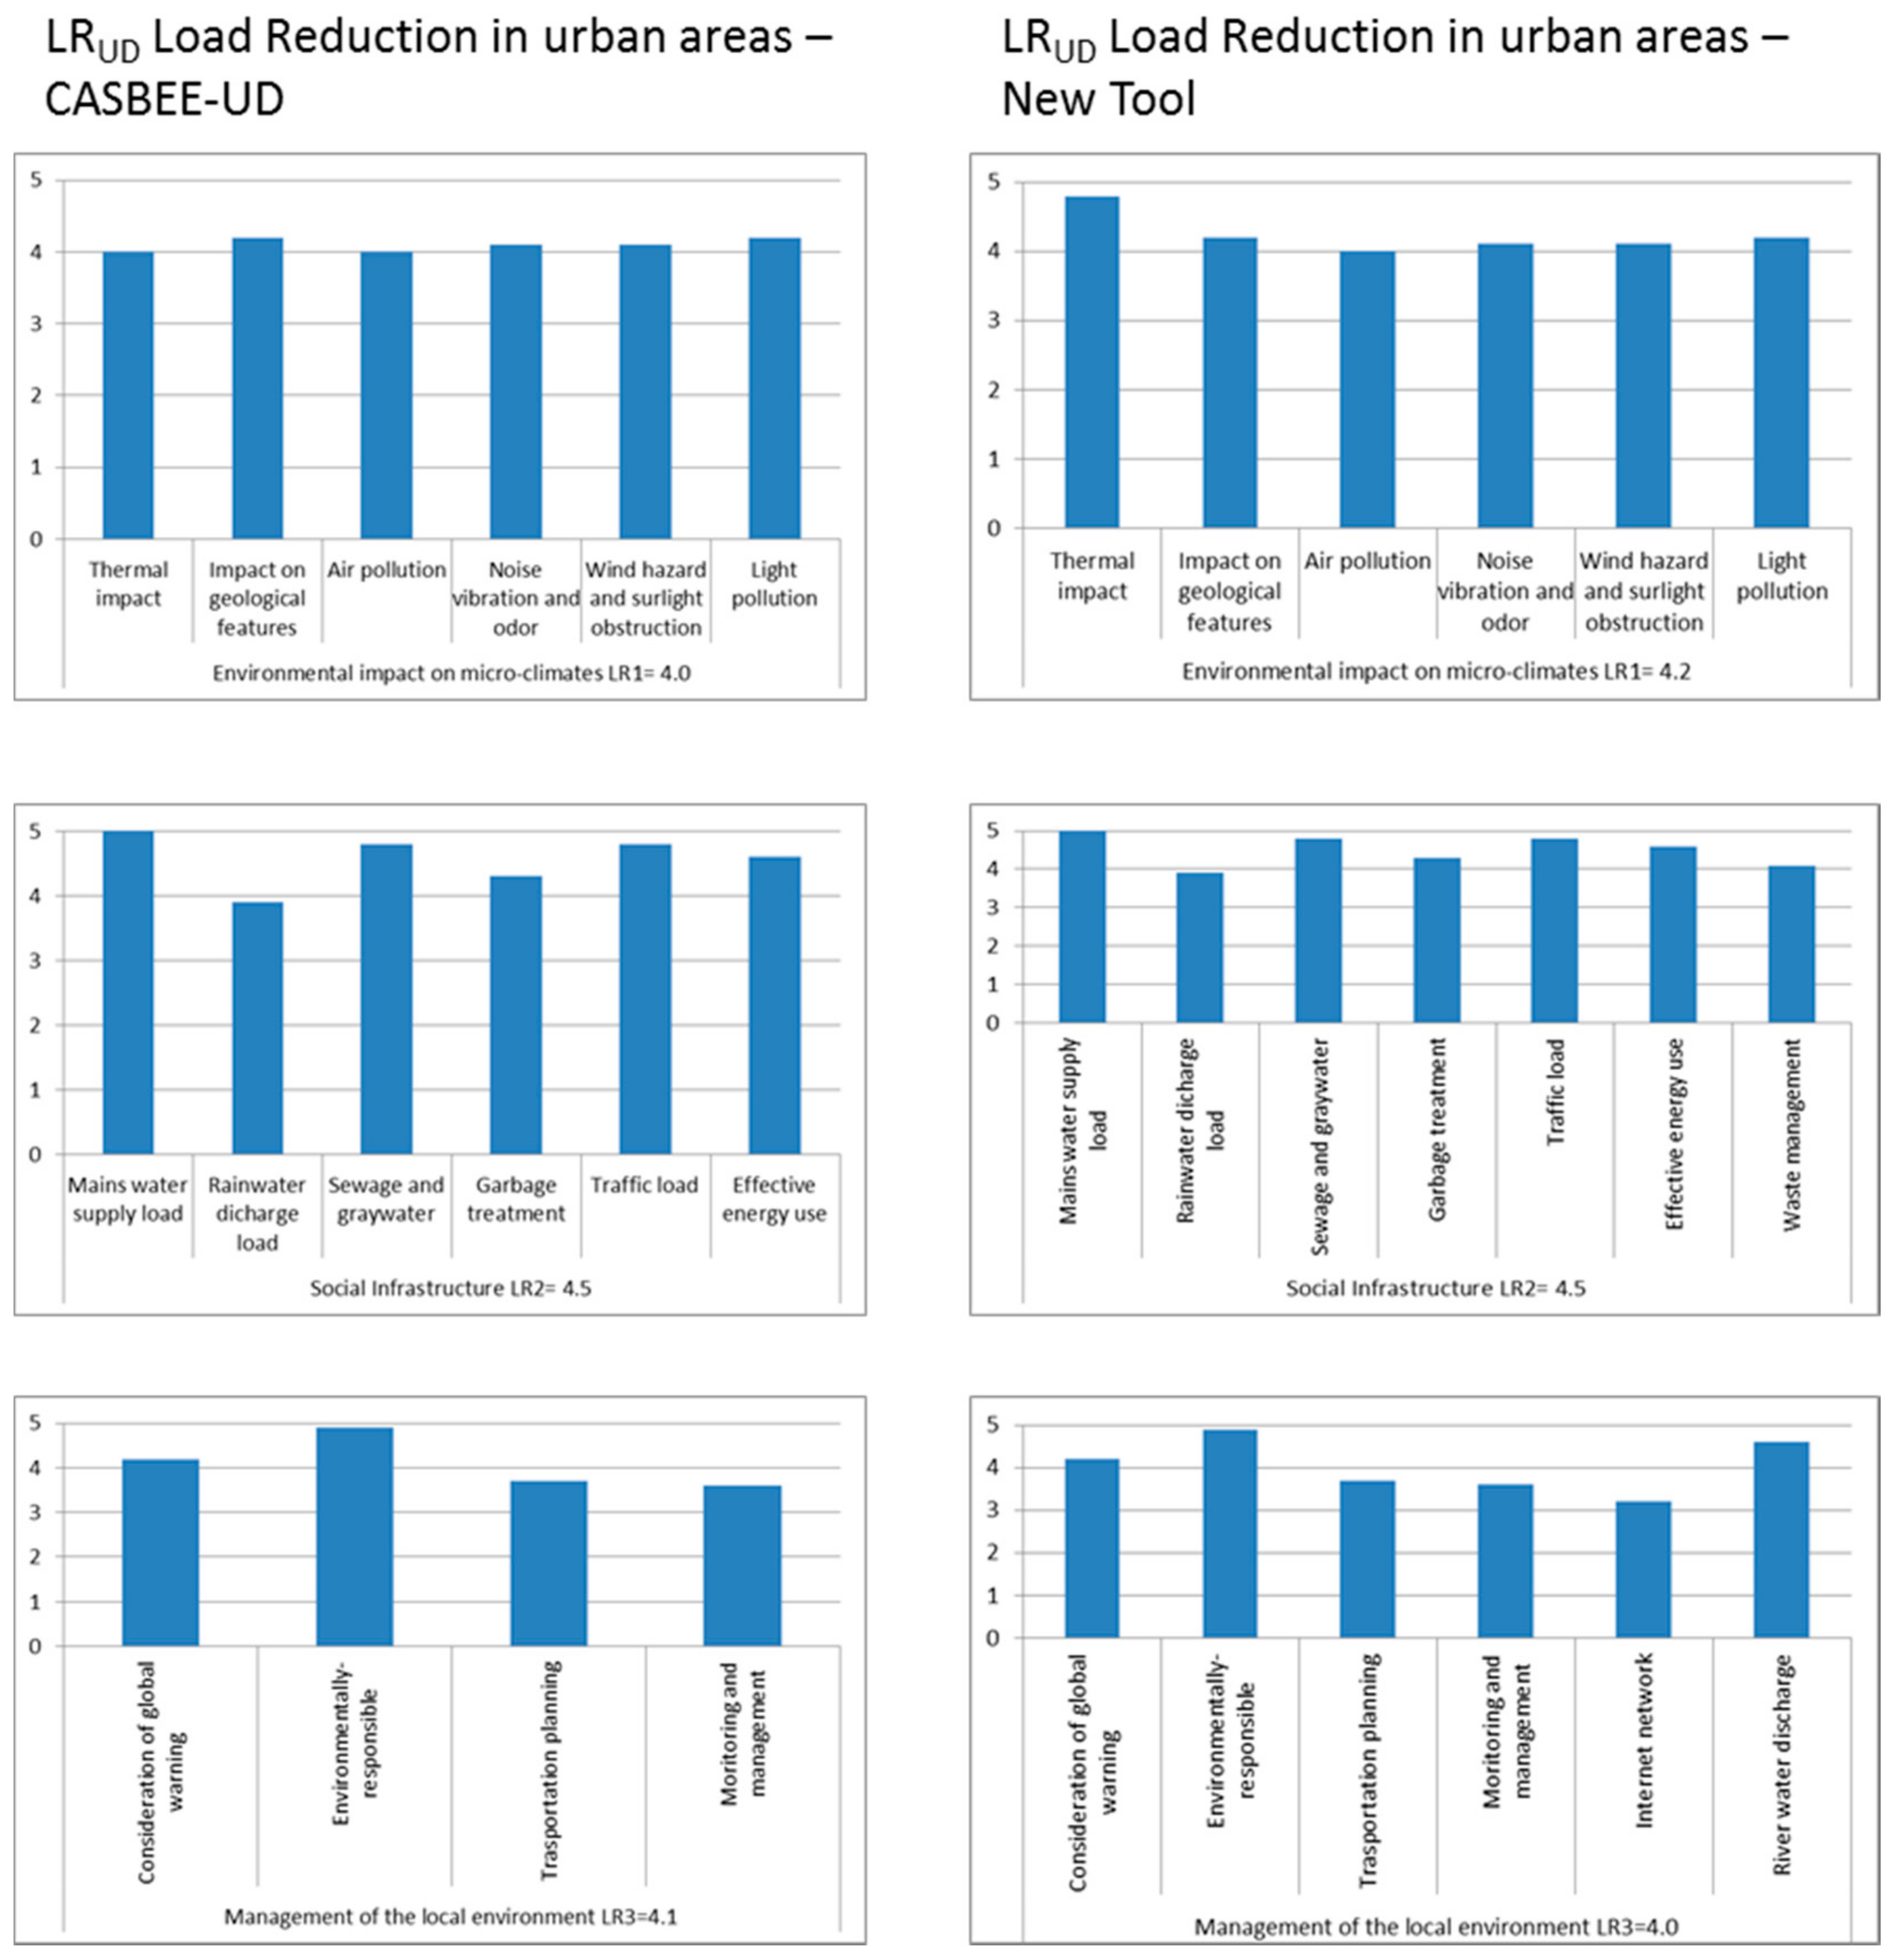
In the areas evaluated, some the local expectations were not respected, a circumstance that does not allow the new tool to assign a maximum point score for the social aspects. However, in general, for social aspects the new tool gives a higher score than the CASBEE-UD. Indeed, the Environmental Quality Assessment (SQUD) for the new tool has a score of 4.0 compared to a score of 3.8 with the CASBEE-UD. In the Load Reduction (SLRUD) evaluation the two tools are almost equal in their assessments. This very similar result was expected, because for this evaluation the CASBEE-UD structure was left almost unchanged; only two indicators were added in the evaluation of social aspects and two for the evaluation of economic aspects.
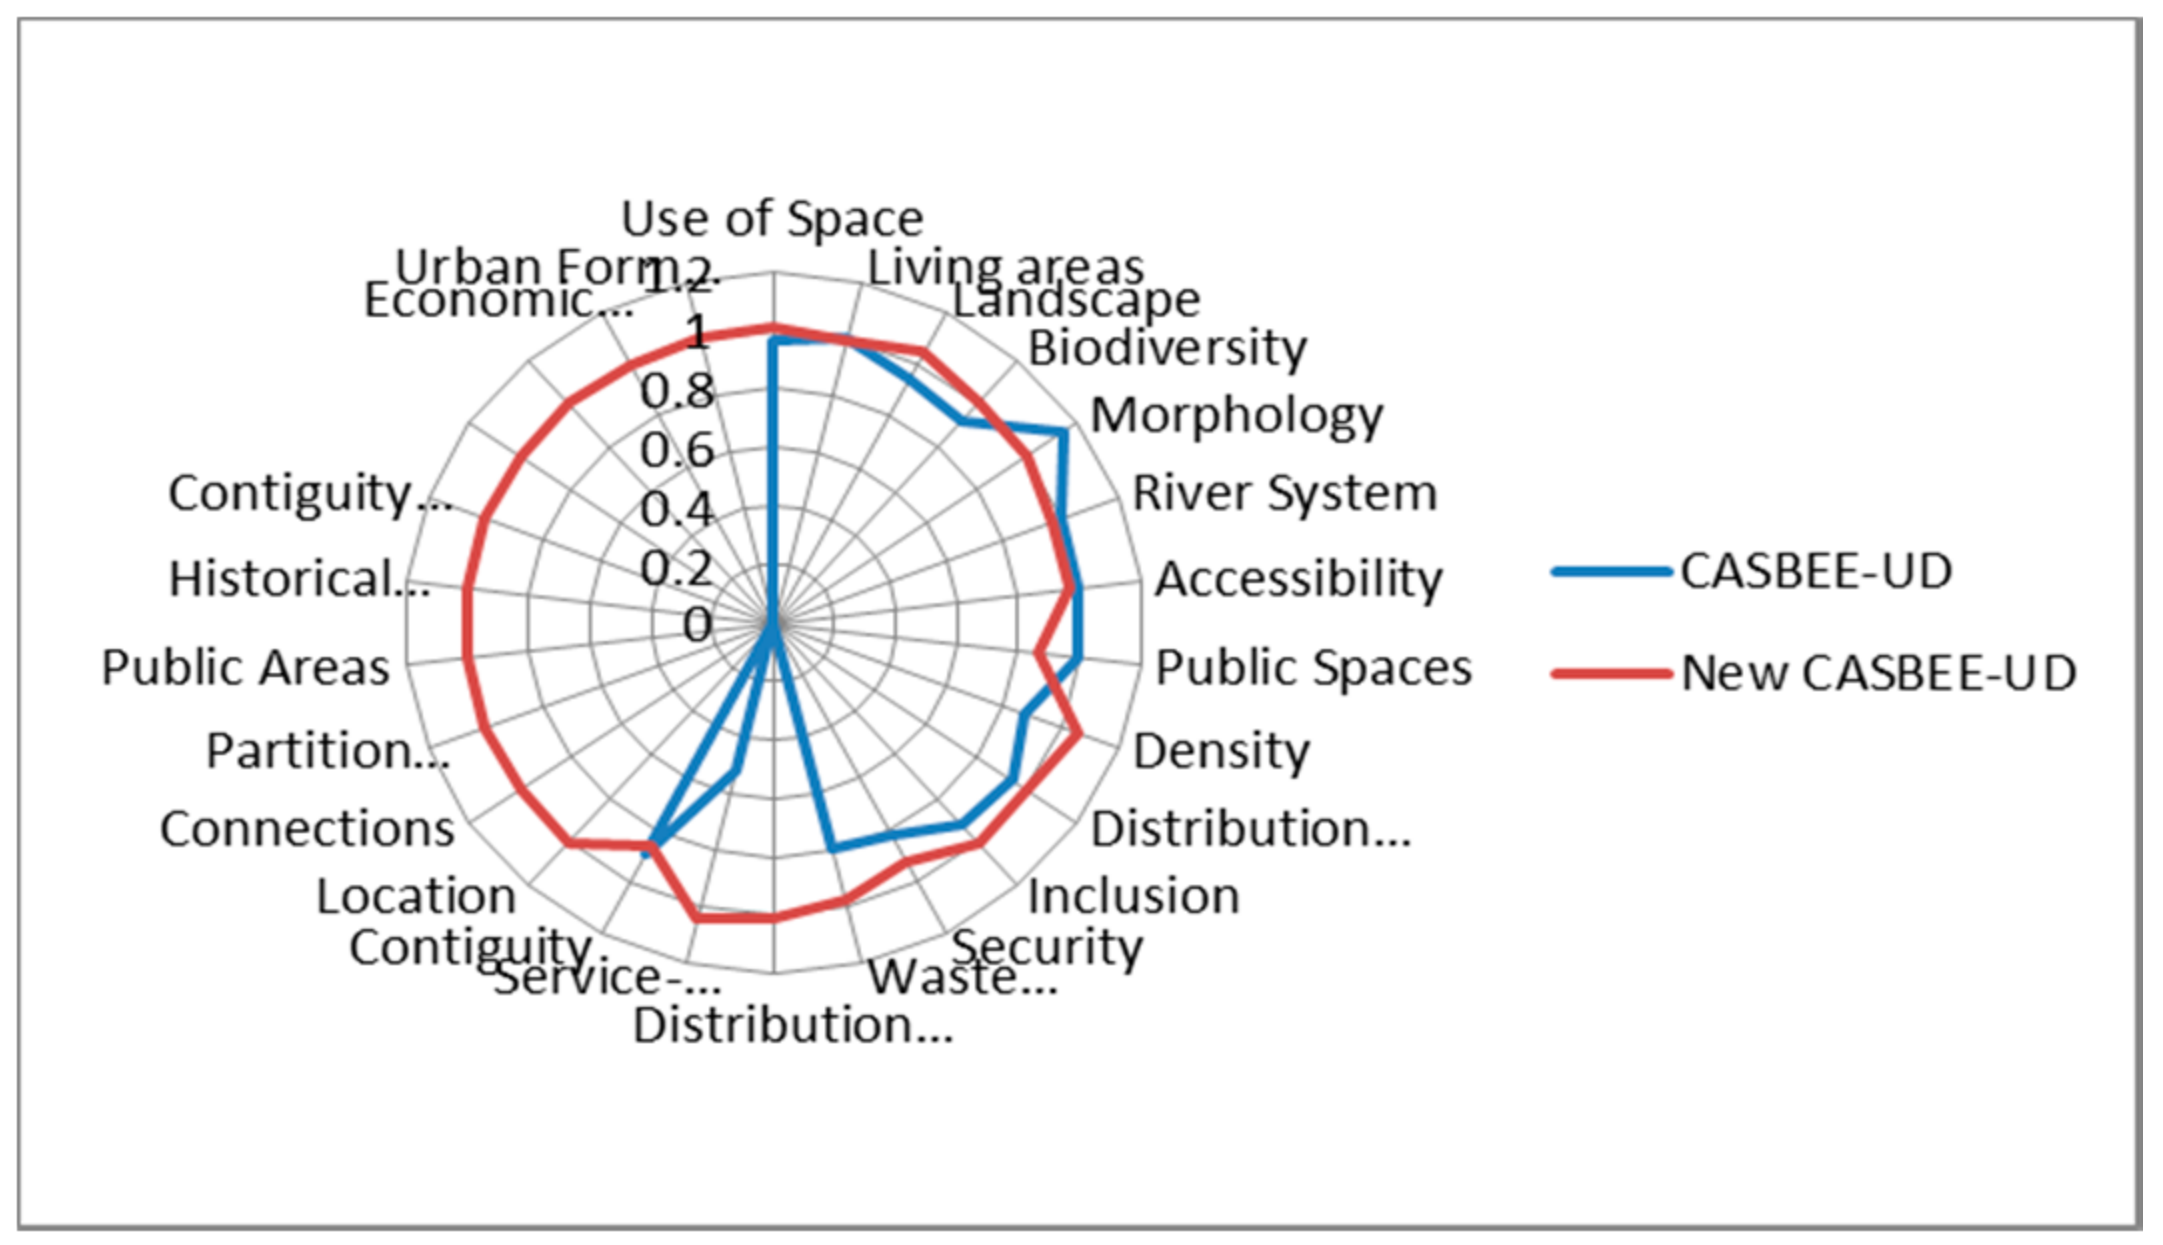
The results of the integration of socio-economic aspects in the CASBEE-UD are reassuring, as the radar chart shows that there are differences in the evaluation of the same territory (Figure 5). Figure 5 shows the improvement of the CASBEE-UD evaluation tool taking into account the socio-economic aspects of integration (in red) compared to the results of the CASBEE-UD without socio-economic criteria (in blue).
The strategy used for the assessment of boroughs in urban areas poses a difficult challenge as it must take into account various objectives and tasks that are often inconsistent with local socio-economic and political realities.
From the results obtained here, we can see that the dominant solution is the evaluation tool with socio-economic indicators. Based on our analysis of the results of this study, the proposed methodology improves the ability of an assessment tool to carry out quantitative and multidimensional assessments of specific territories.
As shown in Table 10, the AHP revealed that the new assessment tool that incorporates 12 variables performed better than the CASBEE-UD.
5. Discussion
Assessment tools are structured to take into account economic, social and environmental sustainability. However, the majority of these methods evaluate “green” performance regardless of social and economic issues and problems (Cole, 1999 cited by Sev, 2011 [14]).
In fact, an evaluation tool must take into account multiple aspects, including: (i) the availability of resources, (ii) economic viability and (iii) social acceptance. (Cole, 2005 cited by Sev, 2011 [13]). For example, Japan has developed innovative policies for its cities (e.g., Tokyo, Osaka) in recent years utilizing their CASBEE-UD assessment tool.
The objective of this study was to integrate more socio-economic aspects into the CASBBE-UD evaluation tool and to apply and analyze its evaluation in four boroughs of the city of Montreal. The comparison of two tools (the CASBEE-UD and the new tool) gave us the opportunity to appreciate the contribution of the integration of these indicators. The evaluation assigned a positive score for environmental efficiency based on the environmental indicators that are already in the structure of the tool. But what we were most interested in was the evaluation of the territory in terms of the socio-economic indicators that we integrated. The evaluation gave a rating on these aspects based on site security, affordability and accessibility.
Regarding the evaluation of economic indicators, the new tool gave a rating based on employment differentiation, the distribution of services and historical activities and the contiguity of the street network. However, with the CASBEE-UD methodology, we could not compare economic indicators with certain social indicators because these indicators are not included in the manual, such as the urban renewal index, the proportion of pedestrian-priority streets, the number of schools, the number of services per capita and so forth.
As demonstrated in this study, the CASBEE-UD assessment tool needs to be structured so that all dimensions can be covered with appropriate indicators. We used the inclusion and security of the site as an example. Another problem with CASBEE-UD is the distribution of the weight of the different criteria, as certain performance criteria for these tools have a greater positive impact on the environment than other criteria. The performance criteria must be applied locally and weighted according to the situation of each site. Therefore, weighting should be done according to a hierarchy of criteria developed at the local level. This local weighting can meet both community expectations and pre-set objectives when designing a project. A consensus-based weighting system, developed according to local and regional priorities, will more accurately reflect community assessment [14,17].
Another criterion that the CASBEE-UD tool does not address is to evaluate the presence of affordable housing. Having affordable homes is necessary in a neighborhood, as it allows for a social mix, access to different types of jobs and also allows a neighborhood to enjoy a level of stability. Again, we found that the specificity of a site must be taken into account. Building materials and technology, the labor supply, the availability of water and electricity are the main site-specific factors that are generally not taken into account.
Most assessment tools encourage the use of public transit and bicycles which is easy in the urban areas of most developed countries. However, CASBEE-UD is the only tool that does not have indicators in the transit system evaluation category “MOBILITY AND TRANSPORT” (Subcategories “Public transport and other sustainable alternatives”—No Indicators “Efficiency of public transport”—No Indicators) because public transport is the most typical means of transport in Japan [7].
It should be noted that in some cases CASBEE-UD assigns a score almost equal to that of the new tool. For example, in transport where CASBEE-UD offers a score of 3.7, with the new tool New CASBEE-UD the score is 3.9. This can be explained by the fact that CASBEE-UD has only two indicators to evaluate transport. We also observe that historical environmental protection is another problem in the assessment. The CASBEE-UD does not provide a criterion for protecting the cultural context or the historical environment. However, certain criteria related to this dimension are covered, such as the impacts of development on neighbors, the local community, relationships and sensitivity to the archaeological and historical context. Social and economic dimension criteria can be said to confer a unique power to the CASBEE-UD to achieve sustainability [14,19].
An assessment tool that can measure additional dimensions of sustainability can encourage dialogue among stakeholders. As support for this statement “for evaluation tools to be beneficial during the design process, the performance criteria of the tools must be considered as quickly as possible” [1,14] because, if the target performance levels are not achieved, subsequent changes will take longer, cost more and citizens may never get involved in the life of their neighborhood.
6. Conclusions
The application of this methodology in the four boroughs of the city of Montreal has made it possible to highlight the limits of this proposed evaluation method. One of the limitations is that it bases its calculations on indicators that are themselves derived from other studies, as well as on indicators used by the four municipalities. This leads to a dependence on other tools whose users does not necessarily control the outputs. Another limit lies in the aggregation of criteria. To give a performance score for each dimension, it is necessary to aggregate the performances of all the criteria. This makes the scores unreliable, as on many occasions it was not possible to aggregate them and so we had to force the performance of certain criteria to achieve a coherent result. A third limit, one that was not taken into consideration by the authors, is stakeholders’ participation, as this was not within the objectives of this study. The AHP method remains easy to use and to understand. New aspects may be taken into account in the form of indicators (e.g., indicators linked to the institutional component) or of criteria (to, for example, improve urban comfort). Concerning the aggregation of indicators and criteria, the method of determining the weighting coefficients is less transparent but remains understandable and usable and above all it makes it possible to verify the coherence of the choices.
Assessment tools and in particular the CASBEE-UD, are indeed powerful tools notwithstanding the CASBEE-UD’s lack of socio-economic criteria, because, as already highlighted, its approach to evaluating the territory offers the possibility to not only evaluate a project but also to contextualize it to the rest of the territory by evaluating the entire external environment. It is true that for use outside Japan, the CASBEE-UD should be adapted to each country or region, taking into account environmental weightings and references to local codes and standards (including the addition of criteria to assess the level of public and active transportation). Today, the most widely used tool remains LEED, currently the most widely used standard in North America and one that has been widely adapted for use in countries outside of North America [19].
We believe this study can be particularly useful at the decision-making stage, as it is a crucial step where stakeholders play a key role in defining neighborhood sustainability goals. In decision-making, it is important to choose a tool that allows a more complete assessment of the territory. Indicators describing the local context therefore play an important role and can help decision makers build new neighborhoods based on local expectations. The dimensions of sustainability must be clearly identified in order to associate them with local criteria that will best capture the problem of the contextualization of a neighborhood in relation to the rest of the territory. It is true that in a city there are different areas (empty spaces, industrial wastelands, etc.) that are not easy to contextualize to the rest of the territory. It is in these cases especially that an evaluation method and local indicators can facilitate the role of stakeholders in decision-making and project development.
The validation of the methodology can be carried out by searching for references. This requires the application of the proposed method to several case studies in order to obtain sufficient statistics. More fundamentally, any decision support system requires strong decision-makers to implement it. Only consultation and negotiation can make it possible to choose realistic and applicable indicators and to build a method for using them to arrive at a reasoned and satisfactory decision. We hope that by making available a robust and reliable methodological approach we can convince decision-makers of the advantages in implementing such tools. We believe that future research should focus on developing a comparative analysis of socio-economic aspects at the local level and on using a methodological approach that is sensitive to the expectations of the local community. Our orientation in future research is to select and use a battery of local indicators in a specific urban project, for example in a brownfield redevelopment, in order to better contextualize these territories to the rest of the city taking into account local expectations.
Acknowledgments
The authors would like to express their appreciation for two laboratories of the École de Technologie Supérieure—GRIDD and STEPPE—for their financial support in conducting this study. Thanks should also go to all of the experts we consulted for their time and input during the realization of this article. Finally, much gratitude is extended to two anonymous reviewers for their valuable comments on this paper.
Author Contributions
Francesco Cappai conceived the project, the main conceptual ideas and the outlines of proof and made numerical calculations for the suggested experiment. Daniel Forgues and Mathias Glaus developed almost all the technical details and verified the numerical results of the case study. Francesco Cappai wrote the manuscript.
Conflicts of Interest
The authors declare no conflict of interest.
References
- Sharifi, A.; Murayama, A. Neighborhood sustainability assessment in action: Cross-evaluation of three assessment systems and their cases from the US, the UK, and Japan. Build. Environ. 2014, 72, 243–258. [Google Scholar] [CrossRef]
- Western Cape Education Department (WCED). 2014. Available online: http://www.un-documents.net/wced-ocf.htm (accessed on 10 October 2014).
- European Environment Agency (EEA). 2015. https://www.eea.europa.eu/fr (accessed on 9 November 2014).
- Holden, M. Sustainability indicator systems within urban governance: Usability analysis of sustainability indicator systems as boundary objects. Ecol. Indic. 2013, 32, 89–96. [Google Scholar] [CrossRef]
- Wong, S.-C.; Abe, N. Stakeholders’ perspectives of a building environmental assessment method: The case of CASBEE. Build. Environ. 2014, 82, 502–516. [Google Scholar] [CrossRef]
- Kepaptsoglou, K.; Karlaftis, M.G.; Gkotsis, I.; Vlahogianni, E.; Stathopoulos, A. Urban Regeneration in Historic Downtown Areas: An Ex-Ante Evaluation of Traffic Impacts in Athens, Greece. Int. J. Sustain. Transp. 2015, 9, 478–489. [Google Scholar] [CrossRef]
- Kyrkou, D.; Taylor, M.; Pelsmakers, S.; Karthaus, R. Urban sustainability standards: Predetermined checklists or adaptable frameworks? In Proceedings of the 2011 International Conference on Green Buildings and Sustainable Cities, Bologna, Italy, 15–16 September 2011. [Google Scholar]
- Szibbo, N.A. Assessing Neighborhood Livability: Evidence from LEED® for Neighborhood Development and New Urbanist Communities. J. Urban Res. 2016. [Google Scholar] [CrossRef]
- Jacobs, J. The Death and Life of Great American Cities; Random House: New York, NY, USA, 1961. [Google Scholar]
- Institute for Building Environment and Energy Conservation (IBEC). 2014. Available online: http://www.ibec.or.jp/CASBEE/english/toolsE_urban.htm (accessed on 9 November 2015).
- British Organization BRE Global. 2015. Available online: https://www.breeam.com/discover/technical-standards/communities/ (accessed on 19 March 2018).
- Sharifi, A.; Murayama, A. Viability of using global standards for neighbourhood sustainability assessment: Insights from a comparative case study. J. Environ. Plan. Manag. 2015, 58, 1–23. [Google Scholar] [CrossRef]
- Sev, A. A comparative analysis of building environmental assessment tools and suggestions for regional adaptations. Civ. Eng. Environ. Syst. 2011, 28, 231–245. [Google Scholar] [CrossRef]
- Cities Alliance. 2007. http://unpan1.un.org/intradoc/groups/public/documents/apcity/unpan028794.pdf (accessed on 9 November 2014).
- Turcu, C. Re-thinking sustainability indicators: Local perspectives of urban sustainability. J. Environ. Plan. Manag. 2013, 56, 695–719. [Google Scholar] [CrossRef]
- White, L.; Lee, G.J. Operational research and sustainable development: Tackling the social dimension. Eur. J. Operational Res. 2009, 193, 683–692. [Google Scholar] [CrossRef]
- Blanch Verges, A. Environmental Efficiency Assessment on Spanish Urban Settings applying CASBEE methodology. In Environmental Efficiency Assessment; Universitat Politècnica de Catalunya: Barcelona, Spain, 2010; p. 49. [Google Scholar]
- Sharifi, A.; Murayama, A. A critical review of seven selected neighborhood sustainability assessment tools. Environ. Impact Assess. Rev. 2013, 38, 73–87. [Google Scholar] [CrossRef]
- Cappuyns, V.; Kessen, B. Evaluation of the environmental impact of Brownfield remediation options: Comparison of two life cycle assessment-based evaluation tools. Environ. Technol. 2012, 33, 2447–2459. [Google Scholar] [CrossRef] [PubMed]
- George, G. On the Nature of Neighbourhood. Urban Stud. 2001, 38, 2111–2124. [Google Scholar]
- Coulton, C.J.; Jennings, M.Z.; Chan, T. How Big is My Neighborhood? Individual and Contextual Effects on Perceptions of Neighborhood Scale. Am. J. Commun. Psychol. 2013, 51, 140–150. [Google Scholar] [CrossRef] [PubMed]
- Choguill, C.L. Developing sustainable neighbourhoods. Habitat Int. 2008, 32, 41–48. [Google Scholar] [CrossRef]
- AlQahtany, A.; Rezgui, Y.; Li, H. A proposed model for sustainable urban planning development for environmentally friendly communities. Archit. Eng. Des. Manag. 2013, 9, 176–194. [Google Scholar] [CrossRef]
- Luederitz, C.; Lang, D.J.; Von Wehrden, H. A systematic review of guiding principles for sustainable urban neighborhood development. Landsc. Urban Plan. 2013, 118, 40–52. [Google Scholar] [CrossRef]
- Burnett, J. City buildings—Eco-labels and shades of green! Landsc. Urban Plan. 2007, 83, 29–38. [Google Scholar] [CrossRef]
- Sharifi, A. From Garden City to Eco-urbanism: The quest for sustainable neighborhood development. Sustain. Cities Soc. 2016, 20 (Suppl. C), 1–16. [Google Scholar] [CrossRef]
- De Sousa, C.A. Urban brownfields redevelopment in Canada: The role of local government. Can. Geogr. 2006, 50, 392–407. [Google Scholar] [CrossRef]
- Shen, L.; Peng, Y.; Zhang, X.; Wu, Y. An alternative model for evaluating sustainable urbanization. Cities 2012, 29, 32–39. [Google Scholar] [CrossRef]
- Bramley, G.; Power, S. Urban Form and Social Sustainability: The Role of Density and Housing Type. Environ. Plan. B Plan. Des. 2009, 36, 30–48. [Google Scholar] [CrossRef]
- Green Building Council in the US. 2015. Available online: http://www.usgbc.org/resources/leed-v4-neighborhood-development-current-version (accessed on 16 November 2015).
- Brandt, U.S.; Svendsen, G.T. Is local participation always optimal for sustainable action? The costs of consensus-building in Local Agenda 21. J. Environ. Manag. 2013, 129, 266–273. [Google Scholar] [CrossRef] [PubMed]
- Alnaser, N.W.; Flanagan, R.; Alnaser, W.E. Model for calculating the sustainable building index (SBI) in the kingdom of Bahrain. Energy Build. 2008, 40, 2037–2043. [Google Scholar] [CrossRef]
- Haapio, A. Towards sustainable urban communities. Environ. Impact Assess. Rev. 2012, 32, 165–169. [Google Scholar] [CrossRef]
- Mori, K.; Christodoulou, A. Review of sustainability indices and indicators: Towards a new City Sustainability Index (CSI). Environ. Impact Assess. Rev. 2012, 32, 94–106. [Google Scholar] [CrossRef]
- Chrysochoou, M.; Garrick, N.; Segerson, K.; Bagtzoglou, A.; Dahal, G.; Brown, K.; Granda-Carvajal, C. Reversing Urban Sprawl: A Reclaimability Index Approach for Reviving Downtown Brownfields. Available online: https://www.ctls.uconn.edu/wp-content/themes/ctls/pdfs/completedProjects/08-03Final.pdf (accessed on 19 March 2018).
- Saaty, T.L. Multicriteria Decision Making: The Analytic Hierarchy Process; RWS Publication: Pittsburgh, PA, USA, 1996; Volume 1. [Google Scholar]
- Bouyssou, D.; Dubois, D.; Pirlot, M.; Prade, H. Concepts et méthodes pour l’aide à la décision, Hermès (série IC 2: Information, Commande, Communication). Anal. Multicrit. 2006, 3, 336. [Google Scholar]
- Sahely, H.R.; Kennedy, C.A.; Adams, B.J. Developing sustainability criteria for urban infrastructure systems. Can. J. Civ. Eng. 2005, 32, 72–85. [Google Scholar] [CrossRef]
- Statistique Canada. Available online: https://www.statcan.gc.ca/fra/debut (accessed on 23 November 2016).
- Ville de Montréal. Available online: http://ville.montreal.qc.ca/portal/page?_pageid=5798,85341635&_dad=portal&_schema=PORTAL (accessed on 23 November 2016).
Figure 1.
Methodological approach.

Figure 2.
Boroughs being sampled.
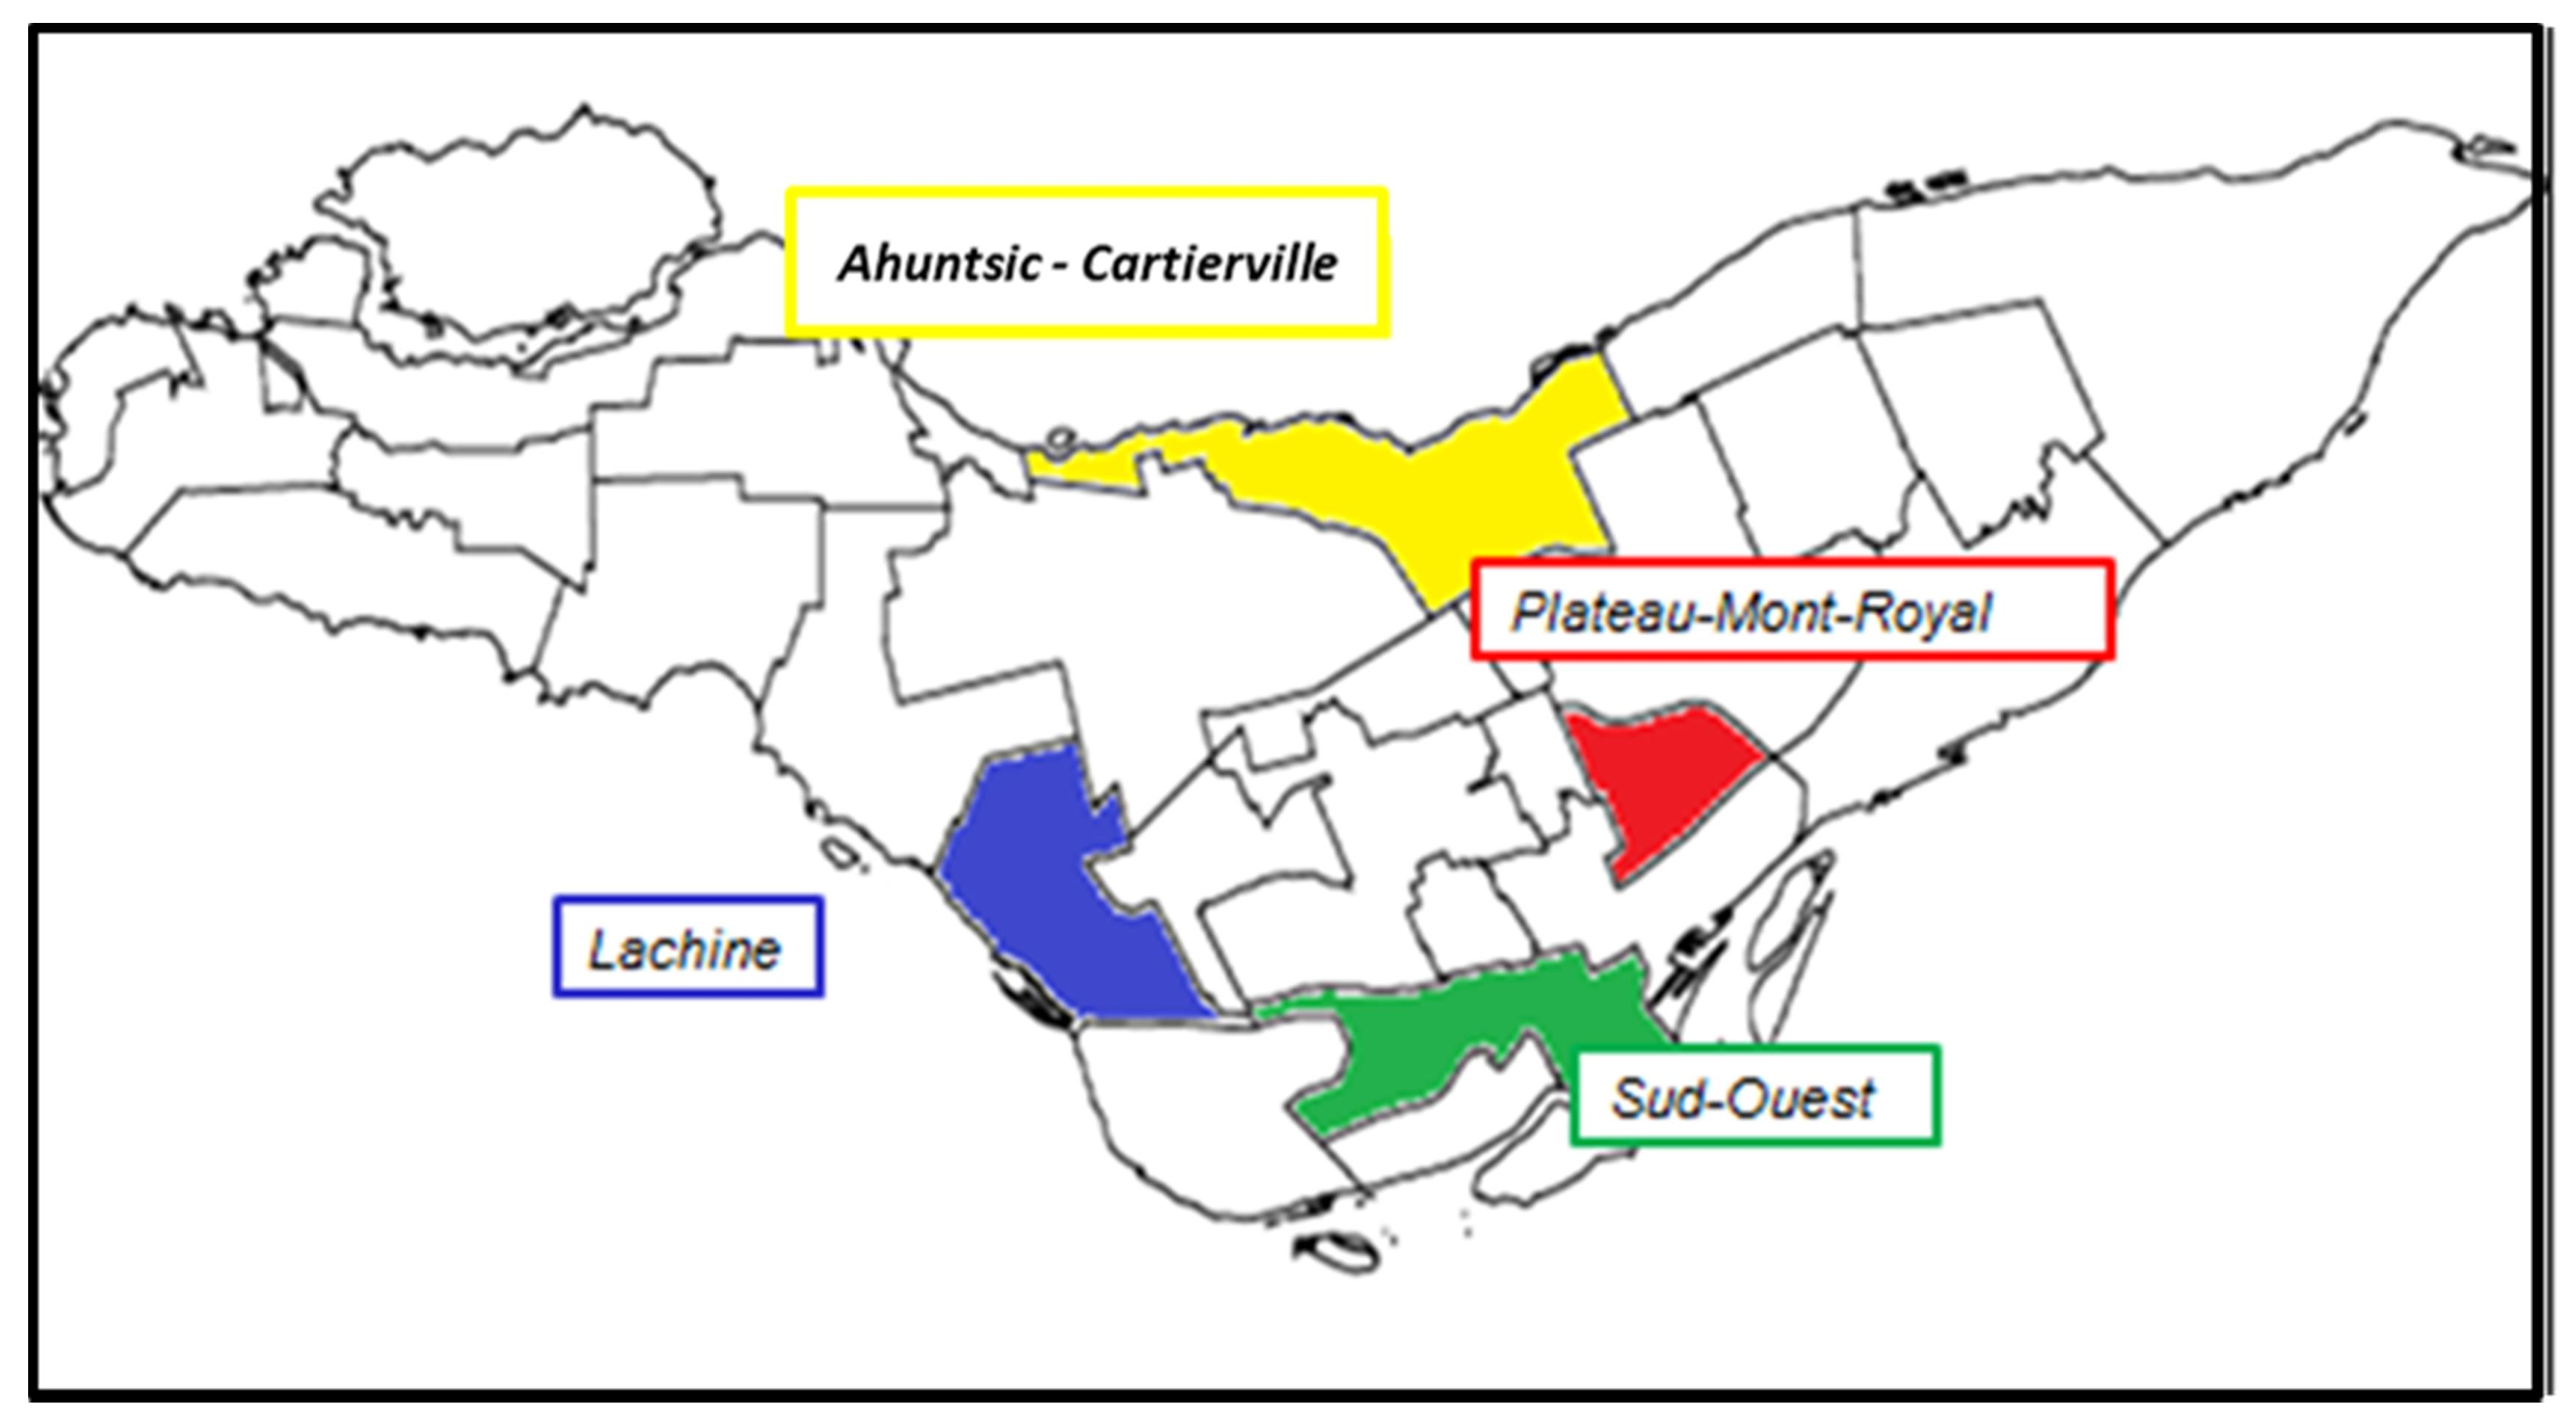
Figure 3.
Comparison results of environmental quality (QUD) assessment.

Figure 4.
Comparison results of Load Reduction (LRUD).

Figure 5.
Evaluation result in radar form depicting the final score of each tool.


Table 1.
Breakdown of evaluation tool credit categories.
| LEED-ND a | CASBEE-UD b | BREEAM c Communities |
|---|---|---|
| Smart Location and Linkage | Resources and Environment | Governance |
| 9 Criteria | 19 Criteria | 4 Criteria |
| Total points 28 | Total points 41 | Total points 8 |
| Prerequisites no. 5 | Prerequisites no. 0 | All Mandatory Criteria |
| Neighborhood Pattern & Design | Social | Social and Economic |
| 15 Criteria | 6 Criteria | 17 Criteria |
| Total points 41 points | Total points 6 | Total points 47 |
| Prerequisites no. 3 | Prerequisites no. 0 | All Mandatory Criteria |
| Green Infrastructure & Buildings | Location and Pattern and Design | Resources and Energy |
| 17 Criteria | 22 Criteria | 7 Criteria |
| Total points 31 | Total points 43 | Total points 31 |
| Prerequisites no. 4 | Prerequisites no. 0 | All Mandatory Criteria |
| Innovation & Design Process | Transportation and Mobility | Land Use and Ecology |
| 6 Criteria | 3 Criteria | 6 Criteria |
| Total points 6 | Total points 10 | Total points 18 |
| Prerequisites no. 0 | Prerequisites no. 0 | All Mandatory Criteria |
| Regional Priority Credits | Innovation and Economic | Transport and Movement |
| 3 Criteria | 0 Criteria | 6 Criteria |
| Total points 4 | Total points 15 | |
| Prerequisites no. 0 | All Mandatory Criteria |
a = U.S.; b = Japan; c = England.
Table 2.
RI coefficient values.
| Matrix size (n) | 1 | 2 | 3 | 4 | 5 | 6 | 7 | 8 | 9 | 10 | 11 | 12 | 13 | 14 | 15 |
|---|---|---|---|---|---|---|---|---|---|---|---|---|---|---|---|
| RI | 0.00 | 0.00 | 0.58 | 0.90 | 1.12 | 1.24 | 1.32 | 1.41 | 1.45 | 1.49 | 1.51 | 1.53 | 1.56 | 1.57 | 1.59 |
Table 3.
Independent variables of the boroughs and from the literature.
| (A) Borough Variables | Literature Variables | (B) List of Selected Variables (Unite of Measure) | Pearson’s Crrelation Coefficient |
|---|---|---|---|
| Street Density | Street Density | Street Density (m/ha) | 0.790 |
| Intersection Density | Intersection Density | Intersection Density (unit/ha) | 0.736 |
| Average Lots Density | Average Lots Density | Average Lots Density | 0.686 |
| Average block length | Average block length | Average length of de blocks | −0.636 |
| House Diversity (affordable house) | House Diversity | House Diversity (Number of each Type of House) | 0.616 |
| Apartment’s proportion | Apartment’s proportion | Apartment’ proportion (apartment/total house) | 0.649 |
| Number historical houses | Number historical houses | Number historical houses (hh/total house) | 0.757 |
| Pedestrian Marginal Green | Pedestrian Marginal Green | Green Pedestrian Margin (ha/street km) | 0.964 |
| Land Use Diversity | Land Use Diversity | Land Use Diversity | 0.896 |
| Public areas | Public areas (Parks, living areas) | Living areas (m2) | 0.805 |
| Water surface | Water surface | Water surface (m2) | 0.622 |
| Population density | Population density | Population density (person/ha) | 0.953 |
| Number of jobs | Number of jobs | Number of jobs (No Jobs) | 0.962 |
| Job Type | Job Type | Job Type (Number) | 0.889 |
| Total income | Total income | Total income ($) | 0.856 |
| Historical activities | Historical activities | Historical activity (No. H.A./Job type) | 0.892 |
| Politics inquiries | Politics inquiries | Government inquiries (Number) | 0.531 |
| Crimes | Crimes | Crimes (Number) | 0.601 |
| Public transportation | Public transportation | Public transportation (No. bus, metro and train) | 0.899 |
| Vehicle and Bike parking | Parking | All Public Parking (m2) | 0.730 |
| Distances (airport, railway station, high school, mosque, Anglican and catholic church, primary, school, museum, health center, shop areas, green spaces, industry) | Distance all railway Station | Distance all railway Station (km) | 0.962 |
| Distance to Green Space | Distance to Green Space (km) | 0.794 | |
| Distance to Industry (km) | Distance to Industry (km) | 0.741 | |
| Distance to shop areas (km) | Distance to shop areas (km) | 0.883 | |
| Distance to high school (km) | Distance to high school (km) | −0.288 | |
| Distance to mosque (km) | Distance to mosque (km) | 0.228 | |
| Distance Anglican church (km) | Distance Anglican church (km) | 0.266 | |
| Distance catholic church (km) | Distance catholic church (km) | 0.222 | |
| Distance to primary school (km) | Distance to primary school (km) | 0.893 | |
| Distance to health center (km) | Distance to health center (km) | 0.368 | |
| Distance to museum (km) | Distance to museum (km) | 0.749 | |
| Bus frequency | Detached house’s proportion | ||
| Street Connectivity | Semi-detached houses’ proportion | ||
| Soil decontamination | Row houses’ proportion | ||
| Heat island | Non-residential density | ||
| Trees of the plant cover | Diversity | ||
| Street trees | Waste management | ||
| Vehicular spaces vs pedestrian | Distribution of functions | ||
| Roof planning | Contiguity | ||
| Opening of the ground floor | Streets frame | ||
| Entrance doors | Ease of movement | ||
| Ground level ground floor | Traffic flow | ||
| Wooden content of the structures | Economic diversification | ||
| Recycled content of infrastructures | Location | ||
| Total annual energy consumption | Connection | ||
| Energy use index (EUI) | Partition areas | ||
| Air Conditioning (Cumulative Load) | Distribution of services | ||
| Heating | Inclusion | ||
| Lighting (Security) | Security | ||
| GHGs related to energy | Structure | ||
| Medium U—wall and fenestration | Technology | ||
| Compactness of buildings | Protection | ||
| Built Density—Raw COS | Care and maintenance | ||
| Natural lighting | |||
| Solar access | |||
| Presence of residents | |||
| Traffic | |||
| Urban forme | |||
| Fragmentation | |||
| Type building | |||
| Religion | |||
(A) Variables list from the boroughs and from the literature; (B) Selected variables list.
Table 4.
Selected list after factor analysis of independent variables.
| Code | Variables | Calcul |
|---|---|---|
| Var1 | Green Pedestrian Margin (ha/street km) | 0.964 |
| Var2 | Land Use Diversity | 0.896 |
| Var3 | Residential Areas (m2) | 0.805 |
| Var4 | Population Density (person/ha) | 0.953 |
| Var5 | Number of Jobs | 0.962 |
| Var6 | Job Type (Number) | 0.889 |
| Var7 | Total Income ($) | 0.856 |
| Var8 | Historical Activity (No. H.A./Job type) | 0.892 |
| Var9 | Public Transportation (No. bus, metro and train) | 0.899 |
| Var10 | Distance to Railway Station (km) | 0.962 |
| Var11 | Distance to Shop Areas (km) | 0.883 |
| Var12 | Distance to Primary Schools (km) | 0.893 |
Table 5.
Score indicators.
| Criteria Ranking | Assigned Number |
|---|---|
| Var1 | 24 |
| Var3 | 22 |
| Var7 | 21 |
| Var6 | 16 |
| Var5 | 14 |
| Var2 | 12 |
| Var10 | 11 |
| Var9 | 12 |
| Var4 | 11 |
| Var11 | 10 |
| Var8 | 10 |
| Var12 | 9 |
Table 6.
Normalization and prioritization of territorial indicators (Analysis Hierarchical Process (AHP)).
Table 6.
Normalization and prioritization of territorial indicators (Analysis Hierarchical Process (AHP)).
| Score | OG | Var01 | Var3 | Var7 | Var6 | Var5 | Var2 | Var10 | Var9 | Var4 | Var11 | Var8 | Var12 |
|---|---|---|---|---|---|---|---|---|---|---|---|---|---|
| 24 | Var01 | 1 | 1.20 | 0.32 | 2.11 | 1.07 | 0.84 | 0.34 | 2.66 | 1.89 | 1.86 | 2.55 | 4.50 |
| 22 | Var03 | 1 | 0.91 | 0.93 | 0.16 | 0.39 | 0.89 | 1.48 | 0.70 | 0.68 | 1.36 | 3.32 | |
| 21 | Var07 | 1 | 1.82 | 0.77 | 0.55 | 0.05 | 2.36 | 1.59 | 1.57 | 2.25 | 4.20 | ||
| 16 | Var06 | 1 | 1.07 | 1.30 | 1.80 | 0.57 | 0.25 | 0.27 | 0.45 | 2.41 | |||
| 14 | Var05 | 1 | 0.25 | 0.75 | 1.61 | 0.84 | 0.82 | 1.50 | 3.45 | ||||
| 12 | Var02 | 1 | 0.52 | 1.84 | 1.07 | 1.05 | 1.73 | 3.68 | |||||
| 11 | Var10 | 1 | 2.34 | 1.57 | 1.55 | 2.23 | 4.18 | ||||||
| 12 | Var09 | 1 | 0.80 | 0.82 | 0.14 | 1.86 | |||||||
| 11 | Var04 | 1 | 0.05 | 0.68 | 2.64 | ||||||||
| 10 | Var11 | 1 | 0.70 | 2.66 | |||||||||
| 10 | Var08 | 1 | 1.98 | ||||||||||
| 9 | Var12 | 1 |
Table 7.
Variable weights assigned according to the AHP.
| Criteria Ranking | Assigned Weight |
|---|---|
| Var1 | 0.127 |
| Var2 | 0.092 |
| Var3 | 0.115 |
| Var4 | 0.082 |
| Var5 | 0.095 |
| Var6 | 0.097 |
| Var7 | 0.105 |
| Var8 | 0.056 |
| Var9 | 0.071 |
| Var10 | 0.071 |
| Var11 | 0.060 |
| Var12 | 0.027 |
Table 8.
Thematic fields and neighborhood setting in dimensions.
| Thematic Field (Dimension) | Neighborhood Settings | |
|---|---|---|
| Environmental Valuation | Natural Resource Management (Storm water, sewage, alternative energy, etc.); Biodiversity; Quality of Natural Areas | Infrastructure System Water, Water Consumption (including water quality); Energy consumption; Green Spaces; Water Surface; Vegetation; |
| Environmental Protection (Floodplains, Rivers, Lakes, Wetland, Parks, Animals, etc.) | Use of Space; Living Areas; Landscape (Unnatural Barriers, Bridges, Viaducts); Enhancing Biodiversity; Morphology; River System | |
| Improved Comfort and Health (Pollution of the Site) | Ventilation; Physical comfort; Proportion of Own Sites; Soil Quality; Lighting | |
| Equitable Social Value Social Responsibility | Strengthening Cohesion and Social Equity | Accessibility; Public Spaces; Density; Distribution Services; Inclusion; Security; Land Use Diversity; Population Density; Total Income |
| Enhancement of the Architectural (Buildings and Material) and Historical (Preservation of Historical Memory) Heritage | Structure; Materials; Technology; Protection; Care and Maintenance; Form; Architectural Fragmentation; Architectural Quality; Residential Areas; | |
| Economic Strategy | Cost Reduction | Waste Management; Distribution functions; Service-Business; Contiguity |
| Increase of Cohesion (Accessibility and Transportation) and economic Dynamics (Employment and Business) | Streets Network; Public Transport; Fluidity of Movement; Parking; Links, Connections; Economic Diversification; Number of Jobs; Job Types; Public Transportation; Green Pedestrian Margin | |
| Multi-functionality of the territory, Territorial Competitiveness | Location; Connections; Partition Areas; Urban Form (Urban Fabric); Public Areas; Historical Activity; Distance to Railway Station; Distance to Shopping Areas; Distance to Primary Schools |
Table 9.
Integration indicators in the new tool and allocation of points for each dimension.
| Dimension | Criteria | CASBEE-UD | New CASBEE-UD |
|---|---|---|---|
| Resources and Environment | Energy, Materials, Biodiversity, Conservation, Resources, Water | 41 points | 30 points |
| Transportation | Public and Private | 10 points | 10 points |
| Social | Affordable Housing, Inclusive Communities Safety, Community Well-being Outreach, Heritage, Social Networks | 6 points | 30 points |
| Economic | Local Jobs, Finances, Investments, Employment, Business | 0 points | 10 points |
| Location | 3 points | 20 points | |
| Pattern and Design | Mixed Use, Green Infrastructure, Compact Development, Access, Urban Planning and Design | 40 points | |
| Innovation | Accredited Professionals Innovation | 0 points |
Table 10.
Multi-criteria AHP evaluation results depicting final score of each alternative.
| Dimensions | Base | Variant 1 (Casbee-UD) | Variant 2 (New Assessment Tool) |
|---|---|---|---|
| Environment | |||
| Alternative Weight | 1.00 | 0.43 | 0.57 |
| Social | |||
| Alternative Weight | 1.00 | 0.27 | 0.73 |
| Economic | |||
| Alternative Weight | 1.00 | 0.00 | 1.00 |
© 2018 by the authors. Licensee MDPI, Basel, Switzerland. This article is an open access article distributed under the terms and conditions of the Creative Commons Attribution (CC BY) license (http://creativecommons.org/licenses/by/4.0/).
Share and Cite
MDPI and ACS Style
Cappai, F.; Forgues, D.; Glaus, M. The Integration of Socio-Economic Indicators in the CASBEE-UD Evaluation System: A Case Study. Urban Sci. 2018, 2, 28. https://doi.org/10.3390/urbansci2010028
AMA Style
Cappai F, Forgues D, Glaus M. The Integration of Socio-Economic Indicators in the CASBEE-UD Evaluation System: A Case Study. Urban Science. 2018; 2(1):28. https://doi.org/10.3390/urbansci2010028
Chicago/Turabian StyleCappai, Francesco, Daniel Forgues, and Mathias Glaus. 2018. "The Integration of Socio-Economic Indicators in the CASBEE-UD Evaluation System: A Case Study" Urban Science 2, no. 1: 28. https://doi.org/10.3390/urbansci2010028