Spatiotemporal Analysis of Human Mobility in Manila Metropolitan Area with Person-Trip Data


Faculty of Life and Environmental Sciences, University of Tsukuba 1-1-1 Tennodai, Tsukuba City, Ibaraki 305-8572, Japan
Urban Sci. 2018, 2(1), 3; https://doi.org/10.3390/urbansci2010003
Submission received: 27 November 2017
/
Revised: 28 December 2017
/
Accepted: 3 January 2018
/
Published: 5 January 2018
Abstract
:The metropolitan area can be regarded as a multi-functional structure consisting of plural coordinated urban nucleuses. This study aims to clarify the characteristics of urban nucleuses and a spatiotemporal pattern of human mobility in the Manila metropolitan area. Hourly density of human mobility from 00:00 to 24:00 in the whole study area is quantitatively studied. Urban nucleuses with six types: central city, business city, commuter town, south suburb, north suburb, and subcenter city, are identified. Differences of human mobility owing to different human behaviors or properties are also analyzed in 10 typical areas with different urban functions. Results prove that pattern of human mobility in each area depends on its human social division, population composition, infrastructure condition, and functional structure. This study provides an effective thinking on handling geo-tagged big data supported by MATLAB programming and GIS technology. Moreover, spatiotemporal analysis of human mobility also possesses a meaningful academic value for transport geography.
1. Introduction
The metropolitan area can be regarded as a multi-functional structure consisting of plural coordinated urban nucleuses. Urban nucleuses are core areas carrying important functions: administration, business, cultural activities, landscape, etc. They have agglomeration effect on person trip, logistics, information flow, and exert controls over the surrounding areas.
Before proving that a modern metropolitan area is based on multiple nuclei pattern, explaining the basic theory development of urban structure is necessary. Urban planners, economists, sociologists, and geographers have developed many kinds of models, explaining the formation and expansion of urban structure. Three major ones are herein discussed. Burgess [1] noted that Chicago fit a structure of concentric rings, depicting different urban land usage. His concentric zone model suggested that the Central Business District (CBD) was in the middle of the model, and, furthermore, the city expanded its domination in rings, forming a concentric structure included factory zone; transition zone of mixed residential and commercial uses; working class zone (inner suburb); and, commuter and residential zone with better housing quality (outer city) from inside to outside. However, the CBD idea originated from the Chicago School in 1924 was challenged and refuted by many contemporary scholars, like Hoyt’s sectoral model [2] in 1939 and multiple nuclei model, as suggested by Harris & Ullman [3] in 1945. The sectoral model proposed that a city expands in sectors instead of rings. Hoyt raised the existence of sectoral zones extending from the city center along railroads, roads, or other traffic routes. Even suburb areas may be attractive for certain human activities, for example, a shopping center tends to be built in suburb areas instead of the traditional CBD area because of the lower land price and better accessibility for potential customers. Different human activities flourish in these areas and expand outward as the city grows, becoming a sector of the city. Similarly, this model was considered as a modification of the concentric zone model and its validity is also limited. This theory started on the beginning of 20th century when rail transport is the major reason of urban expedition. However, in the recent years, private cars had become popular and it was possible to commute from cheaper land prices outside city boundaries [4]. Different with these two models, multiple nuclei model suggested that mega-cities had become increasingly polycentric, with multiple urban centers being dispersed across a typical metropolitan area with different functions and features, which has been proved by many recent works from urban economics and regional studies [5,6,7,8,9].
According to the multiple nuclei model that firstly made this theory systematic, a city contains more than one center around which activities revolve [3]. With the urban expansion process, interactions built around these nucleuses form not a mononuclear structure based on a domination-subordination relationship, but a multicore structure based on the functional complementarities between them. Many previous studies had focused on multinucleation in metropolitan area [3,5,6,7,8,9,10,11], who had discussed this topic from many viewpoints. In recent decades, dispersed spatial developments had intensified polycentric urban spatial patterns in major United States (U.S.) metropolitan areas [5,6]. A multi-functional structure is more efficient for urban’s service function [7]. Ishikawa [8] examined that how multinucleation is progressing and what characteristics of nucleation areas found in the Keihanshin metropolitan area. Like central urban area, suburban area can also form an urban nucleus having similar functions and characteristics, even significantly can contribute to the spatial restructuring [10]. Fujii & Hartshorni [11] found that rather than existing as independent urban realms, four downtowns in the Atlanta region are mutually interdependent based on commuting trip patterns, shopping behavior, and traffic flows. Boarnet et al. [5] noted that large population subcenters have diminished the role of the traditional city center as a commuting or consuming destination and sharing their urban functions for making a megacity more compact.
Human mobility is a kind of micro phenomenon of urban’s agglomeration and diffusion, whose characteristics can be used for classifying what urban functions an area has and for identifying whether it can be regarded as an urban nucleus or not, in one metropolis. Moreover, it tends to be attracted to some particular nodes with different urban function in the metropolitan area, implying a structure of mutual complement. Two major kinds of human mobility, commuting and consuming activities, are the most important behaviors of human’s daily life [8,9]. Because of this, multiple nodal regions in sphere of daily activity level can form groups of urban nucleuses, serving as the regional hubs that are interspersed among the whole metropolitan area [9]. Komaki [9] thought that it is not rigorous if only resting on traditional analysis, like the identification of commuting and consuming nucleuses or the classification of urban function, but ignoring the spatiotemporal gap owing to different individual attributes (like gender, age, occupation, transportation mode) on a microscale. In particular, because data is difficult to obtain and reproduce, few studies had clarified the spatiotemporal characteristics of human mobility and distinguished different mobility patterns of individual attributes from the viewpoint of urban structure.
Certainly, on the other hand, delineating human mobility pattern is also a core research topic in transport geography on recent years. In the era of big data, the emerging of social media along with wearable devices enables human activity data to be collected more easily and efficiently, especially during contemporary information age, enabling scholars to quantitatively study individual and collective mobility patterns. By using geo-tagged big data, spatiotemporal pattern of urban structures can be reappeared. Moreover, human mobility can be captured for concluding the general regularities that are implied in the data. Novák & Sýkora [12] organized a questionnaire survey toward the inhabitants of newly built suburban districts, for revealing the relations between new suburban areas and other parts of the Prague metropolitan area and for highlighting the time-space activity and mobility patterns, however, the sample data they used are not meticulous and sufficient. Liu et al. [13] analyzed the intra-urban trip patterns based on one-week taxi trajectory data, quantizing their distance decay effect and geographical heterogeneity. Based on GIS-enabled taxi data, Liu et al. [14] created spatially embedded network to model intra-city interactions, for revealing travel patterns and city structure in Shanghai, which provided a forceful reference on human mobility patterns and the corresponding urban structure. Even though the geo-tagged big data that they used are suitable to realize their purpose, it is nearly impossible for them to particularly designating single sample and to identify the spatiotemporal differences, owing to human behaviors and trip purpose. However, the author thinks that, if only using these unstructured big data without carefully controlling the process of data collection, one cannot firmly believe that whether system errors caused by uncontrollable human’s preference or by complex sampling position can be tolerated. Hawelka et al. [15] investigated a billion tweets recorded in 2012 and estimated the volume of international travelers by countries, who highlighted that temporal patterns disclose the seasons of increased international mobility. They argued that Twitter is exceptionally useful for investigating the global mobility patterns, but their processing was a macro simulation and similarly unstructured big data might be inconvenient for focusing on individual mobility patterns on a microscale. Li & Tong [16] used household travel survey data and raised a new approach for constructing human activity spaces underlying urban structure. However, their main contribution is to verify the models’ effect, which is divorced from the viewpoint focusing on individual human mobility. Roux et al. [17] discussed the social segregation and provided a new thinking about understanding dynamically place effects on human behavior and highlighting the connection between human mobility and the real urban rhythms, whose findings can help public and policy planner to implement useful interventions for obtunding the social inequalities. But, their theoretical basic is sociological and social segregation is a geographic presentation mainly based on occasional human’s will and general social division of labor, so this means that other potential reasons, like personal attributes and infrastructure development situation that may affect significantly the patterns of human mobility, might not be fully considered during the analyses.
Based on the literature reviews above, this study herein aims to clarify the characteristics of urban nucleuses from the viewpoint of urban structure, and then reveal the spatiotemporal pattern of human mobility in different urban nucleuses in the Manila metropolitan area (MMA), by using person-trip survey (PTS) data. The author developed an original and succinct thinking for surmounting the technical difficulty on data mining, supported by MATLAB programming and GIS technology. After making it possible for the data process, commuting, and consuming activities, which occur for most outdoor travel purposes of human daily activities, are examined for classifying the type of urban nucleuses (commuting and consuming nucleuses). Spatiotemporal patterns of human mobility are studied on both the macro and micro scale. This study enables us to identify what structures and characteristics of urban nucleuses have and how human mobility is associated with different urban functions, providing insights into revealing the spatiotemporal gaps of human mobility owing to individual attributes.
2. Data and Methodology
2.1. Technical Difficulty on Geo-Tagged Big Data and the Application of Person-Trip Data Survey
Recent years have witnessed an explosion of geo-tagged big data, such as person-trip data, taxi trajectory data, mobile phone data, and social media data, enabling scholars to use these datasets for realizing many kinds of research. All of them have the merits and demerits. For example, Taxi trajectory data has been widely used for understanding the urban structure [14], for revealing land use variations from traffic patterns [18] or for exploring the differences access characteristics in facilities [19]. Though taxi trajectory data is easy to obtain, however, only focusing on single transportation mode (taxi) seems too unilateral and higher utilization ratio of taxi mode is usually depended on these situation, such as when passenger does not care about travel fare but focus on saving time, or where public transport is not well developed. Mobile phone, smart card, and social media have provided a new data sources for catching the human mobility [15,20,21]. Yang et al. [20] identified the spatiotemporal patterns of human convergence and divergence, discussing whose relationships with the urban functional environment. Li et al. [21] found that the mean human mobility range of frequent Twitter users is linearly correlated to the city scale. However, mobile phone data and social media data are mostly unstructured, like XML, text files, etc. Certainly, these data can be obtained from mobile operators, the software administrators and so on. However, these raw data are difficult to reprocess and the existing approaches are mostly not user-friendly, which requires mature technologies and complete equipment. The most important point should be noted that, even if mobile phone data and social media data are easy and rapid for obtaining via mobile or computer terminals, using them is difficult to specially designate single sample and optionally restrict the sample capacity. Like what has been mentioned in the Section 1, it is impossible to focus on individual mobility patterns on a microscale by using mobile phone or social media data, because of the policies about research ethics review and private information protection. In brief, contradictions between user’s needs and data quality is not harmonized yet.
When compared with other geo-tagged big data, the PTS data offers two advantages in understanding the spatiotemporal pattern of human mobility. Firstly, based on a household interview survey, this data are more reliable and precise than others, for example personal information like gender, age or occupation, can be checked by each sample, where he/she is and what he/she is doing at any time of one day, what transportation mode he/she is using and what human attributes he/she have can be identified. Moreover, this data are structured meticulously, whose sampling rate and capacity are under control. Japan International Cooperation Agency (JICA) is managing a huge person-trip database collected in multiple mega-cities of many developing countries during a long time period. The project for creating PTS database is a part of technology development assistance about urban transport plan from Japan to these countries. Our laboratory is authorized to use this data by the Center for Spatial Information Science, University of Tokyo (CSIS Tokyo). Many previous studies by Japanese scholars had proved the academic value of this PTS data [8,9]. Regardless, PTS can be regarded as an excellent geo-tagged big data appropriate for this study.
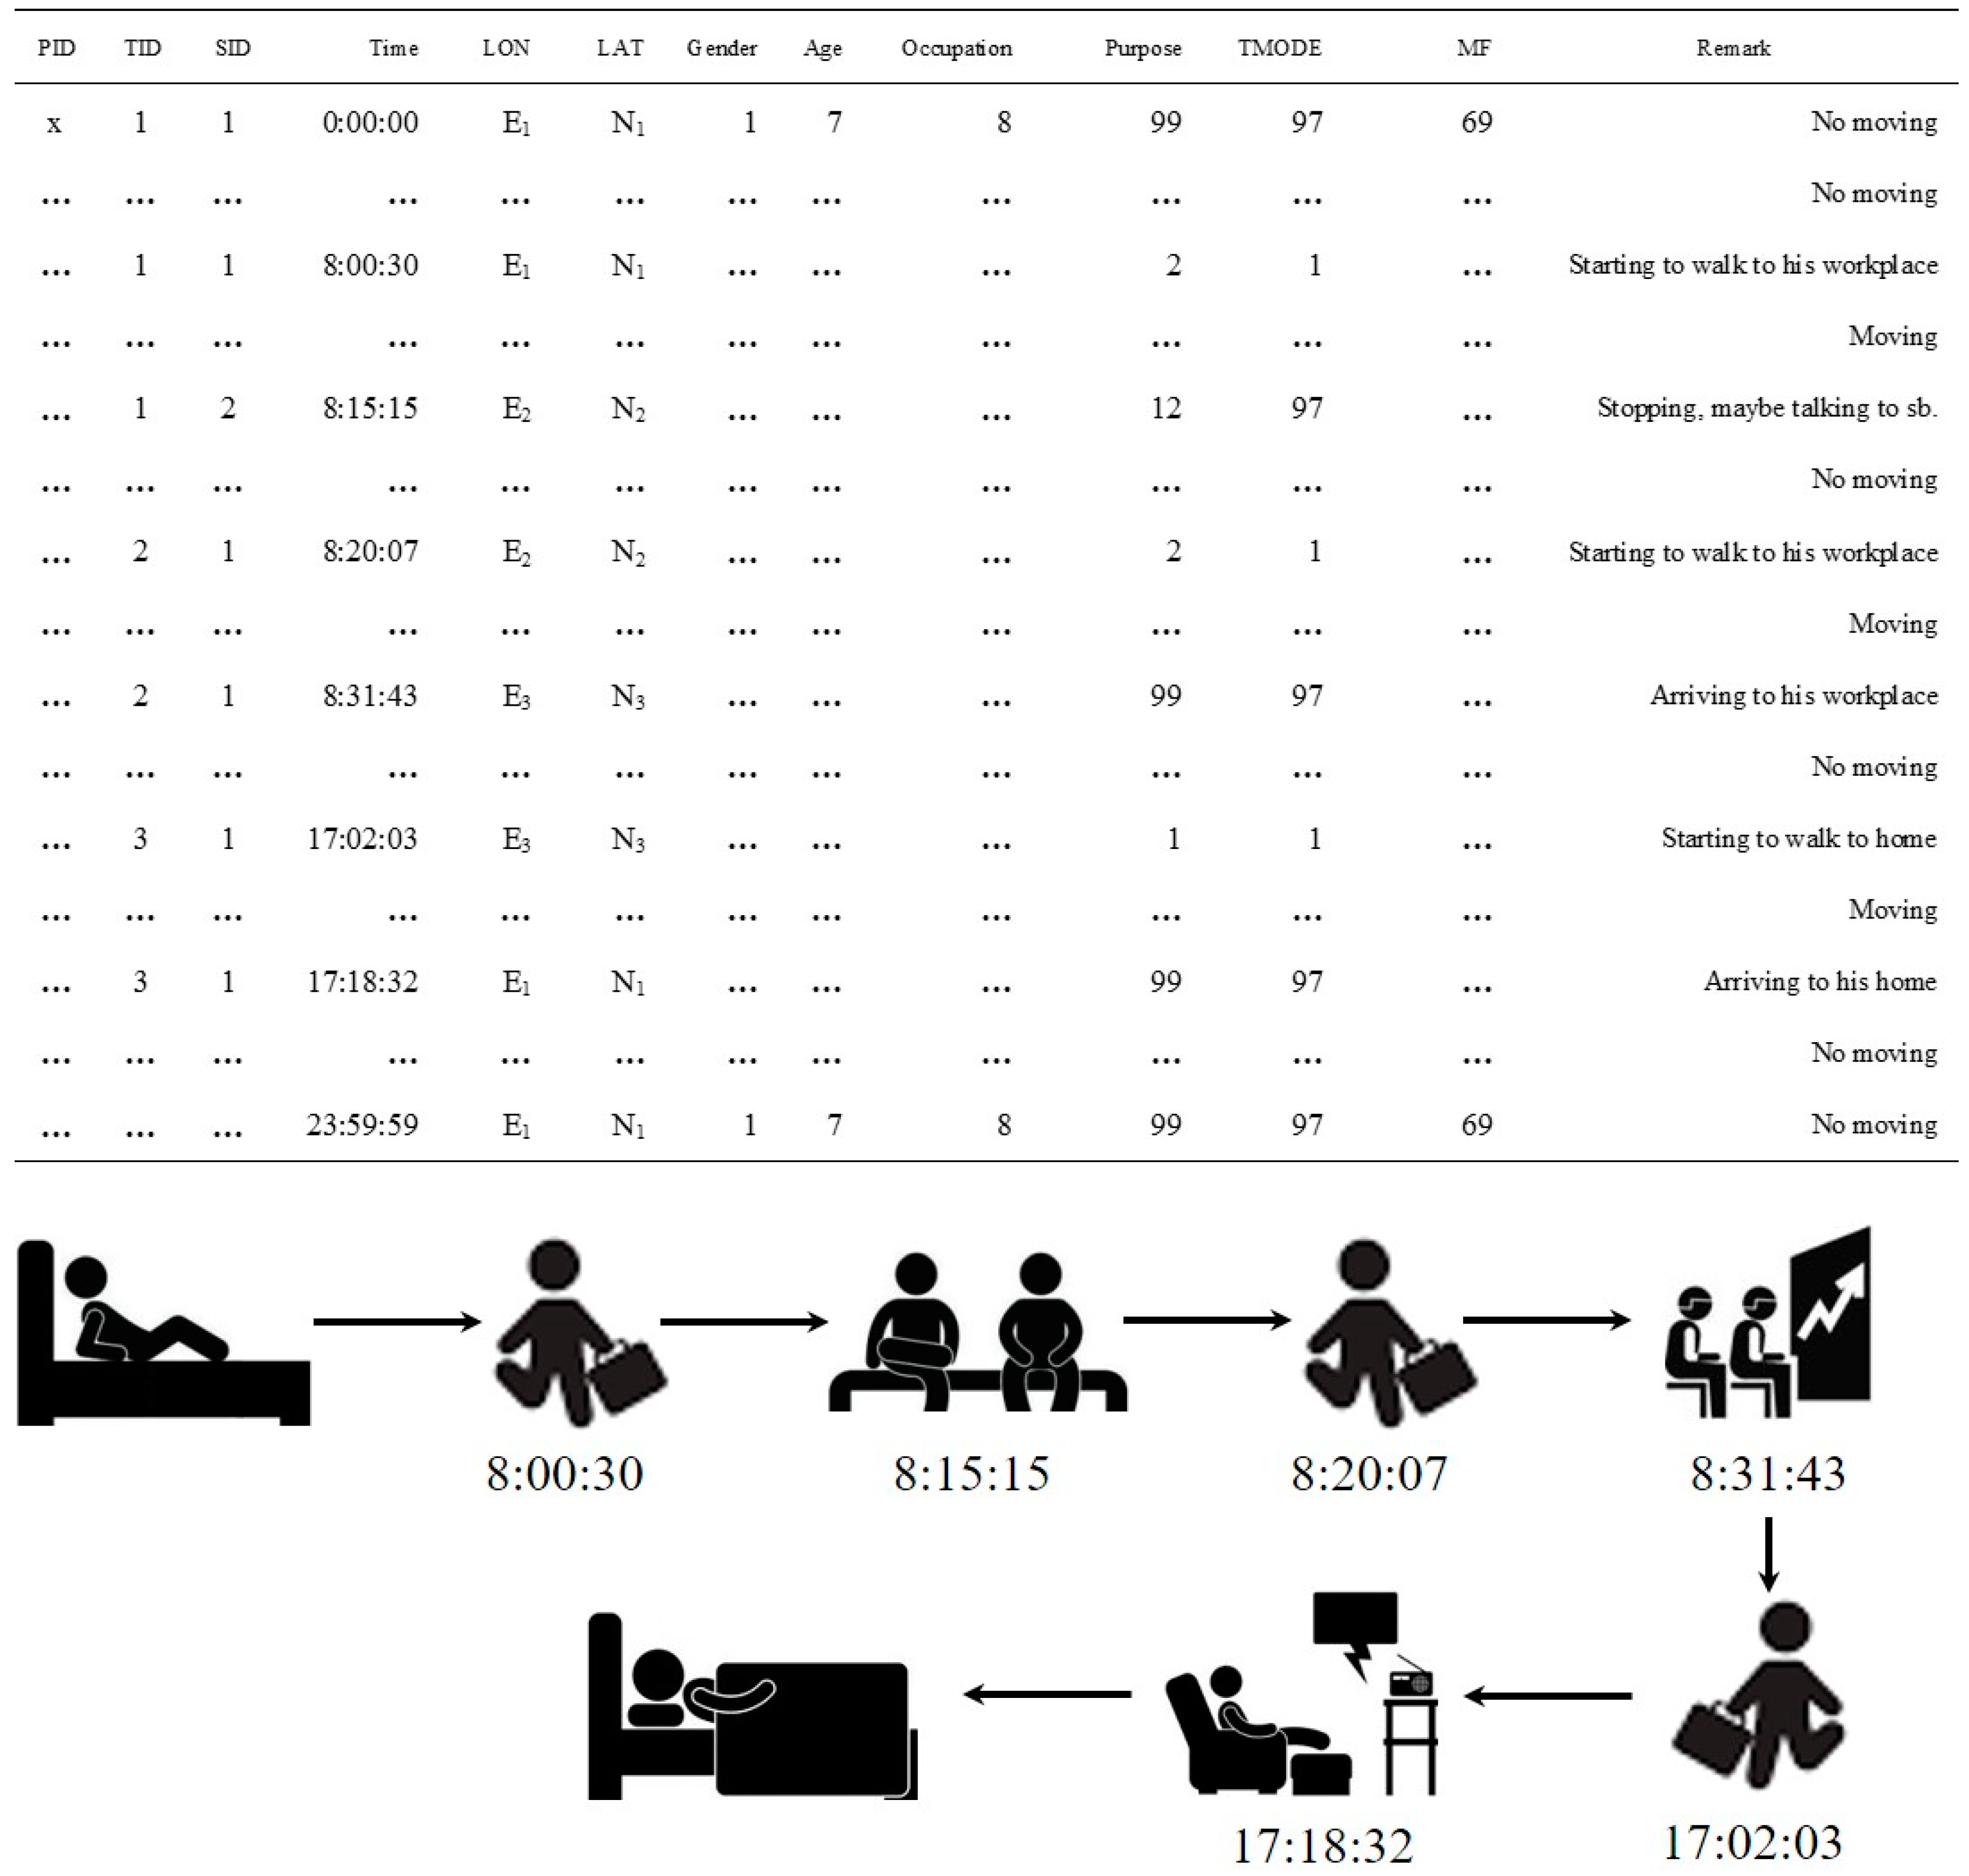
PTS data consist of latitude (LAT) and longitude (LON); time; number of trips per one sample during one day (TID); number of destinations per one trip (SID); trip purpose; transportation mode (TMODE); and, human attributes (person ID; gender; age; occupation; magnification factor (MF), i.e., reciprocal number of sampling rate based on sampling size and amount of residents), using an encoded method. The survey’s time period was 00:00:00~23:59:59 Tuesday, 1 October 1996. Each sample has 86,400 (60 s × 60 min × 24 h) records and human mobility occurring at any second can be known from each csv file. Observed quantity of this survey is 189,335. For this reason, the total data size is huge, about 21 GB. Figure 1 shows data structures and explanations of person trip pattern i.e., what he (human attributes are all known) is doing, where he is and what transportation mode he is using per one second. More specifications like code descriptions can be checked from the data product manual [22]. One important detail need to be emphasized that the PTS data is a kind of sampling, but not a “real” traffic big data that can reflect the true condition and it is impossible to catch the whole population (A statistical meaning). However, this is a hint on solving this problem. The sampling is carried out area-by-area and the sampling rate of each unit area is based on its size and number of residents. Fortunately, the magnification factor (reciprocal number of sampling rate) is a given value and all csv data are authorized to download and use (cf. specification document from CSIS). Thus, the author has calculated the weighted sum (expected value) based on the magnification factor, and through this procedure a kind of presumptive traffic big data has been estimated.
There are two major technical challenges about handling the massive geo-data processing and visualization. One of it is that all raw data are csv files by individuality. So, it is impossible to efficiently catch moving records from 86,400 rows at each csv file, making the data size huge, nevertheless no-moving records account for the vast majority. In this study, MATLAB programming was used to recognize moving records in one csv file, assembled them together, and created clean table files that are filled with all the clean data by Person IDs. Thus, the data set became smaller and cleaner. Another problem is that geocoding is necessary, because the raw data consist of the GPS coordinates, but zone allocation toward the study area is unknown and not defined. Spatial allocation had not been done and zone code of Manila had been unavailable since this survey was created in 1996. At last, the author fulfilled the geocoding on GIS framework, and created OD matrixes filled in values of flows’ amount from origin to destination, according to different purposes of movement or human attributes. In brief, this study provides an effective thinking and reference on handling geo-tagged big data supported by MATLAB programming and GIS technology.
2.2. Study Framework
Figure 2 illustrates the study framework. First, all person-trip data set are completely cleansed supported by MATLAB program and their potentialities are possible to easily reveal after loading and geocoding at the GIS framework. After that, OD matrixes between pairing cities/municipalities and requisite tables are created. Second, functional characteristics of urban nucleuses are classified by using cluster analysis. Locations and urban functions of each type are identified. Third, spatial pattern of connection and influence among urban nucleuses based on commuting and consuming activities are highlighted. Furthermore, spatiotemporal characteristics of human mobility in the whole Manila metropolitan area and the similarities and the differences of it in 10 typical urban nucleuses are elucidated in depth. Through MATLAB programming, rose charts of human mobility patterns based on different human different properties are created of these 10 areas. At last, this paper summarizes the key findings and conclusions, and reaffirms the originalities and significances in the conclusion part.
2.3. Study Area and Description of the Sample
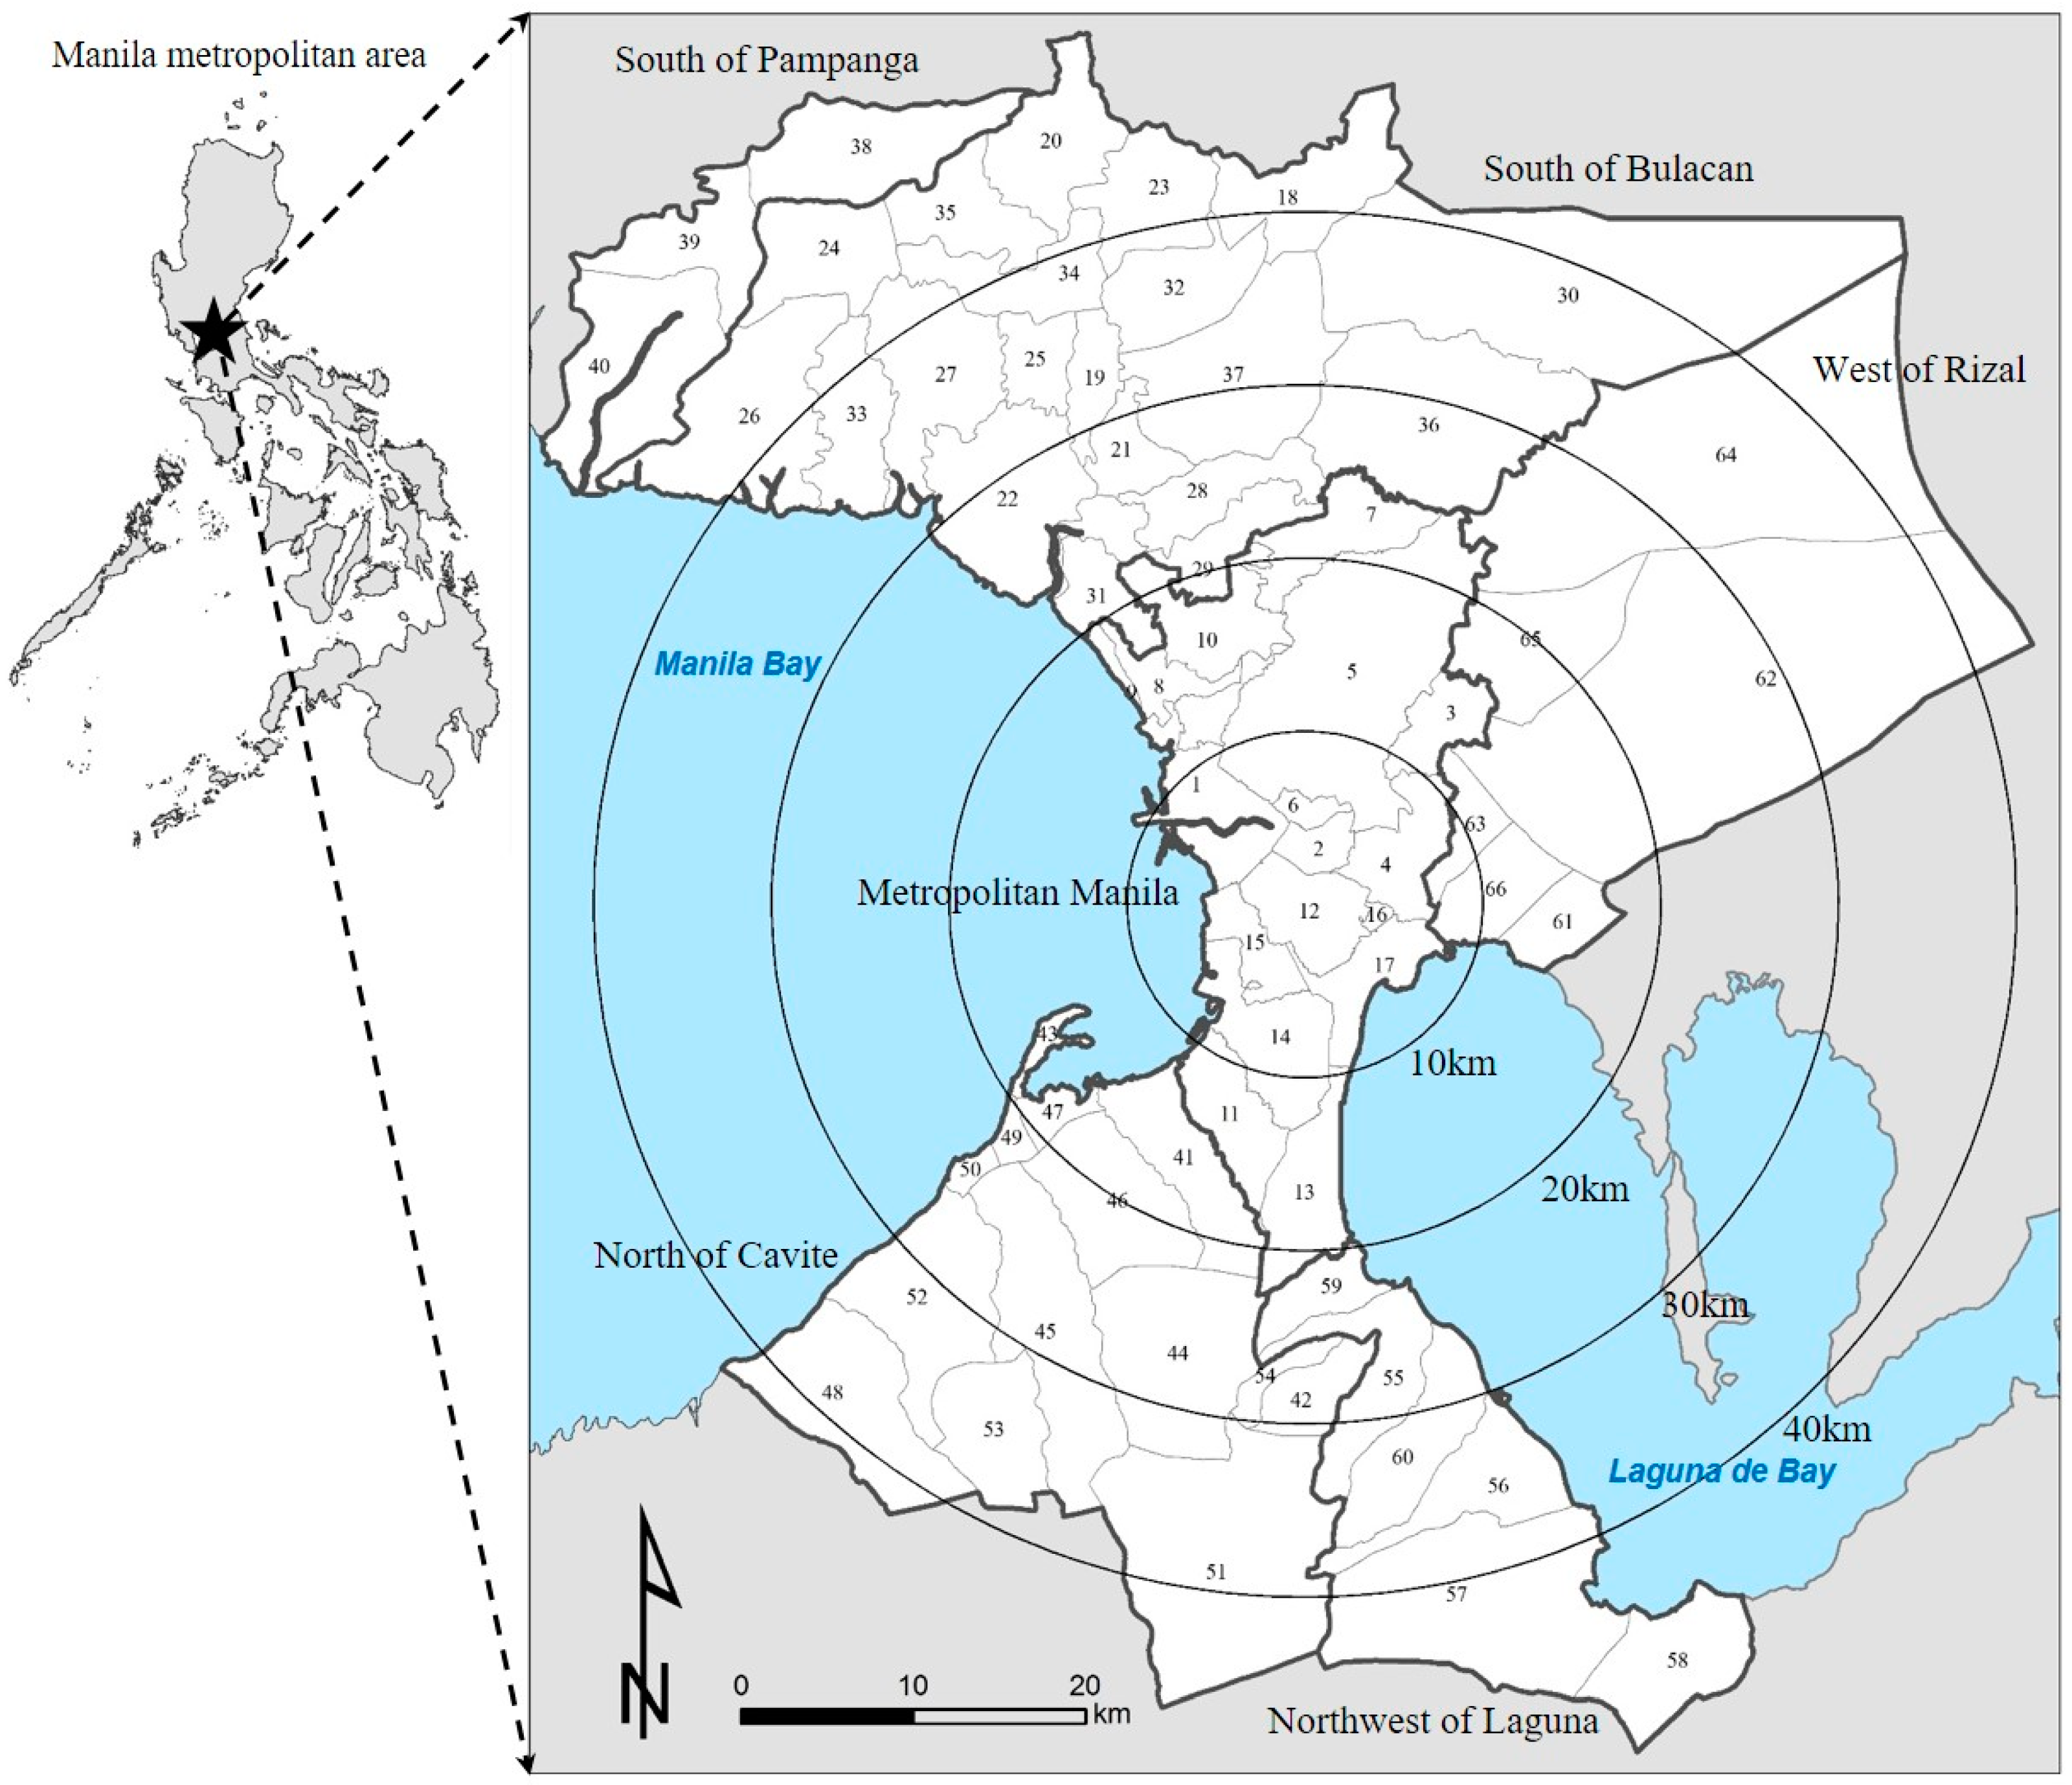
Manila metropolitan area (MMA), covering the whole National Capital Region (NCR) of Philippines (Province of Metropolitan Manila) and parts of several surrounding regions, is the most populous and densely populated area in the country. Its economic power makes the region the country’s premier center for finance and commerce. NCR accounted for 37.2% of the GDP of the country [23], determining MMA’s urban primacy over the other metropolitan areas. It was designated as a global power city [23], thereby making it an important center and hub for the Asia. The reason why MMA is chosen as our study area and why the application of PTS data in 1996 is necessary will be explained, as follows: (1) Philippines is a developing country and its capital region may be seen as a typical and interesting case for highlighting urban structure. (2) PTS data for MMA is available to our university. (3) Most of the studies using this data paid less attention to the definition of the metropolitan area’s boundary. In this study, the boundary is determined based on results of spatial and descriptive statistics using PTS data. Our calculations indicate that almost all of the trips (99.94% of a total of 22,298,714 inflow trips) occurred within this so-called Manila metropolitan area (see Figure 3). According to this boundary, 66 cities/municipalities (hereinafter called city) are included within six provinces. (4) PTS data in 1996 in MMA provides a window for investigating the urban structure and spatiotemporal pattern of human mobility in the past, when MMA was undergoing a significant urban extension and population growth and the area of built-up lands has increased almost twofold, transforming the landscape of MMA from 1993 to 2014 [24]. It should be reaffirmed that it is meaningful to reproduce the urban functional structures and the patterns of human mobility by using the data set collected in 1996.
Table 1 summarizes the sample description of person-trip survey data based on different human properties: gender, age and occupation. The number of estimated population (a value after weighting by multiplying its magnification factor) and the number of samples (an original value before weighting) can be checked in this table. Moreover, sample distribution is itemized by five gradations divided according to the number of sub trips. Here the item of sub trips means that one person may travel plural quantities of trips during the whole one day. For example, in Table 1, the item “≤3” means the people who have traveled 3, 2, or 1 destination(s) during one day.
From Table 1, several characteristics can be discovered: (1) People who have traveled 4~6 destinations during one day, has the maximum population when comparing with other items of number of sub trips. (2) A Male may travel more number of sub trips than a female. (3) People who is 31~40 years old, may travel more destinations than other ages. (4) Manual workers prefer to travel more quantities of destinations when comparing with mental workers. (5) Total estimated population in the whole Manila metropolitan area is 13,409,819 in 1996. Referring to the official census data from Philippines Statistics Authority [25], the authoritative figure of population of National Capital Region, i.e., Province of Metropolitan Manila in 1996 is 9,618,323. Therefore, this method of weighting by multiplying a sample value and its magnification factor can be thought practicable for getting the estimated population value, and the calculation are dependable after checking the census-based population.
3. Results and Discussion
3.1. Identification and Classification of Urban Nucleuses
According to results from data preprocessing, commuting, and consuming activities (see Table 2 for details) contained about 46% of total amount of trips (author’s calculations). Obviously, like what Chapter 1 has mentioned, the metropolitan area can be regarded as a functional and multipolar structure in continuous domains around where activities revolve remarkably. This section attempts to recognize the pattern of urban nucleuses and further reveals the functional structure of a metropolitan area considering two major kinds of daily life activities: commuting and consuming activities, which can be regarded as the most important induced mechanism of human mobility in urban nucleuses.
Two popular methods about how to identify the urban nucleuses are highlighted here. One is based on graph theory. Liu & Wang [26] explored polycentric urban development in 318 cities of China using detailed gridded population data, through a method of adopting the polycentricity indicator based on social network theory. Many indicators of centrality like the in-degree and the out-degree indicators can be borrowed from the network analysis in order to quantify how each node plays a central role in the urban network [27]. However, this method is generally regarding an urban as a node and just considering the intercity flow, but ignoring the individual choices and preferences. This will bring some deviation from the reality. Various forms of human mobility may affect to the responses of urban function. For example, the areas with remarkable home-returning, commuting or consuming activities may have completely different functions. A modern metropolitan area has a complex multi-functional structure. While the traditional CBD can stretch its influence and dominance through the developed road network, suburb areas also have a potential possibility of becoming a future urban nucleuses. Because that all indictors affecting on human mobility, like commuter cost, location of human facility and land price are based on human’s will and planning, if ignoring different urban functions, but just identifying the urban nucleuses based on single kind of flow like the previous studies, it will be difficult to explore deeper relationships between the multi-functional urban structure and human mobility pattern in a metropolitan area. Fortunately, the PTS data can solve this problem and be used to finish the missions about identification of where urban nucleuses are and the classification of what urban function they have and the explanation of what spatiotemporal characteristics of human mobility are. Referring to the previous approach used by Komaki [9], this study applies this method of identifying two kinds of urban nucleuses, i.e., commuting or consuming nucleuses. The process will be explained, as below.
Additionally, referring to the PTS data of MMA, human daily activities can be exactly defined into 14 categories by trip purposes. This study has implemented a reclassification process of the raw data, in order to simplify the table item and facilitate the result interpretation. Table 2 defines each category, before and after reclassification, and corresponding original code of every trip purpose. Particularly, this study describes “trips to workplace or school” as commuting activities, and “trips for private affairs, medical, social, eating, shopping, and accompanying other household members” as consuming activities.
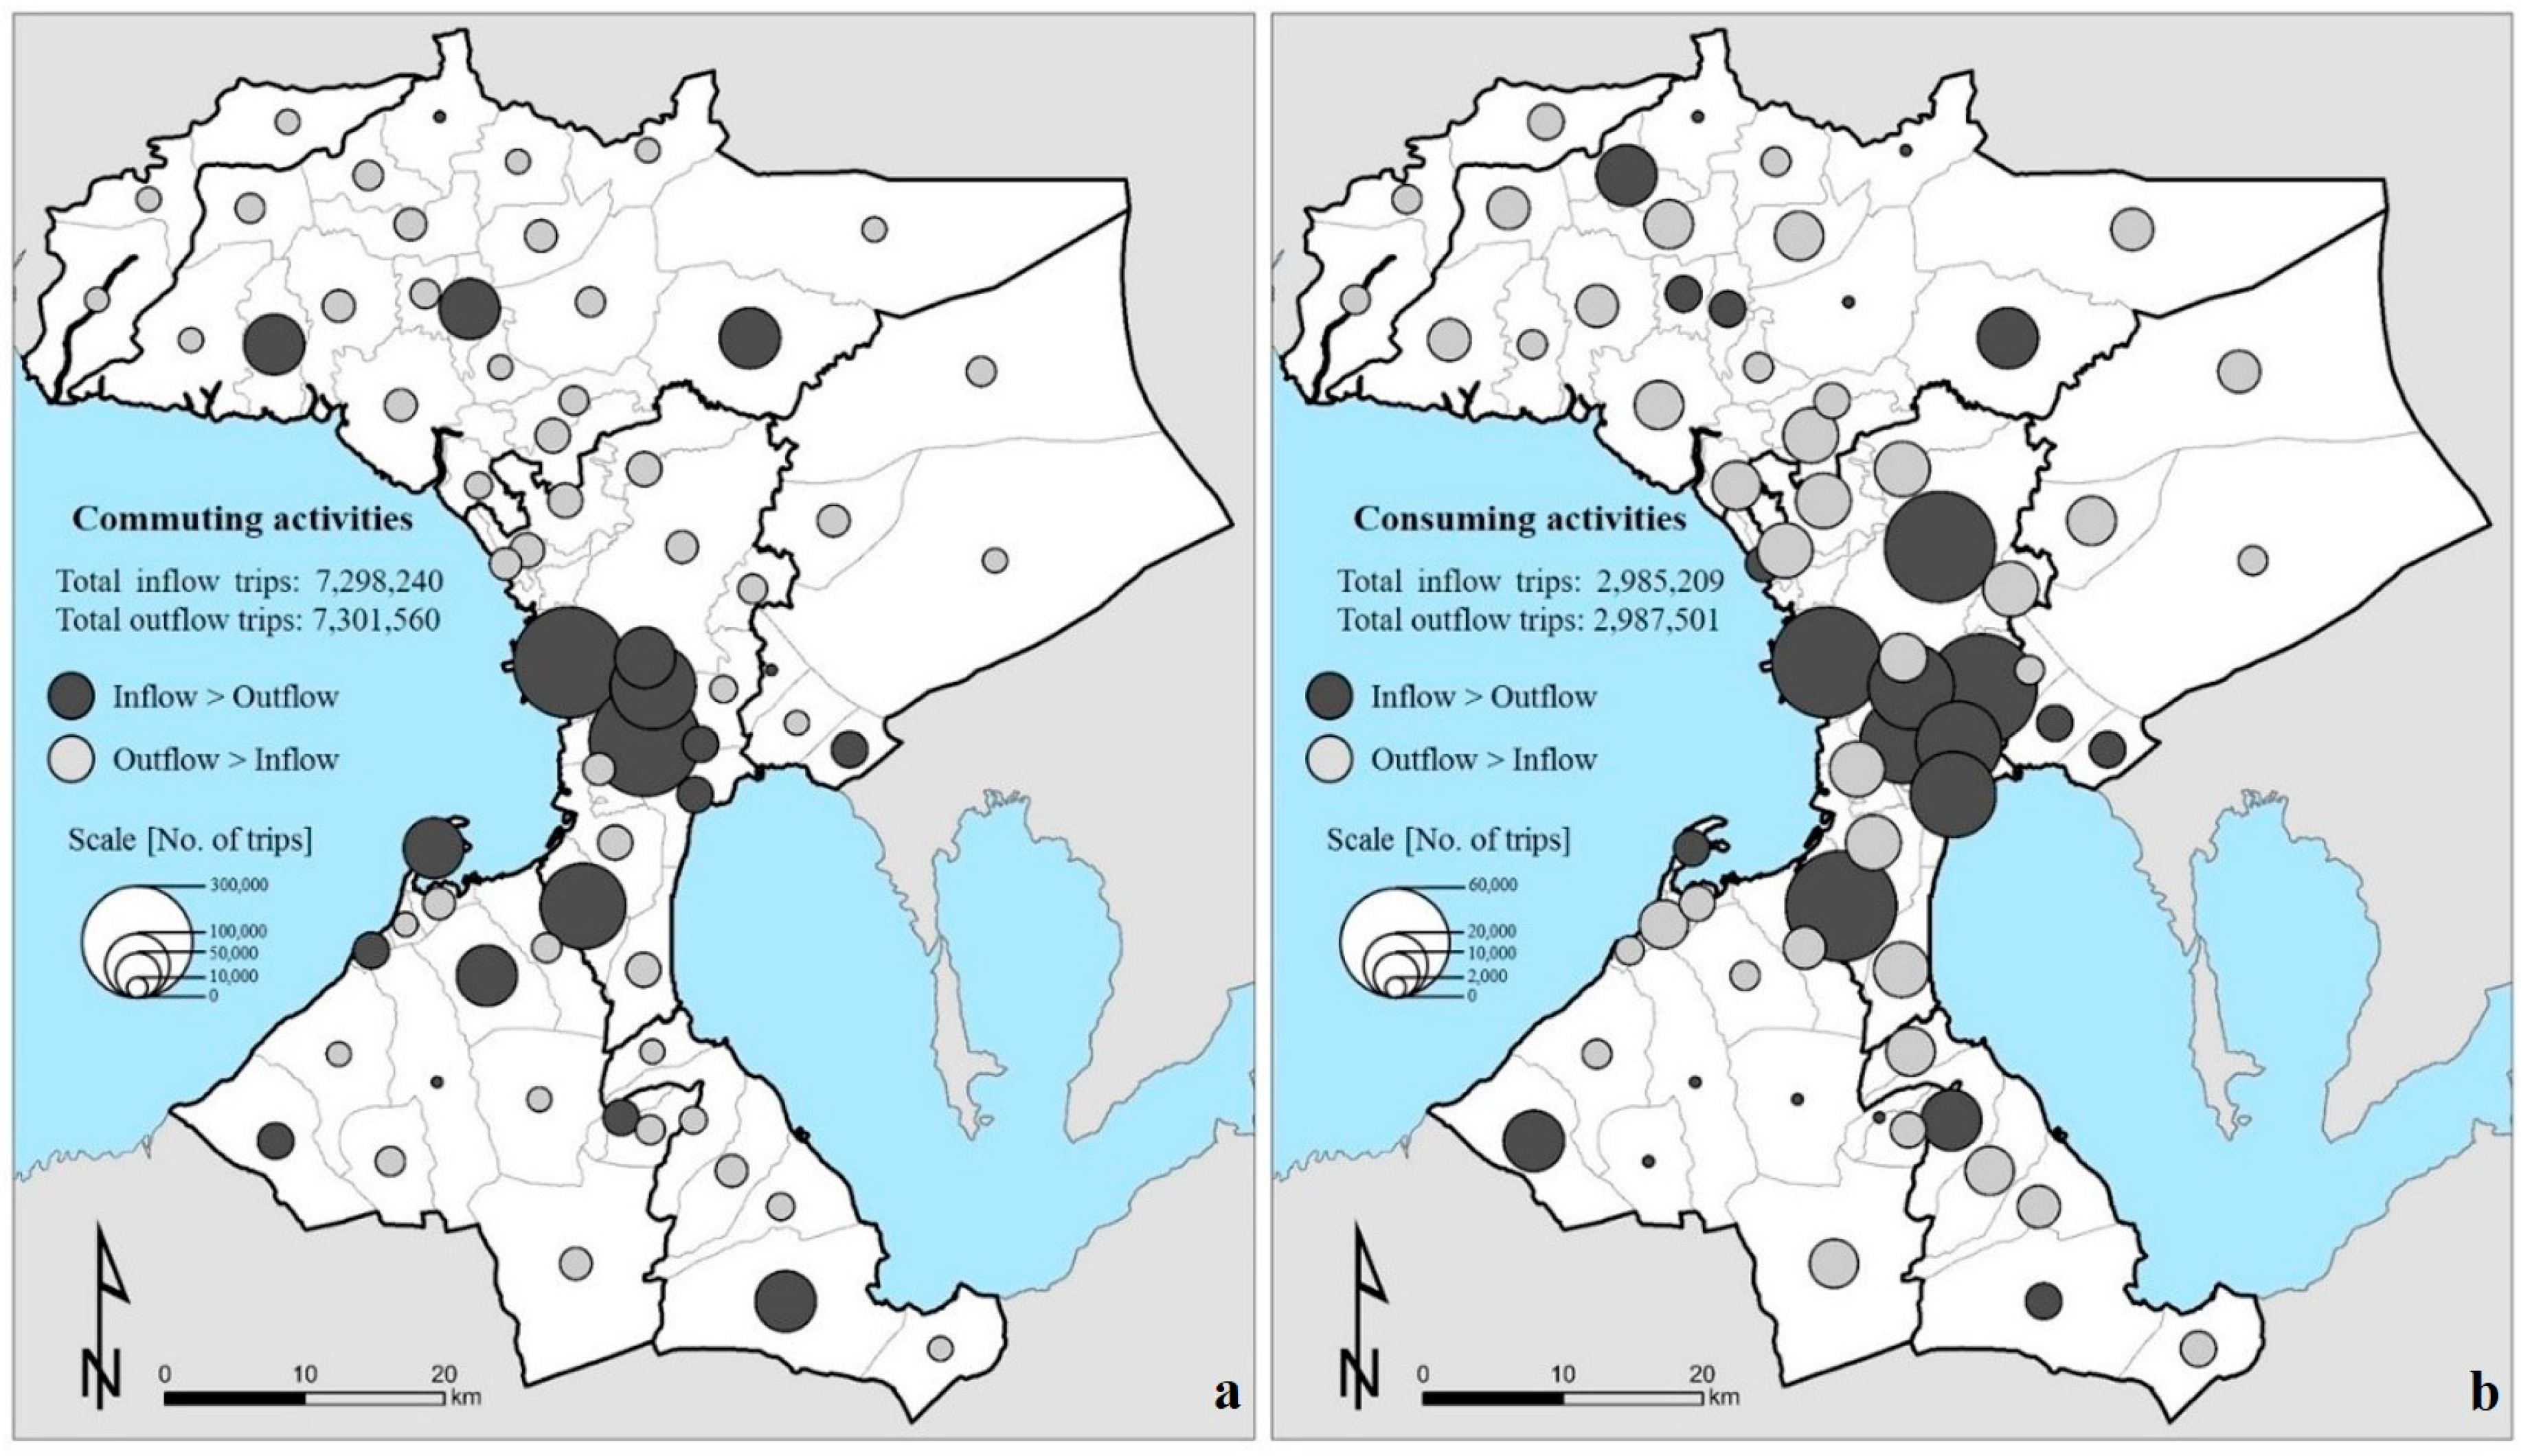
Figure 4 shows the spatial pattern of inflow and outflow excess trips for commuting activities and for consuming activities. Inflow excess areas (Inflow > Outflow) mean that the number of inflow trips is larger than outflow ones, i.e., these areas trend to aggregate human activities. Otherwise, the number of outflow excess trips means a value of subtraction between the number of outflow trips and of inflow ones (Outflow > Inflow). Black circles show inflow excess area on the map of MMA, and their size indicates the scale. Similarly, grey ones show outflow excess area. On Figure 4a, total number of inflow trips for commuting activities is 7,298,240 and outflow one is 7,301,560. Top five cities with number of inflow excess trips are Manila, Makati, Mandaluyong, Las Piñas, and Paombong, successively. Top five cities with number of outflow excess trips are Caloocan, Parañque, Valenzuela, Muntinlupa, and Malabon. On Figure 4b, total number of inflow trips for consuming activities is 2,985,209 and outflow one is 2,987,501. Concentrated and multipolar structure are clearly seen to emerge. Herein, these areas with a superior scale of inflow excess can be recognized as commuting or consuming nucleuses, surrounded by those with outflow excess trips. In other word, each area’s scale is investigated for judging whether the area can be identified as an urban nucleus or not.
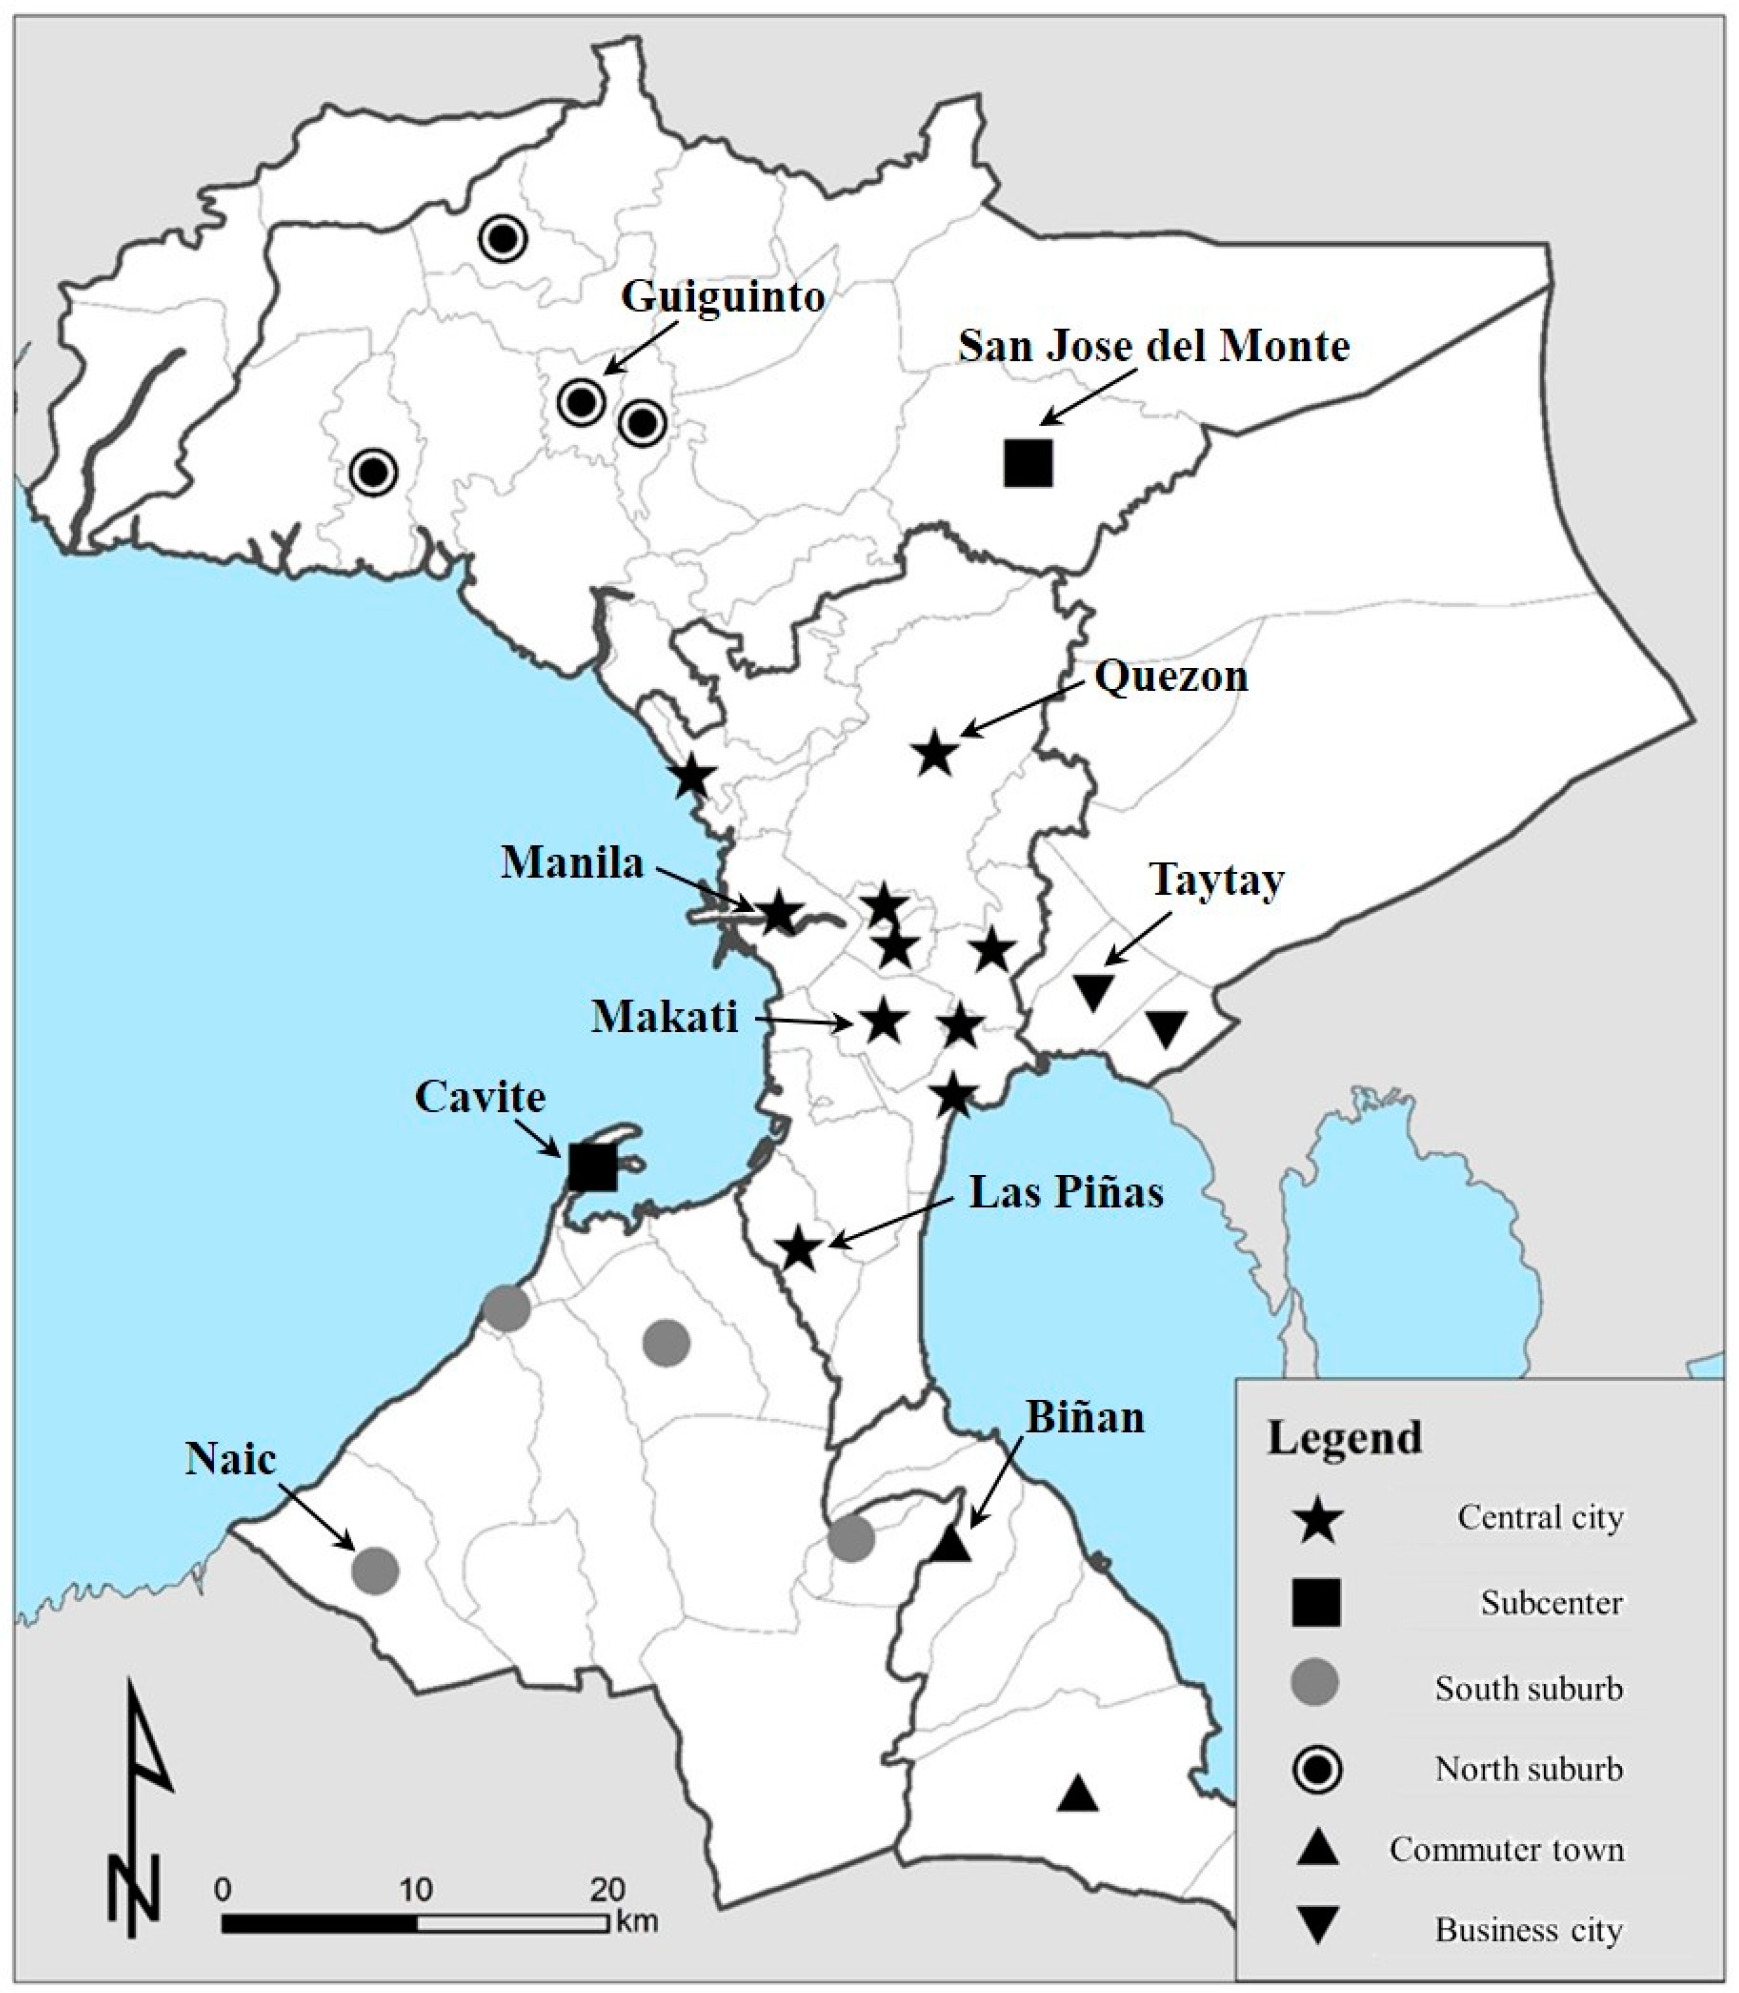
Based on the reclassification used in this study, 24 urban nucleuses (commuting or consuming nucleuses) in MMA, totally covering about 99% of inflow/outflow excess trips (author’s calculation) for the whole population are determined. Next, those selected urban nucleuses will be classified for revealing their different urban functions in accordance with 12 feasible mobility pattern (cf. Table 2), thus highlighting the characteristics of urban nucleuses from different urban functional indices. When considering the consistency from data process, urban function can be seen as a reflection of the amount of trips prompted by different human activities. Stated thus, each kind of human activity’s occurrence rate in each area can approximately express its urban function, making the following analyses more persuasive. Firstly, a 24 × 12 matrix of place cases and their corresponding 12 kind of activity occurrence rate is created. Secondly, hierarchical cluster analysis based on Ward’s method is applied. Each type’s name is an appellation derived from its context. Table 3 shows the average values of 12 kinds of activity occurrence rate each group, and Figure 5 shows the location of the 24 urban nucleuses. They are located within the NCR, its adjacent sectoral areas and several central places of the suburban. Nine typical areas are also noted. Next, 24 cases are divided into 6 groups: A, B, C, D, E, and F, corresponding to the six different types. Lastly, the characteristics and differences of each type are studied.
Referring to Figure 5 and Table 3, foundations of classification and how to determine corresponding nomenclature are explained hereinbelow. Group A is considered as central city type. Activities for employer’s business and medical have a relatively high rate when compared with others. Ten urban nucleuses in group A are all located within the NCR area. Group B is named by business city type, because employer’s business, social and eating activities are most remarkable. Furthermore, unlike group A, it has a high rate of school trip. Two areas within this group are all located in Rizal Province, justifying the suburbanization of educational institutions. Group C has the highest rates of school and medical trips, and a relatively high occurrence rate of returning-home trips. Consequently, commuter town type is the most suitable classification for group C. Two commuter towns are located in Laguna Province. Urban nucleuses in group D are classified onto south suburb type and group E north suburb type. Groups D and E have very similar indices, however, four areas of south suburb type are all located in Cavite province, distributing over the south of MMA. Occasionally another four areas of north suburb type are all situated in Bulacon province over the north. This implies spatial discrepancies and propinquity between south suburb areas and those of the north ones. Two urban nucleuses with subcenter type are classified into group F, just located in the outskirts of the NCR. For this reason, the characteristics of group F are close to those of group A, i.e., central city type.
3.2. Pattern of Connection and Influence among Urban Nucleuses
Hence, spatial pattern of connection and influence among urban nucleuses based on commuting and consuming activities is expressed in Figure 6. Regarding the spatial pattern of commuting nucleuses in MMA, commuting mobility is more obvious in NCR area, subcenter cities and several suburban central cities. Moreover, difference between north suburban areas and south ones emerge from the Figure 6a: north suburban produced stronger influence onto their surrounding areas than south ones. A key finding is that business cities, commuter towns, and subcenter cities play their individual roles by themselves and contribute to their urban functions, rationally and complementally. In other word, these cities can be seen as a kind of buffer areas between central cities and suburban central cities. Results of the spatial connection pattern among consuming nucleuses are different from the case of commuting nucleuses (see Figure 6b). Although Manila and Makati have more linkage from other cities far from the NCR than Quezon due to their better transport accessibility, Quezon has more dominancy than other central cities because of its stronger consuming function. On the other hand, the influence of some suburban central cities for consuming mobility on the surrounding areas are very strong, however, towards other nucleuses far from them, the consuming mobility is not so weak, as they always exists and more high quality consumer products and services can be provided by central cities despite longer distances. In brief, spatial pattern of commuting nucleuses in MMA is polynuclear, simple, and decentralized, differently pattern of consuming nucleuses is also polynuclear, but more complex and multilayer.
3.3. Spatiotemporal Structures and Characteristics of Human Mobility in the Whole Manila Metropolitan Area
Spatiotemporal structures and characteristics of human mobility in the whole MMA will be generally expounded in the ensuing paragraphs. Hourly density of human mobility for a whole day is captured, using Kernel Density Estimation approach (KDE). In this study, grid size is set to 300 m × 300 m for KDE. Figure 7 shows hourly density of human mobility from 00:00 to 24:00. Values filled in each grid indicate trip frequencies (the number of moving trips). All of the subgraphs share the same legend for better comparison.
From 00:00 to 03:00, human mobility is stable and slight. Pronounced human mobility occur only at the NCR area and several suburb centers. Then, at 03:00, human mobility start to spread further outward like wild fire across NCR area and suburb centers, thus attaining the first peak value at 07:00. After 08:00 before 11:00, this spreading trend was maintained at a reduced speed and localized downturn of human mobility can be read at several suburb centers. At noon (11:00–13:00), a second peak value of human mobility occurs at all urban nucleuses and their surrounding areas. Similarly, the intensity of human mobility weakens after 13:00, but reintensifies at 16:00. The third peak value occurs between 17:00–18:00. Lastly, during the nighttime, the intensity of human mobility weakens again. This temporal cycling variation forms a recurring 24 h loop that starts at 00:00 and ends at 24:00. Obviously, it is more significant to highlight the spatiotemporal structure of human mobility occurring at urban nucleuses with different urban function and revealing the reasons for these structures, which will be discussed explicitly in Section 3.4.
3.4. Spatiotemporal Patterns of Human Mobility in Urban Nucleuses
Firstly, 10 typical areas are identified for studying the spatiotemporal characteristics and differences of human mobility at a microcosmic level, considering their different functions and locations (see Section 2.2 and Figure 5). Four urban nucleuses belonging to central city type: Manila (city), Quezon, Makati, and Las Piñas, with different functional characteristics, are herein chosen as the most ideal cases. Manila, the capital of Philippines, is one of the most densely populated city in the world. Quezon is the most populous city in the Philippines and the site of many government offices, which is the northernmost area of NCR next to Manila. Makati is the financial center of Philippines, having the highest concentration of multinational and local corporations in the country, and it is also known for being a major cultural and entertainment hub in MMA. Las Piñas is the southernmost area of NCR, with over half of its land area being residential and the remaining half utilized for commercial, industrial, and institutional purposes. Taytay is chosen as the target area with business city type, because it is a densely populated municipality in the province of Rizal sharing borders with Metro Manila and having a high financial capability, making it one of the richest municipalities in the Philippines. As a commuter town, Biñan is both a suburban residential community of Metro Manila and home for some of the Philippines’ largest industrial estates and export processing zones. It is therefore prudent that Biñan is classified as commuter town type with a high rate of returning-home activities. Two urban nucleuses with south and north suburb type are also chosen, Naic and Guiguinto. Naic is located at the outskirts of the MMA. It is the remotest place when compared with other urban nucleuses in south suburb area. Guiguinto, which is located on the north suburb area of Metro Manila, is a first class and fast-growing urban municipality in the province of Bulacan, Philippines. It is also one of the fast-growing municipalities with a predominantly agricultural economy, where is gradually urbanizing and developing. For urban nucleuses with subcenter city type, Cavite is known as the main seaport of Manila hosting the Manila-Acapulco galleon trade and the port is used for other heavy and larger sea-bound ship since Spanish colonial period. San Jose del Monte is one of the biggest resettlement area, being bordered by the cities of Caloocan and Quezon. Based on the above, these 10 urban nucleuses are chosen as the target area for our next analysis.
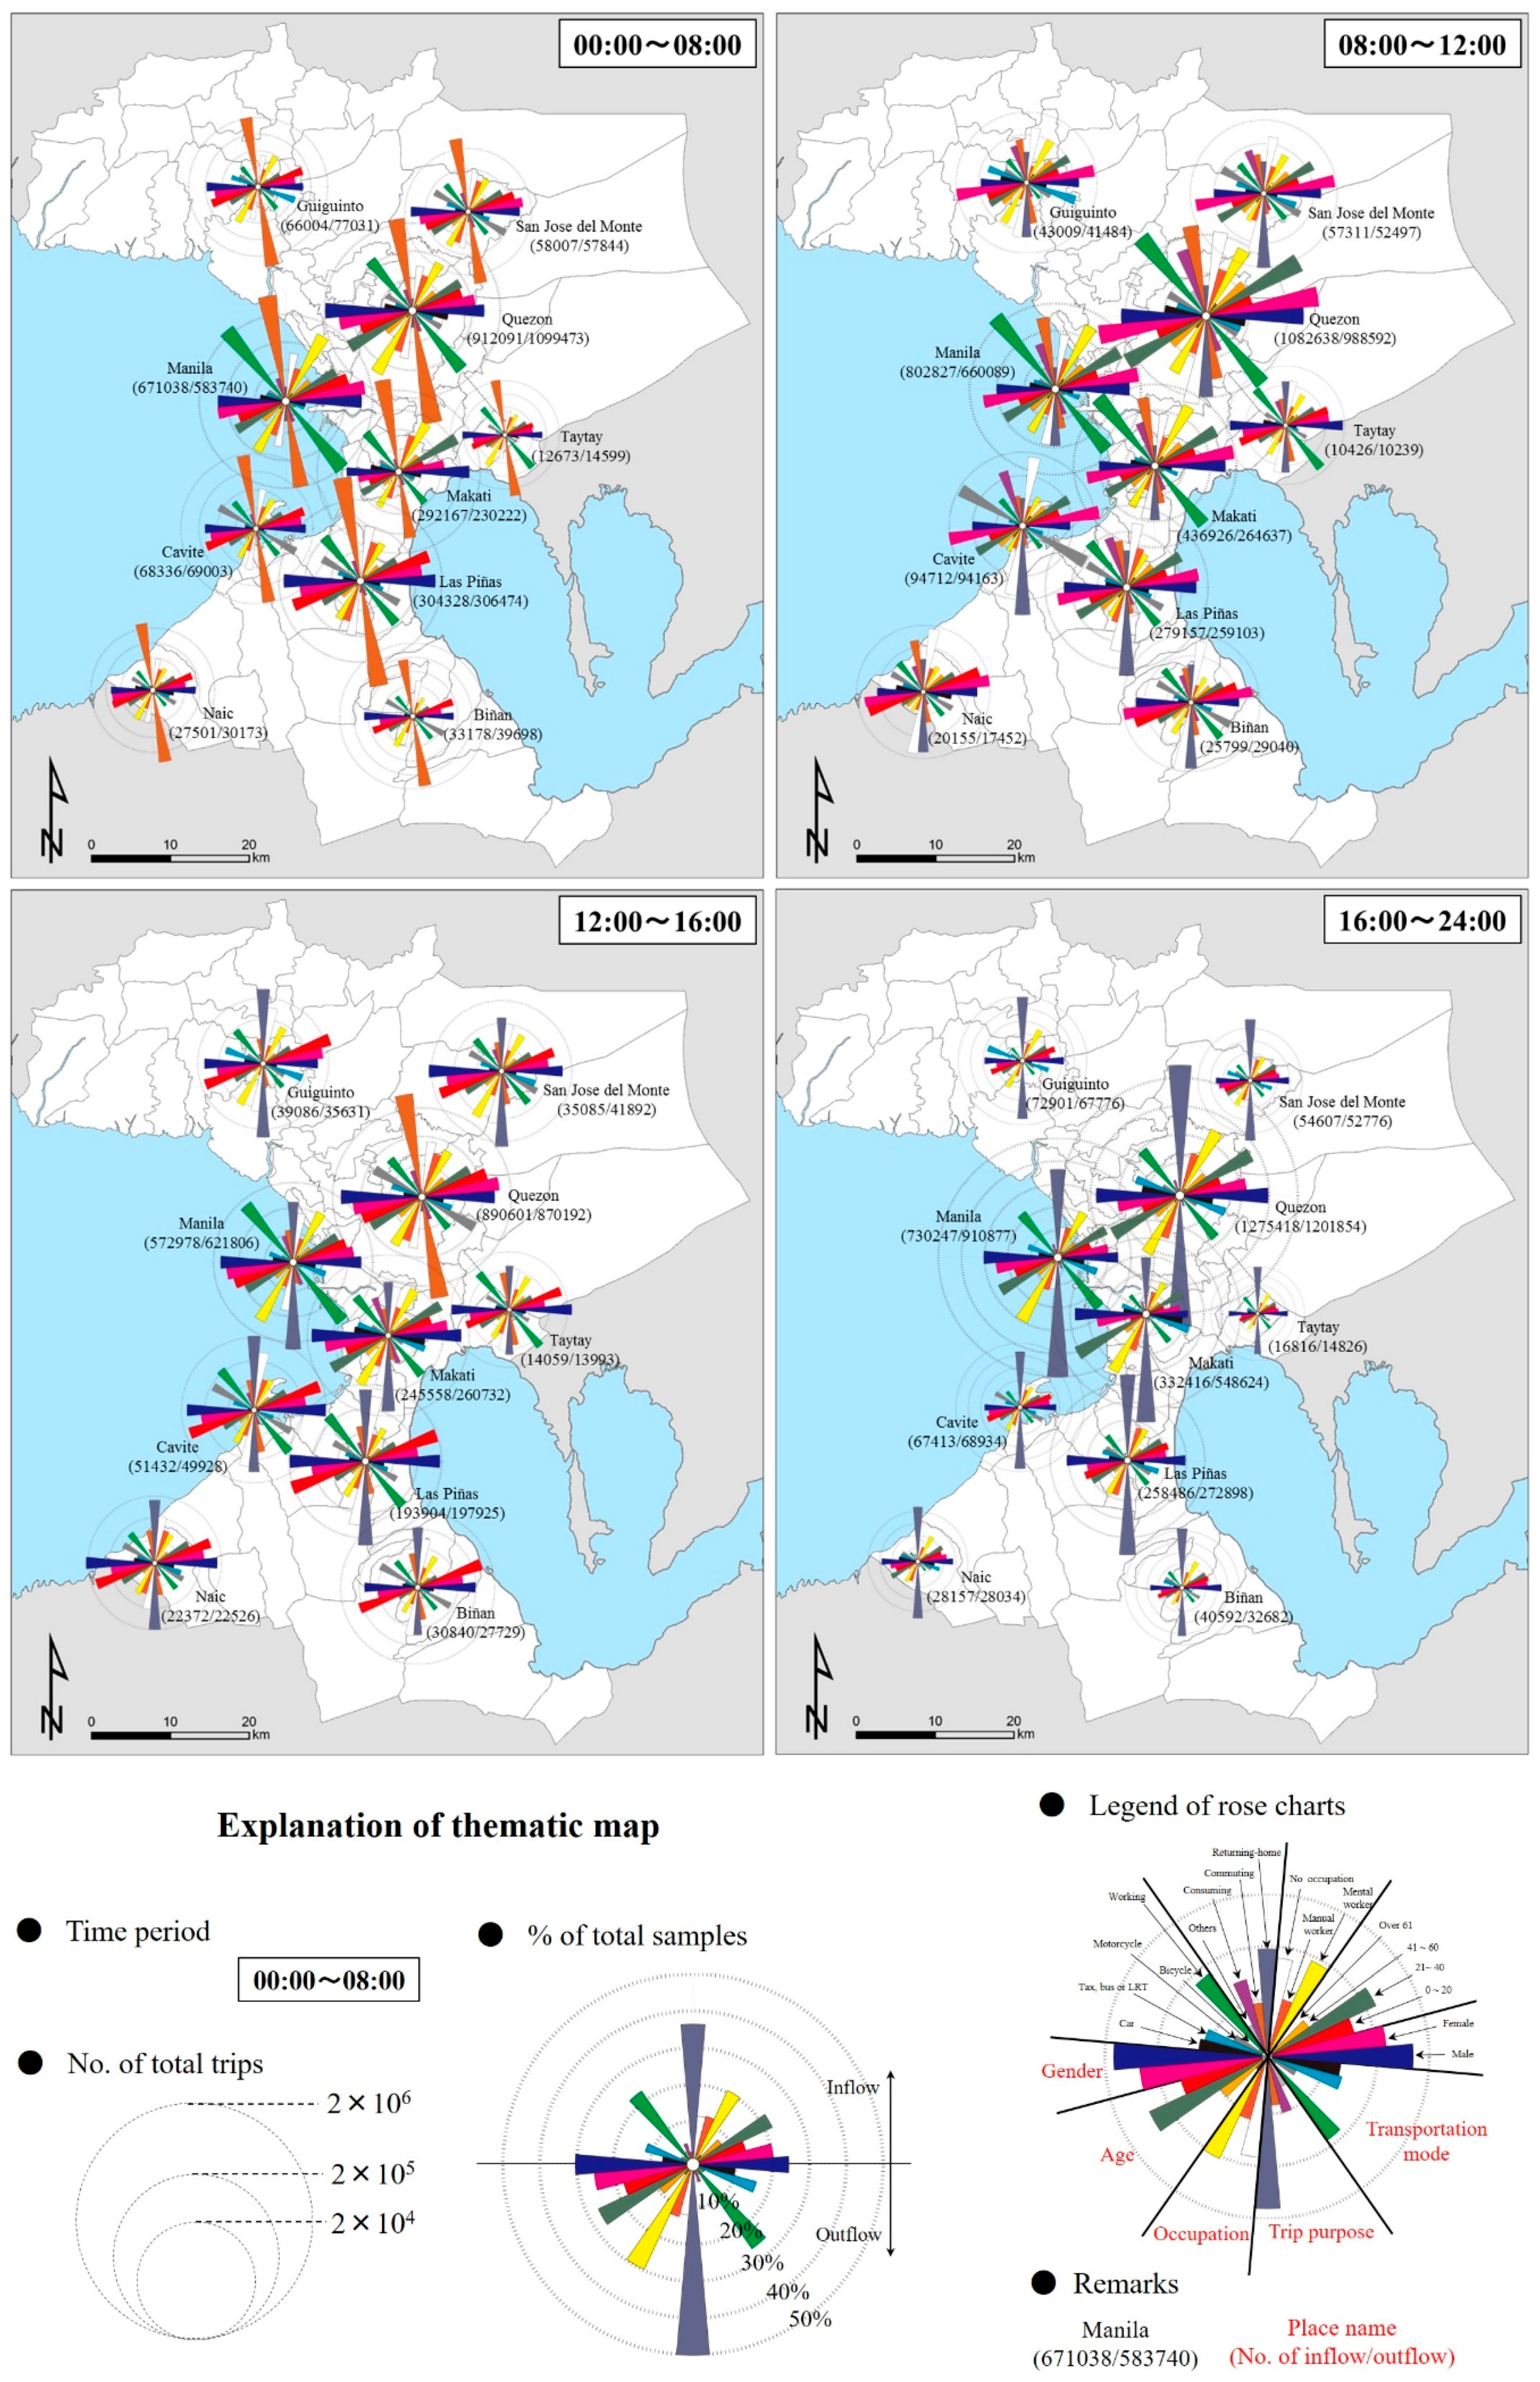
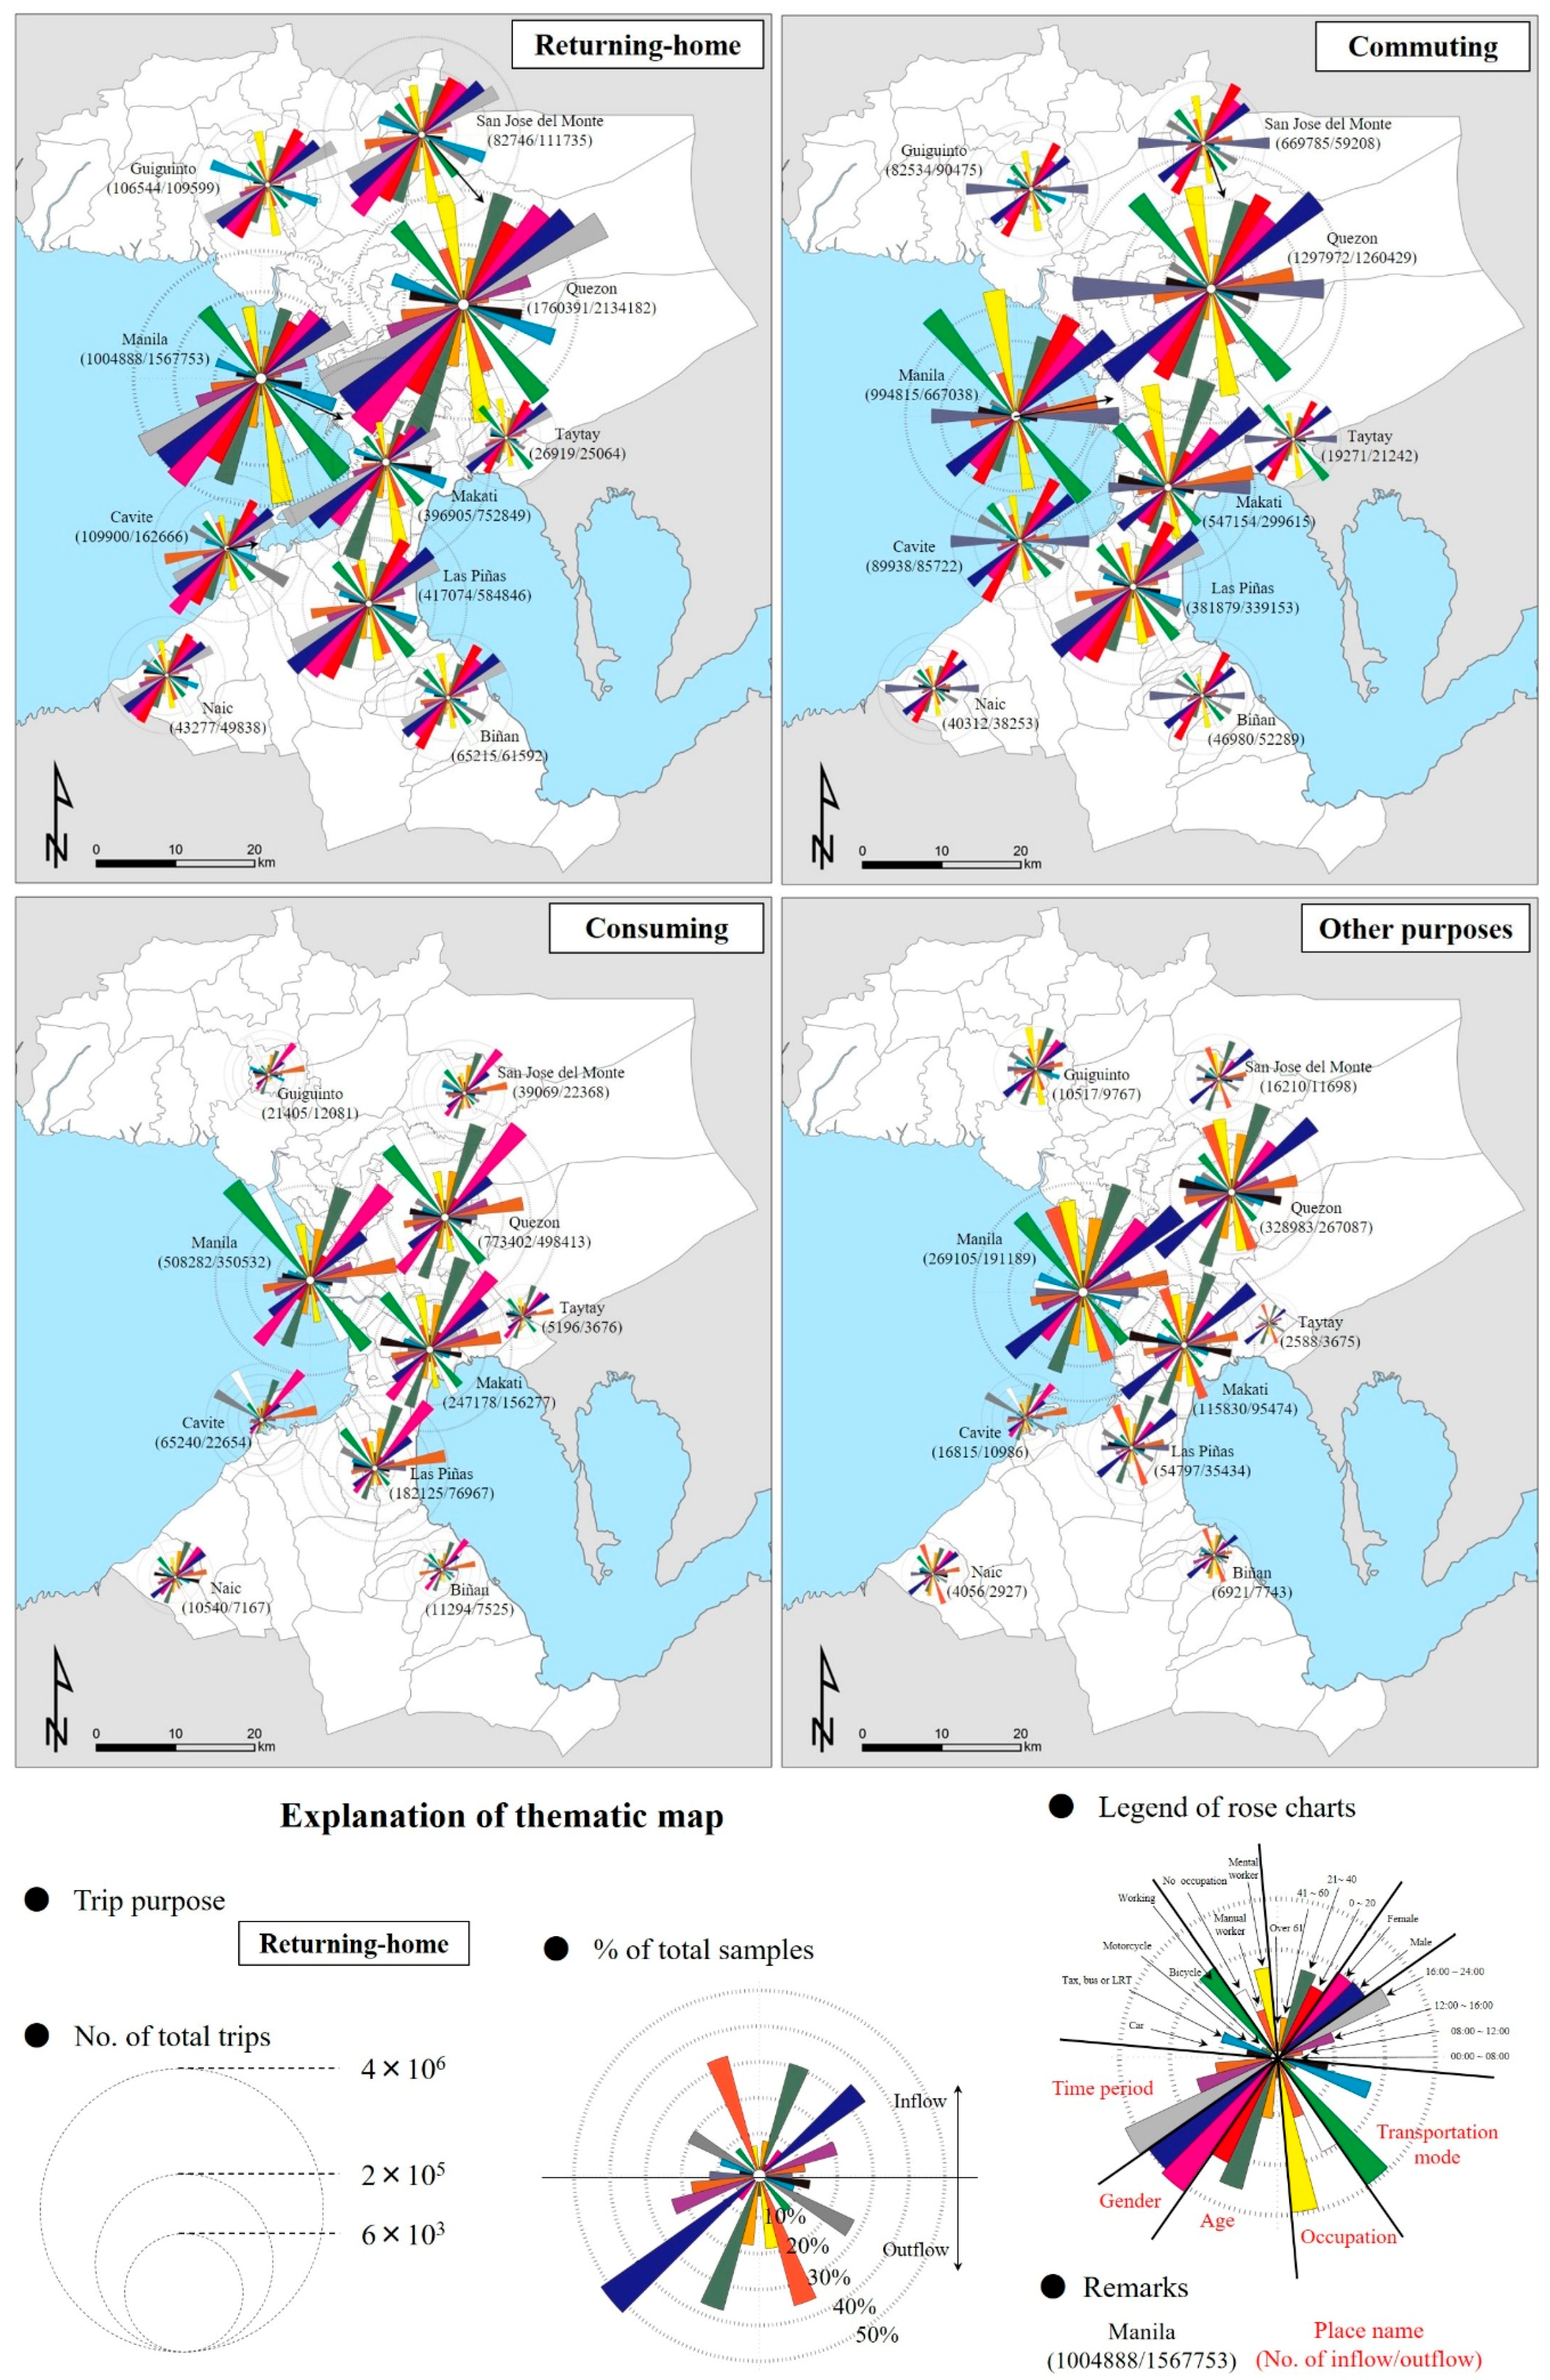
Both inflow and outflow trips are analyzed for the same interval (00:00–08:00; 08:00–12:00; 12:00–16:00; and, 16:00–24:00) for clarifying the attracting and diffusing scope of each target area. When considering that the sample capacity during 00:00–04:00 and 20:00–24:00 is relatively small, this study reclassified the six time periods (4 h break in 24 h) into four ones. Results are summarized in Figure 8 and Figure 9. Figure 8 shows the temporal pattern of human mobility based on different properties, and Figure 9 shows the pattern of human mobility by different properties based on different trip purposes. Size of the rose chart means the total number of trips occurring in one urban nucleus, and its corresponding place name and the number of inflow/outflow are appended. Rings shown in the rose chart mean the percentage of total samples. The upper half-round shows inflow patterns and the lower half-round shows outflow ones. Different properties like gender, age, occupation, trip purpose, transportation mode, and time period are shown dividedly in the rose chart. Color of the sector is for distinguishing the categories of different properties, and length of it means the frequency distribution for each category. That is to say, the number of flows with any properties in 10 target areas can be accurately estimated.
Then, spatiotemporal pattern of human mobility in these 10 target areas with each type will be further studied in the following sections.
3.4.1. Urban Nucleuses with Central City Type
Temporal human mobility in Manila (city) owing to different human properties can be viewed in Figure 8. Considering Manila in the case of gender, during 00:00–12:00, females tend to travel more trips than males. On the contrary, after 12:00 until 24:00, trips by males overtake that of females. This implies difference of social division between males and females. Indeed, a housewife tend to go out for buying food in the morning so a female may get up earlier than a male. Conversely, a male may go back home later than a female. When considering the case of age, younger people (under 40 years old) tend to travel more trips than other age ranges. Peak-time of inflow and outflow trips occur at different time period in different cases of age. Generally speaking, people younger than 20-year-old travels more trips than other cases at 00:00–08:00, because it is the time when students go to school. People older than 20-year-old may prefer trips at 08:00–12:00, later than the case of younger people. People from 21 to 40-year-old may have more nightlife activities than other age ranges. Focusing on the case of transportation mode, walking is the most remarkable transportation mode when compared with others. Peak-time of trips by different transportation modes are generally consistent. However, trips by public transit (here indicates taxi, bus, or light rail transit) or car become more remarkable in the afternoon or night. This is because that public transit is the most convenient and safest mode, and car is the fastest one as compared with other modes. This detail was also proved by the technical report by JICA [28].
Referring to Figure 9, results in Manila show that a male does more commuting activities but a female does more consuming activities. People from 21-year-old to 40-year-old do more commuting and consuming activities relative to other age ranges. Moreover, people younger than 20-year-old have more mobility for returning-home or attending-school. This is in coherence with that shown in Figure 8. A mental worker or unemployed may have more consuming activities than a manual one. Human mobility for different human behaviors is generally consistent based on different properties. In other words, similar to that shown in Figure 8, here we also see difference of social division by different human properties. For inflow case, commuting or consuming activities are more remarkable, but for outflow case returning-home activities are obvious. It should be noted that peak-time of mobility for returning-home, commuting and consuming in Manila occur at 16:00–24:00, 00:00–08:00, and 08:00–12:00, respectively.
Quezon has more volumes of mobility, especially by females, younger people under 20 years old, motorcycle public transit or car than Manila does (Figure 8). This is because Quezon’s area is bigger than Manila and their infrastructure and population structures are different. Moreover, it is easy to envisage that Quezon is located on the north of NCR area and closer to the suburb areas. Manila’s inflows for commuting activities is more considerable than outflows, conversely, Quezon’s result is quite different (see Figure 8 and Figure 9). Therefore, Quezon is more likely to be a commercial core and it has different functions when compared with Manila.
Pattern of human mobility by each kind of human properties in Makati seem to have no difference with those of Manila, Quezon or Las Piñas, except the amount, so not every result of target areas is shown in detail, similarly hereinafter.
In Las Piñas, manual workers’, unemployed people’s and motorcycle mobility are relatively higher, but younger people’s mobility is lower. This may be related with different regional population distribution by age ranges, transportation modes or occupations, and different structures of infrastructure. Generally speaking, unlike Manila and Quezon, Las Piñas has a weaker function as a commuting or consuming nucleus, but a stronger residential function (see Figure 9), which is located at the southernmost part of the NCR and closer to the suburb area.
In summary, urban nucleuses belonging to city center type like Manila, Quezon, Makati, and Las Piñas, attract more males for working, females for consuming, mobility by young people, and mental workers. Amount of commuting or consuming activities is the most considerable in the study area, determining their primacy and dominance over the other cities in MMA. More mobility by public transit and on foot occur there. This indicates that public transit infrastructure and walking environment are superior there. Considering the daily rhythm of human mobility for different purpose, inflow trips for commuting activities are mostly dominant at 08:00–12:00, while outflow trips for returning-home activities are mostly dominant at 16:00–24:00.
3.4.2. Urban Nucleuses with Business City Type
It can also be seen that the rate of commuting mobility is relatively higher than other trip purpose in Taytay. More mental workers’ and motorcycle mobility occur there. Unlike Quezon, consuming activities by females are not so more remarkable than those by males. Rates of social and eating activities are notable, which means that these activities are more possible to be done by males, while females tend to do more shopping activities, which agrees with results in Table 3. Moreover, in Taytay, inflow-mobility for returning-home activities is higher than outflow-mobility, while inflow-mobility for commuting mobility is lower than outflow-mobility. Herein, Taytay has a different function with other urban nucleuses, and it can be regarded as belonging to business city type.
3.4.3. Urban Nucleuses with Commuter Town Type
A male tends to go out for working before 08:00 and come back home after 16:00 in Biñan. Consuming activities are not so remarkable. More mobility by motorcycle or car occur there. Mobility by the unemployed, housewives, or children (no occupation) is the most considerable than other cases. It can also be inferred that a male, younger people or a mental worker’s mobility account for the vast majority of outflow trips that occur in Biñan. Outflow for commuting and inflow for returning-home are more than the other cases. Table 3 unwaveringly emphasizes that urban nucleuses with commuter town type have the highest occurrence rates of attending-school and of medical trips, followed by returning-home trips. Peak-times of inflow-mobility and outflow-mobility occur at 16:00–24:00 and 00:00–08:00, respectively. This demonstrates a perfect temporal symmetry between commuter towns and central cities. Thus, Biñan can be served as a commuter town.
3.4.4. Urban Nucleuses with South and North Suburb Type
Unlike other urban nucleuses, middle or old age people and manual workers or persons with no occupation travel relatively more trips. Walking mobility is less, however mobility by motorcycle and car are more remarkable than other transportation modes (see Figure 8). Similarities and differences of human mobility’s pattern between Naic and Guiguinto can be inferred. Pattern of temporal human mobility based on gender and age is similar. In Naic, mobility by the unemployed, housewives, or children (no occupation) and motorcycle or car are relatively higher than other cases. However, mobility by mental workers and public transit are more considerable in Guiguinto. These details confirm the differences in human social divisions and of infrastructure condition. Generally speaking, Naic’s commuting function is stronger than that for consuming, otherwise Guiguinto is considered as a consuming nucleus.
3.4.5. Urban Nucleuses with Subcenter City Type
Like Naic that belongs to suburb type, mobility by motorcycle in Cavite and San Jose del Monte is also considerable. However, unlike Naic, these cities attract a high rate of consuming activities and relatively more females’ movement. Indeed, urban nucleuses with subcenter city type are not only a kind of spatial transition between central city area and suburb area, but also a kind of attribute functional transition between them.
3.5. Limitations and Suggested Improvement
Indeed, some limitations are also existing in this study. Firstly, person trip dataset we have used was created in 1996, which means that problems caused by obsolete data were ignored. Modern geo-tagged big data that is available in the recent years necessitates a re-thinking for this study. If ignoring the data issues and assuming that PTS data of one urban area at two time-stage might be available in the further, recent data sets can be used to bring the analysis into the “modern” period. Then, the 1996 data set of MMA could be used as a baseline comparable to reveal how human mobility patterns have changed in the MMA over the decades, especially when considering the context of the impacts of socio-economic globalization. This will be an excellent target for the author’s future plan.
Secondly, due to the precision of GPS coordinates, spatial errors might be introduced when geocoding was performed. Furthermore, this dataset does not contain the street address or residence code for each sample, however, we tried to address this problem during the data processing. For future researches on this context, the arduous methods can be ameliorated by using more suitable follow-up survey in MMA. Furthermore, through handling this geo-tagged big data at different time periods can make it possible to reveal the dynamic changing pattern of human mobility on the viewpoint of urban structure. Nevertheless, this study does complete the missions about revealing spatiotemporal patterns of urban structure and human mobility in Manila metropolitan area, by focusing on multiple areas with different functions.
4. Conclusions
The research purposes are to highlight the characteristics of urban nucleuses from the viewpoint of urban structure, and reveal the spatiotemporal pattern of human mobility in Manila metropolitan area, using person-trip data within the application of data mining technology and GIS-based spatial analysis.
First, 24 different urban nucleuses of MMA are determined, which can be divided into six types: central city, business city, commuter town, south suburb, north suburb, and subcenter city. Then, Hourly density of human mobility from 00:00 to 24:00 in the whole study area is quantitatively studied. Particularly, 10 typical areas belonging to 6 different types are picked up for studying spatiotemporal characteristics of human mobility at a microcosmic level. Key findings are summarized as follows.
Spatial pattern of commuting nucleuses in MMA is polynuclear, simple and decentralized, different patterns of consuming nucleuses are also polynuclear, but more complex and multilayer. Spatiotemporal pattern of human mobility in each area depend on its human social division, population composition, infrastructure condition, and functional structure. When considering the urban structure of MMA, a kind of three-levels concentric circles pattern can be understood (see Figure 2). Central cities are all located in the 10-km-range zone from the Makati CBD, where public transit infrastructure are the most prosperous. Business cities are located eastern next to the NCR area, as a hub of communication between NCR area and province of Rizal. Commuter towns are located in the area of about 25 km range from the CBD, playing a residential function to the NCR. Subcenter cities are close to NCR, where both residential and commercial function can be embodied. Suburban center cities are located in the range of 20–40 km from the CBD. Inevitably, therefore, motorcycle and car (jeep and utility vehicle also included) are popular transportation modes within this zone.
This study further provides an effective thinking on handling geo-tagged big data supported by MATLAB programming and GIS technology, possessing a meaningful academic value for transport geography.
Acknowledgments
My thanks would go to the Center for Spatial Information Science, University of Tokyo (CSIS Tokyo), who authorized me to use the person trips dataset of Manila metropolitan area. I also owe my sincere gratitude to Yuji Murayama, Toshiaki Ichinose, Ronald Estoque and Tamba Dauda who gave me their time in listening to me and helping me work out my problems during the difficult course of the thesis. The author would also like to thank the editor and the anonymous reviewers for their constructive comments and suggestions.
Conflicts of Interest
The author declares no conflicts of interest.
Appendix A

Table A1.
List of place name in Manila metropolitan area.
| ID | Province | Place Name | ID | Province | Place Name |
|---|---|---|---|---|---|
| 1 | Metropolitan Manila | Manila | 34 | Bulacan | Plaridel |
| 2 | Mandaluyong | 35 | Pulilan | ||
| 3 | Marikina | 36 | San Jose del Monte | ||
| 4 | Pasig | 37 | Santa Maria | ||
| 5 | Quezon | 38 | Pampanga | Apalit | |
| 6 | San Juan | 39 | Macabebe | ||
| 7 | Caloocan | 40 | Masantol | ||
| 8 | Malabon | 41 | Cavite | Bacoor | |
| 9 | Navotas | 42 | Carmona | ||
| 10 | Valenzuela | 43 | Cavite City | ||
| 11 | Las Piñas | 44 | Dasmariñas | ||
| 12 | Makati City | 45 | General Trias | ||
| 13 | Muntinlupa | 46 | Imus | ||
| 14 | Parañque | 47 | Kawit | ||
| 15 | Pasay | 48 | Naic | ||
| 16 | Pateros | 49 | Noveleta | ||
| 17 | Taguig | 50 | Rosario | ||
| 18 | Bulacan | Angat | 51 | Silang | |
| 19 | Balagtas | 52 | Tanza | ||
| 20 | Baliuag | 53 | Trece Martires | ||
| 21 | Bocaue | 54 | General Mariano Alvarez | ||
| 22 | Bulacan | 55 | Laguna | Biñan | |
| 23 | Bustos | 56 | Cabuyao | ||
| 24 | Calumpit | 57 | Calamba | ||
| 25 | Guiguinto | 58 | Los Baños | ||
| 26 | Hagonoy | 59 | San Pedro | ||
| 27 | Malolos | 60 | Santa Rosa | ||
| 28 | Marilao | 61 | Rizal | Angono | |
| 29 | Meycauayan | 62 | Antipolo | ||
| 30 | Norzagaray | 63 | Cainta | ||
| 31 | Obando | 64 | Rodriguez | ||
| 32 | Pandi | 65 | San Mateo | ||
| 33 | Paombong | 66 | Taytay |
References
- Burgess, E.W. The Growth of the City: An Introduction to a Research Project. In Urban Ecology; Marzluff, J.M., Shulenberger, E., Endlicher, W., Alberti, M., Bradley, G., Ryan, C., Simon, U., ZumBrunnen, C., Eds.; Springer: Boston, MA, USA, 2008; pp. 71–78. Available online: https://link.springer.com/content/pdf/10.1007%2F978-0-387-73412-5.pdf (accessed on 4 January 2018).
- Hoyt, H. The Structure and Growth of Residential Neighborhoods in American Cities; Federal Housing Administration: Washington, DC, USA, 1939. Available online: https://ia800503.us.archive.org/30/items/structuregrowtho00unitrich/structuregrowtho00unitrich.pdf (accessed on 4 January 2018).
- Harris, C.D.; Ullman, E.L. The nature of cities. Ann. Am. Acad. Political Soc. Sci. 1945, 242, 7–17. [Google Scholar] [CrossRef]
- Rodwin, L. The Theory of Residential Growth and Structure. Apprais. J. 1950, 18, 295–317. [Google Scholar]
- Boarnet, M.G.; Hong, A.; Santiago-Bartolomei, R. Urban spatial structure, employment subcenters, and freight travel. J. Transp. Geogr. 2017, 60, 267–276. [Google Scholar] [CrossRef]
- McDonald, J.F.; McMillen, D.P. Employment subcenters and land values in a polycentric urban area: The case of Chicago. Environ. Plan. A 1990, 22, 1561–1574. [Google Scholar] [CrossRef]
- Richardson, H.W. Urban Economics; Dryden Press: Hinsdale, IL, USA, 1978. [Google Scholar]
- Ishikawa, Y. The Trend of Multinucleation and the Characteristics of Suburban Nucleations in the Keihanshin Metropolitan Area. Geogr. Rev. Jpn. 1996, 69, 387–414. (In Japanese) [Google Scholar] [CrossRef]
- Komaki, N. Functional structure of the Tokyo metropolitan area based on the analysis of commuting and consuming activities. New Geogr. 2004, 52, 1–15. (In Japanese) [Google Scholar] [CrossRef]
- Hartshorn, T.A.; Muller, O.P. Suburban downtowns and the transformation of metropolitan Atlanta’s business landscape. Urban Geogr. 1989, 10, 375–395. [Google Scholar] [CrossRef]
- Fujii, T.; Hartshorni, T.A. The changing metropolitan structure of Atlanta, Georigia: Locations of fuctions and regional structure in a multinucleated urban area. Urban Geogr. 1995, 16, 680–707. [Google Scholar] [CrossRef]
- Novák, J.; Sýkora, L. A city in motion: Time-space activity and mobility patterns of suburban inhabitants and the structuration of the spatial organization of the Prague metropolitan area. Geogr. Ann. Ser. B Hum. Geogr. 2007, 89, 147–168. [Google Scholar] [CrossRef]
- Liu, Y.; Kang, C.; Gao, S.; Xiao, Y.; Tian, Y. Understanding intra-urban patterns from taxi trajectory data. J. Transp. Geogr. 2012, 14, 463–483. [Google Scholar] [CrossRef]
- Liu, X.; Gong, L.; Gong, Y.; Liu, Y. Revealing travel patterns and city structure with taxi trip data. J. Transp. Geogr. 2015, 43, 78–90. [Google Scholar] [CrossRef]
- Hawelka, B.; Sitko, I.; Beinat, E.; Sobolevsky, S.; Kazakopoulos, P.; Ratti, C. Geo-located Twitter as proxy for global mobility patterns. Cartogr. Geogr. Inf. Sci. 2014, 41, 260–271. [Google Scholar] [CrossRef] [PubMed]
- Li, R.; Tong, D. Constructing human activity spaces: A new approach incorporating complex urban activity-travel. J. Transp. Geogr. 2017, 56, 23–35. [Google Scholar] [CrossRef]
- Roux, L.G.; Vallée, J.; Commenges, H. Social segregation around the clock in the Paris region (France). J. Transp. Geogr. 2017, 59, 134–145. [Google Scholar] [CrossRef]
- Liu, Y.; Wang, F.; Xiao, Y.; Gao, S. Urban land uses and traffic ‘source-sink areas’: Evidence from GPS-enabled taxi data in Shanghai. Landsc. Urban Plan. 2012, 106, 73–87. [Google Scholar] [CrossRef]
- Kong, X.; Liu, Y.; Wang, Y.; Tong, D.; Zhang, J. Investigating Public Facility Characteristics from a Spatial Interaction Perspective: A Case Study of Beijing Hospitals Using Taxi Data. ISPRS Int. J. Geo-Inf. 2017, 6, 38. [Google Scholar] [CrossRef]
- Yang, X.; Fang, Z.; Xu, Y.; Shaw, S.L.; Zhao, Z.; Yin, L.; Zhang, T.; Lin, Y. Understanding spatiotemporal patterns of human convergence and divergence using mobile phone location data. ISPRS Int. J. Geo-Inf. 2016, 5, 177. [Google Scholar] [CrossRef]
- Li, Y.; Li, Q.; Shan, J. Discover patterns and mobility of Twitter users—A study of four US college cities. ISPRS Int. J. Geo-Inf. 2017, 6, 42. [Google Scholar] [CrossRef]
- Center for Spatial Information Science (CSIS), University of Tokyo. Specification Document of Web API, Ver. 2.72. 2016. Available online: http://pflow.csis.u-tokyo.ac.jp/wp-content/uploads/webapi.pdf (accessed on 13 December 2017).
- National Economic and Development Authority. Building Globally Competitive Metro Areas in the Philippines. 2007. Available online: http://www.neda.gov.ph/devpulse/pdf_files/Devpulse%20factsheet%20-%20Aug%2030%20issue.pdf (accessed on 27 December 2017).
- Estoque, R.C. Manila Metropolitan Area. In Urban Development in Asia and Africa; Murayama, Y., Kamusoko, C., Yamashita, A., Estoque, R., Eds.; The Urban Book Series; Springer: Singapore, 2017; pp. 85–110. [Google Scholar]
- Philippines Statistics Authority. Summary of Projected Population by Region, by Single-Year Interval, Philippines: 1995–2005. Available online: https://psa.gov.ph/sites/default/files/attachments/hsd/article/PDPOPPROJdt9.pdf (accessed on 13 December 2017).
- Liu, X.; Wang, M. How polycentric is urban China and why? A case study of 318 cities. Landsc. Urban Plan. 2016, 151, 10–20. [Google Scholar] [CrossRef]
- Veneri, P. The identification of sub-centres in two Italian metropolitan areas: A functional approach. Cities 2013, 31, 177–185. [Google Scholar] [CrossRef]
- Japan International Cooperation Agency (JICA). Metro Manila Urban Transportation Integration Study; Technical Report; No. 4. Transportation Demand Characteristics Based on Person Trip Survey; Japan International Cooperation Agency: Tokyo, Japan, 1999. Available online: http://open_jicareport.jica.go.jp/pdf/11580503_01.pdf (accessed on 13 December 2017).
Figure 1.
Data structure and explanations of person trip pattern.

Figure 2.
Study framework.
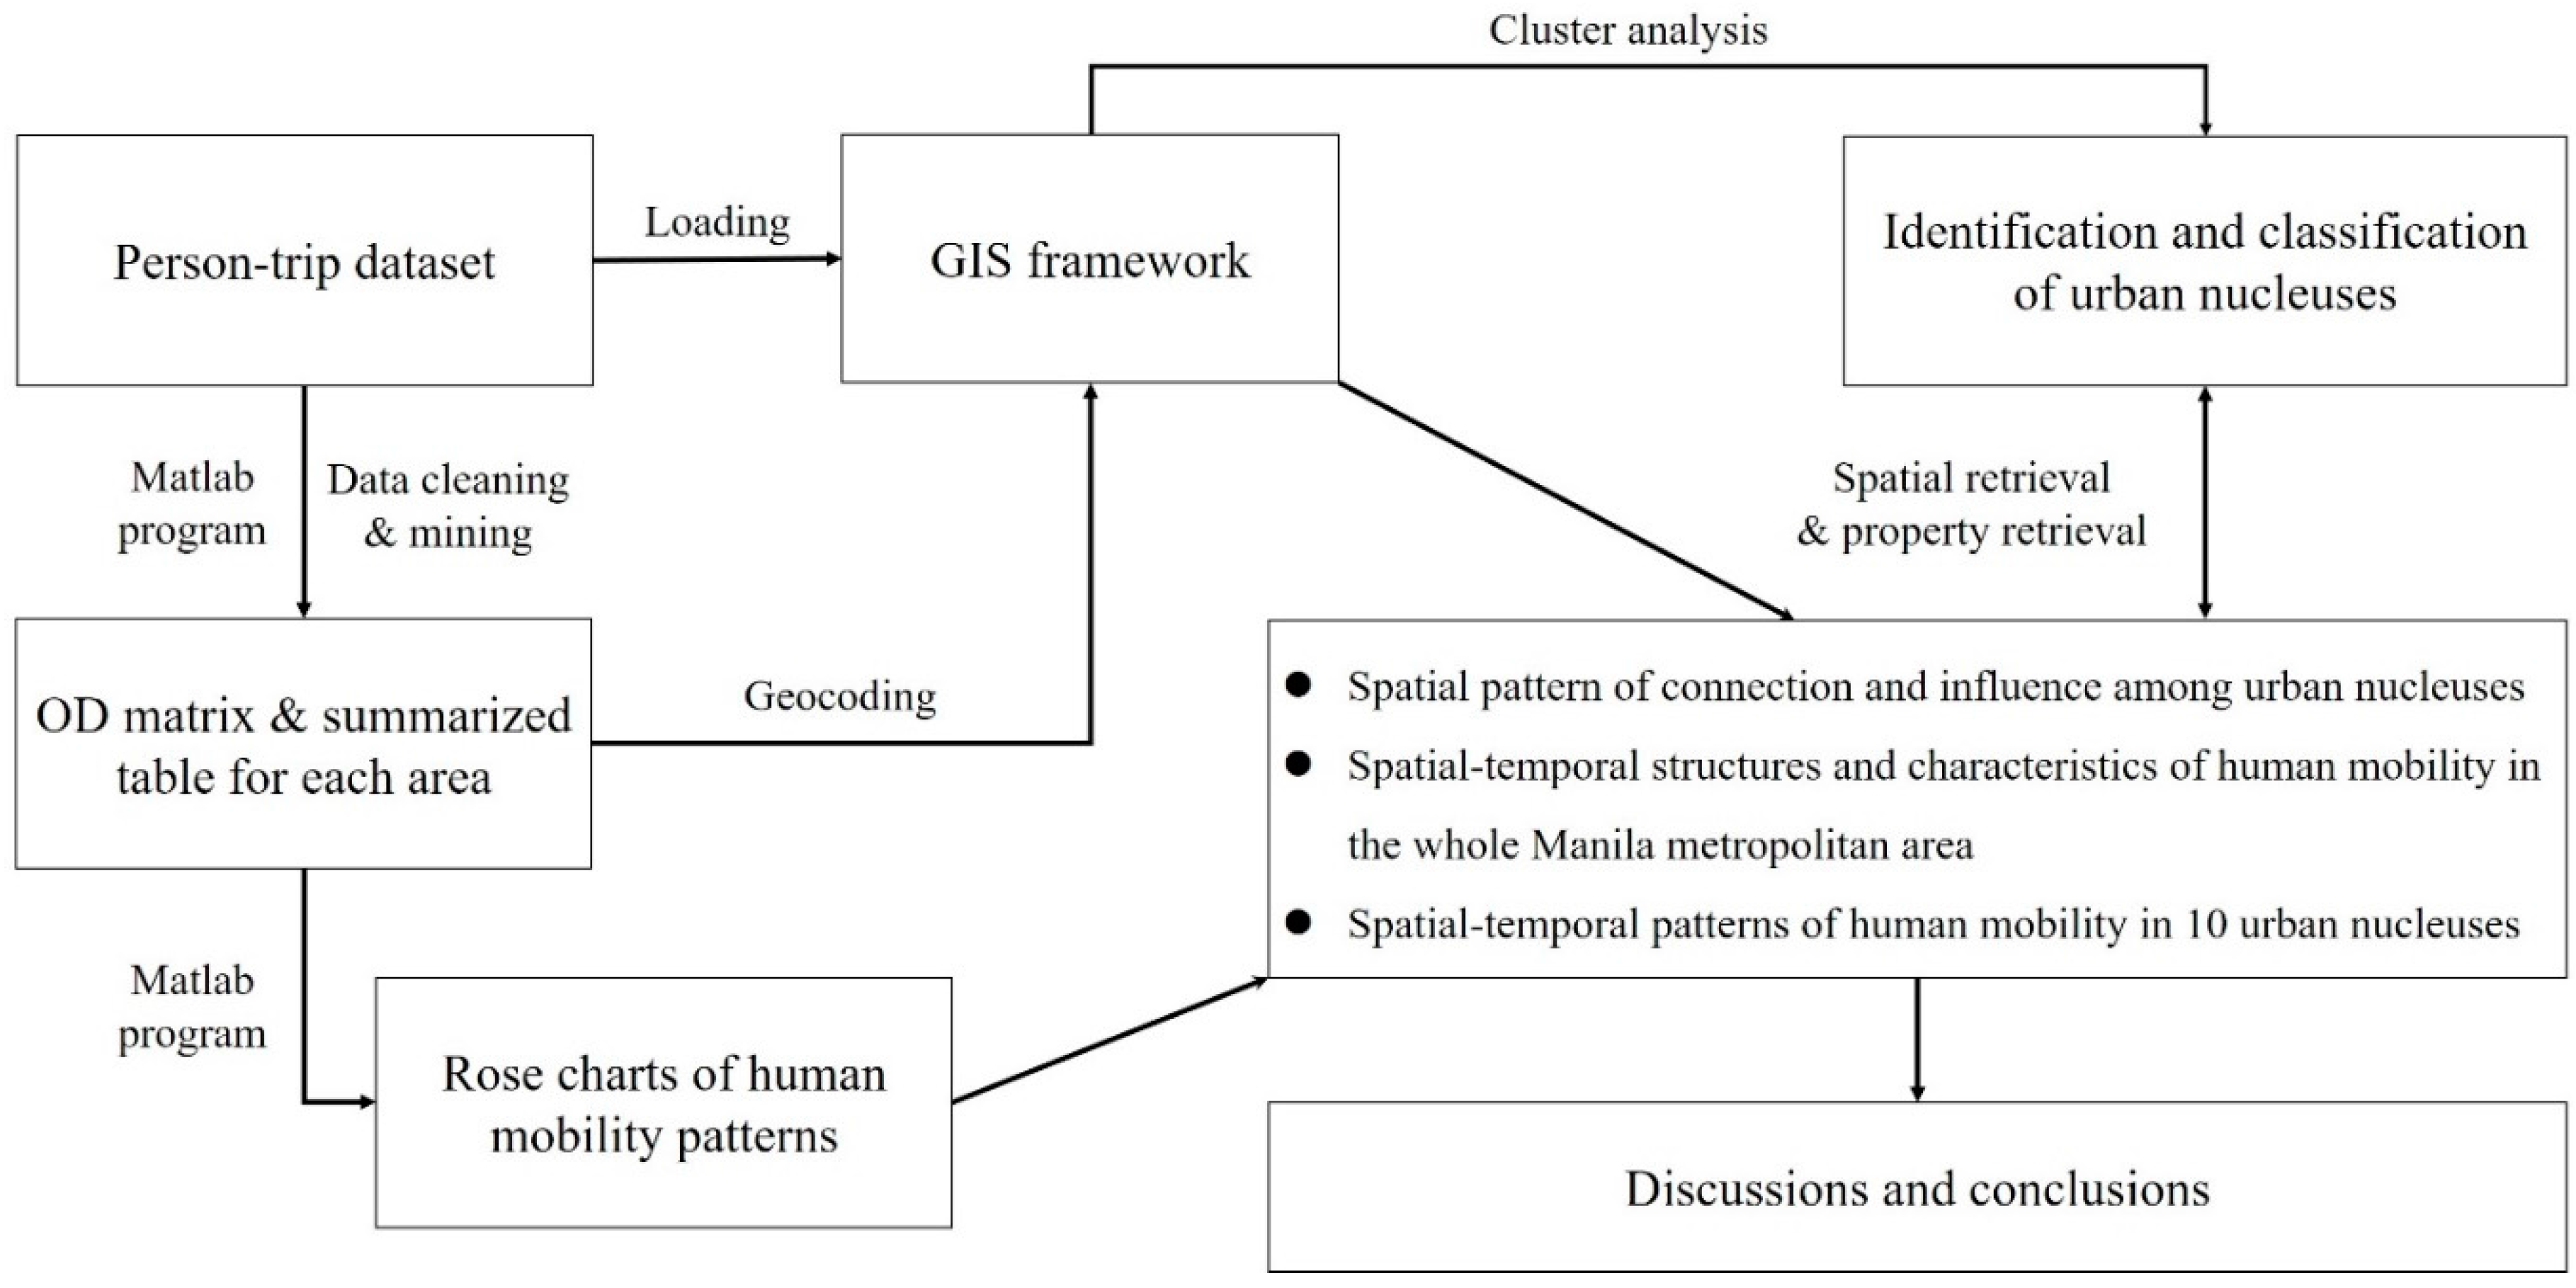
Figure 3.
Administrative division in Manila metropolitan area. Data source: GADM. (Note: Circle center shows the Makati CBD. ID corresponds to place name (cf. Table A1 in Appendix A).).
Figure 3.
Administrative division in Manila metropolitan area. Data source: GADM. (Note: Circle center shows the Makati CBD. ID corresponds to place name (cf. Table A1 in Appendix A).).

Figure 4.
Inflow/outflow excess trips for commuting activities (a) and consuming activities (b).

Figure 5.
Location of urban nucleuses with different types.

Figure 6.
Spatial pattern of connection and influence among commuting nucleuses (a) and among consuming ones (b).
Figure 6.
Spatial pattern of connection and influence among commuting nucleuses (a) and among consuming ones (b).

Figure 7.
Hourly density of human mobility from 00:00 to 24:00 (a–x).
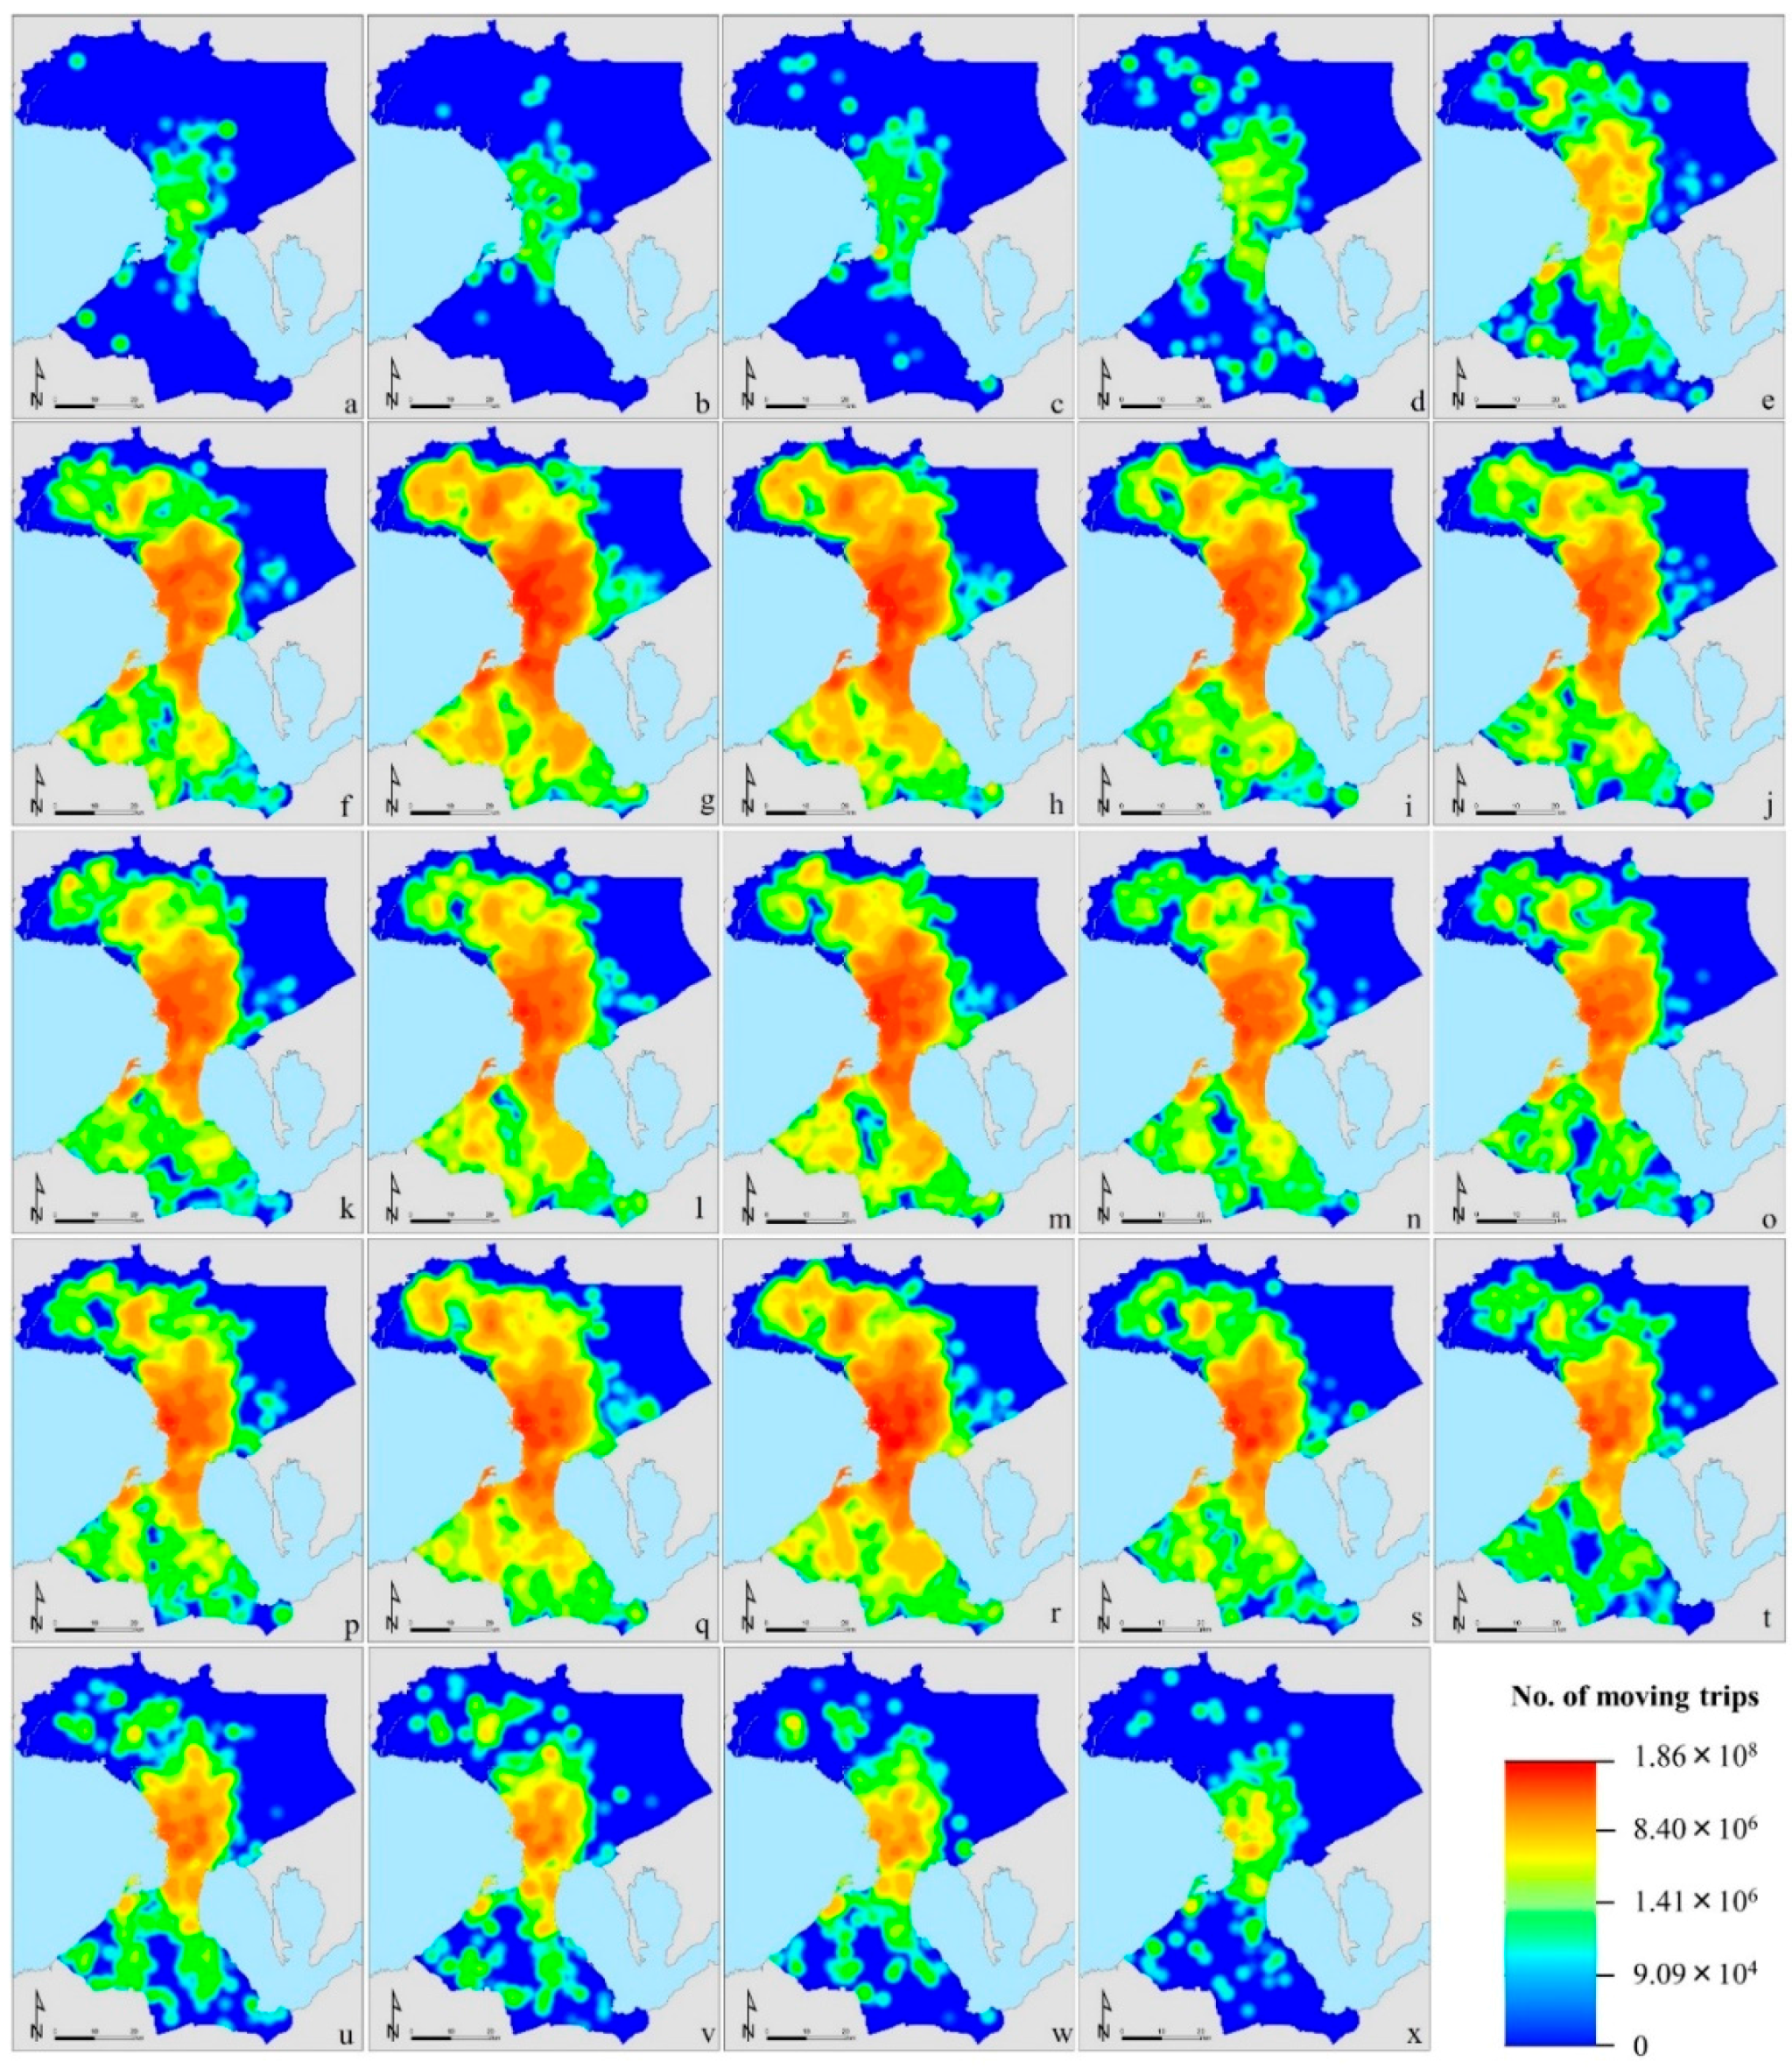
Figure 8.
Temporal pattern of human mobility in Manila metropolitan area based on different properties.
Figure 8.
Temporal pattern of human mobility in Manila metropolitan area based on different properties.

Figure 9.
Pattern of human mobility by different properties in Manila metropolitan area based on different trip purposes.
Figure 9.
Pattern of human mobility by different properties in Manila metropolitan area based on different trip purposes.

Table 1.
Sample description (estimated variables) of person-trip survey data based on different human properties (unit: one thousand persons). Data source: CSIS, author’s calculations.
Table 1.
Sample description (estimated variables) of person-trip survey data based on different human properties (unit: one thousand persons). Data source: CSIS, author’s calculations.
| Item | Number of Sub Trips | ≤3 | 4–6 | 7–9 | 10–13 | ≥14 | Estimated Population | Number of Samples |
|---|---|---|---|---|---|---|---|---|
| Gender | Male | 1420 | 4339 | 586 | 102 | 22 | 6468 | 88 |
| Female | 2133 | 4332 | 441 | 34 | 2 | 6942 | 102 | |
| Age | ≤20 | 810 | 3470 | 299 | 8 | 0.5 | 4587 | 69 |
| 21–30 | 820 | 2003 | 243 | 36 | 6 | 3108 | 39 | |
| 31–40 | 653 | 1504 | 225 | 48 | 8 | 2439 | 33 | |
| 41–50 | 528 | 919 | 148 | 28 | 6 | 1629 | 25 | |
| 51–60 | 356 | 468 | 68 | 11 | 3 | 905 | 14 | |
| ≥61 | 387 | 306 | 43 | 5 | 0.4 | 742 | 10 | |
| Occupation | Mental worker | 633 | 3334 | 420 | 47 | 6 | 4440 | 61 |
| Manual worker | 487 | 1798 | 279 | 67 | 17 | 2647 | 37 | |
| No occupation | 2119 | 3372 | 307 | 19 | 0.8 | 5817 | 85 | |
| Others or unknown | 313 | 167 | 21 | 3 | 0.4 | 506 | 7 | |
| Total | 3552 | 8671 | 1027 | 136 | 24 | 13,410 | 189 | |
Note: In order to simplify the data operations, 15 kinds of occupation codes had been reclassified into 4 groups: mental worker (executive, profess, clerical, trade or student); manual worker (technician, service, farmer, operator or laborer); no occupation (pupil, housewife or jobless) and others or unknown, same as the below.
Table 2.
Descriptions of trip purpose code. (cf. document from CSIS).
| Original Code | Categories of Trip Purpose (Before) | Description in this Case (After) |
|---|---|---|
| 1 | To Home | Home-returning activities |
| 2 | To Work | Commuting activities |
| 3 | To School | |
| 4 | Private affairs | Consuming activities |
| 5 | Employer’s business | Others or unknown |
| 6 | Medical | Consuming activities |
| 7 | Social | |
| 8 | Eating | |
| 9 | Shopping | |
| 10 | Church | Others or unknown |
| 11 | Accompany other household members | Consuming activities |
| 12 | Others | Others or unknown |
| 97 | No-moving | Unexplored |
| 99 | Unknown | Others or unknown |
Note: Code 97 means no-moving, which was unexplored in this case.
Table 3.
12 kinds of activity occurrence rate’s average values of each group. Data source: CSIS, author’s calculations.
Table 3.
12 kinds of activity occurrence rate’s average values of each group. Data source: CSIS, author’s calculations.
| Group (No. of Areas) | A (10) | B (2) | C (2) | D (4) | E (4) | F (2) |
|---|---|---|---|---|---|---|
| To Home | 41.52% | 30.72% | 47.49% | 44.99% | 48.59% | 46.06% |
| To Work | 17.10% | 17.74% | 10.43% | 20.87% | 18.39% | 12.13% |
| To School | 15.46% | 28.92% | 31.29% | 22.84% | 21.42% | 20.62% |
| Private affairs | 2.39% | 4.33% | 1.57% | 1.62% | 1.60% | 1.58% |
| Employer’s business | 6.66% | 7.53% | 3.54% | 3.80% | 3.19% | 5.03% |
| Medical | 0.46% | 0.35% | 0.56% | 0.12% | 0.35% | 0.29% |
| Social | 2.18% | 3.44% | 1.31% | 1.84% | 1.41% | 2.56% |
| Eating | 1.26% | 2.28% | 0.03% | 0.44% | 0.45% | 1.17% |
| Shopping | 7.01% | 2.73% | 2.50% | 1.96% | 3.36% | 8.23% |
| Church | 2.70% | 0.11% | 0.30% | 0.21% | 0.22% | 0.31% |
| Accompany other household members | 2.27% | 1.48% | 0.66% | 0.76% | 0.70% | 1.52% |
| Others | 1.00% | 0.38% | 0.31% | 0.53% | 0.32% | 0.50% |
Note: All percentage numbers are round-off ones after retaining two decimal places. Bold face numbers give a basis for the classification.
© 2018 by the author. Licensee MDPI, Basel, Switzerland. This article is an open access article distributed under the terms and conditions of the Creative Commons Attribution (CC BY) license (http://creativecommons.org/licenses/by/4.0/).
Share and Cite
MDPI and ACS Style
Liu, K. Spatiotemporal Analysis of Human Mobility in Manila Metropolitan Area with Person-Trip Data. Urban Sci. 2018, 2, 3. https://doi.org/10.3390/urbansci2010003
AMA Style
Liu K. Spatiotemporal Analysis of Human Mobility in Manila Metropolitan Area with Person-Trip Data. Urban Science. 2018; 2(1):3. https://doi.org/10.3390/urbansci2010003
Chicago/Turabian StyleLiu, Kai. 2018. "Spatiotemporal Analysis of Human Mobility in Manila Metropolitan Area with Person-Trip Data" Urban Science 2, no. 1: 3. https://doi.org/10.3390/urbansci2010003