A Framework for Understanding Sense of Place in an Urban Design Context


1
School of Architecture, Planning and Preservation, University of Maryland, 3835 Campus Drive, College Park, MD 20742, USA
2
Golisano Institute for Sustainability, Rochester Institute of Technology, Rochester, NY 14623, USA
*
Author to whom correspondence should be addressed.
Urban Sci. 2018, 2(2), 34; https://doi.org/10.3390/urbansci2020034
Submission received: 24 February 2018
/
Revised: 5 April 2018
/
Accepted: 11 April 2018
/
Published: 13 April 2018
Abstract
:Creating a sense of place and community is a guiding principle in designing livable and high-quality built environments. This paper presents a framework for understanding the relationship between design and people’s perceptions about a place, within an urban design context. While a large volume of literature on sense of place (SOP) already exists, the proposed framework and its application in the design field present a unique opportunity to add new knowledge to this interdisciplinary topic. This research will investigate the empirical relationship between architecture/urban design and people’s perceptions about a place and their contributions to SOP. Urban designers and architects play important and determining roles in defining the physical qualities and the characteristics of a place. However, it has always been challenging to quantify the relationship between a physical environment and a person’s emotional experience. Three urban sites were analyzed to illustrate this framework, and four physical characteristics and four perceptual qualities were cross-investigated and analyzed. This proposed framework will help architects and urban designers to gain a better understanding of SOP and placemaking techniques, eventually helping to improve urban design quality.
1. Introduction
Creating a sense of place (SOP) and community is a guiding principle in designing livable and high-quality built environments [1,2,3]. “Place” is a complex concept that embodies a set of tangible and nontangible qualities, and literature has long theorized an emotional connection between people and places. The study of this connection can be referred to as SOP research. SOP is not a theory belonging to one single discipline, as the earliest studies on SOP were rooted in both social science and urban design. Social science examines people’s connectedness and identity with the built environment, whereas urban design focuses on people’s perceptions and experiences of the built environment through design. A rich history of discussion and theory has developed over the last half-century that explores SOP. Researchers from collateral fields—such as sociology, geography, anthropology, philosophy, environmental psychology, and architecture and urban planning—have examined SOP from different perspectives. A preliminary literature review follows in order to cast an overall picture of the current body of literature and to help position this work within that context.
From a geographical perspective, “place” means primarily two things: one’s position in society and spatial location. The study of status belongs to sociology whereas the study of location belongs to geography. Possessing SOP is unique to human beings: people demonstrate their SOP when they apply their moral and aesthetic discernment to sites and locations [4]. There is a strong belief that SOP is an innate faculty possessed by everyone, which connects us to the world. It is essential to our environmental experience and is, in fact, a skill that can be learned and applied to understand changes in environmental knowledge and practice [5,6]. The geographical view of SOP is broader, and the research objectives are typically less idealistic and are well connected to other disciplines, such as psychology, architecture, sociology, and even economics. One particular subset of geography—behavioral geography—examines human behavior in order to understand individuals’ perceptions of their surrounding areas. This subfield has been particularly successful in studying people’s experiences and lives by introducing a phenomenological approach. Later on, it was broadly used in the architectural design field [7,8], which largely contributed to forming research on SOP.
In the social sciences sphere, the study of SOP has focused on how one understands a place and his or her existence in that certain place. An individual’s feelings about a place are closely interwoven with different the dimensions of community sentiment, such as community satisfaction, attachment, and identity [9]. When compared to a space that is more properly conceived as abstract geometries, “place” is defined by a unique collection of qualities and characteristics that are registered with a particular geographic location, material form, and group of people [10,11]. Therefore, each place has its own unique set of indicators—physical, visual, social, and economic—that define SOP [12]. In our proposed framework, we adopt this fundamental idea that SOP is to be investigated from physical, visual, and social angles.
There are a variety of SOP studies, from anthropological, psychological, and philosophical perspectives as well. From the beginning, those studies have been more interested in determining the history of conceptualizations of places and spaces since the quality of a place is shaped by the qualities of its occupants and reflect those qualities in its own constitution as a series of events [13,14]. The most interesting development has been in the field of psychology: a theory of perception of ecology was developed based on the inextricable links between the visual perception of an organism and the environment in which it interacts. This theory has been extended and applied to decipher the relation between space and place, environment, and perception [15,16].
The existing knowledge gap exists in translating the academic research to architecture and urban design practice. Urban designers and architects play important and determining roles in defining the physical qualities and characteristics of a place. In fact, SOP is a guiding principle in designing the built environment for sustainability and livability. Scholars, such as Christopher Alexander and Sebastien Marot, also identified the important role that landscape plays in placemaking, since social meanings and cultural heritage could exist in a natural place [17,18]. Constructing and making a place is dynamic, and the effectiveness of the place depends on human perceptions of the space, social interactions, economies, cultures, and histories [19]. The physical environment provides cues in people’s perceptions about a place, and perceptions of the place are ever-changing due to the time and context, which could make or unmake the place. There is limited understanding of how people perceive the design features. Currently, architects and designers concentrate on the physical environment when crafting a sense of place; understanding the influence of and the interaction between perception and placemaking could be a huge benefit to creating both effective and meaningful places.
The research questions authors aim to answer are: (1) whether there are correlation between physical environment characteristics and perceptual qualities of a place, and (2) whether the perceptual qualities contribute to a sense of place.
Current Research of SOP in Urban Design Field
The literature that has been produced by architects and urban designers has been very active in creating the measurement of urban-design quality for SOP, but most of those methods are qualitative. Norberg-Schulz believed that SOP could be best described as a three-dimensional spatial organization: “Space denotes the three-dimensional organization of the elements which make up a place, and character denotes the general atmosphere which is the most comprehensive property of any place …” [20] Influential urban planner/designer Kevin Lynch developed a qualitative framework to measure SOP in the 1980s. His framework contains several key indicators and establishes the potential relation between physical forms and peoples’ perceptions. Lynch pointed out that the interaction between person and place not only depends on the spatial form, but also on the person’s cultural background, previous experience, and social status, among other things [21]. His views and studies were rooted in a social science perspective of SOP. Similar to Lynch, Jackson defines SOP as being “created by recurring events which are created by the users in the course of the time … A SOP is reinforced by what might be called a sense of recurring events” [21]. In this subset of urban-design studies, SOP is created and changed by the users—without the changing of physical characteristics of a place, people’s SOP could change due their personal experience and status.
In another subset of SOP studies in an urban-design context, the physical characteristics of a place are the dominant factors that can influence a person’s SOP. Urban designers and architects believe that improving the visual quality of a place could alter or reverse a bad SOP. There have been several influential studies on this since the 1990s. In particular, Nasar produced a study that was focused on how people react to the visual form. He conducted interviews with residents and visitors in which the interviewees were asked to identify the areas that they liked and disliked [22]. He proposed a theoretical framework of aesthetic responses in relation to buildings that resulted from interactions between the users and the built environment. Traditionally, this type of visual survey is conducted through verbal description [23,24] or image ratings [25,26,27]. This study was useful but not comprehensive. People’s perceptions about a place are influenced by many factors. Multiple sensory channels—such as sound, smell, and speed—can have a big effect on perceptions, which are absent in pictographic depictions [28].
In recent years, there have been quite a few studies on collecting and understanding people’s perceptions of cities on a macroscale or a micro-neighborhood scale. The studies typically come from conventional fields, such as geography, sociology, environmental psychology, architecture, or urban design. However, the most recent studies have been conducted by transdisciplinary teams (sociology, computer science, physics, media art, etc.) using novel technology and methods, such as online crowdsourcing. For instance, Salesses’ team created quantitative measures of urban perceptions using online images to determine inequalities among cities. Most recently, a group of computer scientists introduced a new crowdsourced dataset that measures six perceptual attributes of a city: safety, liveliness, boredom, wealth, depression, and beauty [29]. So far, this newest transdisciplinary method, when combined with data science, has been successful in collecting a large dataset. The limitations with this method include the condensed and limited amount of information that can be captured by an image [28]. Meanwhile, researchers from different disciplines agree that our ability to understand the effects of a city’s built environment on social and economic outcomes has been limited by the lack of quantitative data on urban perception [28]. For professionals in the architecture and urban-design fields, what is more important than the continuation of data collection is the question of how we can interpret the data and translate it into practice.
It has always been challenging to quantify the relationship between the physical environment and human emotional attachment, therefore to translate perception data to design approach or techniques. With all good intentions to create a high-quality space to stimulate users’ positive emotion about a place that eventually could lead to a better SOP most current design guidelines have taken a prescriptive approach without providing transparent reasons for their requirements. For instance, the City of Los Angeles’ downtown design guide requires that each sidewalk provide a minimum of 6 feet of continuous path of travel, and an 18-to-24-inch wide access zone next to the curb. There is a lack of transparency in how such prescriptive requirements and measurements have been determined. The lack of transparency and clarity could result in three sources of confusion: (1) unclear requirements—it is not clear whether the physical spaces and dimensions are needed only for practical reasons, such as parking space size, car turning radius, etc., or physiological comfort of pedestrian; (2) lack of scientific support—most guidelines come from the designers’ field experience and observations that have been proven to be effective in certain conditions, however, so far there are no agreed-upon research results supporting a universal design guideline suitable for all different urban contexts; and, (3) uncertainty of effectiveness—there is no proven feedback about the effectiveness of those design guides. For anyone who has experienced downtown Los Angeles, a 6-foot-long continuous travel path certainly is not the key component in creating a SOP or a vibrant urban environment. A rich history of discussion and theory has developed over the past century among researchers from the geography and sociology fields, which has been exploring the connection between physical environment and users’ perceptions. However, only a very small body of literature from the fields of architecture and urban design take an integrated quantitative and qualitative approach to the SOP.
2. Perceptual Qualities of Place and Physical Characters Defined in Urban Design Guidelines
The urban design literatures show a variety of perceptual qualities in the physical environment could affect human behaviors. The majority of the discussion about SOP has been theoretical; there are very few studies in design that take a quantitative approach to collecting users’ feedback about a place and identifying the relationship between designers’ intentions and users’ perceptions. A few studies have taken qualitative approaches or hybrid approaches. R. Ewing and S. Handy have listed 51 perceptual qualities that have a direct correlation to a physical built environment [30]. Most urban design literature does not provide empirical evidence to support the claim that those perceptual qualities could actually provide a SOP, due to the difficulties of measuring and understanding how the perceptual qualities could stimulate a positive SOP. Of the 51 qualities, R. Ewing identifies the eight most important and successfully validates five of eight: imageability, visual enclosure, human scale, transparency, and complexity [30]. Ian Bentley points out five key issues in placemaking that have an impact on the SOP and can be perceived through the urban design: permeability, variety, legibility, robustness, and visual appropriateness [31]. Beidler and Morrison identify four dimensions of SOP: the self, the environment, social interaction, and time [32]. Ray Green uses a 21-point rating scale to measure the residents’ perception of town character, and identifies 19 environment stimuli, both natural and man-made, such as beach, lighthouse, ocean, restaurants, shops, rainforest area, pub, etc. [33]. The perceptual qualities are the key factors contributing to the SOP, based on the literature review, this research has chosen to examine the four perceptual qualities in Ewing’s study that are most closely related to visual form defined by urban design: imageability, visual enclosure, human scale and complexity.
It is possible that this lack of quantitative approaches in urban design studies derives from two major causes. First is the designers’ concern about losing creativity: if a SOP could be bounded by certain criteria, then the designers might feel constrained; the second cause could be that the origin of urban design derived from philosophical and political traditions that typically take a qualitative approach [34]. Without a scientific or quantitative approach, evidence of the impact of built forms and the physical environment on creating a SOP is not yet well established. Even with the best intentions, urban design that is based on design guidelines alone may not necessary effectively help residents to form a strong bond with the space and gain a SOP. Table 1 below lists examples of the current design guidelines in several different cities. Authors have reviewed design guidelines from 34 cities in four continents and have selected the most exemplary and detailed design guidelines. Three criteria we have used to select the cities to review the design guidelines: population around 1,100,000 or more (similar to Rochester); maturity of city (the urban design guidelines have been implemented for more than 40 years); and, diversity of city location (across different continents and culture).
From those design guidelines, we extracted four frequently adopted key physical categories: nature system and site feature, urban pattern and form, architecture context and form, streetscape. Later, we asked panelists to rate each of those categories based on their contribution to four perpetual qualities of a place.
3. Methodological Approach and Process
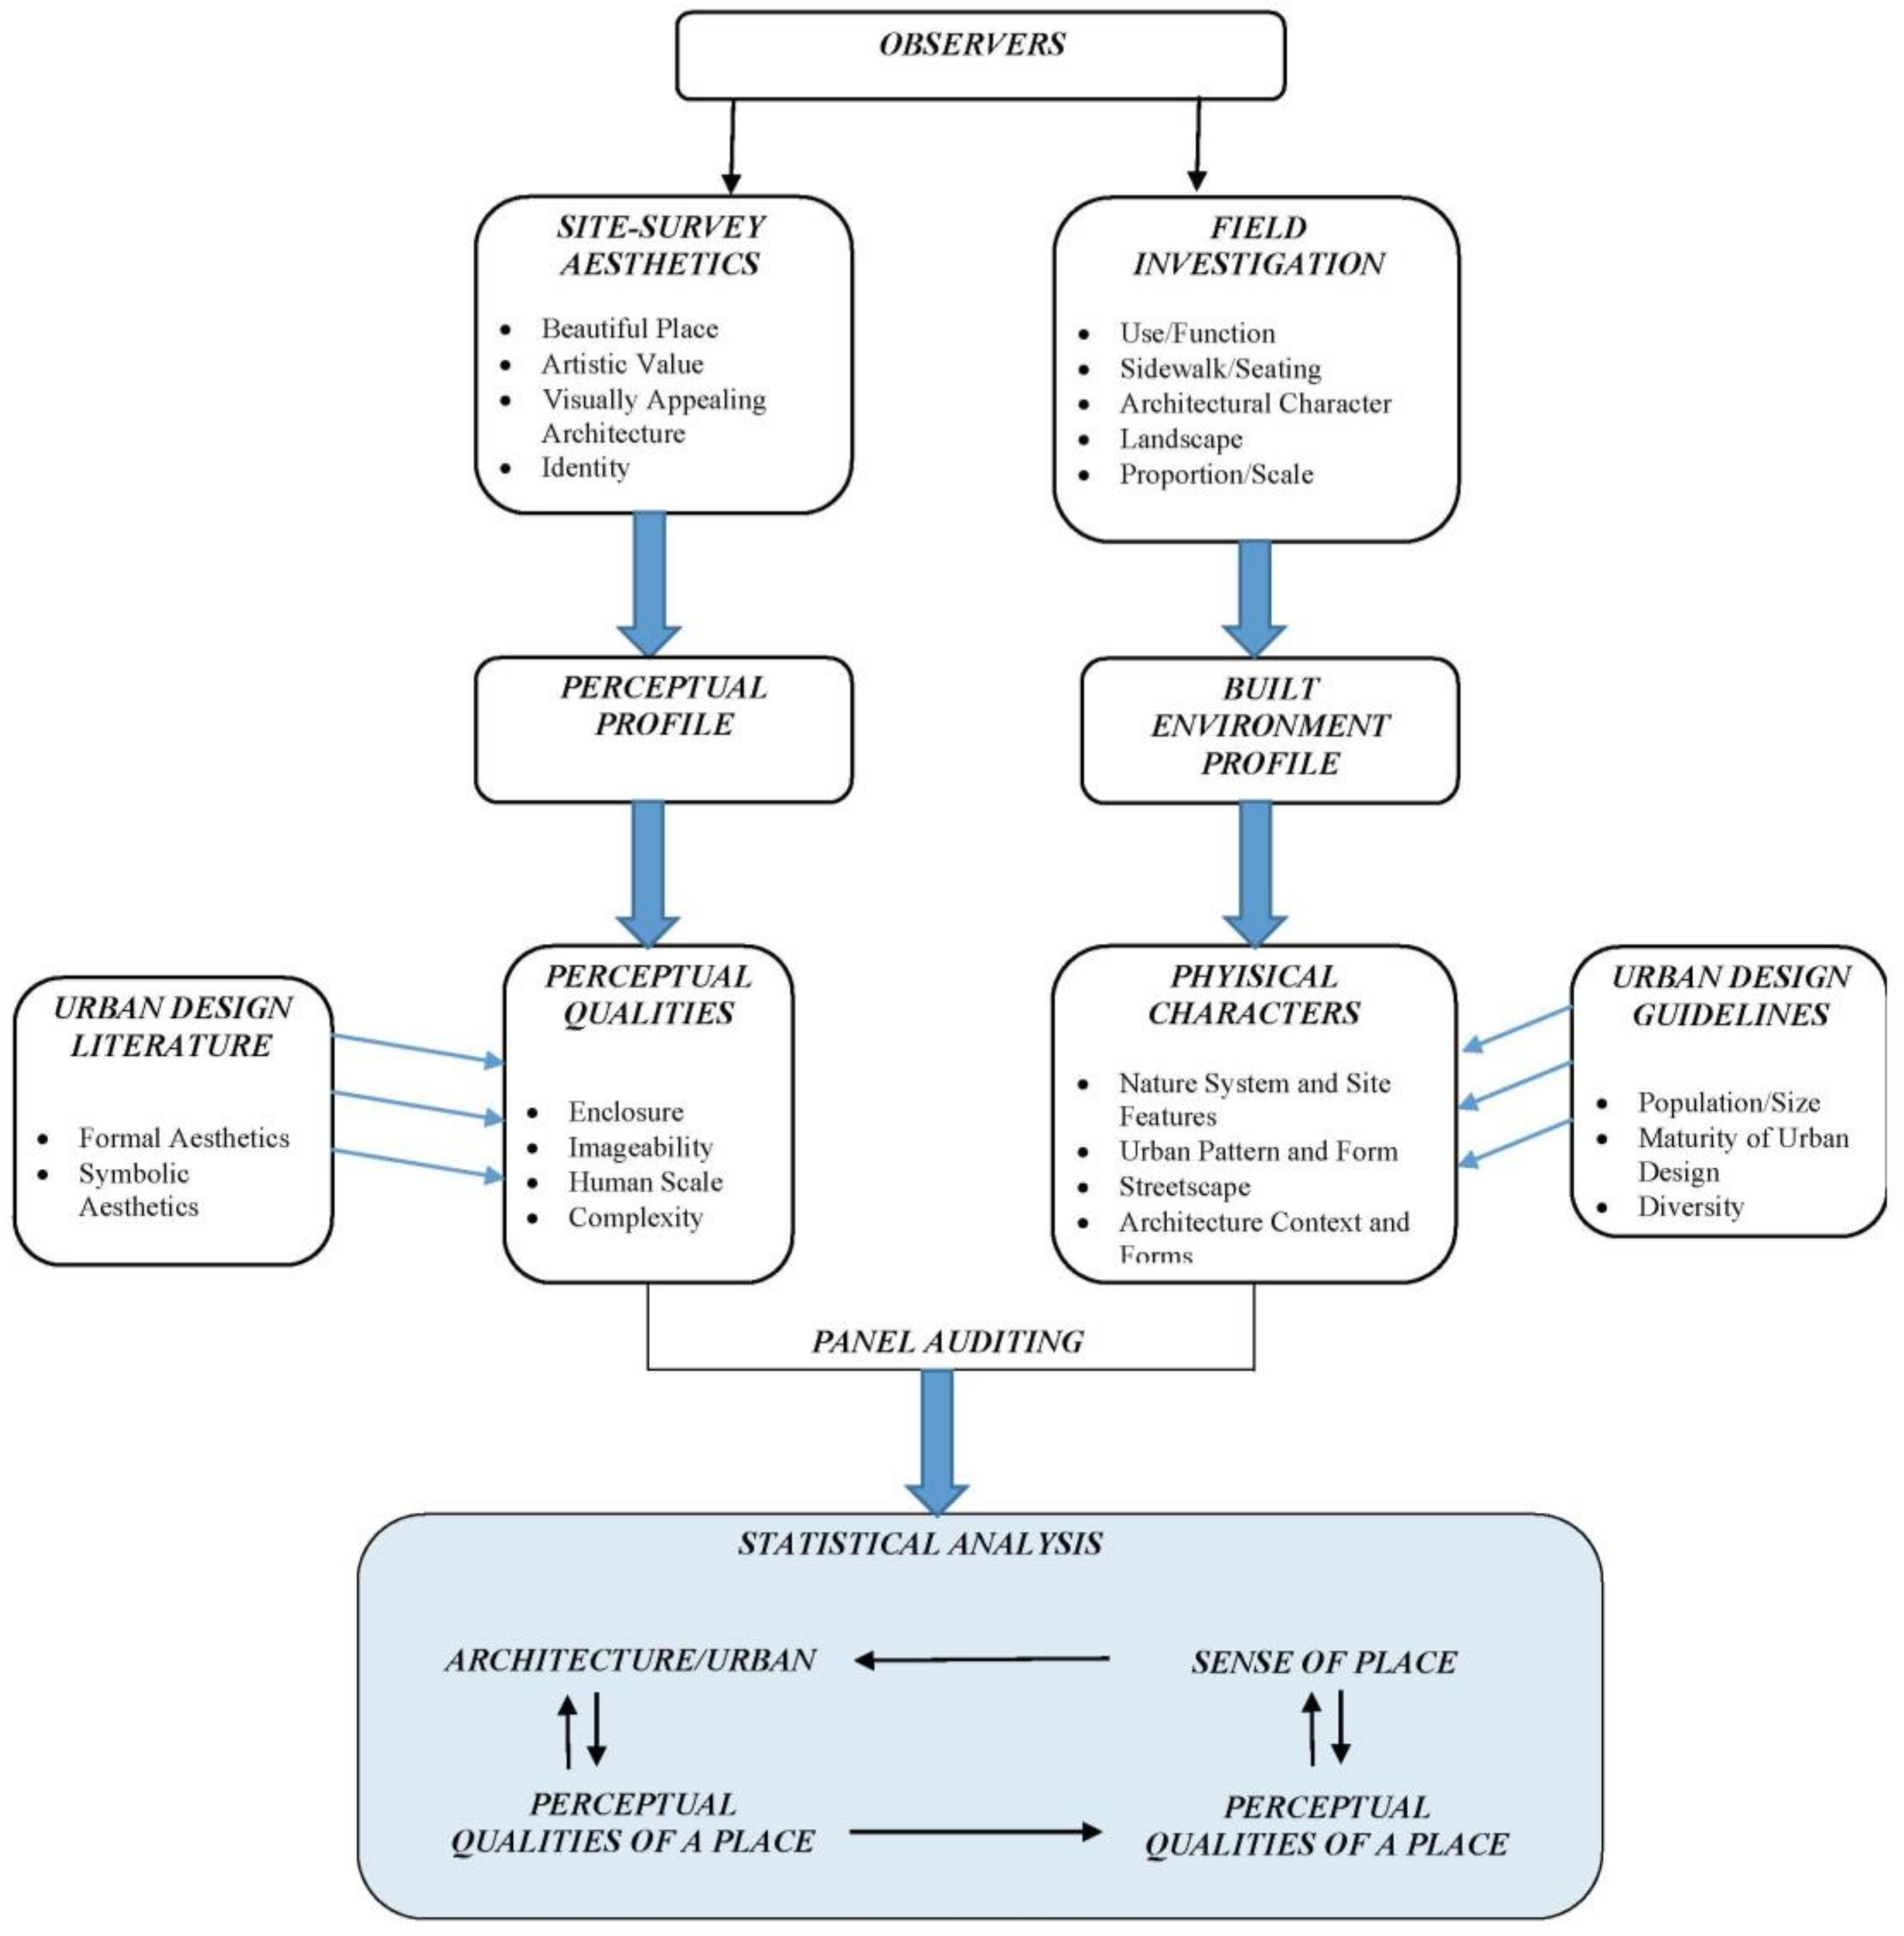
The proposed framework/experiment is composed of three steps: an on-site survey, field investigation, and panel auditing (refer to Figure 1). A total of 283 responses were collected across three sites from an on-site survey, and the respondents were local residents that were randomly picked. The survey results were analyzed to create a perceptual profile of the residents from the three different sites, and the profiles were used as a base, together with urban design literature review results, in order to extract the quantifiable perceptual qualities of a place: imageability, visual enclosure, human scale, and complexity. Meanwhile, field investigations were conducted on three sites to create built environment profiles to be used in the panel auditing. The built environment profiles were based on architecture/urban design characteristics described in 2.0 (refer to Figure 2 for sample profile sheets). Four physical characteristics defined the profile: the nature system and site feature, urban pattern and form, architecture context and form, and streetscape (refer to Table 1). In the last step, a total of twelve panelists were selected from the on-site survey takers (refer to 3.4 for a detailed explanation) to participate in the auditing. Their responses were used to map the empirical relationship between two things: the relation between architecture/urban design and the perceptual qualities of a place, and the relation between those perceptual qualities of a place and people’s SOP. For the perceptual qualities of place, based on the literature review, this research has chosen to examine the four categories in Ewing’s study that are most closely related to current urban design: imageability, visual enclosure, human scale, and complexity [30]. Figure 1 illustrates the proposed frame:
3.1. Site Selection
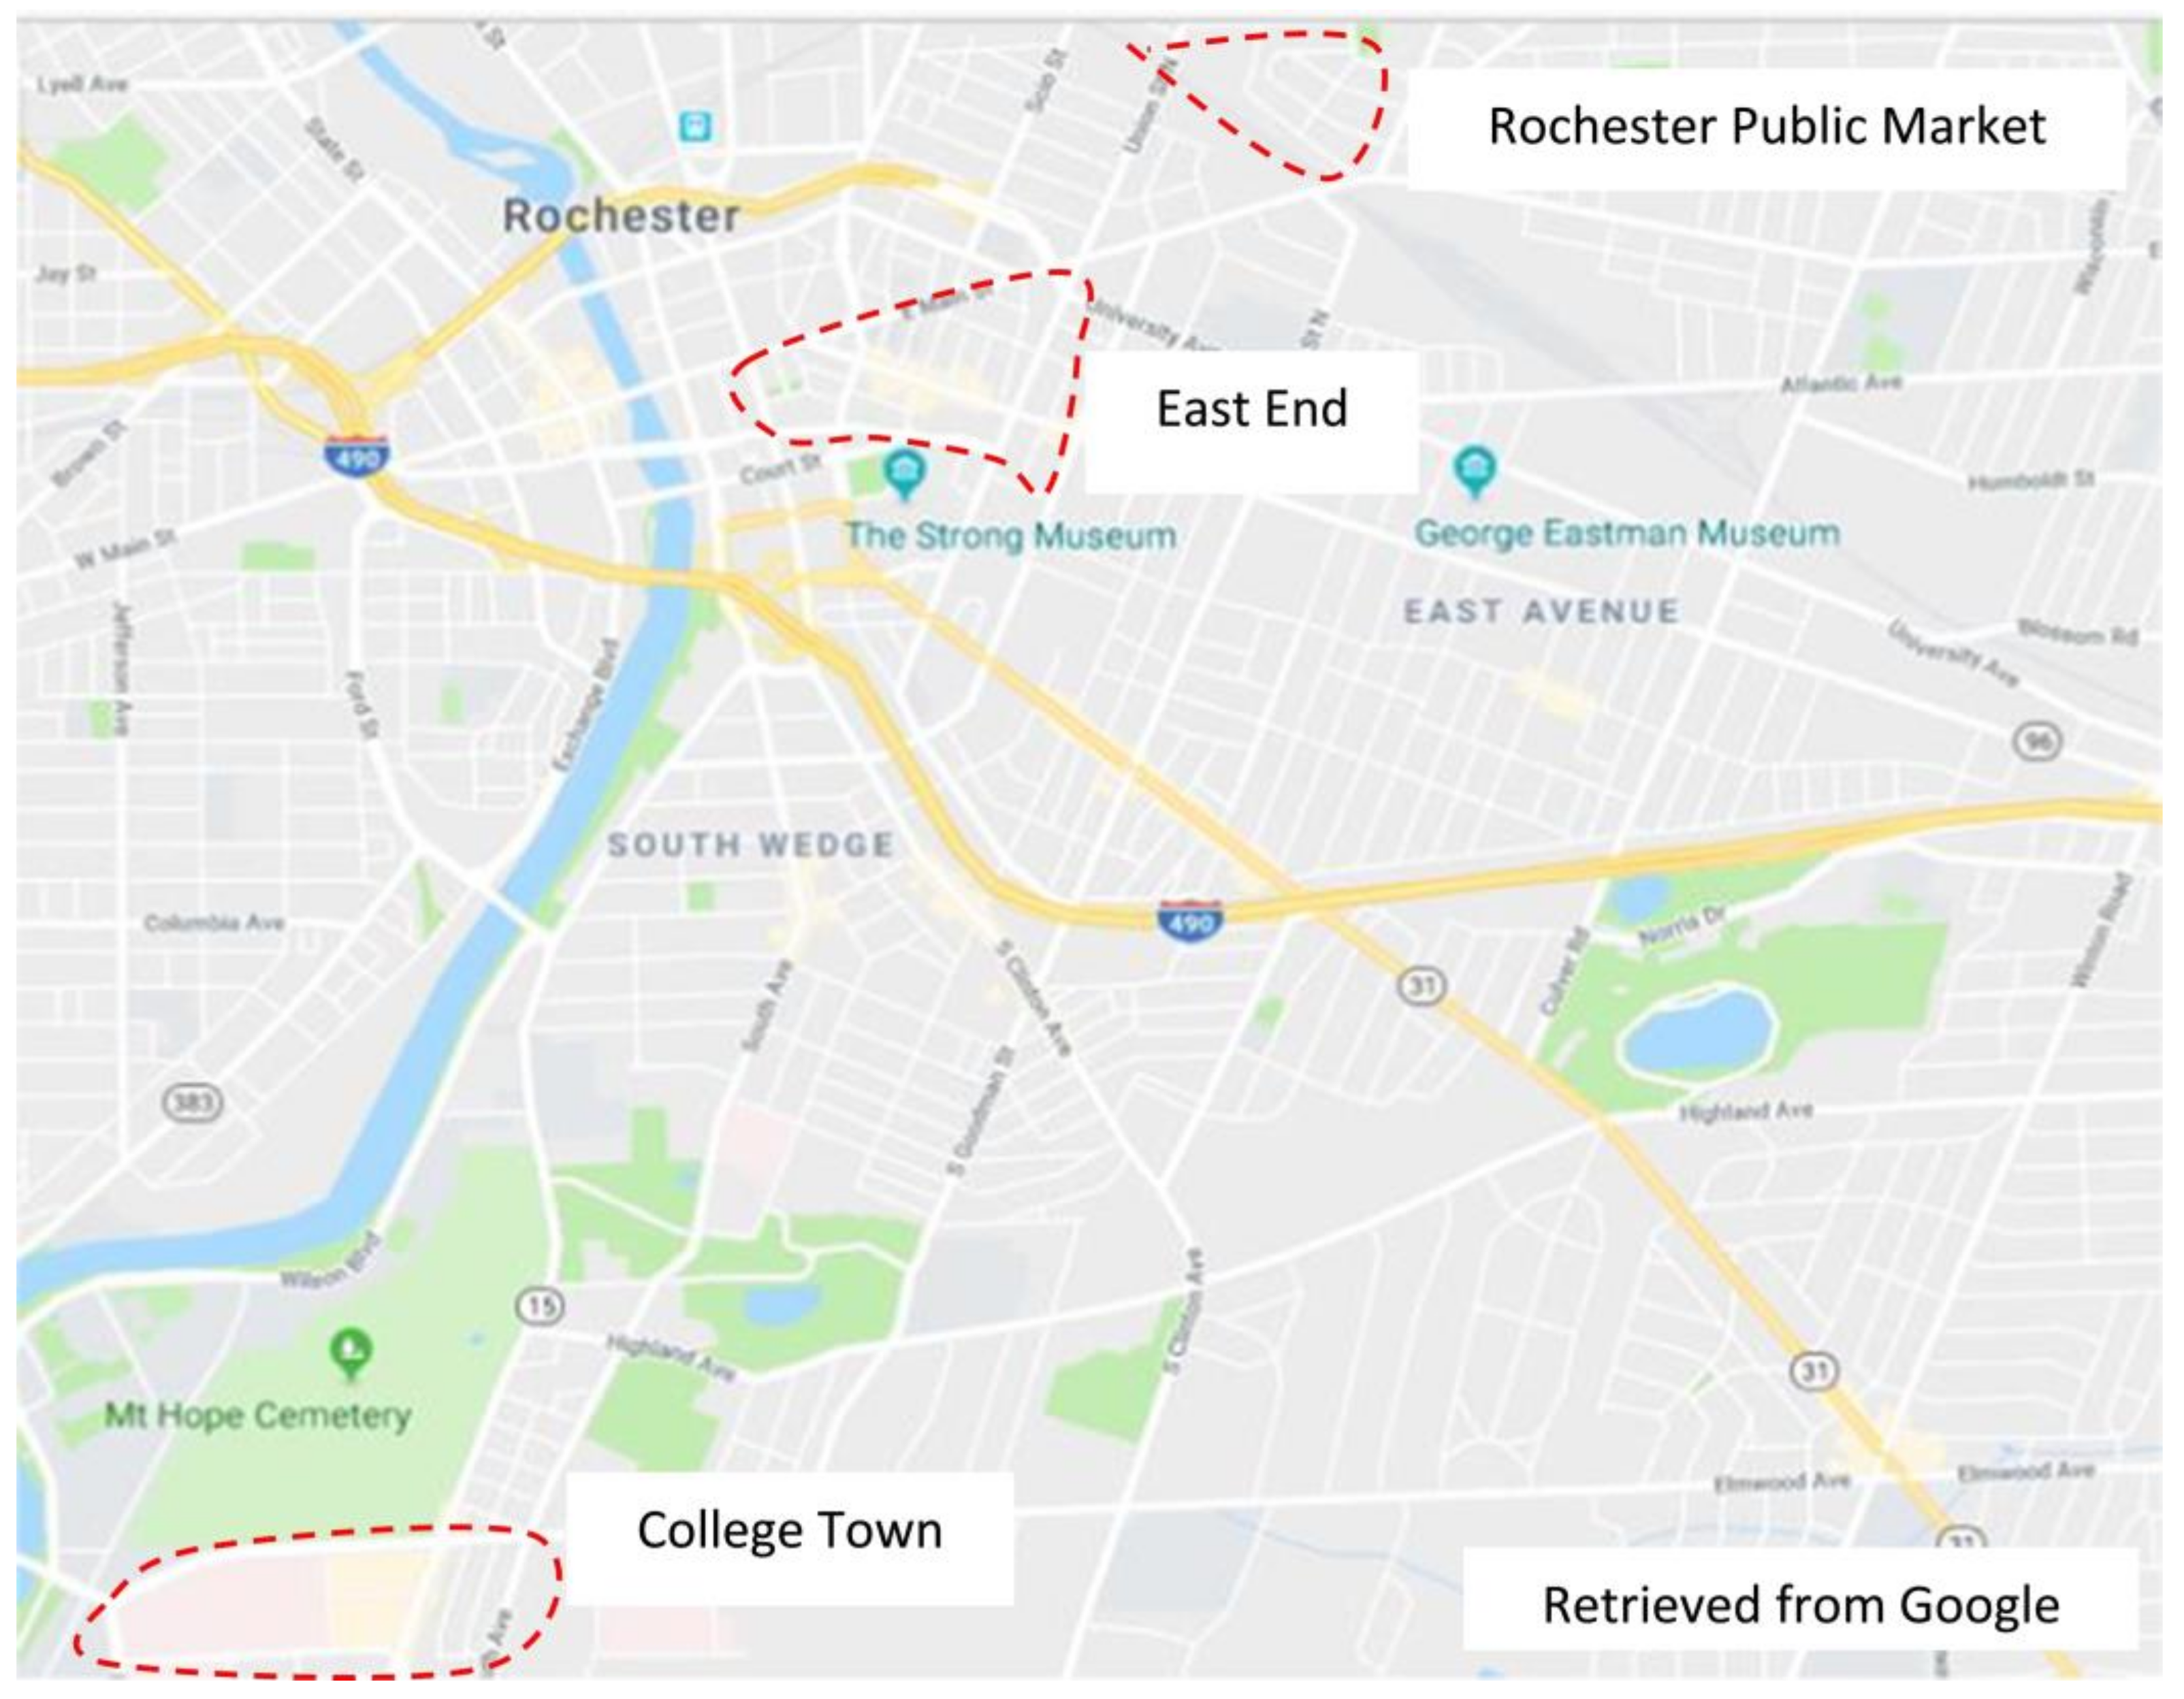
For this study, we select three neighborhoods in Rochester, NY that serve as our three study sites that varied in their design elements. We based our selection on the architectural relevance to Rochester and high daily visitor rates. All three sites were mixed-use developments where there is a blend of residential and commercial. Even in the case of Rochester Public Market (RPM), which is located in the residential neighborhood of Marketview Heights, RPM is blend of the market space and commercial space for restaurants. The chosen neighborhoods were East End (EE), College Town (CT), and Rochester Public Market (RPM), and are described as follows:
Public Market: Rochester Public Market (PRM) offers fresh produce, ethnic delicacies, specialty items, general merchandise, and other goods and services. An array of independent local businesses—including cafés, food stands, coffee shops, florists, specialty food purveyors, and breweries—can be found on market grounds and in the surrounding Market District. Rochester Public Market is located at 280 N. Union Street. It is open on Tuesday, Thursday, and Saturday, 52 weeks a year.
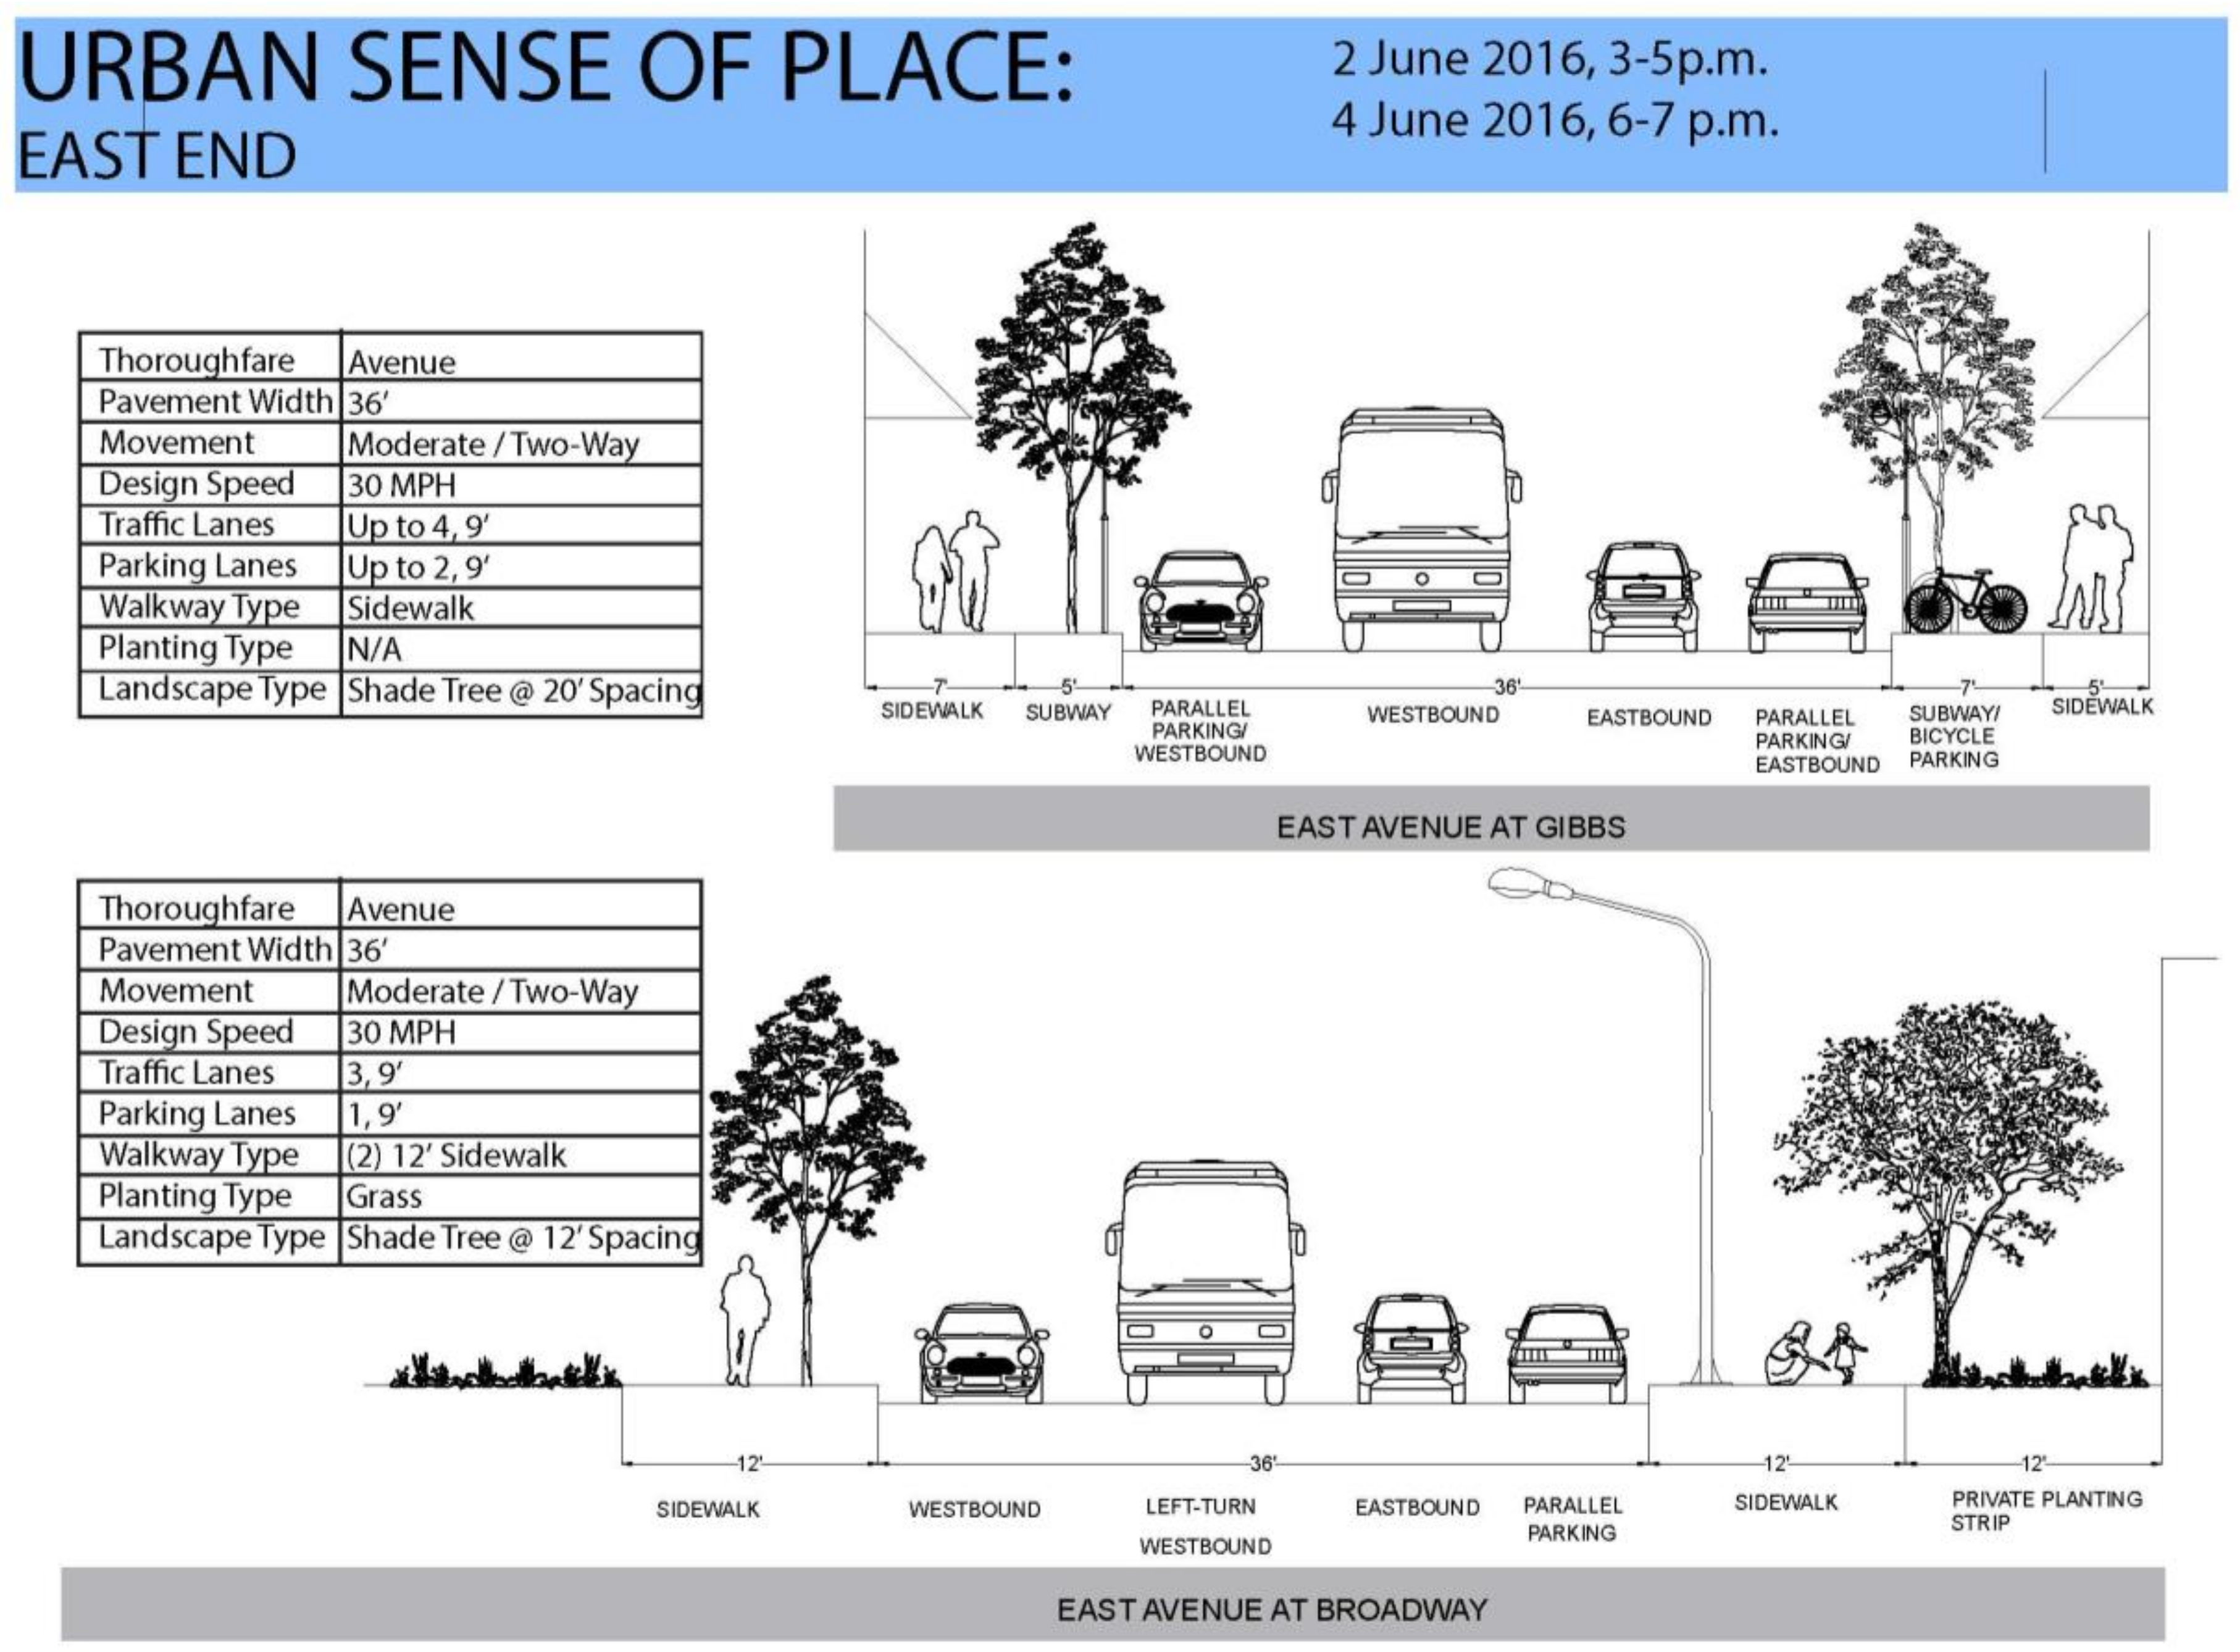
The East End (EE) is a neighborhood in downtown Rochester. It is the area between East Avenue, Alexander Street, and Main Street. It is characterized by vibrant night life and cultural attractions. The initial plan was to survey people in and around Temple Bar and Grille, which is located conveniently in the heart of the East End neighborhood, but due to the weather conditions at winter and early spring of the year, all of the interviews were conducted inside.
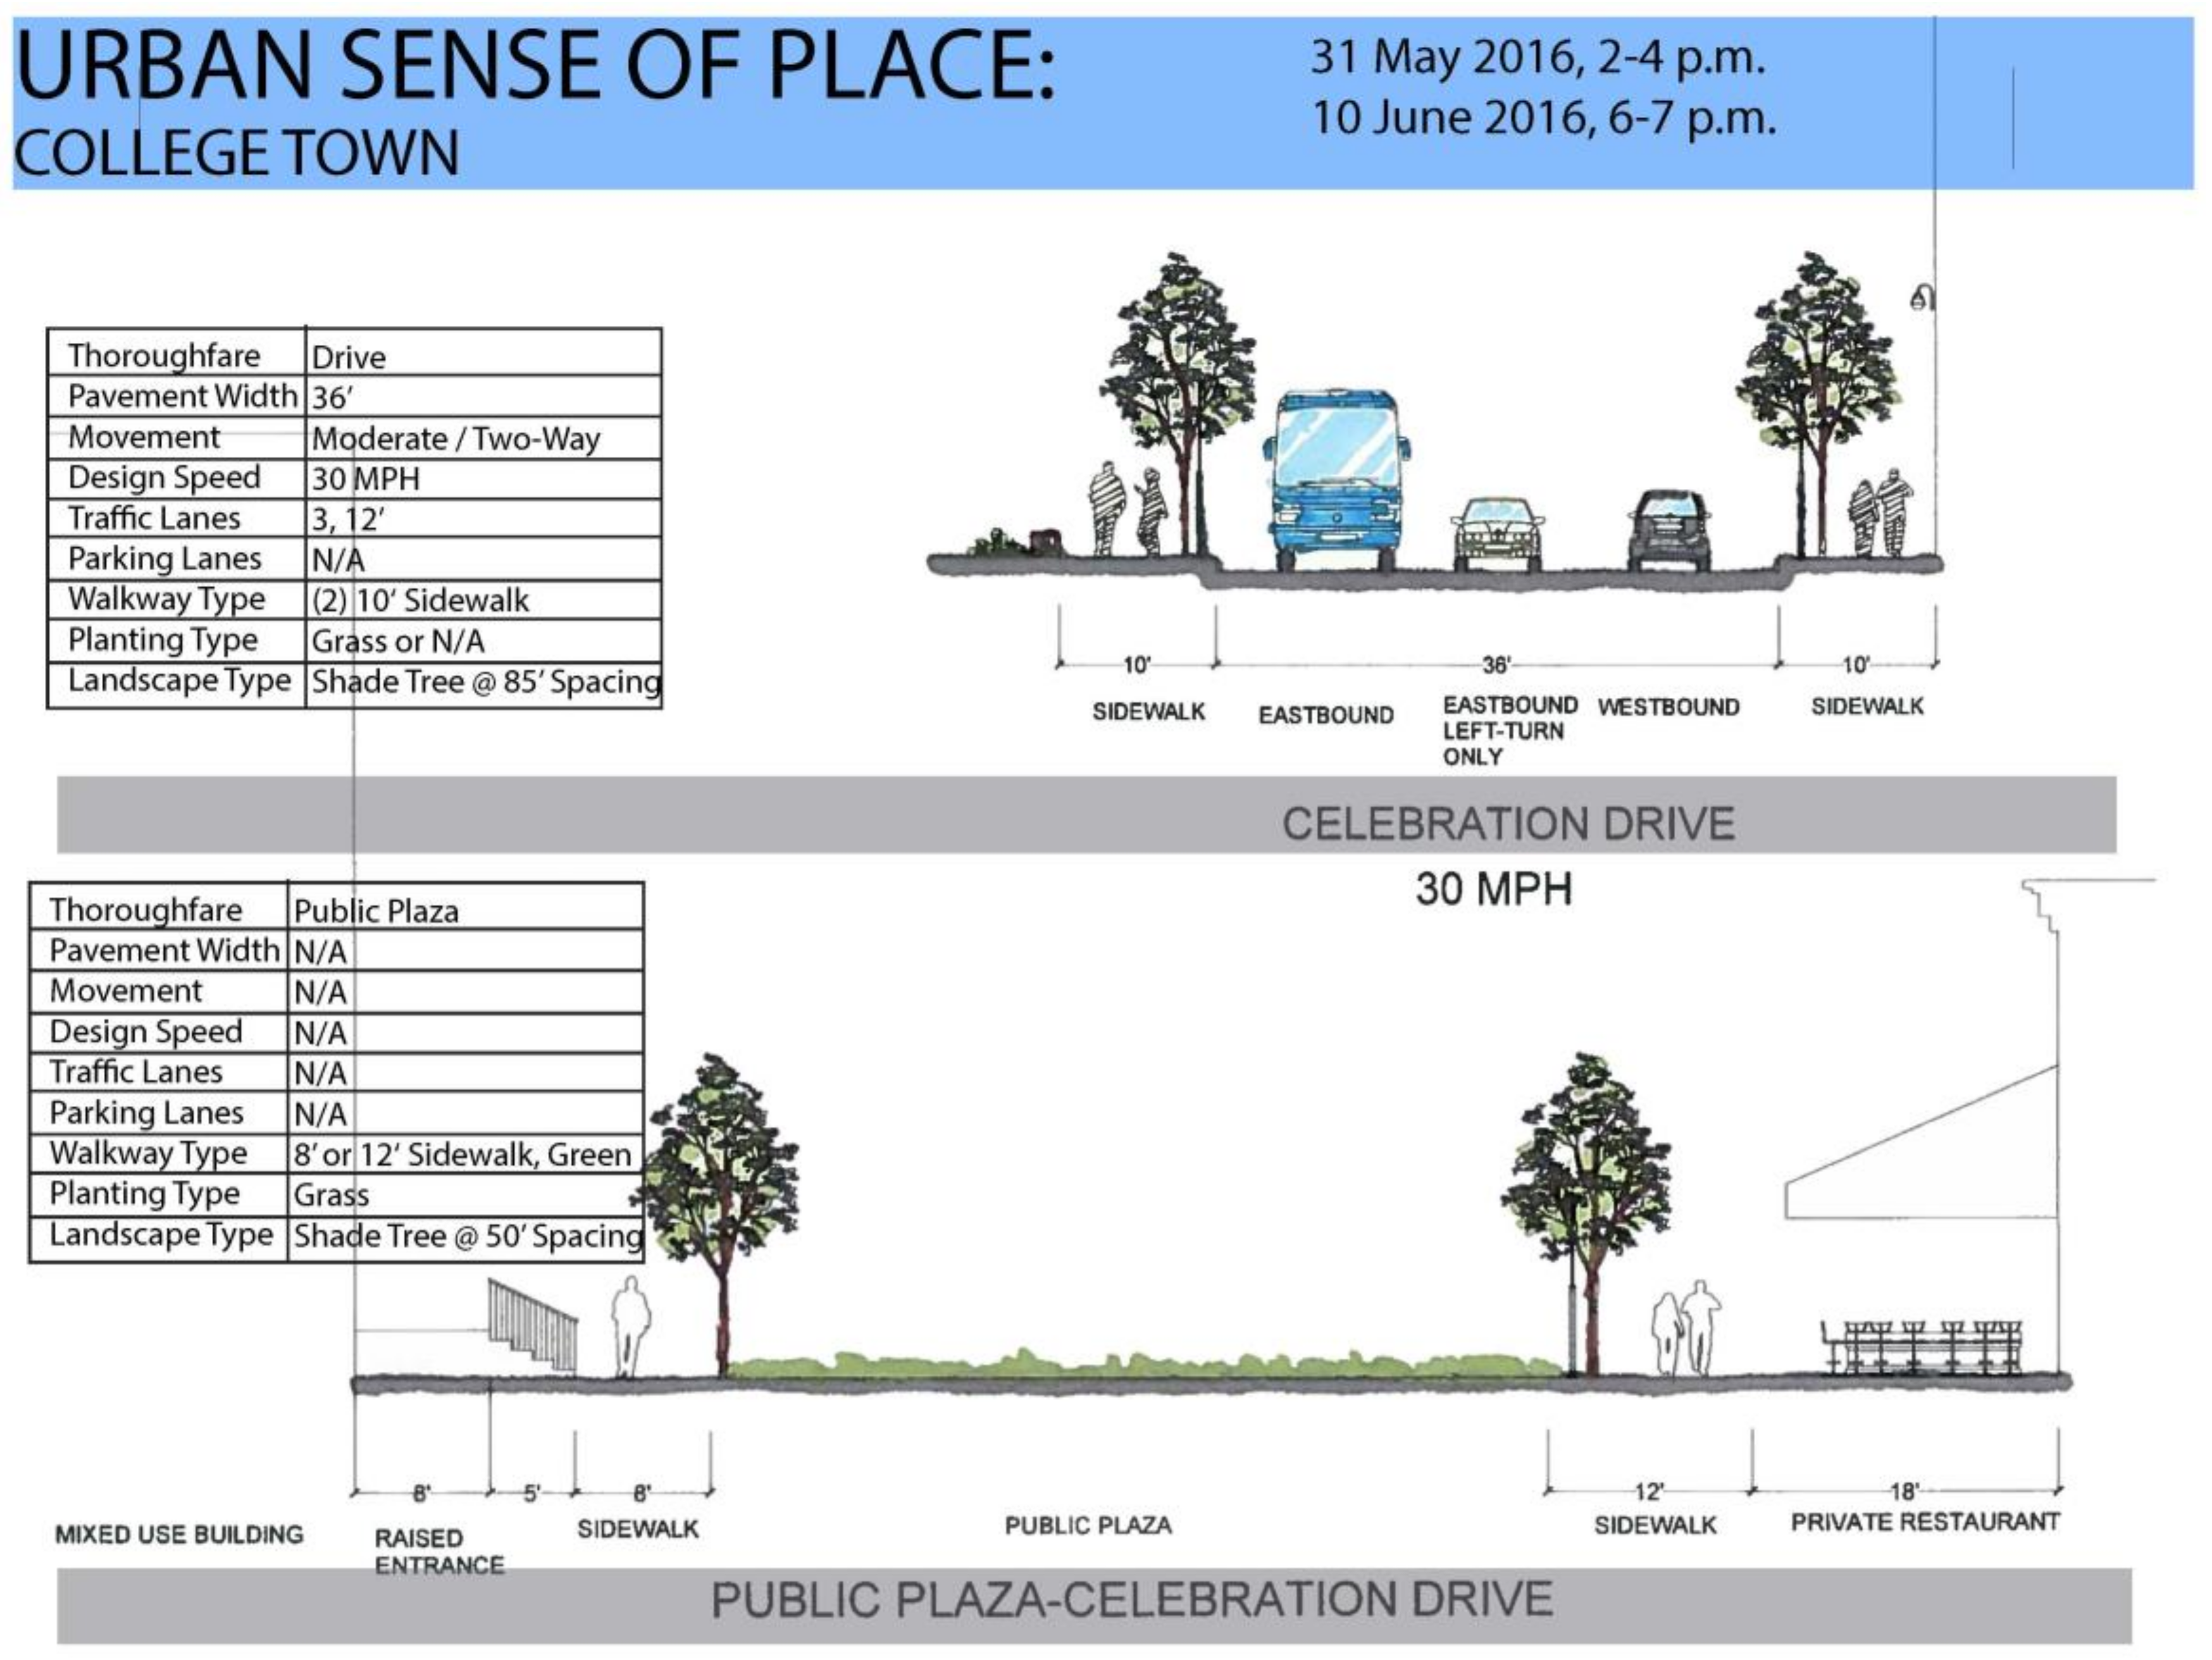
College Town (CT) is a mixed-use development/sub-neighborhood in Upper Mount Hope. It is characterized by shopping, dining, working, hospitality, and upscale living within an engaging 24/7 environment. The location mostly attracts college students from the University of Rochester, followed by the general public.
3.2. Field Investigation
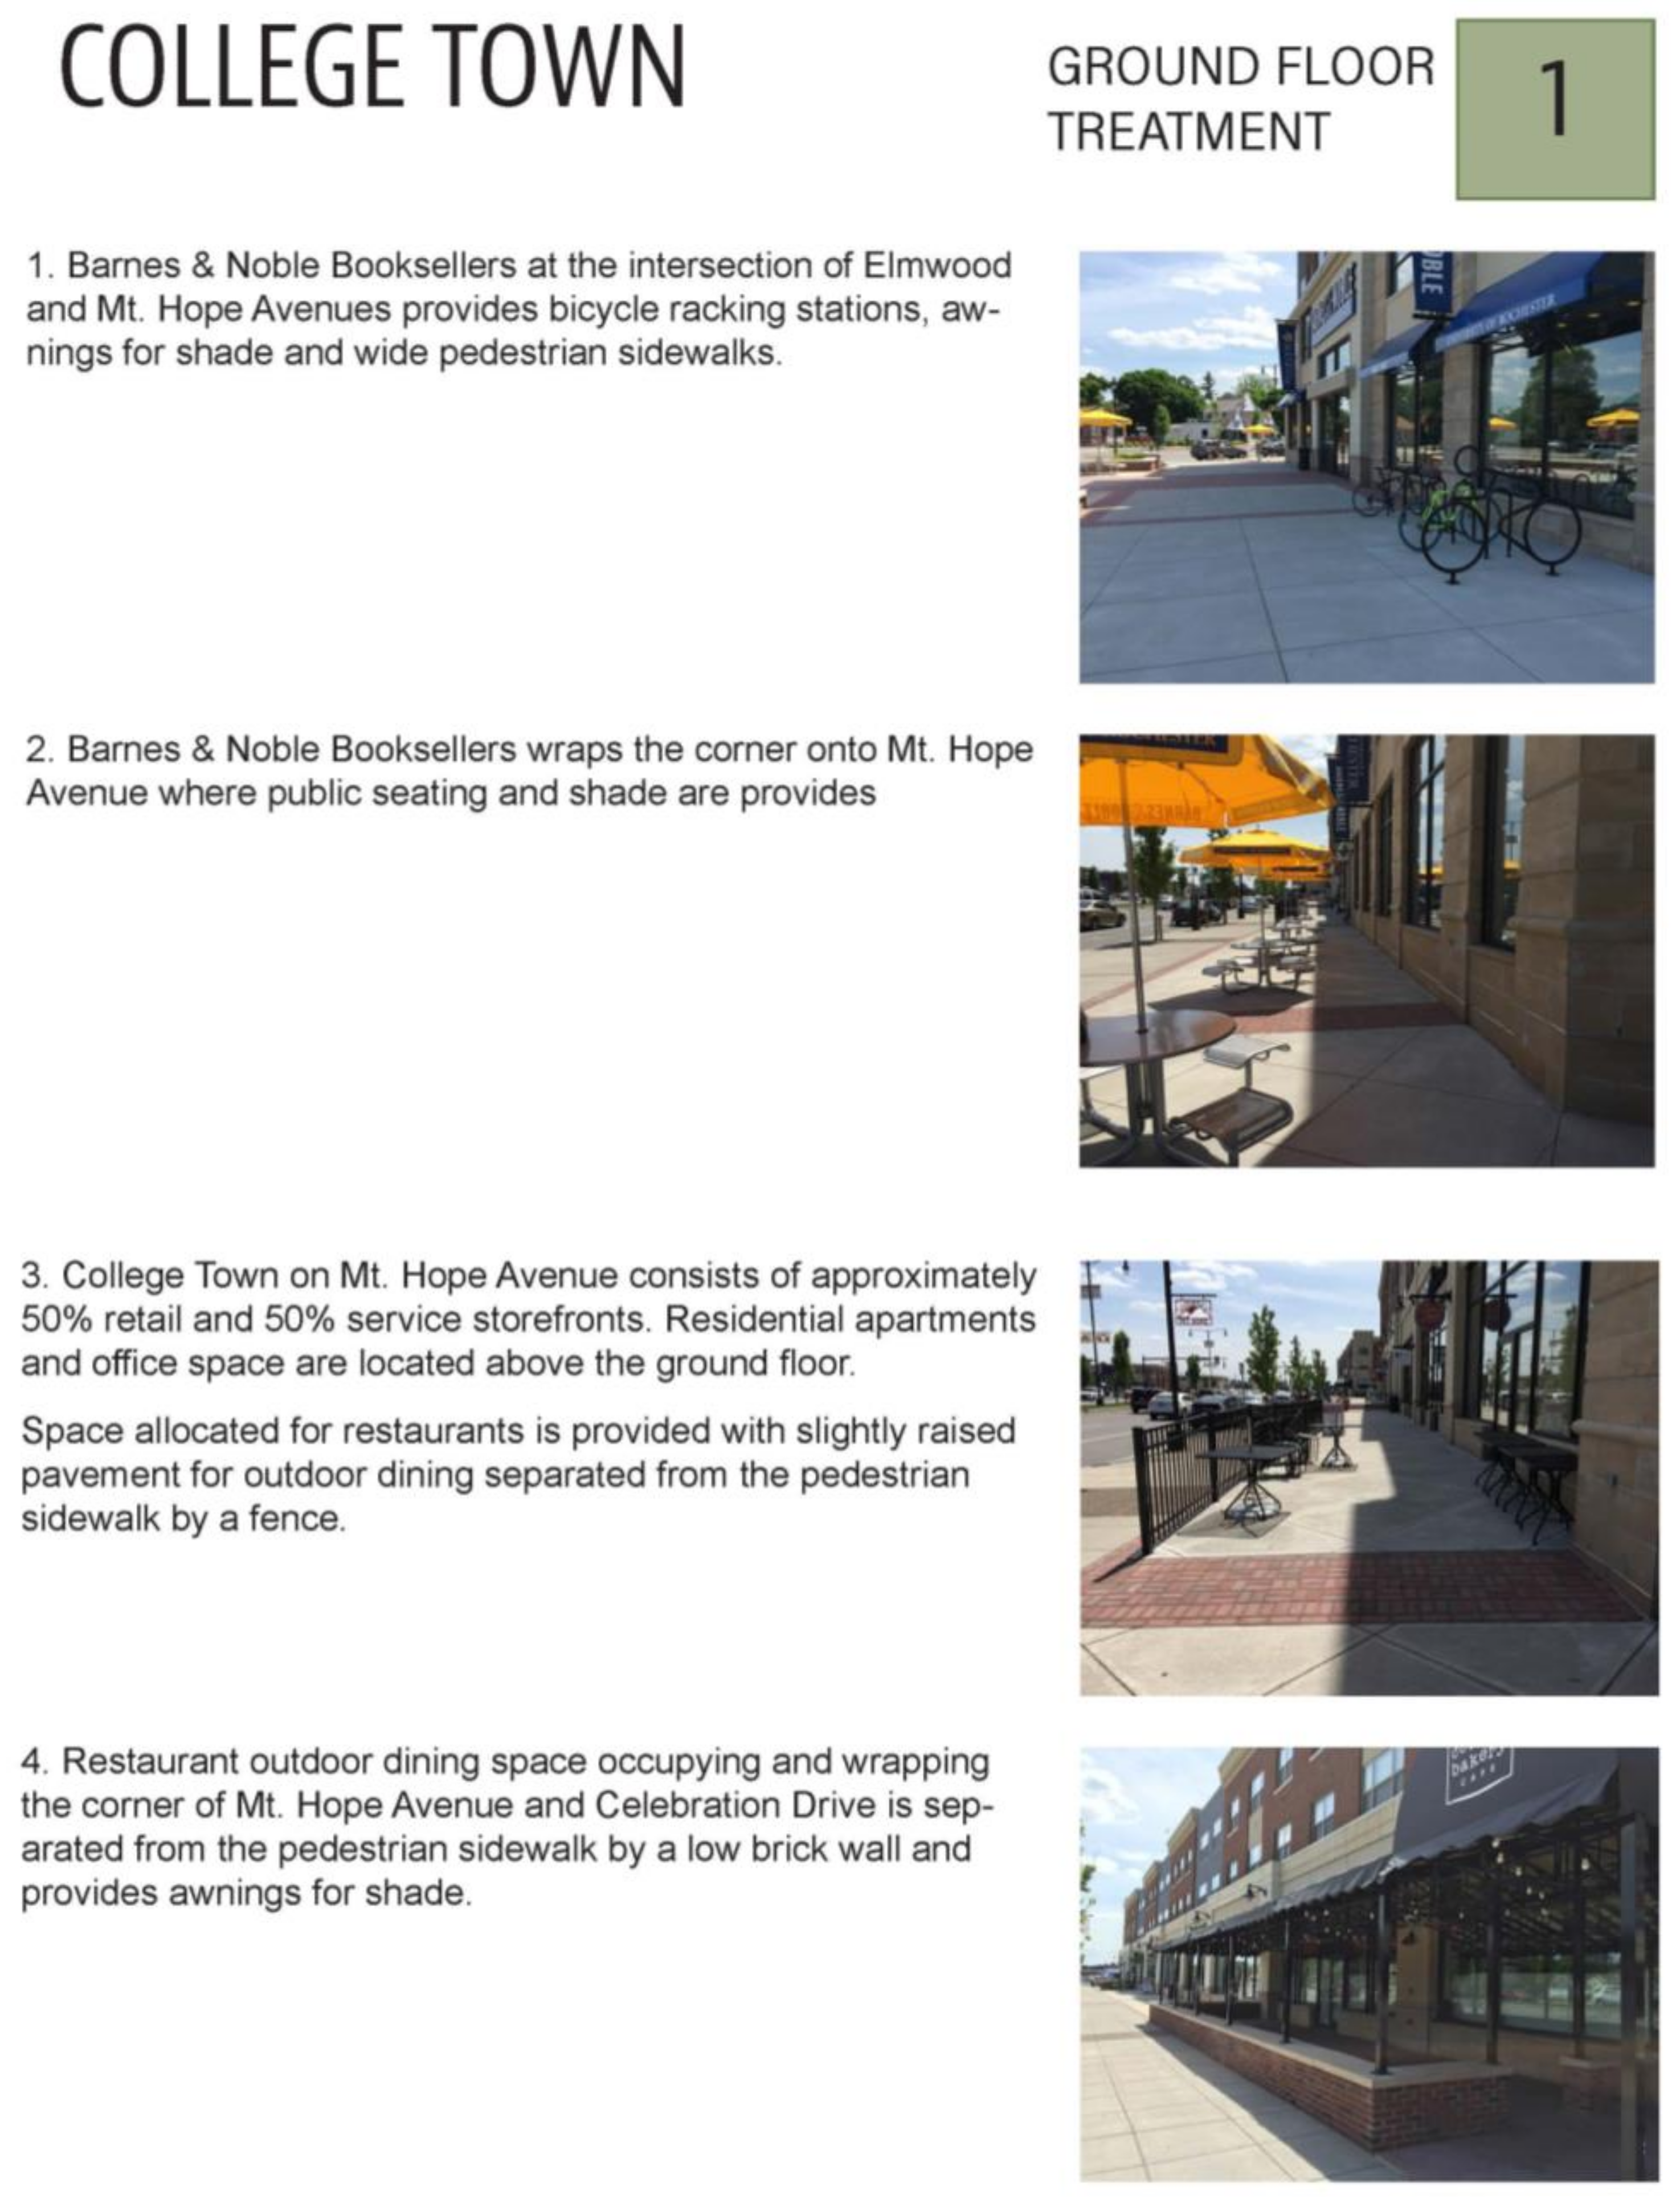
The field investigation was conducted to evaluate the space and physical forms against compliance with current urban design guidelines; reports were then compiled for panel auditing. For the physical environment, the researcher extracted the four most common categories being implemented, which were based on a variety of design guidelines: natural system and site features, urban pattern and form, streetscape, and architectural character. The field investigation team was composed of three architecture graduate students, one engineer graduate students and two architecture faculty. A checklist was then created to guide the field investigation. The research team conducted site investigations twice for each site. For each site, the team produced a minimum of three street sections, a building typology map, and a picture map illustrating the different street façade heights, architecture language, urban form, urban patterns, colors, materials, and ratio between streets and street walls, etc. The team also documented the different types of open space and adjacent buildings height and design. The team then compiled this information into maps and created the pictorial environmental profile sheets, as illustrated below (refer to Figure 3 for a built-environment profile sheet). In the built-environment profile sheet, the four major physical characteristics are described with text and photos. In Figure 3, Items 1, 2, and 3 focus on “nature system and site features” and “streetscape”. The figure documents the special site features—such as shading, bicycle-racking stations, outdoor dining areas—that constitute the streetscape and site features. Items 3 and 4 document “architecture context and form”—for example, the retail and service storefront ratio and building functions (residential, retail). Later, these built-environment profile sheets were shown to panelists who scored the perceptual qualities of the place based on the physical characteristics.
3.2.1. Urban form and Pattern
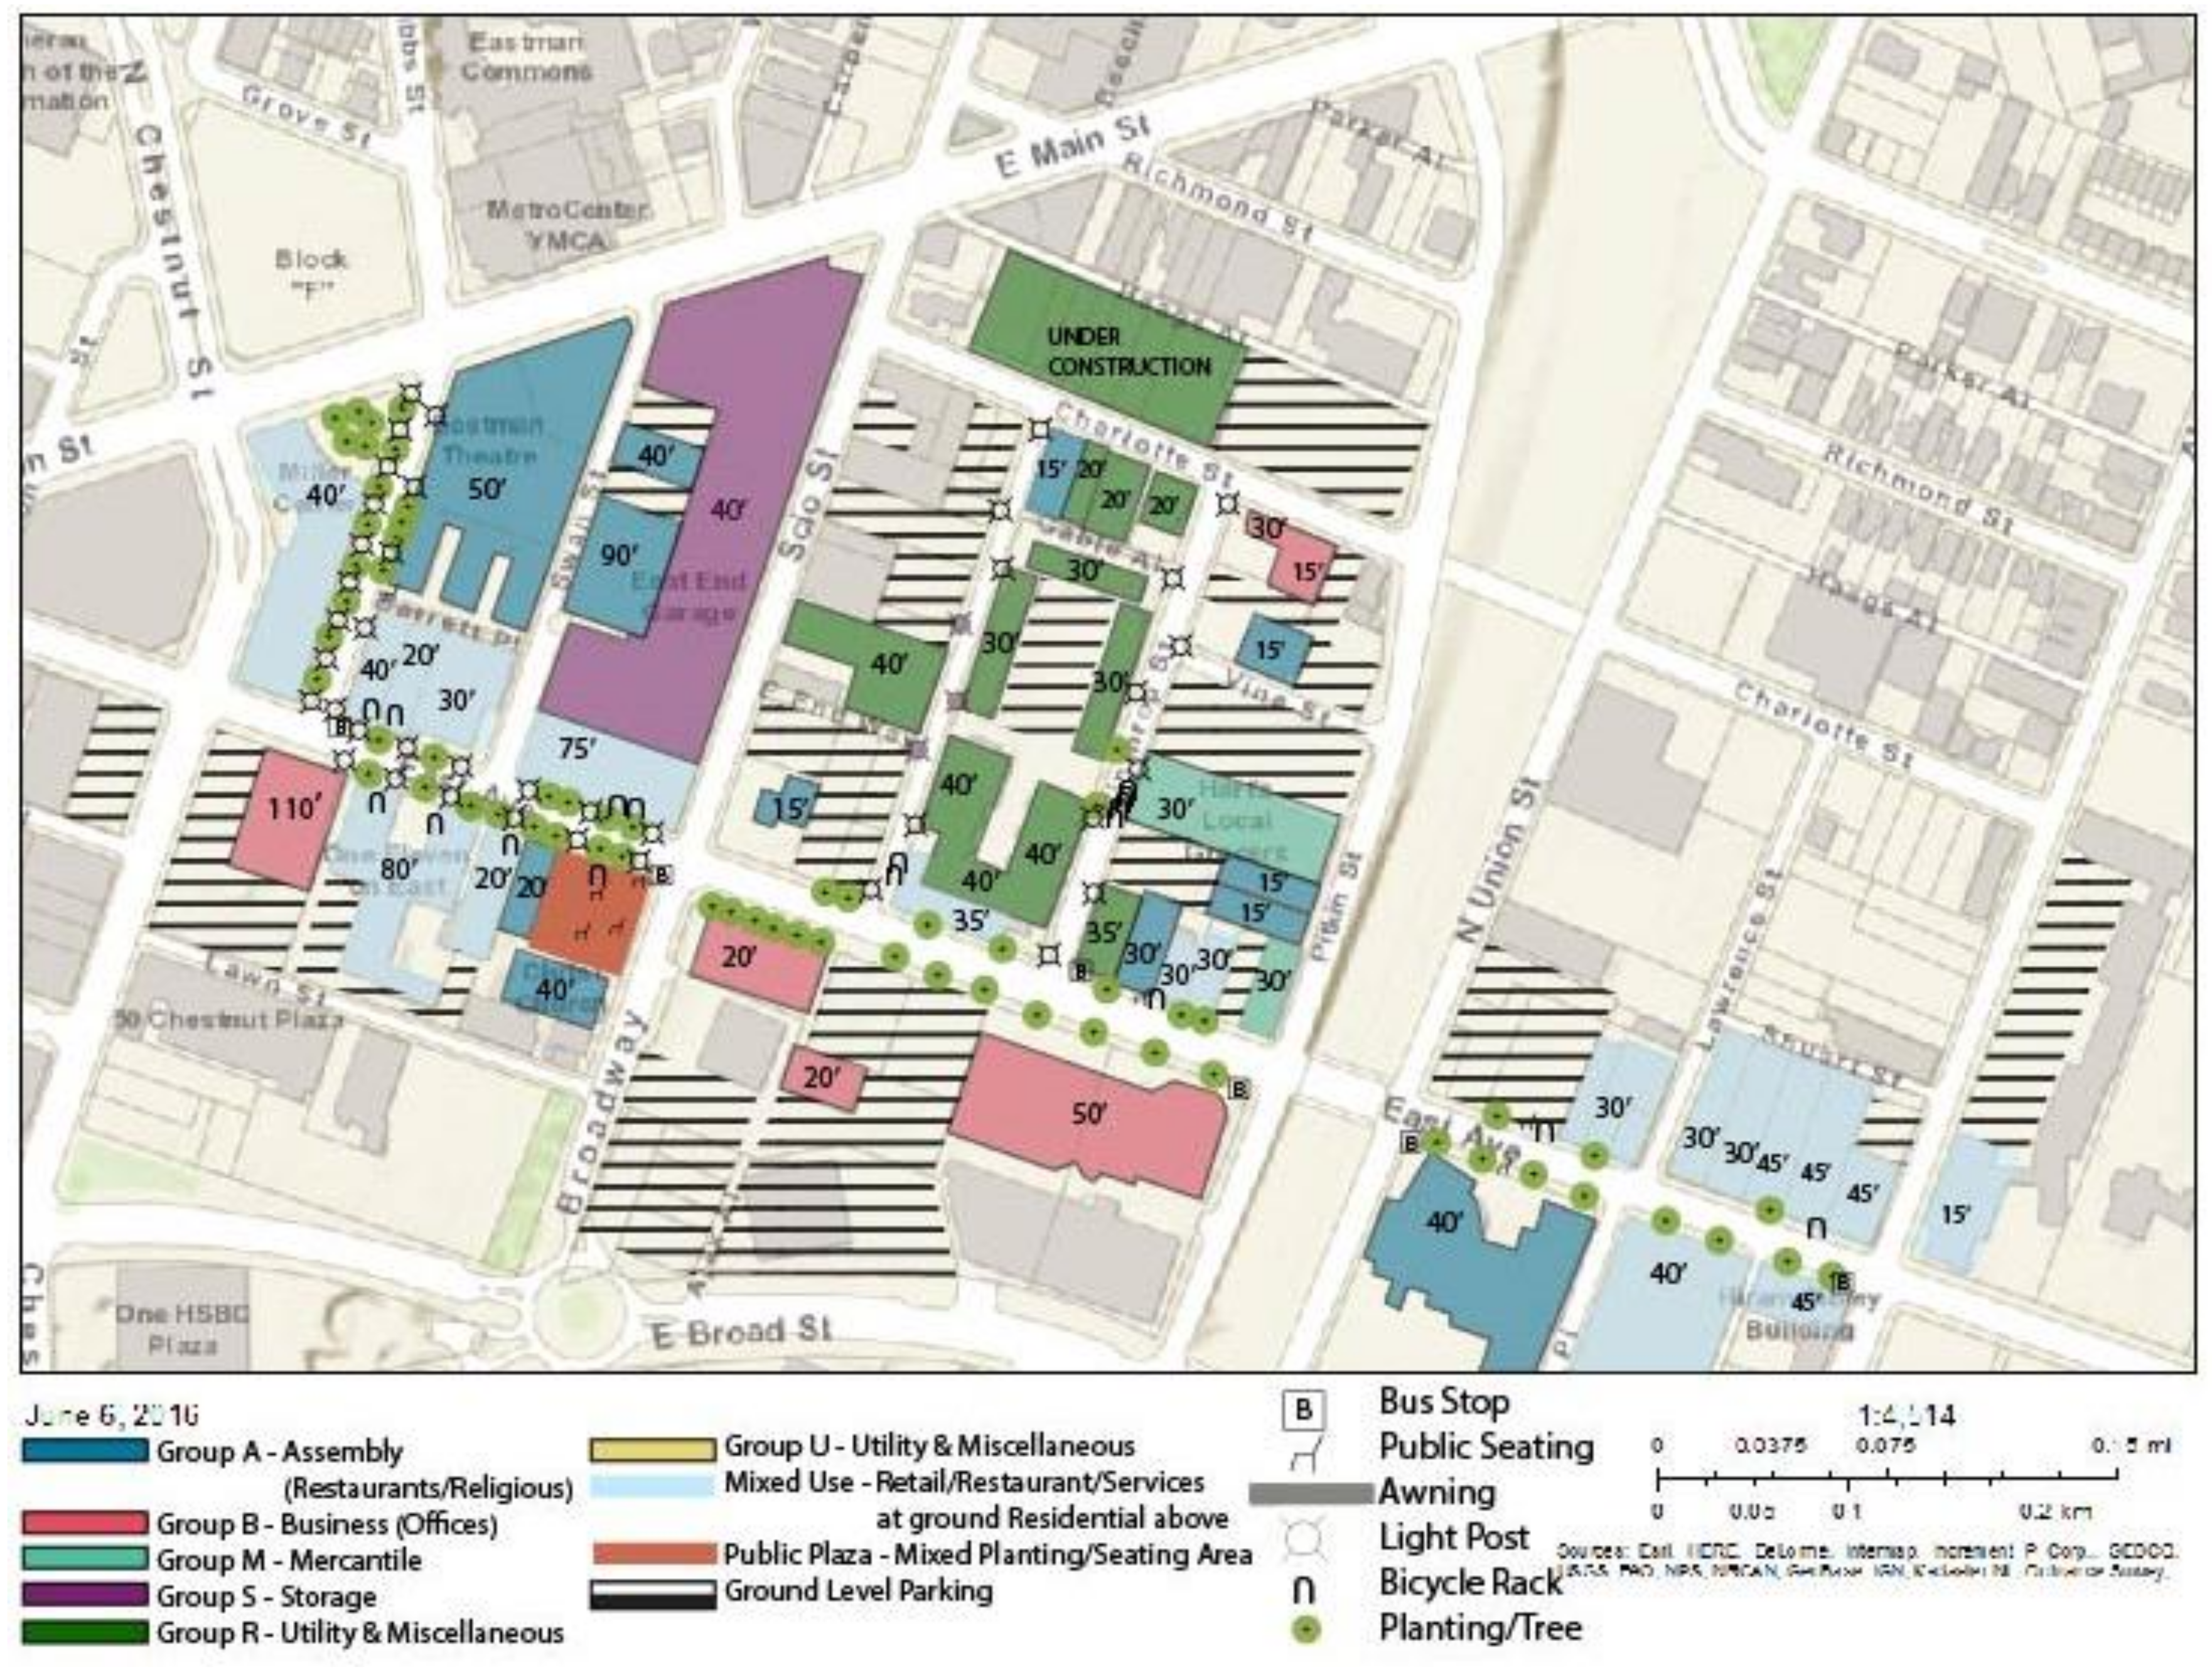
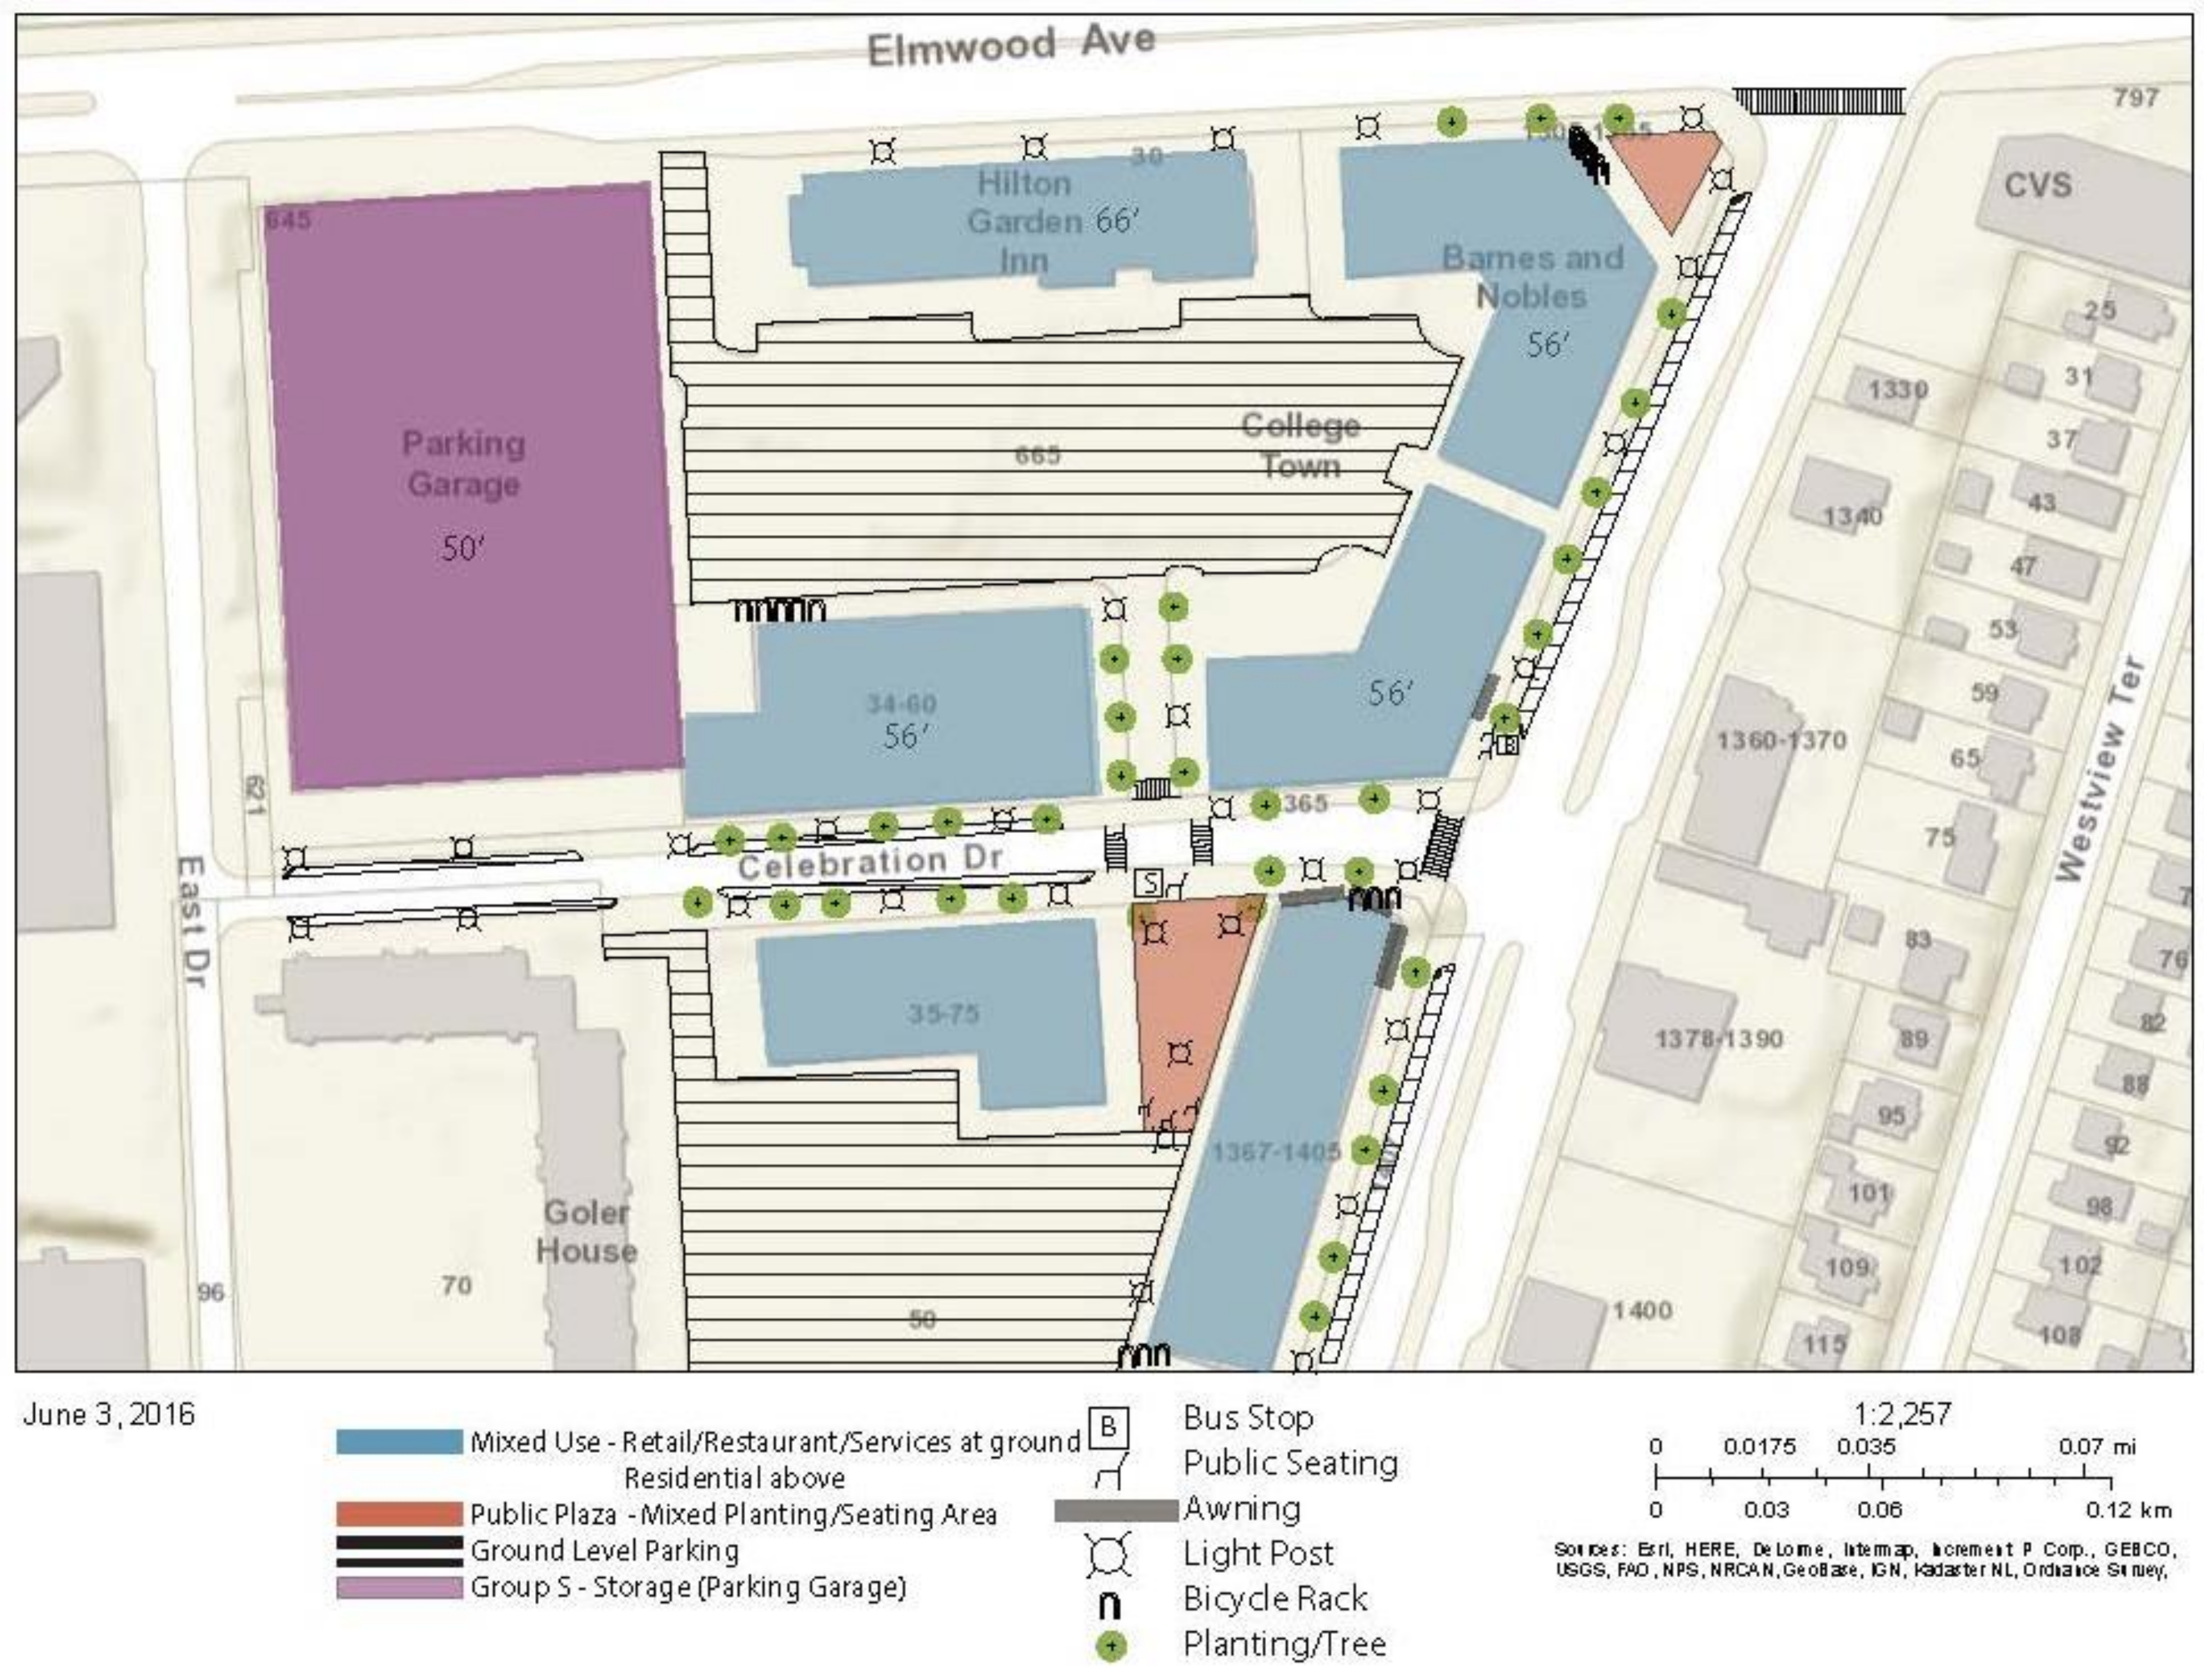
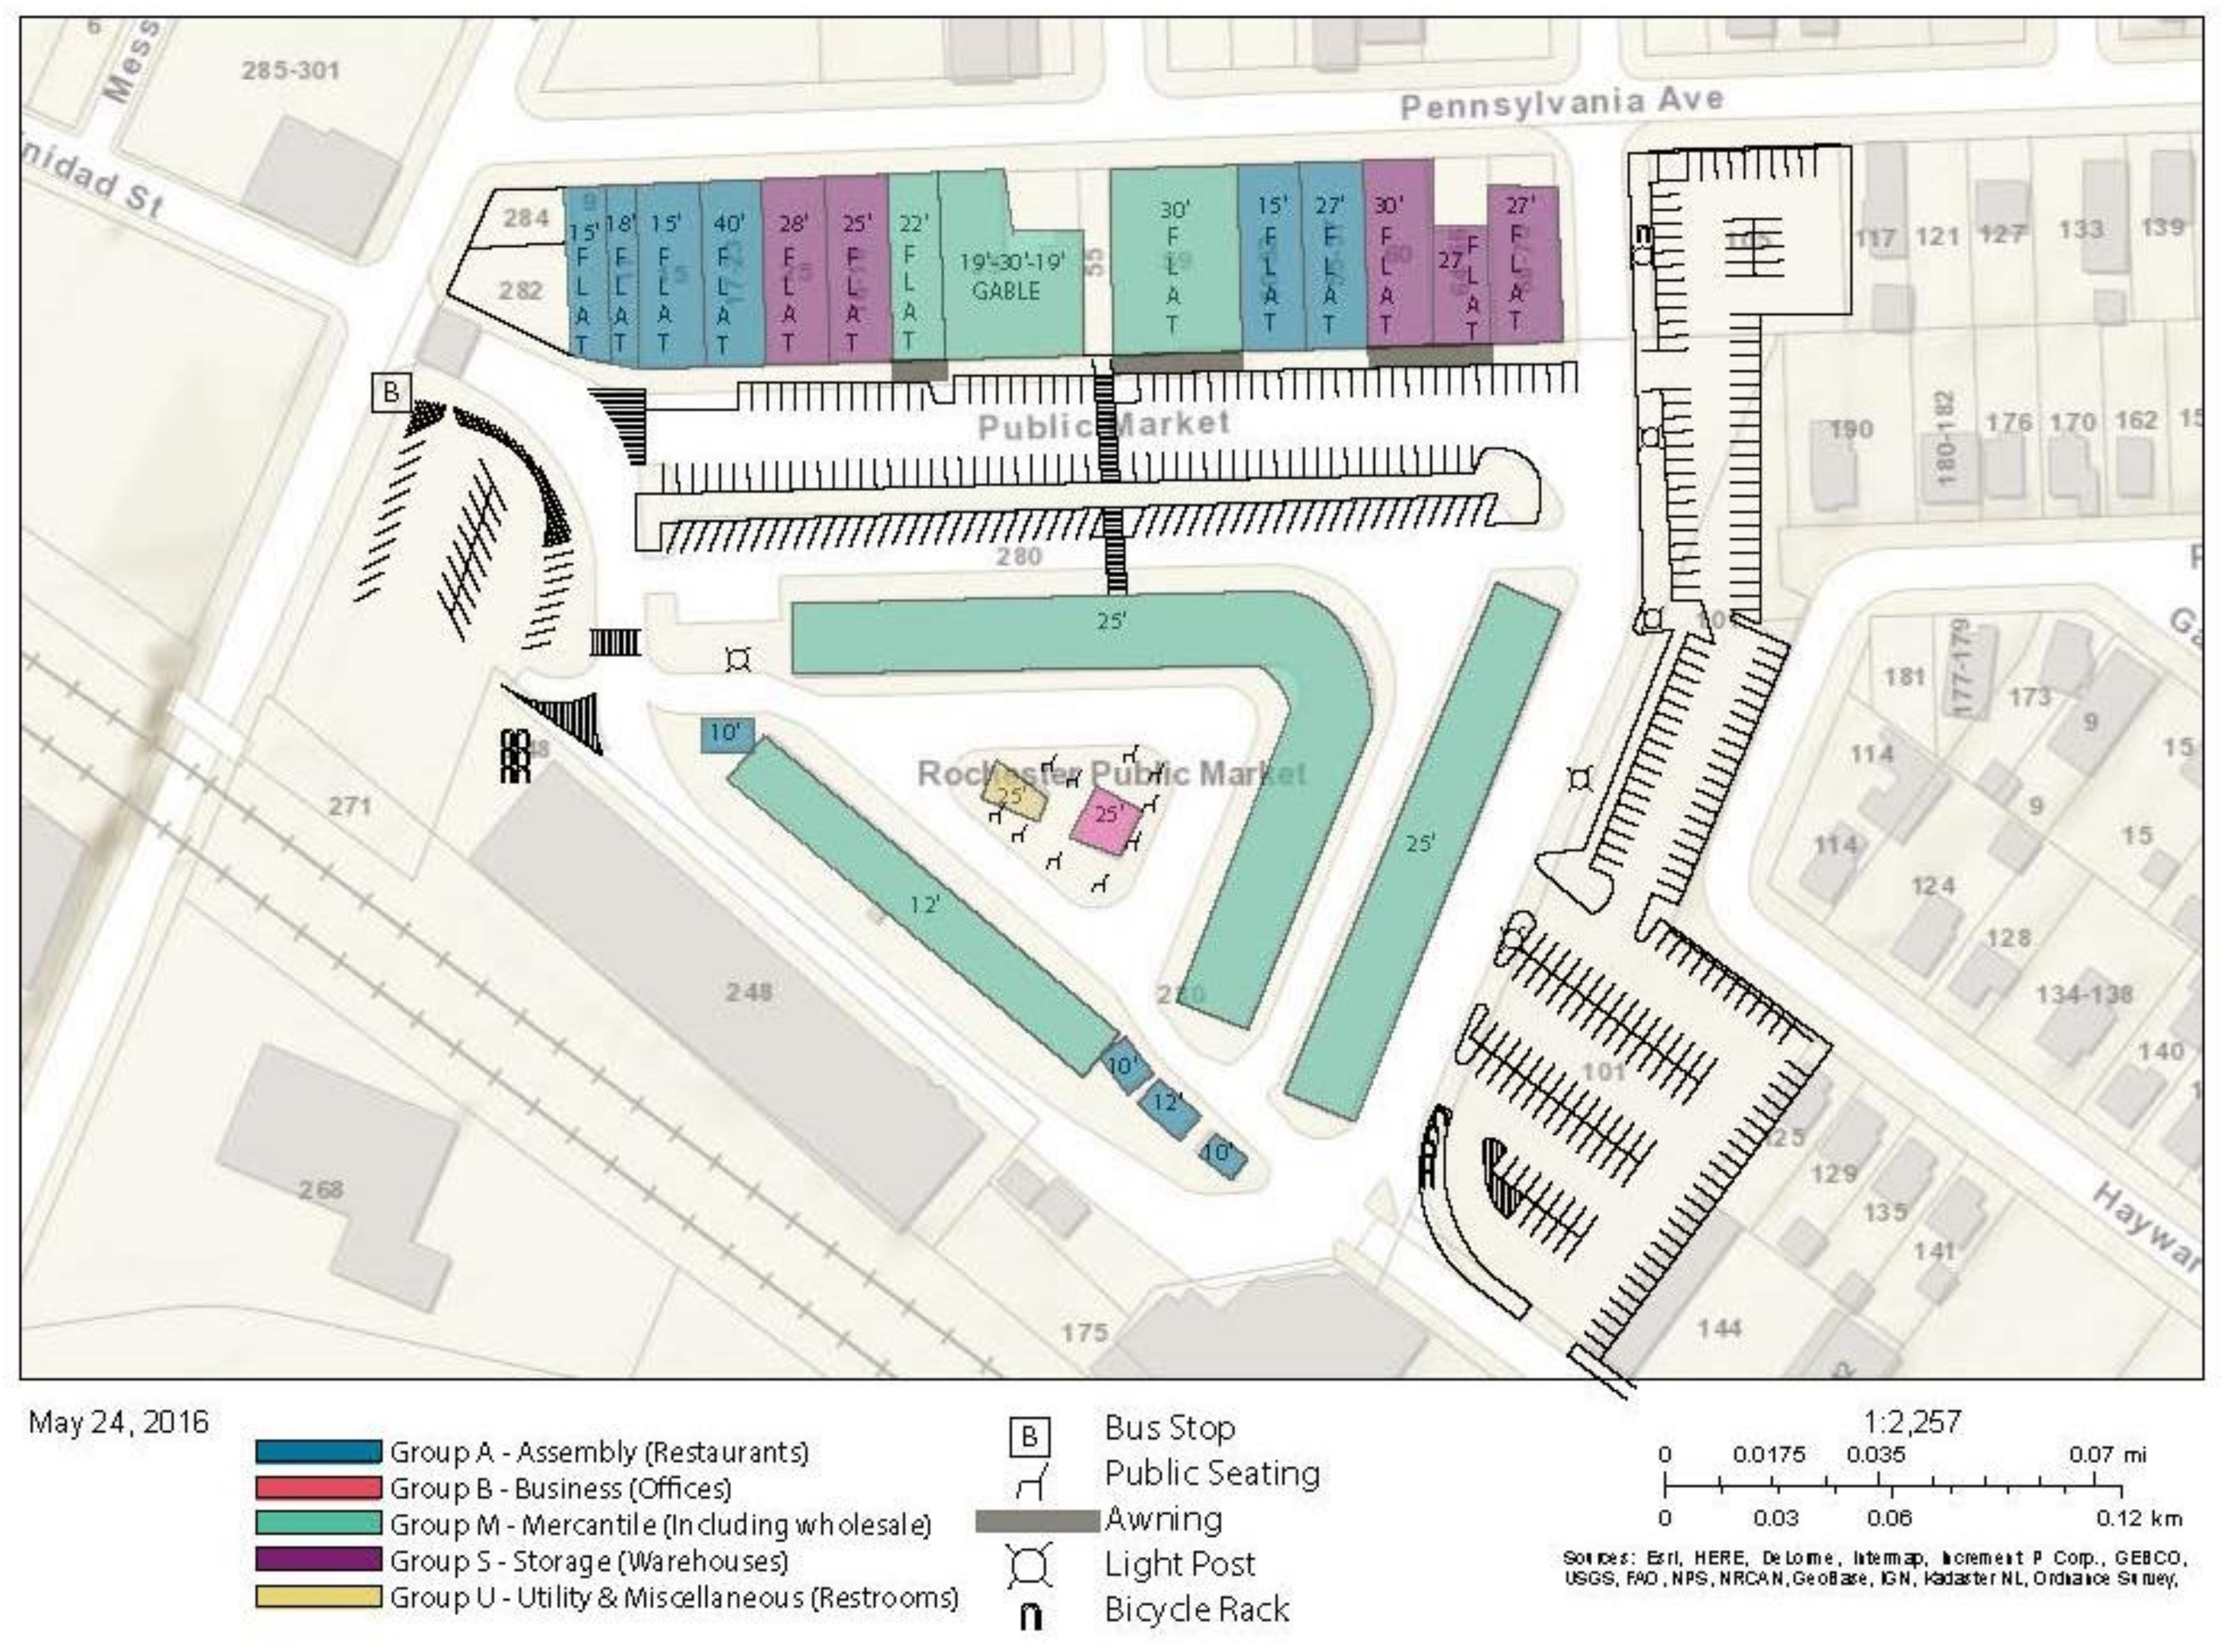
East End is an essential part of the Rochester historic district, with a large number of historical buildings, such as the Eastman School’s music hall and academic buildings. (refer to Figure 4 When compared to Rochester Public Market and College Town, East End has the most diverse building types, sidewalk types, building typologies, building heights, building mass, and open space types, as illustrated in Figure 4, Figure 5 and Figure 6. Even though College Town has provided a variety of open space, the overall building form, height, and mass lack diversity (refer to Figure 5). Rochester Public Market only has one type of open space (refer to Figure 6), but the building forms and patterns are of different types since most buildings are existing buildings that have been converted to commercial use from their original industry or residential function and have kept their original form and architectural character. One significant characteristic of the East End is the visual enclosure at the end of major streets: distinguished buildings or public art provide a distinctive visual identity that is recognized by local residents.
Streetscape
The streetscape of a space is the factor that is most connected to human scale. East End is the most pedestrian-friendly site, when compared to College Town and Rochester Public Market. It provides a variety outdoor seating areas, weather protection covers, and shelters. The clear signage, safety protected seating, and street lamps could provide safety for pedestrians; providing safety and comfort could encourage public interaction and activities. Public activities will help users to develop a distinct memory of a place. East End also has more bus stops and better connected streets, as compared to College Town and Rochester Public Market. The market’s schedule and function is fixed and singular, and its visibility, fenced wall, and gateway provide safety for all activities within its boundary, but they do isolate the public market from the adjacent neighborhoods. Neither College Town nor Rochester Public Market are bike accessible: although both of the locations provide bike racks on site, there are no designated, well-marked, and protected bike lane/trails leading to those two sites. One other big difference between East End and the other two sites is the street trees: East End has many more mature trees that are providing shade and defining the area boundary (see Figure 7, Figure 8 and Figure 9).
3.2.2. Architectural Context and Character
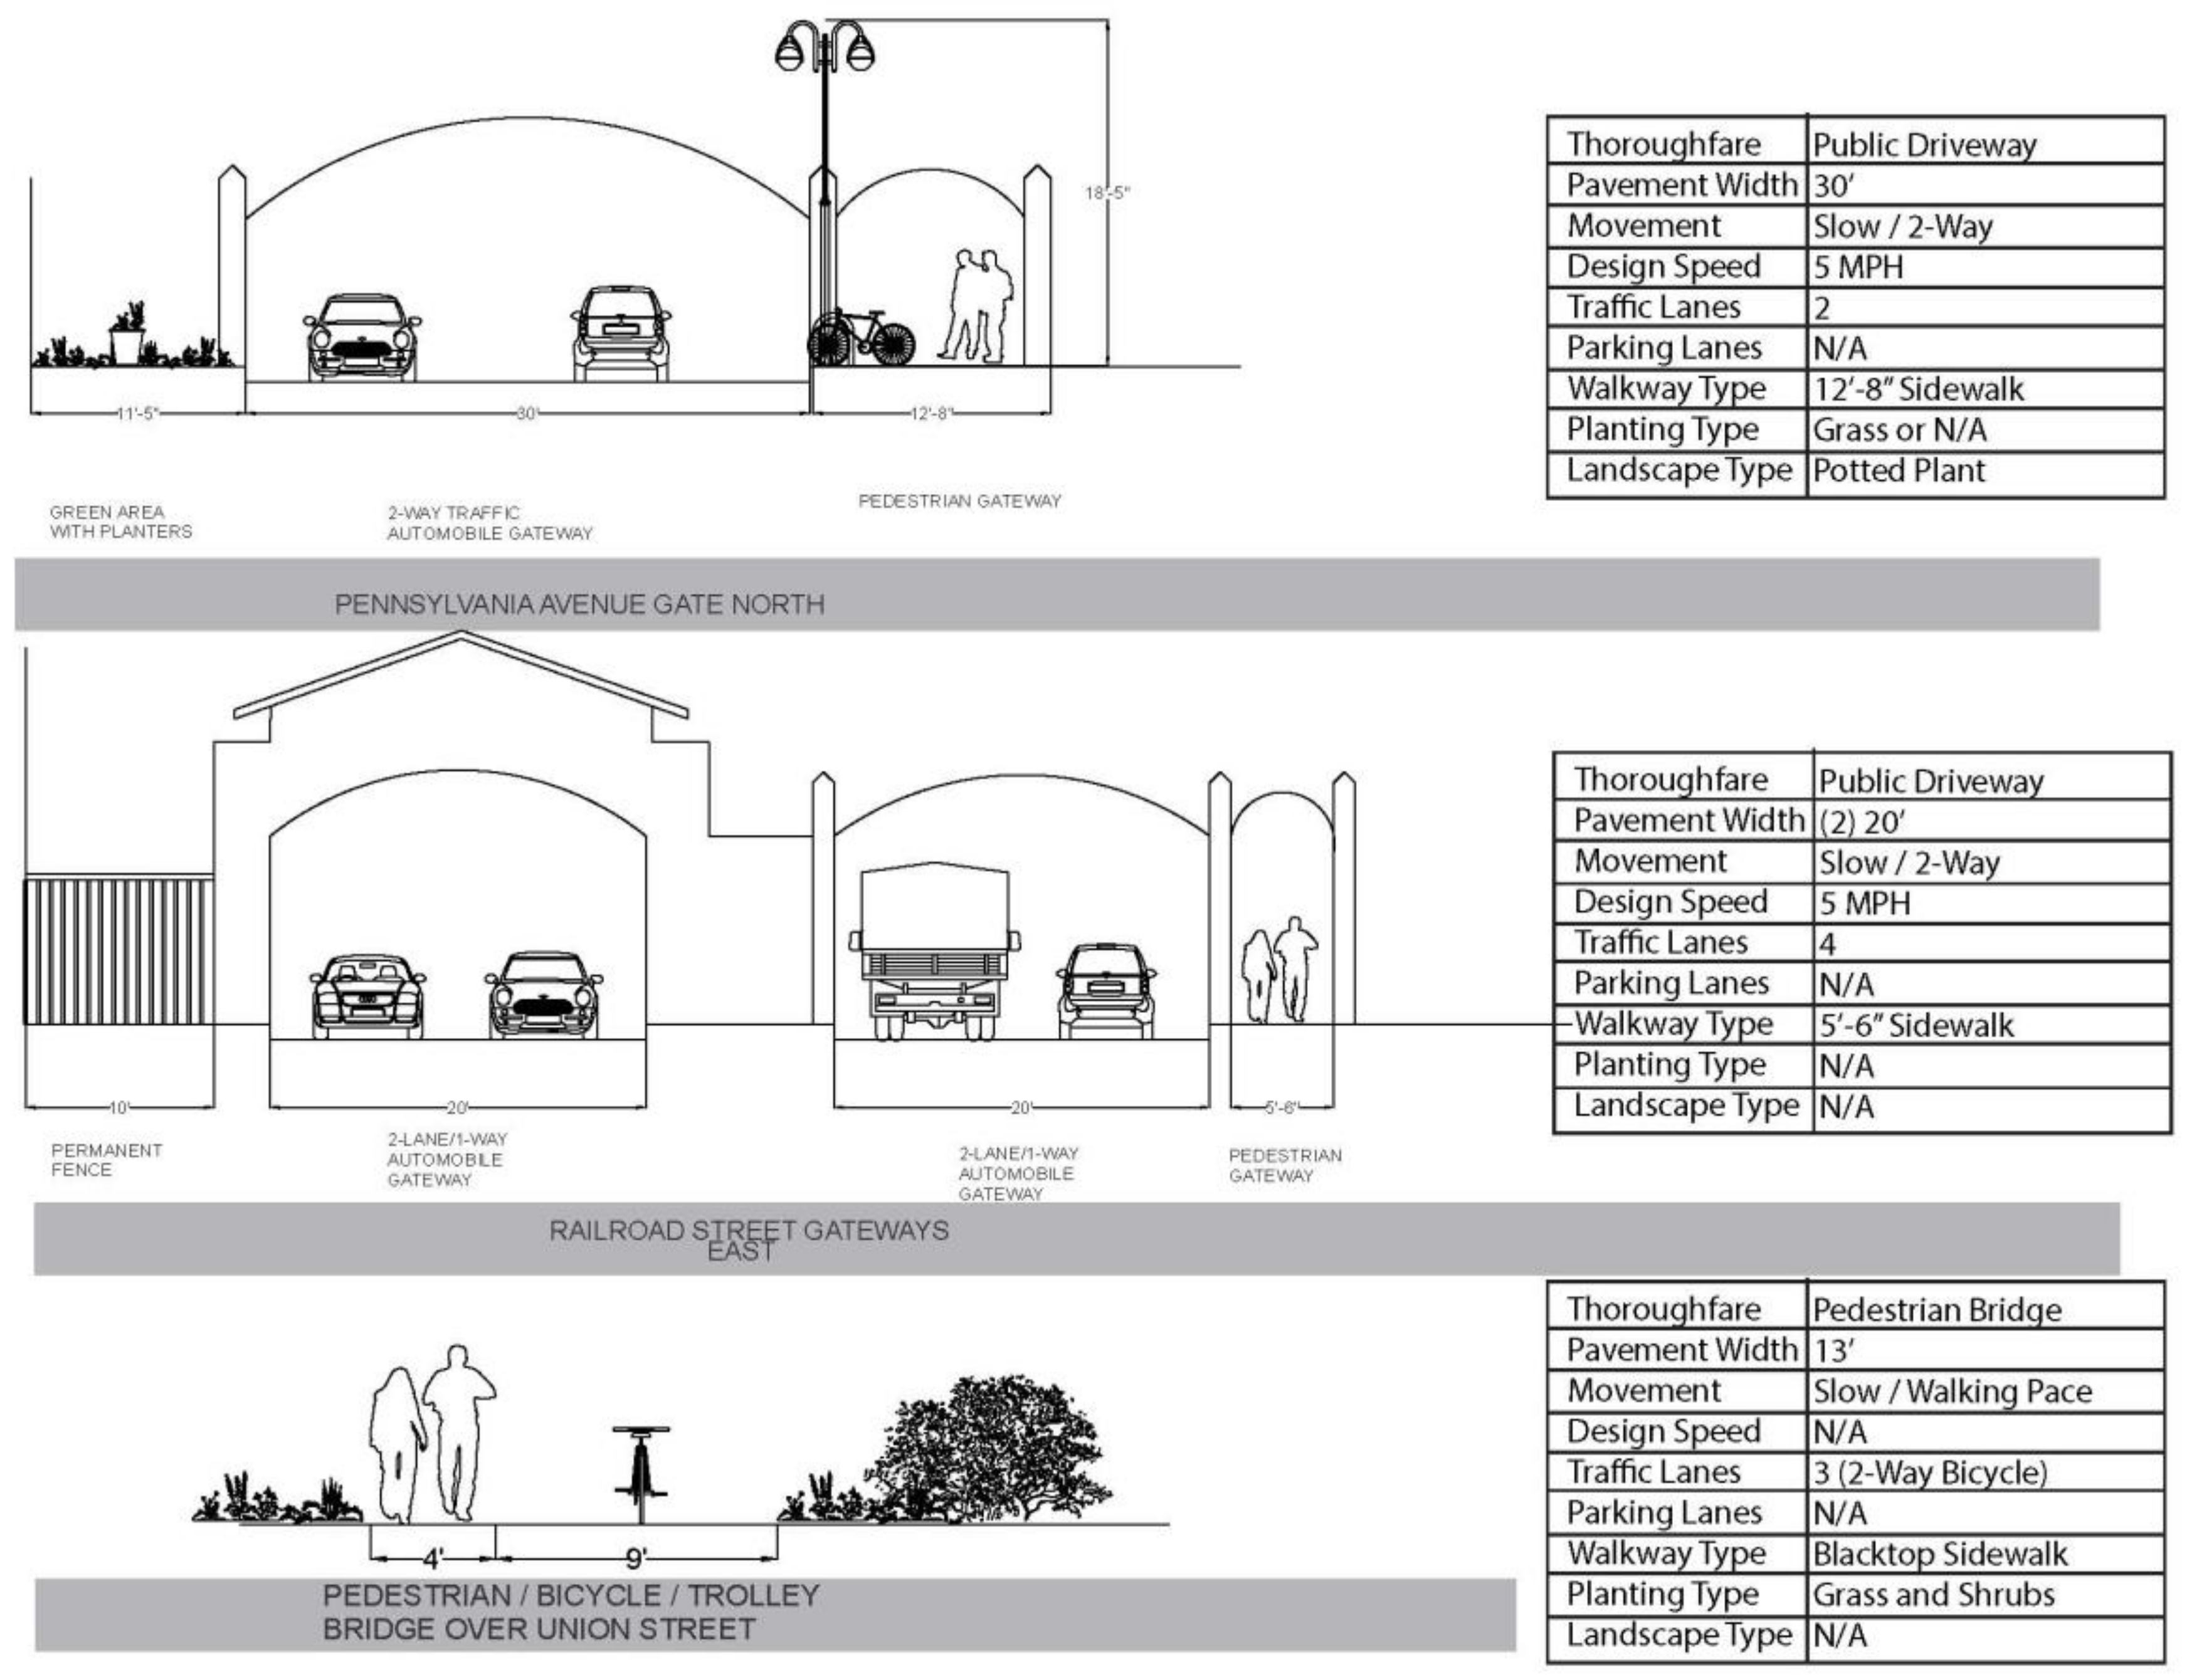
The Rochester Public Market has maintained most of the existing buildings and reused them, adapting them to new and different functions. The market was built in 1905. The open arch structure has a distinctive character, having used local materials and having been built particularly for open market use. The ground pavement-brick pavers are also local materials. The majority of the buildings in East End were built between 1920 and 1980—new buildings, which are those built after 2000, only account for 2% (City of Rochester, NY property information). The East End also has three buildings that have been designated as state historical landmarks and national registered historical buildings: Little Theater, the Sibley Triangle building, and the National Company building. Those buildings carry distinctive and unique architectural details, representing the regional and local identity of Rochester. All of the buildings in College Town were developed in 2012–2014 (City of Rochester, NY property information), by the same developer. The uniform architectural language could explain the neighborhood’s consistent appearance, however the lack of diversity also makes the entire development unexciting, based on the feedback from local residents. None of the buildings in College Town presents any particular local architectural style or character: it looks like any new mixed-used development that could be found in any other city or town. The use of popular façade materials and construction types instead of local materials makes College Town seem isolated from the nearby University of Rochester main campus (refer to Figure 10a–c).
3.3. On-Site Survey
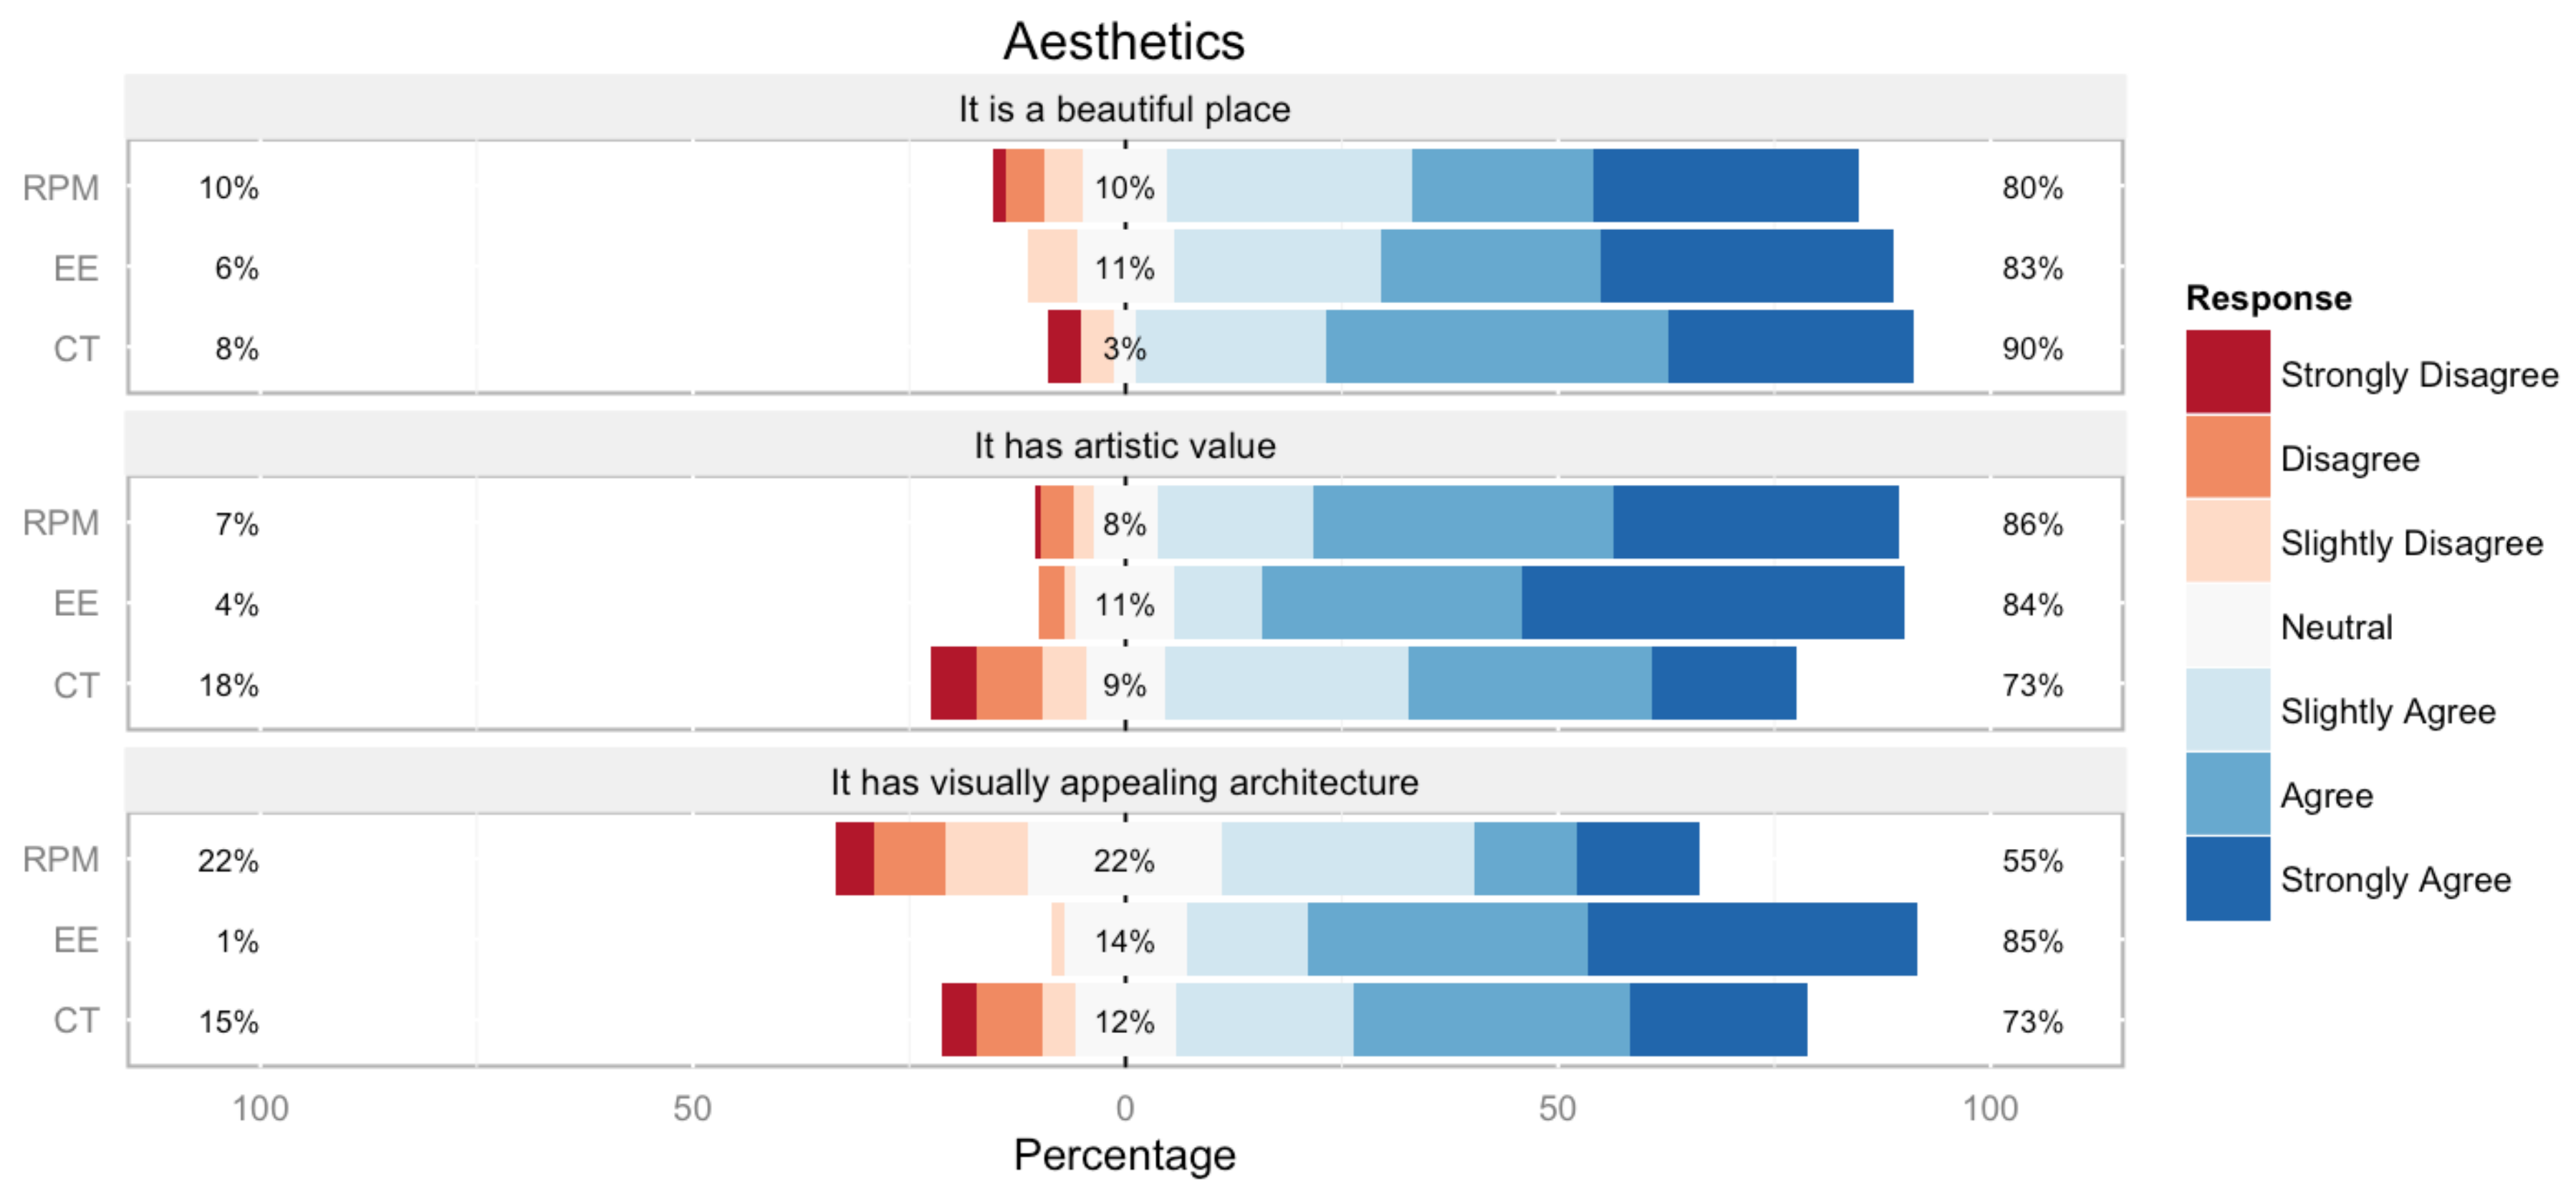
The research team conducted all of the intercept onsite surveys during the months of September, October, and November 2015. We selected these months due to the high visitation rates to all three sites in the fall relative to other seasons. During the winter months, bicycle and walking access to all three sites severely drops. The sites experience lower visitation rates during summer months due to summer break for education institutions in Rochester. A total 283 responses were collected across three sites with 78 from College Town (CT), 71 from East (EE), and 134 from Rochester Public Market (RPM). The majority of respondents finished the survey within 15 to 20 min. Only visitors that were 18 years or older took the survey. Three questions were asked with respect to the aesthetics of each site, relating closely to physical elements, architecture, and urban forms (see Figure 11 and Figure 12): It is a beautiful place; It has artistic value; It has a visually appealing architecture. More detailed information about survey could be found in another published paper by authors of this project [33].
Rochester Public Market (RPM): For RPM, the team conducted all surveys on Saturdays (10 October 2015 and 24 October 2015) between 9 a.m. and 2 p.m. and on Thursday (8 October 2015) between 9 a.m. and 11 a.m. Each respondent received a $5 food token for completing the survey. At the RPM, a dedicated tent was available for locating student assistants conducting the survey. The market administrators made a public announcement every hour at RPM.
East End (EE): For East End, the team conducted all surveys between 4 p.m. and 7 p.m. on a Tuesday (27 October 2015; 3 November 2015), Thursday (29 October 2015; 5 November 2015), or Friday (30 October 2015). These dates coincide with “Taco” and “Trivia” nights at the Temple Bar and Grille. Each respondent received a $4 food token for completing the survey. At the EE, since the neighborhood was unsafe in some parts, the team conducted the survey at Temple Bar and Grille, and neighborhood food and drink establishment. The owner of Temple Bar and Grille was the president of the East End neighborhood business association; the team decided a good representation of visitors to and community members of the East End visited his establishment.
College Town (CT): For CT, survey intercepts occurred in the afternoons on Monday (19 October 2015), Wednesday (21 October 2015) and Friday (23 October 2015) between 1 p.m. and 5 p.m., and on Saturday (31 October 2015) morning between 9 a.m. and 12 p.m. At CT, due to administrative difficulties, the team conducted the survey at Saxby’s coffee shop and at the Barnes and Noble Bookstore, which serves as the university bookstore for University of Rochester. Each respondent received a $3 gift card to Saxby’s for completing the survey.
3.4. Panel Auditing
The purpose of panel auditing is to determine the relation between architecture/urban design and perceptual qualities of a place; and the relation between those perceptual qualities of place and people’s SOP. To non-professionals, the concept of SOP and studies like this one are not familiar, so it is very difficult to ask them to associate a physical form with how they feel about a place, and impossible to ask them to rate a place using terms like “imageability, enclosure, or complexity”. Thus, the panel was composed of a group of people who are either design professionals or members of the general public who understand the basic vocabulary of urban design. Those people have participated in the on-site survey previously and volunteered for the panel. To this extent, the panel was composed of four urban design and planning professionals, four laypeople, and four professionals from fields other than architecture, landscape design, or urban design, but still have basic knowledge of SOP. In the auditing process, the panel evaluates the same set of built environment profile documents (visual images and pictorial reports) and uses the definition that was given by the research team. Using the same set of images and information to score the same sites at the same time might yield the most comparable and reliable results in terms of identifying how individuals perceive the built environment.
The panelists are asked to score the four perceptual qualities of each of the four physical characteristics based on the built environment profile (see Figure 2, Figure 3, Figure 4, Figure 5, Figure 6, Figure 7, Figure 8 and Figure 9c). At the end, the panelists were also asked to provide an overall score of SOP for each site. Then, the correlation between physical environment elements and perceptual qualities of place were then analyzed and examined. Conclusions were drawn upon the analysis, opportunity areas for architects and urban designers to improve design were identified, and the recommendations were formulated.
4. Results and Discussion
4.1. Key Findings from on-Site Survey(Perceptual Profile)
Aesthetics: Aesthetics is one of important factors that we focused on during our survey (refer to Figure 11). On average, EE has the most positive responses when compared to other locations. Only 55% of the respondents thought that RPM has visually appealing architecture. CT is considered to be less artistic, even though it is rated as beautiful. This is not necessarily contradictory: visually unappealing architecture could have high artistic value and could be deemed beautiful by local residents. There is a clear lack of sophisticated architecture design and formal atheistic value, but the Rochester Public Market holds the symbolic meaning of the city’s past; therefore, local residents are able to form a strong SOP for the market.
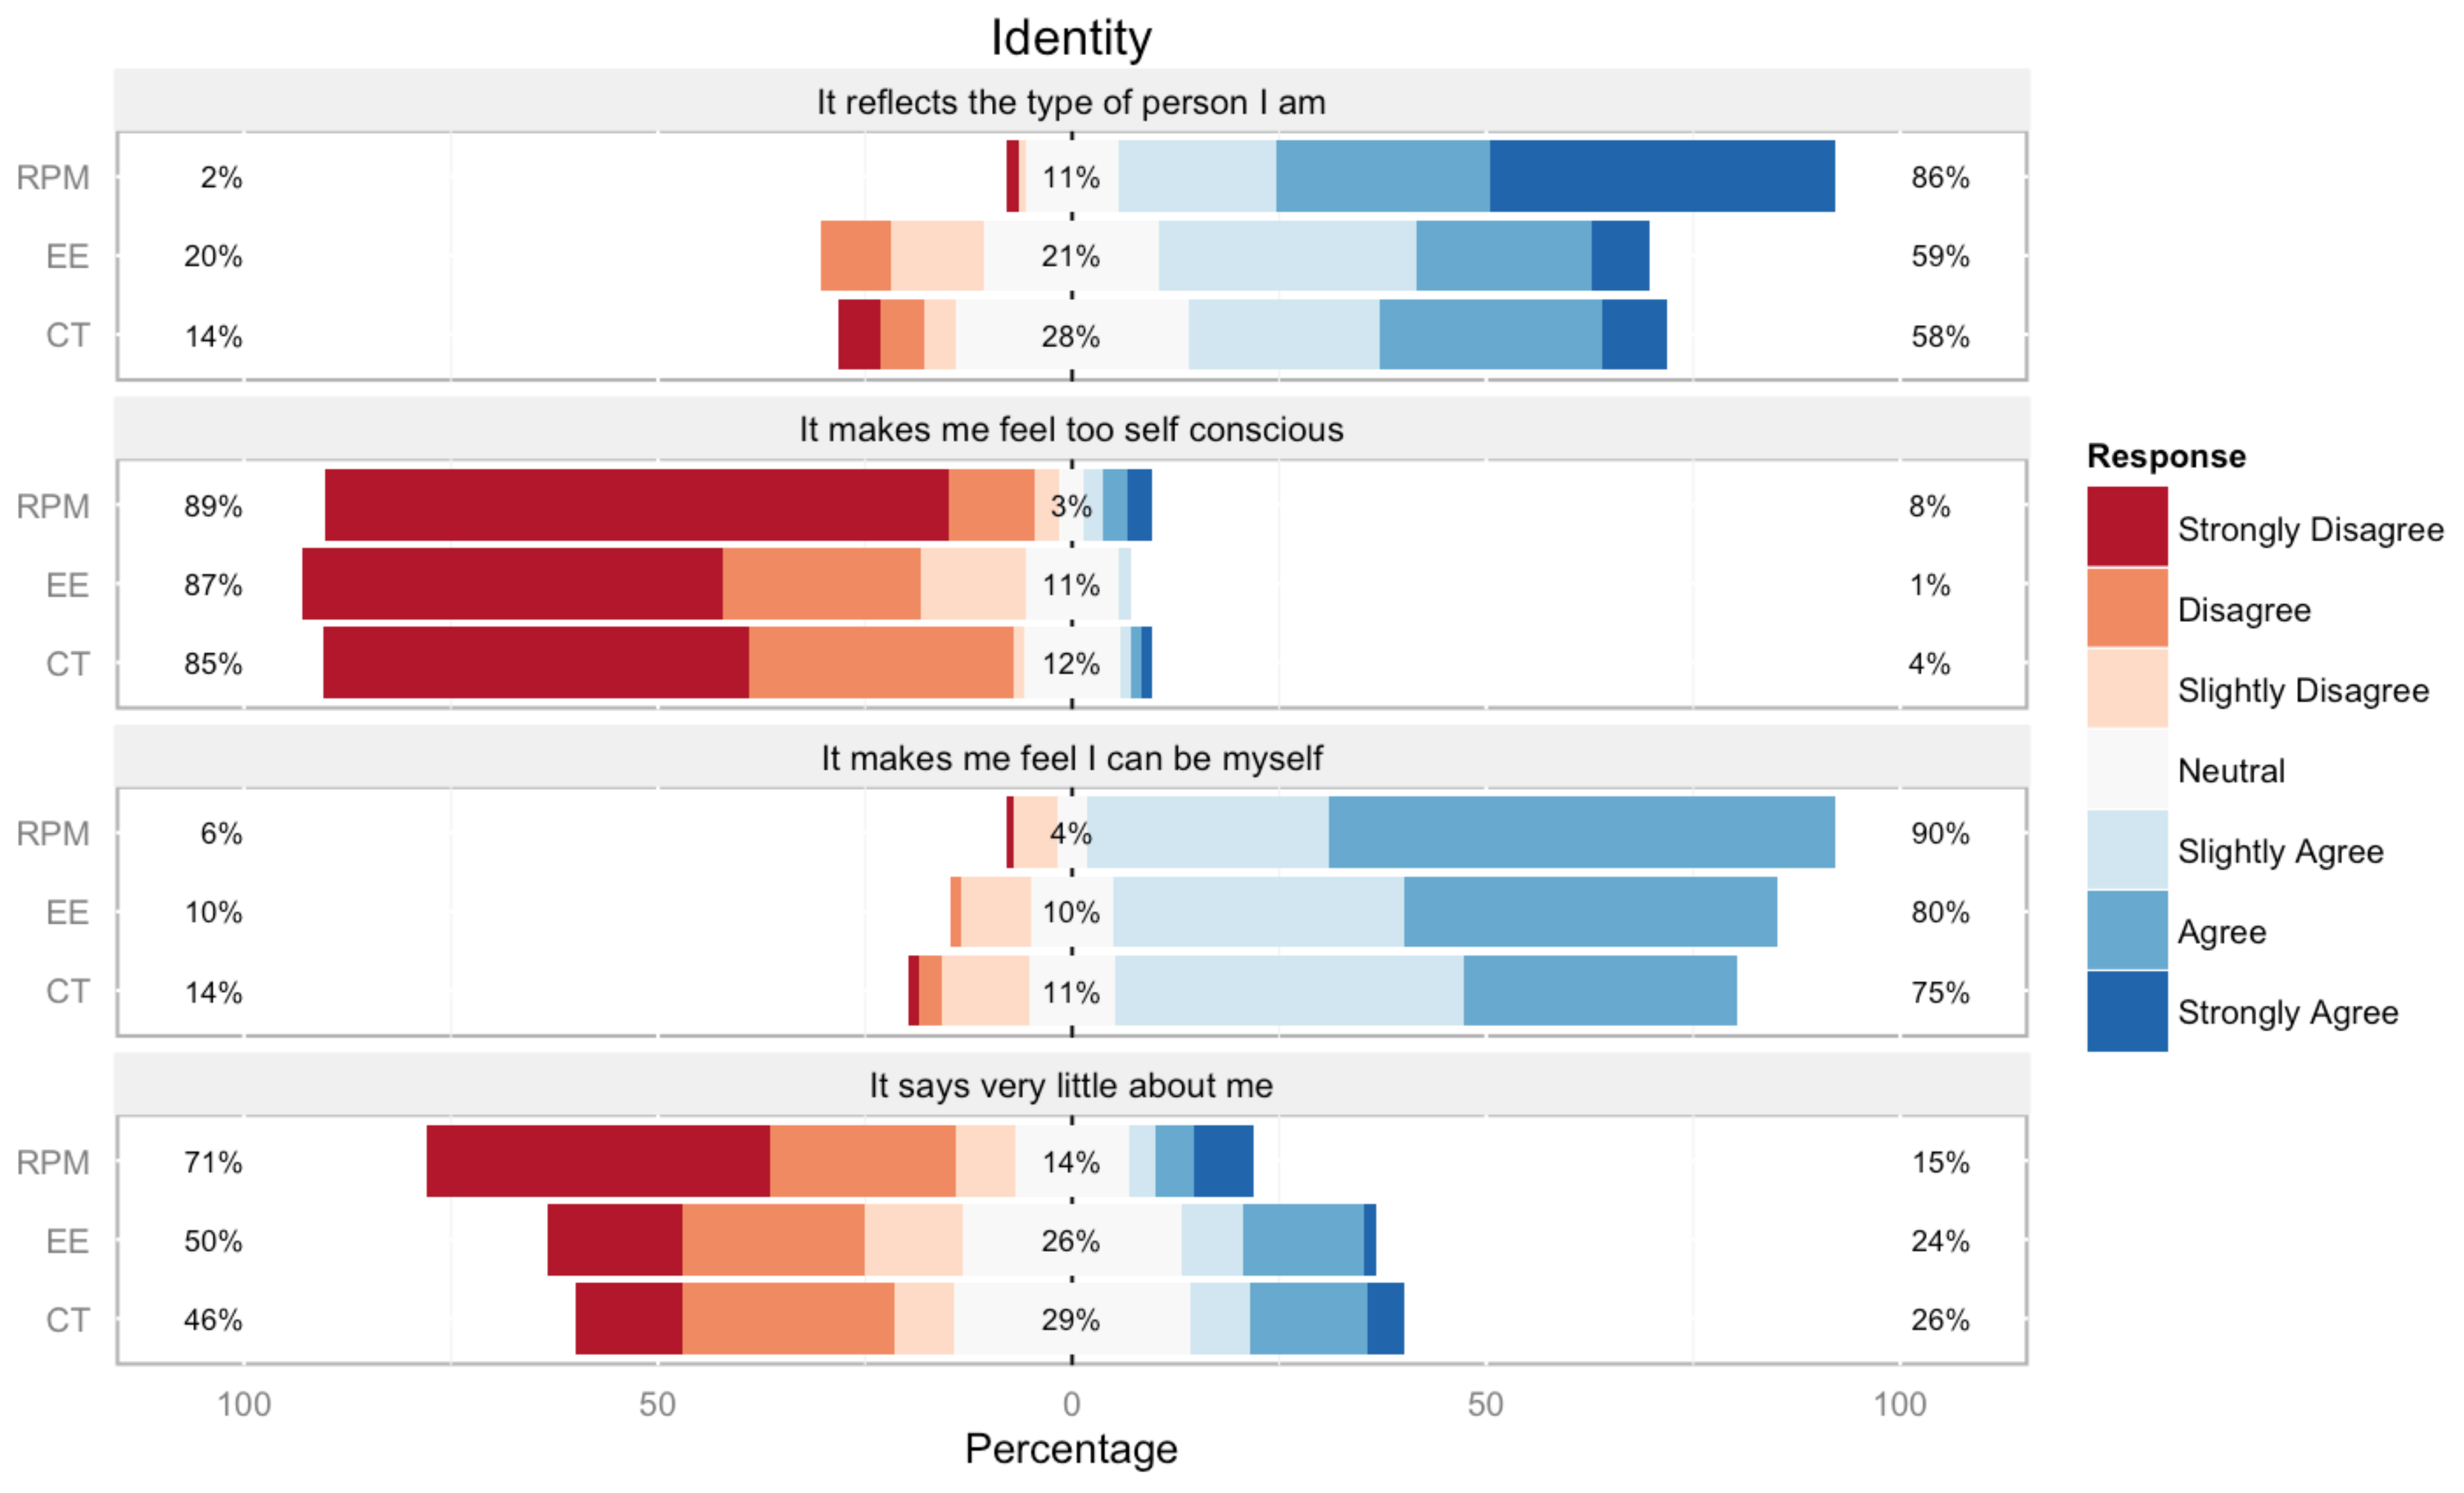
Identity: In average RPM had the most positive responses for place identify. In this construct, two questions are asked into both a positive and a negative sense. People visiting RPM felt that the market reflects who they were and therefore they disagreed with the negative statement “it says very little about me”. Similarly, people vising RPM felt that they can be themselves and therefore they did not feel self-conscious. Environmental images may be analyzed with respect to three components: identity, structure, and meaning [36]. First, identity refers to the ways in which an object is distinct from other things. The natural system and site features do not always have distinguishing characteristics, which gives designers opportunities to introduce distinctive artificial features that could differentiate a particular place from others. Second, an image must include the spatial or pattern relationship of the object to the observer and to other objects. Thus, urban pattern and architectural form play an important role in creating the structure to provide cues for observers to move through the space and to form their own experiences, memories, and SOP. Finally, the object must have some meaning for the observer, whether being practical or emotional. This might explain why there is a disconnection between the pure artistic value of the architecture and the residents’ SOP. For example, based on the on-site survey, College Town received the most consistent response among all the factors, which could be due to the consistent but generic urban and architecture design—even though College Town was viewed as beautiful, although with less artistic value—and the consistent response was that the design did not directly contribute to a better SOP in comparison to the other two sites. Further statistical tests and analyses regarding the correlation between identify and aesthetics survey can be found in another paper by authors [35].
4.2. Key Findings from Panel Auditing—Statistical Analysis
We asked the panel to first rank the four perceptual qualities, based on the contribution of each physical environment characteristic, and then gave an overall SOP score to each site. Table 2 represents an example of the score that was given by one panelist for one site (there are 17 scores from each panelist). Altogether, 12 panelists have 204 score for each of the four physical characteristics (for its correlation to one of perpetual qualities).
A multiple regression model was used to analyze the significant relationship between the four physical characteristics and the perpetual qualities of a place, as well as the overall SOP for the four perpetual qualities. To this end, we have used equation A to analyze the correlations:
where Yi is a perceptual quality, x is the physical characteristic, β1 is the coefficient, β0 is the intercept, and ε is the residual. For instance, the equation that is used to analyze the correlation between four physical characteristics of a place and the imageability of a place looks like this:
Yi = β0 + β1 (x1)i + β2 (x2)i + β3 (x3)i+ β4 (x4)i + ε,
imageabilityi = β0 + β1 (nature)i + β2 urban formi + β3 architecturei + β4 streetscapei + ε.
The statistical tools that we used were the Statistical Package for Social Science (SPSS) and Microsoft Excel. After we ran an analysis for all four perceptual qualities, we then reviewed the adjusted R-squared value to determine whether the model was generalized enough and to fit the data (score) that was collected. The adjusted R-squared value indicates the percentage of variables that could be explained by the predicated model. Simply put, if the adjusted R-squared is 0.8, then it means that 80% of the predicated score of imageability could be explained by the four physical characteristics. Table 3 shows the summary output (adjusted R value) for all of the analyses. The multiple regression model for human scale and imageability is less robust than for visual enclosure and complexity. In the model for complexity, 75.7% of the complexity score could be explained by those four physical characteristics, and 60.6% of the visual enclosure score could be explained by those characteristics.
In the second step, we then reviewed the p-value for the correlation between the individual perceptual quality and individual physical characteristic, and a low p-value (<0.05) suggested that there was likely a meaningful relation between a certain physical characteristic and a certain perceptual quality of a place. Table 4 shows the regression statistics of perceptual qualities in their most significant relationship to physical characteristics. Based on the p-value, nature has a meaningful correlation with imageability, visual enclosure, and urban form; pattern has a correlation with complexity; architecture has a correlation with human scale and imageability; and, streetscape has a correlation with human scale and complexity. Overall, architecture and streetscape contribute more to forming the perceptual qualities of a place, while urban form only contributes one out of four perceptual characteristics, which was unexpected. At this moment, we still cannot conclude that architecture, over urban form, plays an important role in defining SOP, as further research is needed to measure the weight of each attribute to determine which perceptual qualities are significant factors.
Lastly, we have examined the relationships between four perpetual qualities and the overall SOP to gain a better understanding of whether those qualities could help us to predicate how people perceive a place. Based on the significant p-value (<0.05), high scores for imageability and visual enclosure mostly likely could be linked to a strong SOP and vice versa (refer to Table 5). Among the four perceptual qualities, the abovementioned two could have a strong correlation, but how people acquire the SOP from those perpetual qualities needs to be further studied.
Panel auditing results also show misalignments between residents’ perceptual profile of a place and their overall SOP to a particular place. Among the three sites, College Town (CT) had the lowest overall SOP score, which could be due to the lack of diversity in urban form and pattern, as well as the generic architectural character; the panelists did not seem to think that CT was capable of providing a SOP, even though they scored CT quite highly in architecture, streetscape, etc. On the other hand, the public market was recognized as an important landmark that could represent Rochester’s identity and form a strong SOP, even though most of the panelists gave PP a very low score in three out of four categories of perceptual qualities.
This study found that a gap exists between the pure artistic value that was derived from architecture and the intended goal of developing an SOP. Locations can be aesthetically pleasing, but homogeneity in design may work against developing a strong connection with the place (see the findings in Section 4.1). Although the newly developed College Town was considered to be beautiful by many visitors, it held less artistic value. Therefore, beautiful, visually pleasing aspects do not directly contribute to the artistic value of architecture. The generic characters of urban form and architectural language are the product of generic design guidelines. Most current design guidelines use consistent, common, and generic terms to describe the requirements for urban design and placemaking and following such design guidelines leads to generic if consistent placemaking—that is, following generic design guidelines can lead to consistency in placemaking. However, it can also lead to a lack of diversity and place identity, which are crucial for perceptual qualities, such as imageability and visual enclosure, which are likely directly linked to a strong SOP. Based on the responses of the panel auditing, architectural form and streetscape in their view contributed more to forming the perceptual qualities of a place [than natural system, site features, and urban form. This finding verified the reason for why both aspects are regulated in detail in most urban design guidelines. We concluded from this that streetscape and architectural forms play important roles in cueing visitors that move through the space to form their own experiences, memories, and eventual SOP. Designers and planners who wish to embrace SOP as a concept for the built environment should therefore look beyond the physical dimension and consider a more holistic sociocultural experience when attempting to design or plan for SOP [37,38].
5. Conclusions
This paper presented a framework for understanding the relationship between a physical environment and people’s perceptions of the place in an urban design context. While an understanding of SOP is not groundbreaking, the proposed framework and its application in the design field present a unique opportunity to add new knowledge to this interdisciplinary topic. The results include several major findings:
- There is no direct correlation between the architectural artistic value and place identity and the SOP perceived by visitors.
- Less visually appealing architecture appears to hold high artistic value by local residents.
- The overall architecture and streetscape contribute more to forming the perceptual qualities of a place.
- Nature has a meaningful correlation with imageability, visual enclosure, and urban form; pattern has a correlation with complexity; architecture has a correlation with human scale and imageability; and, streetscape has a correlation with human scale and complexity.
Overall, the understanding of space and placemaking could help architects and urban designers to improve the quality of urban design. This hybrid quantitative and qualitative approach is promising but it requires more research to generate a comprehensive understanding that provides novel insights and informed updates on current design principles and regulations. The results of this study have begun to answer some questions about opportunities for improving design. Architectural context and characteristics could provide areas of opportunity for urban designers and architects to improve their design. However, further research is needed to identify which subcategories under architectural context and characteristics play the most important roles in placemaking.
Acknowledgments
The authors wish to thank UTRC2 at CUNY for funding this research work.
Author Contributions
Ming Hu and Roger Chen conceived and designed the experiments together; Roger Chen supervised students to the on-site survey and analyzed the data from survey results; Ming Hu Supervised students and conducted field investigation and analyzed the data; Ming Hu organized and conducted panel auditing and analyzed the data; Ming Hu and Roger Chen wrote the paper.
Conflicts of Interest
The authors declare no conflict of interest.
References
- Puddifoot, J.E. Dimensions of community identity. J. Commun. Appl. Soc. Psychol. 1995, 5, 357–370. [Google Scholar] [CrossRef]
- McMillan, D.W.; Chavis, D.M. Sense of community: A definition and theory. J. Commun. Psychol. 1986, 14, 6–23. [Google Scholar] [CrossRef]
- Mohammad, N.M.N.; Saruwono, M.; Said, S.Y.; Hariri, W.A.H.W. A Sense of Place within the landscape in cultural settings. Procedia Soc. Behav. Sci. 2013, 105, 506–512. [Google Scholar] [CrossRef]
- Tuan, Y.F. Space and Place: The Perspective of Experience; University of Minnesota Press: Minneapolis, MN, USA, 1977. [Google Scholar]
- Relph, E. Geographical experiences and being-in-the-world: The phenomenological origins of geography. In Dwelling, Place and Environment; Springer: Dordrecht, The Netherlands, 1985; pp. 15–31. [Google Scholar]
- Cresswell, T. Place: An introduction; John Wiley & Sons: New York, NY, USA, 2014. [Google Scholar]
- Seamon, D.; Mugerauer, R. Dwelling, place and environment: An introduction. In Dwelling, Place and Environment; Springer: Dordrecht, The Netherlands, 1985; pp. 1–12. [Google Scholar]
- Rose, G. Visual Methodologies: An Introduction to Researching with Visual Materials; Sage: Newcastle upon Tyne, UK, 2016. [Google Scholar]
- Hummon, D.M. Community attachment. In Place Attachment; Springer: Boston, MA, USA, 1992; pp. 253–278. [Google Scholar]
- Gieryn, T.F. A space for place in sociology. Ann. Rev. Sociol. 2000, 26, 463–496. [Google Scholar] [CrossRef]
- McMahon, E.T. The Distinctive City. 2012. Available online: http://urbanland.uli.org/development-business/the-distinctive-city/ (accessed on 5 December 2017).
- Cross, J.E. What is Sense of Place. In Proceedings of the 12th Headwaters Conference, Western State College, Gunnison, CO, USA, 2–4 November 2001. [Google Scholar]
- Casey, E.S. How to get from space to place in a fairly short stretch of time: Phenomenological prolegomena. In Senses of Place; School of American Research Press: Santa Fe, NM, USA, 1996. [Google Scholar]
- Hinton, A. Understanding Context: Environment, Language, and Information Architecture; O’Reilly Media, Inc.: Newton, MA, USA, 2014. [Google Scholar]
- Gibson, J.J. The Ecological Approach to Visual Perception: Classic Edition; Psychology Press: Tucson, AZ, USA, 2014. [Google Scholar]
- Varela, F.J.; Thompson, E.; Rosch, E. The Embodied Mind: Cognitive Science and Human Experience; MIT Press: Cambridge, MA, USA, 2017. [Google Scholar]
- Marot, S. The reclaiming of sites. In Recovering Landscape: Essays in Contemporary Landscape Architecture; Princeton Architectural Press: New York, NY, USA, 1999; pp. 45–57. [Google Scholar]
- Alexander, C.; Ishikawa, S.; Silverstein, M.; Ramió, J.R.; Jacobson, M.; Fiksdahl-King, I. A Pattern Language; Gustavo Gili: Barcelona, Spain, 1977; pp. 311–314. [Google Scholar]
- Bott, S.; Cantrill, J.G.; Myers, O.E., Jr. Place and the promise of conservation psychology. Hum. Ecol. Rev. 2003, 10, 100–112. [Google Scholar]
- Norberg-Schulz, C. Genius Loci: Towards a Phenomenology of Architecture; Rizzoli: New York, NY, USA, 1980. [Google Scholar]
- Lynch, K. Good City Form; MIT Press: Cambridge, MA, USA, 1984. [Google Scholar]
- Jackson, J.B. A Sense of Place, a Sense of Time; Yale University Press: New Haven, CT, USA, 1994. [Google Scholar]
- Nasar, J.L. The evaluative image of the city. J. Am. Plan. Assoc. 1990, 56, 41–53. [Google Scholar] [CrossRef]
- Francis, J.; Giles-Corti, B.; Wood, L.; Knuiman, M. Creating sense of community: The role of public space. J. Environ. Psychol. 2012, 32, 401–409. [Google Scholar] [CrossRef]
- French, S.; Wood, L.; Foster, S.A.; Giles-Corti, B.; Frank, L.; Learnihan, V. Sense of community and its association with the neighborhood built environment. Environ. Behav. 2014, 46, 677–697. [Google Scholar] [CrossRef]
- Devlin, K.; Nasar, J.L. The beauty and the beast: Some preliminary comparisons of ‘high’ versus ‘popular’ residential architecture and public versus architect judgments of same. J. Environ. Psychol. 1989, 9, 333–344. [Google Scholar] [CrossRef]
- Roth, M. Online Visual Landscape Assessment Using Internet Survey Techniques. 2004. Available online: http://www.kolleg.loel.hs-anhalt.de/studiengaenge/mla/mla_fl/conf/pdf/conf2004/42_roth-c.pdf (accessed on 10 December 2017).
- Wherrett, J.R. Creating landscape preference models using internet survey techniques. Landsc. Res. 2000, 25, 79–96. [Google Scholar] [CrossRef]
- Dubey, A.; Naik, N.; Parikh, D.; Raskar, R.; Hidalgo, C.A. Deep learning the city: Quantifying urban perception at a global scale. In Proceedings of the European Conference on Computer Vision, Amsterdam, The Netherlands, 8–16 October 2016; Springer: Cham, Switzerland, 2016; pp. 196–212. [Google Scholar]
- Ewing, R.; Handy, S.; Brownson, R.C.; Clemente, O.; Winston, E. Identifying and measuring urban design qualities related to walkability. J. Phys. Act. Health 2006, 3, S223–S240. [Google Scholar] [CrossRef] [PubMed]
- Bentley, I. Responsive Environments: A Manual for Designers; Routledge: London, UK, 1985. [Google Scholar]
- Beidler, K.J.; Morrison, J.M. Sense of place: Inquiry and application. J. Urban. Int. Res. Placemak. Urban Sustain. 2016, 9, 205–215. [Google Scholar] [CrossRef]
- Green, R. Meaning and form in community perception of town character. J. Environ. Psychol. 1999, 19, 311–329. [Google Scholar] [CrossRef]
- Salesses, P.; Schechtner, K.; Hidalgo, C.A. The Collaborative Image of the City: Mapping the Inequality of Urban Perceeption. PLoS ONE 2013, 8, e68400. [Google Scholar] [CrossRef] [PubMed] [Green Version]
- Chen, R.B.; Sekar, A. Investigating the impact of Sense of Place on site visit frequency with non-motorized travel modes. J. Trans. Geogr. 2018, 66, 268–282. [Google Scholar] [CrossRef]
- Gosling, D.; Maitland, B. Concepts of Urban Design, Academy Editions ed; St. Martin’s Press: New York, NY, USA, 1984. [Google Scholar]
- Lynch, K. The Image of the City; MIT Press: Cambridge, MA, USA, 1960. [Google Scholar]
- Najafi, M.; Shariff, M.K.B.M. The concept of place and Sense of Place in architectural studies. Int. J. Hum. Soc. Sci. 2011, 6, 187–193. [Google Scholar]
Figure 1.
Framework to gain understanding of sense of place (SOP).

Figure 2.
City map includes three sites [35].
Figure 2.
City map includes three sites [35].

Figure 3.
Sample Built Environment Profile Sheet (CT) (By authors).

Figure 4.
East End urban form and pattern map (By authors).

Figure 5.
College Town urban form and pattern map (by authors).

Figure 6.
Rochester Public Market urban form and pattern map (By authors).

Figure 7.
College Town street sections (by authors).

Figure 8.
Public Market street sections (by authors).

Figure 9.
East End street sections (by authors).

Figure 10.
(a) Public Market view. (b) College Town view. (c) East End view.
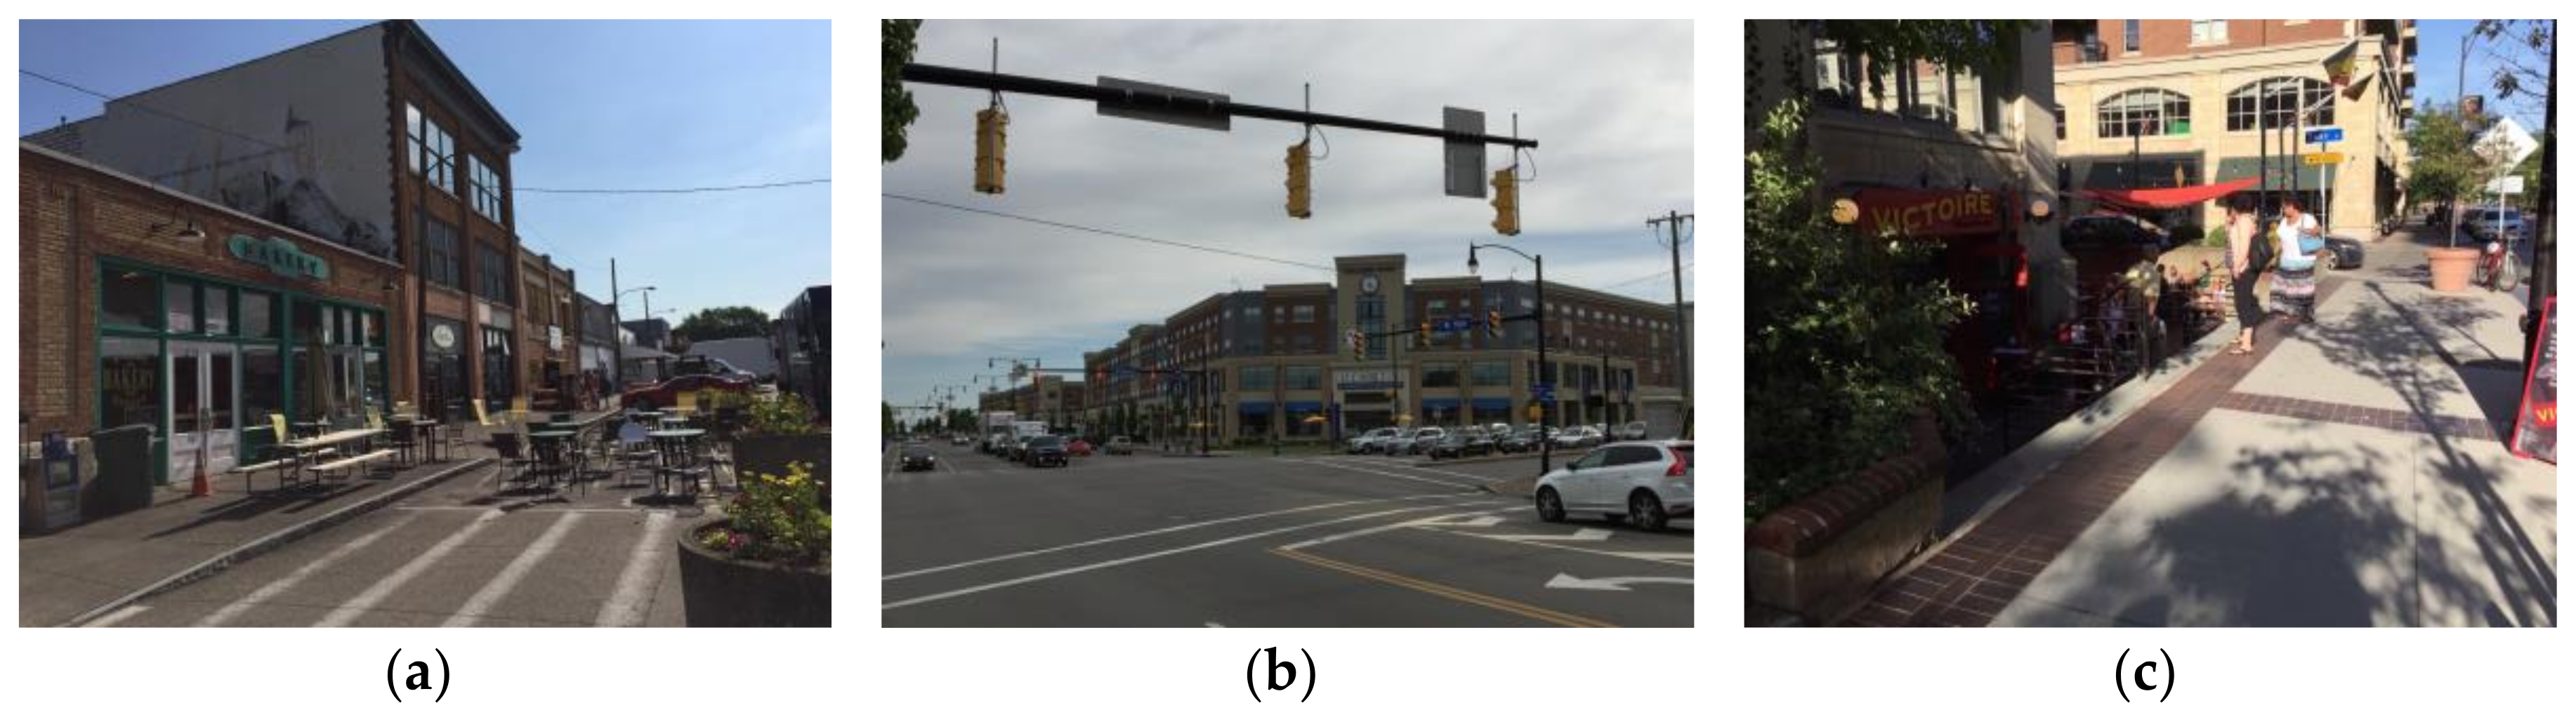
Figure 11.
Summary statistics of attitudinal questions regarding Aesthetics among the three locations (By authors).
Figure 11.
Summary statistics of attitudinal questions regarding Aesthetics among the three locations (By authors).

Figure 12.
Summary statistics of attitudinal questions regarding Identity among the three locations (By authors).
Figure 12.
Summary statistics of attitudinal questions regarding Identity among the three locations (By authors).

Table 1.
Design guidelines.
| City | Methodology | Physical Character (Focus Area) |
|---|---|---|
| Los Angeles—Downtown Design Guide | Quantitative and qualitative | Sustainability, sidewalks, setbacks, ground floor, parking and access, massing, street walls, open space, architectural detail, signage, streetscape, public art |
| Virginia—Fairfax County Urban Design Checklist | Qualitative | Context/location, access, function, amenities, form |
| London—Illustrate Urban Design Principles | Quantitative and qualitative | Urban structure, streets, built form, façade details, setbacks, parking, massing and scale, materials, density, building type |
| Edinburgh—Standards for Urban Design | Qualitative | City-wide views and context, city edges, image and legibility, network of green and civic spaces, local identity, distinctive urban form, coherent layouts, street character, pedestrian access, open space, public space |
| Seattle—Design Guidelines | Qualitative | Natural systems and site features, urban pattern and form, architectural context and character, open space connectivity, walkability, street-level interaction, transportation, exterior elements and finishes |
| Rochester—City-wide Design Guidelines | Qualitative | Building elevations, entrance, roofs, waterfront view |
| Baltimore—Design Guidelines | Qualitative | Building typology, building forms, fenestration, entries, materials |
| Sendai City Yokohama city | Quantitative and qualitative | Urban structure, streets, built form, façade details, setbacks, height, slope, parking, materials, density, Building type |
Table 2.
Panel auditing score sample from one single panelist for one site.
| Physical Characteristics of a Place | ||||||
|---|---|---|---|---|---|---|
| Nature | Urban Form | Architecture | Streetscape | Overall Score | ||
| Perceptual qualities | Imageability | 2 | 3 | 6 | 7 | |
| Visual Enclosure | 2 | 2 | 9 | 5 | ||
| Human Scale | 1 | 7 | 9 | 4 | ||
| Complexity | 1 | 4 | 5 | 3 | ||
| Sense of Place | 6 | |||||
Table 3.
Regression statistics of robustness of the model.
| Regression Statistics | Adjusted R-Squared | Significance F (p-Value) |
|---|---|---|
| Imageability | 0.415 | 0.000316 |
| Visual Enclosure | 0.606 | 2.635 × 10⁻⁵ |
| Human Scale | 0.473 | 6.745 × 10⁻⁵ |
| Complexity | 0.757 | 1.17 × 10⁻⁷ |
Table 4.
Regression statistics of perceptual qualities of a place (and variables forming urban design guidelines).
Table 4.
Regression statistics of perceptual qualities of a place (and variables forming urban design guidelines).
| Nature | Urban Form | Architecture | Streetscape | |
|---|---|---|---|---|
| Imageability | 0.002 | n.s. | 4.093 × 10⁻⁵ | n.s. |
| Visual Enclosure | 0.046 | n.s. | n.s. | n.s. |
| Human Scale | n.s. | n.s. | 0.0006 | 0.005 |
| Complexity | n.s. | 0.0002 | n.s. | 8.95 × 10⁻⁵ |
p-value of correlation between perpetual quality and physical characteristic.
Table 5.
Regression statistics of the SOP score.
| Coefficients | Standard Error | p-Value | |
|---|---|---|---|
| Imageability | 0.675430381 | 0.07748886 | 7.65487 × 10⁻¹⁰ |
| Visual Enclosure | 0.342741522 | 0.101207767 | 0.00193938 |
| Human Scale | 0.037904662 | 0.0876121 | n.s. |
| Complexity | 0.039776496 | 0.093933275 | n.s. |
© 2018 by the authors. Licensee MDPI, Basel, Switzerland. This article is an open access article distributed under the terms and conditions of the Creative Commons Attribution (CC BY) license (http://creativecommons.org/licenses/by/4.0/).
Share and Cite
MDPI and ACS Style
Hu, M.; Chen, R. A Framework for Understanding Sense of Place in an Urban Design Context. Urban Sci. 2018, 2, 34. https://doi.org/10.3390/urbansci2020034
AMA Style
Hu M, Chen R. A Framework for Understanding Sense of Place in an Urban Design Context. Urban Science. 2018; 2(2):34. https://doi.org/10.3390/urbansci2020034
Chicago/Turabian StyleHu, Ming, and Roger Chen. 2018. "A Framework for Understanding Sense of Place in an Urban Design Context" Urban Science 2, no. 2: 34. https://doi.org/10.3390/urbansci2020034