Land-Cover Change Analysis and Simulation in Conakry (Guinea), Using Hybrid Cellular-Automata and Markov Model


1
Graduate School of Environmental Science, Hokkaido University, Sapporo, Hokkaido 060-0810, Japan
2
Faculty of Environmental Earth Science, Hokkaido University, Sapporo, Hokkaido 060-0810, Japan
*
Author to whom correspondence should be addressed.
Urban Sci. 2018, 2(2), 39; https://doi.org/10.3390/urbansci2020039
Submission received: 11 February 2018
/
Revised: 14 April 2018
/
Accepted: 15 April 2018
/
Published: 20 April 2018
(This article belongs to the Special Issue Urban Landscape Degradation and Restoration)
Abstract
:In this study, land-cover change in the capital Conakry of Guinea was simulated using the integrated Cellular Automata and Markov model (CA-Markov) in the Geographic Information System (GIS) and Remote Sensing (RS). Historical land-cover change information was derived from 1986, 2000 and 2016 Landsat data. Using the land-cover change maps of 1986 and 2000, the land-cover change map for 2016 was simulated based on the Markov model in IDRISSI software (Clark University, Worcester, MA, USA). The simulated result was compared with the 2016 land-cover map for validation using the Relative Operating Characteristic (ROC). The ROC result showed a very strong agreement between the two maps. From this result, the land-cover change map for 2025 was simulated using CA-Markov model. The result has indicated that the proportion of the urban area was 49% in 2016, and it is expected to increase to 52% by 2025, while vegetation will decrease from 35% in 2016 to 32% in 2025. This study suggests that the rapid land-cover change has been led by both rapid population growth and extreme poverty in rural areas, which will result in migration into Conakry. The results of this study will provide bases for assessing the sustainability and the management of the urban area and for taking actions to mitigate the degradation of the urban environment.
1. Introduction
With the increasing world population, coupled with technological advancement, humankind has emerged as the major, most powerful and universal instrument of environmental change in the biosphere today [1]. The urbanization process, regarded as modernization, has become a severe problem, particularly in developing countries [2,3]. It’s the most human led land-use anthropogenic activity with huge and irreversible impacts on landscape [4,5]. Urban land-cover change threatens biodiversity and affects ecosystem productivity through loss of habitat, and carbon storage [6,7]. It has resulted in global climate change, and forest and soil degradation to the extent that the sustainability of our planet’s ecosystems is threatened [8]. Urbanization is generally influenced by national laws, plans, policies and poor governance in many developing countries [9,10]. Population growth increases the demand for natural resources, including land for construction, thus, human disturbances such as pollution, fire, grazing, cutting, and cultivation can also lead to spatial shift in land-use systems [11]. Because of various anthropogenic and natural factors, developing countries experience relatively more rapid urban growth and land-cover changes compared to developed countries [12]. Hence, urban planners and policy makers in developing countries face unprecedented challenges with regards to governing and planning due to the prevailing high dynamic change [13]. Knowledge on land-cover change, especially related to urban landscape transformation, can play a crucial role in the decision-making process and in reducing social and environmental impacts [14]. As monitoring land-cover change helps to develop an understanding of past trends and growth patterns, while based-simulation can provide insights into probable future developments [15,16].
Among the world’s urbanizing cities, coastal urban areas with the highest population density have become the most dynamic economic regions in the world [17,18]. Conakry, the capital of Guinea, is a coastal city that is characterized by a rapid urbanization process. As it is continuing to expand, there are numerous concerns about future urban sustainability [13,19]. While majority of the Guinea’s population resides in rural areas, however, the urban population is constantly increasing at an unprecedented rate. For instance, in 2014, the urban population was estimated at nearly 3.7 million, or 34.7% of the population, up from 30.6% in 1996 [20]. Nevertheless, Conakry the capital city concentrates more than half of this population and has experienced the highest growth since the country declared independence in 1958 [21]. Unplanned urbanization in Conakry has led to massive degradation of the natural landscape, and the alteration the climate patterns [22]. Previous urbanization study in Conakry had indicated that socioeconomic and physical factors were among the major drivers of Conakry’s rapid urban expansion [13]. Similarly, land-use and land-cover change studies in Conakry and its two neighboring cities (Coyah and Dubreka) has shown that these three cities were on the verge of being unified, because of the massive expansion in residential areas and the changing in socioeconomic realities, causing significant influences on land-cover change patterns [22]. On the other hand, Guinea, like many other West-Africa countries, the concentration of socioeconomic opportunities, and political power of the capital cities has led to the spatial imbalance among cities. For instance, it was indicated that approximately 50% of the urban dwellers in Mali are residents of the capital Bamako [23]. Unsustainable urbanization causes major difficulties for urban planning, particularly the provision of basic social services and infrastructure development.
Nevertheless, while rapid urbanization is continuing to exacerbate these issues, experiences from developed countries showed that urbanization has the potential to boost the national economy and improve the quality of life and social well-being of the urban population [24]. But, this requires accurate, consistent, and timely geospatial information on urban growth trends to assess current and future urban growth patterns [23]. Furthermore, to ensure that urban planning produces positive effects on the urban fabric and reduces social and environmental effects, urban planners ideally need a planning tool that has a capability of simulating the complexities of managed urban growth over the next coming years [25]. Geospatial information will be important for setting policies that promote inclusive and equitable urban, environmental, and socioeconomic development. Studying the spatial and temporal land-cover change in Conakry is urgently needed for promoting sustainable urban planning and improve the overall urban development process. Remote sensing data has emerged as one of the most useful data sources for quantitatively, spatially and temporally measuring land-cover change [21]. While a few studies on urban land-cover change in Conakry have been conducted, however, little is known about the future locations, magnitudes, and rates of the urban growth. This study aims to examine the spatial and temporal land-cover change in Conakry and simulate future land-cover patterns by 2025 based on the Geographic Information System (GIS) and Remote Sensing (RS) and Cellular Automata and Markov (CA-Markov) model. The results of this study will provide bases for assessing the sustainability and the management of the urban area and for taking actions to mitigate the degradation of the urban environment.
2. Materials and Methods
2.1. Study Area
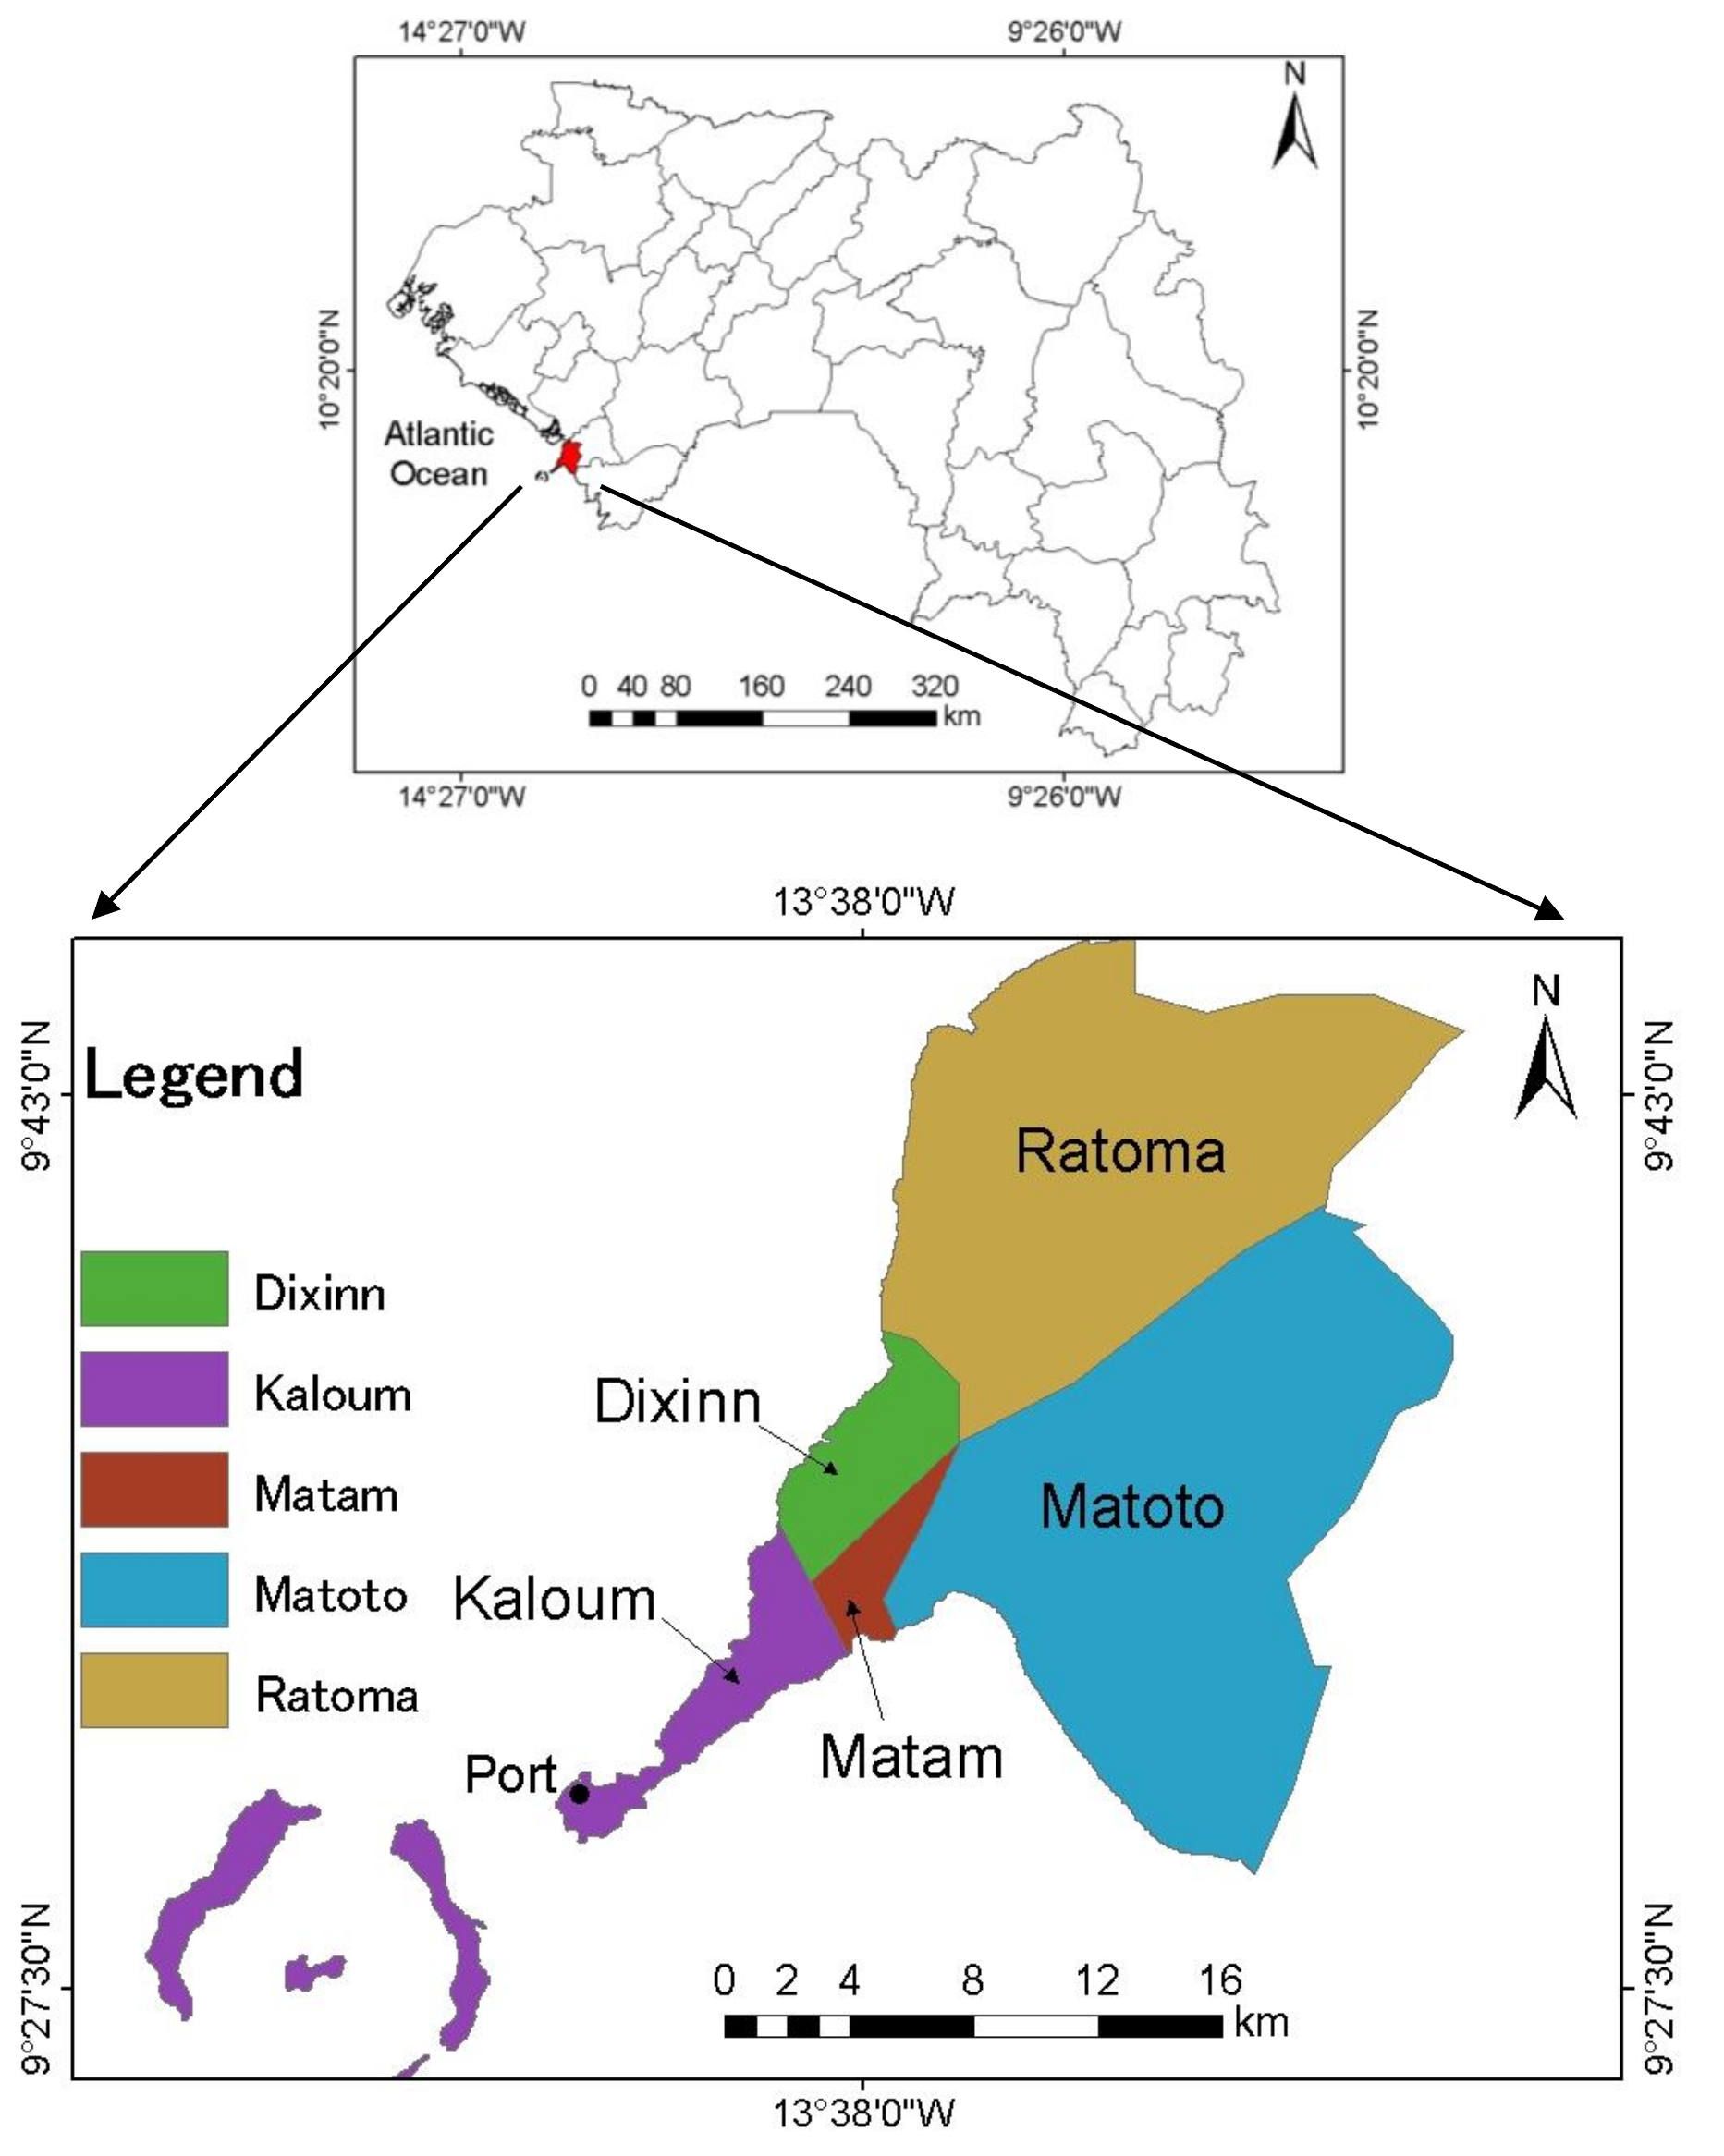
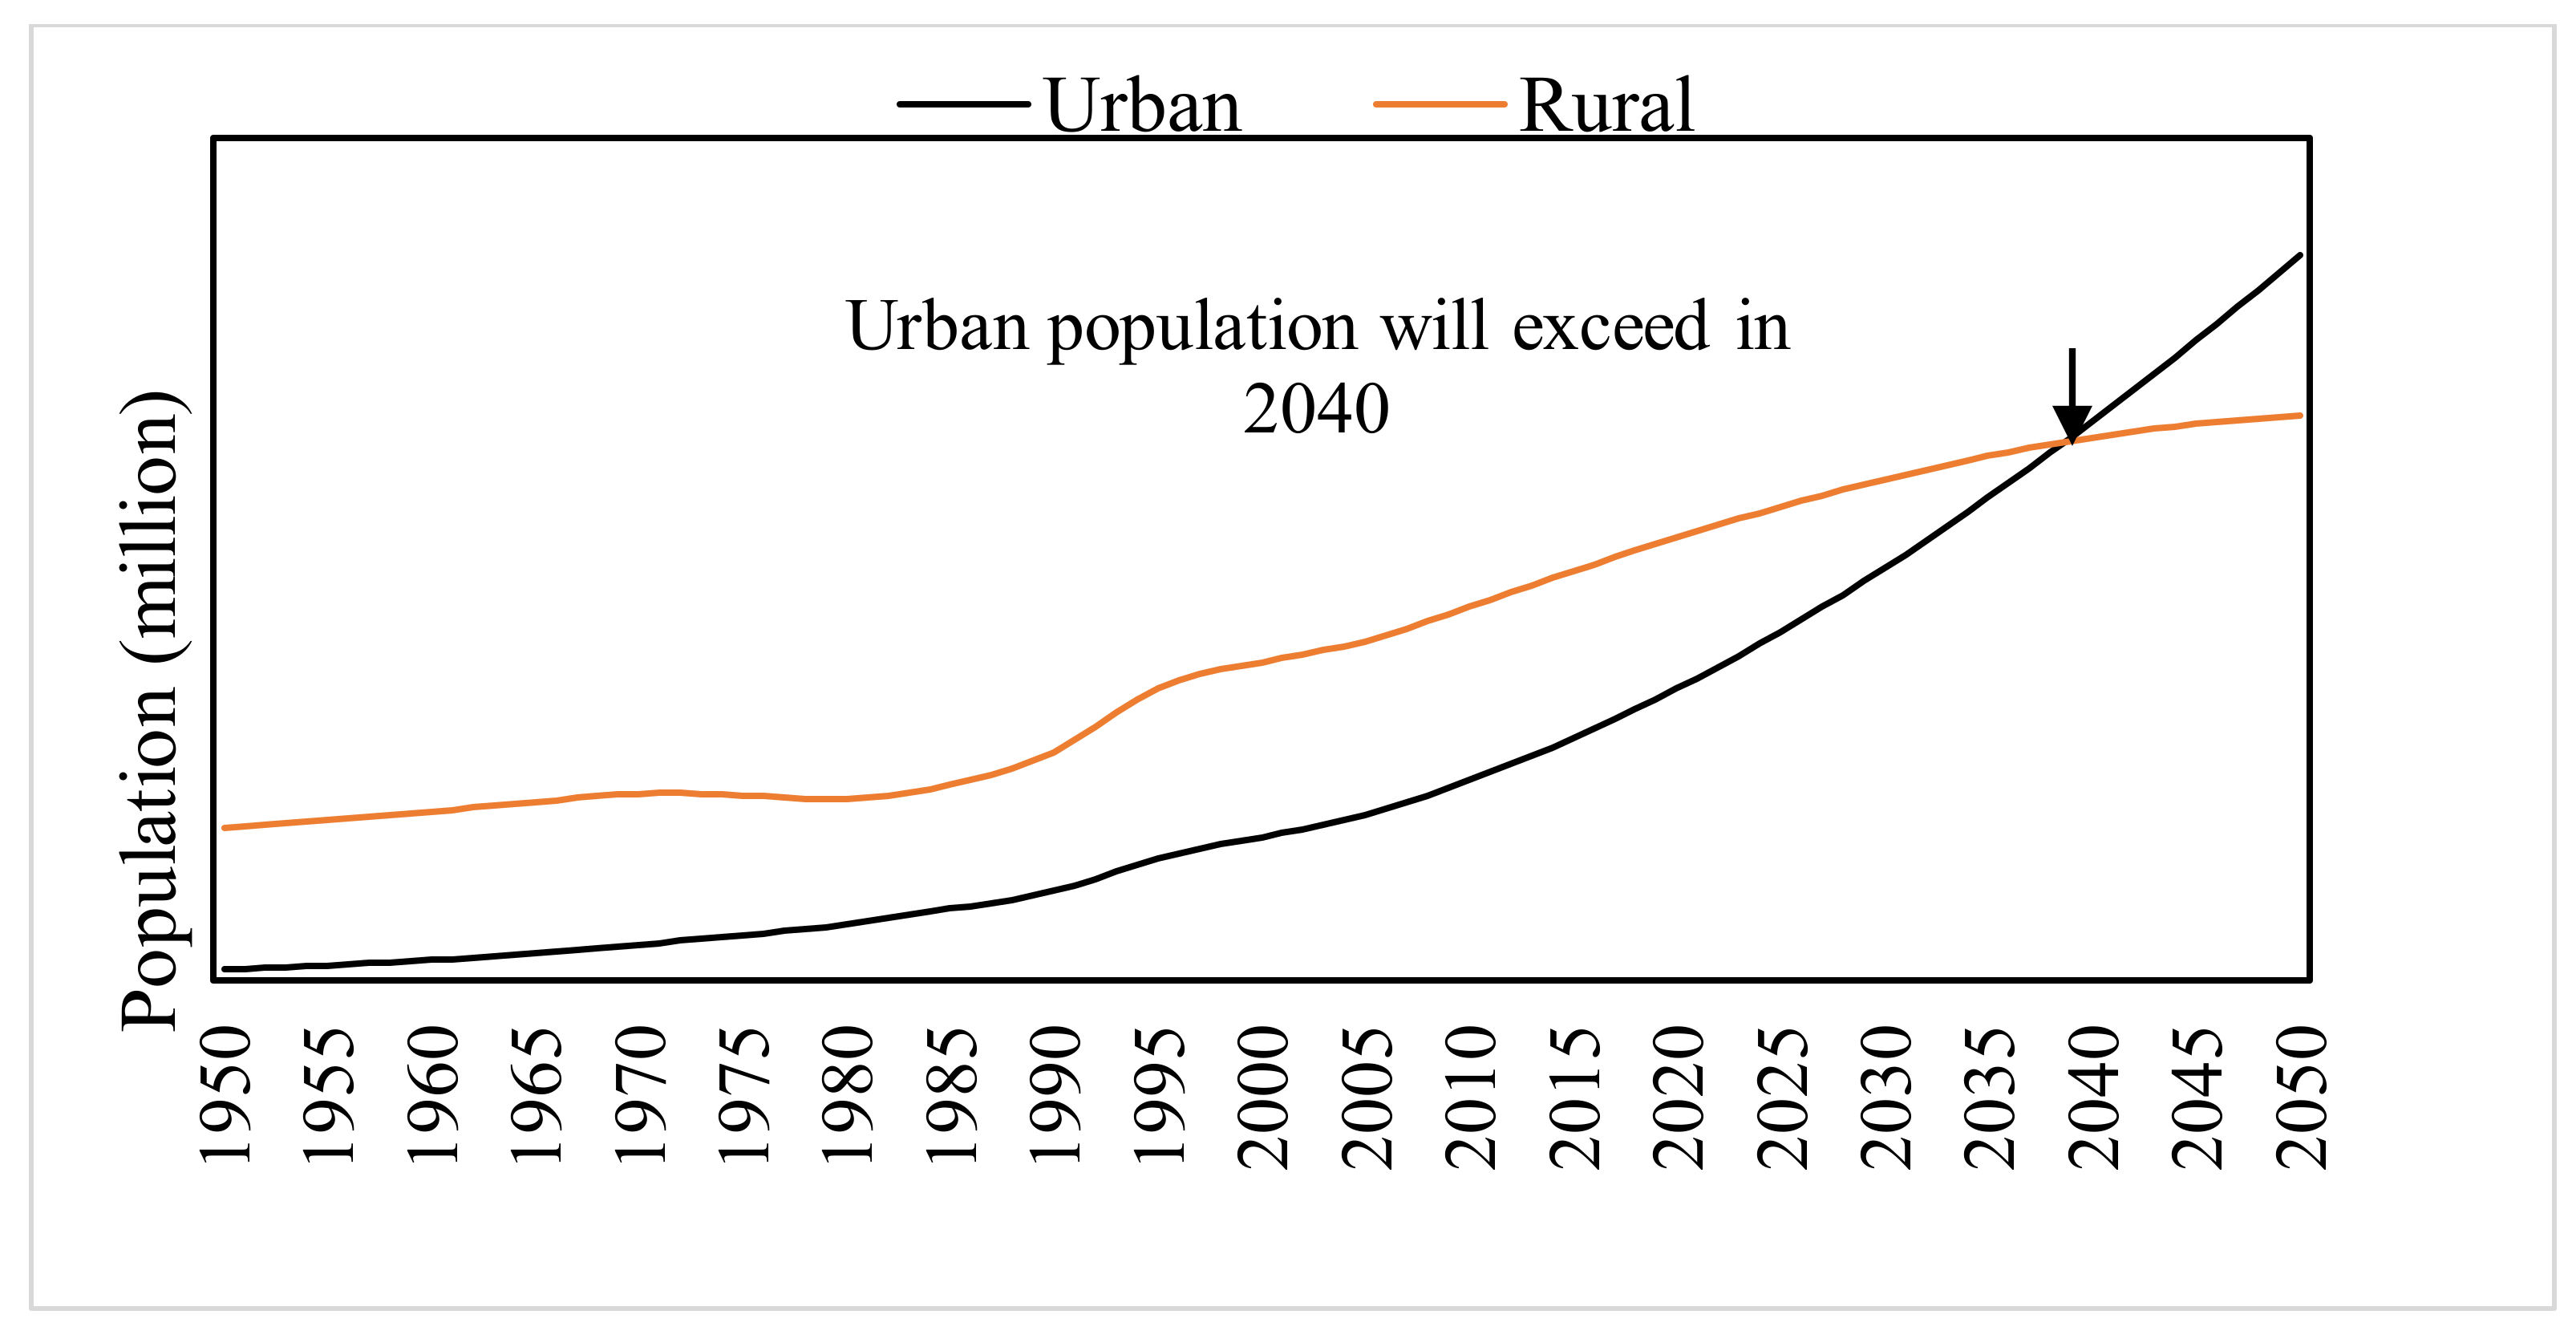
Conakry is in the coastal region of Guinea between 9°34′30″ N latitude and 13°34′30″ W to 13°45′0″ W longitude (Figure 1). It is the largest and the most rapidly urbanized city in the country [13]. According to the latest population census, 2 million of Guinea’s population was living in Conakry in 2014 [26]. Its total area is approximately 420 km2. However, due to its small land area and relatively high population dynamic, Conakry has created an infrastructure burden and shows great imbalance in the urban network. The city is administratively divided into five communes, three downtown communes: (1) Kaloum, (2) Dixinn, and (3) Matam and two suburban communes (4) Ratoma, and (5) Matoto (Figure 1). Conakry’s rapid urbanization and urban expansion can also be attributed to the accumulation of it is administrative, economic, and cultural functions [22]. As a capital and the only sizeable international harbor (an outlet for bauxite exports), the city remains the location of rare industries, and has the main educational institutions, despite long-standing efforts at decentralization [27]. The economy of Conakry revolves largely around the port (Figure 1). Future projections of the urban and rural population trends in Guinea show that the urban population is expected to dramatically increase (Figure 2), and Conakry with the highest growth rate would be the most affected. Thus, studies on the spatial and temporal urban land-cover change will be important for setting policies that promote sustainable urban development in Conakry. The climate of Conakry is characterized by two alternating seasons (dry and wet). The highest temperature is recorded between March and April, while the temperature reaches 38 °C and the lowest temperature is registered between November and December with the temperature around 25 °C [22]. The terrain is characterized by estuaries and littoral plains and ranges between 0 and160 m above the sea level. The Vegetation consists of palm trees, mangrove in the marshy zones, coconuts trees, some grassland, and primary forest formations in some places.
2.2. Data
Remote sensing data has emerged as one of the most prominent data sources for quantitatively, spatially and temporally monitoring land-cover change [28,29]. The dynamic land-cover change process can be explored by using a temporal series of remote sensing data, while census data provide a statistical view of demographics and socio-economic [30]. To examine the spatial, temporal land-cover change and simulate future land-cover change in Conakry, three Landsat images were used. Table 1 provides detailed information related to each Landsat data. The choice of these data was primarily based on their free availability, very high-quality satellite imagery (clear and nearly free of cloud), and these selected years correspond with a period of rapid urbanization and urban expansion in Conakry [13]. In addition to the Landsat data, a boundary shapefile of Conakry was acquired from the global administrative area www.gadm.org/country for image processing and classification.
2.3. Image Processing
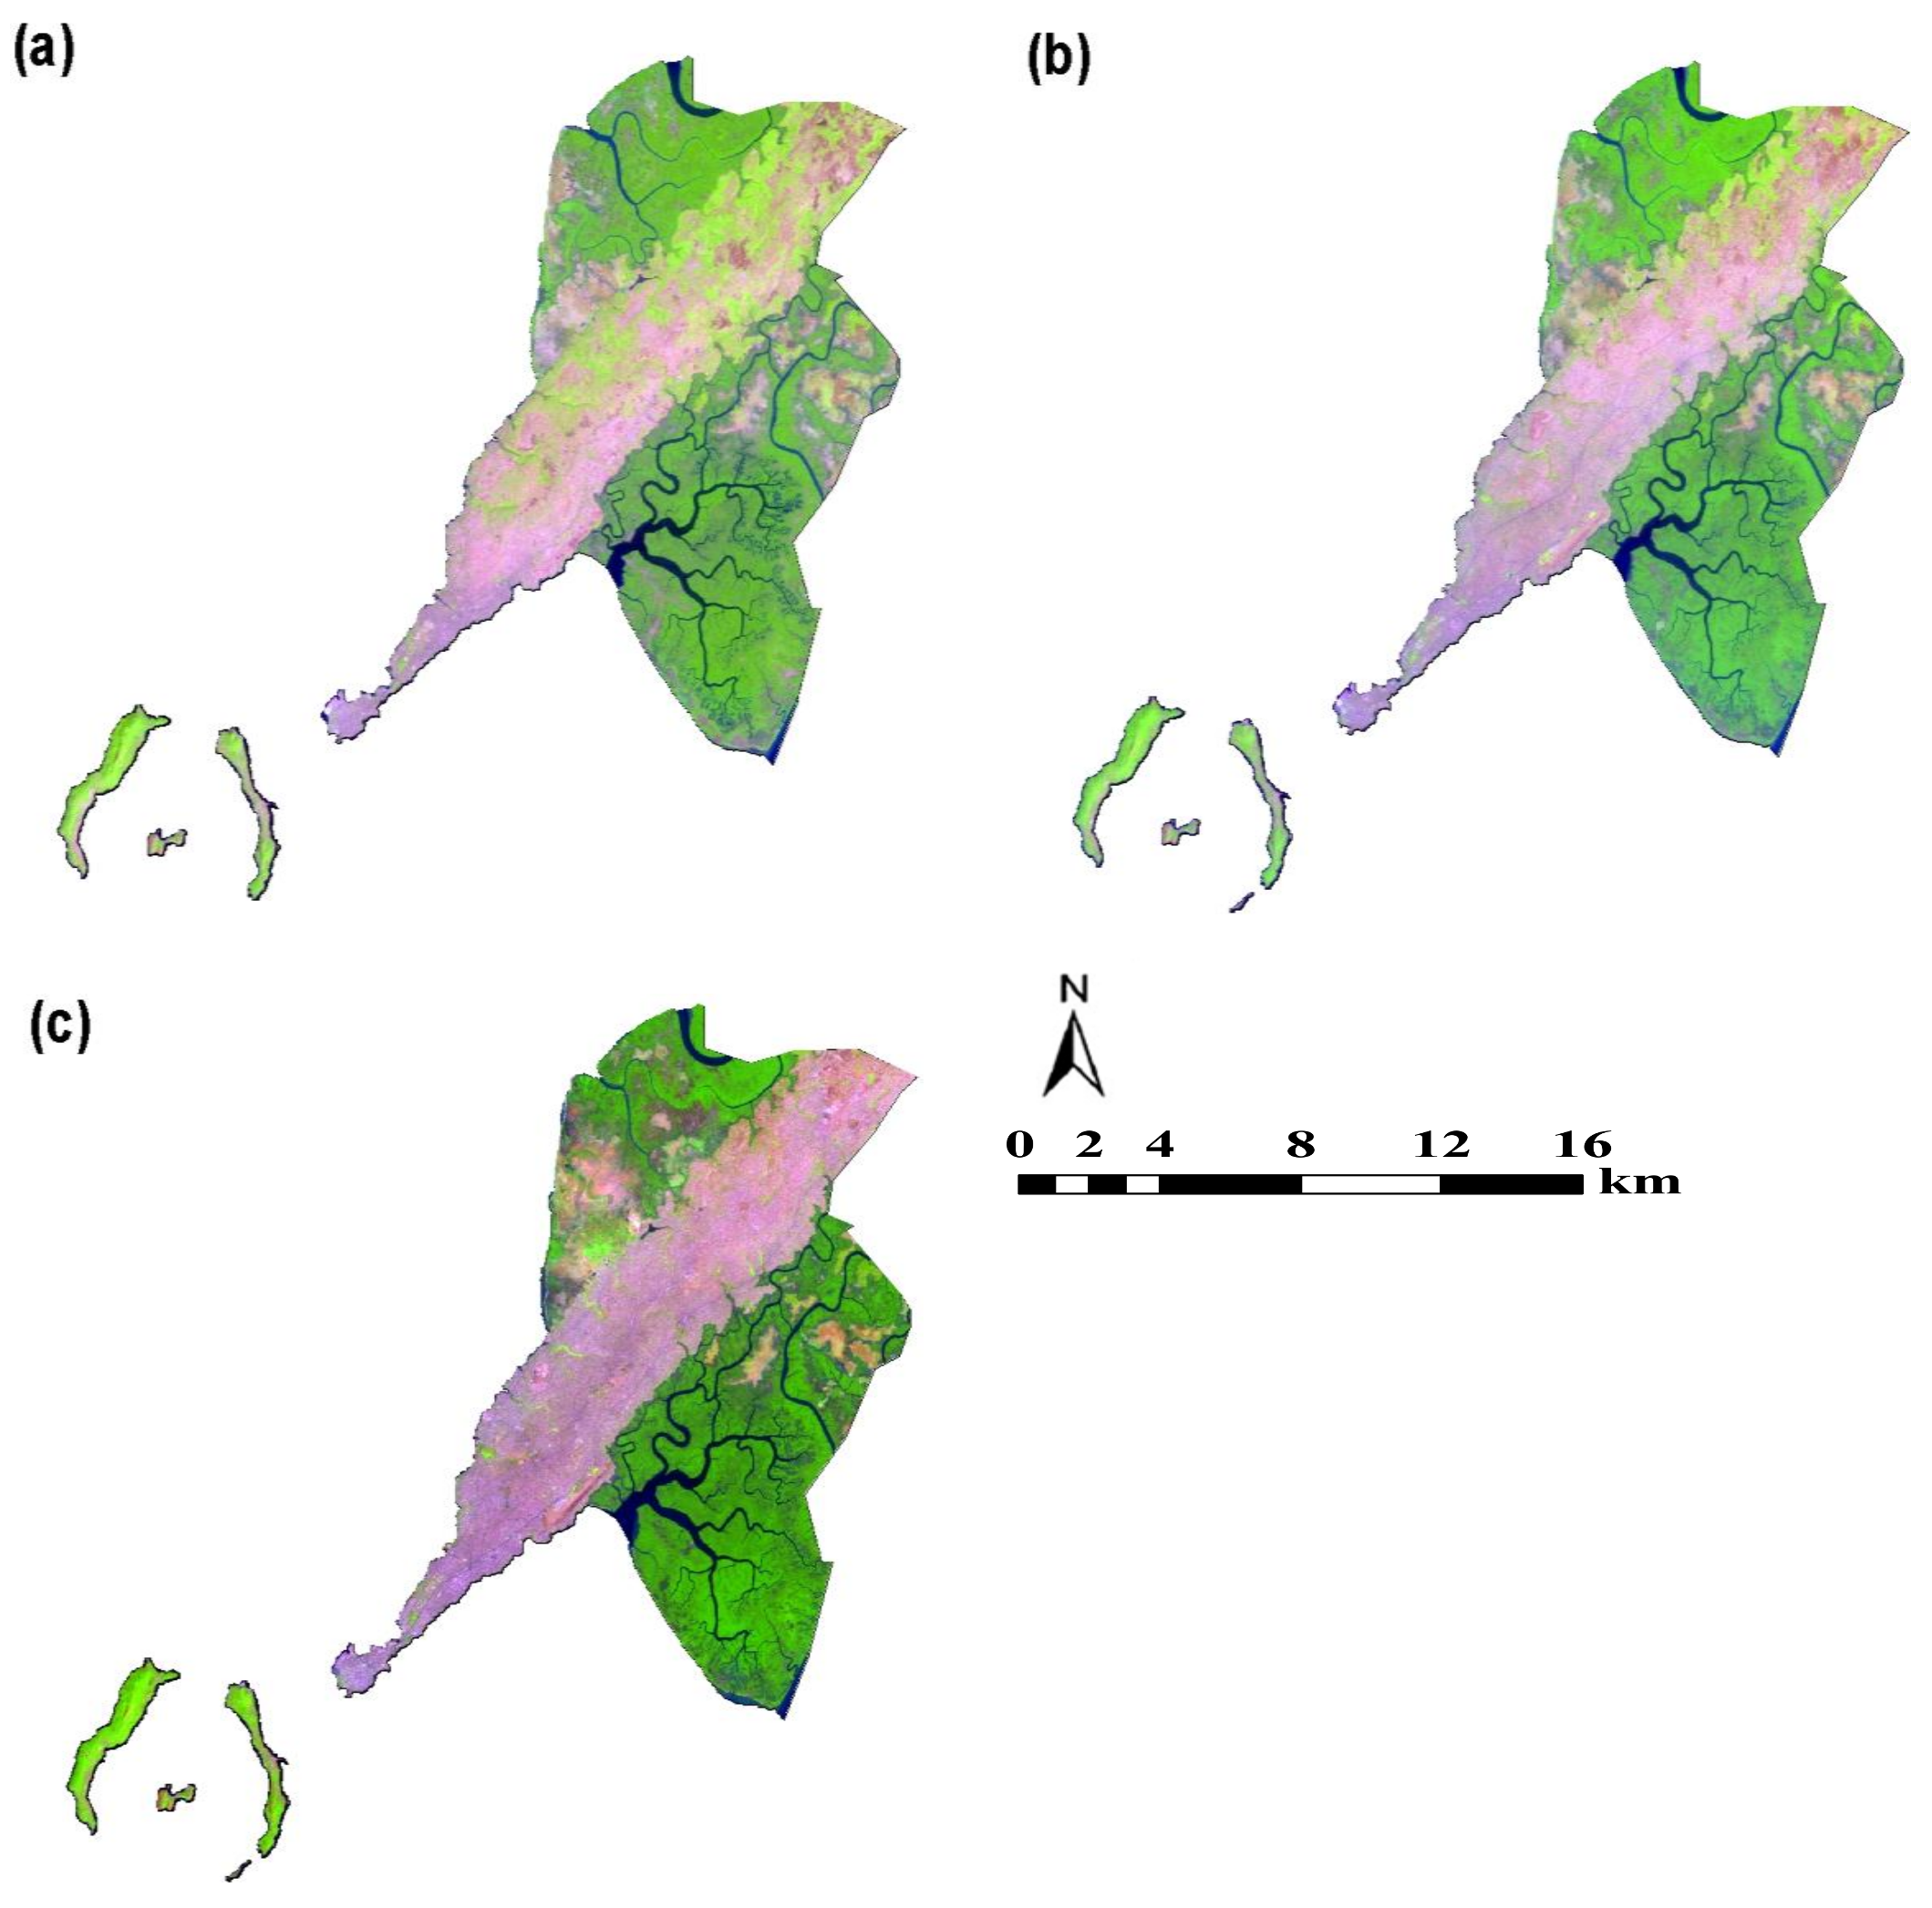
Due to the complex land-cover heterogeneity in the study area, image pre-processing and enhancement was fundamental to reduce or eliminate confusion between different spectral signatures, and improve the overall images classification process. The First-Line of-sight Atmospheric Analysis of Spectral Hypercube (FLAASH) model was used to enhance radiometric and atmospheric correction using the ENVI 5.3 software (Harris Geospatial, Broomfield, CO, USA). For the geometric correction, the common Universal Transversal Mercator (UTM) 28N zone projection was applied to all images. Next, the three images were then imported into the Earth Resources Data Analysis System (ERDAS) to match, by means of an image-to image matching method, then resampled using the nearest neighbor algorithm with a root mean square error of less than ±0.5 pixel per image to a 30-m spatial resolution. The study area was then extracted from the temporal imagery by overlaying the boundary of the city on visible and infrared bands of Landsat data in ArcMap10.2 (Esri, Redlands, CA, USA). Prior to image classification using a supervised classification algorithm, unsupervised classification and the Normalized Difference Vegetation Index (NDVI) were computed to help in selecting appropriate polygons as training sites and to improve the overall classification process. Figure 3 shows the red, green, and blue (RGB) false color combination of these Landsat images. This false color combination provides a user with great amount of information and color contrast for identifying and discriminating features in the study area.
2.4. Image Classification
The classification scheme was established based on ancillary information of field survey, local knowledge of the study area and visual image interpretation. The image classification was conducted using the maximum likelihood classification (MLC) algorithm, which is a supervised classification, and one of the most widely applied parametric classification algorithm [31,32]. A supervised classification, per [33], is where the user develops the spectral signatures of known categories, such as urban or non-urban, and then the software assigns each pixel in the image to the cover type to which its signature is most comparable. For each land-cover class, 50 polygons were digitized based on the visual interpretation of locations on Google Earth and on the image, itself. The pixels in the polygons that were selected as representative of each class were plotted in spectral space and a visual check was made that all classes could be separated in at least one combination of bands. The choice of classification method depends on the data available, knowledge about the area under investigation, and if the land-cover composition of the study area is known from field work or from other sources [34]. Nevertheless, when there is not enough knowledge of land-cover classes, unsupervised classification may be essential [25]. Considering the spectral characteristics of the satellite images, and the existing knowledge of the study area, four land-cover categories, namely (1) Urban, (2) Water, (3) Vegetation, and (4) Bare ground, were respectively identified and classified for 1986, 2000 and 2016. Table 2 shows the description of each land-cover class considered in this study.
2.5. Accuracy Assessment of the Land-Cover Classification
Accuracy assessment is a key step of any classification project, as it compares the classified image to another source that is assumed to be accurate [35]. This process is achieved by computing an error matrix. An error matrix is a table of values that compares the value assigned during the classification process to the actual value from an image that is assumed to be correct [34]. A key component of accuracy assessment, Cohen’s kappa coefficient is calculated from error matrix. Kappa tells us how well the classification process was performed as compared to just randomly assigned values. In this study, both ground control points and Google Earth images were used during the accuracy assessment process. At least 200 ground control points were collected using a handled Garmin Global Positioning System (GPS), during the field survey. In addition, a random generator in Arc Map was used to generate a random of 200 pixels (50 pixels from each class), following the recommended minimum sample size of 50 random points for each land-cover class. The comparison between the classified results and reference data was carried out statistically using error matrices. Kappa test was also performed for each land-cover map. Table A1, Table A2 and Table A3 in the Appendix A show the results of accuracy assessment.
2.6. Future Land-Cover Change Based on CA-Markov Chain
In this study, the 2016 land-cover map was firstly simulated by calculating the transition probability matrix using land-cover maps of 1986 and 2000 in IDRISI software (Clark University, Worcester, MA, USA). The transition probability matrix records the probability that each land-cover category will change to every other category [36]. This matrix is the result of cross-tabulation of the two images adjusted by the proportional error [37]. The transition areas matrix records the number of pixels that are expected to change from one land-cover class to another land-cover class over the next time [33]. This matrix is produced by multiplication of each column in the transition probability matrix by the number of cells of corresponding land-cover in the later image [38]. In both files, the rows represent the older land-cover categories and the columns represent the newer categories [39]. Markov model is developed into an essential predictive approach in geographic research and due to its features of descriptive power, simple trend simulation of land-cover transition [40]. Let be a vector of land-cover distribution at time . The land-cover distribution at time , is given by Equation (1)
where: M is an transition matrix whose elements is the probability of transition from one land-cover to j within the interval to . The is usually derived by diving each element in the change/no change matrix by its marginal row total Equation (2) [38].
The distribution of each land-cover type after n time periods is made powering matrix M Equation (3)
A major advantage of the Markov model is its operational simplicity and the ability to simulate land-cover change with minimum data requirements [38]. This is particularly relevant for the study area, because historical data on land-cover is virtually nonexistent. Once a transition matrix has been created, it only requires the current land-cover information to simulate future land-cover distribution [40]. In this study, the transition function was determined based on the difference between land-cover maps of 2000 and 2016. The CA-Markov then used this transition function to simulate the land-cover for 2025. In order words, the transition probability matrix, created from the changes observed between 2000 and 2016, the transition probability maps of 2016 and each scenario were used to produce maps of the land-cover for 2025. In an iterative process, CA-Markov uses the transition probability maps of each land-cover type to establish the inherent suitability of each pixel to change from one land-cover to another [37]. To assign a weight of suitability to the pixels that are away from the pixel analyzed, a 5 × 5 filter was used. Since it is considered that the probability of changes during the year’s analysis stays constant, any year after 2016 can be projected [33]. However, simulations in the short term are more realistic than simulations in the long term [24,25], so we simulated until 2025.
3. Results
3.1. Land-Cover Classification
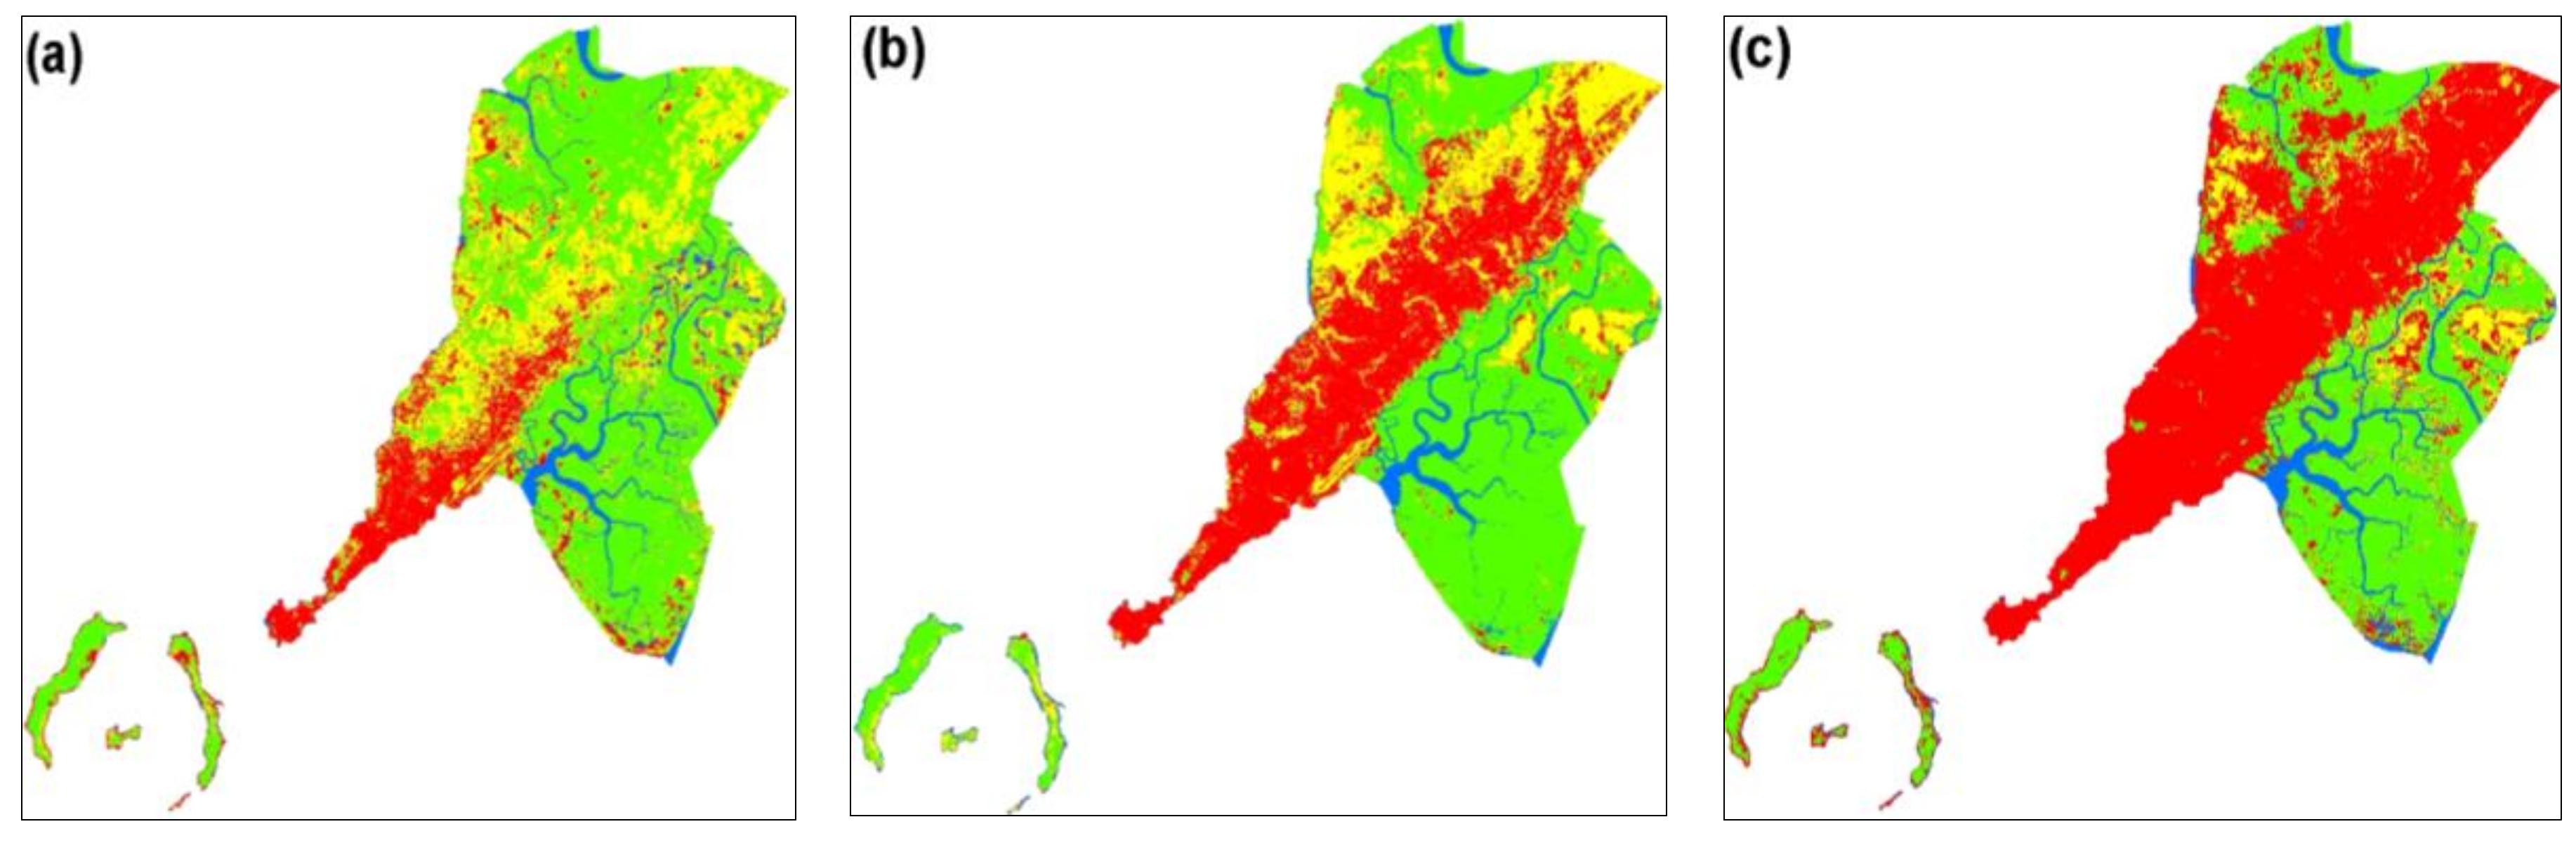
To examine the spatial and temporal land-cover change in Conakry, post-classification analysis through pixel by pixel comparison was performed in Arc Map10.2 (Esri, Redlands, CA, USA). using classified maps of 1986, 2000 and 2016 respectively. From the overall trends, the intense land-cover change occurring in Conakry was mainly characterized by a significant increase in urban area and a substantial decrease in vegetation and bare ground. Vegetation class (i.e., mangrove forests, high vegetation, reserved forest, non-reserved forest) was the most dominant land-cover type in 1986 representing 51% of the total area; followed by bare ground (27%) (i.e., fallow land, bare exposed, parks, shrubs, area and transition), urban (i.e., residential, commercial, industrial, transportation, utilities, communication) (15%), and water (5%) (i.e., rivers, lakes, ponds, reservoirs, and other water bodies), respectively. The area under vegetation decreased from 52% (217.48 km2) in 1986 to 35% (147.32 km2) in 2016, with an annual decrease rate of 0.57% in the first period (1986–2000) and 0.50% in the second period (2000–2016) respectively. The area under bare ground area decreased from 27% (114.76 km2) in 1986 to 9% (39.88 km2) in 2016, with an annual decrease rate of 0.35%, in the first period (1986–2000) and 0.81% in the second period (2000–2016). The area under urban development has increased from15% (63.03 km2) in 1986 to 49% (206.58 km2) in 2016 with an annual increase rate of 1% in the first period (1986–2000) and 1.25% in the second period (2000–2016) respectively. The area under water showed a slight increase from 5% (24.63 km2) in 1986 to 6% (26.10 km2) in 2016, maybe due to seasonal variation and the geographical location of the study area, as a coastal city. Figure 4 shows the land-cover change maps in 1986, 2000 and 2016 respectively.
3.2. Markov models and the transition probability matrices
Table 3 and Figure 5 show the transition probability matrix and the conditional probability to urban respectively. This was obtained based on the simulation of land-cover maps of 1986 and 2000. The transition probability matrix records the number of pixels anticipated to change from one land-cover category to another. From Table 3, the diagonal elements represent the no-change probability of transition. Probability of transition from water to urban is 0.016, probability of transition from vegetation to urban is 0.326 and the probability of transition from bare ground to urban is 0.127 respectively. This result clearly illustrates that vegetation land-cover had the highest probability of transition to urban.
3.3. Accuracy Assessment of the Simulated Markov Model Based on ROC
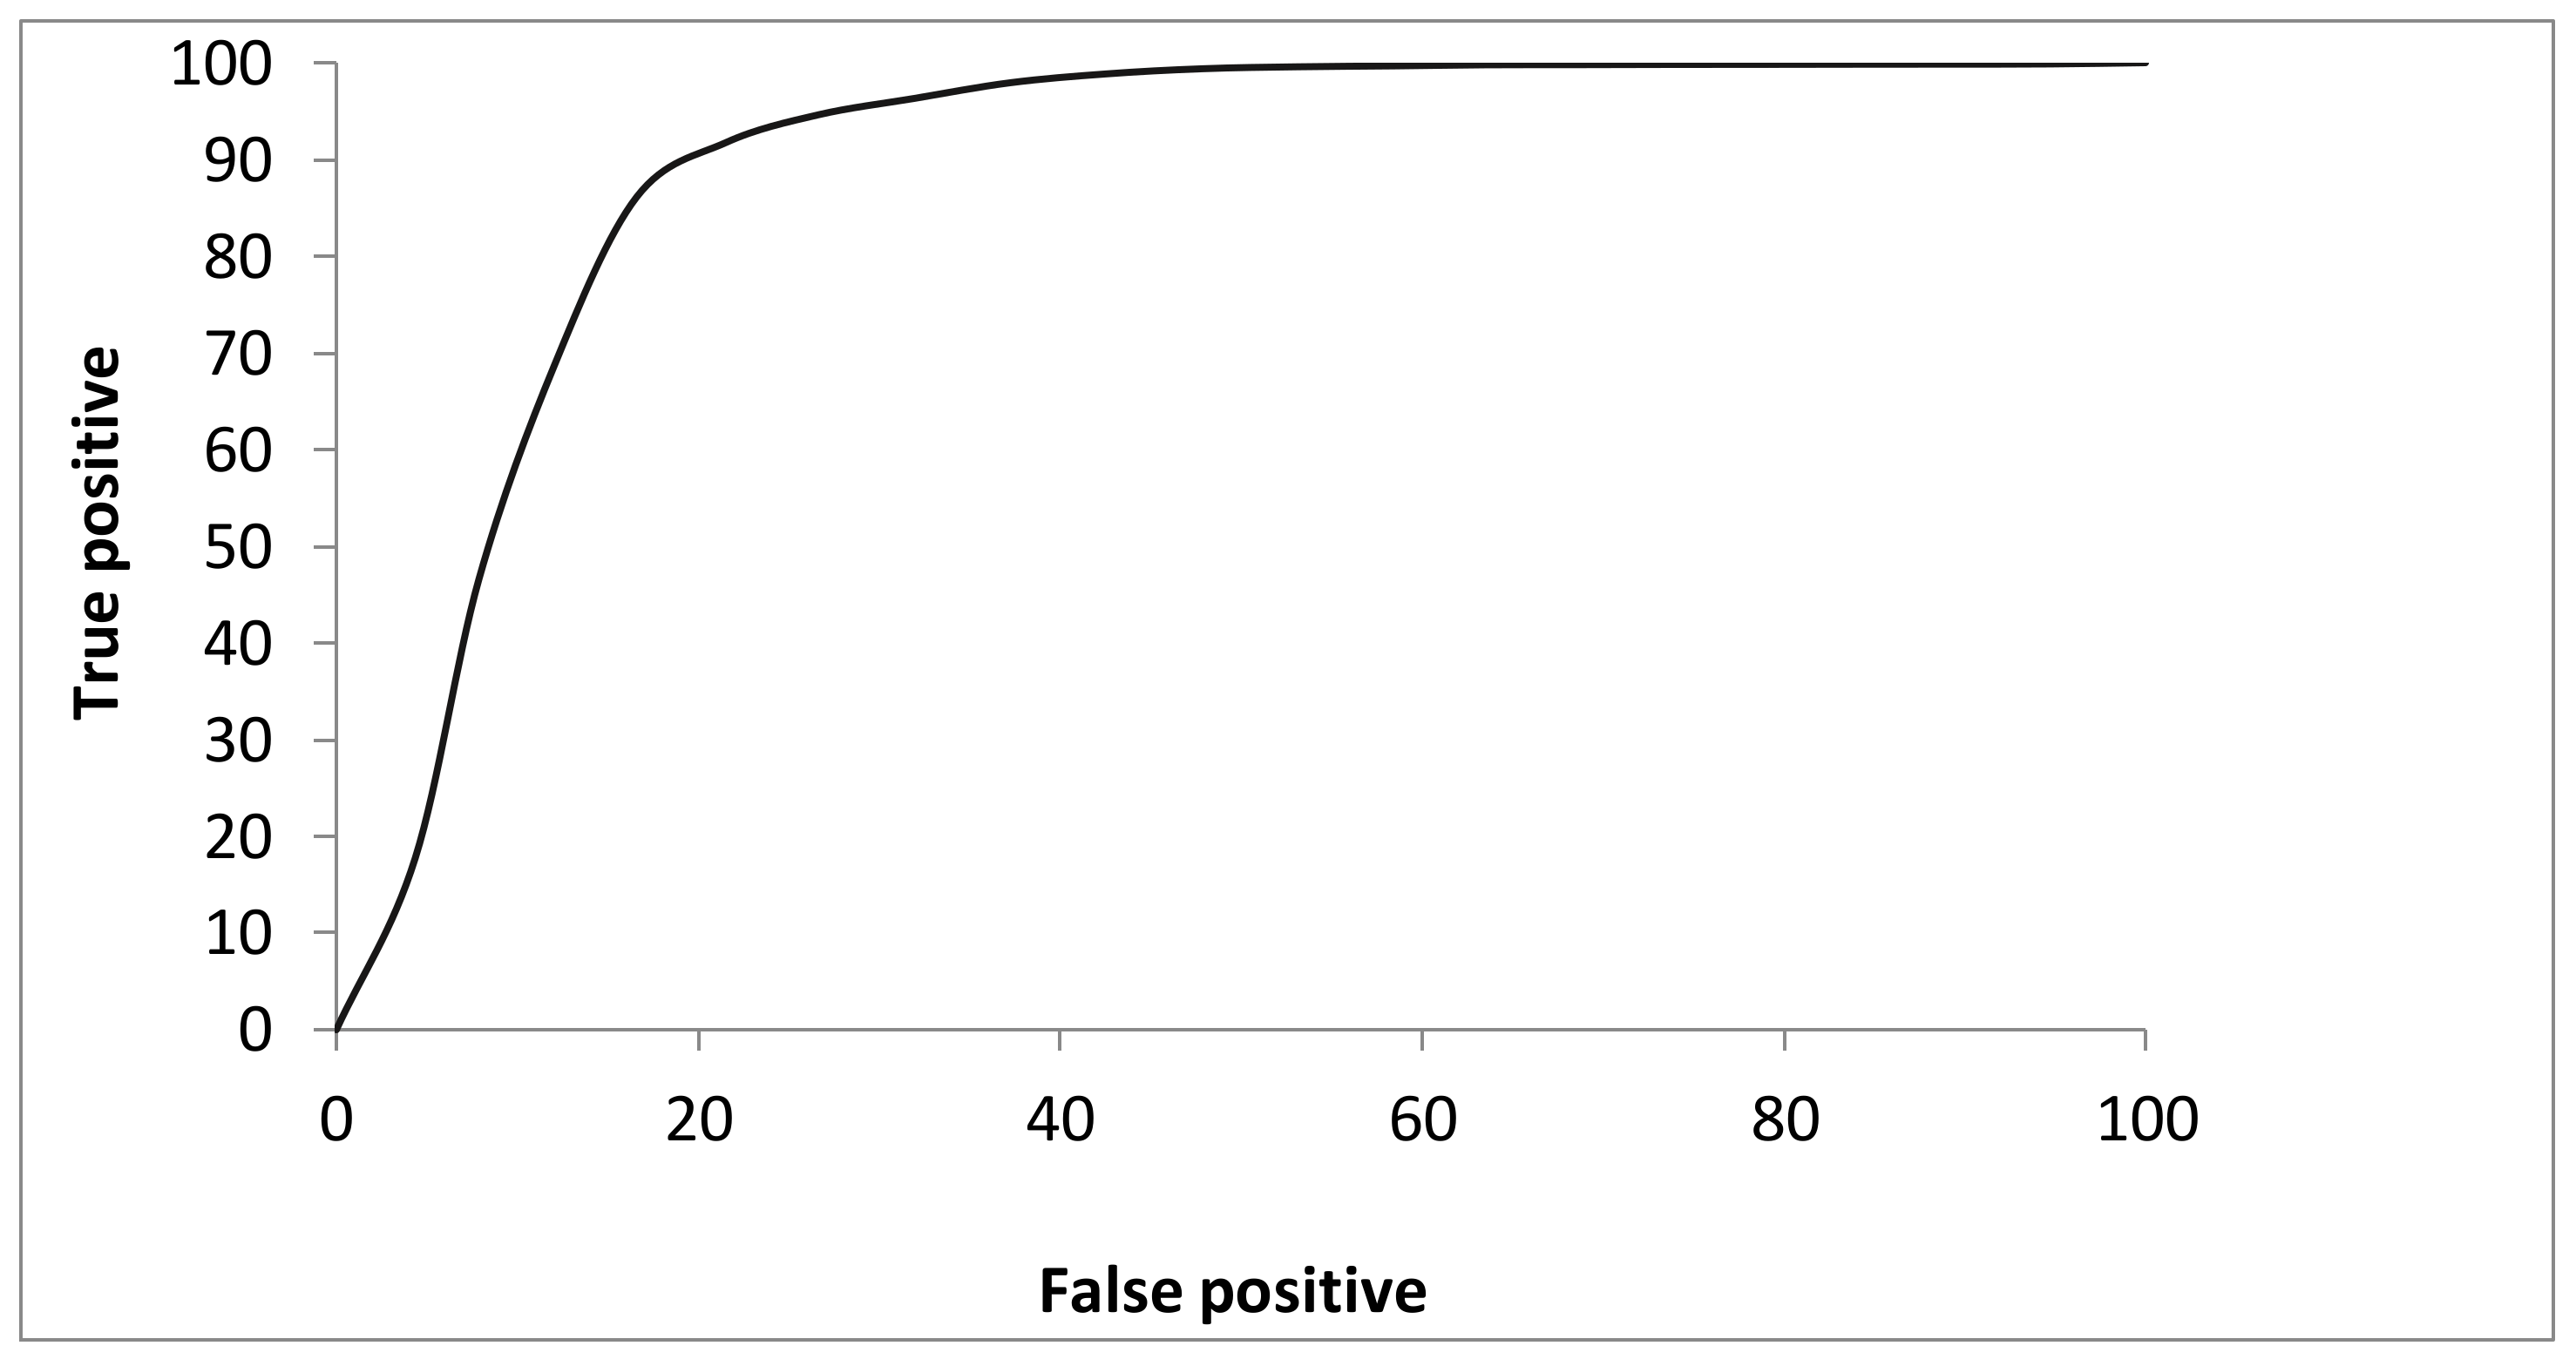
The ROC (relative operating characteristic) is an excellent method to compare a Boolean map of “reality” versus a suitability map [33]. Thus, the ROC is included here as an excellent statistical method for measuring the goodness of fit of the simulated Markov model map in this case the Markovian probability of transition to urban (Figure 5), and the binary urban growth map between 2000 and 2016 (Figure 6). The binary map illustrates cells status that have changed from non-urban to urban (1, and 0). The ROC values range between 0 and 1, where 1 indicates a perfect fit and 0.5 indicates a random fit [41]. In this study, the ROC exhibited an accuracy value of 0.92, indicating a very good agreement between the two maps. The ROC curve is shown in Figure 7.
3.4. Simulated Land-Cover Map of Conakry by 2025 Based on CA-Markov Model
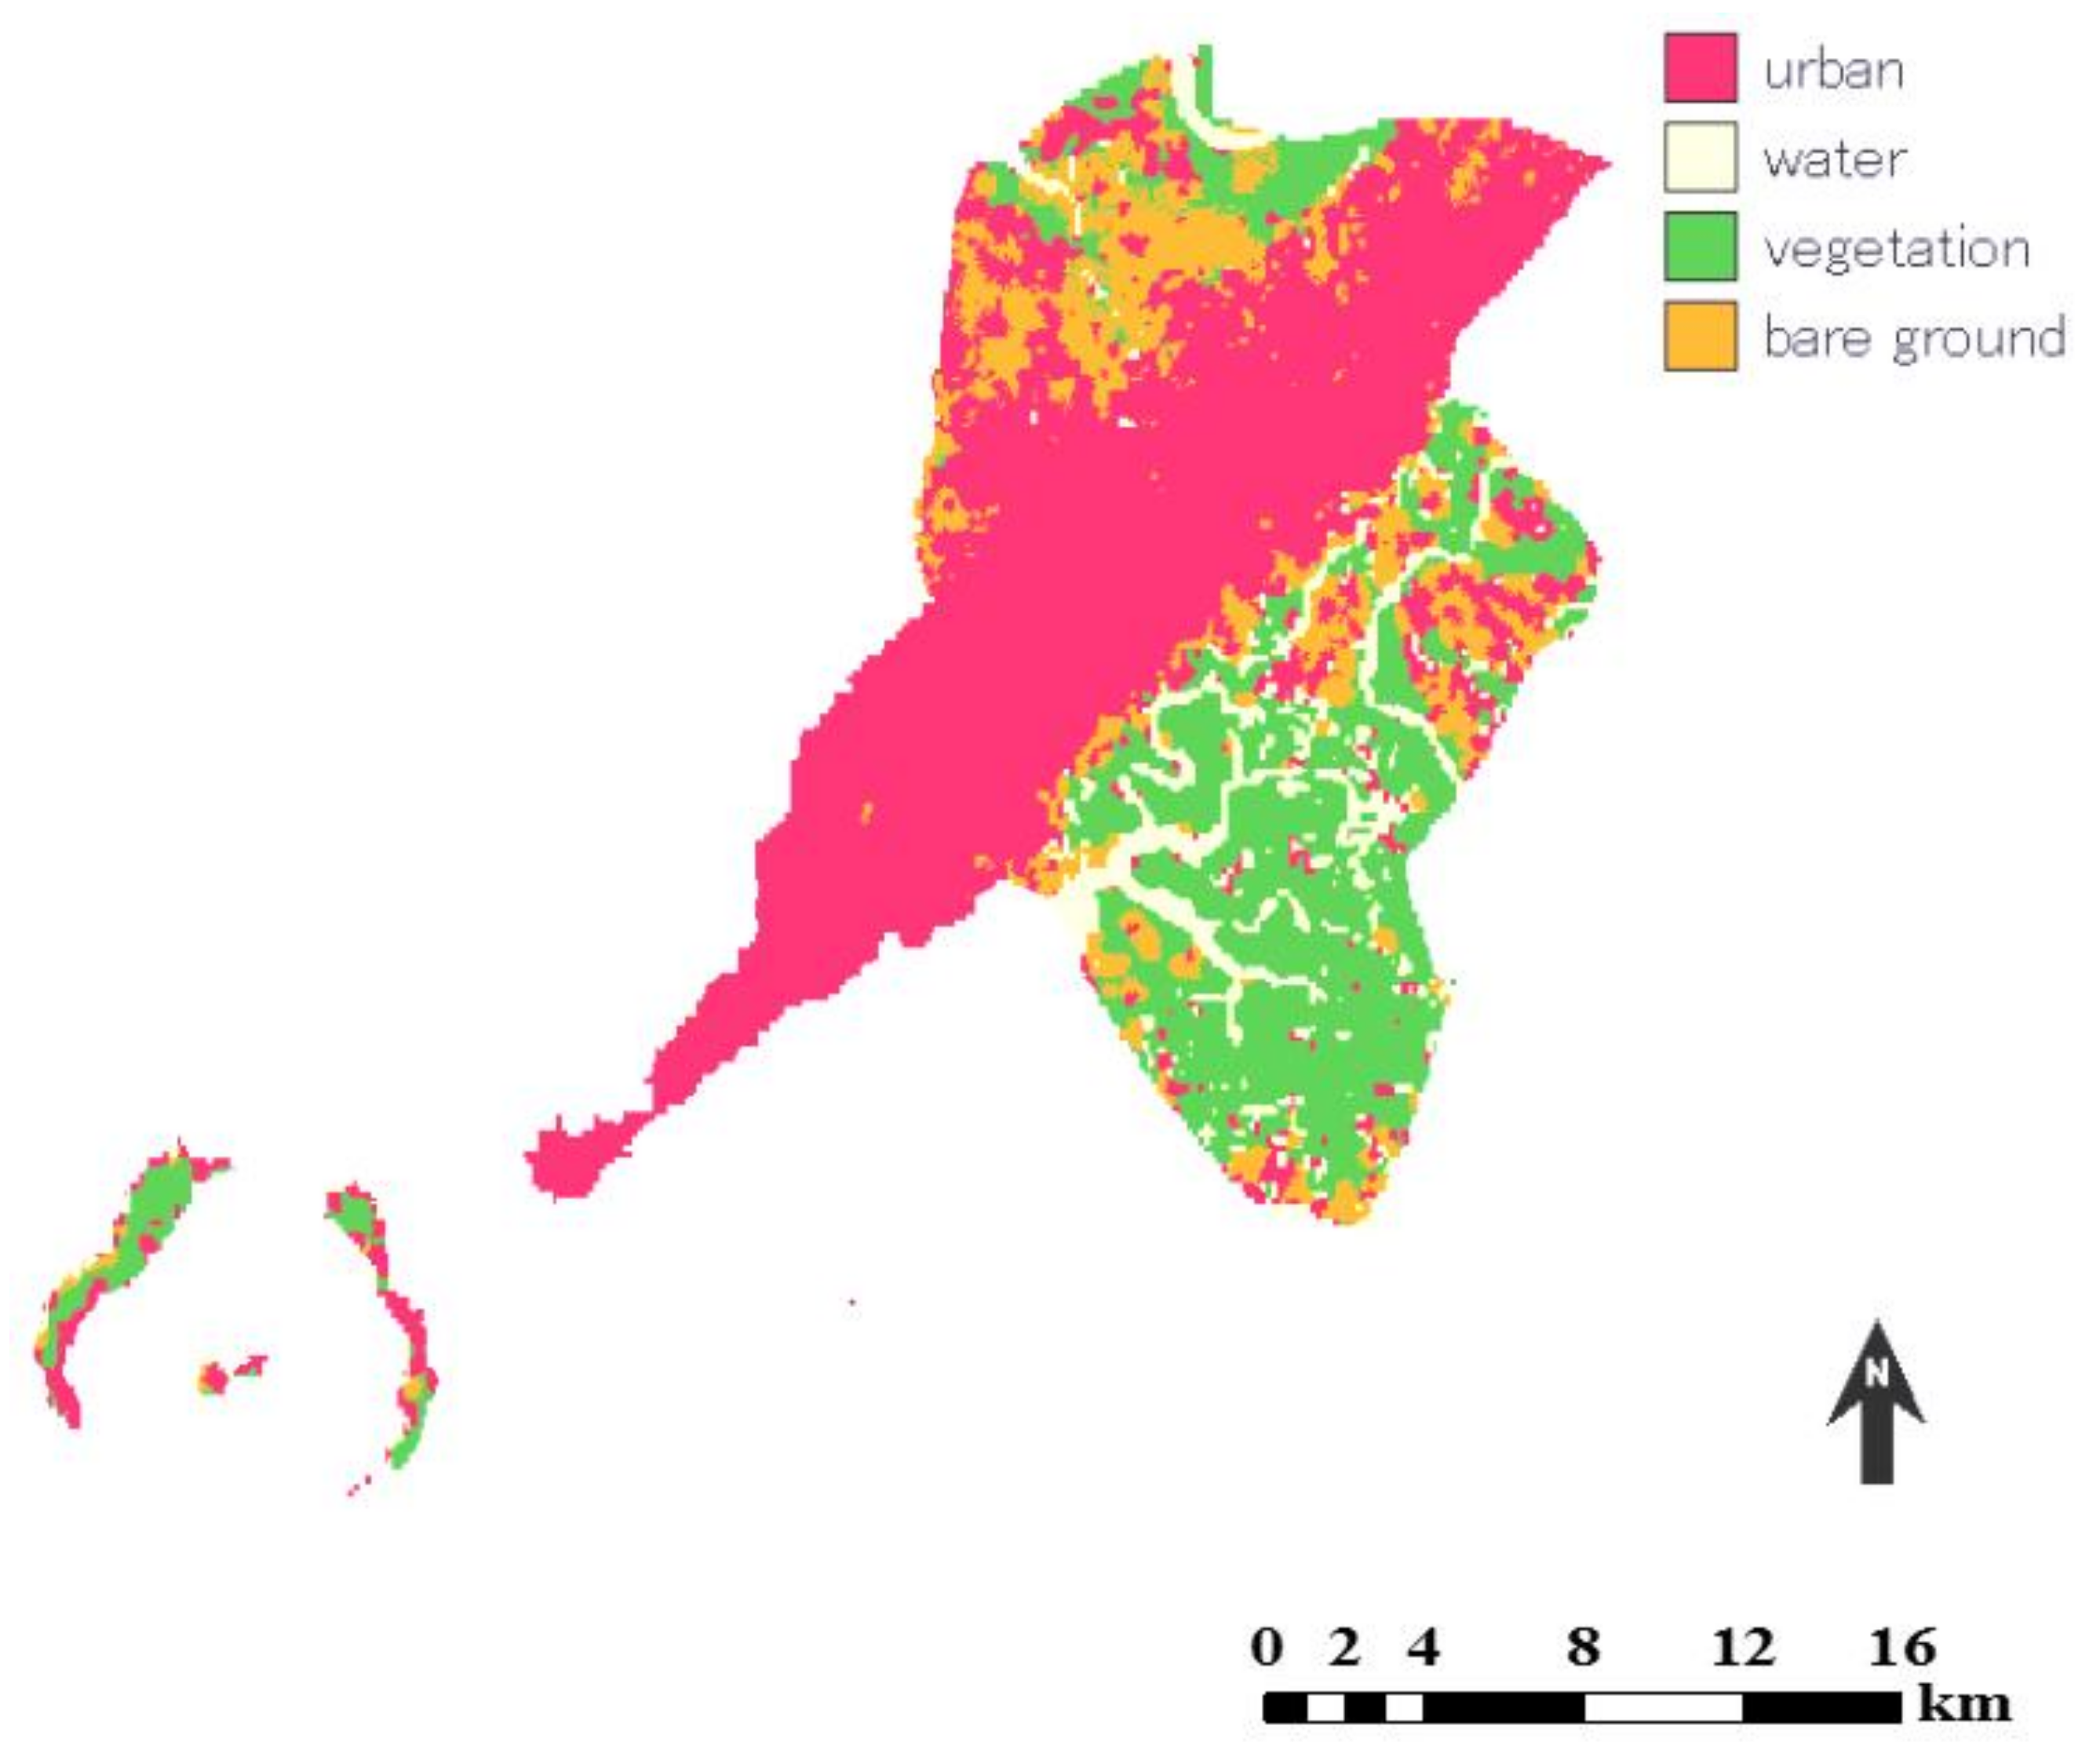
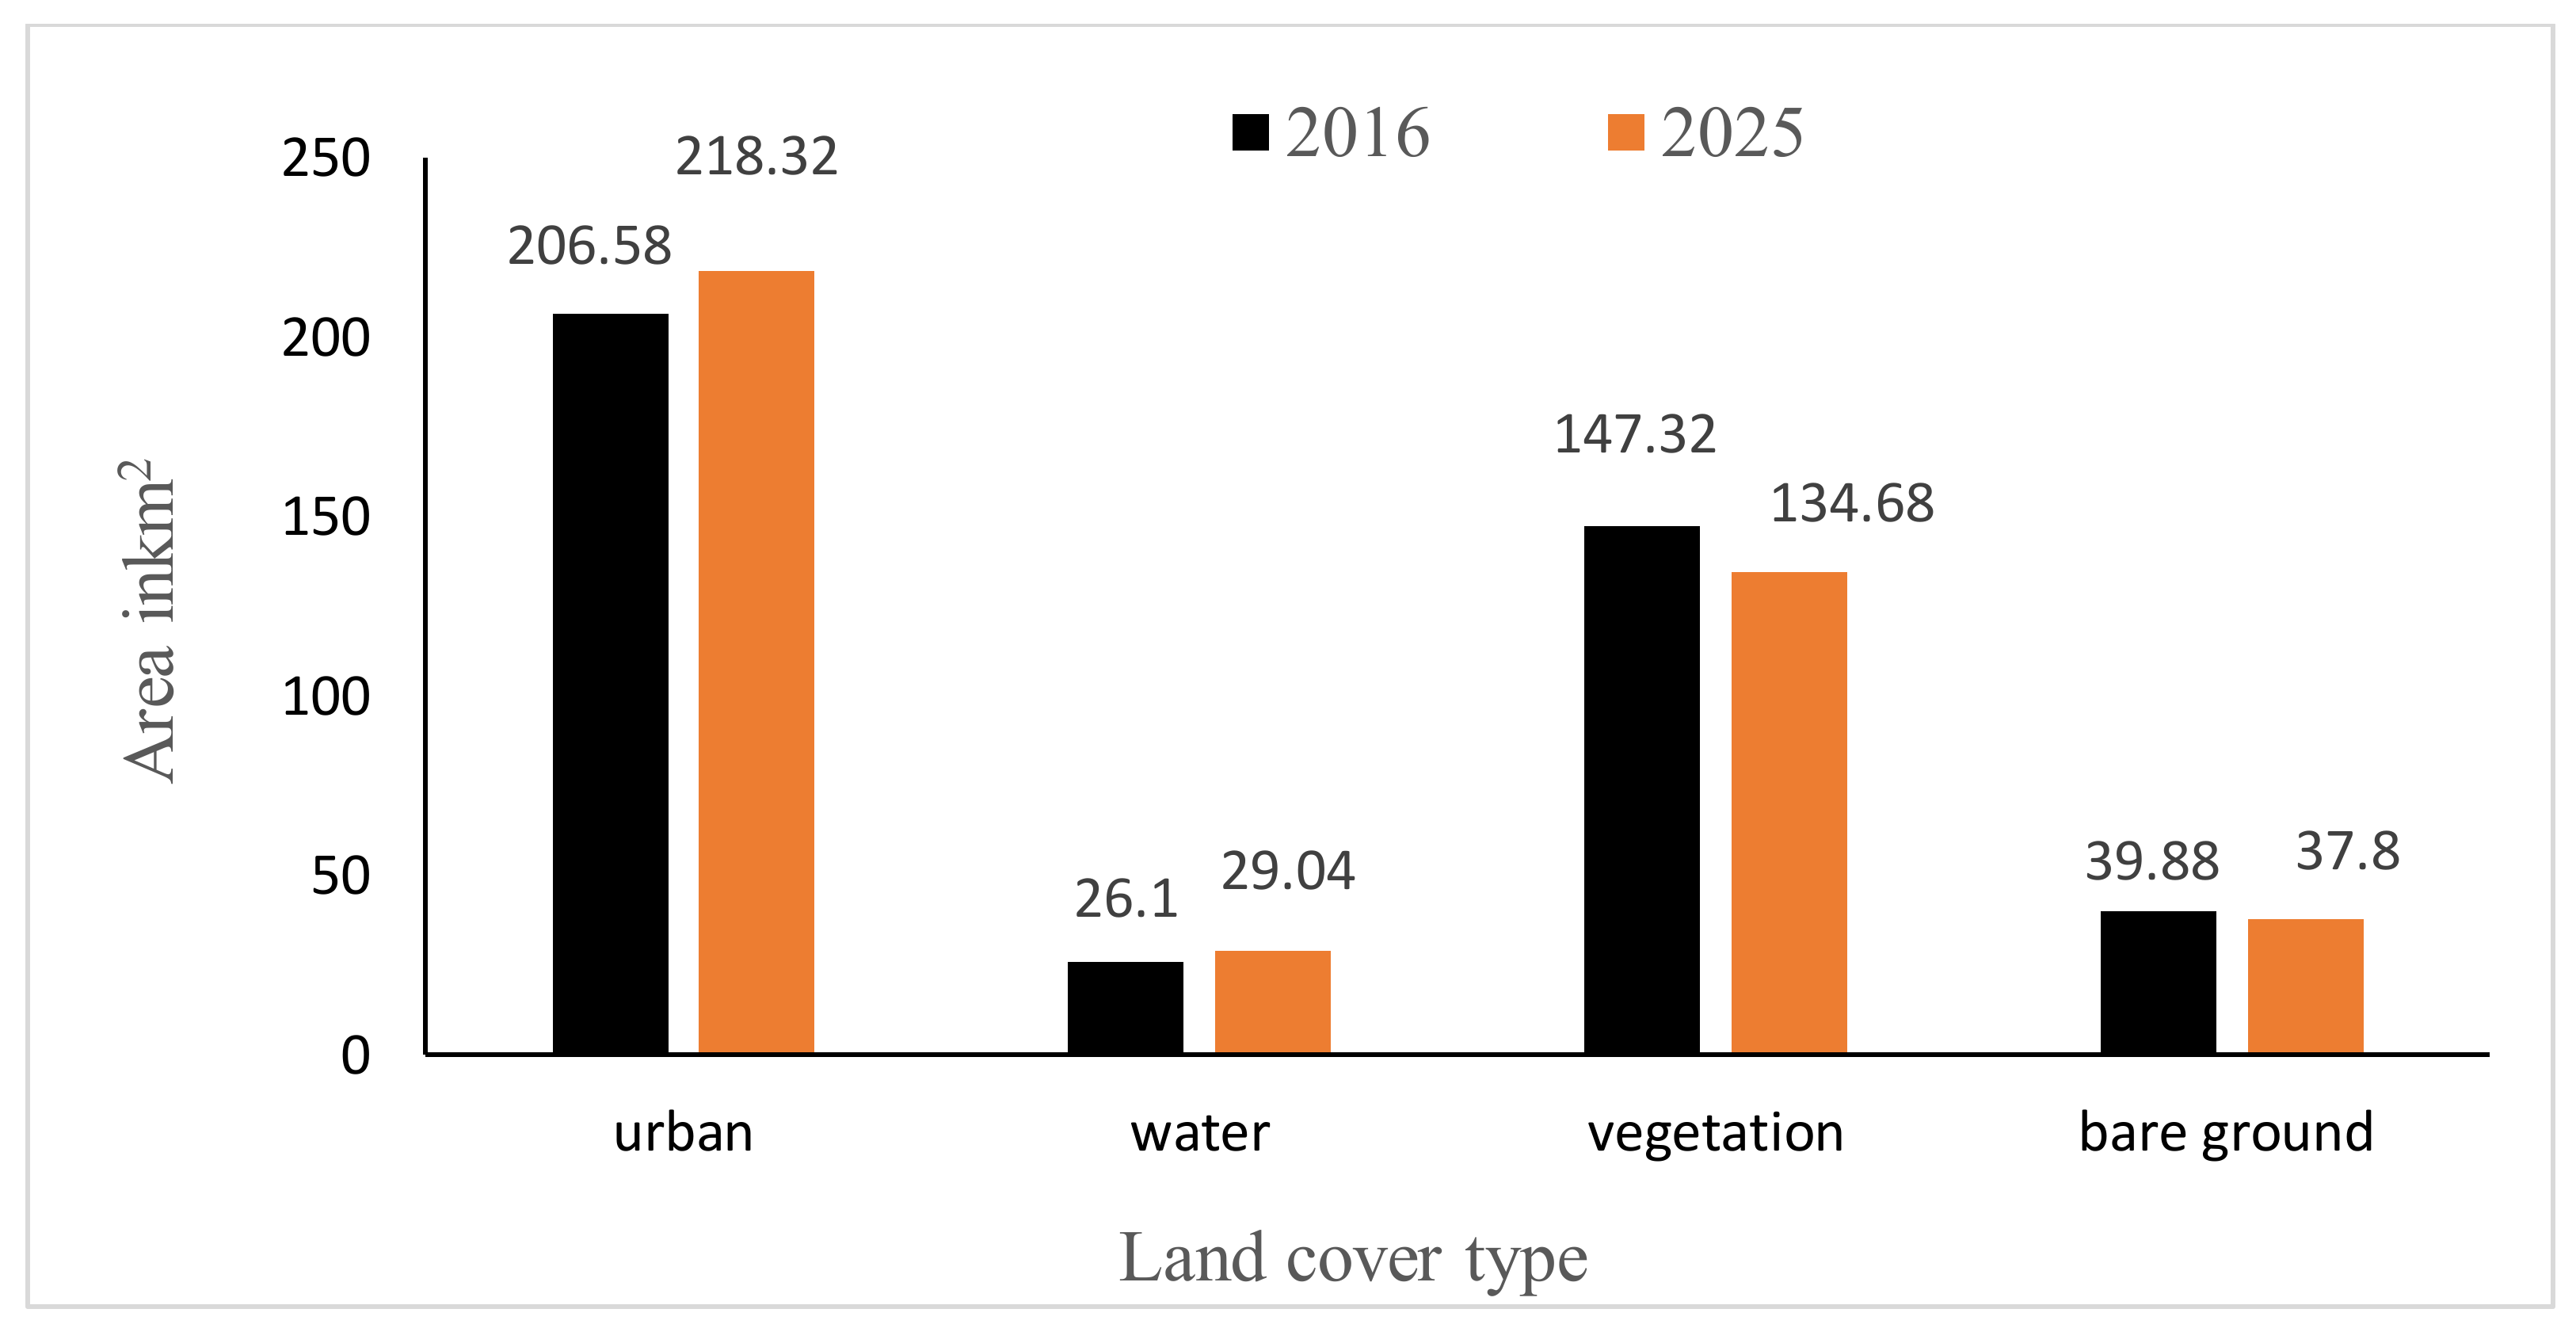
A future land-cover change map of Conakry by 2025 was simulated based on CA-Markov module in the IDRISI software. The simulated 2025 land-cover map of Conakry is shown in Figure 8 and the spatial and temporal area change is illustrated in Figure 9 respectively. It was found that area under urban land-cover will continue to increase largely at the expense of vegetation. The area under urban represented 49% (206.58 km2) of the total area in 2016, and it is projected to increase 52% (218.32 km2) in 2025. Vegetation will decrease from 35% (147.32 km2) in 2016 to 32% (134.68 km2) in 2025. Bare ground land-cover shows a minor decrease in its area. In contrast, water class will slightly increase, may be due to the geographical location as coastal and seasonal variation.
4. Discussion
Land-Cover Change and Demographic Dynamics in Conakry
Post-classification comparison of the classified land-cover maps 1986, 2000 and 2016 has revealed continuous increase in the urban land-cover and a substantial decrease in the vegetation and bare ground cover respectively. This unprecedented growth in the urban area can largely be explained by the rapid population growth. For instance, according to the National Institute of Statistics of Guinea, the population of Conakry has sharply increased from 0.8 million in 1986, to 1.3 million in 2000 and 2.2 million in 2016 [26]. Besides that, in Guinea, there has been important rural-urban migration, since agricultural productivity has fallen, and the economic and living conditions in rural areas have deteriorated [12,36]. The poverty incidence map in all administrative regions of Guinea is shown in Figure 10. This figure clearly indicates low poverty rate in Conakry (24.4%) in comparison to other regions. This once demonstrates the attractiveness of Conakry for important migration, despite its pronounced congestion.
These results are like other capital cities in the same region (West-Africa), for example, it was found that urban expansion in the capital of Mali (Bamako) and Senegal (Dakar) was mainly driven by urban primacy, high natural population growth, and rural to urban migration; consequently, the demand for land for housing in these cities has increased sharply leading to uncontrolled urban expansion [23]. Nowadays, urban conditions in Conakry largely reflect the problems and shortcomings of Guinea’s overall economic development process since independence [42]. Investment in infrastructure, services and public utilities in Conakry has remained far below minimal requirements [13,21]. Land-cover change is influenced by many driving factors, ranging from socioeconomic conditions, demographic, landscape topographic, physical infrastructure, and policies [43]. Nevertheless, to examine the urban development of Conakry, which remained quite a small town for long time, has offered an opportunity to analyze how historically recent urbanization has changed the natural landscape patterns.
Future land-cover change in Conakry was simulated based on the integrated CA-Markov model. The result has indicated that, based on the current trends, Conakry would expect further increase in its urban land-cover to the detriment of vegetation and bare ground cover respectively. The CA-Markov model is of special interest in land-use and land-cover change simulation, because of several advantages. Firstly, it is a discrete dynamical system, and its structure offers a capacity for simulating dynamic of complex spatial patterns [44]. Secondly, the model can be easily implemented into GIS and RS, as it operates on lattice, raster-format geographic data, and consequently, it can work at high spatial resolution with computational efficiency [45]. In addition to its operational simplicity, it has the potential to simulate land-cover change with minimum data requirements [46]. This model has been widely used in many land-cover change simulations, for example, a case study in the Ashanti region (Ghana) based on the CA-Markov model showed an upsurge in built up area, and a decline in agricultural and forest land-cover [47]. In Abuja city (Nigeria), future land-cover simulation has revealed a growing trend in settlement that might take over allotted spaces for green areas and agricultural land [48]. CA-Markov model as rule-based land-cover simulation model, imitates process and often addresses the interaction of components forming a system, with the great capability to handle temporal dynamic [49]. However, it focuses on micro spatial pattern, and it is difficult to reflect macro-changes affected by social and economic factors [50]. In contrast, the SLEUTH model is a Cellular Automata based land-cover change model, its name comes from an acronym for the input image requirements for driving the model: Slope, Land-use, Exclusion, Urban extent, Transportation, and Hill-shade. It requires inputs of historical land-cover from at least four-time periods, at least two historical land-cover layers, a historic transportation network from at least two-time periods, a single layer containing percent topographic slope, and a layer with areas excluded from urbanization [18]. The Conversion of Land-use and its effects (CLUE) is another land-use and land-cover change simulation model that has the geographic component, so it uses location characteristics (terrain, distance to roads population density etc.) [51]. These methods have been extensively used in many other studies, the CLUE model was used in simulating land-use changes in south-central Chile [52], to predicting land-use change and its impact on the groundwater system of Kleine Nete catchment in Belgium [53], and in simulating land-use changes in urban renewal areas in Hong Kong [54]. Meanwhile the SLEUTH model was used in modeling and simulation of the future impacts of urban land-use change on the natural environment [55]. However, both methods require quite some data which we could not get for this study. Nevertheless, land-cover change modeling and predictions are important for urban planning practices given their usefulness for generating multiple planning scenarios and evaluating their consequences.
5. Conclusions
The main objectives of the present study were to examine the nature of land-cover change in Conakry in 1986, 2000 and 2016, and to simulate future land-cover change by 2025. The result of the land-cover analysis has indicated significant land-cover transition over the study period, particularly a continuous increase in the urban land-cover at the expense of vegetation and bare ground cover respectively. Furthermore, the simulated result has revealed that if the current land-cover change prevails, Conakry would expect more increase in its urban land-cover to the detriment of other land-cover types. Nevertheless, Conakry, as with many other capital cities in the West-Africa region, is the outcome of spontaneous rapid growth, as the growth of population in Conakry is taking place at an exceptional rate, it has become one the most populous cities in the region. Conakry has undergone radical changes in its physical forms leading to several unplanned urban fabrics. Open spaces have been converted into building areas, loss of wetlands, wildlife habitats, ecological pollution, and so on. The city is also attracting many rural-urban migrants from all over the country due to extreme poverty and lack of opportunities in the rural areas. Nevertheless, while few studies on land-cover change in Conakry exist, this study is the first to examine the spatial and temporal land-cover change and to simulate future land-cover patterns in Conakry. The results of this study will provide bases for assessing the sustainability and the management of the urban area and for taking actions to mitigate the degradation of the urban environment.
Acknowledgments
The Ministry of Education, Culture, Sports, Science and Technology of Japan (MEXT) supported this study for the promotion of science.
Author Contributions
Arafan Traore conducted the fieldwork, analyzed the datasets, Arafan Traore, John Mawenda and Atupelye Weston Komba wrote the first draft of the manuscript, and addressed the review’s comments.
Conflicts of Interest
The authors declare no conflict of interest.
Appendix A
Table A1, Table A2 and Table A3 show the results of the accuracy assessment of the three land-cover maps in 1986, 2000 and 2016 respectively. The overall accuracy varies from 0.79 to 0.88 and the kappa coefficients vary from 0.72 to 0.83.

Table A1.
Error matrix of the 1986 classified land-cover map of Conakry.
| Reference Image | User’s Accuracy (%) | |||||
|---|---|---|---|---|---|---|
| Classified Image | Urban | Water | Vegetation | Bare Ground | Total Row | |
| Urban | 48 | 3 | 3 | 4 | 58 | 83 |
| Water | 2 | 39 | 4 | 3 | 48 | 81 |
| Vegetation | 4 | 3 | 45 | 2 | 54 | 83 |
| Bare ground | 6 | 3 | 1 | 30 | 40 | 75 |
| Total column | 60 | 48 | 53 | 39 | 200 | |
| Producer’s accuracy(%) | 80 | 81 | 85 | 77 | ||
| Overall accuracy: | 0.81 | |||||
| Kappa coefficient | 0.75 | |||||
Table A2.
Error matrix of the 2000 classified land-cover map of Conakry.
| Reference Image | User’s Accuracy (%) | |||||
|---|---|---|---|---|---|---|
| Classified Image | Urban | Water | Vegetation | Bare Ground | Total Row | |
| Urban | 46 | 3 | 5 | 5 | 59 | 78 |
| Water | 3 | 38 | 2 | 3 | 46 | 83 |
| Vegetation | 3 | 2 | 39 | 7 | 51 | 76 |
| Bare ground | 1 | 3 | 5 | 35 | 44 | 80 |
| Total column | 53 | 46 | 51 | 50 | 200 | |
| Producer’s accuracy (%) | 87 | 83 | 76 | 70 | ||
| Overall accuracy | 0.79 | |||||
| Kappa coefficient | 0.72 | |||||
Table A3.
Error matrix of the 2016 classified land-cover map of Conakry.
| Reference Image | User’s Accuracy (%) | |||||
|---|---|---|---|---|---|---|
| Classified Image | Urban | Water | Vegetation | Bare Ground | Row Total | |
| Urban | 49 | 2 | 1 | 2 | 54 | 91 |
| Water | 2 | 42 | 2 | 1 | 47 | 89 |
| Vegetation | 3 | 2 | 45 | 2 | 52 | 87 |
| Bare ground | 2 | 3 | 2 | 40 | 47 | 85 |
| Total column | 56 | 49 | 50 | 45 | 200 | |
| Producer’s accuracy (%) | 88 | 86 | 90 | 89 | ||
| Overall accuracy | 0.88 | |||||
| Kappa coefficient | 0.83 | |||||
References
- Ouedraogo, I. Land Use Dynamics and Demographic Change in Southern Burkina Faso. Available online: https://pub.epsilon.slu.se/2355/1/Ouedrago_I_100928.pdf (accessed on 16 April 2018).
- Subasinghe, S.; Estoque, R.; Murayama, Y. Spatiotemporal Analysis of Urban Growth Using GIS and Remote Sensing: A Case Study of the Colombo Metropolitan Area, Sri Lanka. ISPRS Int. J. Geo-Inf. 2016, 5, 197. [Google Scholar] [CrossRef]
- Gbanie, S.P.; Griffin, A.L.; Thornton, A. Impacts on the urban environment: Land cover change trajectories and landscape fragmentation in post-war Western Area, Sierra Leone. Remote Sens. 2018, 10. [Google Scholar] [CrossRef]
- Mahmoud, M.I.; Duker, A.; Conrad, C.; Thiel, M.; Ahmad, H.S. Analysis of settlement expansion and urban growth modelling using geoinformation for assessing potential impacts of urbanization on climate in Abuja City, Nigeria. Remote Sens. 2016, 8. [Google Scholar] [CrossRef]
- Lambin, E.F. The causes of land-use and land-cover change: Moving beyond the myths. Glob. Environ. Chang. 2011, 11, 261–269. [Google Scholar] [CrossRef]
- Seto, K.C.; Guneralp, B.; Hutyra, L.R. Global forecasts of urban expansion to 2030 and direct impacts on biodiversity and carbon pools. Proc. Natl. Acad. Sci. USA 2012, 109, 16083–16088. [Google Scholar] [CrossRef] [PubMed]
- Guo, J.; Xu, Y.; Pu, Z. Urbanization and Its Effects on Industrial Pollutant Emissions: An Empirical Study of a Chinese Case with the Spatial Panel Model. Sustainability 2016, 8, 812. [Google Scholar] [CrossRef]
- Meyer, B. Turner II Human Population Growth and Global Land-Use/Cover Change. Ann. Rev. Ecol. Syst. 1992, 23, 39–61. [Google Scholar] [CrossRef]
- Liddle, B. Urbanization and Inequality/Poverty. Urban Sci. 2017, 1, 35. [Google Scholar] [CrossRef]
- Dobigny, G.; Gauthier, P.; Houéménou, G.; Choplin, A.; Dossou, H.-J.; Badou, S.; Etougbétché, J.; Bourhy, P.; Koffi, S.; Durski, K.; et al. Leptospirosis and Extensive Urbanization in West Africa: A Neglected and Underestimated Threat? Urban Sci. 2018, 2, 29. [Google Scholar] [CrossRef]
- WoldeYohannes, A.; Cotter, M.; Kelboro, G.; Dessalegn, W. Land Use and Land Cover Changes and Their Effects on the Landscape of Abaya-Chamo Basin, Southern Ethiopia. Land 2018, 7, 2. [Google Scholar] [CrossRef]
- Dewan, A.M.; Yamaguchi, Y. Land use and land cover change in Greater Dhaka, Bangladesh: Using remote sensing to promote sustainable urbanization. Appl. Geogr. 2009, 29, 390–401. [Google Scholar] [CrossRef]
- Traore, A.; Watanabe, T. Modeling Determinants of Urban Growth in Conakry, Guinea: A Spatial Logistic Approach. Urban Sci. 2017, 1, 12. [Google Scholar] [CrossRef]
- Zheng, H.W.; Shen, G.Q.; Wang, H.; Hong, J. Simulating land use change in urban renewal areas: A case study in Hong Kong. Habitat Int. 2015, 46, 23–34. [Google Scholar] [CrossRef]
- Shafizadeh Moghadam, H.; Helbich, M. Spatiotemporal urbanization processes in the megacity of Mumbai, India: A Markov chains-cellular automata urban growth model. Appl. Geogr. 2013, 40, 140–149. [Google Scholar] [CrossRef]
- Torbick, N.; Chowdhury, D.; Salas, W.; Qi, J. Monitoring Rice Agriculture across Myanmar Using Time Series Sentinel-1 Assisted by Landsat-8 and PALSAR-2. Remote Sens. 2017, 9, 119. [Google Scholar] [CrossRef]
- Naghibi, F.; Delavar, M.; Pijanowski, B. Urban Growth Modeling Using Cellular Automata with Multi-Temporal Remote Sensing Images Calibrated by the Artificial Bee Colony Optimization Algorithm. Sensors 2016, 16, 2122. [Google Scholar] [CrossRef] [PubMed]
- Hua, L.; Tang, L.; Cui, S.; Yin, K. Simulating urban growth using the SLEUTH model in a coastal peri-urban district in China. Sustainability 2014, 6, 3899–3914. [Google Scholar] [CrossRef]
- World Bank. Poverty and Urban Mobility in Conakry. Available online: http://www.gtkp.com/assets/ uploads/20091127-171237-6675-Conakry_en.pdf (accessed on 10 April 2018).
- African Economic Outlook 2017; African Economic Outlook; OECD Publishing: Ogdensburg, NY, USA, 2017; ISBN 9789264274259.
- The World Bank. Guinea—Conakry Urban Development Project; The World Bank: Washington, DC, USA, 1984. [Google Scholar]
- Sylla, L.; Xiong, D.; Zhang, H.Y.; Bangoura, S.T. A GIS technology and method to assess environmental problems from land use/cover changes: Conakry, Coyah and Dubreka region case study. Egypt. J. Remote Sens. Space Sci. 2012, 15, 31–38. [Google Scholar] [CrossRef]
- Murayama, Y.; Kamusoko, C.; Yamashita, A.; Estoque, R.C. Urban Development in Asia and Africa; Springer: Berlin, Germany, 2017; ISBN 978-981-10-3240-0. [Google Scholar]
- Collier, P. African urbanization: An analytic policy guide. Oxf. Rev. Econ. Policy 2017, 33, 405–437. [Google Scholar] [CrossRef]
- Al-Ahmadi, K.; Heppenstall, A.; See, L.; Hogg, J. Modeling Urban Growth Dynamics using Cellular Automata and GIS. In Proceedings of the Third National GIS Symposium, Al-Khobar, Saudi Arabia, 7–9 April 2008; pp. 1–7. [Google Scholar]
- Institut National de la Statistique—Stat-Guinee.org. Available online: http://www.stat-guinee.org/ (accessed on 11 April 2018).
- Goerg, O. Couper la Guinée en quatre ou comment la colonisation a imaginé l’Afrique. Vingtième Siècle. Revue d’histoire 2011, 111, 73–88. [Google Scholar] [CrossRef]
- Manandhar, R.; Odeh, I.O.A.; Ancev, T. Improving the Accuracy of Land Use and Land Cover Classification of Landsat Data Using Post-Classification Enhancement. Remote Sens. 2009, 1, 330–344. [Google Scholar] [CrossRef]
- Thapa, R.B.; Murayama, Y. Drivers of urban growth in the Kathmandu valley, Nepal: Examining the efficacy of the analytic hierarchy process. Appl. Geogr. 2010, 30, 70–83. [Google Scholar] [CrossRef]
- Srivanit, M.; Hokao, K.; Phonekeo, V. Assessing the Impact of Urbanization on Urban Thermal Environment: A Case Study of Bangkok Metropolitan. Int. J. Appl. Sci. Technol. 2012, 2, 243–256. [Google Scholar]
- Li, C.; Wang, J.; Wang, L.; Hu, L.; Gong, P. Comparison of classification algorithms and training sample sizes in urban land classification with landsat thematic mapper imagery. Remote Sens. 2014, 6, 964–983. [Google Scholar] [CrossRef]
- Ahmad, A.; Quegan, S. Comparative analysis of supervised and unsupervised classification on multispectral data. Appl. Math. Sci. 2013, 7, 3681–3694. [Google Scholar] [CrossRef]
- Eastman, J.R. IDRISI Selva Tutorial. In Idrisi Production; Clark Labs-Clark University: Worcester, MA, USA, 2012; Volume 45, pp. 51–63. [Google Scholar]
- Rwanga, S.S.; Ndambuki, J.M. Accuracy Assessment of Land Use/Land Cover Classification Using Remote Sensing and GIS. Int. J. Geosci. 2017, 8, 611–622. [Google Scholar] [CrossRef]
- Mcgee, J.; Campbell, J.; Parece, T. Remote Sensing in an ArcMap Environment. Available online: http://virginiaview.cnre.vt.edu/tutorial/RS_in_ArcGIS_AllChapters.pdf (accessed on 16 April 2018).
- Vázquez-Quintero, G.; Solís-Moreno, R.; Pompa-García, M.; Villarreal-Guerrero, F.; Pinedo-Alvarez, C.; Pinedo-Alvarez, A. Detection and Projection of Forest Changes by Using the Markov Chain Model and Cellular Automata. Sustainability 2016, 8, 236. [Google Scholar] [CrossRef]
- Hamdy, O.; Zhao, S.; Osman, T.; Salheen, M.; Eid, Y. Applying a Hybrid Model of Markov Chain and Logistic Regression to Identify Future Urban Sprawl in Abouelreesh, Aswan: A Case Study. Geosciences 2016, 6, 43. [Google Scholar] [CrossRef]
- Braimoh, A.K.; Vlek, P.L.G. Land-Cover Dynamics in an Urban Area of Ghana. Earth Interact. 2004, 8, 1–15. [Google Scholar] [CrossRef]
- Arsanjani, J.J.; Helbich, M.; Kainz, W.; Boloorani, A.D. Integration of logistic regression, Markov chain and cellular automata models to simulate urban expansion. Int. J. Appl. Earth Obs. Geoinf. 2012, 21, 265–275. [Google Scholar] [CrossRef]
- Liu, Y.; Phinn, S. Developing a cellular automaton model of urban growth incorporating fuzzy set approaches. In Proceedings of the 6th International Conference on GeoComputation, University of Queensland, Brisbane, Australia, 24–26 September 2001. [Google Scholar]
- Carvalho, G.; Moura, A.C.M. Land Cover projection based on Chain Markov and Cellular Automata: Case study of Pampulha Land Cover projection based on Chain Markov and Cellular. In Proceedings of the International Conference on Changing Cities II: Spatial, Design, Landscape & Socio-Economic Dimensions, Porto Heli, Greece, 22–26 June 2015. [Google Scholar]
- Hensher, D.A.; Johnson, L.W. Applied Discrete Choice Modelling. 1981. Available online: https://trid.trb.org/view.aspx?id=1206392 (accessed on 23 March 2018).
- Pontius, R.G.; Schneider, L.C. Land-cover change model validation by an ROC method for the Ipswich watershed, Massachusetts, USA. Agric. Ecosyst. Environ. 2001, 85, 239–248. [Google Scholar] [CrossRef]
- Siddighi Balde, B.; Kobayashi, H.; Matsumura, I.; Esham, M.; Alam, A.; Tolno, E. Land Use Change and their Determinants in the Coastal Area of Guinea: A Study based on Spatial Analysis and Field Survey. J. Jpn. Agric. Syst. Soc. 2014, 30, 64–76. [Google Scholar]
- Archondo-callao, R.; Region, A.; Bank, T.W. Sub-Saharan Africa Transport Policy Program; Annual Report; World Bank: Washington, DC, USA, 2004. [Google Scholar]
- Adhikari, S.; Fik, T.; Dwivedi, P. Proximate Causes of Land-Use and Land-Cover Change in Bannerghatta National Park: A Spatial Statistical Model. Forests 2017, 8, 342. [Google Scholar] [CrossRef]
- Deep, S.; Saklani, A. Urban sprawl modeling using cellular automata. Egypt. J. Remote Sens. Space Sci. 2014, 17, 179–187. [Google Scholar] [CrossRef]
- Rimal, B.; Zhang, L.; Keshtkar, H.; Wang, N.; Lin, Y. Monitoring and Modeling of Spatiotemporal Urban Expansion and Land-Use/Land-Cover Change Using Integrated Markov Chain Cellular Automata Model. ISPRS Int. J. Geo-Inf. 2017, 6, 288. [Google Scholar] [CrossRef]
- Li, S.H.; Jin, B.X.; Wei, X.Y.; Jiang, Y.Y.; Wang, J.L. Using Ca-Markov Model to Model the Spatiotemporal Change of Land Use/Cover in Fuxian Lake for Decision Support. ISPRS Ann. Photogramm. Remote Sens. Spat. Inf. Sci. 2015, 163–168. [Google Scholar] [CrossRef]
- Jafari, M.; Majedi, H.; Monavari, S.; Alesheikh, A.; Kheirkhah Zarkesh, M. Dynamic Simulation of Urban Expansion Based on Cellular Automata and Logistic Regression Model: Case Study of the Hyrcanian Region of Iran. Sustainability 2016, 8, 810. [Google Scholar] [CrossRef]
- Koranteng, A.; Zawila-Niedzwiecki, T. Modelling forest loss and other land use change dynamics in Ashanti Region of Ghana. Folia For. Pol. 2015, 57, 96–111. [Google Scholar] [CrossRef] [Green Version]
- Manuschevich, D.; Beier, C.M. Simulating land use changes under alternative policy scenarios for conservation of native forests in south-central Chile. Land Use Policy 2016, 51, 350–362. [Google Scholar] [CrossRef]
- Dams, J.; Woldeamlak, S.T.; Batelaan, O. Predicting land-use change and its impact on the groundwater system of the Kleine Nete catchment, Belgium. Hydrol. Earth Syst. Sci. 2008, 12, 1369–1385. [Google Scholar] [CrossRef]
- Lagrosa, J.J.; Zipperer, W.C.; Andreu, M.G. Projecting Land-Use and Land Cover Change in a Subtropical Urban Watershed. Urban Sci. 2018, 2, 11. [Google Scholar] [CrossRef]
- Kuo, H.-F.; Tsou, K.-W. Modeling and simulation of the future impacts of urban land use change on the natural environment by SLEUTH and cluster analysis. Sustainability 2017, 10. [Google Scholar] [CrossRef]
Figure 1.
Map of Conakry and its five communes in Guinea.

Figure 2.
Urban and rural population trends in Guinea between 1950 and 2050 [20].
Figure 2.
Urban and rural population trends in Guinea between 1950 and 2050 [20].

Figure 3.
Temporal Landsat composite band red, green and blue (RGB) of Conakry; (a) 1986, (b) 2000 and (c) 2016.
Figure 3.
Temporal Landsat composite band red, green and blue (RGB) of Conakry; (a) 1986, (b) 2000 and (c) 2016.

Figure 4.
Land-cover maps in Conakry in (a) 1986, (b) 2000 and(c) 2016 [13].
Figure 4.
Land-cover maps in Conakry in (a) 1986, (b) 2000 and(c) 2016 [13].

Figure 5.
Markovian conditional probability of change to urban in 2016.
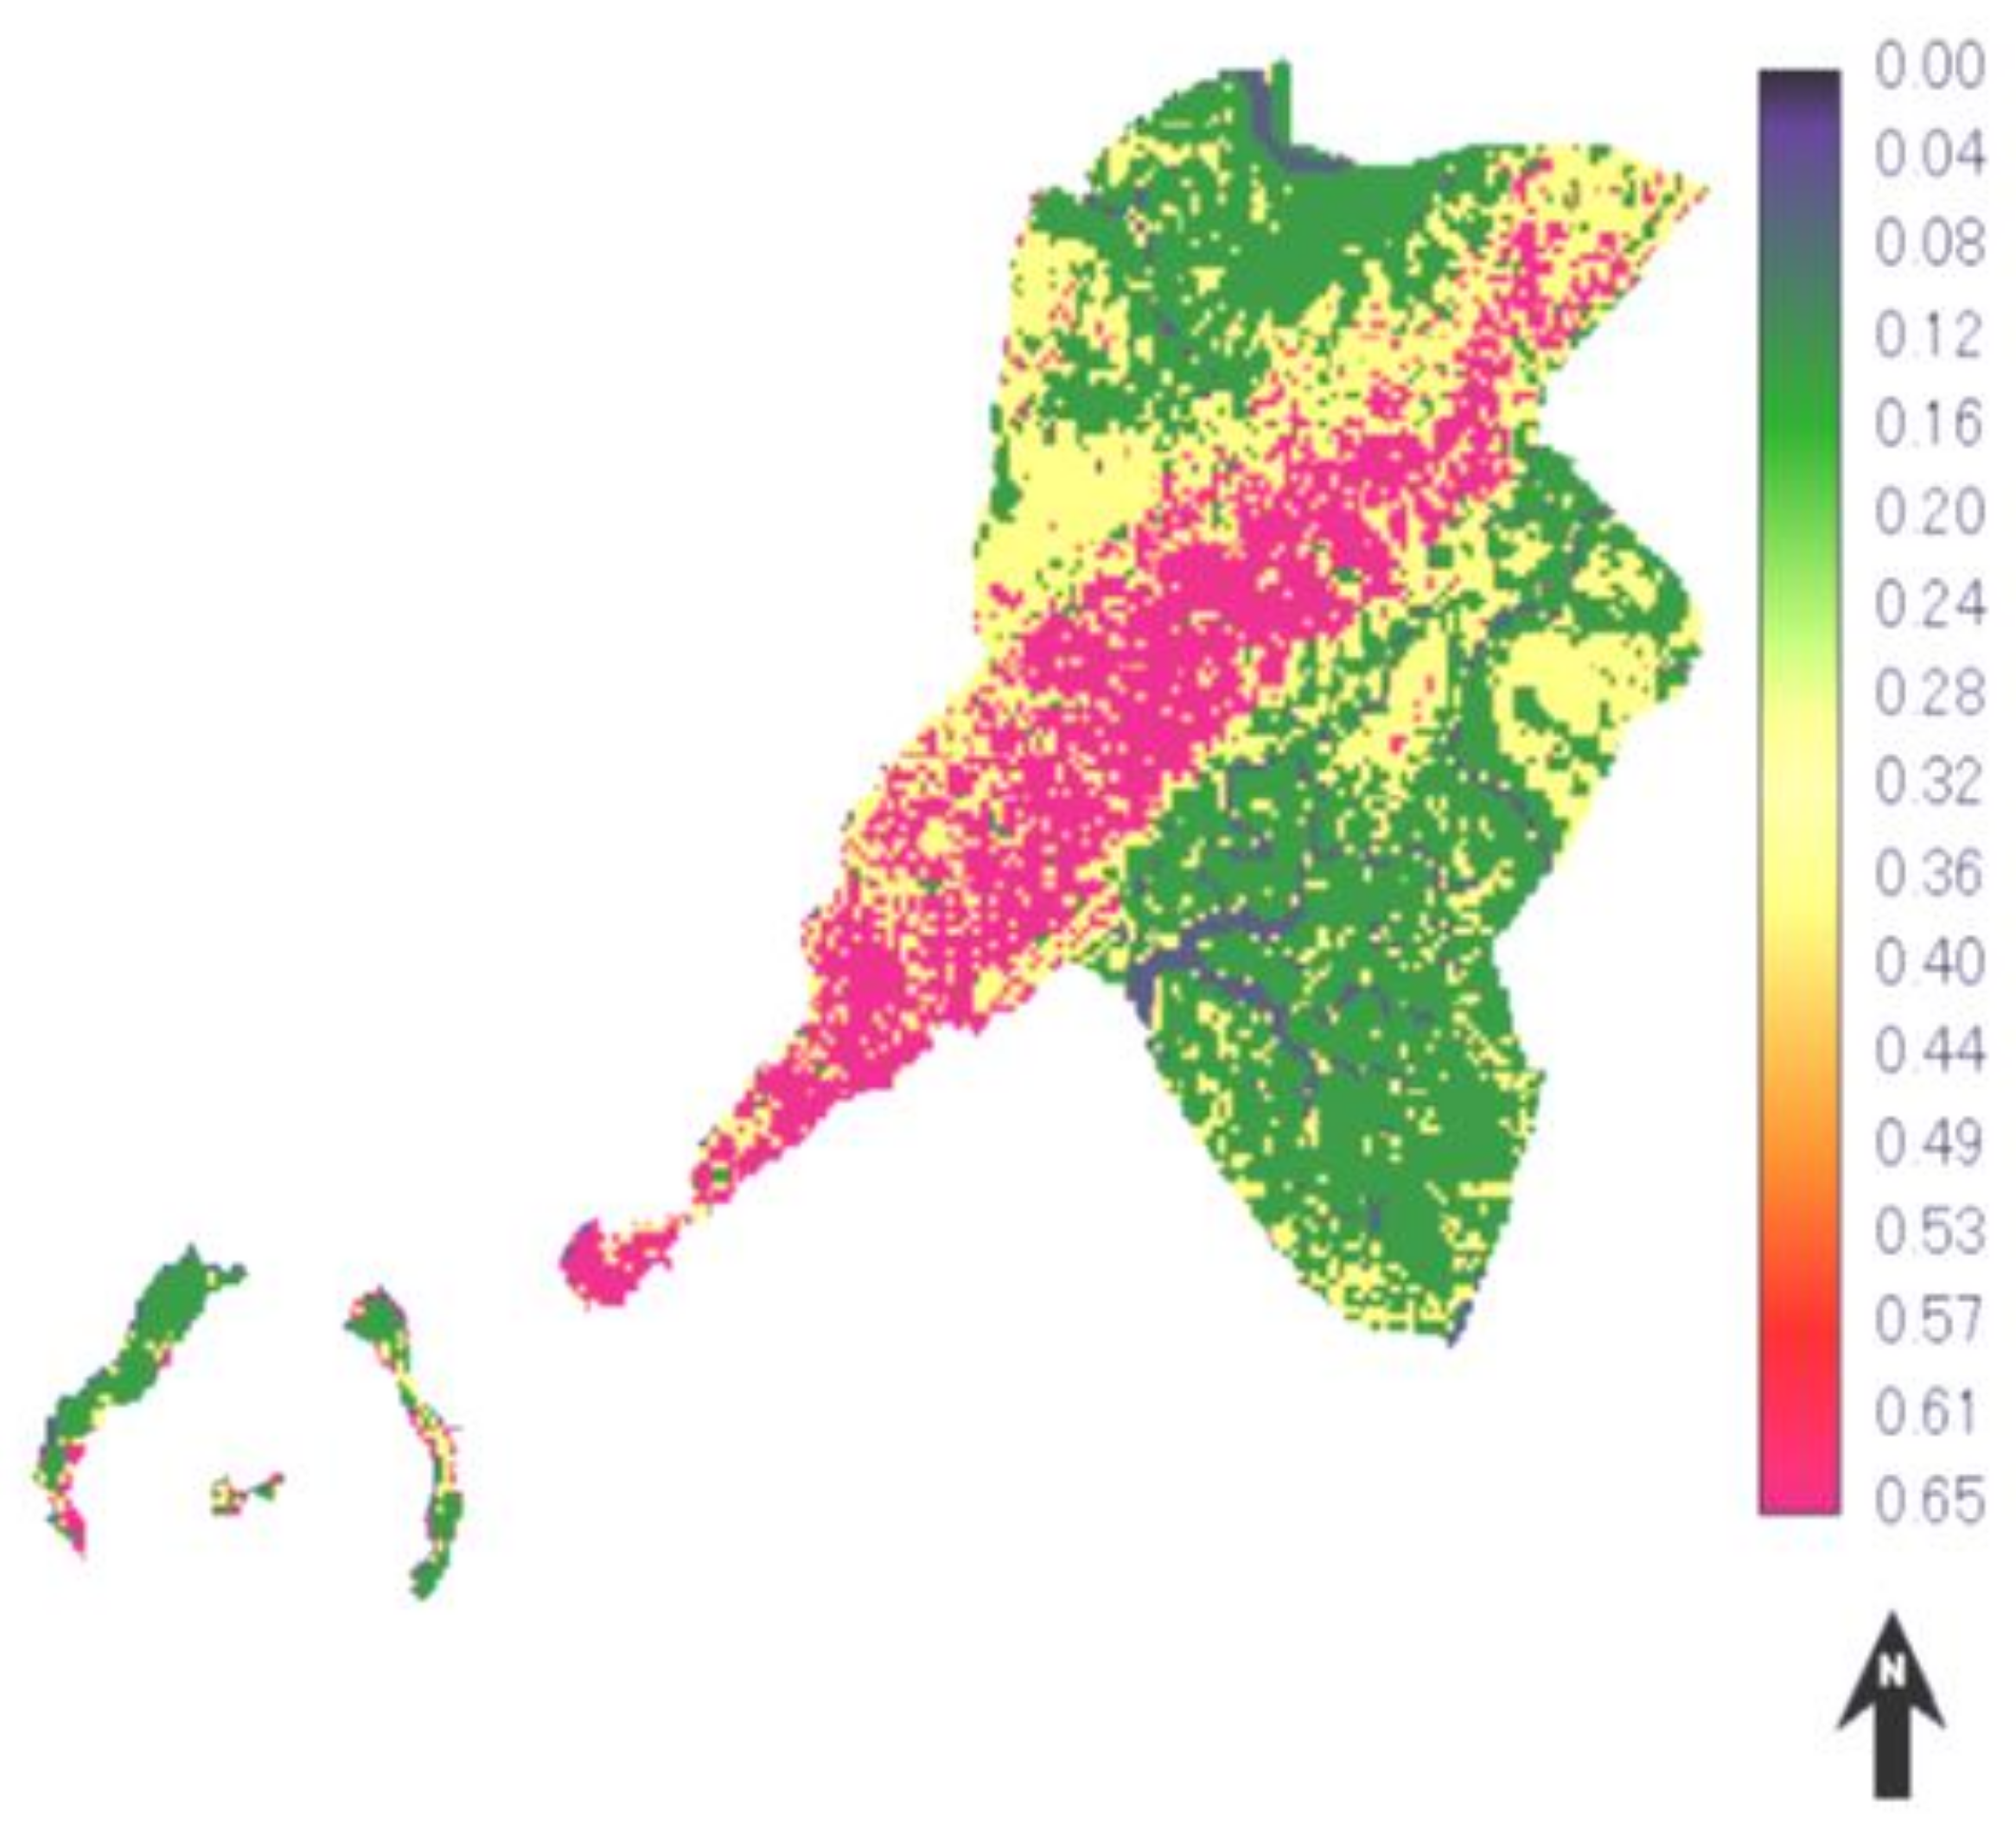
Figure 6.
Binary urban growth from 2000 to 2016.

Figure 7.
Relative Operating Characteristic (ROC) showing agreement between the two maps.

Figure 8.
Projected land-cover map of Conakry by 2025.

Figure 9.
Land-cover area change in Conakry in 2016 and 2025.

Figure 10.
Poverty incidence map of Guinea in 2010 [19].
Figure 10.
Poverty incidence map of Guinea in 2010 [19].
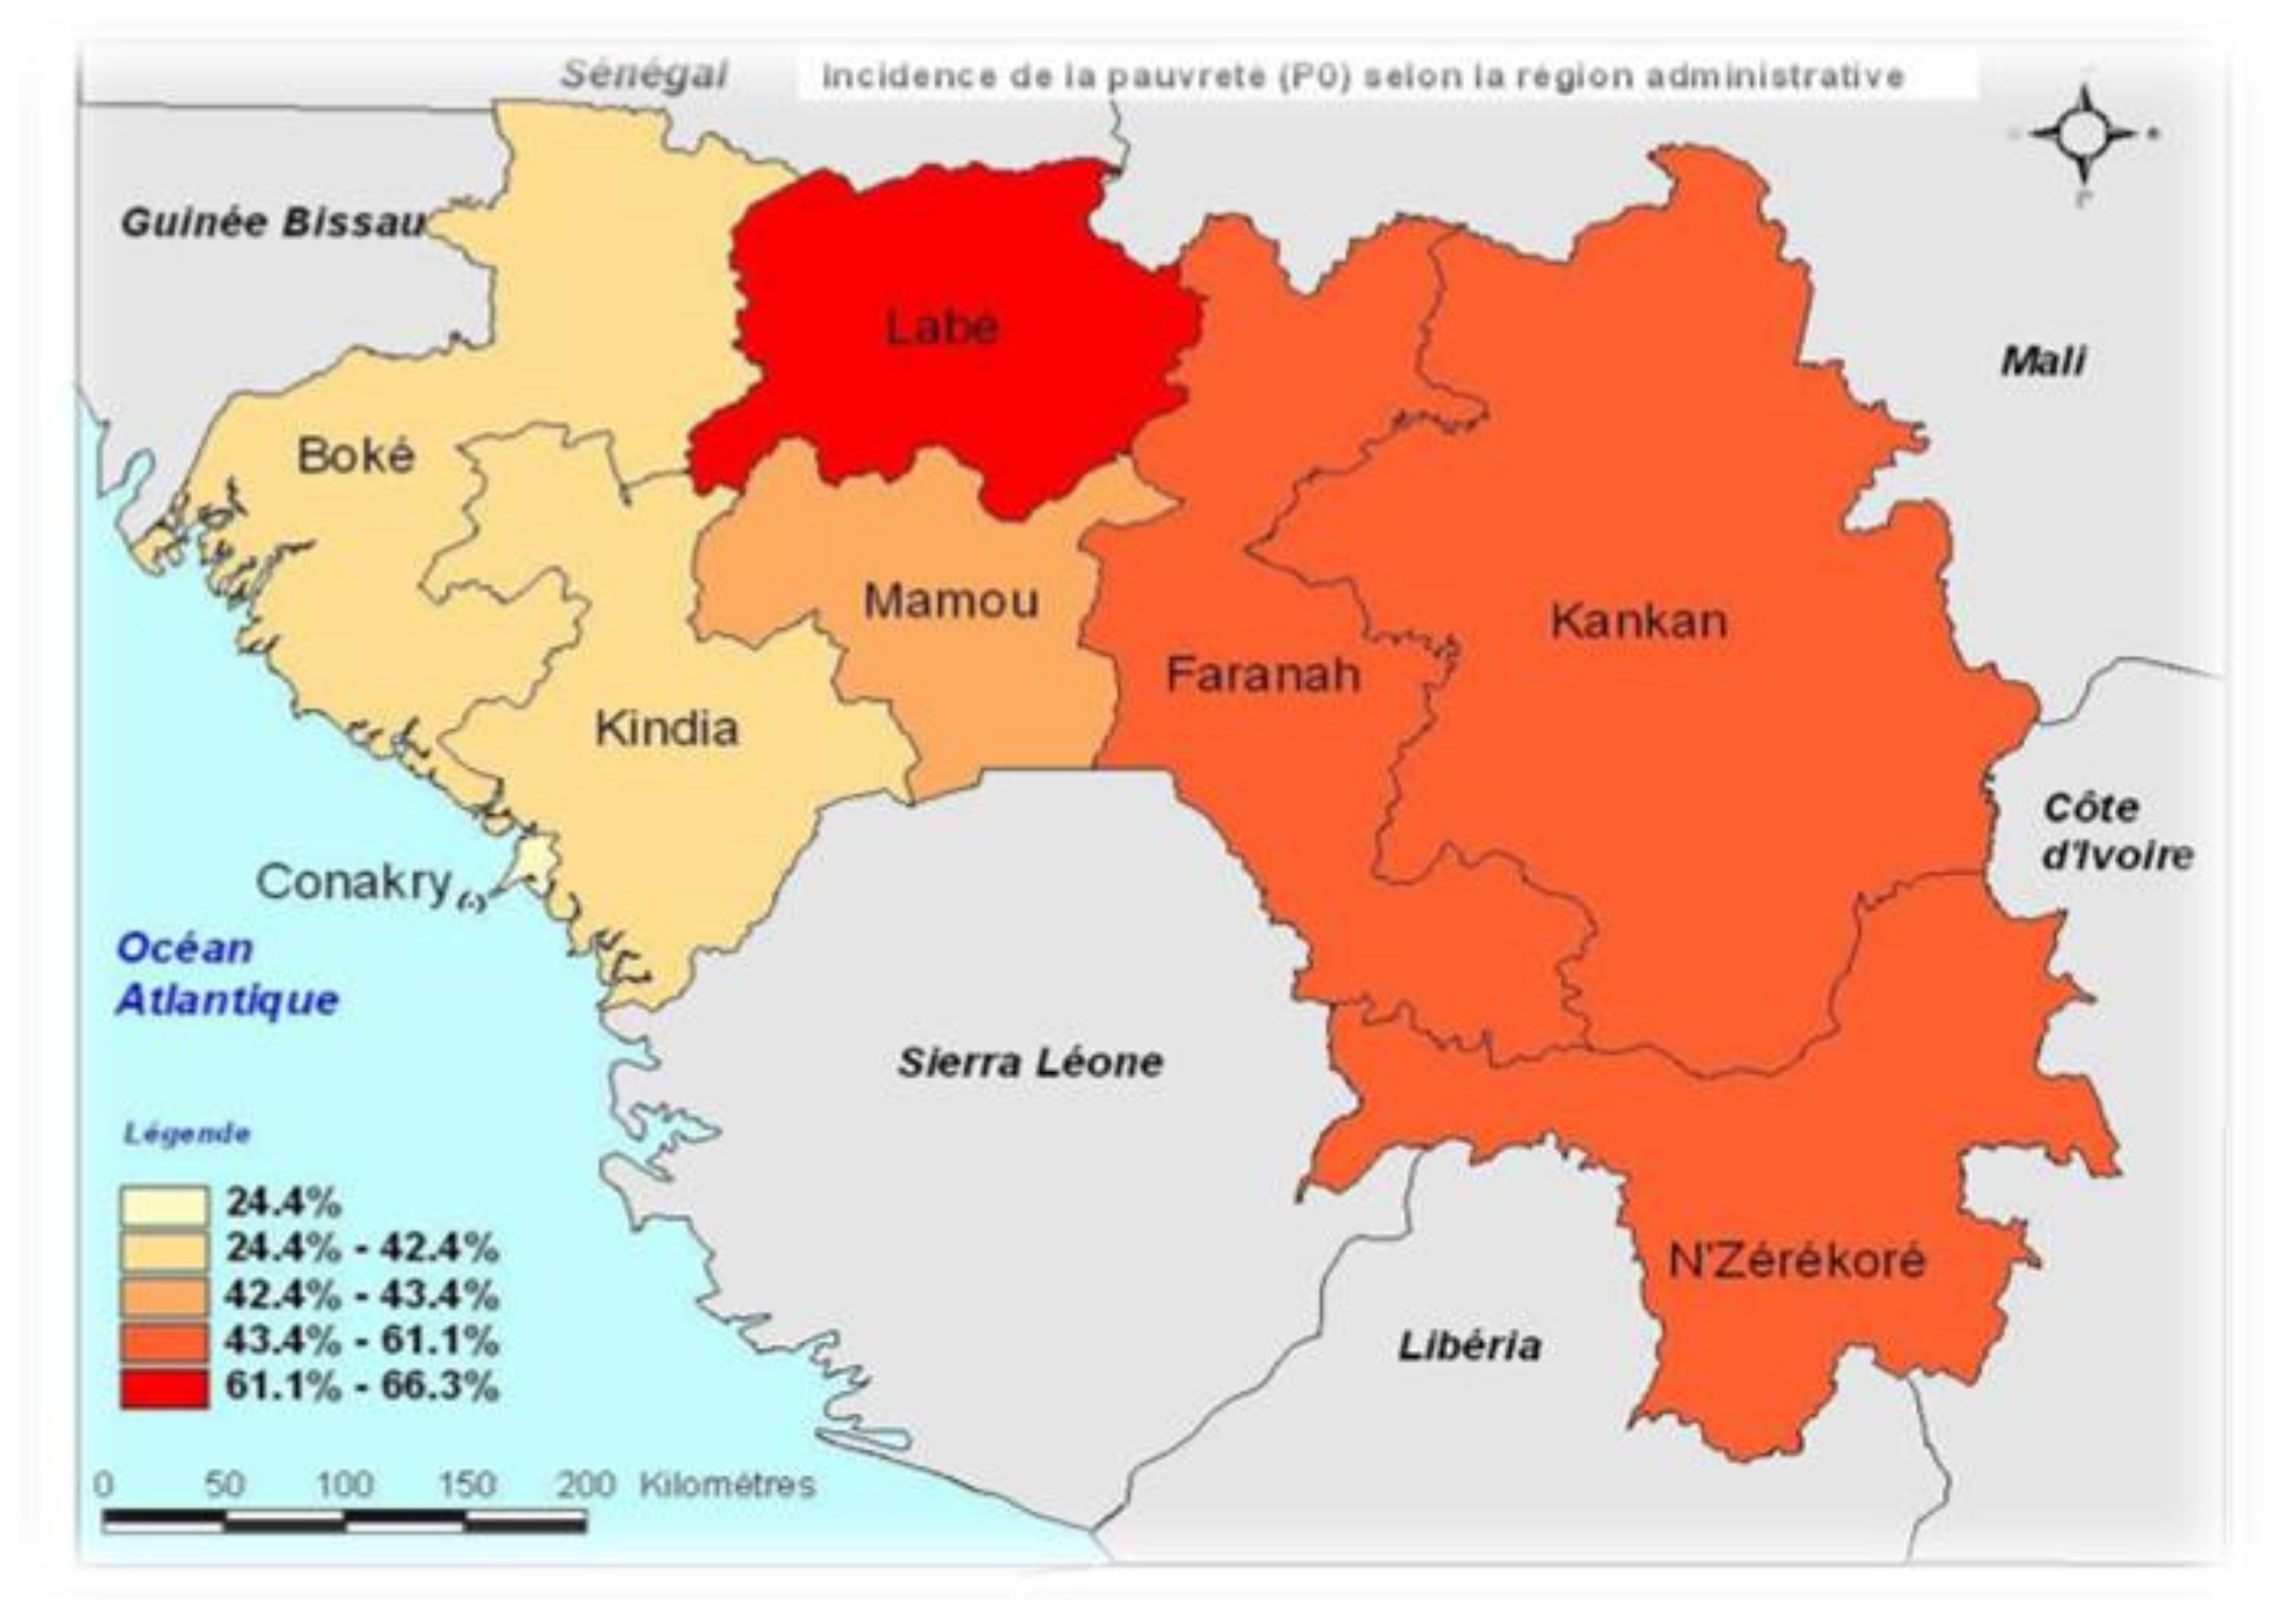
Table 1.
Detailed information of the Landsat data used in this study.
| Satellite | Sensor | Path/Row | Spatial Resolution | Date of Acquisition | Sources |
|---|---|---|---|---|---|
| Landsat 5 | TM | 202/53 | 30 m | 01/03/1986 | USGS |
| Landsat 7 | ETM+ | 202/53 | 30 m | 12/19/2000 | USGS |
| Landsat 8 | OLI | 202/53 | 30 m | 01/20/2016 | USGS |
Table 2.
Land-cover classes.
| Class | Description |
|---|---|
| Urban | Residential, commercial, industrial, transportation, utilities, communication etc. |
| Water | Rivers, lakes, ponds, reservoirs, and other water bodies |
| Vegetation | Mangrove forests, high vegetation, reserved forest, non-reserved forest |
| Bare ground | Fallow land, bare exposed, parks, shrubs, area and transition |
Table 3.
Transition probability matrix in 2016.
| Probability of Transition | |||||
|---|---|---|---|---|---|
| From/To | Urban | Water | Vegetation | Bare Ground | Total |
| urban | 0.936 | 0.000 | 0.000 | 0.063 | 1.000 |
| water | 0.016 | 0.862 | 0.108 | 0.011 | 1.000 |
| vegetation | 0.326 | 0.096 | 0.459 | 0.117 | 1.000 |
| bare ground | 0.127 | 0.051 | 0.000 | 0.821 | 1.000 |
© 2018 by the authors. Licensee MDPI, Basel, Switzerland. This article is an open access article distributed under the terms and conditions of the Creative Commons Attribution (CC BY) license (http://creativecommons.org/licenses/by/4.0/).
Share and Cite
MDPI and ACS Style
Traore, A.; Mawenda, J.; Komba, A.W. Land-Cover Change Analysis and Simulation in Conakry (Guinea), Using Hybrid Cellular-Automata and Markov Model. Urban Sci. 2018, 2, 39. https://doi.org/10.3390/urbansci2020039
AMA Style
Traore A, Mawenda J, Komba AW. Land-Cover Change Analysis and Simulation in Conakry (Guinea), Using Hybrid Cellular-Automata and Markov Model. Urban Science. 2018; 2(2):39. https://doi.org/10.3390/urbansci2020039
Chicago/Turabian StyleTraore, Arafan, John Mawenda, and Atupelye Weston Komba. 2018. "Land-Cover Change Analysis and Simulation in Conakry (Guinea), Using Hybrid Cellular-Automata and Markov Model" Urban Science 2, no. 2: 39. https://doi.org/10.3390/urbansci2020039