1. Introduction and Background
The location of warehouses can generate a competitive advantage in urban goods distribution [
1], since it directly impacts the flow of cargo in cities, and given that warehouses are the origin or destination of a great deal of logistics activities [
2]. Metropolitan areas attract warehouses due to the presence of transport infrastructure, potential customers, logistics real estate, and labor [
3].
An analysis of logistics sprawl was proposed by Dablanc and Rakotonarivo [
4] to understand the impact of the location of warehouses on urban freight transport. Additionally, these authors defined the logistics sprawl phenomenon as the movement of warehousing sites from urban centers to peripheral areas of a metropolitan region. It is important to understand this process due to the negative externalities associated with urban freight transport and the spatial distribution of the facilities [
1,
5]. Moreover, understanding and measuring logistics sprawl is a key step in assessing the dimensions and impact of the phenomena on urban freight distribution, since increased congestion has an impact on travel time, which causes delays in scheduled deliveries and, consequently, reduces the service level of carriers [
1]. Logistics sprawl occurs due to the low cost of land, as well as the availability of areas for new warehouses in peripheral areas rather than in saturated central urban areas [
6]. In some cases, the location of warehouses in peripheral metropolitan areas can be associated with urban expansion rather than with morphological changes in these areas.
As reported in the paper by Heitz and Dablanc [
3], one of the main consequences of logistics sprawl is the increase in travel distances, which contributes to increases in fuel consumption, greenhouse gas emissions, and noise pollution, among other problems. The same authors also demonstrated the importance of investigating the spreading of warehouse locations towards metropolitan areas, stimulating the location of logistics areas in urban centers in order to reduce the distances traveled by freight vehicles. Even though the location of logistics facilities, including warehouses, in urban areas is an important factor to consider in the assessment of the externalities of urban freight distribution, it not the only issue to be considered and might not be the most important one when evaluating these impacts [
3]. Along with other important spatial, commercial, and operational issues, it is essential to measure and assess the logistics sprawl phenomenon and to determine how the location of logistics facilities affects each urban area.
In this context, the location of warehouses becomes a relevant theme for urban transport planning and urban mobility. However, there are few studies focused on understanding the spatial distribution of warehouses in metropolitan regions [
1,
2,
5,
6,
7,
8,
9]. The literature shows investigations that have been carried out in metropolitan areas in Europe [
3,
4,
10,
11,
12], in North America [
13,
14,
15], and for other metropolitan areas around the globe such as Tokyo [
5,
16]. In
Table 1 we present the identified logistics sprawl case studies, indicating the database and the logistics sprawl indicator for each research project. The results indicated that, in most cases, the warehouses sprawled less than 5 km from the original spatial structure within the period analyzed. Additionally, in general, the methodological approach was based on a centrographic analysis [
3,
4,
12,
13,
14]. As in the research by Sakai et al. [
16], the shortest routes connecting incidents and facilities were computed. Furthermore, we used the dispersion ellipsis to assess the variability of the phenomenon [
3], which indicated the direction of the sprawling as presented by Woudsma et al. [
15].
As
Table 1 shows, the logistics sprawl phenomenon in Latin American cities has not yet been investigated. In order to address this gap in the literature, this paper undertakes a geographic-based network analysis of the location of warehouses in the context of a Brazilian metropolitan region. In this paper we present an investigation conducted in the Belo Horizonte Metropolitan Area (BHMA) and Metropolitan Belt (BHMAMB). The BHMA has 34 municipalities, 5 million inhabitants, an area of 9460 km
2, and an annual gross domestic product of 228.1 million in Brazilian Real (1 US
$ ≈ R
$3.50 in April 2018). It is the third largest metropolitan region in Brazil and the seventh largest metropolitan region in Latin America.
The BHMAMB, composed of 50 municipalities with 5.8 million inhabitants and an area of 14,978.9 km
2, encapsulates the BHMA and a municipality further north (Sete Lagoas) where new logistics facilities have been built in the last decade. We hypothesize the significance of the influence of the new warehouses regarding the shape, the centrality, and the shifting in logistics sprawl in the BHMA. Thus, we computed the logistics sprawl indicator, as proposed by Dablanc and Rakotonarivo [
4], and identified the dispersion and direction of the logistics sprawl, as suggested by Woudsma et al. [
15]. Additionally, we used a cluster analysis to identify the concentration of warehouses along the railroad and road infrastructure, and to estimate the population served by the warehouses. Finally, we analyzed the impact of the freight villages proposed in the Master Plan of the Belo Horizonte Metropolitan Area on logistics sprawl. Although the previous studies were related to logistics sprawl in an urban sprawl context, the authors did not analyze the relationships among the location of warehouses confronted with road and railway infrastructure, and the population density. We have incorporated these elements into the current approach as one of the key contributions of this paper.
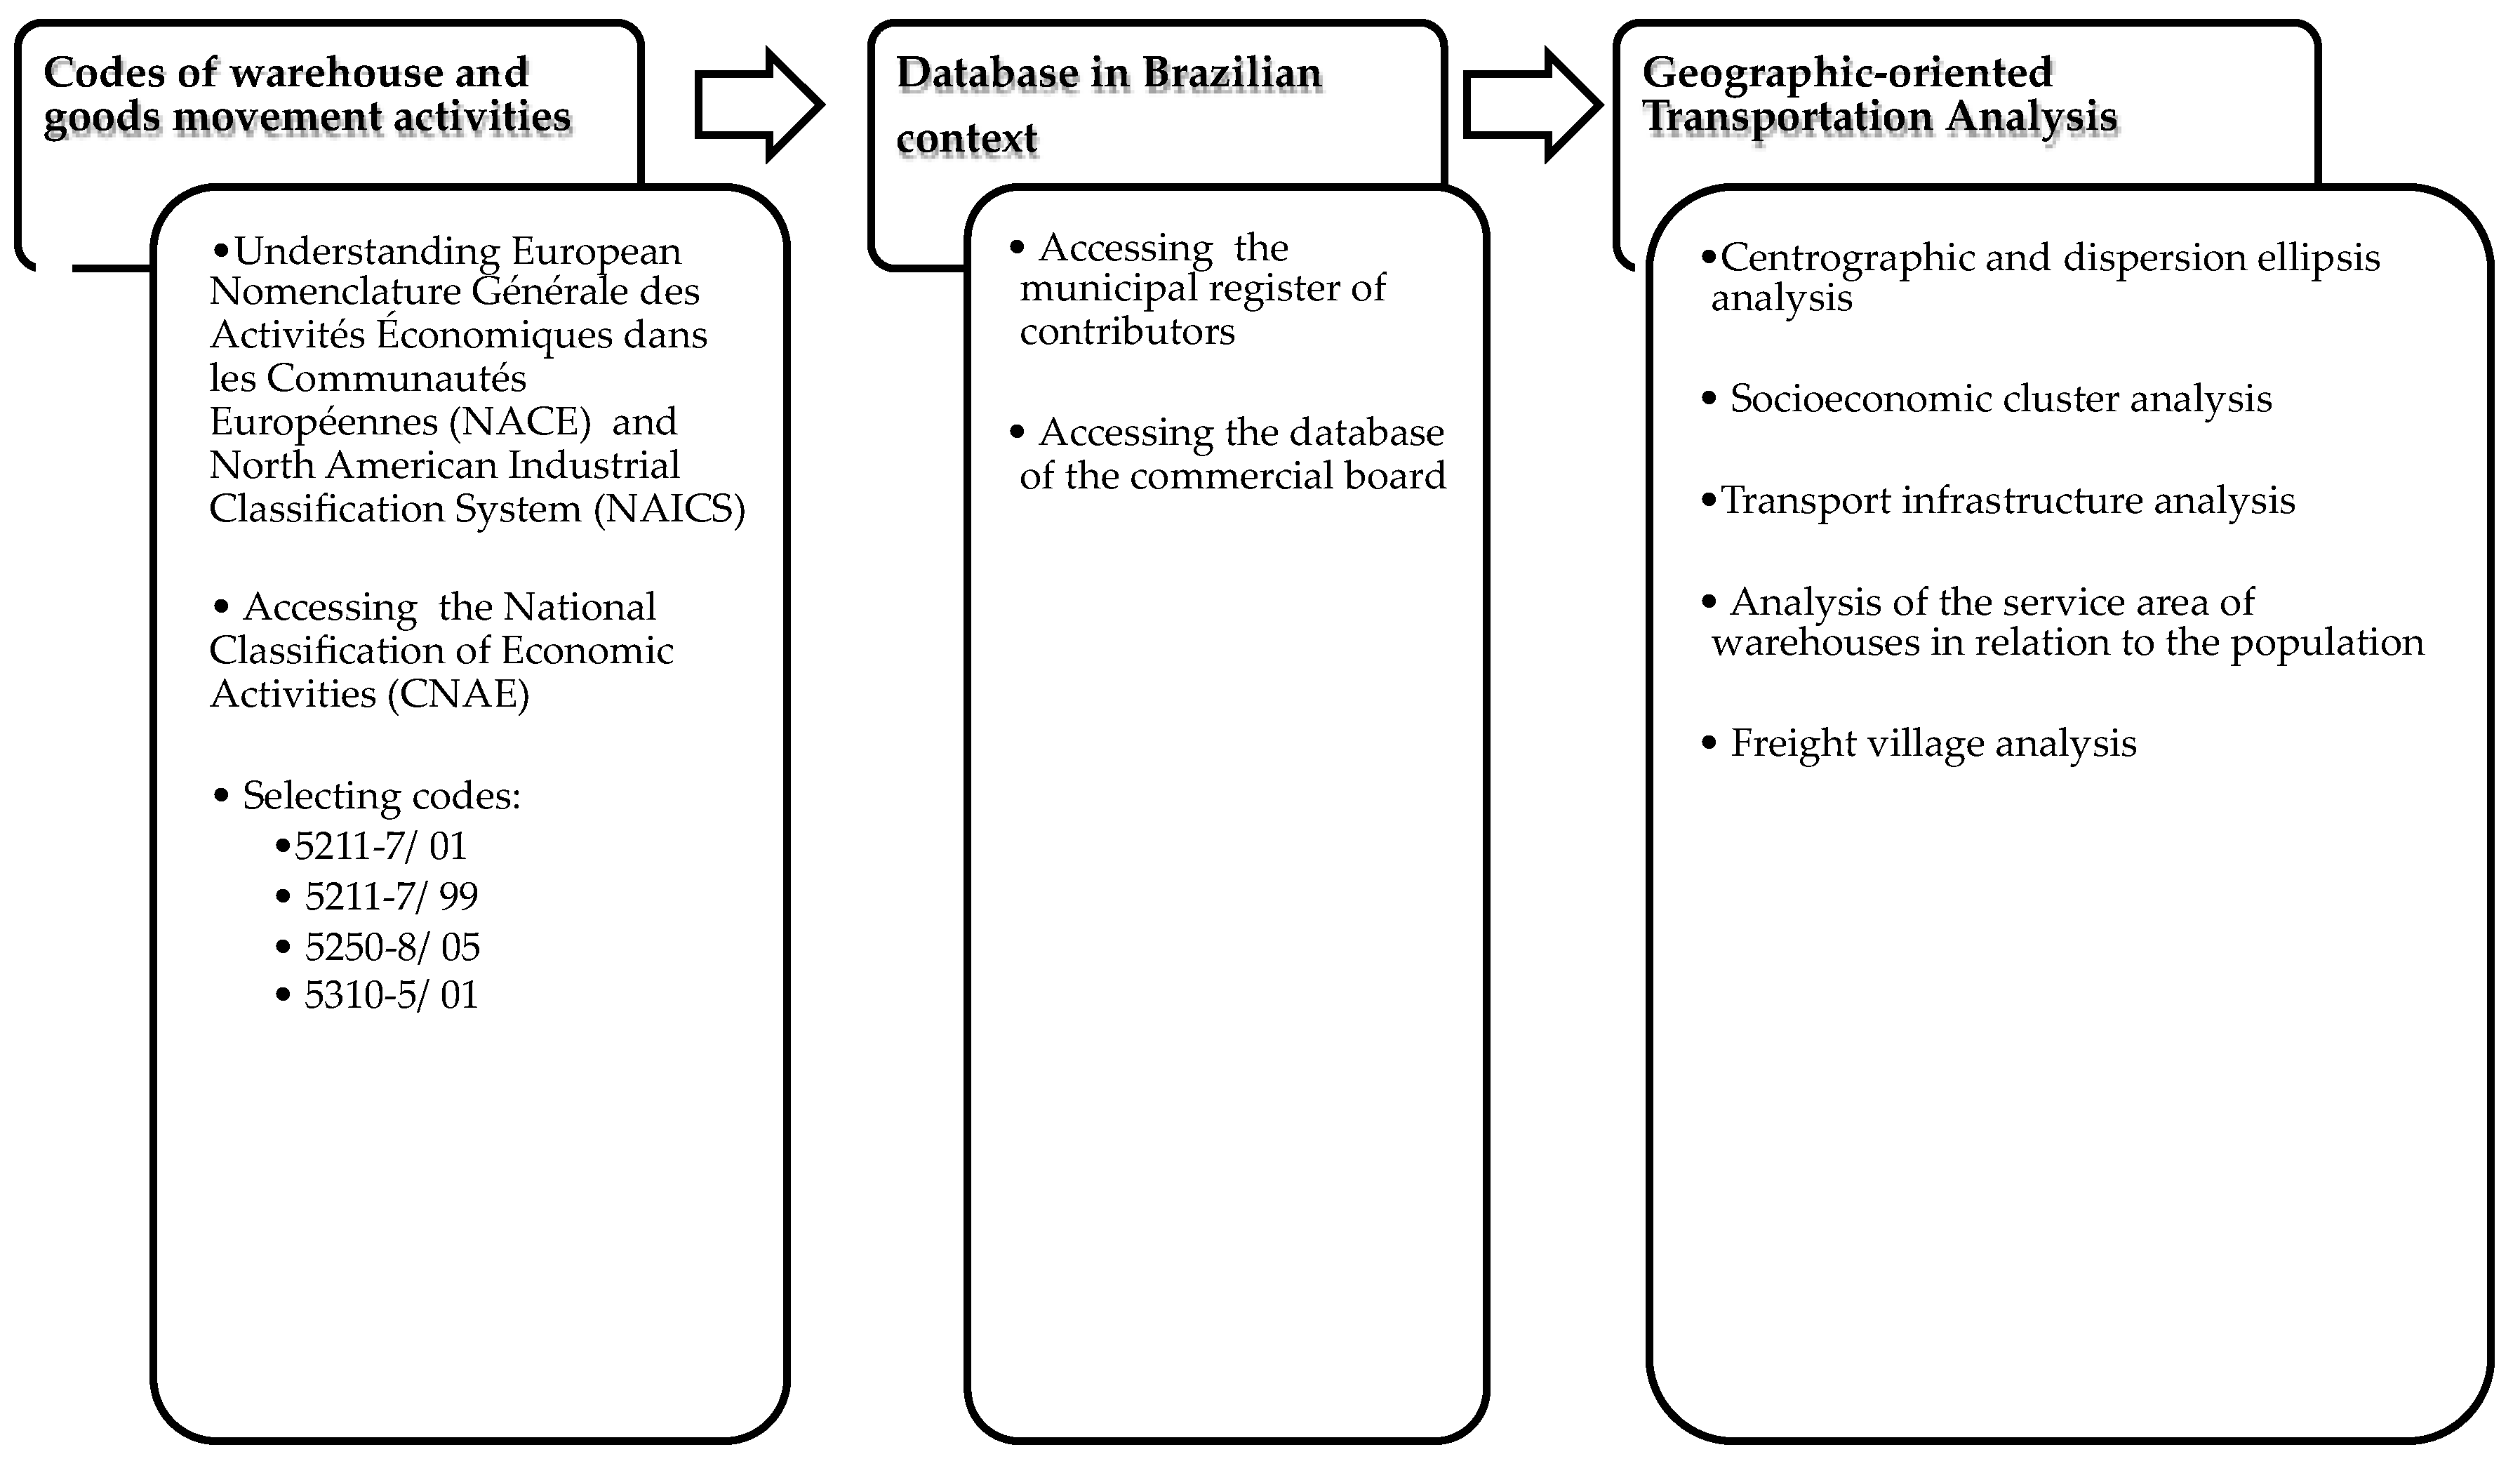
3. Results
The results are organized and presented in five sections according to the geographic-oriented transportation analysis section, as follows.
3.1. Centrographic and Dispersion Ellipsis Analysis
In 1995, there were 95 logistics facilities classified as warehouses, located in 16 cities of the BHMAMB (with a population of 3.8 million in those municipalities). In 2015, the same area registered 401 warehouses located in 24 cities (with a population of 5.5 million). The main descriptive indicators for the time changes from 1995–2015 of the warehouses’ locations are presented in
Table 2. The indicators show a growth of 322% in the number of warehouses in the analyzed period (20 years). Annually, the growth was 15.3 warehouses per year. In the study area, the concentrations of warehouses occurred mostly in three cities: in 1995, the cities of Belo Horizonte, Contagem, and Betim registered 82% of the warehouses (46%, 26% and 9%, respectively), while in 2015, this percentage was 79% (39%, 32% and 8%, respectively).
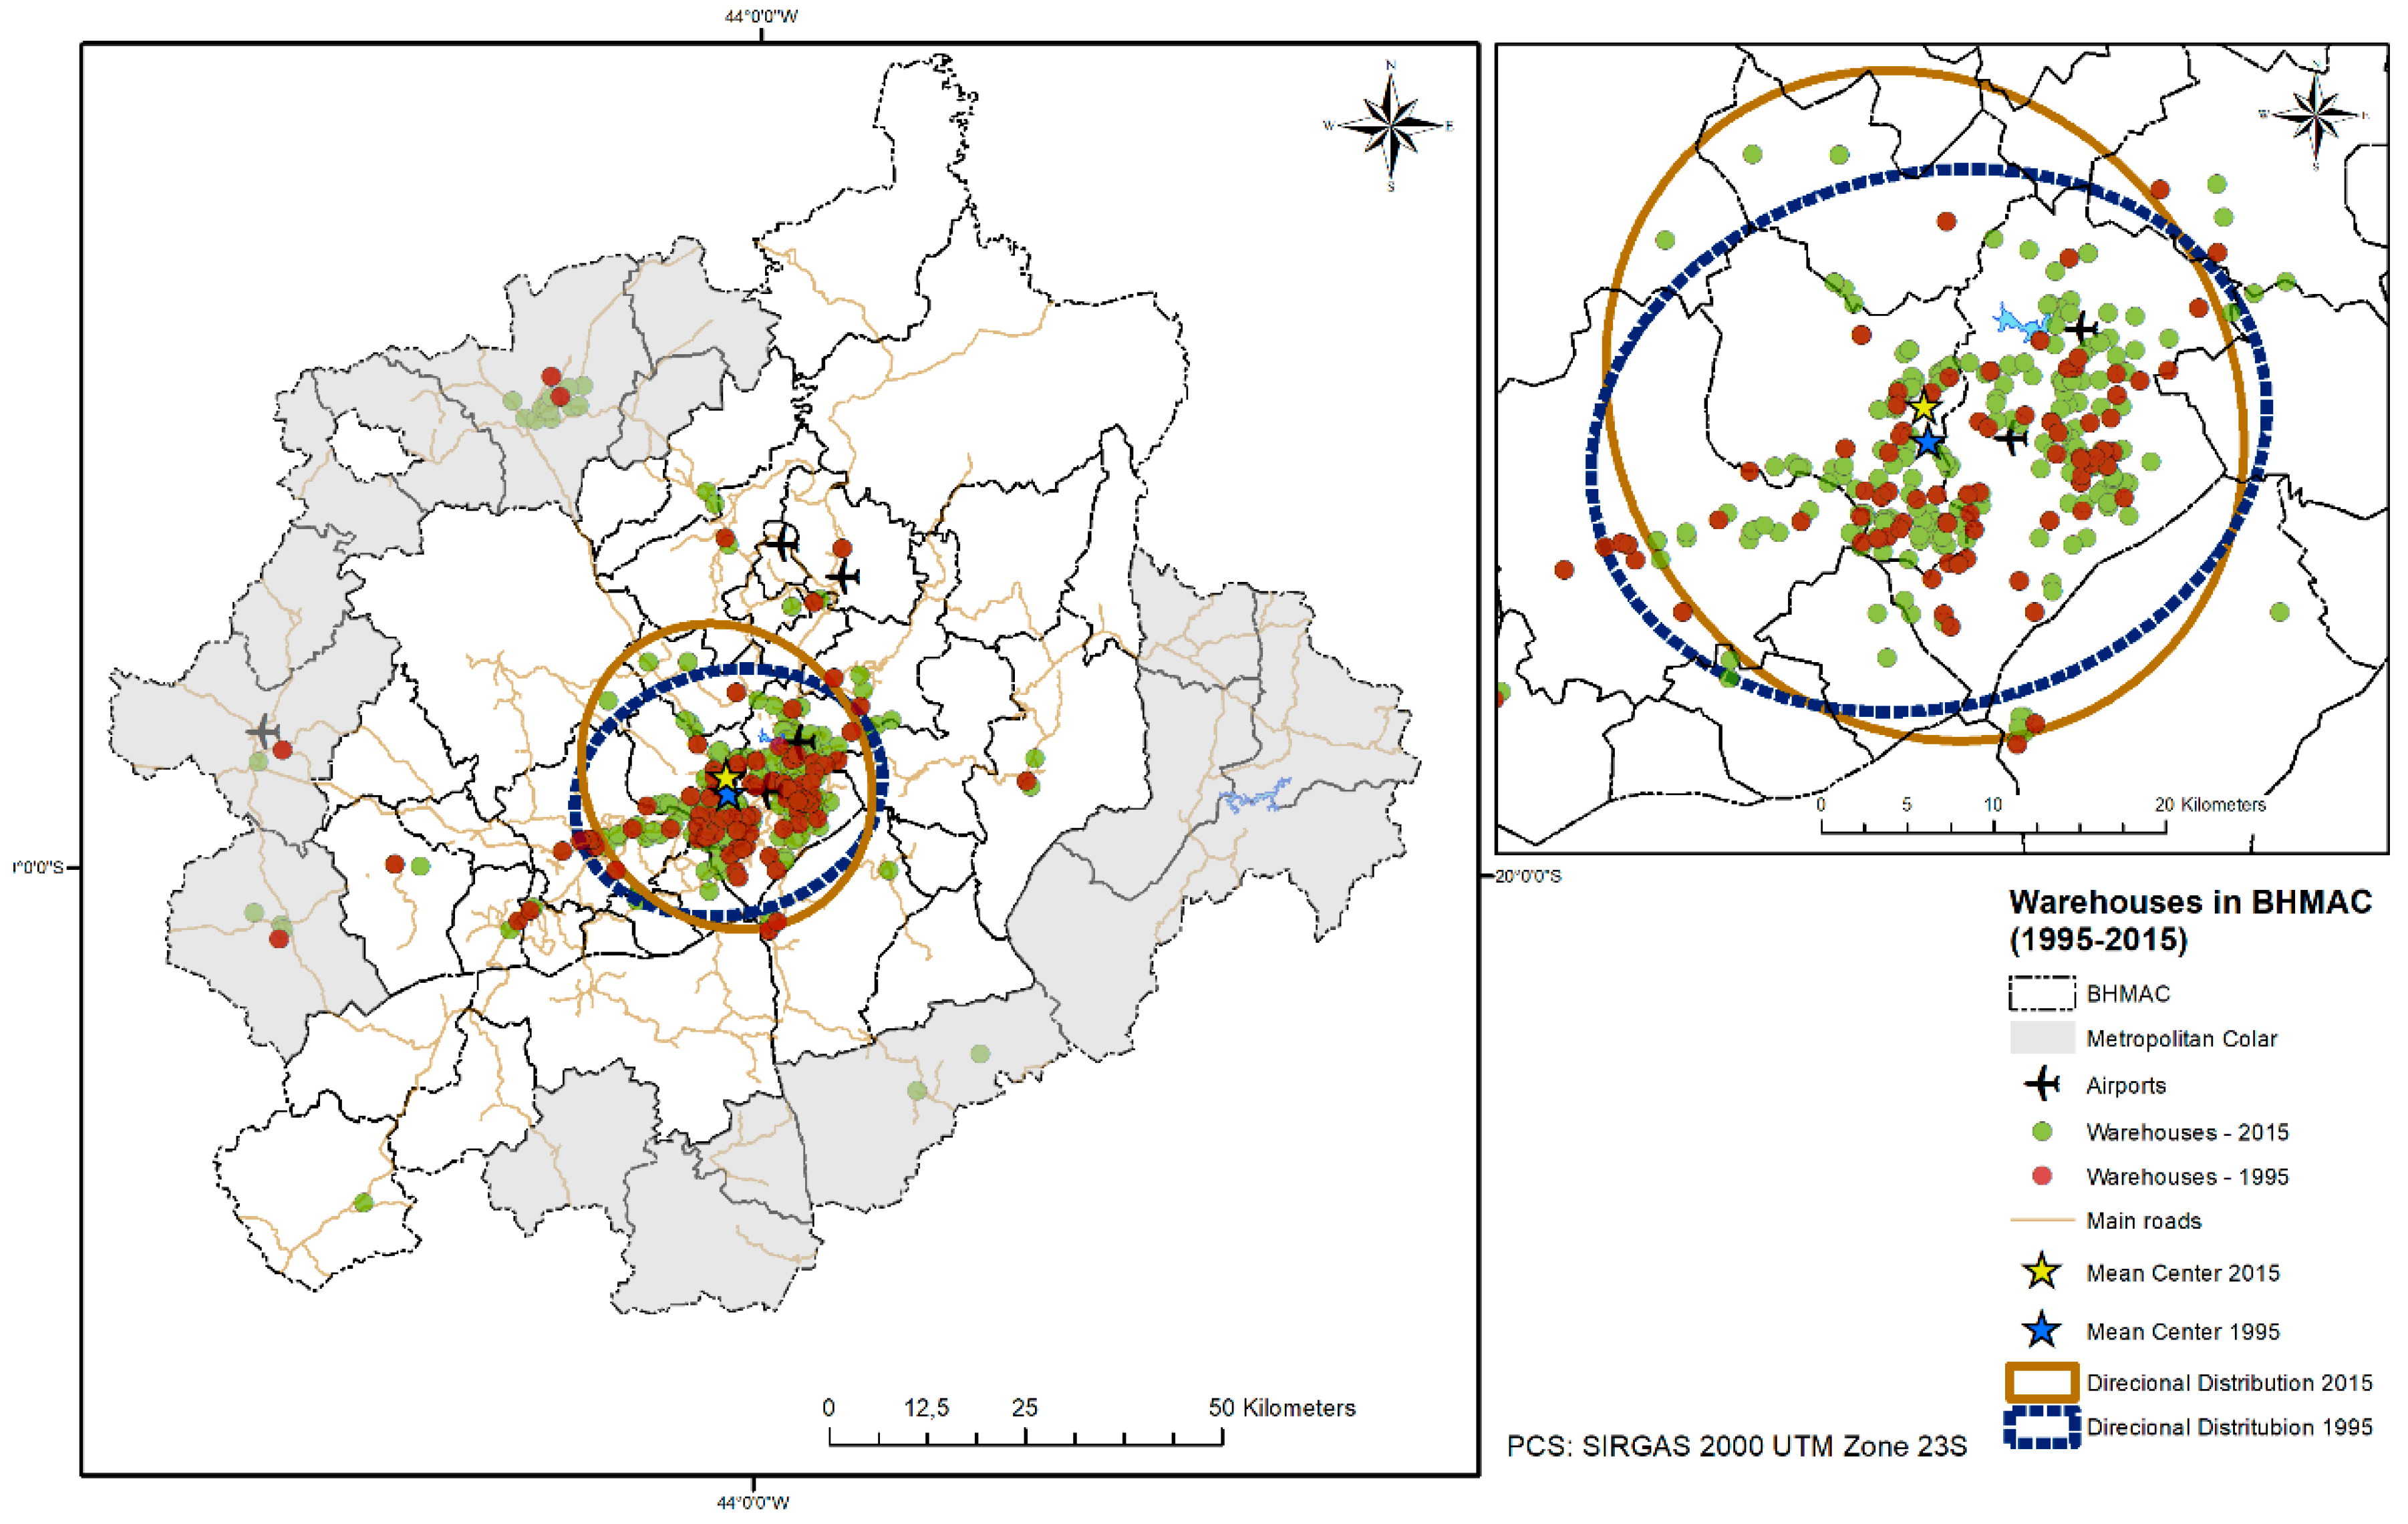
In
Figure 2, the spatial descriptive statistics (mean center, standard distance, and directional distribution) are presented in order to identify the changes in warehouse location in the BHMAC from 1995–2015. In 1995, the standard distance was 17.8 km from the mean center. In 2015, the standard distance was 19 km. These results indicate that the BHMAC did not experience a significant logistics sprawl during the 20 year period (with an overall increase of 1.2 km). In other words, warehouses have sprawled an average distance of 0.06 km per year. Given these results, it is likely that locational studies were carried out to identify the best location near the consumer potential market (which is consistent with our hypothesis).
In addition, in 1995, the directional distribution for the warehouses was in the east–west direction (dotted blue ellipse in
Figure 2). In 2015, there was a change in the spatial dispersion regarding the location of warehouses, with the main axis from the southeast to the northwest (continuous brown ellipse in
Figure 2). The change in the main direction of the directional distribution indicates that there is a new spatial conformation of the warehouses in the BHMAC, consistent with public policies that seek the territorial occupation of the north vector of this metropolitan area. Further, the economic development of Sete Lagoas, as an important city for the BHMAMB, was enhanced. These results corroborate the hypothesis that, in all likelihood, business owners utilized locational studies before the implementation of warehouses.
3.2. Socioeconomic Cluster Analysis
The socioeconomic cluster analysis aimed to integrate the spatial characteristics of the population and the potential market of the area. Therefore, we present the spatial concentration of warehouses in the clustered municipalities with strong potential markets (areas with a high income and population index). The results for the year 2015 showed that 321 of 401 warehouses (80%) are located within the area with a high Getis-Ord index (Z-score values higher than 2.0 represented in red in
Figure 3a and
p-values lower than 0.05 represented in blue in
Figure 3b), which represents 75% of the available area for warehousing. Additionally, the clustered area with a large potential market represents 73% of the BHMAMB population (4.3 million inhabitants). This analysis shows a strong concentration of warehouses overlaying the concentration of a potential market for last mile deliveries (high InPop values). Thus, we can conclude that the majority of warehouses located in the BHMAMB are destined to be logistics facilities for handling goods in order to ship to final consumers and retailers.
3.3. Transport Infrastructure Analysis
We analyzed the location of the warehouses within a maximum Euclidean distance from the road infrastructure, shown in
Figure 4. The warehouses are mainly installed close to the transport infrastructure with a strong concentration between Belo Horizonte and the municipalities located along the west direction of the highways BR-381, BR-040, and BR-262. Considering the railroad infrastructure, in 1995 100% of warehouses were located within a 5-km buffer from the railroad axis (95 out of 95). In 2015, 83% of these facilities were located within the same range (332 out of 401). Considering the road infrastructure, 91% of the warehouses are located within a 2-km buffer of the road axis (66 out of 95), and in 2015, 93% were located within the same range (371 out of 401).
These results indicate that the proximity to road infrastructure strongly influences the decision of where a new warehouse should be located. As a result, the warehouses are located close to the clustered municipalities with the highest InPop concentrations (which may be understood as a higher concentration of potential consumption). Still, the concentration of logistics facilities near the intersections of highways is a factor that needs attention from policy-makers and transportation authorities. This concentration and, consequently, the volume of freight vehicles generated by the warehouses have the potential to contribute to the generation of congestion, resulting in negative impacts for the region.
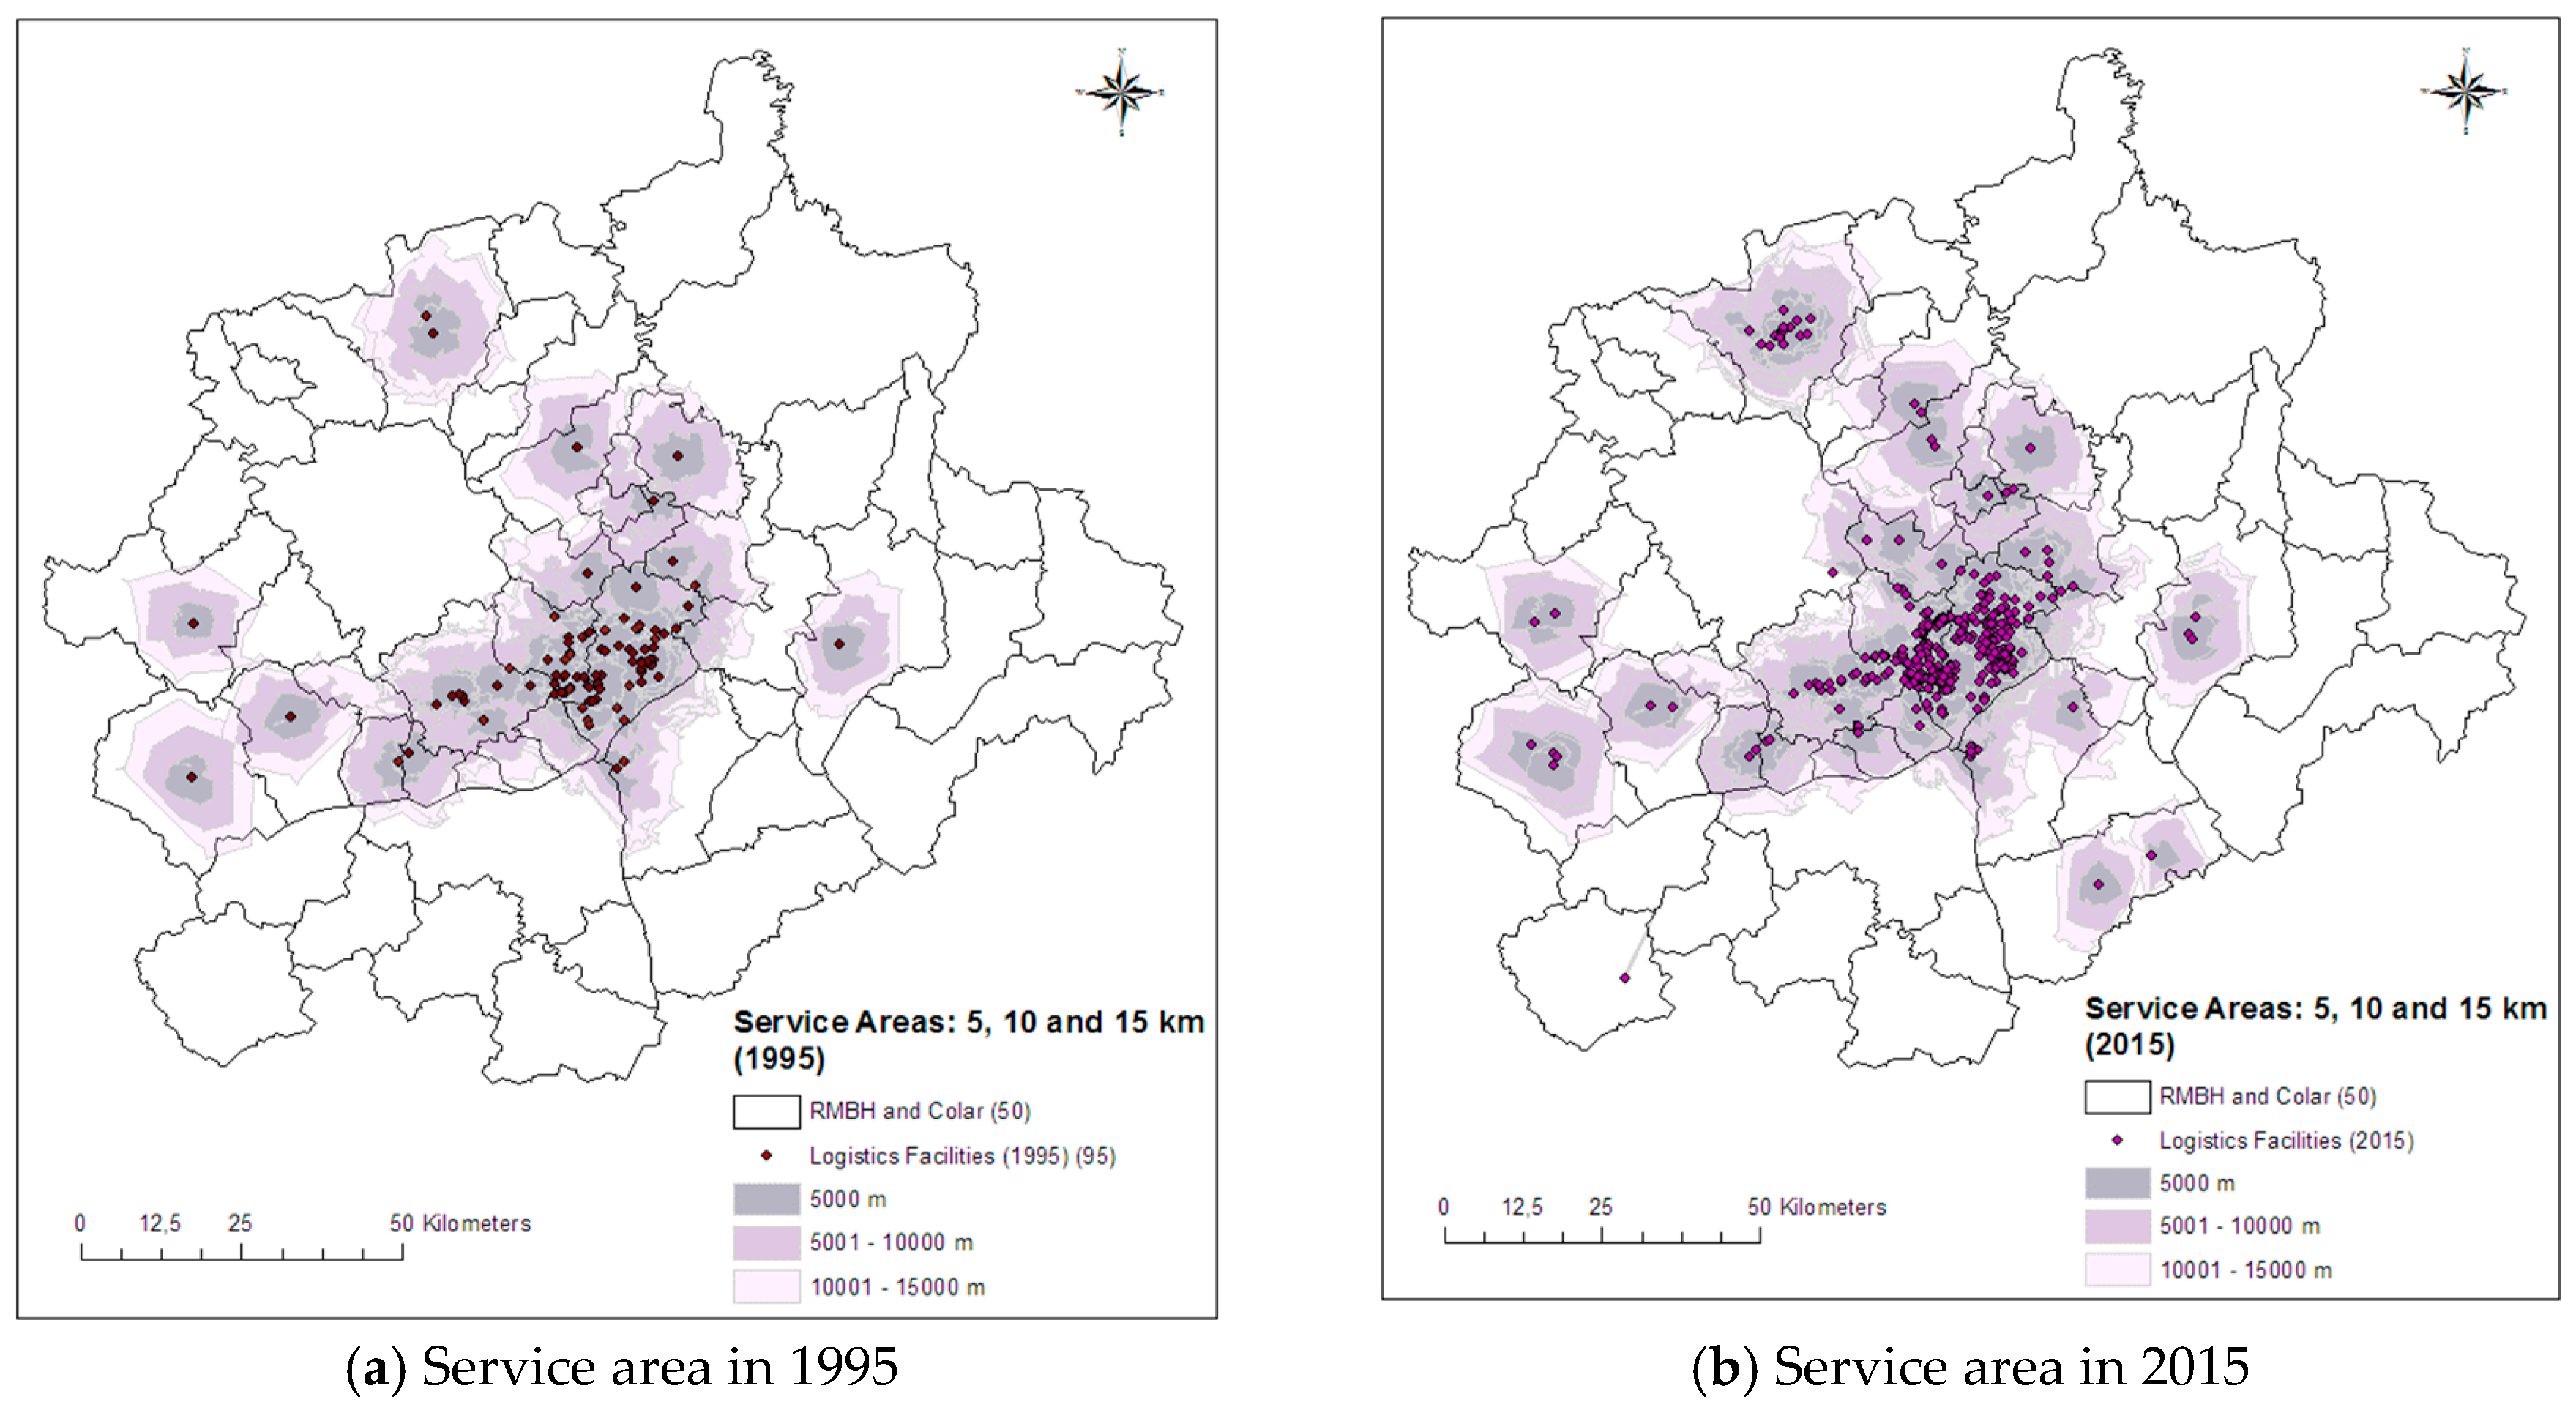
3.4. Service Area of Warehouses and Respective Population Served
The service area of warehouses and the respective population served is important if we consider home deliveries. We analyzed three ranges (5 km, 10 km, and 15 km) to evaluate the number of inhabitants that could be served by the warehouses located in the BHMAC (
Figure 5). In
Table 3, we detailed the service areas and the percentage of inhabitants served by the warehouses. The results show a wider coverage in the 15-km range. The results also indicated these warehouses have the potential to provide home deliveries, and we may conclude that the warehouses are concentrated in the same areas where the population to be served is located. Additionally, the concentration of people implies a concentration of commercial establishments. Therefore, we can surmise that the warehouses are located near those facilities where there may be a concentration of retail deliveries.
In addition, another analysis considered the spatial structure of the warehouses in 1995 and 2015, with regards to large segments of the population within the study area. The findings showed that the structure of the warehouses for 2015 demonstrated a good spatial distribution for urban deliveries (strong adherence among the cluster of the warehouses and the needs of the local population (market)).
3.5. Analysis of the Freight Village Proposed in the Master Plan of the BHMA
In the final analysis, we considered the BHMA’s Master Plan, developed in 2011. This Master Plan predicts the installation of freight villages (short-term for 2015) and public spaces for storage for the purpose of urban goods distribution in Belo Horizonte, without estimating the flow of vehicles or goods and the market served. Data from CeasaMinas, which is the largest trade center for agricultural and food products in the state of Minas Gerais, showed that in 2015 CeaseMinas attracted 24,170 freight vehicles each month—moving, on average, 1,949,000 tons in that year. Thus, if these logistics platforms had similar flows to CeasaMinas, a new transport infrastructure would be required to ensure freight mobility.
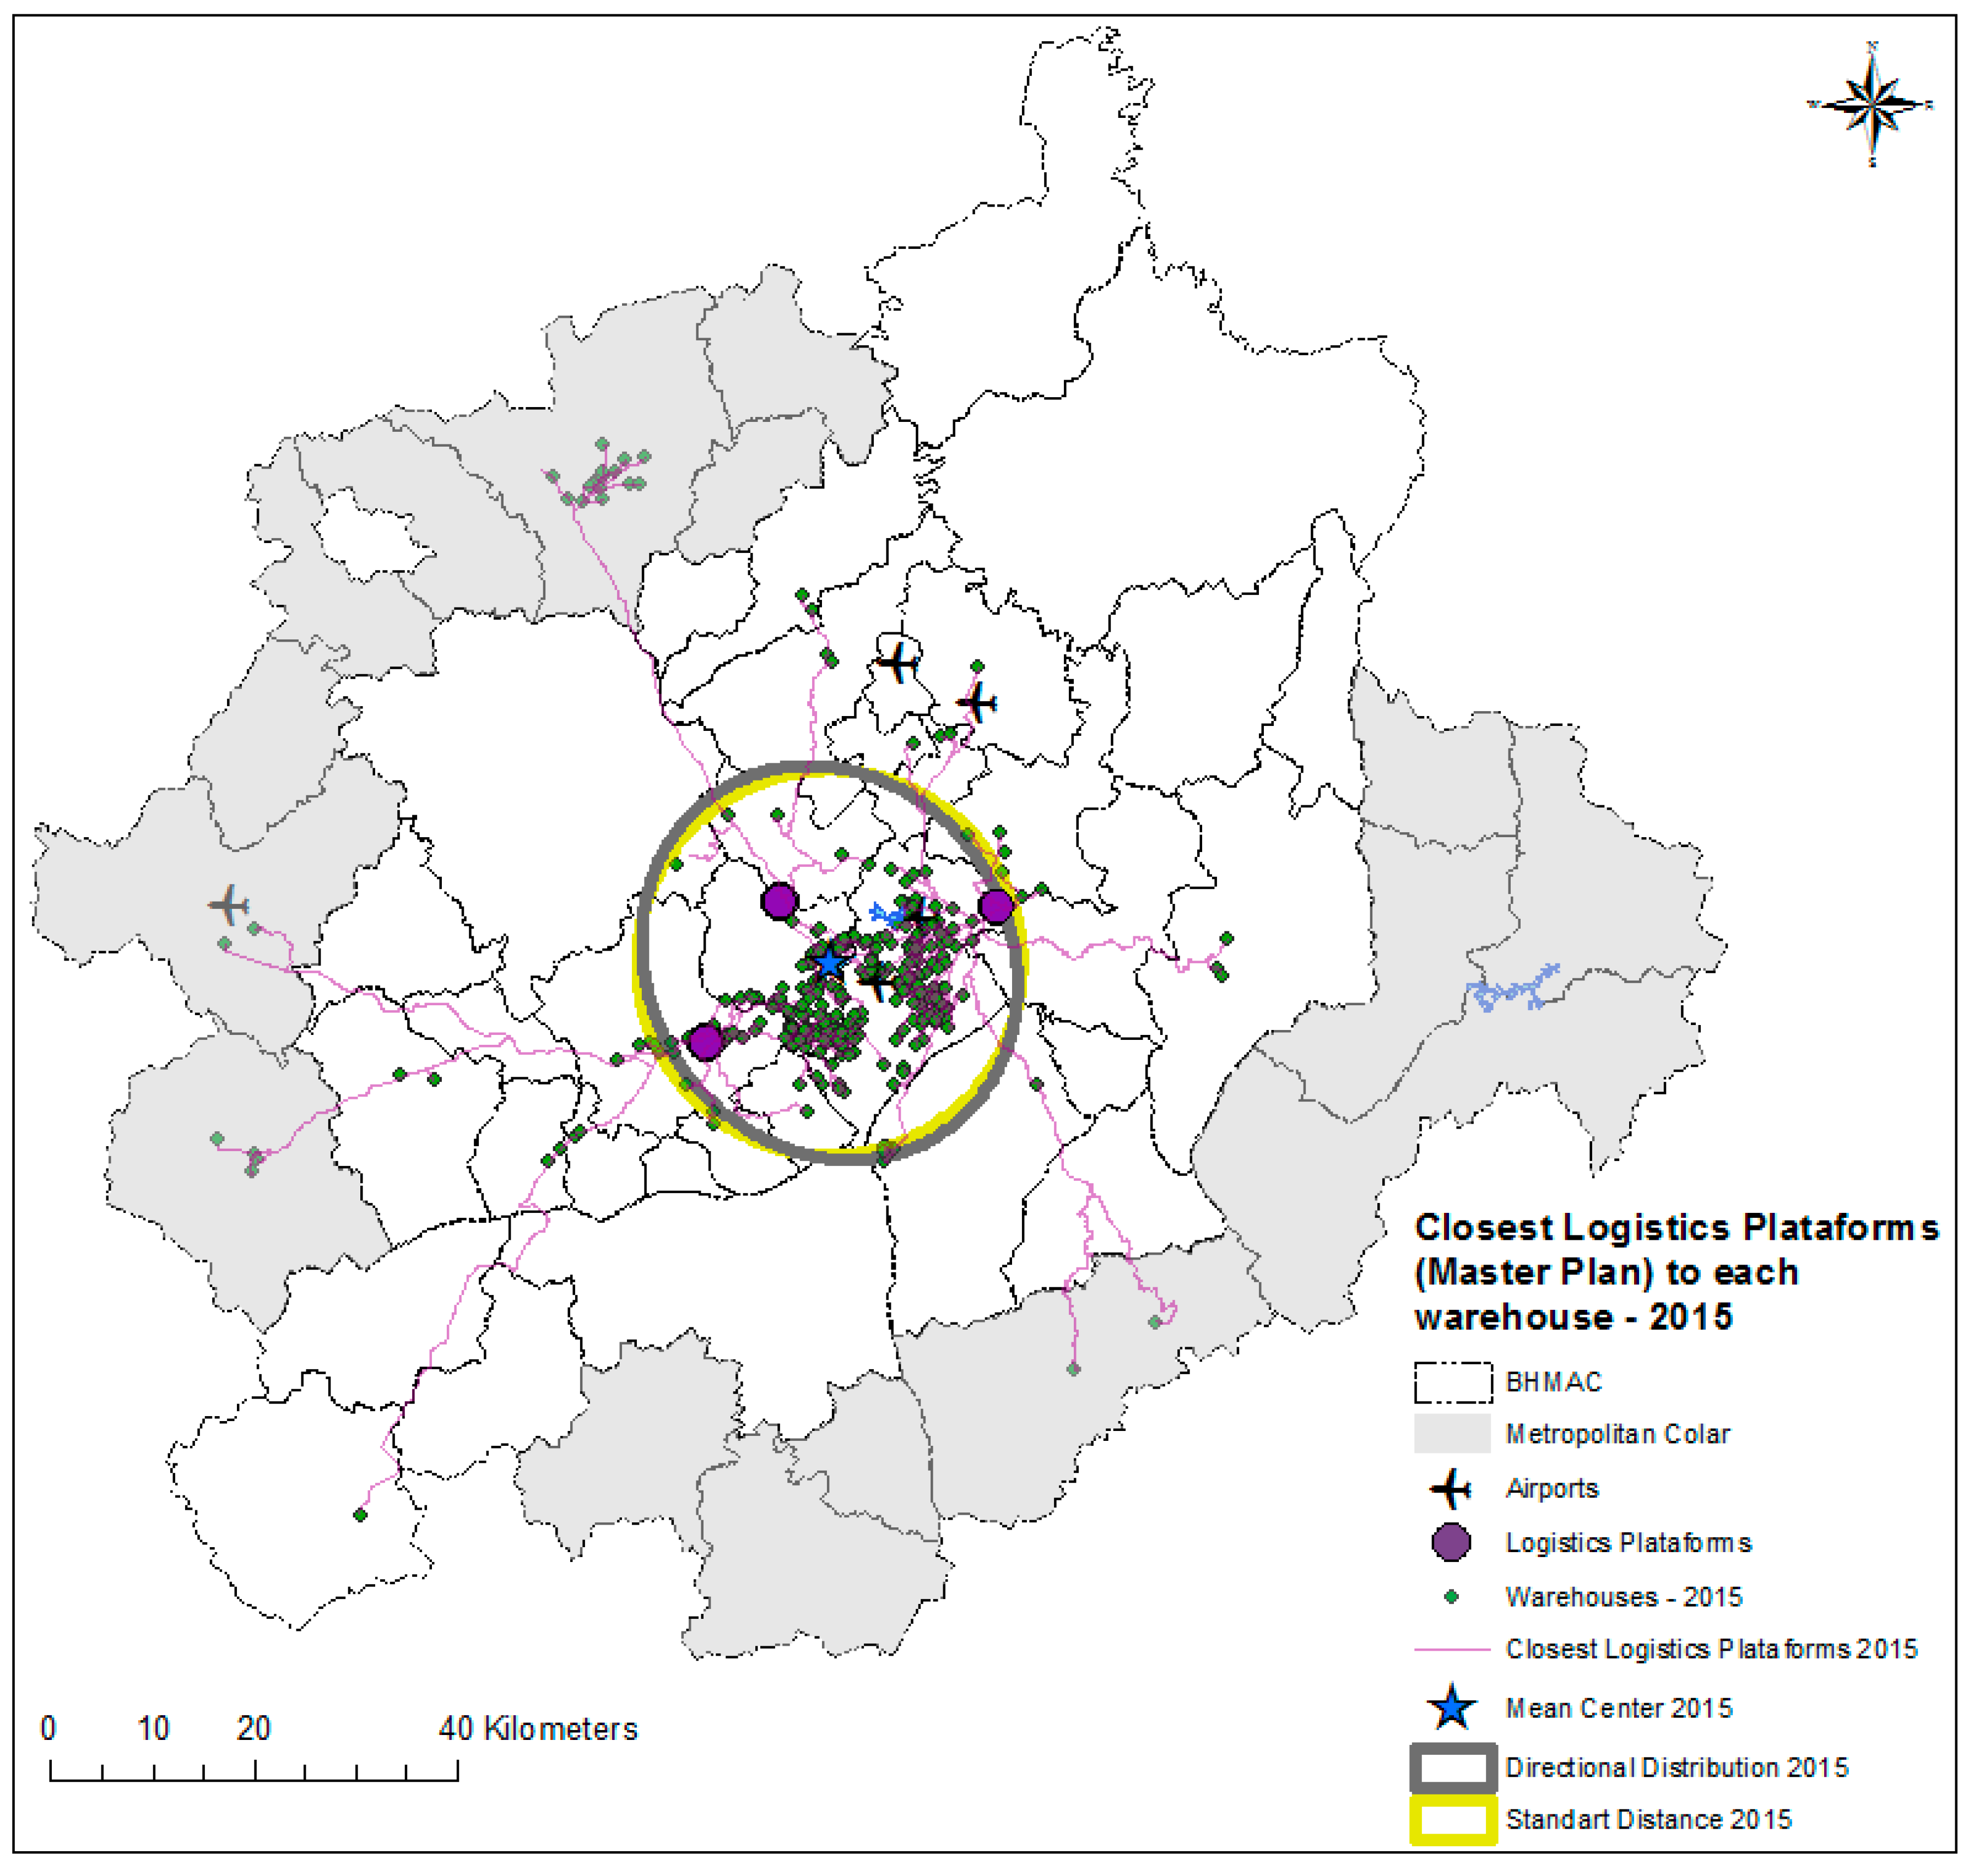
Regarding the Master Plan of the BHMA, we presented the location of the three freight villages (FV) suggested in 2011 (but not yet implemented) in
Figure 6. The FV-South is located near the intersection of highways BR-356 and BR-040, in Nova Lima—a place with a high concentration of mining activities and low real estate exploration. The FV-North needs to be prioritized because it is located in a region of accelerated growth, and due to the investments and needs that may arise through the deployment of this infrastructure. In addition, the proximity of the international airport and the railway infrastructure can enable the multimodality of the FV, contributing to the attraction (inbound) of products of small dimensions and high added value, as well as low added value products for the industry. The FV-Northeast is closer to other warehouses already installed. Due the time elapsed since the planning and until possible implementation, these FVs will find a saturated market regarding handling and warehouse capacity, or there may be no land available for FVs. If this is the case, studies are needed to avoid the imbalance and inactivity of the existing logistics infrastructure in the region. We ran a simulation to analyze the LS indicators, including the three FVs in the dataset in 2015, and the results indicate that these installations do not interfere with the dispersion of the direction of the ellipse and do not contribute to the LS indicators.
These results indicate that there are uncertainties about where and how FVs should be implemented. Thus, the effective insertion of urban freight transport into metropolitan and municipal mobility plans becomes imperative. Attention should primarily be paid to the possibility of creating a logistics sprawl phenomenon with new infrastructure projects if they are undertaken without impact analysis. In addition, these new infrastructure projects need to be supported by green strategies in order to obtain positive results. Furthermore, the implantation of the FVs must be planned together with a strategy of land use and occupation that is well-structured and discussed with the municipalities of the region.
5. Conclusions
The adaptation of the methodology to analyze logistics sprawl in the Brazilian context encourages the development of new studies on the subject in Brazil, making possible future comparisons and the joint discussion of solutions for the distribution of urban goods in a regional context. This is important because of the impact of urban freight transport on road infrastructure; understanding the phenomenon involved allows for the identification of problems and the development of solutions that reduce the use of road infrastructure and, consequently, reduce congestion—one of the main impacts of urban freight transport.
Our findings indicate a significant increase in the number of logistics facilities and minor logistics sprawl in the BHMA. Among the possible causes for the minor logistics sprawl is the investment in the northern region of the BHMA and the public policies adopted by the cities neighboring Belo Horizonte, mainly Contagem and Betim. The current challenge for the metropolitan region of Belo Horizonte is the implementation of integrated municipal and metropolitan strategies to reduce the effects of urban freight transport and, consequently, improve the quality of life of the population. It is fundamental to understand the relationship between transport infrastructure and land policies, location, and freight trip generation in order to define effective public policies. Limitations of this research include the availability of secondary databases which, despite not presenting direct data on urban freight transportation, allowed us to proceed with the proposed analysis. Still, the availability of data could be a challenge for such analyses in other Brazilian metropolitan regions. However, other databases can be used, such as electronic invoice data and freight surveys.
Finally, the data did not reveal the factors of logistics sprawl. Thus, the investigation of the factors that influence the location of logistics facilities and understanding these factors could be useful in improving urban freight planning at the metropolitan level, through informing more efficient public policies.

 ,
, 


