Developing an Intelligent PostGIS Database to Support Accessibility Tools for Urban Pedestrians


1
Department of Electronics and Telecommunication Engineering, Mbeya University Mbeya of Science and Technology, Mbeya, Tanzania
2
College of Informatics and Virtual Education, University of Dodoma, Dodoma, Tanzania
3
Dipartmento di Elettronica, Informazione e Bioingegneria, Politecnico di Milano, 20133 Milano, Italy
*
Author to whom correspondence should be addressed.
Urban Sci. 2018, 2(3), 52; https://doi.org/10.3390/urbansci2030052
Submission received: 27 April 2018
/
Revised: 14 June 2018
/
Accepted: 14 June 2018
/
Published: 22 June 2018
Abstract
:People with mobility impairment must travel through cities with extra care. An intelligent database of Maps for Easy Paths (MEP) project for storing and retrieving accessibility information about a particular path by using PostGIS may enable the public to enjoy the privilege of the technology that alleviates the problem of city accessibility through the Web or, more recently, through smartphones/tablet applications. The methods and techniques for intelligent database to storeand retrieve accessibility information by using a relational intelligent PostGIS database are described. The conceptual data model is designed for an intelligent database (PostGIS). Users will be able to actively participate in the process of taking pictures of obstacles, uploading them to the MEP server and giving some comments on the attributes of the picture of the barrier. The resulting data will help others to locate and evaluate paths. This paper presents the conceptual data model design as well as a review of features of the data of the existing systems. Therefore, the novelty of this approach lies in developing an intelligent database for the enrichment of geographical maps with information about the accessibility of urban pedestrian areas for people with mobility problems.
1. Introduction
In the recent years, there has been an exponential increase in the number of smartphones, tablets, and PCs as well as their applications. In today’s life, using Information Technology, specifically smartphones or tablets or PCs, has become very common and thus paving way for users to have the ability to view and access information on the accessibility of paths in a cities. Parallel with this exponential increase in the use of smartphones, tablets and PCs is the availability of public data that provides for a potential use of Geo-located content, at low cost and infrastructure-less source of information for urban sensing in Smart Cities.
1.1. Smart City
It is estimated that by 2050 nearly every two out of three persons will be living in urban areas. According to the World Health Organization (WHO), the World Bank (WB) and the United Nations Educational, Scientific, and Cultural Organization (UNESCO) more than one billion people have some form of disability in the world. This corresponds to about 15% of the world’s population [1]. In this regard; travelling through cities is one of the main concerns for people with mobility challenges .
Despite their ongoing popularity and influence, there is no universal definition for smart cities. Indeed a number of related terms such as “intelligent city”, “knowledge city”, “digital city”, and “ecocity” are used interchangeably in the literature [2,3,4]. The advent of smartphones and tablets with the citizen sensors and participatory sensing may enable the public to enjoy the privilege of the information technology that alleviates the problem of city accessibility through the Web or, more recently, through smartphones/tablet applications. Thus, people with motor impairments, will constantly find the set of data that provides more up-to-dated information about the paths which a target user may choose.
Reference [5] contend that many wheelchair users hesitate to visit an unfamiliar place because they have no information about the new environment and the accessibility of its paths. The study revealed that people with mobility impairments tend to rely on repetitive and regular routes with least obstructions for their daily movement in a predefined area. Unfortunately, relying on repetitive and regular routes constitutes a big disadvantage to the people with mobility challenges. In this do or die era, navigation software are available for various smartphone devices capable of using GPS sensors for positioning. Therefore, these changes in city streets can be anticipated and avoided by the people with mobility challenges if a dynamic database to improve the accessibility of the cities could be designed. A dynamic database has content that enables people with mobility challenges to move freely in the urban area without the limitations of barriers such as the roots of trees, potholes, and architectural barriers. This content enables the execution of two main activities. First, the registered user (person with mobility challenges and active citizen) is the main user who can access the information about the accessibility of the paths on their smartphones/tablets/PCs, as well as create, update and delete (CRUD) the comment concerning the path. Likewise, the registered user can visualize all the provided information, such as the one inserted by another user; the data computed on the server (e.g., the path); and user profile data. In contrast, the non-registered user can only visualize all information about the accessibility of the paths on their smartphones/tablets/PCs. Thus far, most of the navigation databases are static and cannot be created, updated and deleted. The envisioned dynamic database will allow creation, updating, and deletion of information about the accessibility of the paths. Therefore, the envisioned conceptual data model of the dynamic database provides an opportunity for the user to make an informed decision about the alternative paths. The work presented in this paper proposes a conceptual data model for updated dynamic database (PostGIS) for Maps for Easy Paths, or simply MEP project, on smart phones for navigation.
1.2. MEP Project
Maps for Easy Paths (MEP) is an ongoing project (http://mep5x1000.wixsite.com/mepapp) aiming at providing a set of tools and innovative solutions for the enrichment of geographic maps with information about the accessibility of urban areas for people with mobility challenges. The designed conceptual data model focuses on modeling the reality of the sidewalks of the point of interest (POI) using modeling constructs that are closer to the user and independent of the model adopted by the DBMS. This design allows users to access the information about the accessibility of paths for all sorts of points of interests (POIs) such as public toilets, metro, handicapped parking, etc. and helps them to navigate throughout a city while following the ideal route and avoiding all architectonic barriers and obstacles. Likewise, users are able to access the public transport system status through the visualization of the vehicle’s position in a specific urban area.
The following are the target users:
- Registered Users (Disabled and active citizens) and non-registered users. Both of these users can visualize all information about the accessibility of the paths on their smartphones/tablet/pc.
- Registered user (disabled and active citizens). These are the main users, who can access information about the accessibility of the paths on their smartphone’s/tablet/pc and can create, update and delete (CRUD) all the provided information, such as: user profile data, information that has been inserted by another user, comments, elements, barriers, pictures, accessible toilets, parking lots, accessible transportation, bus and metro stops.
- Municipalities, local governments and organizations that might be interested in this type of information to better plan interventions and help in creating accessible cities.
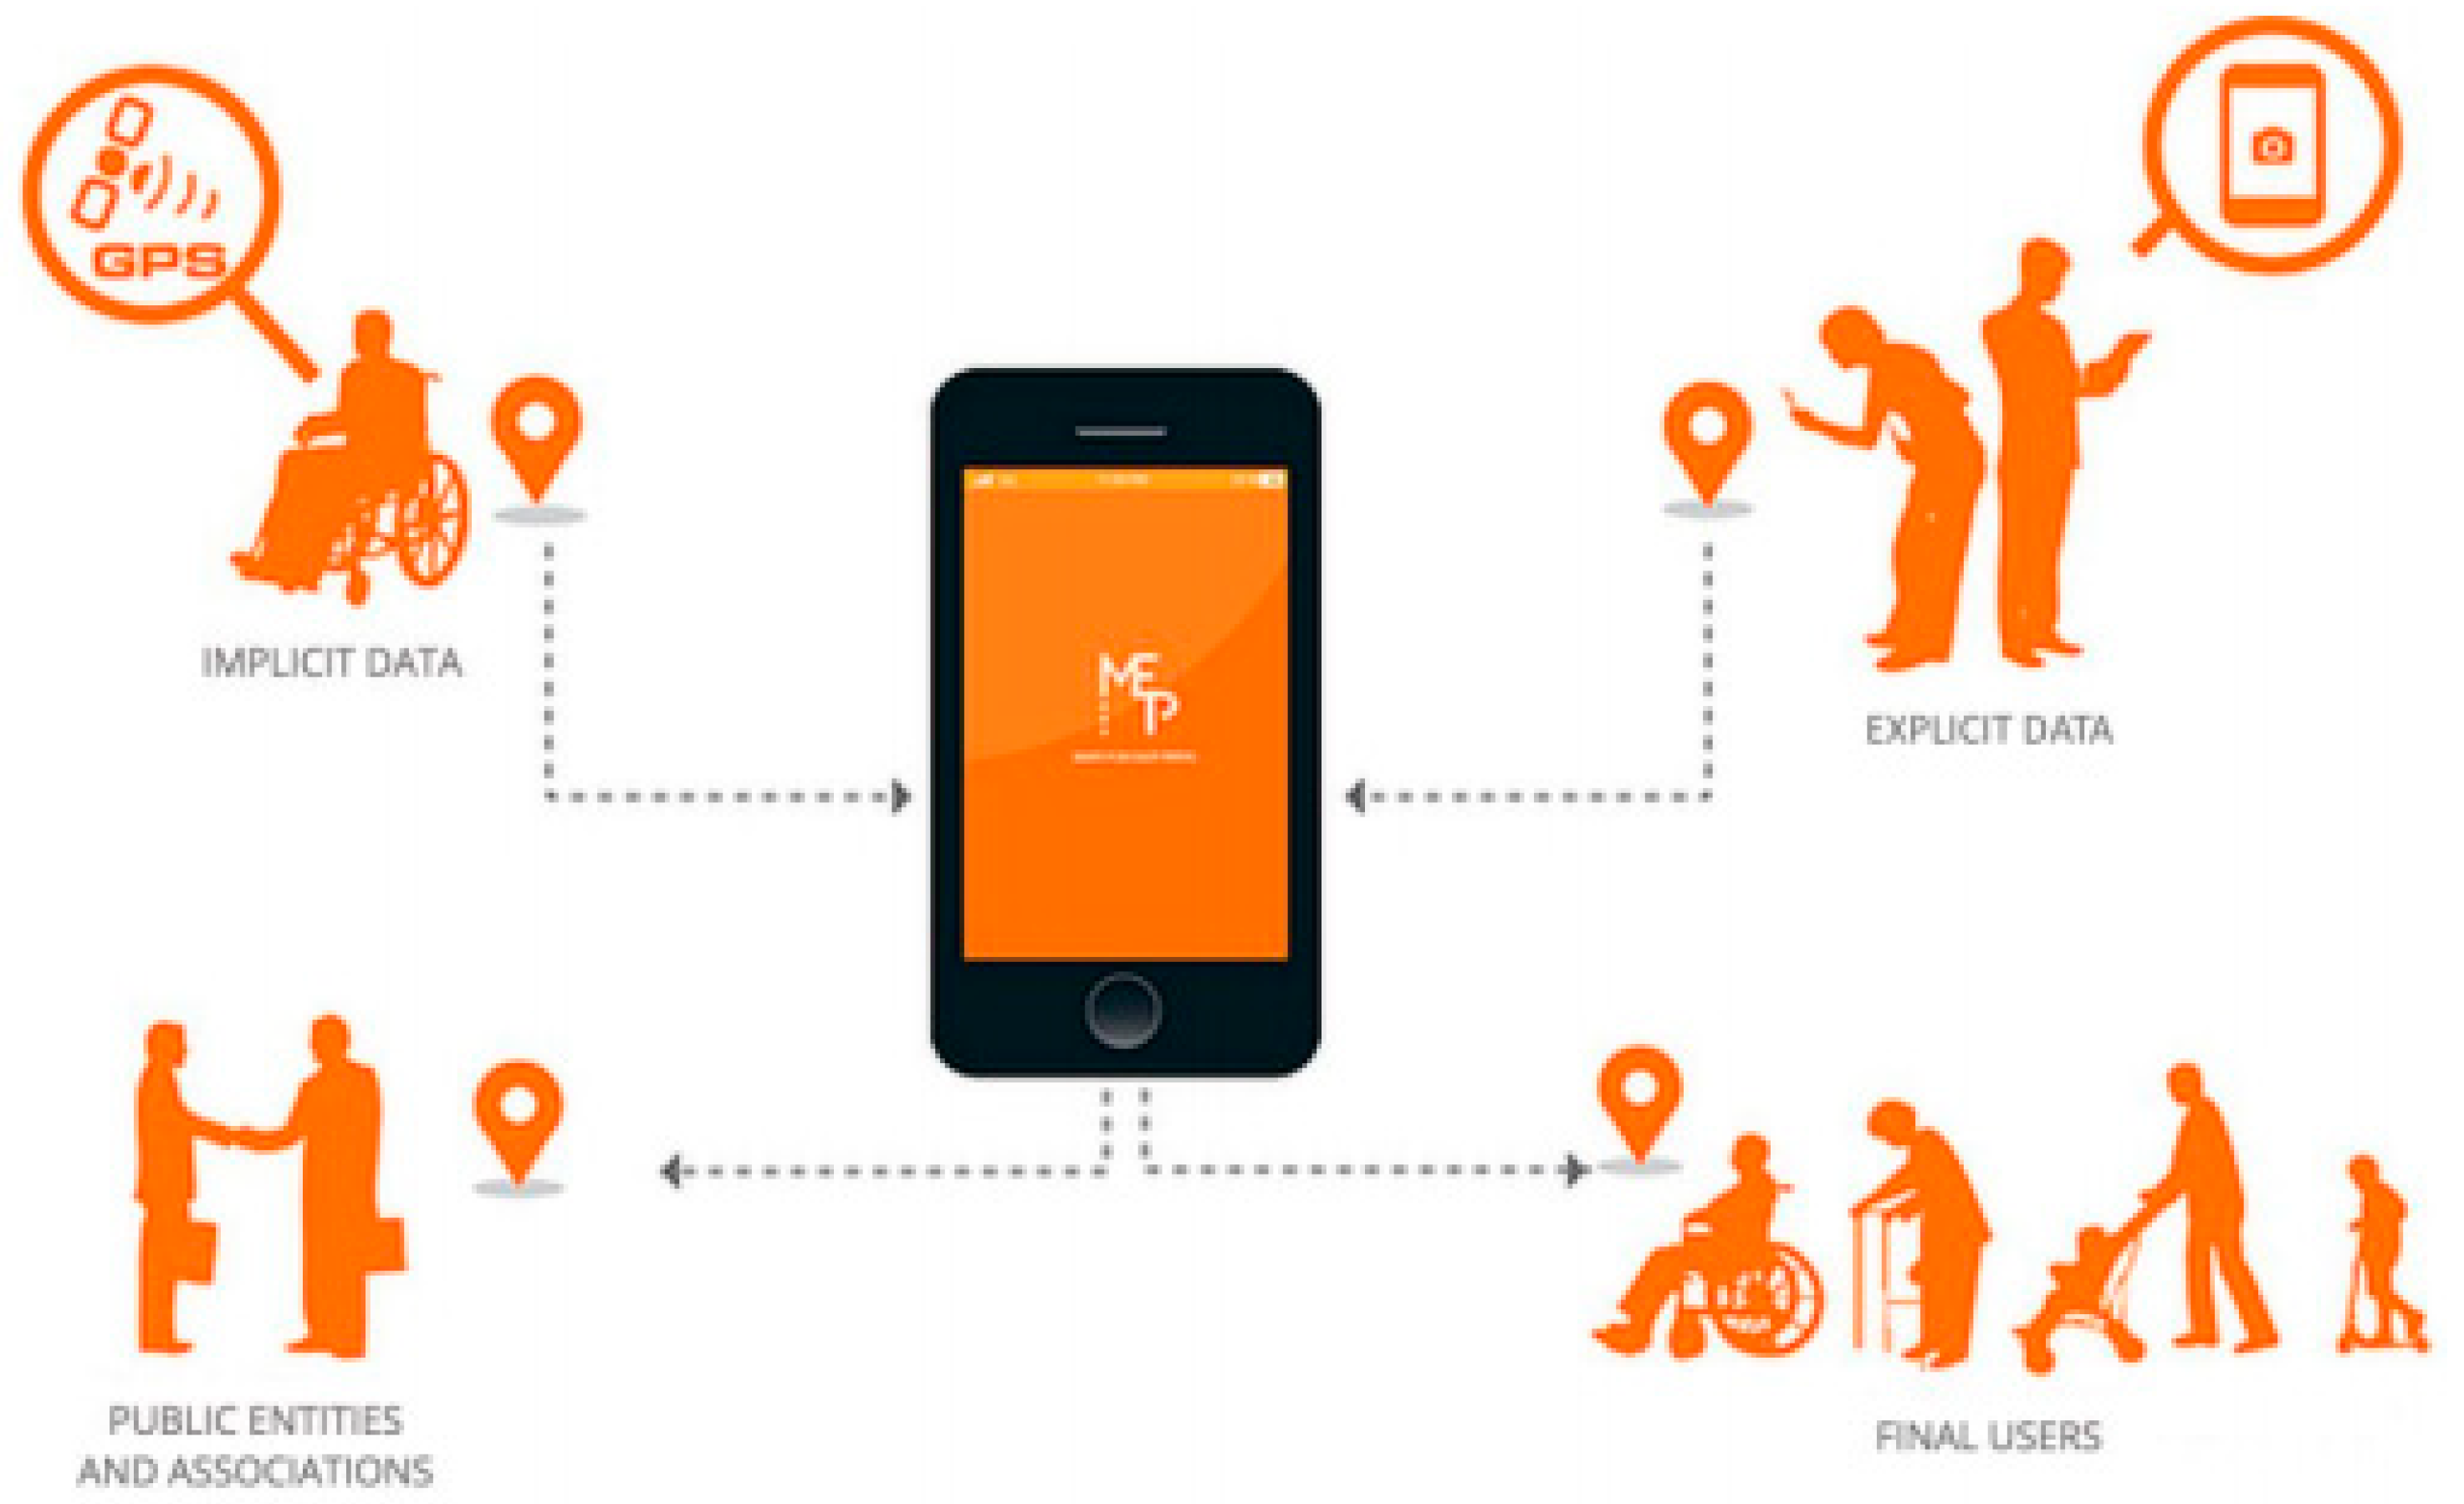
The entire scenario of the project can be described as shown in Figure 1.
1.3. Methods of Data Collection
This section explains the methods that were used for data collections, personal information such as the type of disability or more complex elements such as photos and comments useful for sharing any reports, data sensors from smartphones and tablets and display preference information on a cartographic map was collected.
Information on the following as collection procedures are summaries in Figure 1:
- Explicit data the design required creating a personal account explicitly providing personal information such as profile picture, name, email address, city of origin, type of disability and possible mobility problems in an urban context. By agreeing to authorize the use of the name and profile picture, other subscribers to the service could view any photos/comments associated with reports made on a cartographic map. Other information such as email address, city of belonging and type of disability is considered protected and not viewable by third parties and/or other subscribers to the service. On the other hand, users are allowed to actively participate in the process by taking pictures of the problems and barriers they face in the city; these pictures together with sensor information will be uploaded to the server.
- Implicit data (no intervention required by the user): These are collected from the smartphone/tablet. Information on the GPS position and device sensors during user navigation, such as accelerometer, magnetometer and gyroscope forms part of implicit data. These data are aggregated and merged with other data collected from other users in order to process them to ensure optimal and personalized service on the private profile of the person using that service. The user/visitor viewing on a map cartographic data collected will not be aware of the contributions sent by individual users. No data from the MEP service will be communicated or released unless the user assesses the possibility of sharing such information on other social networks such as Facebook and Google+ directly from one’s profile.
- Other types of data collected includes: data associated with the user during the acquisition phase of data sensors, such as the type of device and a unique identifier, the version of the kernel and the operating system, the status of the other various types of active sensors during the acquisition and the battery consumption. These data are used for statistical purposes and research.
Anonymous data are included in order to improve the implementation and administration purposes. This information is anonymous and therefore does not identify any individual. The collected data can include location, device/computer, operating system, device model, and user actions.
References [6,7] report that the independent mobility is an important dimension of quality of life for individuals with mobility impairments such as a user in a wheelchair, or with walking sticks and visually impaired persons. These individuals may encounter an array of environmental barriers during their activities of daily living, some of which they may be able to overcome and others they may not be able to. A study conducted by [8] interviewed 28 adult wheelchair users and found that the barriers frequently reported included narrow aisles, no ramps or steep ramps, bad weather, door handles or door pressure, no curb cuts or blocked cuts, travel surfaces, obstructed travel, etc. On the one hand, Ref. [9] showed that the American Disability Act (ADA) and Architecture Barriers Act developed specific accessibility guidelines for buildings and directs that these should be applied during the design, construction, and alteration of buildings and facilities. Despite such efforts, environmental barriers remain to be a problem [10] The study by [11] shows from the review of the prototypes/applications developed for the mapping of city accessibility, that there is limited diffusion, lack of involvement of users in the whole design process, and complexity and richness of the requirements that should be faced by the application designers to satisfy all the users. While such studies report a positive correlation between environmental barriers and people with mobility impairments, there is limited conclusive evidence to support a direct solution and the effects of the environmental barriers specifically to the quality and condition of the sidewalk for people with mobility impairments.
2. Problem Statement
Most drawbacks of currently available navigation systems are due to inadequate map information. So far, attempts have been made to mitigate the problem of city accessibility through the Web, smart phones and tablet applications [6]. On the other hand, in their daily lives, people with motor impairments are still confronted with various mobility obstacles in the cities such that it is almost impossible for them to move around when they are away from the security of their homes. In The removal of barriers (e.g., in buildings in an urban context) which makes people with motor impairments independent and equal in the society, with capacity for choice and control over their lives; the ability to know the type of paths (not) eligible, given a specific level of mobility; and the ability to communicate discomfort, send a request, speak, and document a problem constitutes a social imperative.
3. Objective of the Study
The main objective of the study was to identify the physical features that contribute to the accessibility for people with specific mobility problems in an urban setting. And propose a design for an intelligent PostGIS database to support people with mobility impairments to navigate in cities
3.1. User Involvement and User-Centred Design
The study was conducted in order to obtain input data that would produce a design of an updated dynamic database. User Involvement and User-Centred Design (UCD) is applied to optimize the design of a dynamic database for MEP app on mobility challenged pedestrians regarding their experiences of the journey to use the MEP app, rather than forcing such users to change their behavior to accommodate the tool. Thus, UCD stands between the two concentric circles: the inner circle and the outer circle. The inner circle includes the context of the MEP project, objectives of developing MEP app and the environment in which it would run. The study consisted of two phases, namely: Awareness of the problem; and collection of suggestions from the respondents.
3.1.1. Awareness of the Problem
The awareness of an interesting research problem may come from multiple sources including new developments in the industry or reference discipline [12]. Therefore, is worth devoting some attention to the activity that precedes the design process itself. In response to this, the project was preceded by a compilation of the requirements through direct involvement of the project partners and beneficiaries in order to identify the possible scenarios of using the MEP apps. Instruments such as interviews, questionnaires and focused group discussions were used to collect data from the beneficiaries. The data acquired during this process were found to be of fundamental importance in producing a conceptual data model for MEP project applications, to support the accessibility of paths for people with mobility challenges as well as in the output of designing of the updated dynamic database.
3.1.2. Collection of Suggestions
The suggestion phase started with a discussion about accessibility problems that people with motor impairments face while traversing the urban area. In addition to that, suggestions consisting of a tentative creative idea on how to solve the research problem were identified. Since it was raining during the week, the respondents talked about how the weather conditions could affect the accessibility of the city. Hence, the two current urban city accessibility tools which used the spatial data were shown to the focus group. Consequently, most of the adopted urban city accessibility tools or simply UCATs were found to be not user-friendly. A good example is two of the reviewed applications, i.e., comunepertutti and mapability (www.mapability.org). Figure 2 shows the interface of the satellite view of Cremona with green, yellow and red lines that indicate the accessibility of the streets. The route/path of any description about accessibility degree of the street displays on the left-hand side when the line is clicked. The green line means accessible; yellow line means partially accessible, and the red line means not accessible.
The Mapability provides the most detailed picture by locating suitable services, roads, car parks and restaurants. Therefore, the user finds the interface not user-friendly since it is very congested with the information. It is difficult to click precisely on a certain icon or line such as the green, yellow and red in Mapability. Disabled people prefer the interface to be user-friendly.
4. Focus Groups and Results
The MEP project is based on a user involvement and user-centered design (ucd) approach that involves users actively in the whole design process, not only focusing on the “designing for users”, but on the “designing with users [13] Three focus groups with different user characteristics were conducted in order to collect primary data that would be interpreted by designers into user scenarios and design concepts.
4.1. First Group—Elderly
(a) Demographic Information
The first group consisted of 5 elderly people who are, on average, 72 years old, one female and four males. They all were active internet users and four of them, those who use smartphone’s and tablets. Only one of them uses a desktop computer in order to search things in internet. They have active working social lives, in which they always move in the city. They use social network platforms (such as Facebook), and email to get in contact with friends and family.
(b) Methodology
The focus group discussions were held by two moderators plus an observer and a recorder in a home environment, in which the participants felt comfortable. They sat in a circular setting. In the first half of the session, the participants answered the questions asked by the moderator in a discussion setting, and in the second half, they were tested and commented on two existing interfaces.

(c) Tools
During the focus group discussions, several visual tools were used. During the first talk, a series of photos of obstacles about architectonic obstacles were shown, and two tablets and one smartphone were given to the participants to test the two interfaces which have two different characteristics for the visualization of accessibility.
(d) Guiding Questions:
- (i)
- What kind of accessibility problems do you face when you are walking in the city?
- (ii)
- What kind of apps do you use for getting addresses and how do you carry your smartphone while walking?
- (iii)
- Which app is better for visualizing accessibility? (Here the moderator will show/mention two different apps: Comunertutti and Mapability).
- (iv)
- How would an ideal app for accessibility look like? What would you like the app to do for you?
4.2. Second Group—People with Manual Wheelchair
(a) Demographic Information
The second group consisted of 6 users using manual wheelchairs (4 male, 2 female, 55 years old on average).
(b) Methodology
The Focus Group Discussion was organized by a moderator plus an observer and a recorder in meeting rooms in Politecnico di Milano in the Department of Electronic Information and Bio-Engineering (Dipartmento Di ElettronicaInformazioneEBioingegneria—DEIB) and in Como. While the moderator asked the questions in a conversational setting, the observer was taking notes and audio-recording the focus group discussions. In the first session, the moderator opened the general discussion on the accessibility of the city, and in the second session, the group were discussed the two sample interfaces.
(c) Tools
The two different sample interfaces were shown to the participants by projecting them on a wall. The observer makes a simulation of the two interfaces on a PC that was connected to the projector.
(d) Guiding Questions
- (i)
- What kind of accessibility problems do you face when you are walking in the city?
- (ii)
- What kind of apps do you use for looking for an address and how do you carry your smartphone while walking?
- (iii)
- Which app is better for visualizing accessibility? (Here, two different apps will be shown: Comunepertutti and Mapability).
- (iv)
- How would an ideal app for accessibility be like? What would you like the app to do for you?
4.3. Third Group—People with Electric Wheelchair
(a) Demographic Information
The third group consisted of 4 users using electric wheelchairs (4 male, 37 years old on average). One participant used a mini joystick in order to control both the wheelchair and their cell phone due to restricted finger movements. Two participants from the electric wheelchair, group need assistance to do medical care besides assistance in daily life activities and the other two are more autonomous.
(b) Methodology
The focus group discussion was held by a moderator plus an observer and a recorder in Leda, where the participants often go for social activities and assistance. While the moderator asked the questions in a conversational setting, the observer was taking notes and recording the voices of the focus group discussions.
(c) Tools
The two different sample interfaces were shown to the participants in a big screen that was connected to one of the participant’s mini joystick. The participant tried both interfaces and the other participants were able to saw it from the big screen.
(d) Guiding Questions:
- (i)
- What kind of accessibility problems do you face when you are walking in the city?
- (ii)
- What kind of apps do you use for getting an address and how do you carry your smartphone while walking?
- (iii)
- Which app is better for visualising accessibility? (Here, the moderator will show two different apps: Comunepertutti and Mapability).
- (iv)
- How would an ideal app for accessibility be like? What would you like the app to do for you?
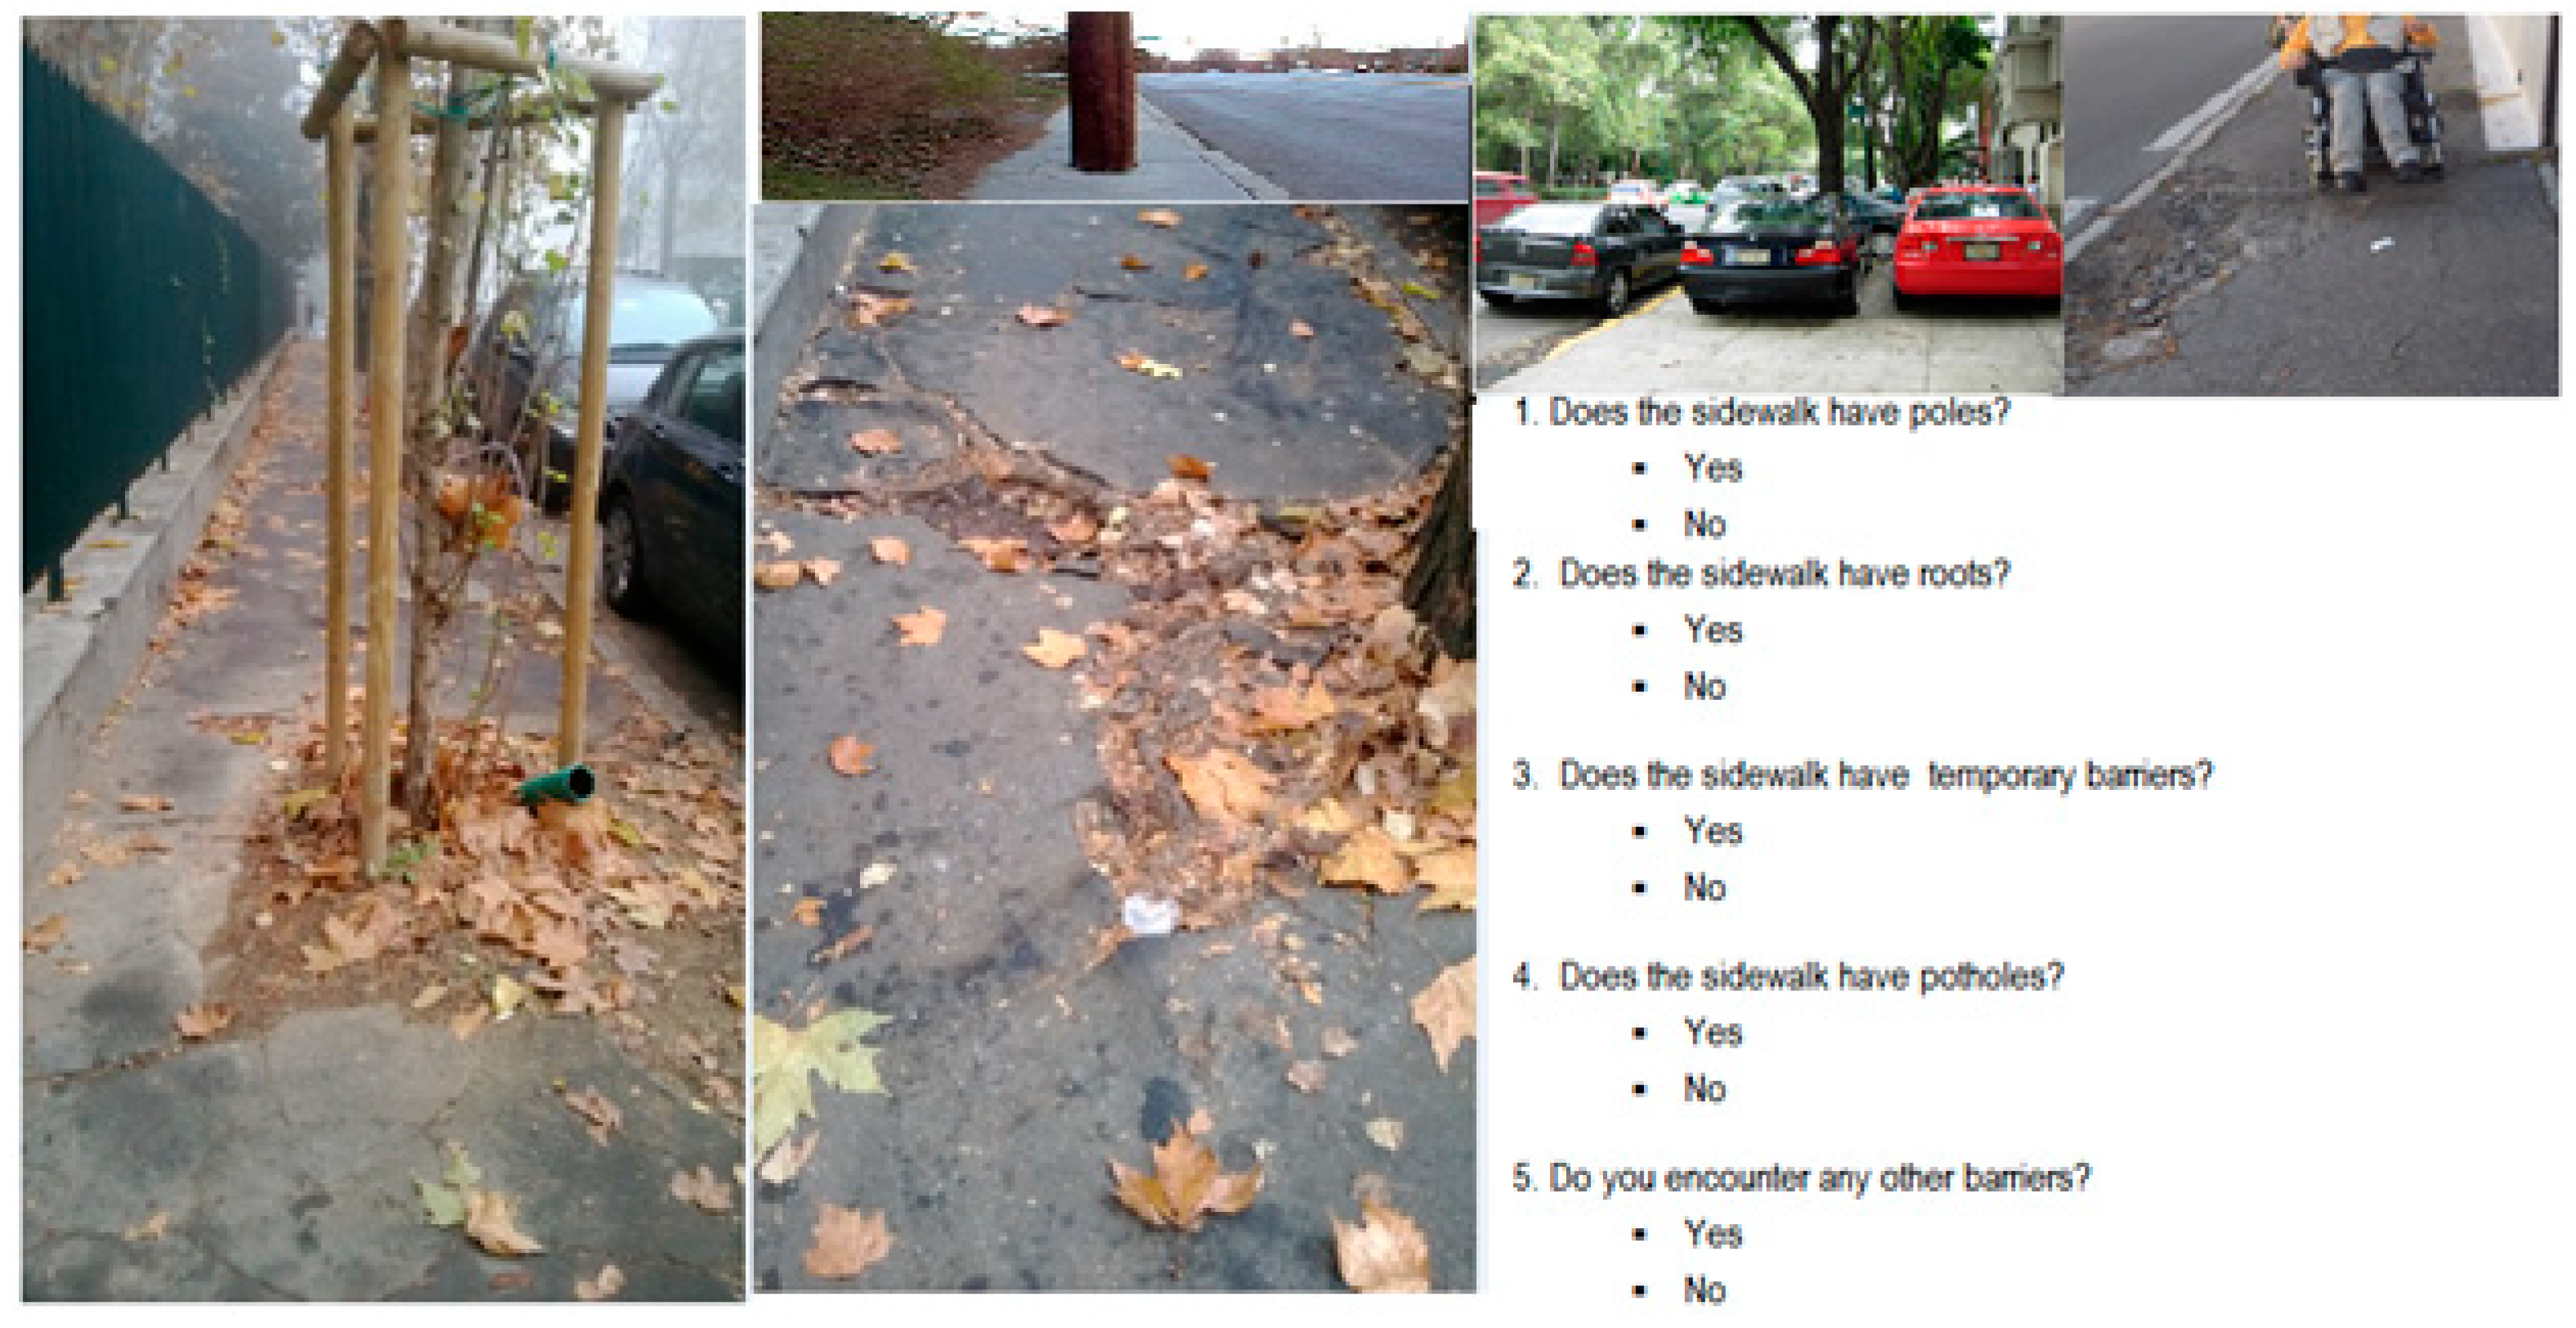
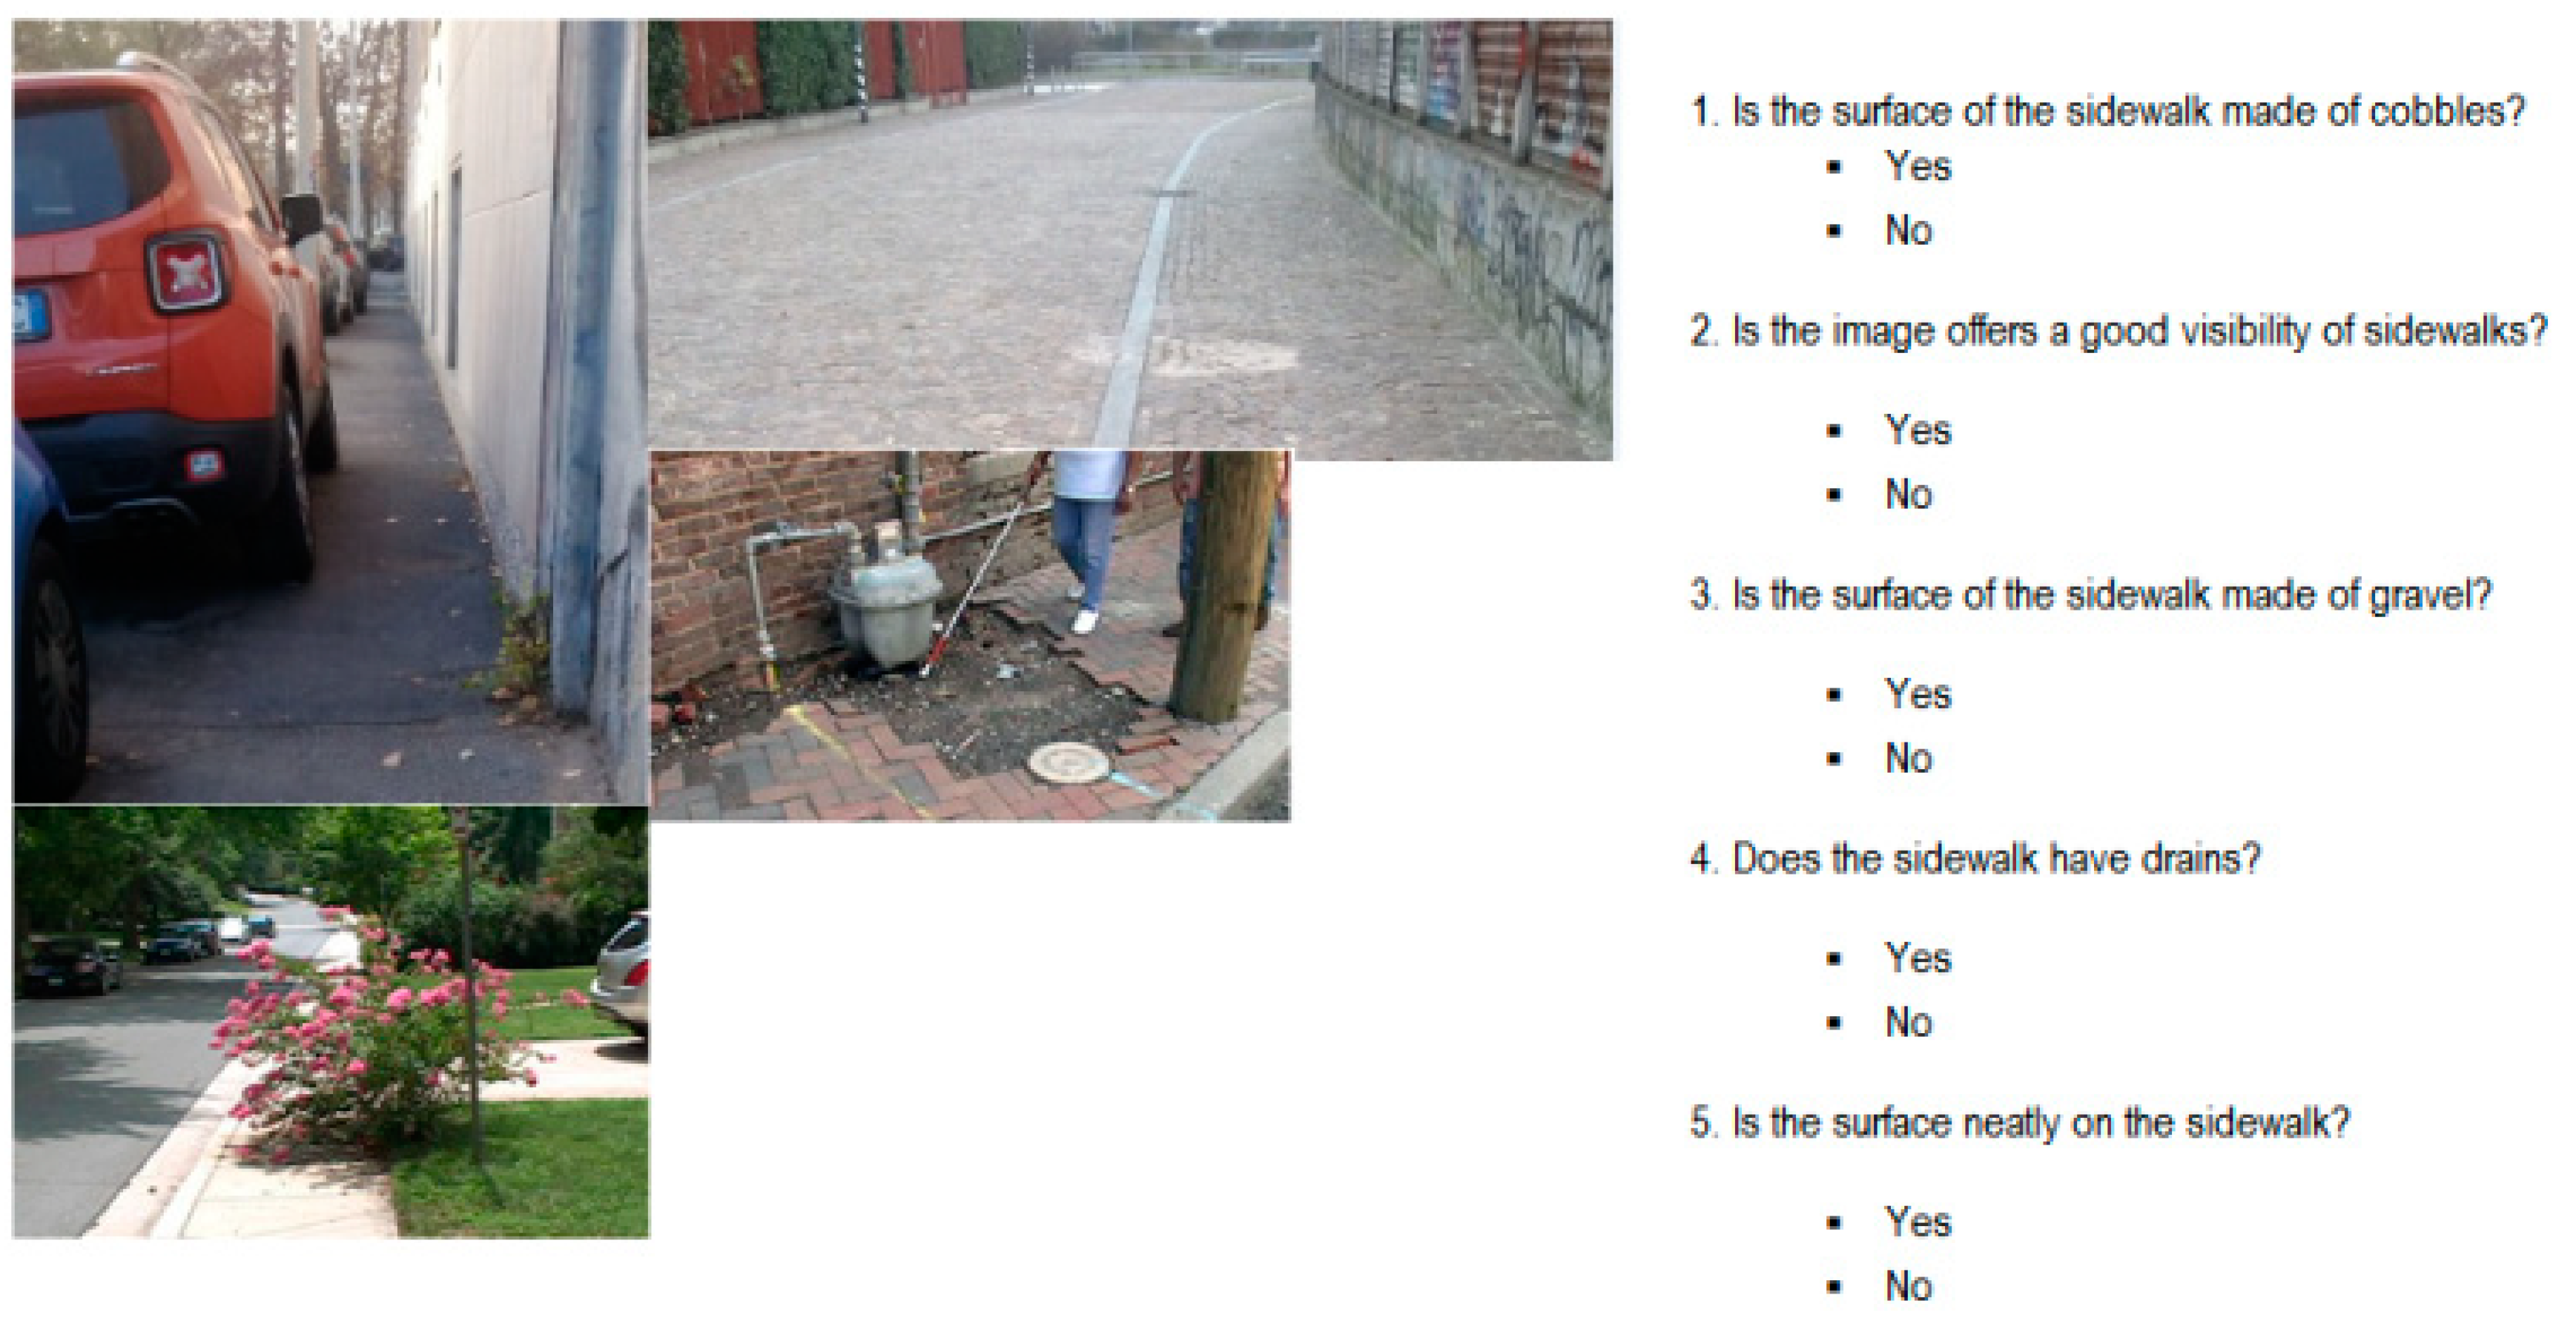
Furthermore, during the focused group discussions, several visual tools were used. A series of images of barriers (holes, poles, trees, etc.), sidewalks (narrow, potholes, bumps, etc.) and pavements (surface neat, cobbles, ramp, etc.) were shown during the first discussion about architectonic obstacles. The results obtained from focusing group discussions were qualitative in nature. Figure 2 illustrates the results of the picture of the barriers taken from a real sidewalk. Figure 3 and Table 1 and Table 2 represent the assessing autonomy respondents based on the type of the elements.
Firstly, the sampled users group agreed that UCATs is very useful, although it has to consider all types of users. To consider the effect of surface type and quality of mobility, various comments of experienced users were undertaken to design an updated dynamic database referring to the elements and comments given. From the sampled users group, this study concludes that the UCATs and the information technology or data around the urban area has a positive impact on the society, people with mobility challenges, as well as the entire world.
Secondly, Figure 4 was intended for comparing the categories of barriers with different obstacles that respondents encounter during their travel around the city. There were four types of users who responded to Figure 4. In short, there were registered users and not-registered users. In registered users, there are many different categories of users of the MEP tool. All respondents indicated that they found that neat surface was useful for all, i.e., the way was perfectly accessible. With regard to the cobbles and gravels, they indicated that the users had neither difficulties nor preferences related to the accessibility path type of this barrier although this accessibility of the path was made possible with some efforts by the user. In this case, an alternative path would be preferred, although it was not necessary.
These barriers are listed in three categories: low, medium and high. Hence the comparison of the differences of the accessibility path between these categories is identified as: Low, medium and high. This is according to the respondents’ responses to the questionnaires. Comparing the respondent groups which are the main targeted users of the MEP tool, the possible values for each user preference on how to rate the barrier while providing the information is:
- ○
- LOW: This value means that the user prefers this type of a path when available. The value is usually related to the barrier and not accessibility facilities. It indicates that the user has neither difficulties nor preferences related to the accessibility and it is totally irrelevant to him/her to meet such a kind of barrier. This means that his/her way is completely accessible.
- ○
- MEDIUM: This value indicates that the user has neither difficulties nor preferences related to the accessibility of a path type. This barrier means accessibility to the path bythe user but with some efforts. This value is used when a user faces an accessible path type, but with some efforts. In this case, an alternative path is preferred, but it is not necessary.
- ○
- HIGH: This value means that the barrier type represents an impossible path to the user.
5. User Centered Approach to Conceptual Data Model Design
The conceptual data model for MEP project is simplified and connections are explained hereafter Figure 5. The conceptual schema model is configured to interact with two different classes of users: registered and not-registered users. To explain this issue related to MEP dynamically updated, the database (PostGIS) modeling and design, the methodology used and looked at the adoption starting from the requirements. The methodology adopted was waterfall model.
5.1. Waterfall Model Strategy
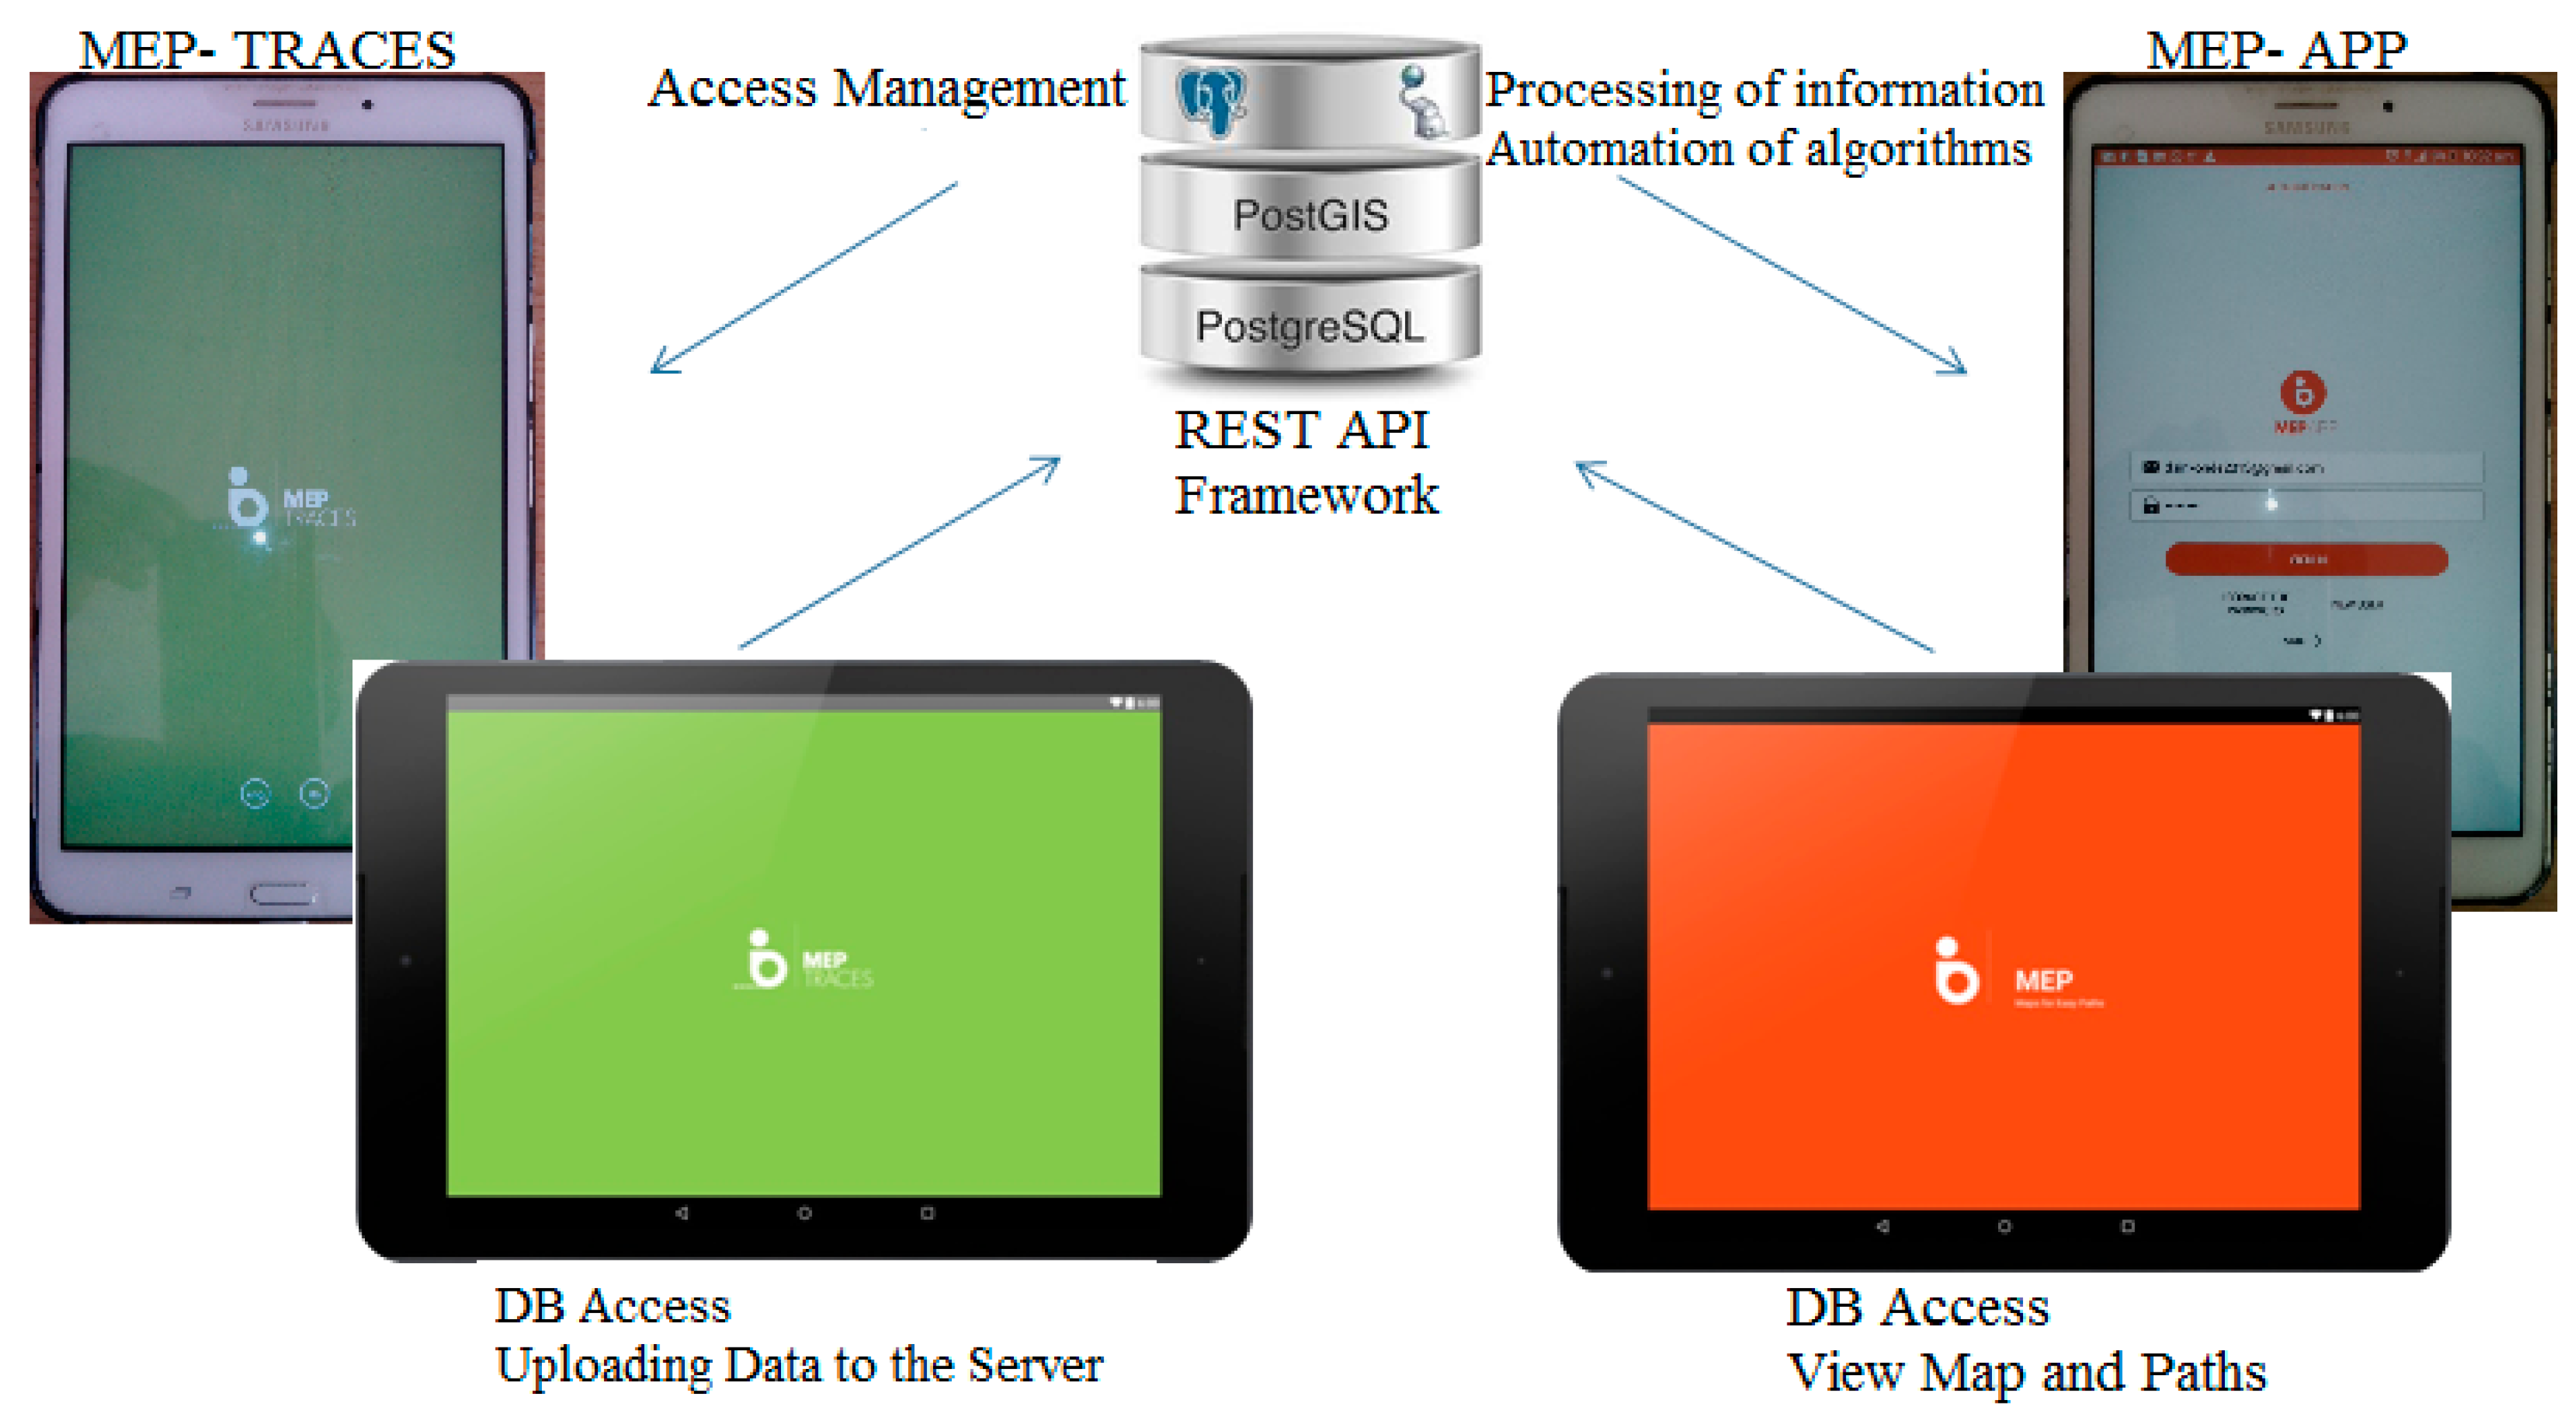
The waterfall model is a sequential strategy approach to the updated dynamic database (PostGIS) design as the proceeding is seen as flowing steadily downwards (like a waterfall) from the attributes and entities which are found and then moving towards an acceptable conceptual data model through piecing together of associated attributes. In other words, the waterfall model is a sequential strategy approach which is a type of active acquisition of information from a primary source. In this database (PostGIS) design in which the end users were involved, the emphasis was put on the active participation by all people with motor impairments, ranging from users with manual or electric wheelchairs, the elderly with or without mechanical support, to people in temporary situations of reduced mobility. Input into a waterfall model was a sequential strategy approach which could be views of data, such as screen shots as in Figure 6 or reports (printouts), or patterns of co-occurring attribute values identified within large data sets.
5.2. Obstacle Annotation and Crowdsourcing
In this context, the term “Crowdsourcing” refers to the method and techniques of solving problems through contribution to the enrichment of geographical maps with information about the accessibility of urban pedestrian paths for people with mobility challenges [14] The study provides a general knowledge of crowdsourcing with a smartphone for allowing users to transparently contribute to complex and novel problem-solving that happens every day. Crowdsourcing can provide a platform for bi-directional communication and collaboration with diverse individuals and groups. It includes registered users and non-registered users to the MEP app. Users actively participate in the process of taking pictures of barriers, uploading them to the dynamic database of the MEP server and adding some comments concerning the attributes of the pictures of the barrier. At the comments’ table, there are two attributes, namely a text and criticality rate, based on the conceptual data model that was designed. There are so many advantages of using crowd-sourcing such as, the ability to collect information quickly and efficiently, and ease of sharing information about the accessibility difficulties that are encountered in paths by users in their daily travels. Some of disadvantages observed by the research show that crowd-sourcing can favor the popular opinion, which in turn favors homogeneity. [15] reported that crowd-sourcing can be expensive or unreliable as it requires no or little expertise from participants and no supervision of participants [16]. Similarly, [17,18,19,20] contend that crowd-sourcing is a powerful mechanism for outsourcing tasks which are traditionally performed by a specialist or small group of experts for a large group of community. Crowdsourcing has long been recognized as a potential of solving problems that require humans (i.e., where technology either cannot complete the task or where people can do it better). Wazny [21] posits that the increase of applications of crowdsourcing technology is perhaps the most challenge in our health field times. In general crowdsourcing is presented as the means of solving tasks that require humans (i.e., where technology either cannot complete the task or where people can do it better). Crowdsourcing can raise public awareness, it is a flexible tool that can be used in various situations as a supplement to traditional research [22,23]. So far research on crowdsourcing has produced mainly general overviews on its application perspective. Missing are actual studies of crowdsourcing techniques for pedestrians to create a safer mobility with transitory obstacle information for people with mobility difficulties.
Data about urban accessibility path, in terms of architectonic barriers and general infrastructure, which could be obtained by crowd-sourcing and sensing activities conducted by citizens equipped with mobile devices, could support users with mobility challenges. Whilst these other such studies report a positive correlation of crowd-sourcing for the general user, there is limited conclusive evidence of its use in systems to support users with mobility challenges.
It’s worth mentioning that data in this study can be (and have been) borrowed from MEP projects, mainly from authoritative data of the Milan city transport such as bus stops and metro stops, parallel to the one from raw GPS data as well as other motion-related sensors data.
6. Conclusions
This paper makes an important contribution to the MEP project by proposing data-driven approaches based on crowd-sourcing for the enrichment of public maps with the information about the accessibility of paths.
The MEP dynamic database was developed by basing on the literature review and exploratory field research, signalizing the satisfaction with the current database which is mostly static. Also, it puts less effort in the collection of real users’ requirements, which in many cases, is completely absent.
The research results demonstrate that it is possible to produce viable a conceptual data model and apply the database to other contexts. This has been achieved within the data collection by the focused group. The end users were involved in a user-centered approach throughout the project through focused group discussions to observe the behavior. Considering the results of the focus groups discussion, with the MEP project provided qualitative data that allowed designing of the entire dynamic database (PostGIS) by considering the different types of users and aspects like the usage restrictions due to limited hand movements.
7. Recommendations for Future Work
The research work in this paper focuses on Maps for Easy Paths, or simply MEP that is, how Smartphone’s or tablets or PCs for navigation systems could benefit people with impairments, mostly motor impairment. There still remain some open issues to be investigated in the future as an extension of this research. We propose further work on the sieving information, due to the fact that different contributors may have different opinions or different requirements. There may be also conflicts and imprecise/imperfect information. This can also reflect the element and it is desirable for the future MEP explicit data to improve the quality of such data.
Author Contributions
For research articles with several authors, a short paragraph specifying their individual contributions must be provided. The following statements should be used Conceptualization, D.S. and S.C.; Methodology, D.S.; Software, S.C., M.M. and D.S.; Validation, D.S. and S.C., Formal Analysis, D.S.; Investigation, D.S.; Resources, S.C., M.M., L.M. and N.S.; Data Curation, S.C. and M.M.; Writing-Original Draft Preparation, D.S.; Writing-Review & Editing, S.C., M.M. and L.M.; Visualization, S.C.; Supervision, S.C., M.M., L.M. and N.S.; Project Administration, S.C. and M.M.; Funding Acquisition, S.C. and M.M.
Funding
This work was partially supported by Polisocial Award 2014, Politecnico di Milano, Italy.
Acknowledgments
We wish to thank the focus groups mentioned in this paper. This study was conducted with the contribution of the following associations: Crais (http://www.crais.eu/—in Italian), Lions Club International Area Milanese, Comodalbasso (http://www.comodalbasso.org/—in Italian), Ledha Milano (http://www.ledhamilano.it/—in Italian). Special thanks should go to the Fondazione Politecnico di Milano for the generosity and support through the scholarship. We thank the University of Dodoma (UDOM) and College of Informatics and Virtual Education (CIVE) and Mbeya University of Science and Technology (MUST) for supporting this work and for allowing us to use their resources.
Conflicts of Interest
The authors declare no conflict of interest.
References
- US Census. Mobility Is Most Common Disability among Older Americans; Census Bureau Reports; United States Census Bureau: Suitland, MD, USA, 2014. Available online: http://www.census.gov/newsroom/pressreleases/2014/cb14-218.html (accessed on 26 May 2017).
- Manville, C.; Cochrane, G.; Cave, J.; Millard, J.; Pederson, J.K.; Thaarup, R.K.; Liebe, A.; Wissner, M.; Massink, R.; Kotterink, B. Mapping Smart Cities in the EU; European Parliament, Directorate-General for Internal Policies: Brussels, Belgium, 2014. [Google Scholar]
- Cocchia, A. Smart and Digital City: A Systematic Literature Review. In Smart City: How to Create Public and Economic Value with High Technology in Urban Space; Dameri, R.P., Rosenthal-Sabroux, C., Eds.; Springer: New York, NY, USA, 2014; pp. 13–44. [Google Scholar]
- Alizadeh, T. A policy analysis of digital strategies: Brisbane vs. Vancouver. Int. J. Knowl. Based Dev. 2015, 6, 85–103. [Google Scholar] [CrossRef]
- Duvall, J.; Sinagra, E.; Stuckey, D.; Cooper, R.; Pearlman, J. Proposed Surface Roughness Standard for Pathways Used by Wheelchairs. In Proceedings of the Transportation Research Board 93rd Annual Meeting, Washington, DC, USA, 12–16 January 2014. [Google Scholar]
- Ding, D.; Parmanto, B.; Karimi, H.A.; Roongpiboonsopit, D.; Pramana, G.; Conahan, T.; Kasemsuppakorn, P. Design considerations a personalized wheelchair navigation system. In Proceedings of the 29th Annual International Conference of the IEEE Engineering in Medicine and Biology Society, Lyon, France, 22–26 August 2007; pp. 4790–4793. [Google Scholar]
- Thapar, N.; Warner, G.; Drainoni, M.L.; Williams, S.R.; Ditchfield, H.; Wierbicky, J.; Nesathurai, S. A pilot study of functional access to public buildings and facilities for persons with impairments. Disabil. Rehabil. 2004, 26, 280–289. [Google Scholar] [CrossRef] [PubMed]
- Meyers, A.R.; Anderson, J.J.; Miller, D.R.; Shipp, K.; Hoenig, H. Barriers, facilitators, and access for wheelchair users: Substantive and methodologic lessons from a pilot study of environmental effects. Soc. Sci. Med. 2002, 55, 1435–1446. [Google Scholar] [CrossRef]
- United States Access Board. Americans with Disabilities Act and Architectural Barriers Act Accessibility Guidelines; United States Access Board: Washington, DC, USA, 2004.
- Darcy, S. Inherent complexity: Disability, accessible tourism and accommodation information preferences. Tour. Manag. 2010, 31, 816–826. [Google Scholar] [CrossRef]
- Comai, S.; Kayange, D.; Mangiarotti, R.; Matteucci, M.; Yavuz, S.U.; Valentini, F. Mapping City Accessibility: Review and Analysis. Stud. Health Technol. Inform. 2015, 217, 325–331. [Google Scholar] [PubMed]
- Vaishnavi, V.; Kuechler, W. Design Research in Information Systems. Available online: http://www.desrist.org/desrist/content/design-science-research-in-information-systems.pdf (accessed on 16 June 2018).
- Sanders, E.B. From user-centered to participatory design approaches. In Design and the Social Sciences: Making Connections; CRC Press: Boca Raton, FL, USA, 2002; pp. 1–8. [Google Scholar]
- Chatzimilioudis, G.; Konstantinidis, A.; Laoudias, C.; Zeinalipour-Yazti, D. Crowdsourcing with smartphones. IEEE Internet Comput. 2002, 16, 36–44. [Google Scholar] [CrossRef]
- Heipke, C. Crowdsourcing geospatial data. ISPRS J. Photogramm. Remote Sens. 2010, 65, 550–557. [Google Scholar] [CrossRef]
- Schemmann, B.; Herrmann, A.M.; Chappin, M.M.H.; Heimeriks, G.J. Crowdsourcing ideas: Involving ordinary users in the ideation phase of new product development. Res. Policy 2016, 45, 1145–1154. [Google Scholar] [CrossRef]
- Brambilla, M.; Ceri, S.; Mauri, A.; Volonterio, R. Community-based Crowdsourcing. In Proceedings of the Companion Publication of the 23rd International Conference on World Wide Web Companion, Seoul, Korea, 7–11 April 2014; pp. 891–896. [Google Scholar]
- Rice, M.T.; Jacobson, R.D.; Caldwell, D.R.; McDermott, S.D.; Paez, F.I.; Aburizaiza, A.O.; Curtin, K.M.; Stefanidis, A.; Qin, H. Crowdsourcing techniques for augmenting traditional accessibility maps with transitory obstacle information. Cartogr. Geogr. Inf. Sci. 2013, 40, 210–219. [Google Scholar] [CrossRef]
- Mirri, S.; Prandi, C.; Salomoni, P.; Callegati, F.; Campi, A. On combining crowdsourcing, sensing and open data for an accessible smart city. In Proceedings of the 2014 8th International Conference on Next Generation Mobile Applications, Services, and Technologies, Oxford, UK, 10–12 September 2014; pp. 294–299. [Google Scholar]
- Weld, G.; Perrier, T.; Aker, J.; Blumenstock, J.E.; Dillon, B.; Kamanzi, A.; Kokushubira, E.; Webster, J.; Anderson, R.J. eKichabi: Information Access through Basic Mobile Phones in Rural Tanzania; ACM: New York, NY, USA, 2017; ISBN 123-4567-24-567/08/06. [Google Scholar]
- Wazny, K. Applications of crowdsourcing in health: An overview. J. Glob. Health 2018, 8. [Google Scholar] [CrossRef] [PubMed]
- Ranard, B.L.; Ha, Y.P.; Meisel, Z.F.; Asch, D.A.; Hill, S.S.; Becker, L.B.; Seymour, A.K.; Merchant, R.M. Crowdsourcing-harnessing the masses to advance health and medicine, a systematic review. J. Gen. Intern. Med. 2014, 29, 187–203. [Google Scholar] [CrossRef] [PubMed]
- Thawrani, V.; Londhe, N.D.; Singh, R. Crowdsourcing of Medical Data. IETE Tech. Rev. 2014, 31, 249–253. [Google Scholar] [CrossRef]
Figure 1.
A rough graphical description of the Maps for Easy Paths(MEP) project.

Figure 2.
Cremona Interface Mapability. Source: www.mapability.org.
Figure 2.
Cremona Interface Mapability. Source: www.mapability.org.

Figure 3.
Barriers.

Figure 4.
Pavement.

Figure 5.
General Schema as Representation of Conceptual Data Model Design. Source: Own processing.

Figure 6.
Identification of relationships of MEP system architecture.


Table 1.
Sidewalk/Path.
| Types | Respondent (%) | Roots (3 out of 4, Is Accessible) | Potholes (2 out of 4, Is Accessible) | Poles (1 out of 4, Is Accessible) | UCATs Usage Is Not Useful (0 out of 4) |
|---|---|---|---|---|---|
| Manual wheelchairs | 32 | 24 | 16 | 8 | 0 |
| Electric wheelchairs | 20 | 15 | 10 | 5 | 0 |
| Walking with a stick | 4 | 3 | 2 | 1 | 0 |
| Elderly | 28 | 21 | 14 | 7 | 0 |
Source: Own processing.
Table 2.
Pavement.
| Types | Respondent (%) | Surface Neat (Accessible 4ALL) | Cobbles (2 out of 3, Is Accessible) | Gravel (1 out of 3, Is Accessible) | UCATs Usage Is Not Useful (0 out of 3) |
|---|---|---|---|---|---|
| Manual wheelchairs | 32 | 32 | 21 | 11 | 0 |
| Electric wheelchairs | 20 | 20 | 13 | 7 | 0 |
| Walking with a stick | 4 | 4 | 3 | 1 | 0 |
| Elderly | 20 | 20 | 13 | 7 | 0 |
Source: Own processing.
© 2018 by the authors. Licensee MDPI, Basel, Switzerland. This article is an open access article distributed under the terms and conditions of the Creative Commons Attribution (CC BY) license (http://creativecommons.org/licenses/by/4.0/).
Share and Cite
MDPI and ACS Style
Sinkonde, D.; Mselle, L.; Shidende, N.; Comai, S.; Matteucci, M. Developing an Intelligent PostGIS Database to Support Accessibility Tools for Urban Pedestrians. Urban Sci. 2018, 2, 52. https://doi.org/10.3390/urbansci2030052
AMA Style
Sinkonde D, Mselle L, Shidende N, Comai S, Matteucci M. Developing an Intelligent PostGIS Database to Support Accessibility Tools for Urban Pedestrians. Urban Science. 2018; 2(3):52. https://doi.org/10.3390/urbansci2030052
Chicago/Turabian StyleSinkonde, Daniel, Leonard Mselle, Nima Shidende, Sara Comai, and Matteo Matteucci. 2018. "Developing an Intelligent PostGIS Database to Support Accessibility Tools for Urban Pedestrians" Urban Science 2, no. 3: 52. https://doi.org/10.3390/urbansci2030052