Urban Segregation and Socio-Spatial Interactions: A Configurational Approach


1
Graduate Program on Urban and Regional Planning—PROPUR, School of Architecture, Federal University of Rio Grande do Sul (UFRGS), Porto Alegre 90 050-170, Brazil
2
Department of Urbanism, Graduate Program on Urban and Regional Planning—PROPUR, School of Architecture, Federal University of Rio Grande do Sul (UFRGS), Porto Alegre 90 050-170, Brazil
*
Author to whom correspondence should be addressed.
Urban Sci. 2018, 2(3), 55; https://doi.org/10.3390/urbansci2030055
Submission received: 15 June 2018
/
Revised: 7 July 2018
/
Accepted: 10 July 2018
/
Published: 12 July 2018
(This article belongs to the Special Issue Formalizing Urban Methodologies)
Abstract
:Urban segregation is an inherent feature of cities and becomes a problem when excluding or hindering certain groups from accessing services, activities and spaces. In Brazil, segregation by social class is dominant in the structure of cities and public policies rarely address urban configuration as part of the segregation problem. This work addresses segregation with a shift in emphasis from traditional housing segregation to segregation as the restraint of socio-spatial interactions, thus including other facets of the phenomenon that have not yet been properly explored and seeking new spatially relevant metrics. This paper aims to present a methodology of segregation analysis based on configurational models and develop an empirical application in a Brazilian city. Representing the probabilities of interaction between different socio-economic groups in public spaces, a configurational model was used, addressing retail-residence spatial relationship. The attributes of population size, household income and number of retail establishments were considered. The results allowed identifying the probabilistic residence-retail trajectories for high and low income groups, providing a first measure of spatial segregation. The conclusions seek to highlight the importance of configurational approaches for segregation studies, as well as to show potentialities and limits of this methodology.
1. Introduction
Segregation is an inherent feature of cities and it has been the focus of interest in different scientific fields. It can have an ethnic, racial, economic, religious, and gender basis, among others. The work in [1] defines segregation as the restriction of interaction involving or not involving the physical space. In architecture and urban planning studies, urban segregation is commonly approached as separation [2,3]. Segregation is the separation of people, activities and functions [4] and it can hardly be approached without considering its spatial aspect. The work in [5] defines urban segregation as any form of spatial exclusion in the city.
Historically, urban segregation studies generally analyze the locational patterns of housing, without taking into consideration the other domains where it can be manifested, such as the separation of activities and functions. In more recent decades, advances in technologies has allowed new ways to study the city. The increase in computational capacities, the development in the field of Geographical Information Systems (GIS), and urban modelling, among others, are crucial to the study of cities, allowing for new and innovative ways to study segregation and its implications [6]. These morphological and configurational approaches enable a description of segregation taking into account the relationships between people and activities in space.
The shift of focus on the segregation problem from purely residential to a broader problem which encompasses the daily routines of individuals and their movement in the public spaces is a welcome change. The way we interact with individuals from different social groups shapes our perception of others, creating a possible capacity for solidarity between different groups. In the words of the authors of [7] (p. 116), “space is an integral part of the outsider problem. The way in which space is organized affects the perception of the ‘other’, either as foreign and threatening, or as simply different”.
The intent of the present paper is to analyze segregation with a shift in emphasis from traditional territorial and housing segregation to segregation as the restraint of socio-spatial interactions, thus including other facets of the phenomenon of segregation that have not yet been properly explored and seeking new forms of evaluating and measuring this segregation through spatially relevant metrics. This paper’s aim is to: (a) Present a methodology of analysis of segregation based on configurational models; and (b) develop an empirical application in a small Brazilian city, Ibirubá. The paper is organized as follows. Section 2 presents a brief review of segregation studies and also configurational approaches. Section 3 describes the methodology, empirical data and the modeling process. Section 4 presents the results and discussion. The last section brings some conclusions and also potentials and limitations of the adopted methodology.
2. Segregation and Urban Spatial Configuration
In this section we outline the theoretical background of the paper. First, we briefly review some studies on urban segregation, highlighting the point of view of spatial configuration. The session closes with the discussion of configurational models as indicators of encounters in public space.
2.1. Urban Segregation
In Latin America the attributes that characterize segregation are mainly socioeconomic, and despite being the largest economy in Latin America, Brazil ranks among the highest indicators of income inequality in the world [8,9]. According to the 2010 UNDP (United Nations Development Programme) report, Brazil is the 10th most unequal country in the world and the 1th in income concentration among the richest 1% of its population. These inequalities have a strong implication for the spatial configuration of cities.
The study of urban segregation has many facets, but two approaches stand out in the scientific field, namely sociological and the geographical [10]. The sociological approach considers segregation as the absence of interaction between individuals of different social groups. The geographical approach considers segregation as the unequal distribution of social groups in the urban space. These two approaches tend to be used separately from one another, and among them the geographical approach is most commonly used.
Most existing studies of urban segregation have their main focus on residential locations. The spatial aspect of urban segregation is usually assumed to be uneven locational housing patterns. There are many examples on this type of study. One of the most well-known is the study of the city of Chicago, with its concentric rings [11]. Most traditional segregation measures are usually based on household income. Many indicators that are used are economic non-spatial indicators, such as income distribution (Gini index, Lorenz curve, etc.). Others are spatial indicators that take into account the spatial distribution of income or the appropriation of the residential space (dissimilarity index, segregation curve, spatial correlations, etc.).
These approaches of residential segregation are the most used approaches in the undeveloped cities of Latin America. However, the spatial patterns in these cities are different than those from North America and Europe. In Brazil, urban segregation was first characterized by its unequal housing standards. Around 1940, with the growth of urban population and the movement of people from rural to urban areas, the city emphasized its segregation patterns, with the rich population living in the downtown area and the poor in its periphery. In more recent years the pattern has changed. Reference [12] (p. 386) mentions that “the marks and the meanings of inequality and the relationships and spaces in which they are manifested and reproduced have changed considerably”. The spatial distance between the different groups has shrunk, the rich started moving towards a more suburban area (settlement patterns are very different from American or Australian suburbia), and the new urban pattern is that of “enclaves”. The enclaves create a new form of segregation, where people are closer, but separated by physical barriers and security control systems [13,14].
In an attempt to fight social inequality, the government implemented some policies in the country. In the urban segregation field, the main policy is residential, to provide more dignified houses for the poorest groups. However, the reduction in the inequality indexes did not accompany increased access to housing at the same speed. There are many reasons why this did not happen (which will not be addressed in this paper), but among them is the spatial issue of urban segregation [14,15,16].
With the relative physical proximity of different social groups [17], segregation as purely housing locational patterns is no longer capable of explaining the whole reality of urban segregation. Researchers in Reference [3] study segregation as spaces of activities, analyzing the indexes of evenness/clustering and exposure/isolation. This context reinforces the idea of urban segregation as the absence of interactions in space or as the exclusion to opportunities of access to activities and services in the cities [1,17,18,19].
2.2. Urban Segregation and Spatial Configuration
Urban form cannot be seen as a neutral background to human activity, but as an intrinsic aspect of everything we do. Configurational studies focus on how space affects our social life, the way we interact with others, the greater or lesser opportunities we have to gather in specific places, and strategies of surveillance and control we have over each other [20,21]. According to Reference [22], it was through cities that societies developed ideas about disciplining life through space. In this sense, space can be considered as part of a heterogeneous ensemble (Foucault’s dispositif) consisting of discourses, institutions, laws, and philosophical and moral propositions, aiming at regulating and ordering acts and shaping relations. Although space is not deterministic of practices, it invites or stimulates certain actions and it can be seen as a form of power in the social field of interaction [22].
Space is not just about properties of individual spaces, but about interrelations between the many spaces that make up the spatial layout. To perform our daily activities, we move around the city, relating and interacting with other and with space itself.
Configurational studies aim at the relations between society and space using methods and techniques able to account for this relation. Spatial Syntax [20,23] is one of the main approaches, but many other studies, based on graph theory, have emerged [24,25]. Configurational theory has also contributed to urban segregation studies, aiming not to replace the other approaches but to broaden the understanding of the segregation phenomena. Some studies analyze the role of space in the geography of poverty by identifying that spatially segregated areas exhibit greater economic marginalization [6,26].
Among the recent research of urban segregation are the studies of co-presence, based on the number of individuals from different social groups that pass by the same location. When individuals of different social groups can see one another, even if they do not directly interact, they can develop empathy for each other, which is an important step in fighting social inequality [8,27,28,29]. These studies consider the daily routines of individuals and try to identify the importance of the the spatial configuration of cities by comparing it with some of Spatial Syntax’s measures, such as accessibility. The work in Reference [29] focuses on the possibility of encounters between different individuals. The author uses big data from social media to identify the movement of individuals, and then, using spatial configuration, measures the possibility for these encounters to happen.
2.3. Configurational Models and Probability of Encounters in Public Space
Urban configurational models are simplified representations of reality, which implies a certain level of abstraction [30,31]. Configurational models assume the city presents a hierarchical pattern of spatial differentiation (configuration) able to influence pedestrian movement, land uses, densities, etc. Such models apply methodologies of disaggregating the city into components (basic units of space and spatial attributes) and their relationships (topological descriptions, adjacencies, and centrality). Graph theory provides the analytical tools for the calculation of different measures and properties of the urban network. The models assume the shortest path hypothesis, i.e., the connections between cells of the network will always be made by the shortest paths. Thus, any city would exhibit a spatial differentiation, i.e. a hierarchy, in which some cells (spaces) are distinguished by their relative position and/or the number of connections with others [25].
Based on the pre-existing configurational studies of cities, the present paper aims to develop a methodology that evaluates urban segregation by measuring the possibilities of encounters between individuals from different social backgrounds in public spaces. This paper focuses on the daily routines from residences to retail places. To measure the possibilities for co-presence, we identify the most likely routes individuals would take from their houses to retail places through the model of Centrality. According to Reference [31] centrality is the property of a cell being along the path that connects two other cells, and their hierarchy is given by the total number of times this one cell appears in the paths connecting all pairs of the cells of a system. Reference [32] proposes a weighted Betweenness Centrality (Freeman-Krafta Centrality), introducing the notions of tension and distance: The tension reflects the relationship between two points expressed by the product of its contents (attributes); the distance refers to the extension of the shortest path between each pair of points, and this increases as the centrality of each cell interposed in the path decreases. The Freeman-Krafta Centrality is expressed by the equation:
where is the tension between two units (i and j) of space, and are the amount of built form, respectively, in i and j, computed with their respective attributes , the tension between i and j assigned to K, where K is a unity of space belonging to the shortest path between i and j, and p is the number of unities of space belonging to those shortest paths. Finally, C(K) is the centrality measure of K, given after the computation of all possible pairs of the system.
The model allows computing the tension generated between activity systems, working as an indicator of the social flow of individuals moving through the spatial system to perform these activities [33].
In this paper we develop a first application focusing on the relationship between residences and retail locations. The model also allows differentiating spatial attributes, such as the level of retail attraction (for example, shopping centres can be modelled as more attractive than a grocery store). The same principle can be used to classify residences by density or income, for example.
3. Materials and Methods
This paper presents a methodology of analyzing segregation based on configurational models. We used a Centrality model to represent the probabilities of interaction between individuals from different socio-economic strata in the city of Ibirubá, Brazil. We built two scenarios, regarding high and low-income resident’s flows to retail shops. Comparing these two scenarios allowed us to identify spaces with higher and lower potentials of interactions in the city, providing a first measure of segregation.
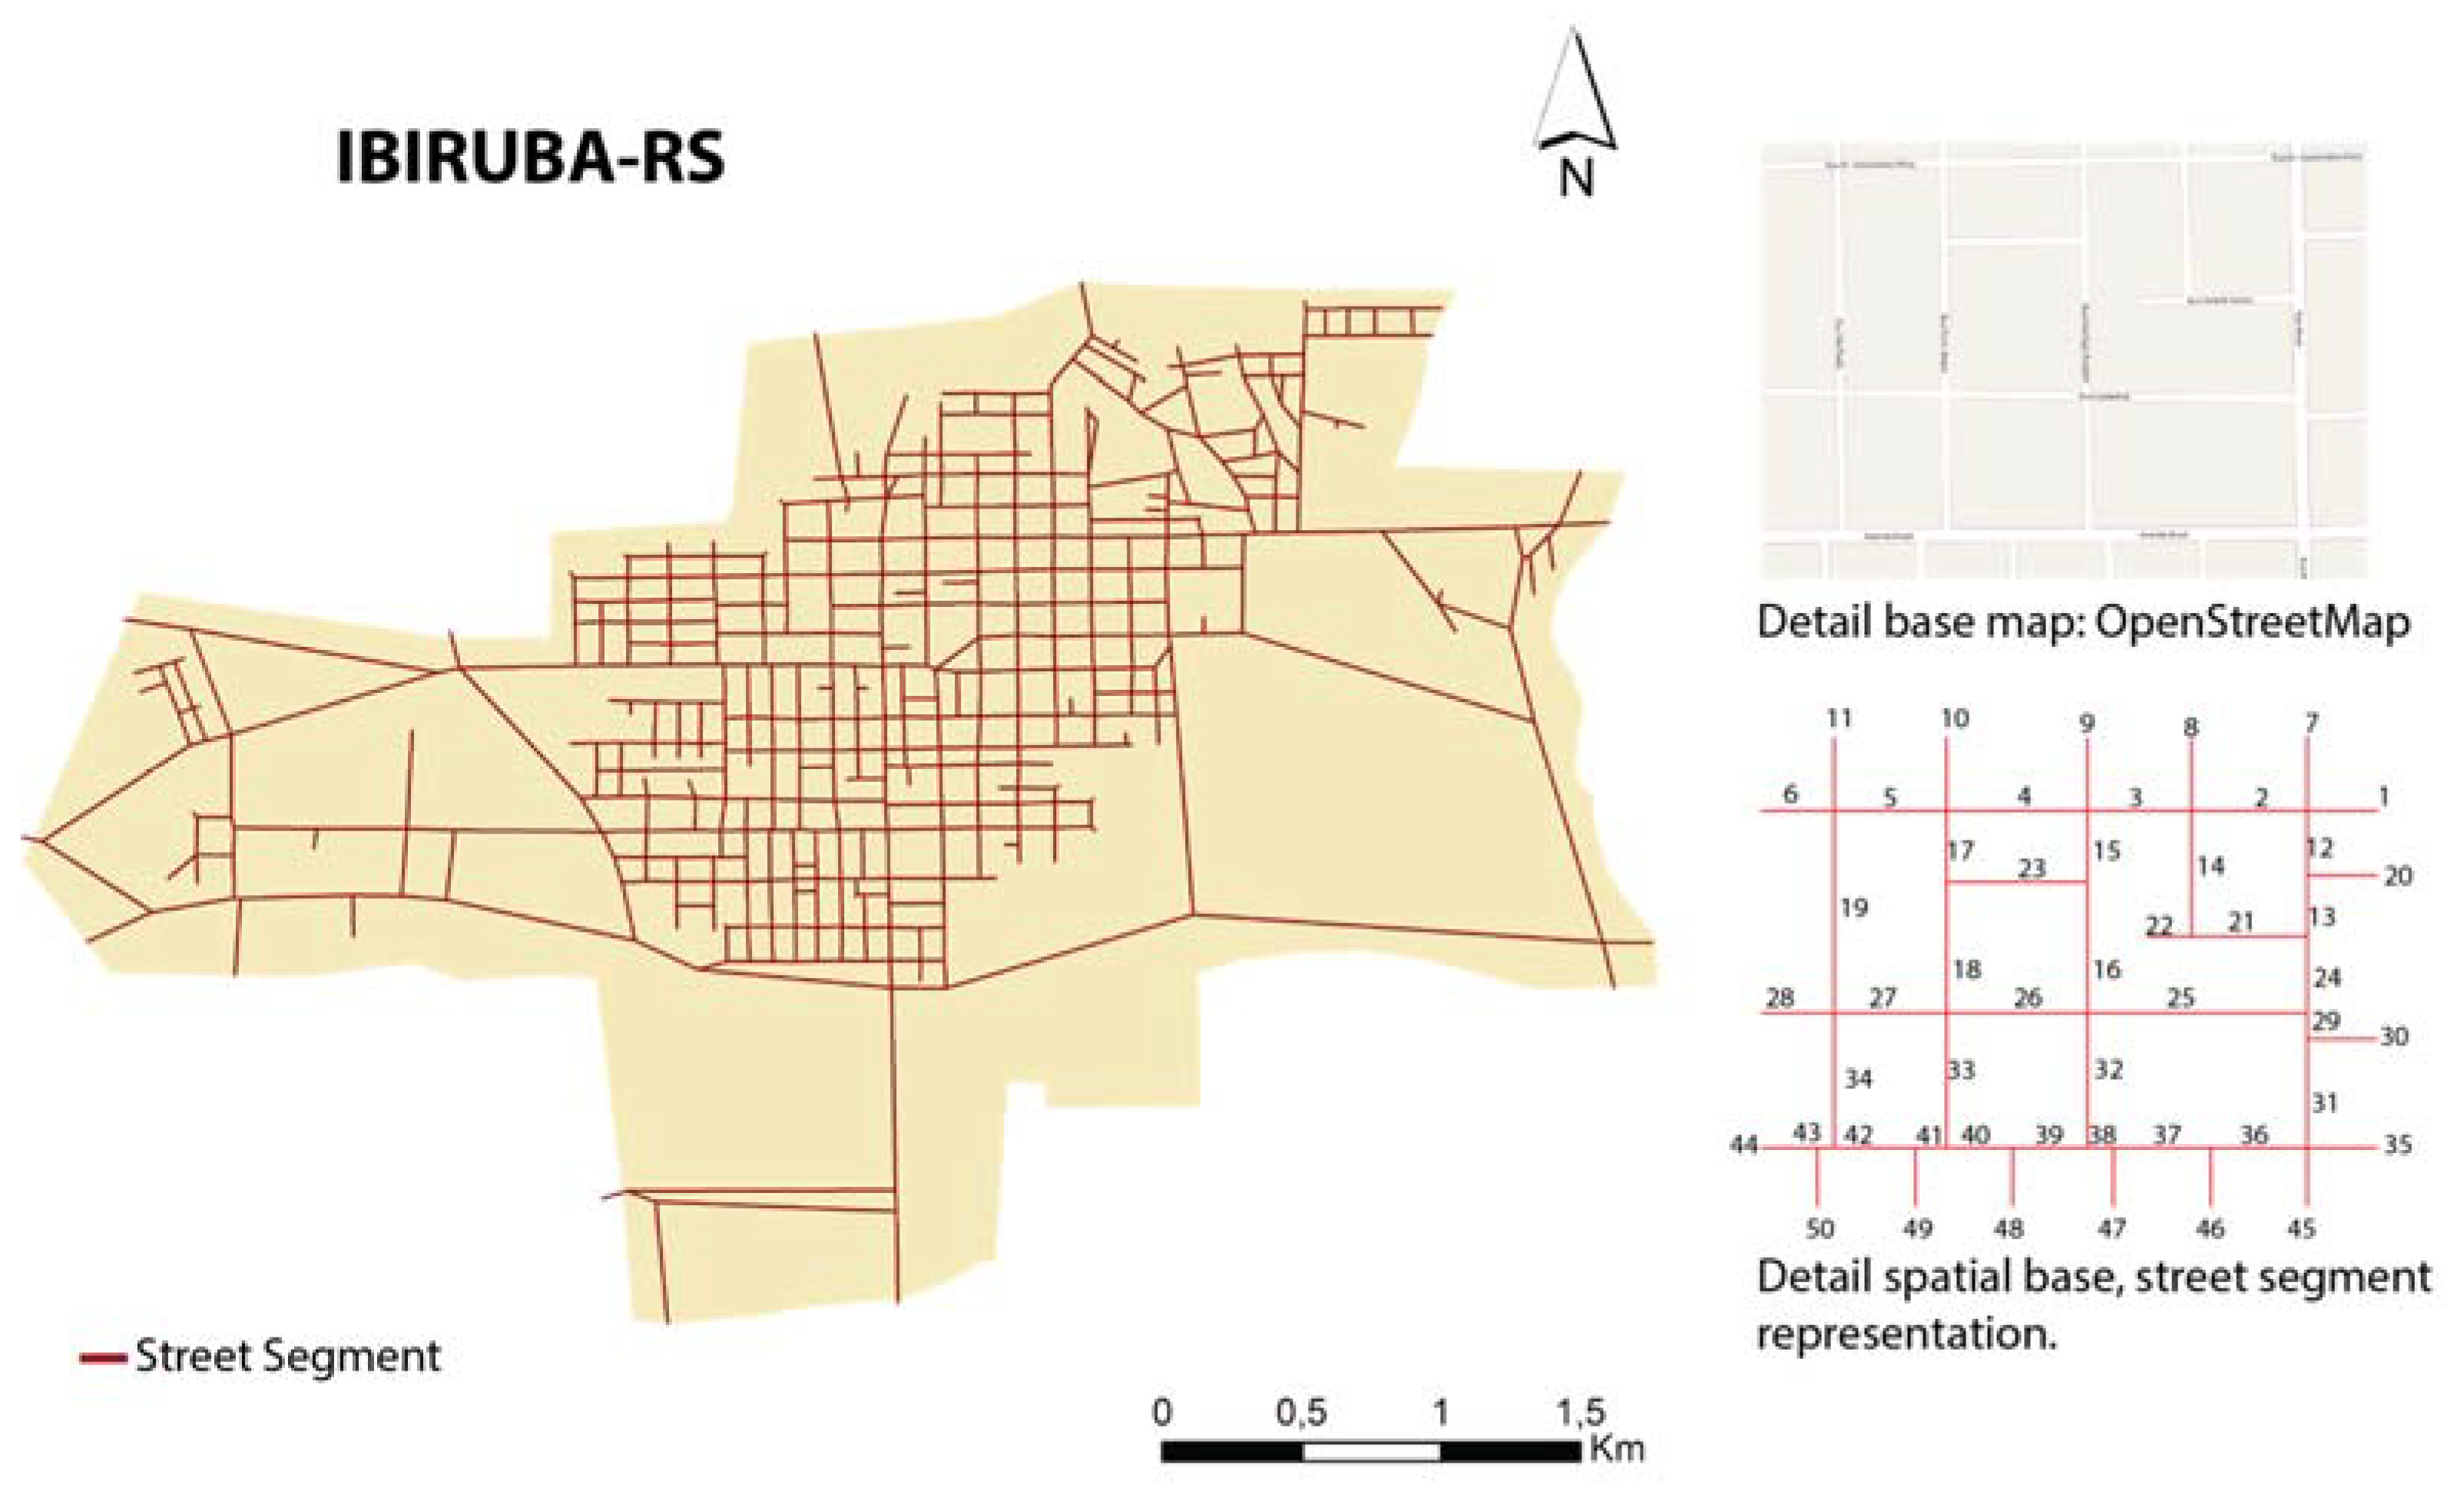
To start, this methodology required the city to be represented as a network, defining the discrete units of urban space to be used, according to the study objectives. We used “street segments”, the geographic space located between two corners. The choice of this spatial unit was due to its high level of detail considering the very unequal distribution of retail shops along the streets, and a small distortion of length between the segment and the actual street. The small distortions in the length were important to us because we were considering geometric values for the calculations of distance.
A street map provided by IBGE (Brazilian Institute of Geography and Statistics) was updated using Open Street Map (ArcGIS Desktop r. 10.1 [34]—ESRI/DigitalGlobe, 2010–2011) to generate the network of segments. This spatial basis contains 711 street segments (Figure 1).
Once the spatialization of the network was finalized, we collected the empirical data to compose the attributes for each street segment. Data on residents correspond to the amount of population in each street segment of the city. This data was obtained through the 2010 IBGE Census (Basic archive, variable V002) referring to the number of residents per Census tract. IBGE also provided the digital network of census tracts in the shapefile format, which was imported into the same GIS environment. The total population of each Census tract was equally distributed between the street segments included in its geographic limits.
Residents were also distinguished by income strata. We estimated an average household income for each Census tract by dividing the total income by the number of dwellings in each Census tract. Then, we classified the results in three categories (in minimum wages): (a) Low (up to 3.5 mw); (b) medium (from 3.5 mw to 6.0 mw) and (c) high (above 6.0 mw). We compared only high and low-income strata. Data on retail establishments was obtained through field research in June, 2017. All 352 retail shops had their addresses recorded and were spatially located in each street segment in ArcGis.
In order to allocate population data from the Census tracts (polygons) to each street segment (line) a GIS procedure was adopted. All lines (segments) were transformed into 3 points (two edges and middle), and the ArcGis “spatial join” function was applied to transfer the data from the polygons to the points contained in their area. After this first procedure, the “spatial join” function was used again to transfer the data back from points into lines.
After this preparation, data relating to the attributes of population and retail activities was organized into tables in the GIS environment (.xml format) and imported into the Medidas Urbanas software [35] to perform the configurational analysis. This software allows linking a database to the spatial basis, enabling the insertion of loads into the spatial units to represent different attributes of the spaces. Thus, the numbers of retail establishments and residents in each street segment were considered as loads in the Centrality model.
In this paper we considered all the retail establishments with the same attractiveness (weight 1.0 in the model), regardless of their attributes, because we did not have good enough data to establish different weights in the model. The residential locations were considered by their income group (low, medium, high) and received a weight of 1.0 in the model.
For the calculation of distances, we used the geometric distance between each pair of street segments, which we considered to be the most reliable in relation to reality, since in everyday life geographic distances have a significant impact on people’s decisions of movement.
The results obtained by applying the centrality model were re-introduced into the GIS platform and the relationship between the spatial system and the socioeconomic data was analyzed and evaluated. Two basic scenarios (thematic maps) were produced, which are presented in the next section.
4. Results
The municipality of Ibirubá is located in the south of Brazil. It has three main districts and a population of approximately 20,000 inhabitants. Figure 2 shows the location of the city.
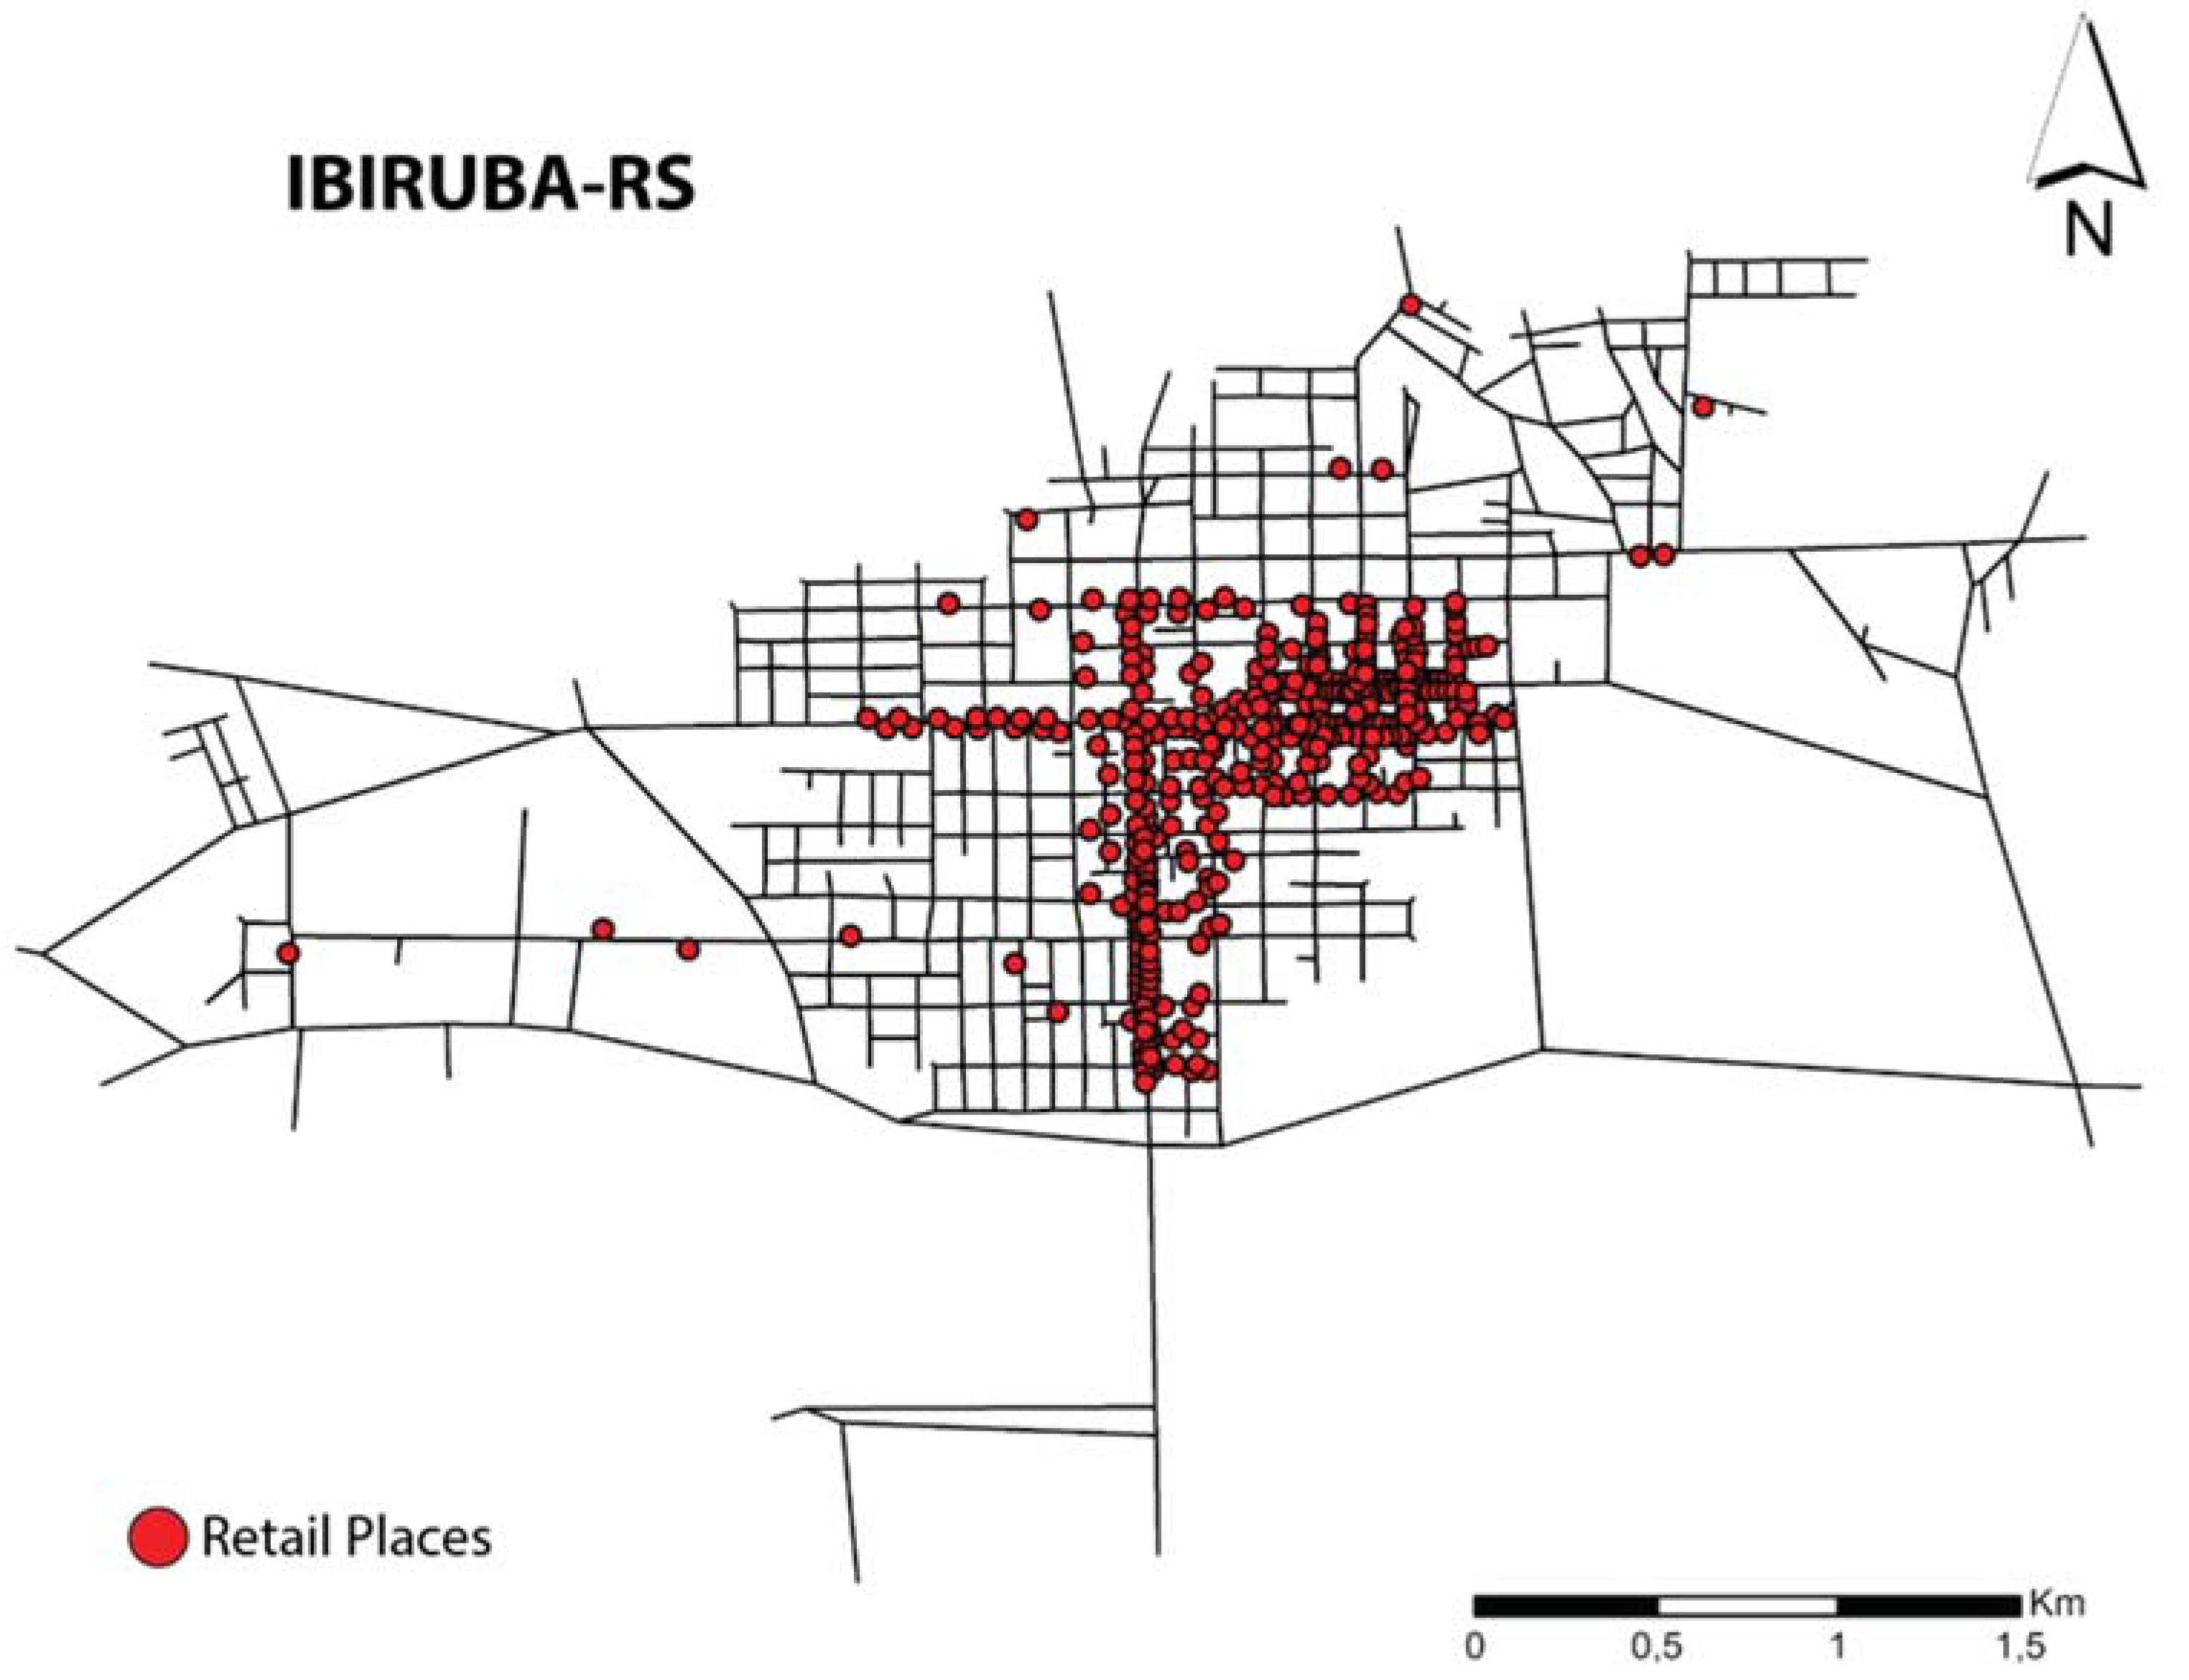
The city’s economy is based on agriculture and agribusiness. In Figure 3 we can see the distribution of household income in each Census tract. There is a large concentration of the high-income strata in and around the downtown area and in the southeast side. The retail sector is constituted mainly of small family-owned shops and some larger shops, such as supermarkets and furniture stores. Figure 4 locates the retail establishments, showing a concentration in the downtown area.
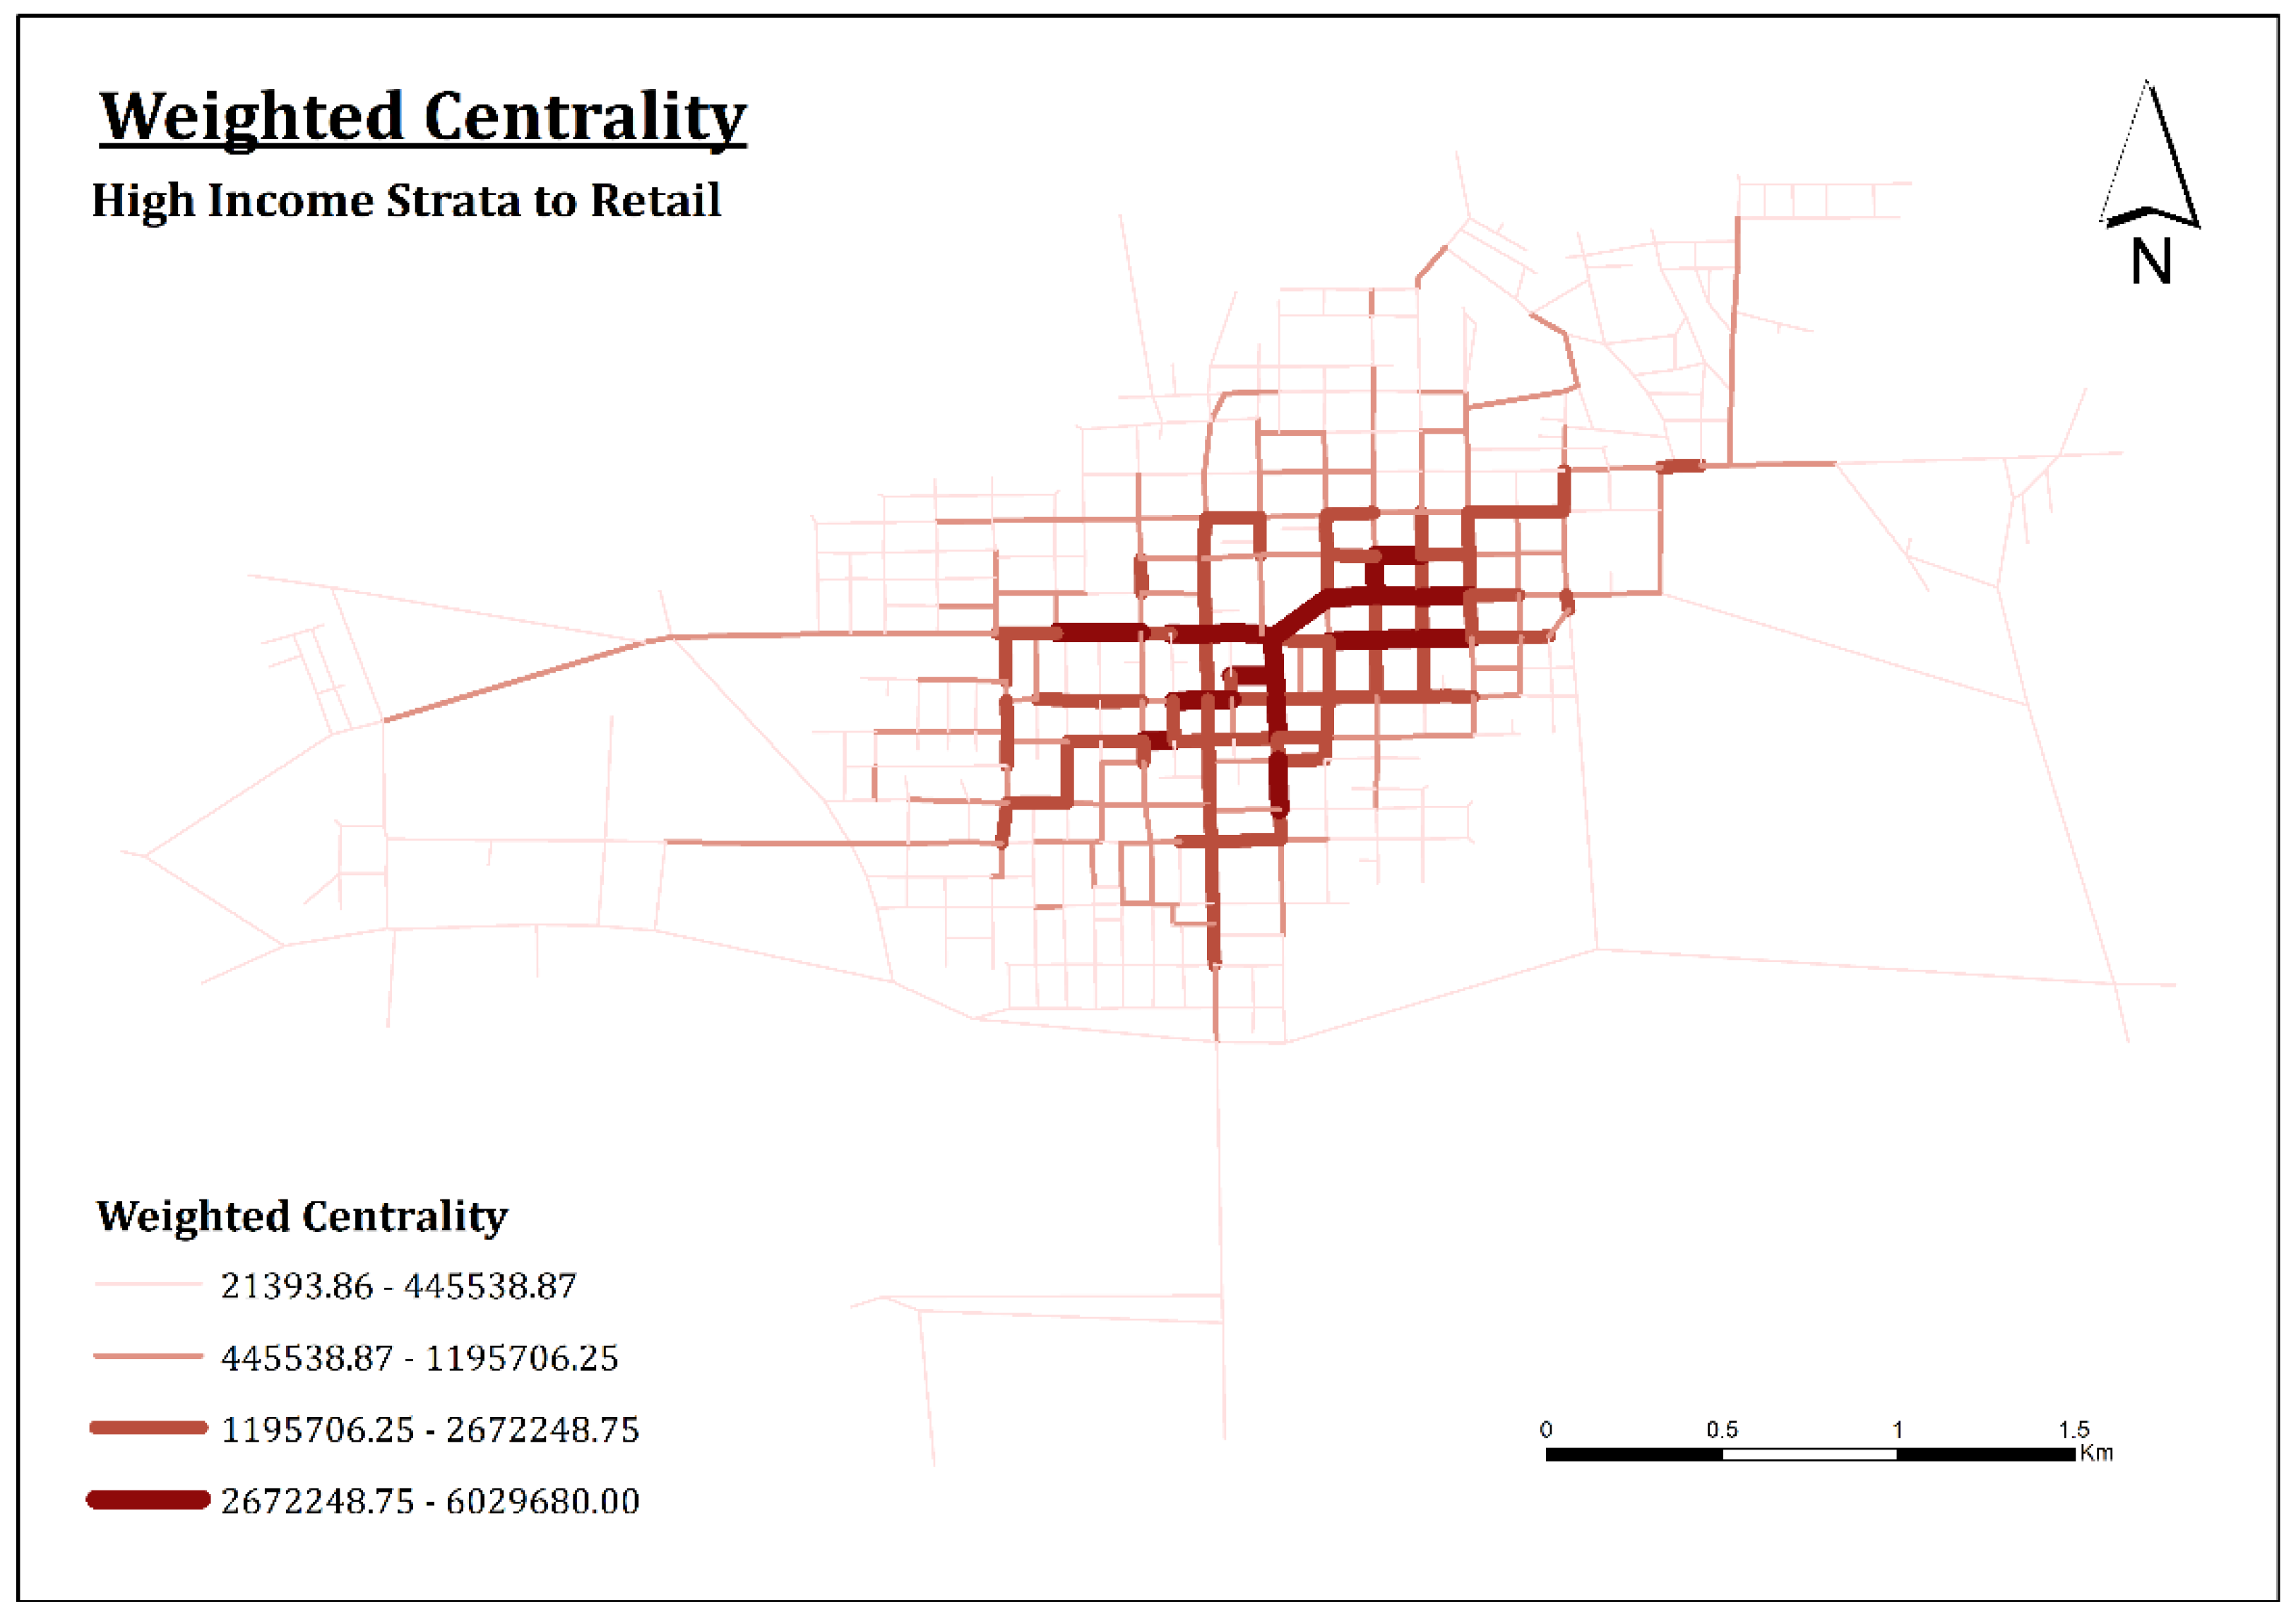
The weighted centrality results for the high-income strata shows a strong concentration in the central commercial area and its adjacencies, but it also shows that this income group probably does not move in the more peripheral area of the city when going to retail establishments. Figure 5 shows the map with the results, which were classified into 4 categories by natural breaks.
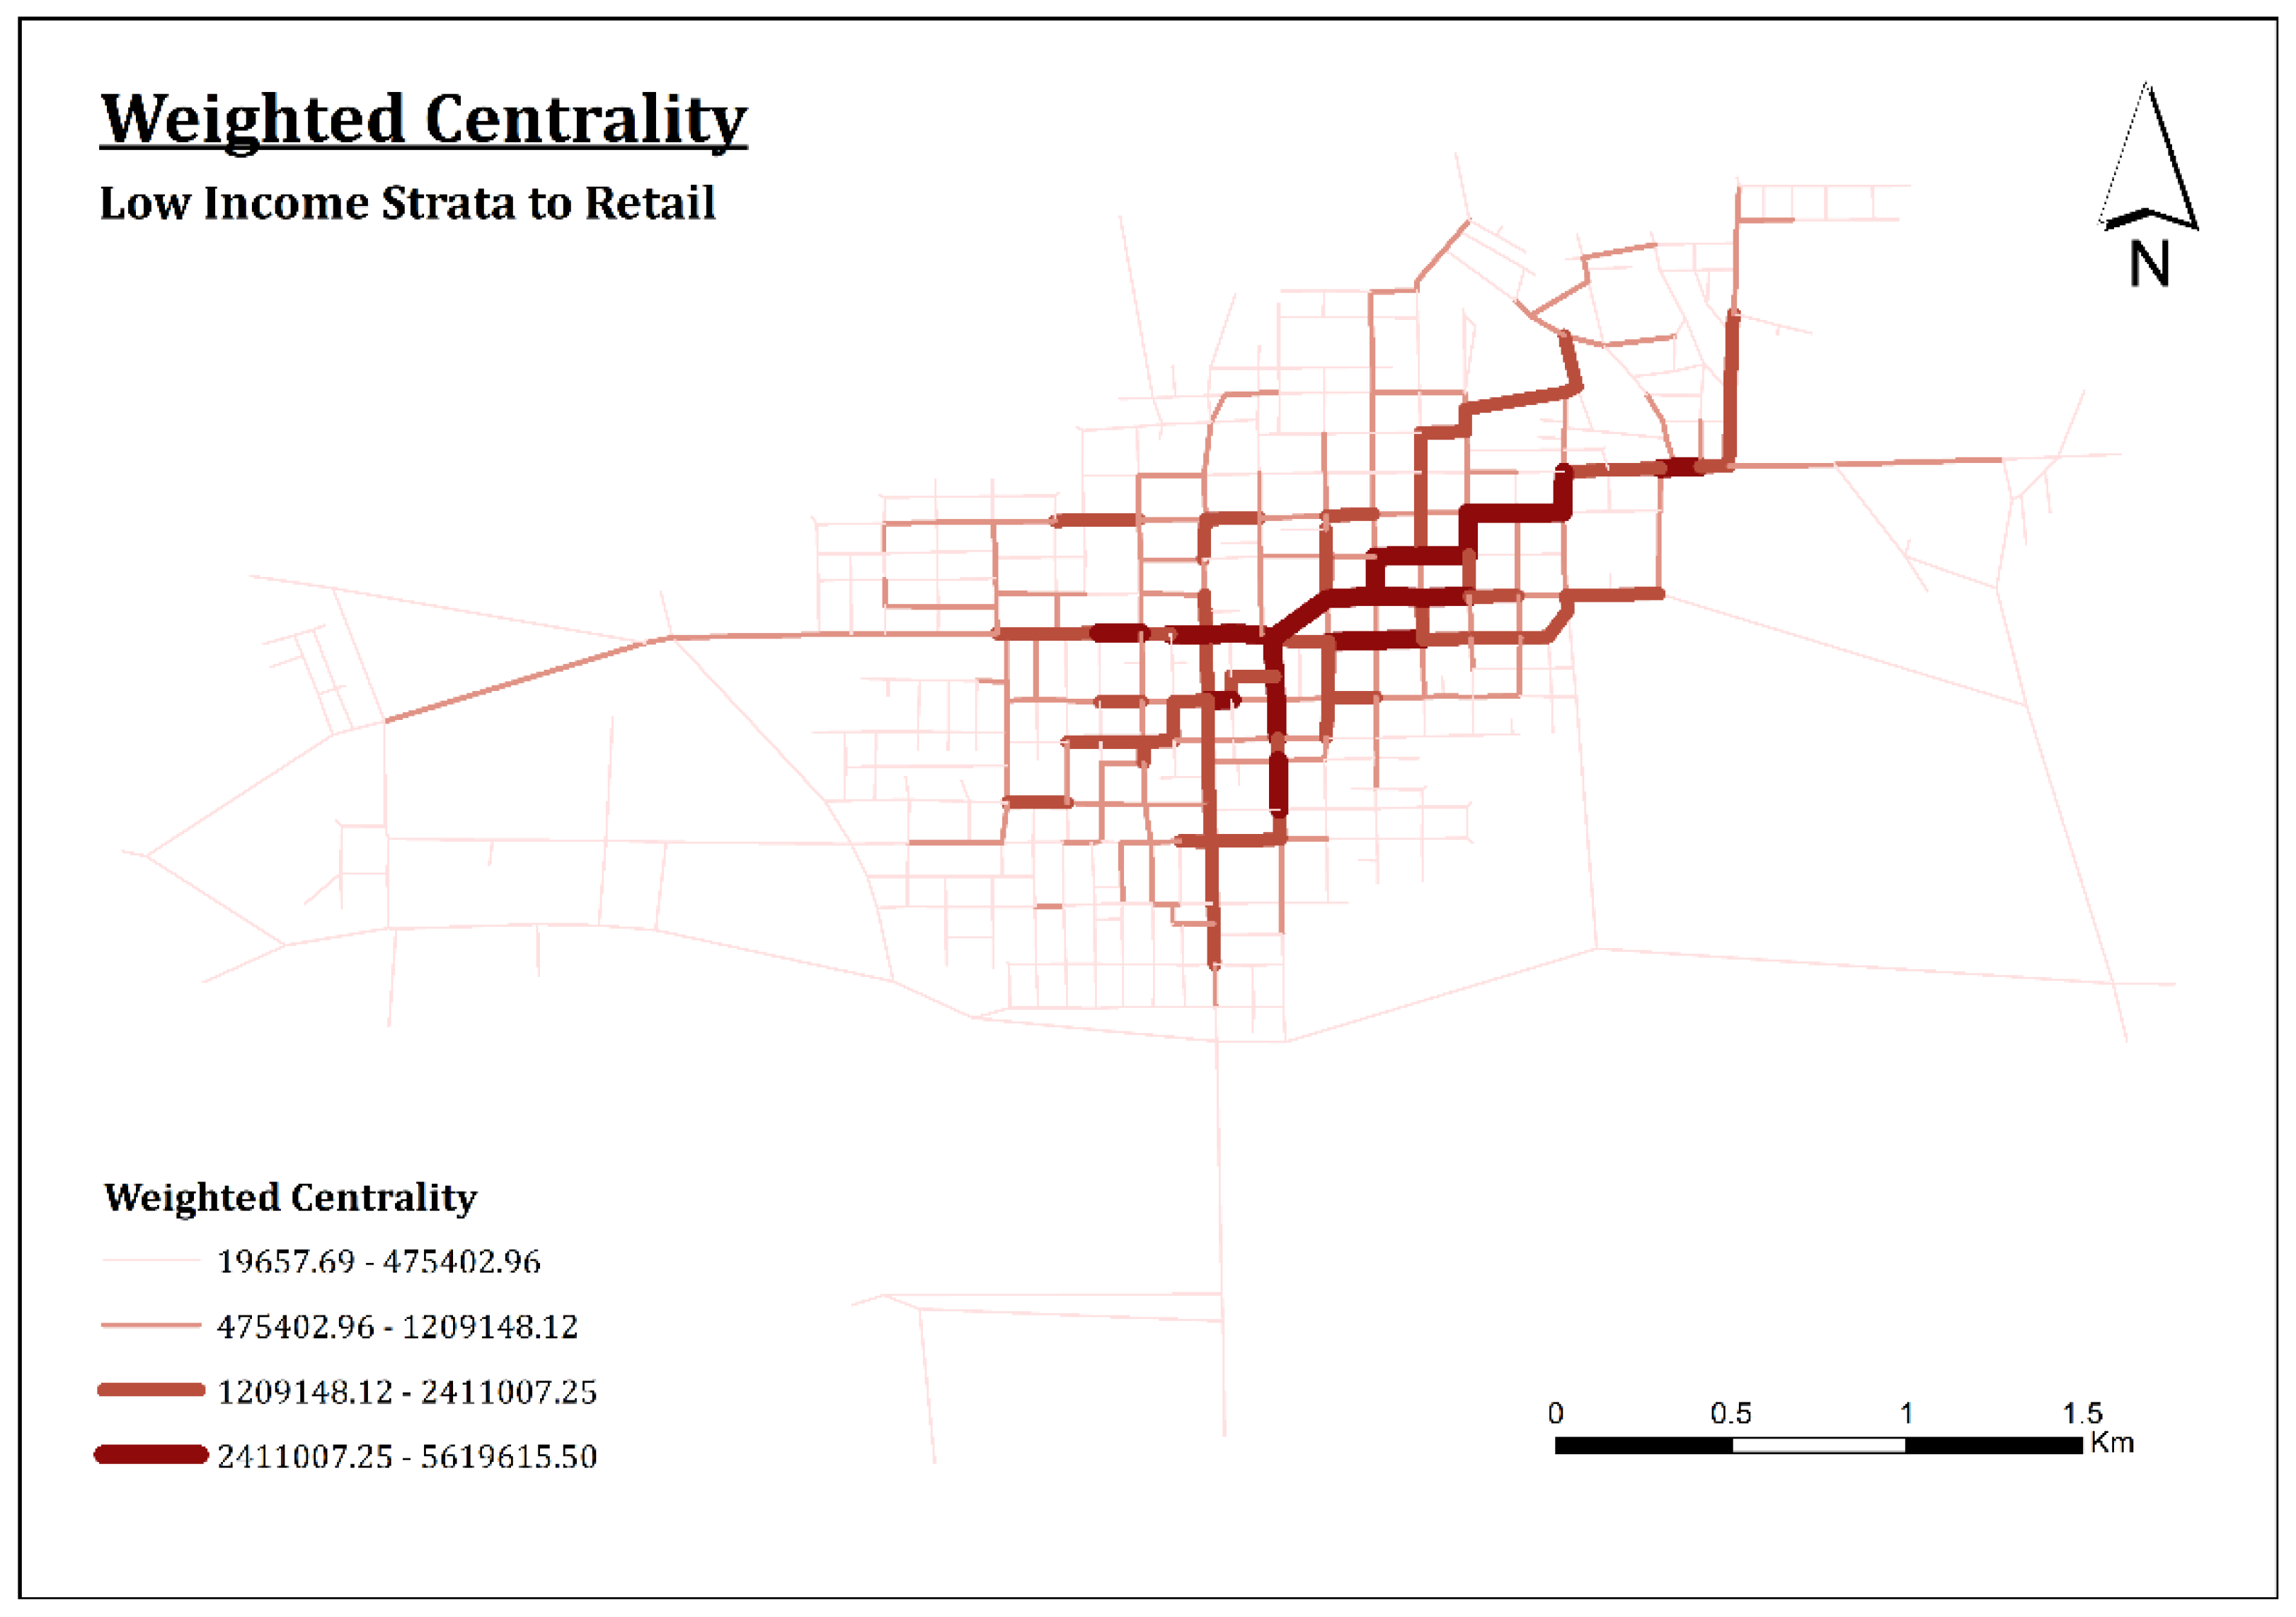
When analyzing the weighted centrality results for the low-income strata in relation to retail establishments there was a change in the results. Figure 6 shows that, although the central commercial area is also important, there are some peripheral segments that gain importance and the segments of the neighborhoods where the high-income group lives start losing importance. The results were also classified by natural breaks into four categories.
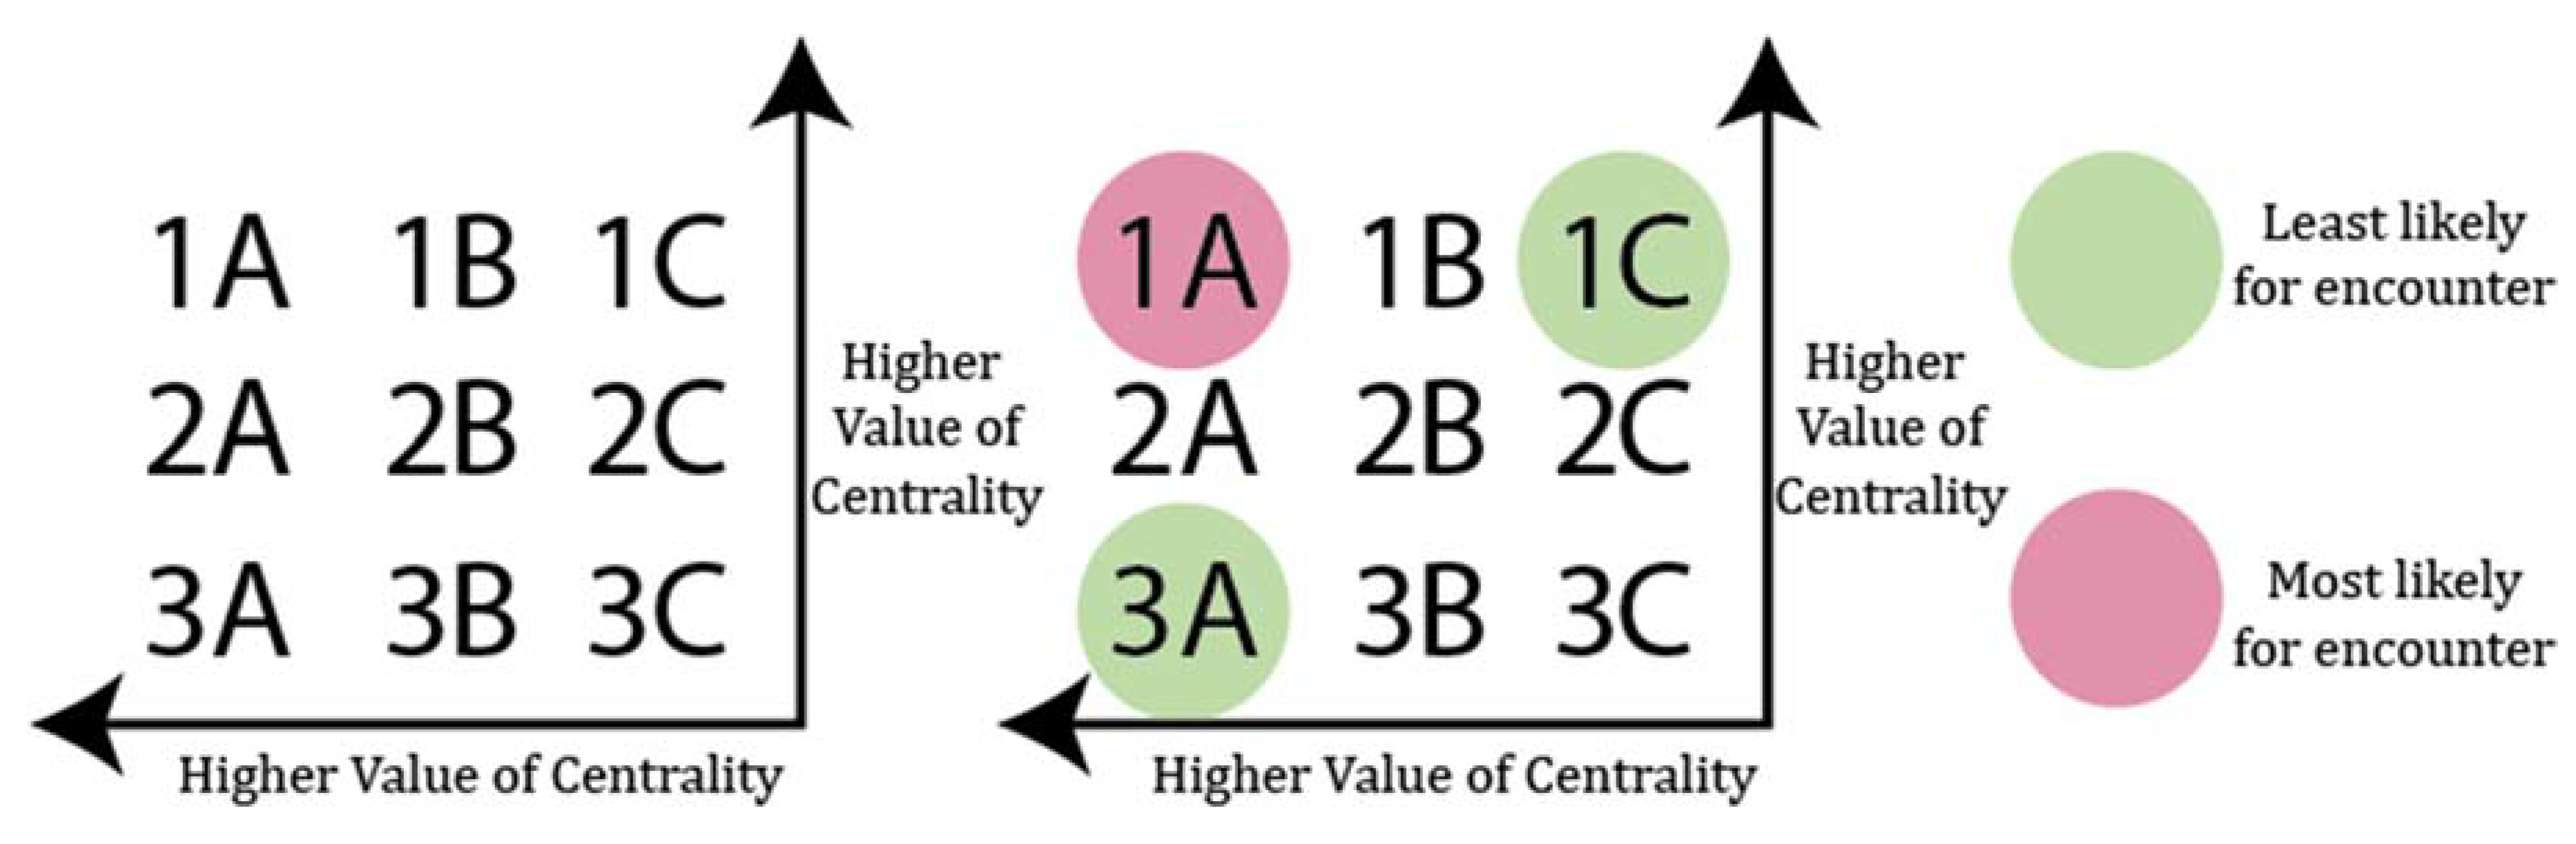
For the comparison of results, we chose the method of bivariate map analysis. The weighted centrality results for high income were categorized into three groups: (1) for high value of centrality; (2) for medium value of centrality; and (3) for low value of centrality, and the results for the low-income group were also categorized into three groups: (A) for high value of centrality; (B) for medium value of centrality; and (C) for low value of centrality. These categories were then compared against each other as shown in Figure 7.
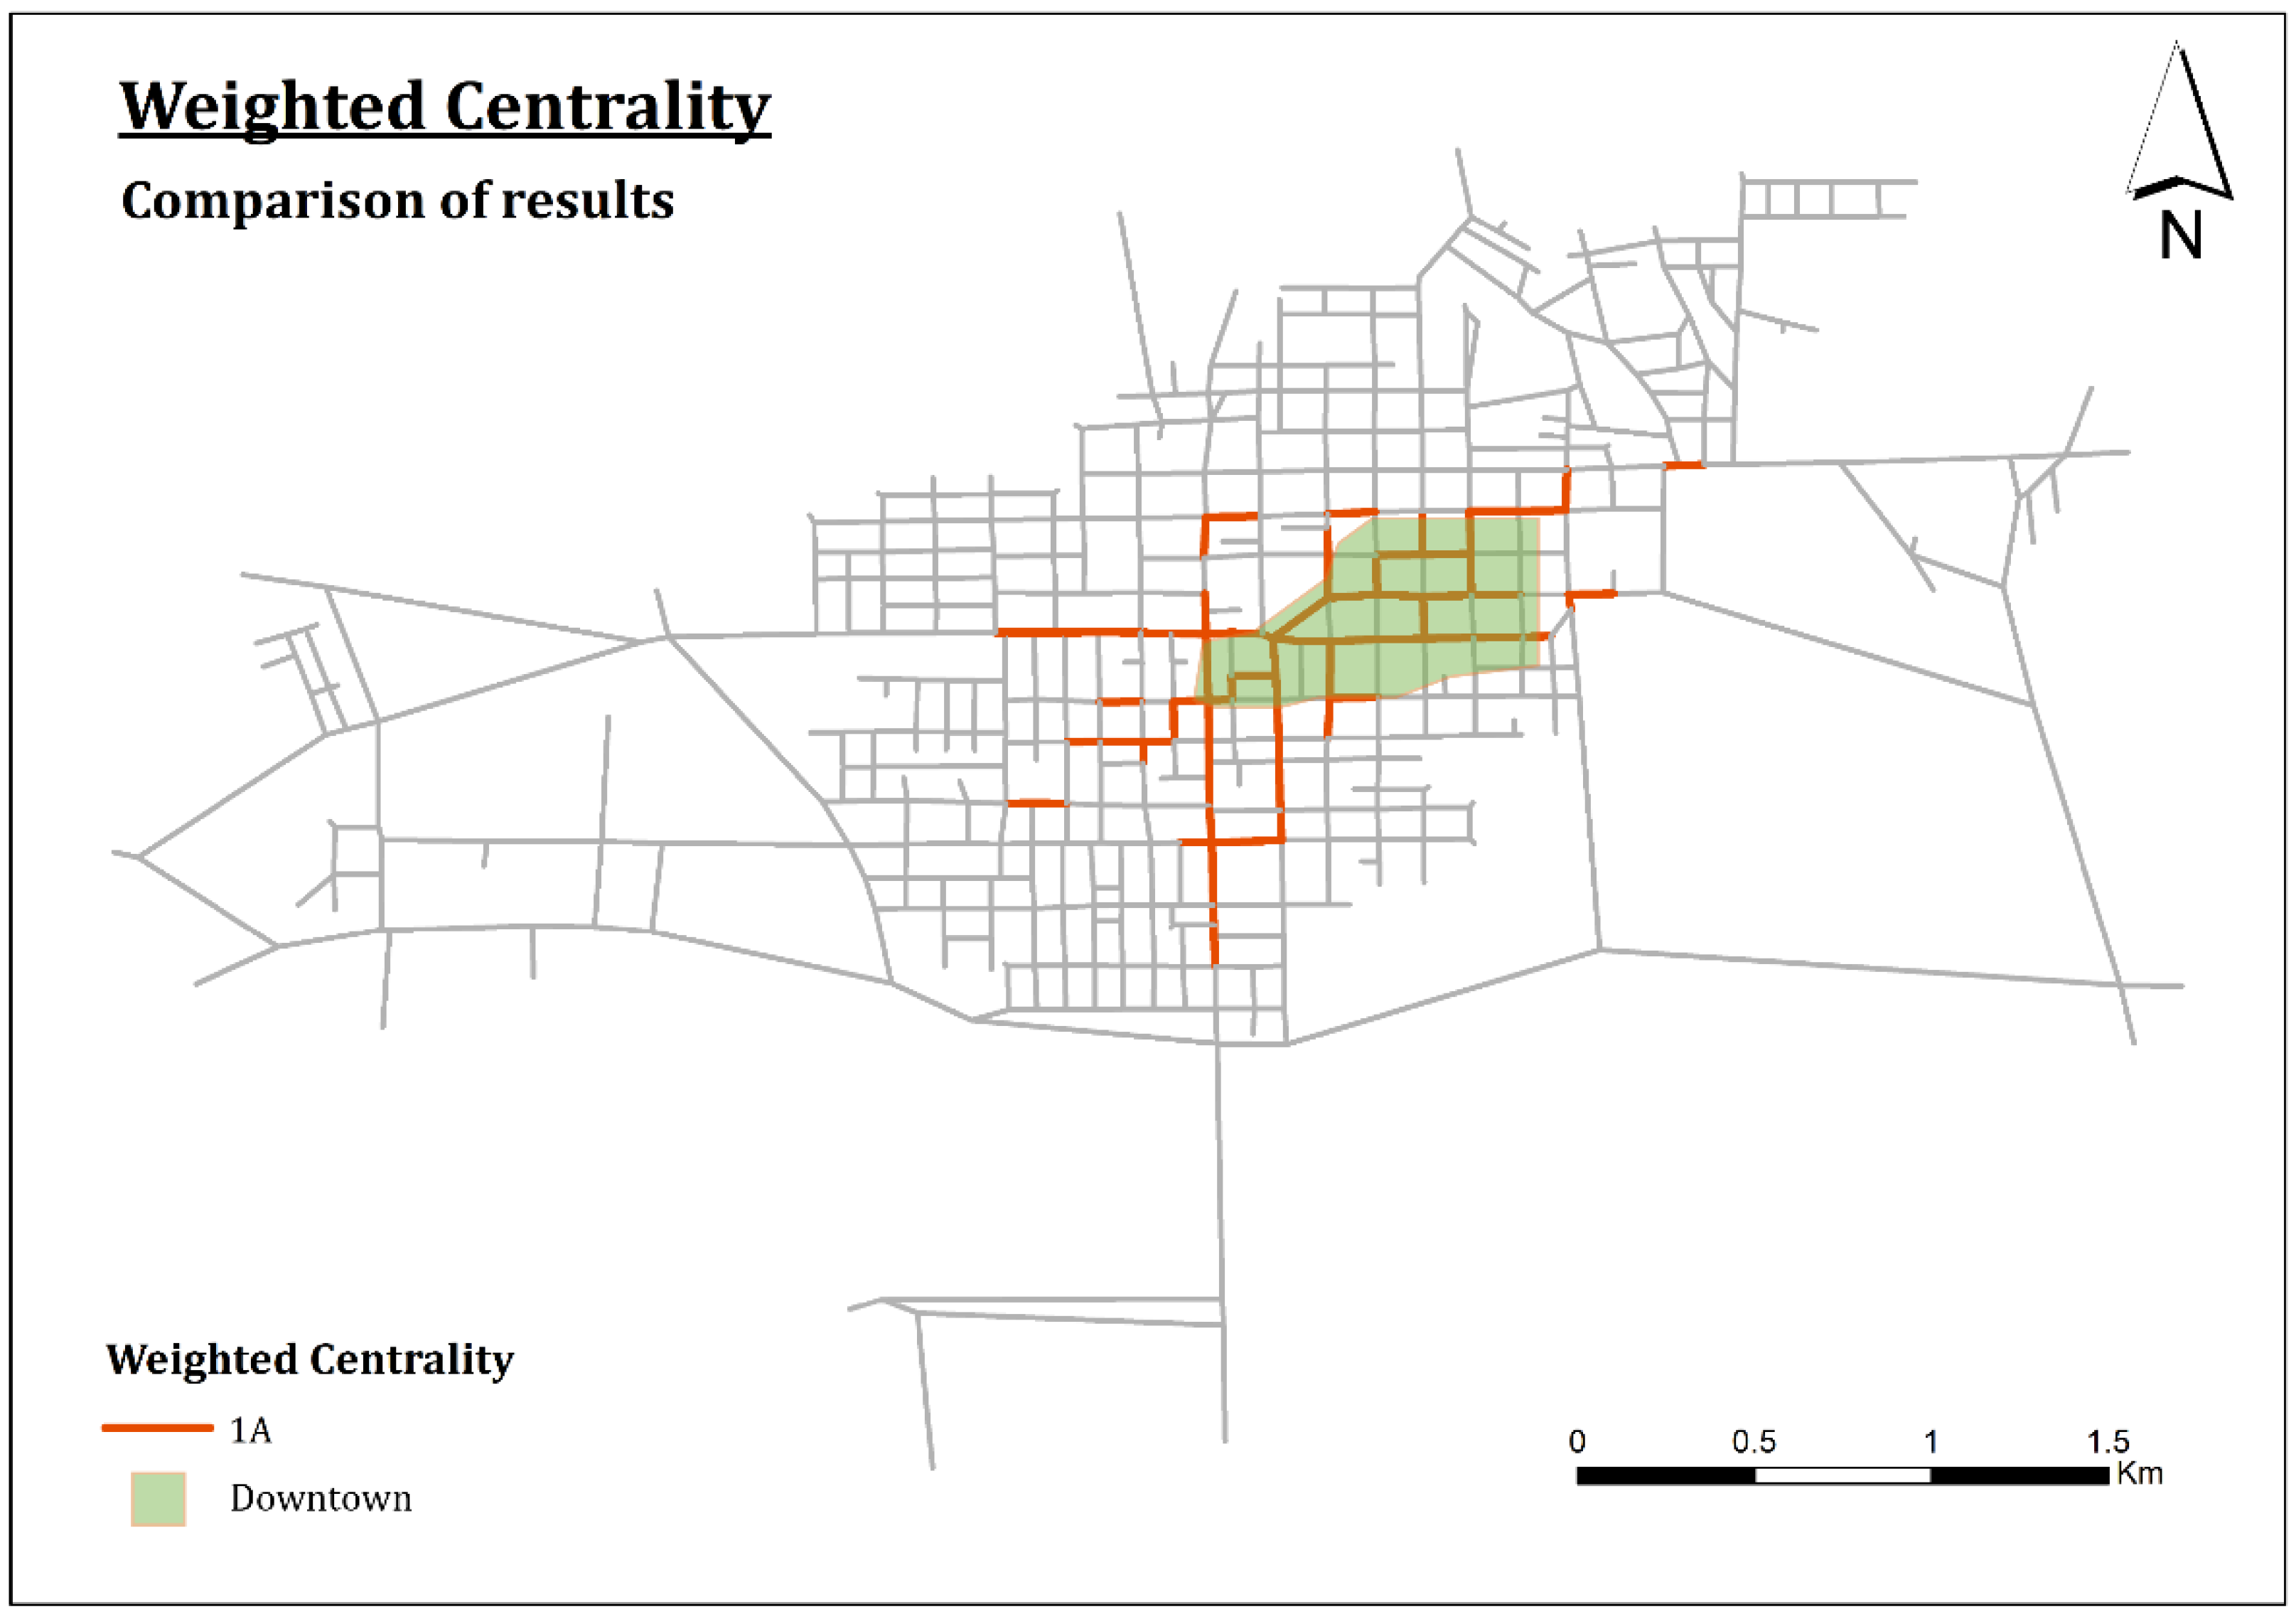
For this paper we were interest in the results in the 1A, 1C and 3A categories, for they would demonstrate the street segments where an encounter is most likely to happen (1A equal high values of centrality for both high and low income groups), and so, show us the least segregated area and the street segments where an encounter is least likely to happen (1C, 3A, where we had results of high centrality values for one groups and low values for another), or the most segregated areas in the city. Figure 8 shows the map with the comparison results.
The results of the comparison showed that there were no segments in the 1C and 3A categories, which leads to the conclusion that the city is not segregated when analyzing the probable interaction between residence–retail establishments. The results also showed us that the highest centrality values for both groups (1A) occur in segments located in the downtown area, which indicates that people from different income groups probably encounter one another when going to retail establishments in Ibirubá.
We must take into account that we are dealing with a small city, which exhibits short, walkable distances. Retail establishments tend to choose their location in order to obtain maximum accessibility for the whole population, in this case the downtown area. Although Ibirubá demonstrates some preferential regions for higher income groups, the city still doesn’t show a residential segmentation capable of creating economic viability for retail decentralization. Our results show that both income strata seem to share the same spaces when moving to shopping areas, suggesting that the residence-shopping relation exhibits a not-segregated pattern for these different groups.
5. Discussion
With this paper we aimed to demonstrate how a configurational methodology could be used for identifying and analyzing urban segregation. Our focus is the segregation that occurs in public spaces through the movement of individuals while performing their activities. The segregation in public spaces can enhance or strengthen the separation between different social groups. The Freeman-Krafta Centrality model was used as an indicator of social flow of individuals moving through the spatial system to perform shopping activities. This method allowed for a systemic description of the urban network, relating its spatial and social attributes. The Centrality model computed the tension generated by pairs of spaces with social content (residents and retail establishments) and distributes this tension through the shortest paths, as in gravitational models [36]. The Centrality model considers that the intensity of the relation between pairs of spaces decreases with increasing distance.
Being a systemic description of reality, our methodology could be used to generate what–if scenarios in order to simulate changes in spatial segregation. For example, we could simulate the impact of a new social housing estate and measure changes in the segregation patterns of activities, such as shopping, working or studying.
However, modeling implies simplifications. In this paper we considered all retail establishments to be equal, regardless of their attributes. Although the model can account for different attributes of the shops, such as retailer size, variety of goods, quality of facilities, etc., such detailed empirical data was not available to this study. These attributes can be inserted as loads in the spatial units and can then be processed by the model.
Another modeling limitation involves transport modes. High income groups tend to move using their automobiles, while the low-income strata tend to use the public transportation system. All these differences can be computed by imposing a different coverage radius of displacement to each socioeconomic group. These improvements stand as suggestions for future work on this topic.
The adopted methodology produced a segregation measure that differs from the traditional methods based only on household income. It is a spatial disaggregated measure at the street segment level, instead of Census tracts or larger zones. In addition, the measure expresses a kind of “dynamic” segregation, resulting from the potential of shared use of public space by different social groups. These approaches, both the traditional ones and the more “dynamic” ones, can be used complementarily in order to provide a broader picture of urban spatial segregation.
Finally, we must say that modeling approaches can be regarded as promising tools of urban planning, as they allow us to systematize relevant metrics on complex urban issues, such as urban segregation, supporting decision processes. Although this method does not address the underlying sociopolitical processes involved in segregation (is it good or bad? For whom?), the metrics of segregation in relation to population groups establish an essential, preliminary basis for inquiry.
Author Contributions
Conceptualization, A.L.M.; Methodology, A.L.M. and C.M.; Software, A.L.M.; Validation, A.L.M.; Formal Analysis, A.L.M.; Investigation, A.L.M. and C.M.; Resources, A.L.M. and C.M.; Data Curation, A.L.M.; Writing-Original Draft Preparation, A.L.M.; Writing-Review & Editing, A.L.M. and C.M.; Visualization, A.L.M.; Supervision, C.M.; Project Administration, A.L.M.
Funding
This research received funding from a CAPES (Brazilian Council for the Improvement of Higher Education) master scholarship.
Conflicts of Interest
The authors declare no conflict of interest.
References
- Freeman, L. Segregation in social networks. Social Methods Res. 1978, 6, 411–429. [Google Scholar] [CrossRef]
- Fainstein, S. The Just City; Cornell University Press: Ithaca, NY, USA, 2010; ISBN 978-0-8014-7690-7. [Google Scholar]
- Feitosa, F.; Câmara, G.; Monteiro, A.M.V.; Koschitzki, T.; Silva, M.P.S. Global and local spatial indices of urban segregation. Int. J. Geogr. Inf. Sci. 2014, 21, 299–323. [Google Scholar] [CrossRef]
- Legeby, A. Urban Segregation and Urban Form. Ph.D. Thesis, KTH Royal Institute of Technology, Stockholm, Sweden, 2010. [Google Scholar]
- Villaça, F. A segregação urbana e a justiça (ou a justiça no injusto espaço urbano). Rev. Bras. Ciênc. Crim. 2003, 11, 341–346. [Google Scholar]
- Vaughan, L.; David, L.C.C.; Ozlem, S.; Mordechai (Muki), H. Space and Exclusion. Area 2005, 37, 402–412. [Google Scholar] [CrossRef]
- Sibley, D. Outsiders in society and space. In Inventing Places: Studies in Cultural Geography; Anderson, K., Gale, F., Eds.; Longman Cheshire: Melbourne, Australia, 1992. [Google Scholar]
- Vaughan, L.; Arbaci, S. The challenges of understanding urban segregation. Built Environ. 2011, 37, 128–138. [Google Scholar] [CrossRef]
- Feitosa, F.; Quang, B.L.; Paul, L.G.V.; Antônio, M.V.M.; Roberta, R. Countering urban segregation in Brazilian cities. Environ. Plan. B Plan. Des. 2012, 39, 1131–1150. [Google Scholar] [CrossRef]
- White, M. The measurement of spatial segregation. Am. J. Sociol. 1983, 88, 1008–1018. [Google Scholar] [CrossRef]
- Burgess, E. Residential segregation in American cities. Ann. Am. Acad. Pol. Soc. Sci. 1928, 140, 105–115. [Google Scholar] [CrossRef]
- Caldeira, T. Imprinting and Moving Around: New Visibilities and Configurations of Public Space in São Paulo. Public Cult. 2012, 24, 385–419. [Google Scholar] [CrossRef]
- Caldeira, T. Cidade de Muros; Editora 34: São Paulo, Brazil, 2000. [Google Scholar]
- Sposito, M.; Góes, E. Espaços Fechados e Cidades; Unesp: São Paulo, Brazil, 2013. [Google Scholar]
- Sposati, A. Pobreza e desigualdade no século do desperdício. In Proceedings of the 32nd International Conference of Social Welfare, Brasília, Brazil, 16–20 July 2006. [Google Scholar]
- Villaça, F. São Paulo: Segregação urbana e desigualdade. Estud. Av. 2011, 25. [Google Scholar] [CrossRef]
- Vaughan, L. The spatial syntax of urban segregation. Prog. Plan. 2007, 64. [Google Scholar] [CrossRef]
- Krafta, R. Spatial self-organization and the production of the city. Cybergeo Eur. J. Geogr. 1999. [Google Scholar] [CrossRef]
- Feitosa, F.; Lisboa, F. Para além da perspectiva residencial. Rev. Bras. Cartogr. 2016, 68, 797–813. [Google Scholar]
- Hillier, B.; Hanson, J. The Social Logic of Space; Cambridge University Press: Cambridge, UK, 1984. [Google Scholar]
- Holanda, F. O Espaço de Exceção; Editora UnB: Brasília, Brazil, 2002. [Google Scholar]
- Pløger, J. Foucault’s Dispositif and the City. Plan. Theory 2008, 7, 51–70. [Google Scholar]
- Hillier, B. Space is the Machine: A Configurational Theory of Architecture; Cambridge University Press: Cambridge, UK, 1996. [Google Scholar]
- Crucitti, P.; Latora, V.; Porta, S. Centrality measures in spatial networks of urban streets. Phys. Rev. E 2006, 73, 1–5. [Google Scholar] [CrossRef] [PubMed]
- Krafta, R. Modelling intraurban configurational development. Environ. Plan. B Plan. Des. 1994, 21, 67–82. [Google Scholar] [CrossRef]
- Legeby, A. From housing segregation to integration in public space. In Proceedings of the 7th International Space Syntax Symposium; Royal Institute of Technology: Stockholm, Sweden, 2009. [Google Scholar]
- Marcus, L. Ecological space and cognitive geometry: Linking humans and environment in space syntax theory. In Proceedings of the 10th International Space Syntax Symposium; Space Syntax Laboratory: London, UK, 2015. [Google Scholar]
- Legeby, A.; Daniel, K.; Ehsan, A. Characterizing urban centres. In Proceedings of the 11th Space Syntax Symposium, Lisbon, Portugal, 3–7 July 2017. [Google Scholar]
- Netto, V. The Social Fabric of Cities; Routledge: New York, NY, USA, 2017; ISBN 978-1-315-55280-4. [Google Scholar]
- Echenique, M. Modelos Matemáticos de la Estructura Especial Urbana; S.I.A.P.: Roma, Italy, 1975; pp. 1–13. [Google Scholar]
- Batty, M. Cities and Complexity; The MIT Press: Cambridge, UK, 2005. [Google Scholar]
- Freeman, L. A set of measures of centrality based on betweenness. Sociometry 1977, 40, 35–41. [Google Scholar] [CrossRef]
- Netto, V.; Krafta, R. Segregação dinâmica urbana: Modelagem e mensuração. Rev. Bras. Estud. Urbanos Reg. 1999, 133–152. [Google Scholar] [CrossRef]
- ESRI—Environmental Systems Research Institute, Inc.: ArcGIS. Professional GIS for the Desktop; v. 10.1; ESRI: Redlands, CA, USA, 2012. [Google Scholar]
- Polidori, M.; Granero, J.; Krafta, R. Medidas Urbanas. V.1.5. Software; FAUrb-UFPel: Pelotas, Brazil, 2001. [Google Scholar]
- Huff, D.L. Defining and estimating a trade area. J. Mark. 1964, 28, 34–38. [Google Scholar] [CrossRef]
Figure 1.
Spatial representation of the city of Ibirubá by street segments (left) and detail (right). Source: Authors, based on Open Street Maps, January, 2018.
Figure 1.
Spatial representation of the city of Ibirubá by street segments (left) and detail (right). Source: Authors, based on Open Street Maps, January, 2018.

Figure 2.
Ibirubá location. Source: Authors, January, 2018.

Figure 3.
Ibirubá by its income strata (Census tracts). Source: Authors based in IBGE, 2010.

Figure 4.
Location of retail establishments. Source: Authors, June 2017.

Figure 5.
Weighted Centrality for high income strata. Source: Authors, January, 2018.

Figure 6.
Weighted centrality for low income strata. Source: Authors, January, 2018.

Figure 7.
Division of results and comparison for analysis. Source: Authors, January, 2018.

Figure 8.
Street segments with highest centrality simultaneously for both income groups in the residences-retail relationship. Source: Authors, January, 2018.
Figure 8.
Street segments with highest centrality simultaneously for both income groups in the residences-retail relationship. Source: Authors, January, 2018.

© 2018 by the authors. Licensee MDPI, Basel, Switzerland. This article is an open access article distributed under the terms and conditions of the Creative Commons Attribution (CC BY) license (http://creativecommons.org/licenses/by/4.0/).
Share and Cite
MDPI and ACS Style
Luisa Maffini, A.; Maraschin, C. Urban Segregation and Socio-Spatial Interactions: A Configurational Approach. Urban Sci. 2018, 2, 55. https://doi.org/10.3390/urbansci2030055
AMA Style
Luisa Maffini A, Maraschin C. Urban Segregation and Socio-Spatial Interactions: A Configurational Approach. Urban Science. 2018; 2(3):55. https://doi.org/10.3390/urbansci2030055
Chicago/Turabian StyleLuisa Maffini, Ana, and Clarice Maraschin. 2018. "Urban Segregation and Socio-Spatial Interactions: A Configurational Approach" Urban Science 2, no. 3: 55. https://doi.org/10.3390/urbansci2030055