The Development of an Infrastructure Quality Index for Nigerian Metropolitan Areas Using Multivariate Geo-Statistical Data Fusion


1
School of Geography, University of Lincoln, Brayford Pool, Lincoln LN6 7TS, UK
2
ICF, Watling House, 33 Cannon Street, London EC4M 5SB, UK
3
Neo-Telligence, 188 Liscard Road, Liscard CH44 5TN, UK
*
Author to whom correspondence should be addressed.
Urban Sci. 2018, 2(3), 59; https://doi.org/10.3390/urbansci2030059
Submission received: 7 July 2018
/
Revised: 12 July 2018
/
Accepted: 14 July 2018
/
Published: 17 July 2018
Abstract
:Nigeria recently witnessed a decade of urban, economic, and social transformation. However, certain features of the Nigerian business environment act as constraints on economic growth. These characteristics also deter investment and exasperate business competitiveness. Inadequate infrastructure is identified as a major constraint to growth and competitiveness. This article summarises the technical development of a City Infrastructure Quality Index (CIQI) aimed at providing a relative measure of performance in urban infrastructure in Nigeria, focusing specifically on factors of production and resources for inclusive economic growth and development. The design of the CIQI adopts quality assurance principles undergirded by a five-stage systematic integration and calibration of spatial statistics derived from secondary data sources. The results have allowed for the piloting of a comparative framework for gauging good practice, excellence and adherence to recognisable standards in the provision of infrastructure across 37 Nigerian urban and metropolitan areas.
1. Introduction
Competitive city indices have existed for over three decades. The first such initiative was the 1970 Prices and Earnings Survey created by UBS, a financial services company, which compared the purchasing power of citizens in 72 cities globally [1].
While indices were initially developed to guide investment decisions, or for multinational companies to calculate compensation packages for expatriate executives (such as indices designed by the Economist Intelligence Unit, a research and advisory services company, and Mercer, a human capital consulting company), over the years their focus broadened to include a wide range of themes and to target a wider audience, which includes business stakeholders but also policy and decision makers, practitioners, and concerned citizens [1].
City indicators are used to capture changing trends, for example, demographics, infrastructure service delivery, rate of city growth, or to measure and monitor performance [2,3,4]. Indices, which are combinations of indicators, are designed to measure overall performance or progress [4,5].
In the context of international development, the United Nations Human Settlements Programme (UN-Habitat) first initiated the Housing Indicators Programme in 1991, which focused on monitoring shelter performances. It was rebranded the Urban Indicators Programme in 1993 to reflect its expanded focus on multiple policy-oriented urban issues [3,4].
Nigeria has witnessed a decade of social and economic growth. This has been facilitated in part by a transformative urbanisation process and extensively documented social and demographic change. Urban centres concentrate dense populations, businesses, and infrastructure, which can bolster agglomeration economies, innovation, and economic growth. These centres often serve as the engines of economic growth.
The positive contribution of infrastructure towards socio-economic growth and development is broadly acknowledged in the academic and policy literature [6,7,8]. Infrastructure investments have contributed more than half to Africa’s economic growth in recent years in terms of Gross Domestic Product (GDP) [9]. However, and therefore of major relevance to economic growth and development, Nigeria suffers from obsolete infrastructure [10,11,12].
The sudden revenues received from oil in the 1970s created the conditions for major investments in infrastructure capacity, notably ports, roads, bridges, and airports [13,14]. Reductions in Federal budgets due to fluctuations in oil prices in the 1980s resulted in no significant additions to infrastructure capacity, as well as a lack of funds destined to the maintenance of existing infrastructure. This caused a deterioration of the country’s road network [15]. As roads are essential for the distribution of goods, a failing road system is a major constraint for economic growth. The deficiencies of the power supply and the impacts on growth and productivity is another major issue in Nigeria [16].
The remainder of this article catalogues the rationale, steps, and findings resulting from the statistical development of a composite indicator for evaluating the quality of urban infrastructure across Nigerian cities. In developing the City Infrastructure Quality Index (CIQI), we were conscious that its relevance and practical application would depend upon the clarity about the aims of measurement and the fundamental principles, quality, and robustness that underpin it. The design process therefore adopts a number of quality assurance principles which include integrity, open, sound, and transparent methodology, robust and reliable official data, serviceability in terms of a planned revision cycle over the long term, and accessibility.
2. Priority Policy Areas for the CIQI
The CIQI aims at providing a relative measure of performance in urban infrastructure in Nigeria, focusing specifically on factors of production and resources for inclusive economic growth and development. The focus is on four broad policy areas identified for the development of the CIQI, based on consultations with local stakeholders, and by taking into consideration policy and academic literature. These are: power, transport, industrial land, and Information and Communication Technologies (ICT).
2.1. Transport-Related Infrastructure
Transport problems are a significant problem in Nigeria, accounting for annual sales losses of 2.4 percent [17]. Road transport is the primary means of transport in the country and poor quality roads and congestion are the main causes of these losses. An adequate inter-regional road and rail network can improve regional connectivity, which helps to promote regional and international trade and can significantly contribute to economic growth and development.
Good roads help to stimulate economic growth by improving travel times for road users and the delivery of goods and services [18]. Additionally, evidence shows that quality investment in road infrastructure helps to cut the costs that commuters pay for transportation services [18]. Similarly, when public urban transportation receives adequate investment attention, the economy benefits [19,20,21,22]. There is evidence of a positive relationship between commuting time and average gross product per capita [21]. Furthermore, good transportation infrastructure makes it easier for new firms to enter the business environment, thereby stimulating business competitiveness [20].
2.2. Industrial Land
Within Nigerian cities, the space and accommodation needs of formal and informal economic activities are often not provided for in the land use and urban development process. Access to land often regularly receives one of the highest rankings when comparing different business constraints in Nigeria. The low availability of land and buildings restricts investment. Due to widespread bureaucratic obstructions, Nigeria is one of the most difficult and expensive places to register landed property in the world [23]. A key issue is therefore how the formal and informal sector accesses the urban facilities required for its operations and better performance.
2.3. Power
The biggest constraint to productivity in Nigeria, as perceived by businesses, is power. Almost all Nigerian firms experience power outages, averaging eight hours per calendar day, which results in indirect costs equivalent to 4.3 percent of sales for manufacturing firms and 5.3 percent for retail firms [17].
To combat this situation, the majority of firms (88 percent) have their own power generating sets, which adds significantly to their operating costs. Approximately 69 percent of the total electricity utilised by manufacturing firms does not come from the national grid. Larger manufacturers are more dependent on self-generation of electricity than smaller ones. On average, the cost of acquiring and maintaining an electricity generator amounts to 9 percent of the total value of machinery budgets and 13 percent of operating expenses [17].
2.4. Information and Communication Technologies (ICT)
Recent research proves that there is a positive relationship between increasing penetration of mobile phones and the growth of the monetary measure of the market value of goods and services [24]. With an average of 10 additional mobile phones per 100 people, a country has the potential to unravel 0.6 percent of supplementary GDP growth. An increase in telecommunications capability also attracts foreign direct investment (FDI) [25].
3. Data, Cities, and Preliminary List of Indicators
Like other developing countries, Nigeria has its fair share of challenges in establishing reliable statistical data infrastructure for evidence-based research. However, in recent years, collaborative engagements between statutory agencies like the National Bureau of Statistics (NBS) and international development partners (such as the World Bank and the Department for International Development [DFID]), have yielded some improvements in the gathering of statistical datasets. Advancements in data management, statistical analysis and retrieval techniques have further expanded opportunities for researchers to undertake novel interdisciplinary research using the datasets available. One of the central aims of this research study was to utilise existing datasets as much as possible. For piloting the CIQI consideration was therefore given to existing data sources.
3.1. Data Source
Following a thorough review of variables subsumed in three potential data sources (The World Bank’s Enterprise Survey, United States Agency for International Development’s Demographic and Health Survey (DHS) and the NBS General Household Survey (GHS)-Panel survey), the World Bank’s Enterprise Survey was chosen as the appropriate dataset for piloting CIQI. The DHS and the GHS-Panel surveys do not contain city-level identifiers. The Nigerian Enterprise Survey is funded by the World Bank and DFID. The broad aim of the survey is to assist the Government of Nigeria in developing a diagnostic base for measuring and benchmarking the country’s enterprise and investment climate. Apart from providing comparative indices across all the 36 states of Nigeria and the Federal Capital Territory (FCT), the survey also allows for benchmark comparators against other countries [28]. The Primary Sampling Unit (PSU) used for the Enterprise Survey is the establishment. In addition to its appropriate alignment with the thematic remits of the CIQI, a major strength of the Enterprise Survey is that it contains city-level identifiers.
3.2. Data Time Points
This study sought to create a baseline CIQI upon which future indices could be created and compared over time. To achieve this, the 2007 and 2009 Enterprise Survey datasets were fused together and used to construct the baseline CIQI. This was done for two reasons. First, both datasets were reported at the city geography. Secondly, evidence shows that most cities are less susceptible to infrastructural change within a short time lag [4]. The time lag between the 2007 and 2009 datasets is two years.
3.3. Selection of Cities
The baseline CIQI is constructed for 37 cities across Nigeria for which data is available. Table 1 shows the 37 cities for which the CIQI is constructed together with the source of data for each corresponding city.
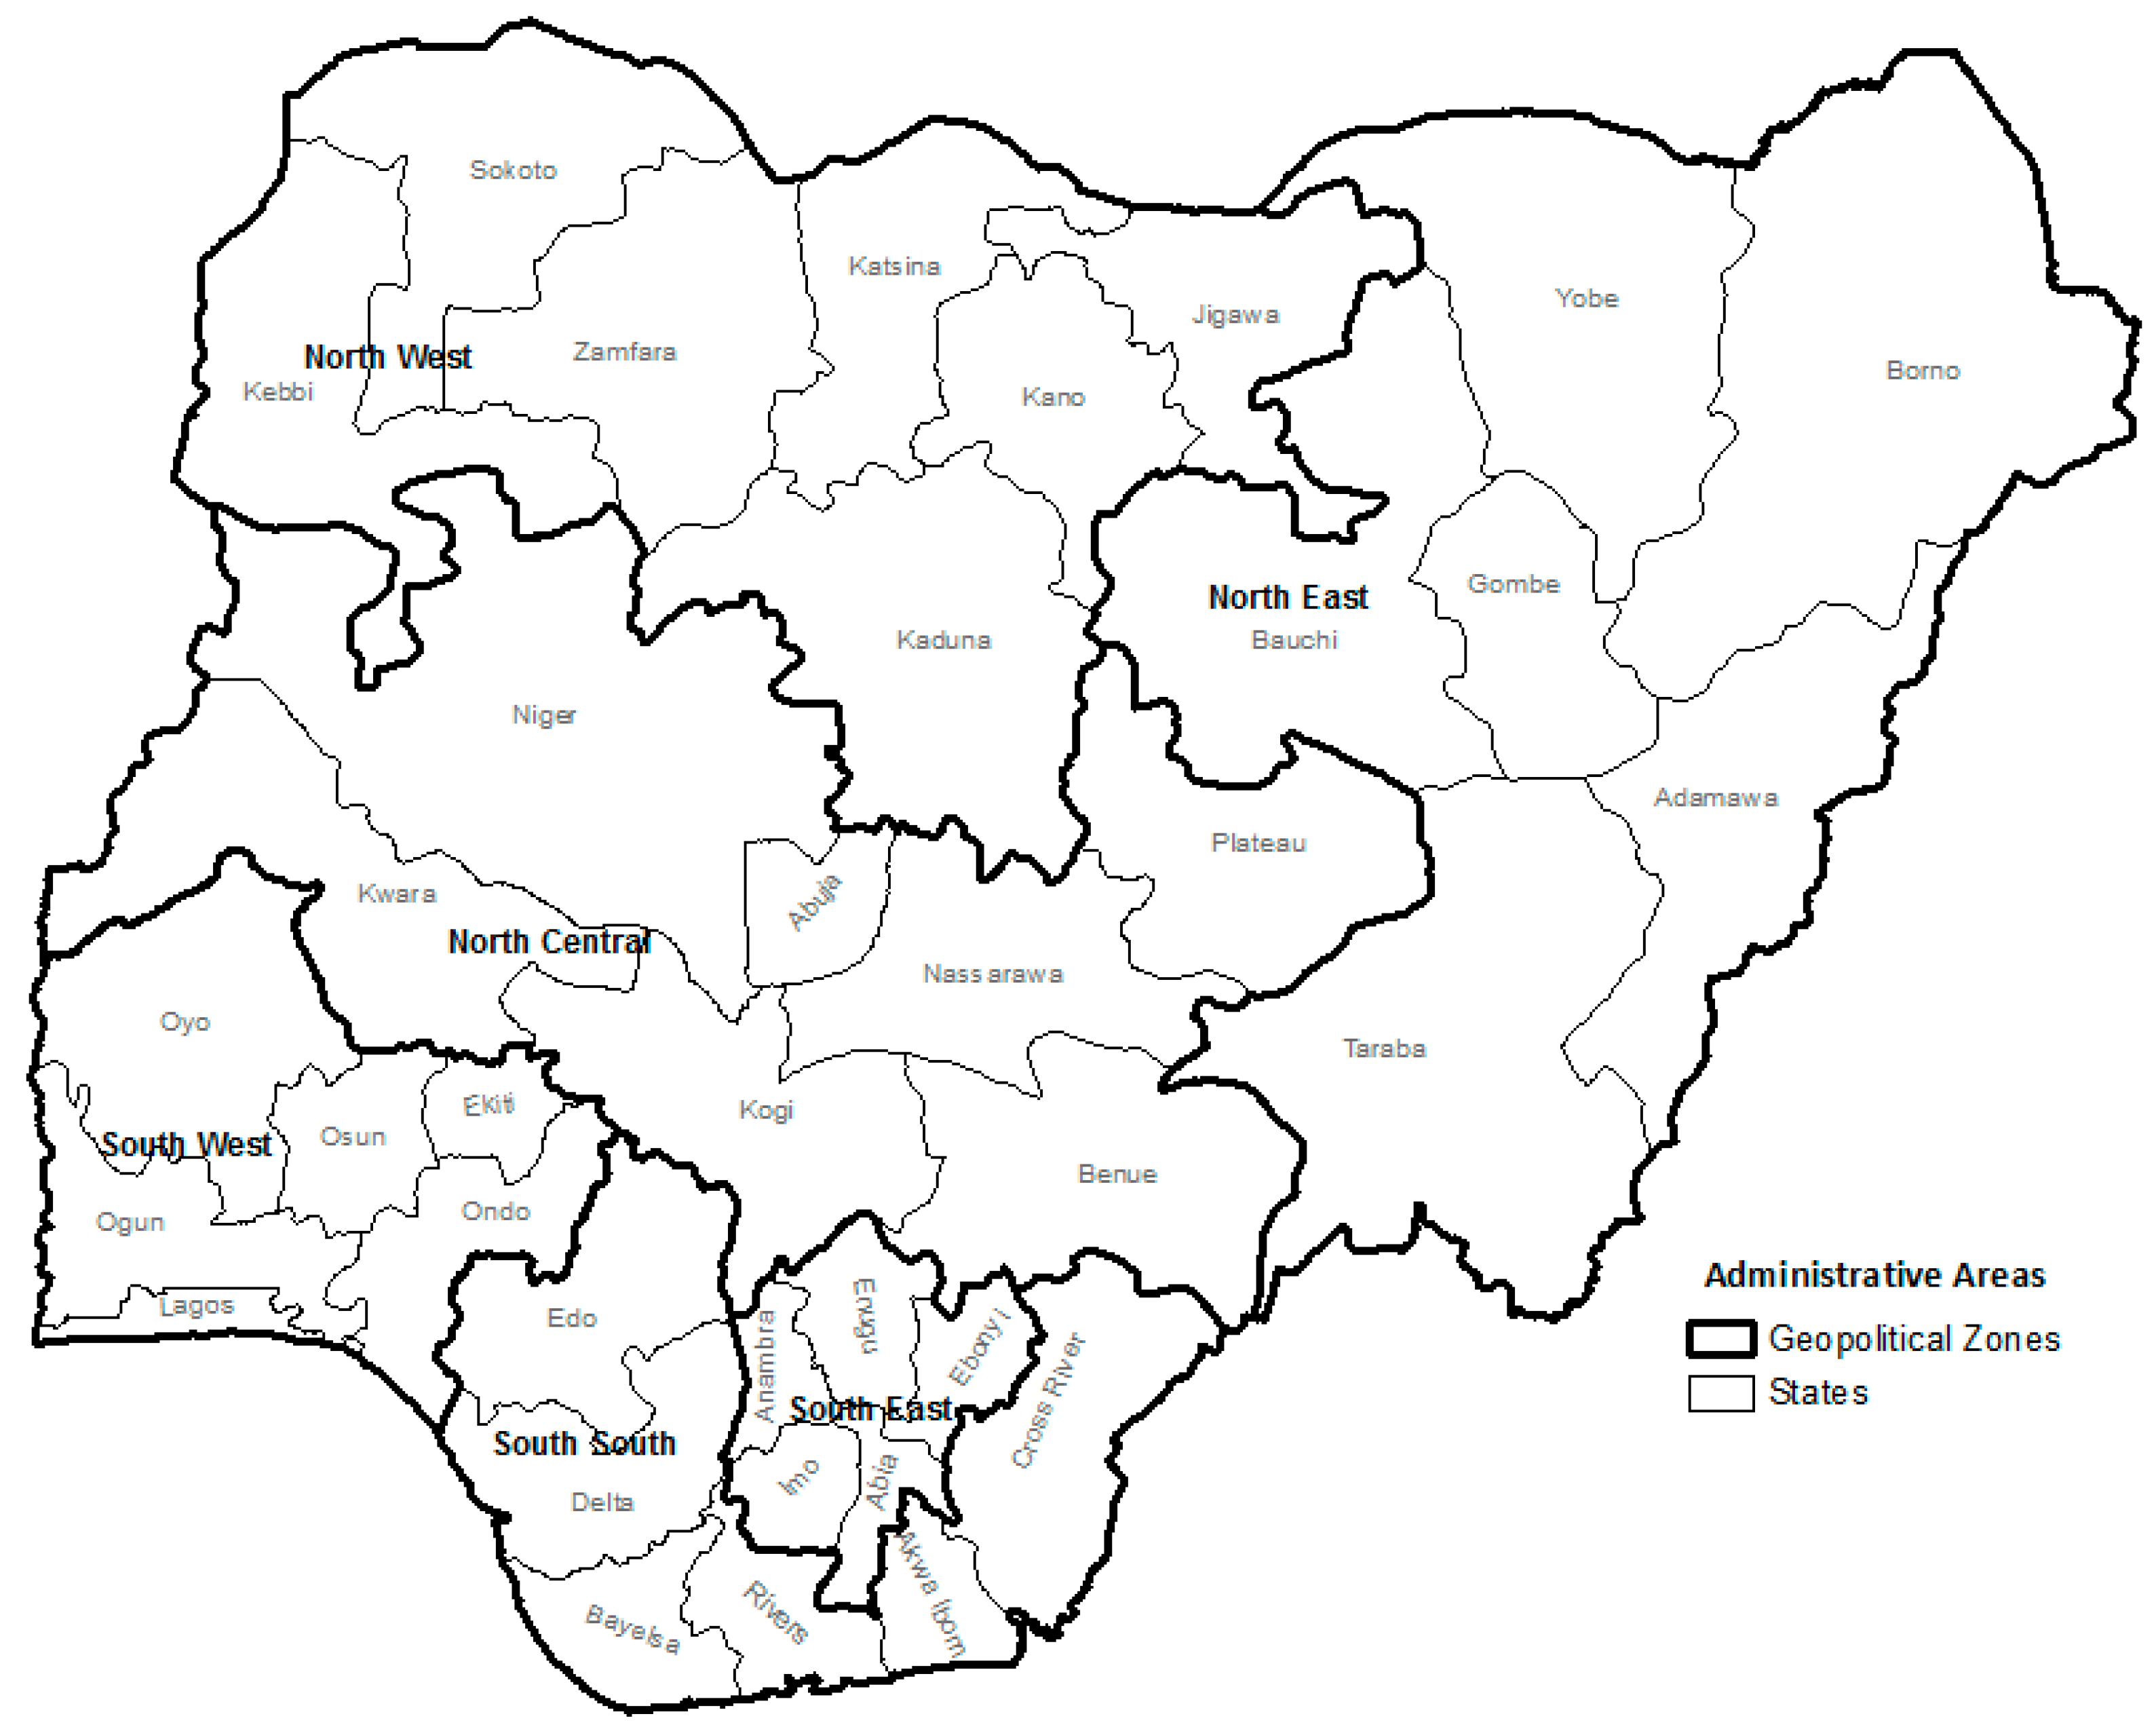
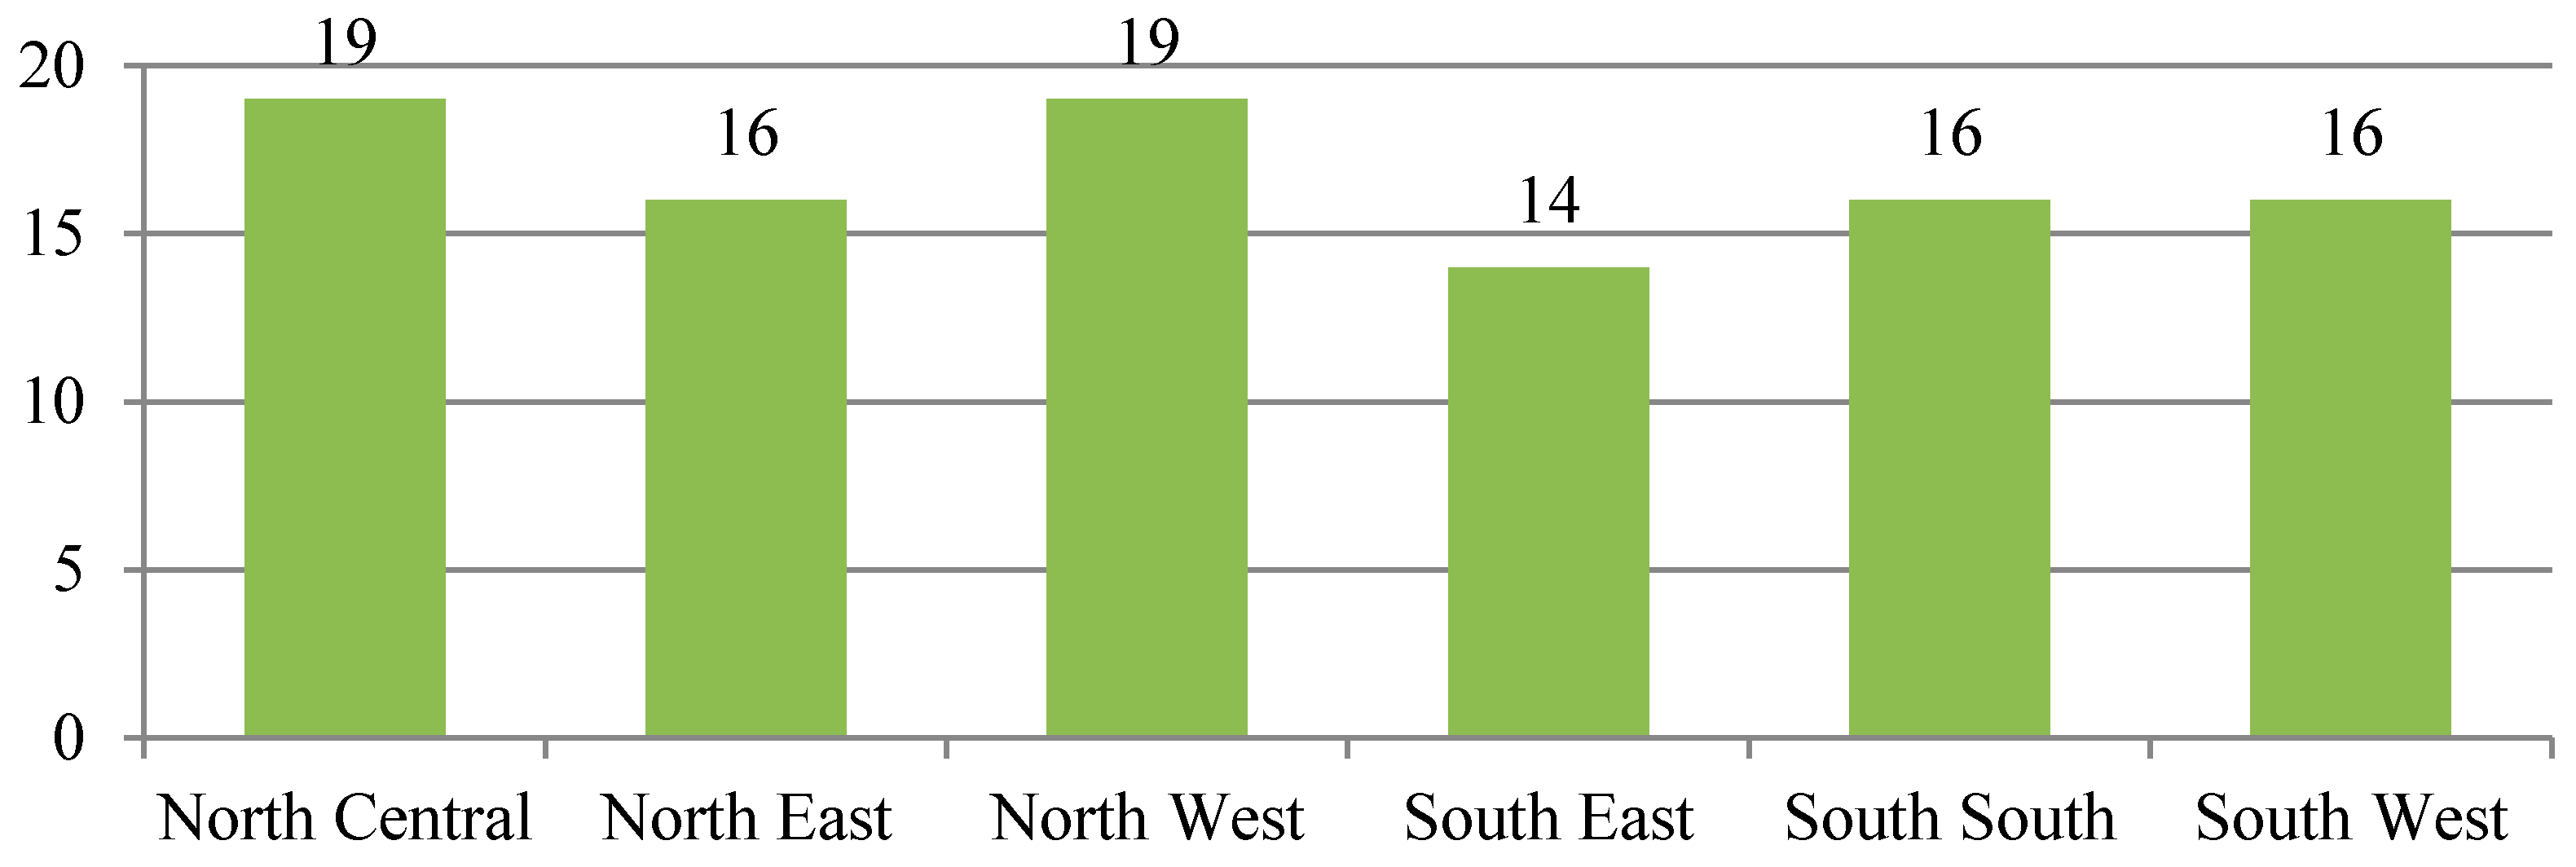
Figure 1 shows the spatial divisions of Nigeria’s key administrative areas. As illustrated in Figure 2, the proportional representation of the CIQI cities across the six geopolitical zones is fairly balanced. This helps to capture regional dynamics of city infrastructure quality across the entire country.
3.4. Preliminary Indicators
A total of 21 indicators were initially considered for the development of the CIQI. In the fields of quantitative social science and urban analytics, indirect or proxy indicators are used where direct measures are not feasible. Table 2, Table 3, Table 4 and Table 5 show the proxy indicators from the World Bank’s Enterprise Survey that were used together with their description or method of computation [28].
Data availability can also be limiting factor that imposes the choice of proxy indicators. To the best of our knowledge, there is no consensus in academic literature on the specific validated list of indicators that should be used to construct infrastructure quality indices. Different scholars have combined different indicators to suit the purpose of the index which they have constructed [3,4,5]. For the CIQI, restricted availability of city-level data compelled us to utilise numerous proxy indicators to represent the initial list of indicators.
4. Statistical Modelling
As described in the previous section, a total of 21 indicators were initially considered for inclusion in the data fusion process. Analytical soundness of each indicator was tested using a series of statistical analysis. These are briefly discussed.
4.1. Multicollinearity
Multicollinearity is a situation where two or more variables are highly correlated [29]. Consideration was given to the relationships between the indicators. The Pearson’s coefficient of correlation was used as the statistic for examining the relationship between variables. Correlations can be positive (where the values of the pair of variables increases or decreases in the same direction) or negative (where the value of a variable while its related variable decreases). High correlations inform redundancy. Multicollinearity was also assessed by examining which indicators represent the principal dimensions of the original dataset. This task was achieved using Principal Components Analysis (PCA).
4.2. Likely Influence of Indicators on the CIQI
A usefulness of PCA as a data reduction technique is its ability to identify which variables are likely to power the data fusion process [30]. One of the outputs of the PCA analysis is a weights table also called a components loading matrix which is indicative of the power that each variable exerts. Typically, for a variable, the higher the value of this weight, the better its variance can be explained by the corresponding principal component and consequently the greater the power it is likely to exert on the cluster analysis [30].
4.3. Assessing Internal Consistency
When assessing internal consistency, the Cronbach Coefficient Alpha (c-alpha) is the most popular statistic that has been used [31,32,33]. It is used to evaluate how well a set of variables measure a single uni-dimensional object. The c-alpha appraises the quota of total inconsistency of the individual indicators due to the association of indicators. The c-alpha is equivalent to zero if individual variables are independent and no correlation exists. However, c-alpha is equal to one if the indicators are perfectly correlated.
4.4. Normalisation
For each policy area of CIQI, the aim was to construct a single summary measure which can be expressed in meaningful units and easily interpreted. The underlying metrics of the indicators are different which means it would be impossible to simply do a straight forward combination of these indicators. It is inappropriate to combine datasets that are measured in different scales because the resultant index will not be a true reflection of reality. Indicators measured on a scale with a large range will be given undue advantage as opposed to those measured on a smaller range [34]. The range standardisation was used to equalise the scale of measurement of different indicators.
where:
- = standardised value
- = original value of the indicator for a city
- = minimum value of the indicator within the distribution
- = maximum value of the indicator within the distribution
The range standardisation converts all values for each indicator into a range of 1 and 0. A value of 1 being the maximum and 0 being the minimum. Unlike other standardisation methods (z-score and inter-decile range), the range standardisation coped well with skewed indicators.
4.5. Weighting
Adding a weight to an indicator signifies the level of importance of that indicator to the index [35]. This is precisely why this process is subjective. What one researcher or policy maker considers important may not be important to another. Even when an indicator is considered important, the level of importance assigned to that indicator may vary from person to person.
Applying a weight to an indicator will ultimately influence the resultant output of the analysis [34]. Whilst weighting is not compulsory [36], one reason why weights were deployed in the creation of the CIQI was to compensate for the quality of the underlying statistical datasets available for analysis.
Factor analysis was to create the weights for the indicators prior to combining them into policy area scores. The underlying conjecture for the generation of weights with factor analysis is the assumption of the existence of latent constructs of the policy areas. The Maximum Likelihood technique was used because of its ability to help overcome problems associated with different levels of statistical accuracy [37]. The analysis generated weights for indicators in each domain. These were amalgamated to produce domain index scores for each of the 37 cities.
4.6. Creating the Overall CIQI
In order to create the overall CIQI, the domain index scores for the four policy areas had to be pooled together. If they were summed up, this would suggest that exert equal importance in the CIQI. However, some policy issues are considered more important in terms of their relevance to economic growth and development within an urban infrastructure framework. For this reasons, each policy domain was also weighted in terms of their perceived importance.
5. Data Reduction Procedure
A total of 21 indicators listed in Table 2, Table 3, Table 4 and Table 5 were originally considered for inclusion in the data fusion exercise. The suitability of these indicators was appraised in order to minimise the number of indicators if there was a compelling empirical evidence for such decision.
Table 6 shows the correlation matrix for the 21 indicators. The blue colours indicate high positive correlations while the red colours identify high negative correlations. Telecoms Penetration for instance was found to be positively correlated with Transport Availability while Authorised Housing was negatively correlated with Access to Land.
Indicators exhibiting a normal distribution are often most ideal for inclusion in this sort of analysis but this is often not the case with area-based infrastructure data. The Fisher-Pearson coefficient of skewness given in Equation (2) was used to evaluate the degree of skewness of each variable in the dataset [38,39].
where:
- = value of skew
- = mean of the distribution
- = standard deviation the distribution
- = number of data points
Positively skewed indicators are particularly undesirable. This was used as a key criterion in selecting or deselecting indicators for the creation of the final CIQI. Table 7 shows the skew values for the indicators with the largest positive skew.
Internal consistency and reliability are important for this analysis because, in their absence, it is impossible to have any validity associated with the composite scores which will be generated from the analysis. The Cronbach Coefficient Alpha (c-alpha) was used here to validate internal consistency. Basically, it helps us to determine if it is justifiable to interpret the scores that will be aggregated together. To interpret the c-alpha, we adapted a commonly accepted rule of thumb proposed by George and Mallery [39] for describing internal consistency. The results from the analysis yielded a high c-alpha value of 1.19 suggesting excellent internal consistency within the dataset.
Principal Components Analysis (PCA) was used to determine the indicators that may exert significant influence on the CIQI. Table 8 shows the loadings of the first principal component with indicators in descending order of level of influence on the CIQI. The analysis suggests that Telecoms Penetration would have the largest influence on the overall CIQI.
Deciding the final choice of indicators is an important and rigorous activity. Following extensive review of the analysis, the 21 preliminary indicators were reduced to 14. Results from statistical analysis were juxtaposed next to one another. Each indicator was assessed independently on the basis of its performance on each statistical metric. Additional expert judgement based on policy literature was also considered. The final list of indicators used to create the CIQI is listed in Table 9 with all four policy areas equitably represented.
6. Fusion of Final Indicators
It is improper to combine the fourteen selected indicators directly because they are measured on different scales. For instance, the Power Reliability indicator measures the average monthly power outages while the Access to Electricity indicator is the percentage share of business establishments for which electricity constitutes minimal or no obstacle to operations. Percentages cannot be directly combined with counts without standardisation. Prior to proceeding with the fusion of the indicators to create separate policy area scores and the final CIQI, the different scales of measurement of the indicators were standardised using a range standardisation method. The range standardisation helped to re-calibrate the values for each indicator within a range of 1 and 0. A value of 1 being the maximum and 0 being the minimum.
The natural exponential function [] was used to transform the standardised data ahead of factor analysis. The function helps to correct for the presence of high skew in the distribution by adjusting the data to conform as closely as possible to normality.
In order to create the baseline CIQI, the scores for the four policy areas were combined. Simply adding the scores together would be inappropriate as that would signify that each policy area has equal importance in the measurement of city infrastructure quality. Businesses consider some policy areas to be more important than others in terms of their influence to productivity in particular, and economic development and growth in general. For this reason, each policy area was weighted in accordance with their perceived importance. The overall CIQI was constructed by combining the policy area scores using weights constructed from the ranking of the top business environment obstacles for firms based on the 2014 Enterprise Survey. Businesses indicated that power presents the most pressing obstacle, followed by transport, land and ICT. Table 10 shows the weights allocated to each of the four policy domains and the fourteen indicators.
7. Results and Discussion
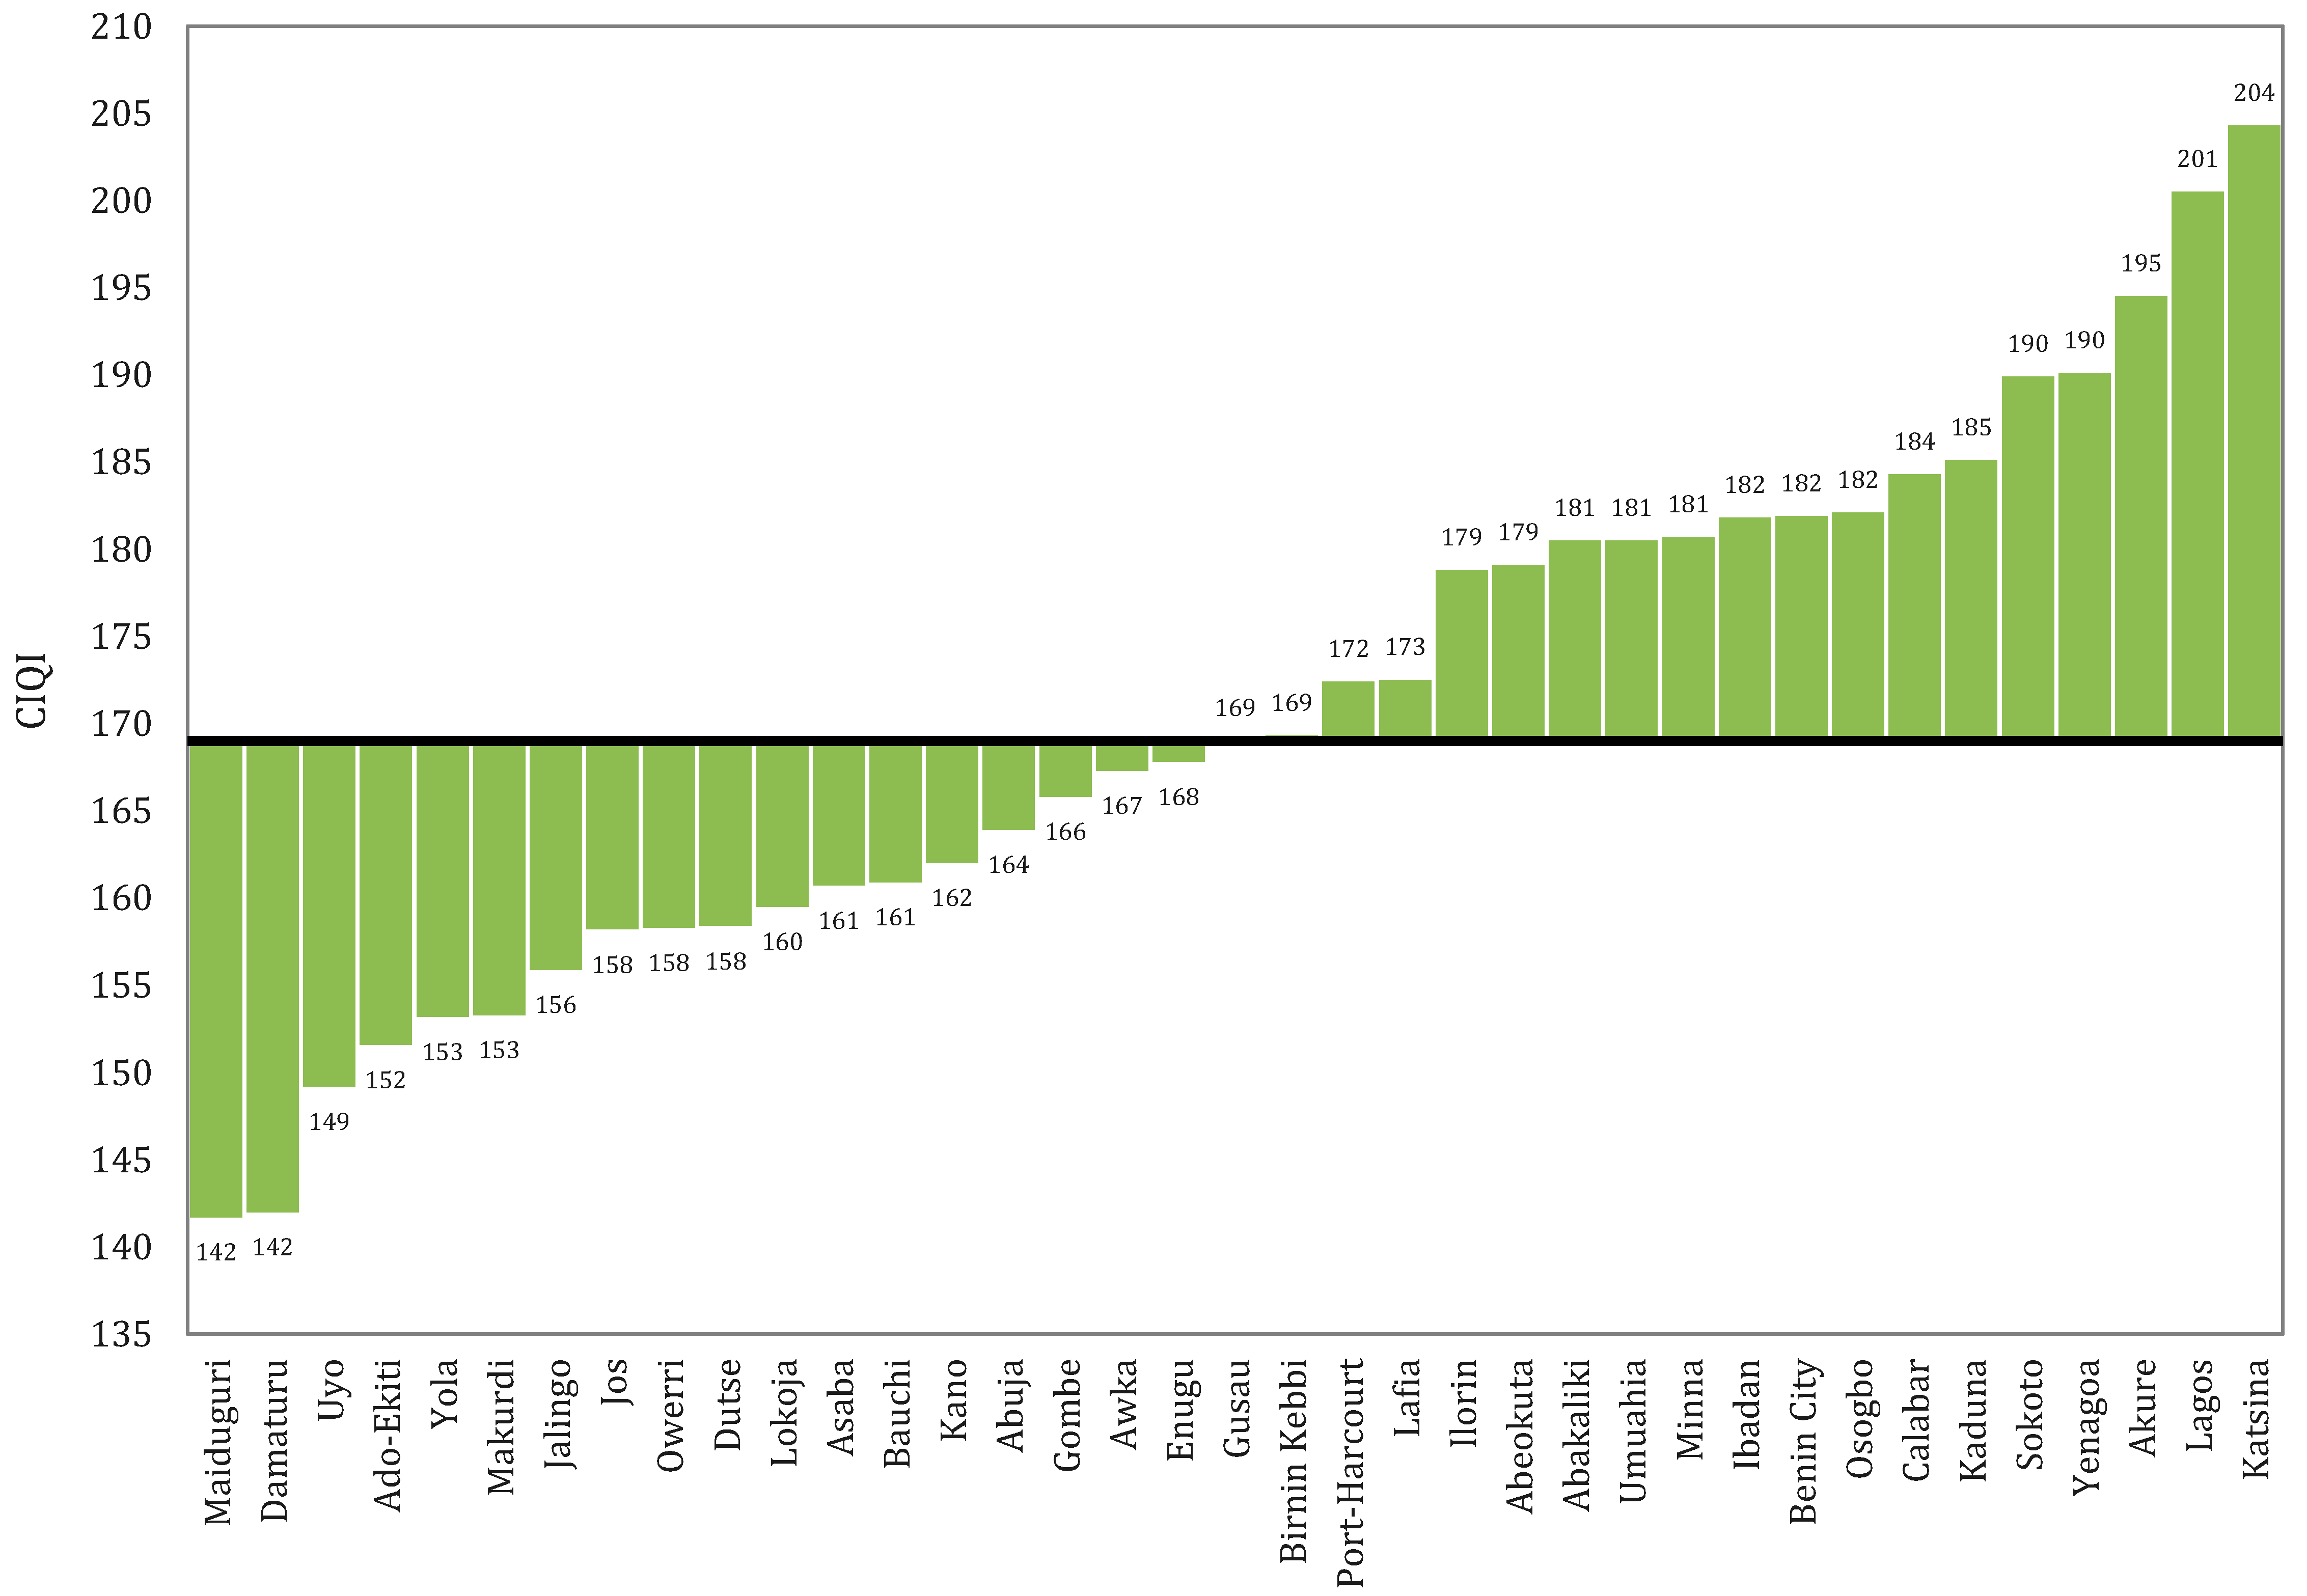
The CIQI is the amalgamated summation of the weighted and transformed policy area scores. It is important to note, however, that as a result of the exponential transformations, a city with a CIQI score of 200 does not necessarily translate into twice that with a score of 100. It is suggested that rankings should be utilised when making comparisons between cities. The baseline CIQI is ranked in the same manner as the policy area scores. The higher the value of the CIQI, the better the overall quality of city infrastructure.
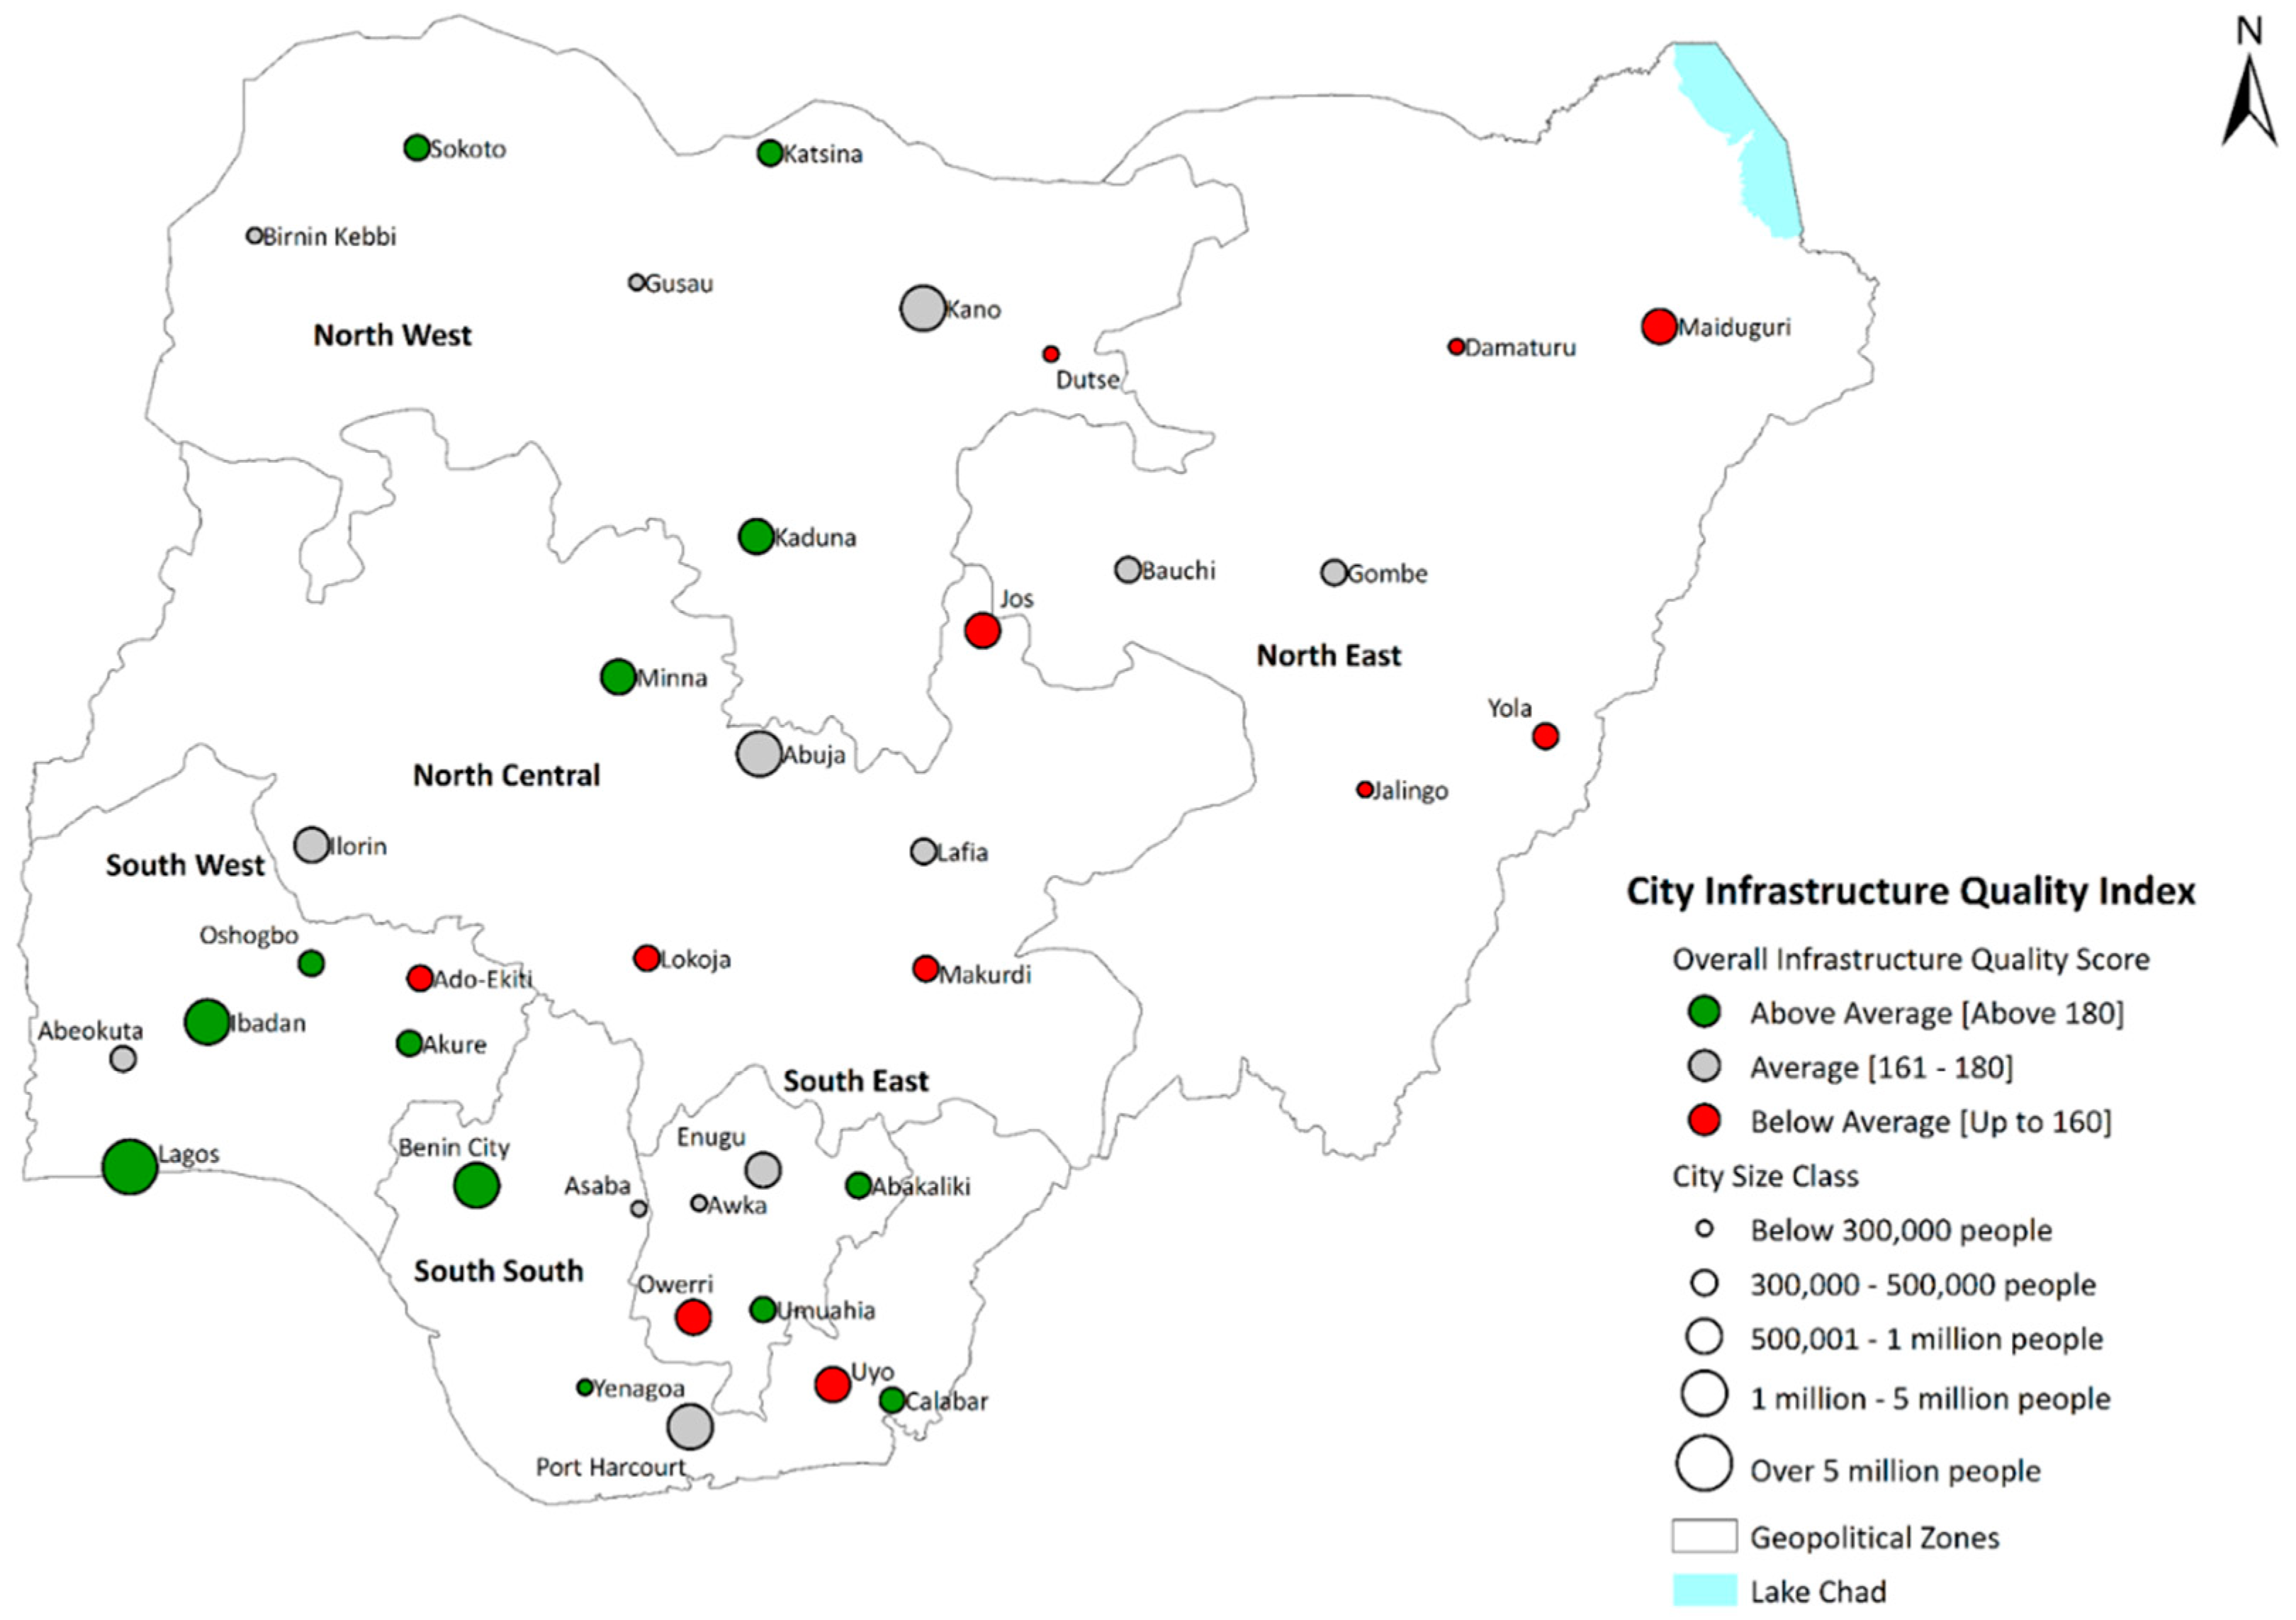
We use the median (169) to benchmark the distribution in Figure 3. The maximum value of the CIQI (204.3) is assigned to Katsina whilst the minimum (141.7) is assigned to Maiduguri. A spatial distribution of the cities by their CIQI score ranges and corresponding population class sizes is presented in Figure 4 whilst Figure 5, Figure 6, Figure 7 and Figure 8 show the spatial distribution of scores for each policy area.
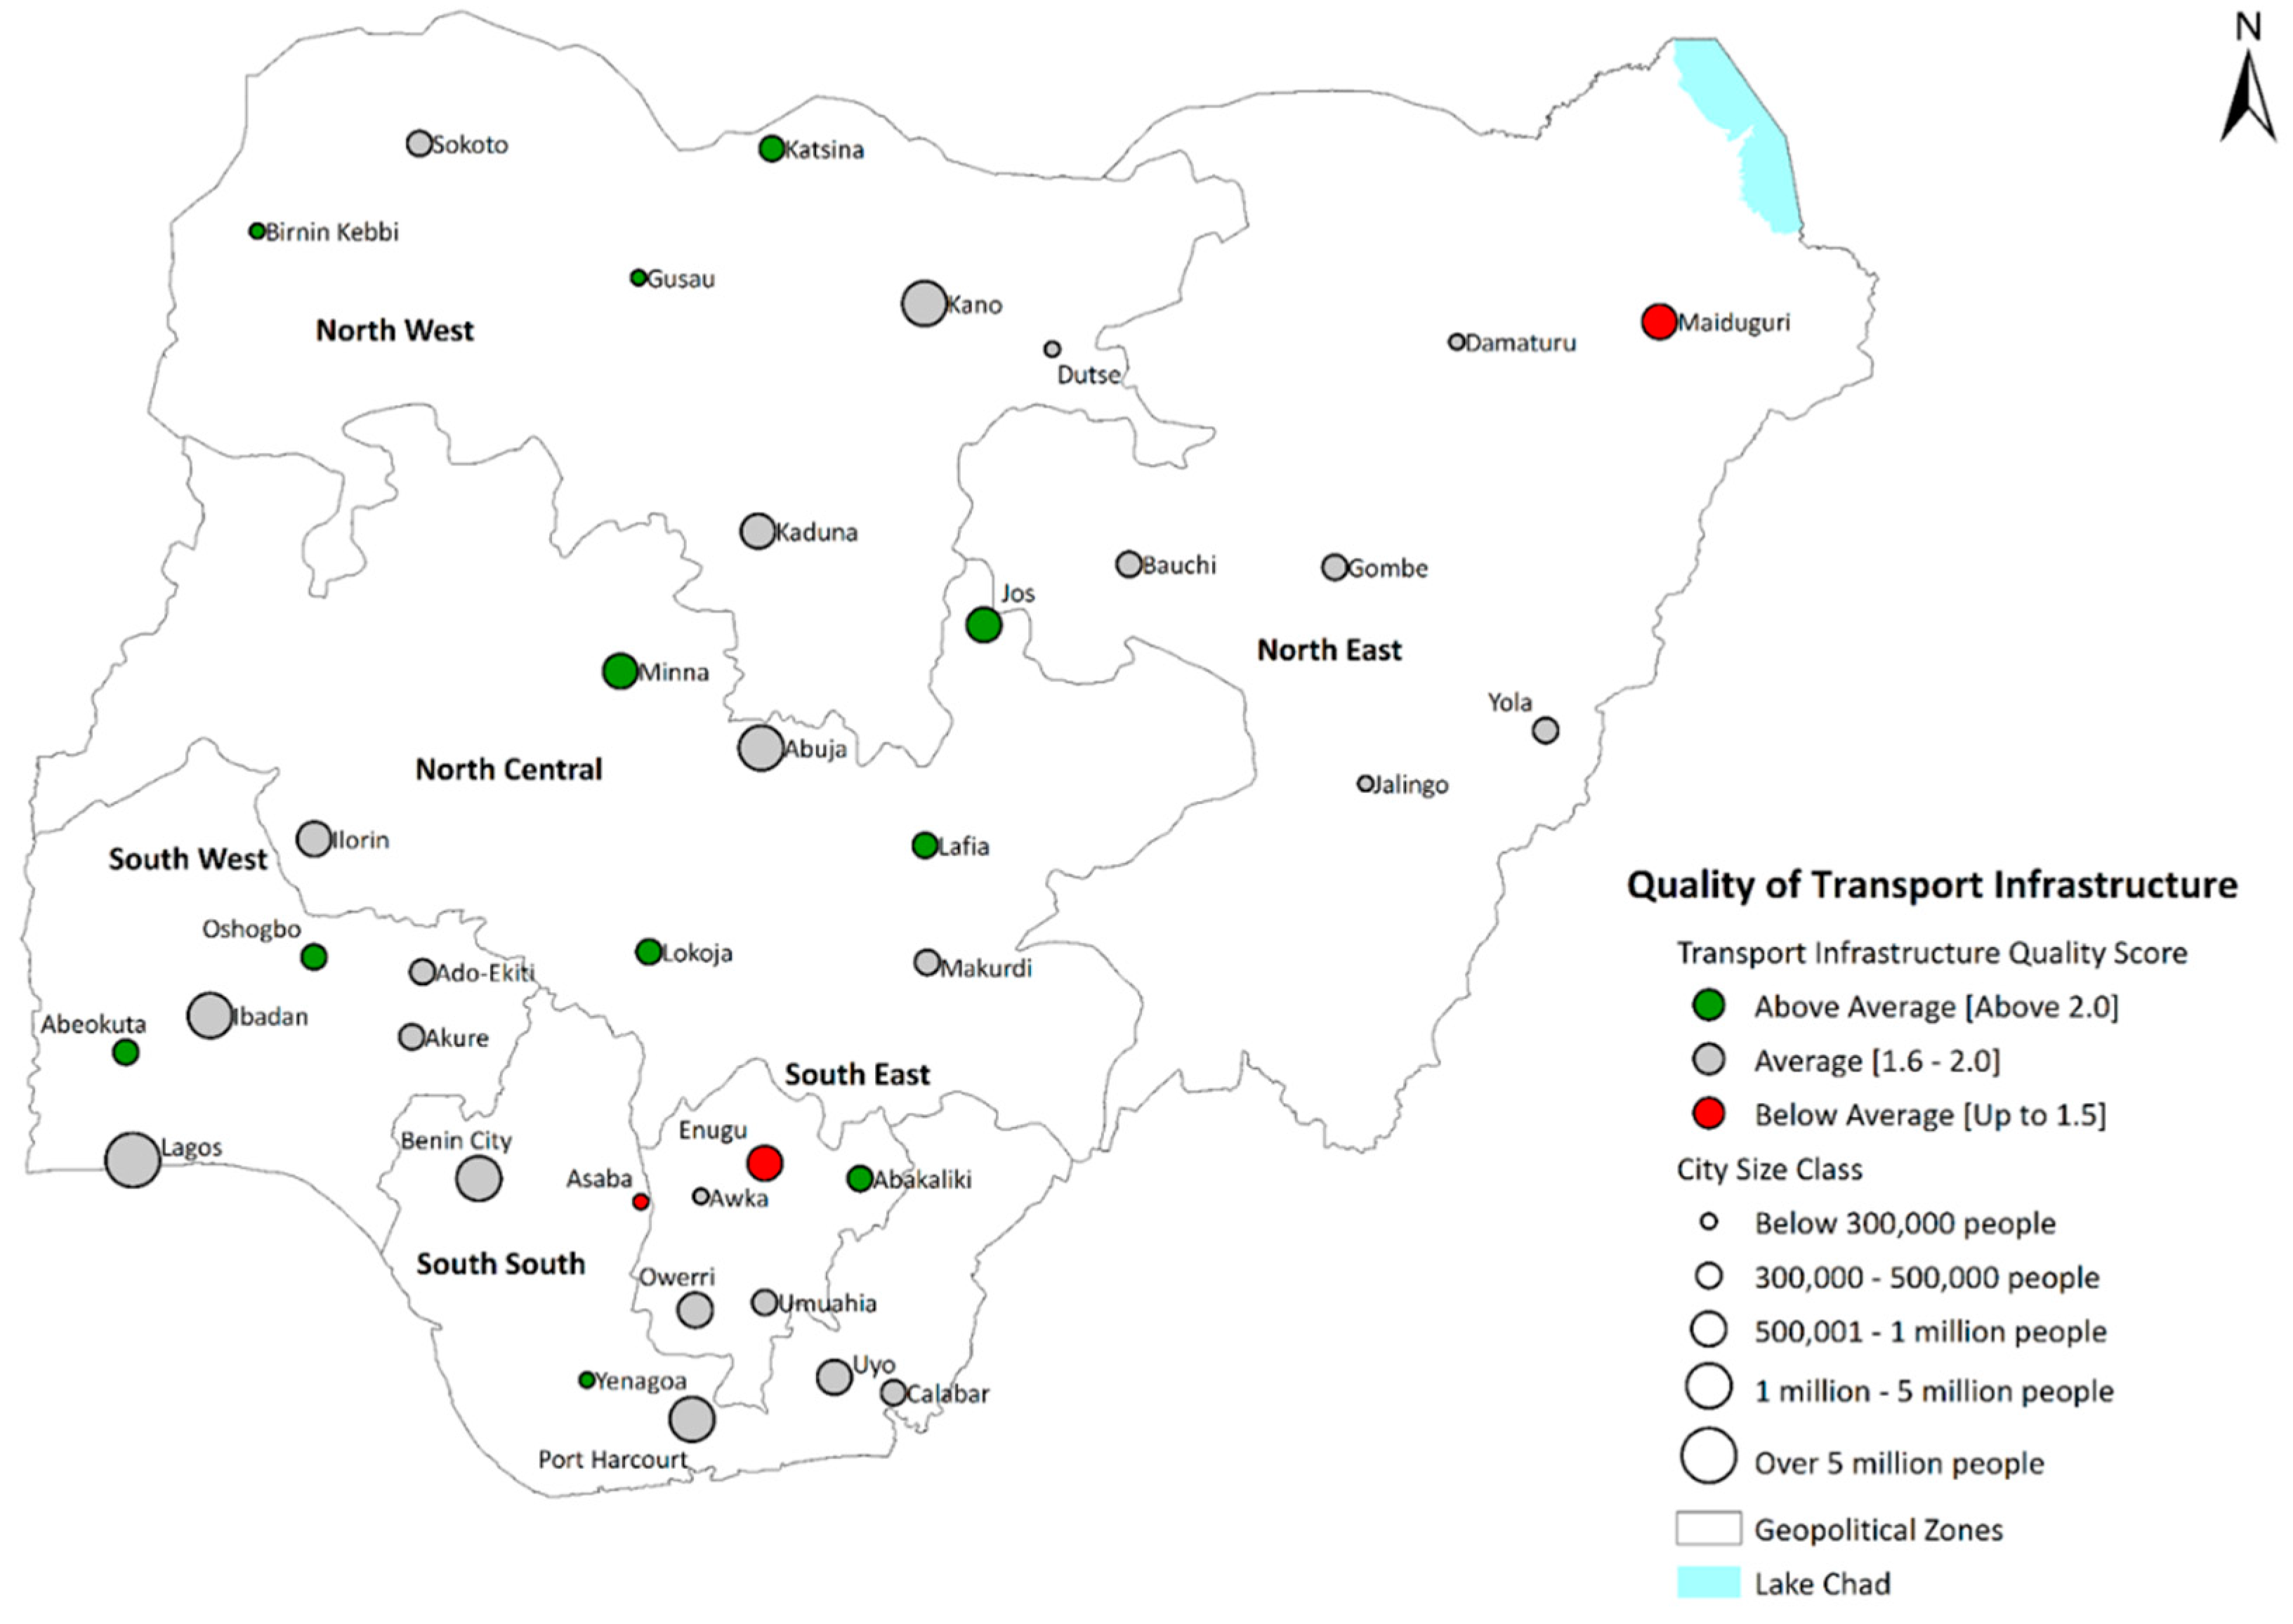
It is important to point out that the results are based on a relative measure of infrastructure quality. Eight cities make it to the top 20 percent of cities exhibiting above average quality transport infrastructure. These include Lafia (North Central), Lokoja (North Central), Yenagoa (South South), Katsina (North West), Birnin Kebbi (North West), Gusau (North West), Jos (North Central), and Abakaliki (South East).
Cities that belong to the bottom 20 percent are characterised by below average quality transport infrastructure. The cities in this category include Enugu (South East), Asaba (South South), Maiduguri (North East), Ado-Ekiti (South West), Lafia (North Central), Calabar (South South), Jalingo (North East), and Owerri (South East). Enugu and Asaba are rated below average partly because of lower use of multi-modal transportation by businesses. For Maiduguri, Calabar, Jalingo, and Owerri, the key problem is travel time whilst in Ado-Ekiti business enterprises seem to grapple with the problem of transport availability.
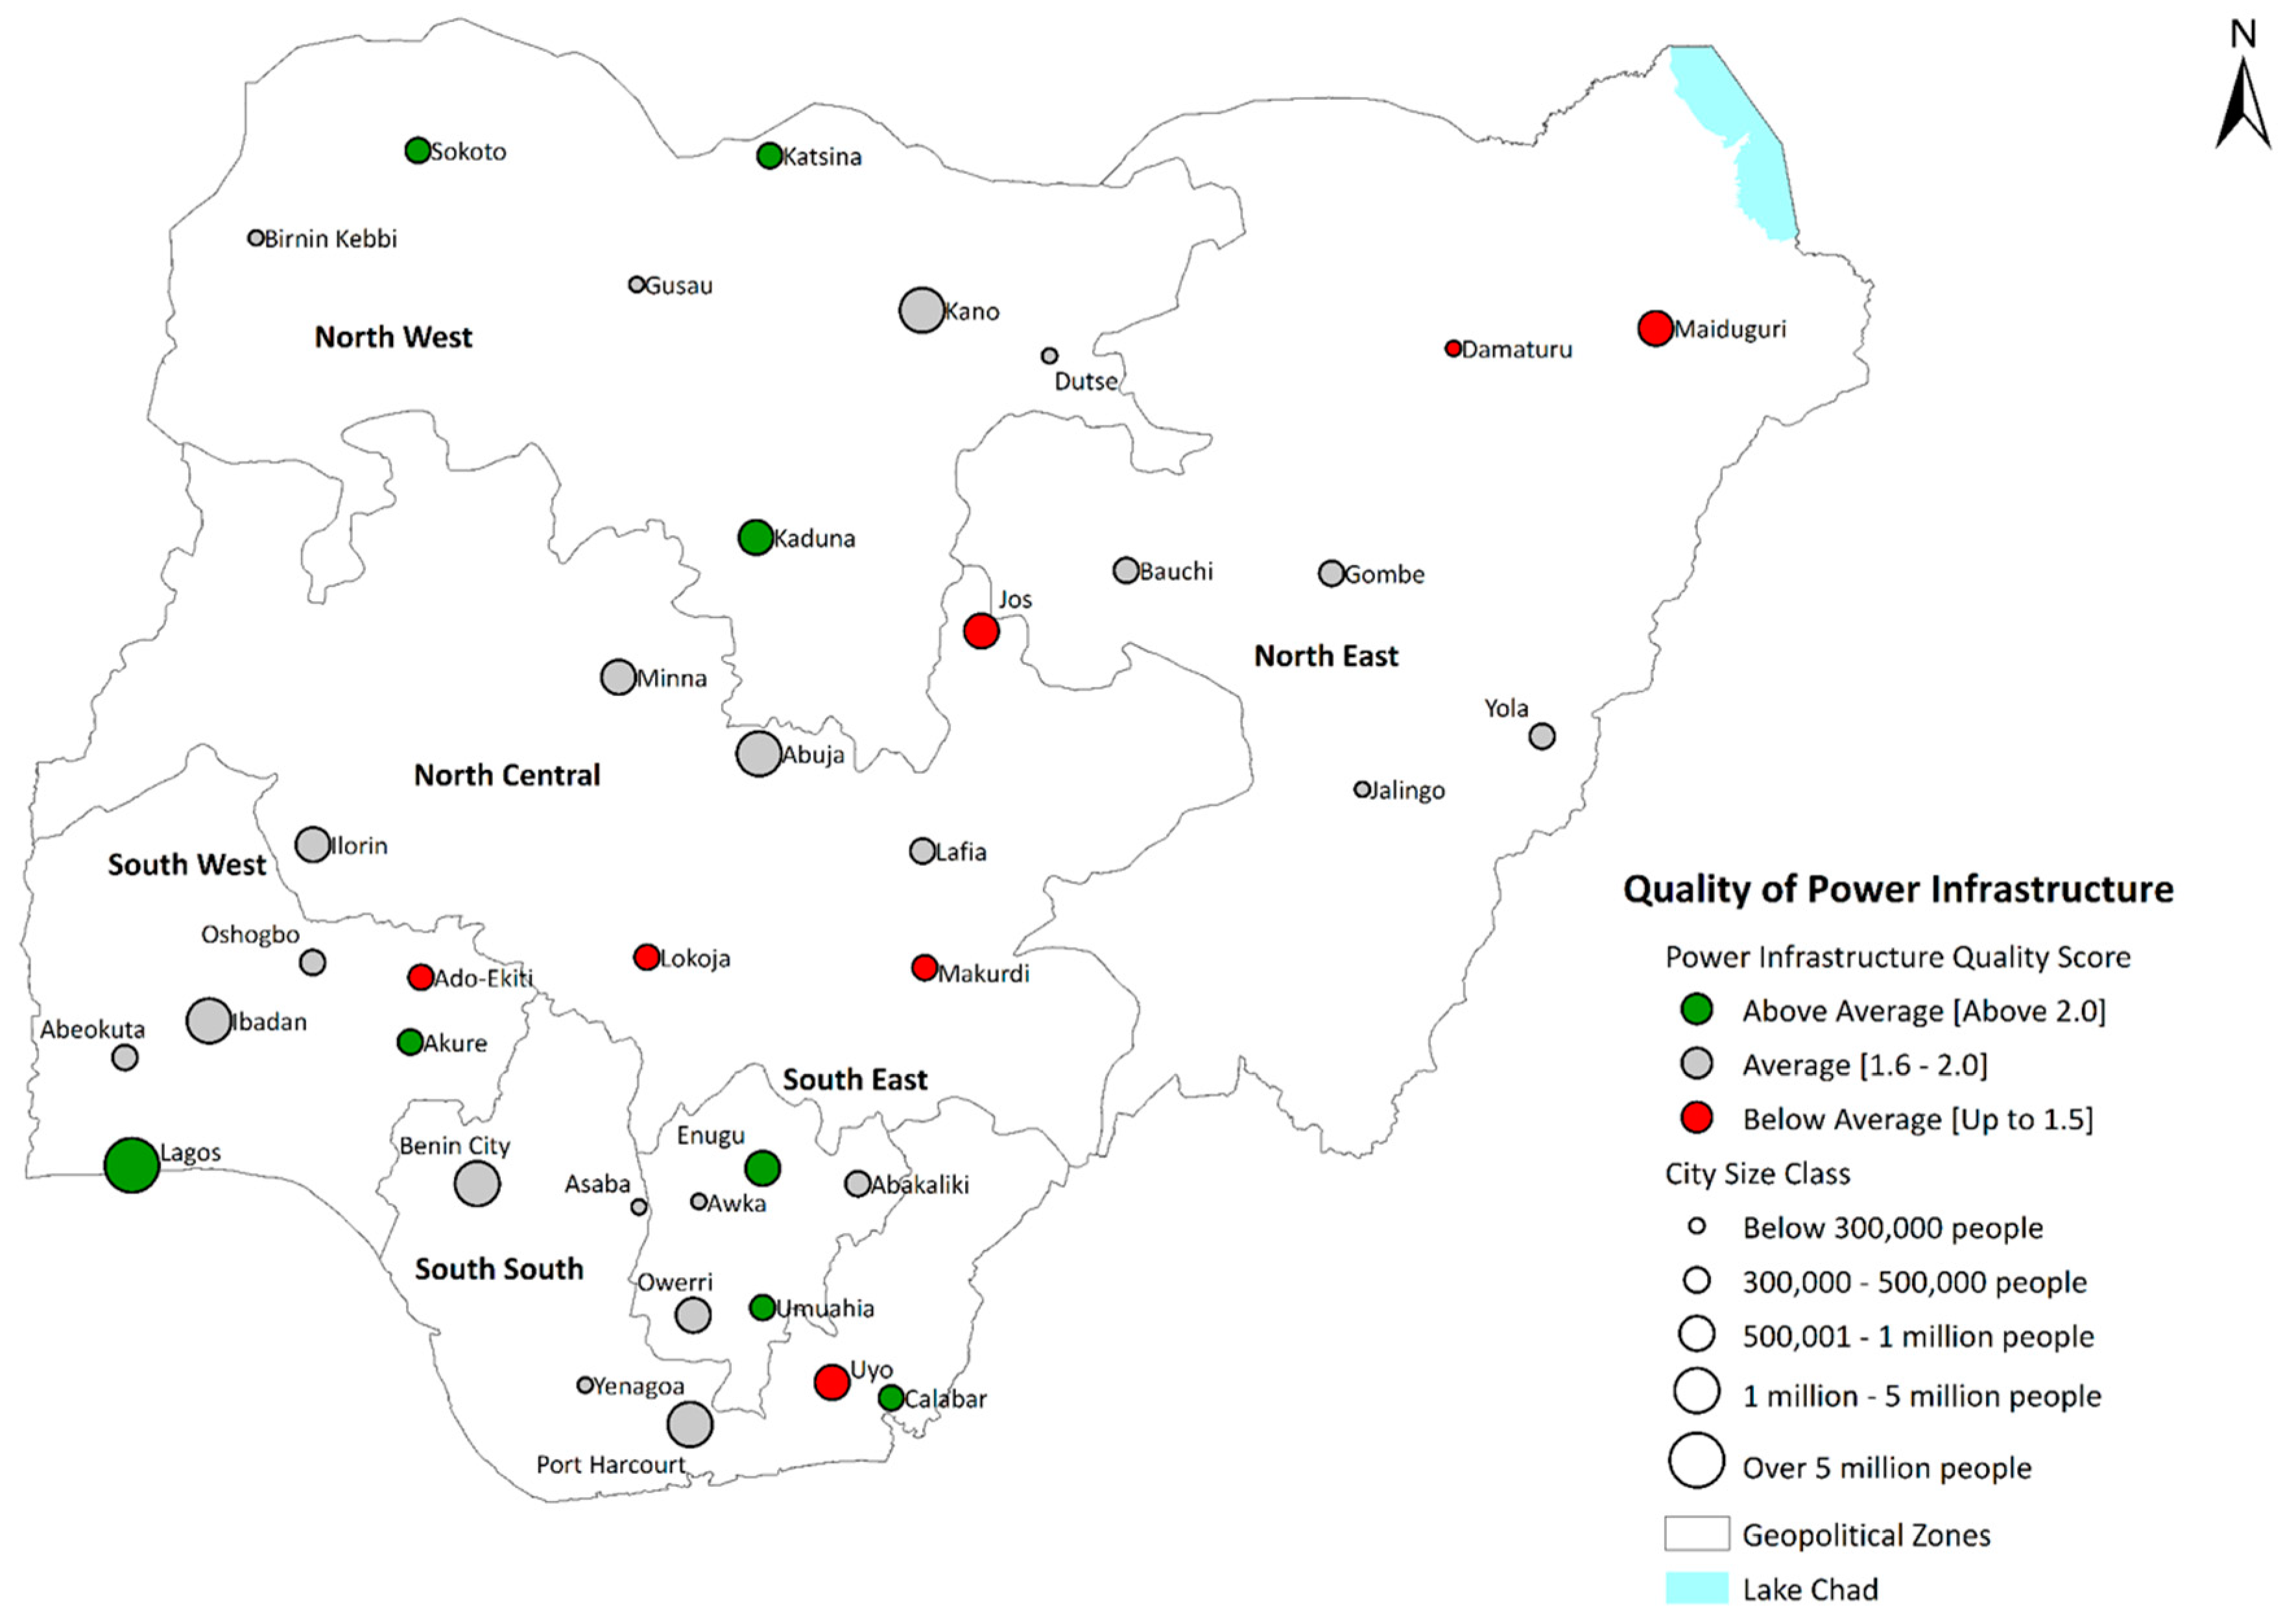
Analysis of the top 20 percent cities exhibiting relatively higher quality power infrastructure was conducted. A total of eight cities belong to this category. They include Lagos (South West), Katsina (North West), Akure (South West), Umuahia (South East), Calabar (South South), Kaduna (North West), Enugu (South East), and Sokoto (North West). Conversely, the bottom 20 percent of cities with the lowest power quality score include Lokoja (North Central), Jos (North Central), Damaturu (North East), Maiduguri (North East), Uyo (South South), Ado-Ekiti (South West), Makurdi (North Central), and Asaba (South South). With the exception of Asaba, all the other low scoring cities are severely impacted by unreliable power supply. For Asaba, the main factor contributing to its low score was the low rate at which businesses secured connectivity to the electricity grid within the statutory period of one week.
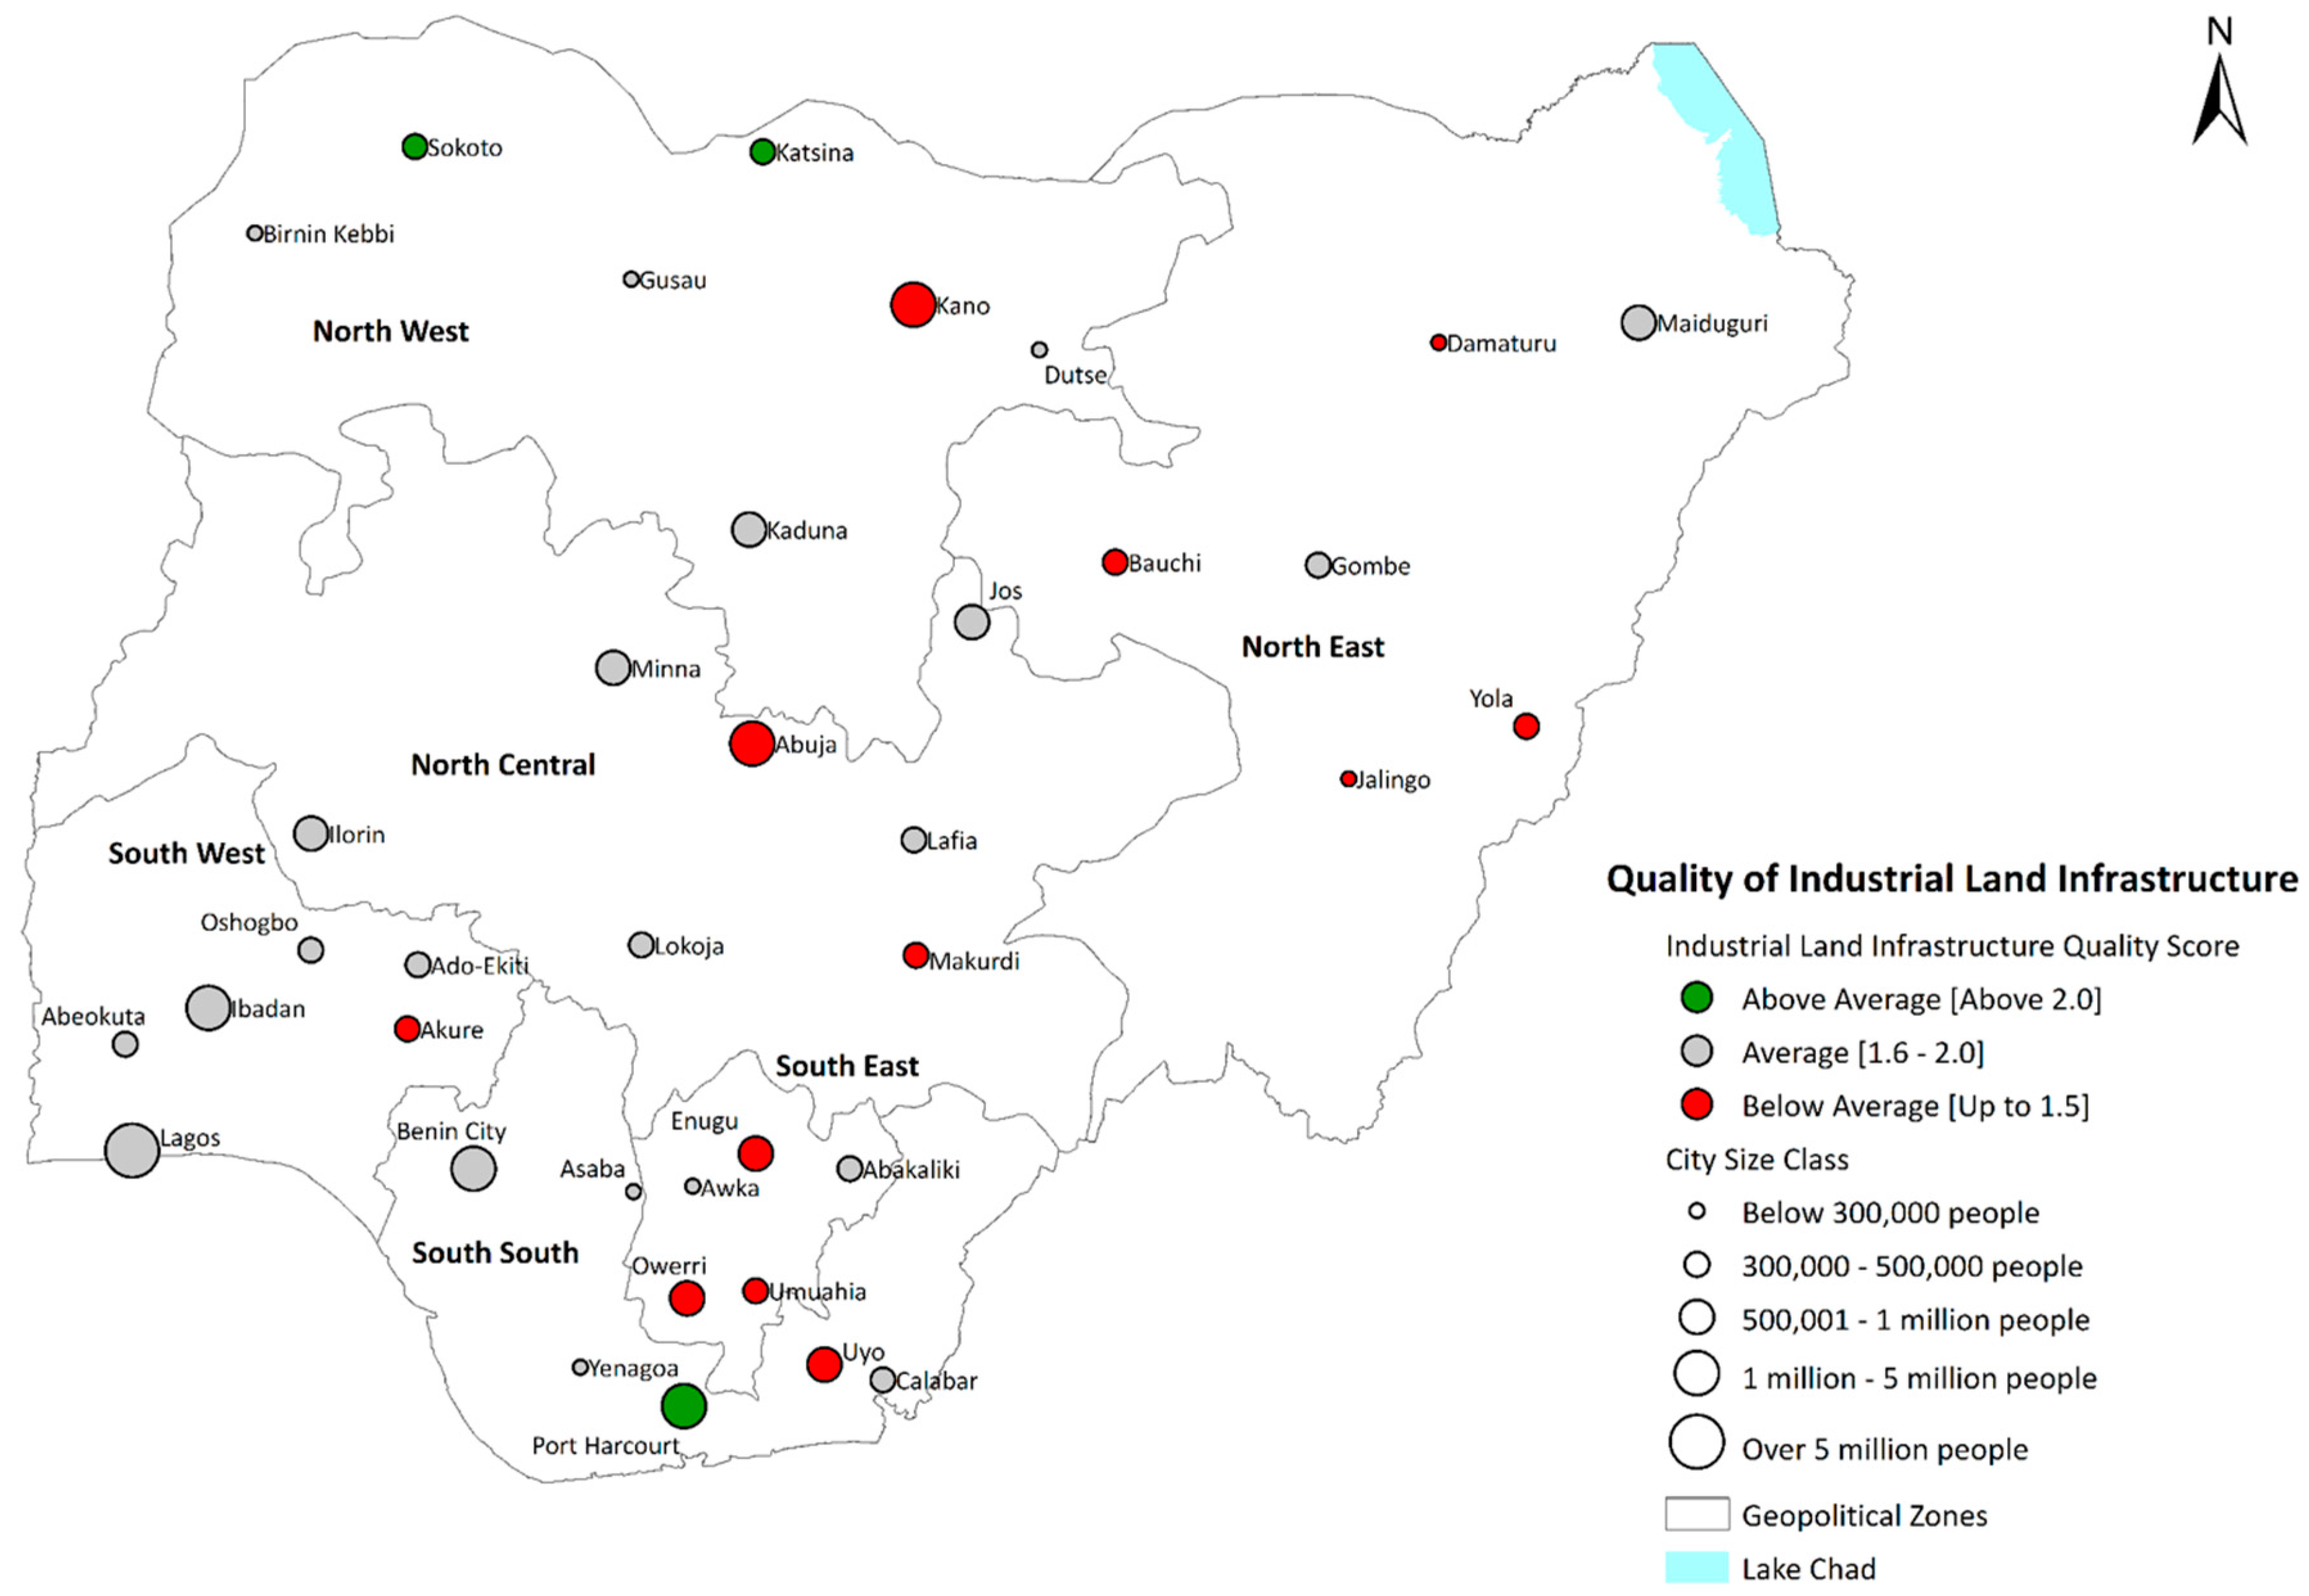
Eight cities make it to the top 20 percent of cities exhibiting relatively high quality of industrial land. The cities include Sokoto (North West), Katsina (North West), Port-Harcourt (South South), Asaba (South South), Ado-Ekiti (South West), Gombe (North East), Ibadan (South West), and Lokoja (North Central). A similar analysis was conducted to determine the cities that belong to the bottom 20 percent. The cities with the lowest quality scores for industrial land infrastructure include Yola (North East), Abuja (North Central), Makurdi (North Central), Umuahia (South East), Jalingo (North East), Bauchi (North East), Kano (North West), and Uyo (South South). One of the reasons why Yola is rated low is because of the disproportionately low numbers of business establishments for which land accessibility constitutes minimal obstacle to operations. In Abuja, Umuahia, and Uyo, disputed land ownership is the main factor inhibiting business growth and expansion. For the other low scoring cities (Makurdi, Jalingo, Bauchi, and Kano), the drawback factor is the difficulty in accessing government land.
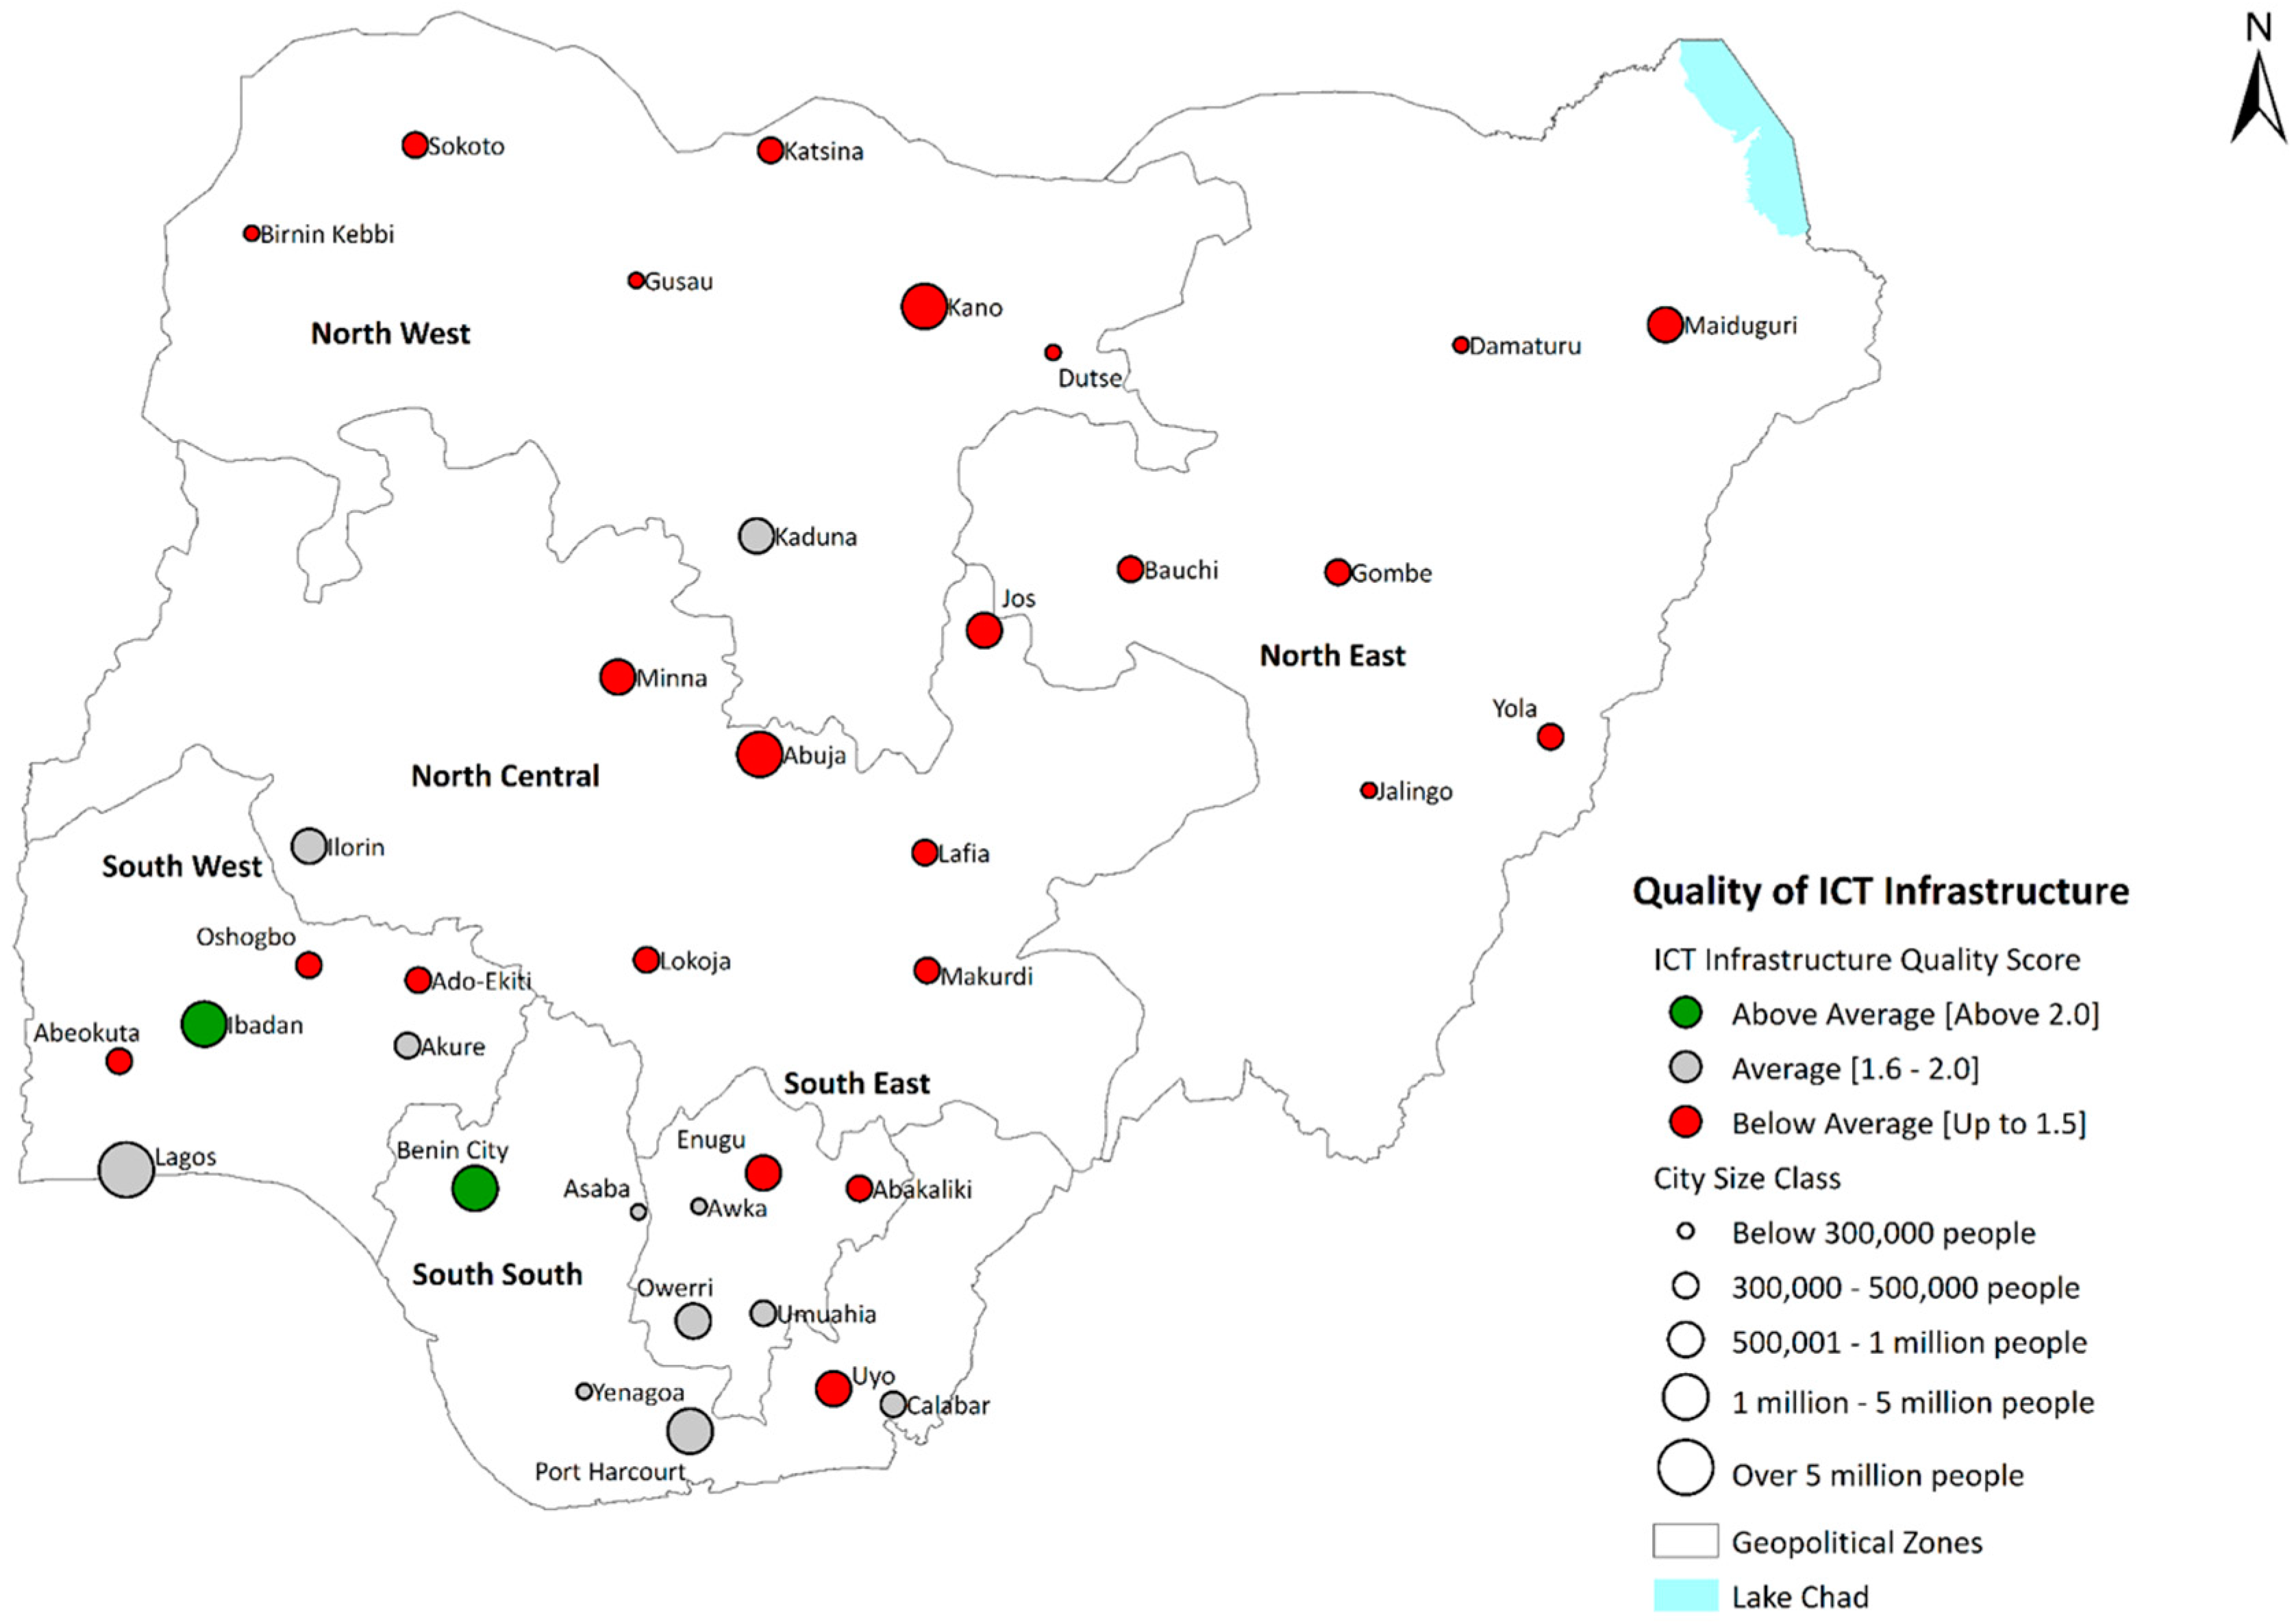
Eight cities are included in the top 20 percent of cities exhibiting relatively high quality ICT infrastructure. They include Ibadan (South West), Benin City (South South), Lagos (South West), Akure (South West), Ilorin (North Central), Awka (South East), Calabar (South South), and Umuahia (South East). A similar analysis was conducted to determine the cities that belong to the bottom 20 percent. The eight cities with the lowest ICT quality score are Birnin Kebbi (North West), Damaturu (North East), Lafia (North Central), Dutse (North West), Lokoja (North Central), Ado-Ekiti (South West), Katsina (North West), and Yola (North East). Figure 7 shows the spatial distribution of the cities by their ICT policy area score and corresponding population class sizes. The map shows an apparent north-south divide. Relatively higher quality of ICT infrastructure appears to favour cities in southern Nigeria. Comparatively lower telecoms penetration is main driver of low ICT quality for five of the lowest scoring cities (Birnin Kebbi, Damaturu, Lafia, Dutse, and Lokoja). For the other three cities the level of internet use amongst business establishments is comparatively lower and it accounts for a relatively low ICT score.
8. Conclusions
This research allowed the piloting of the CIQI for Nigeria, and the drawing of valuable lessons which may also have relevance for other developing country urban contexts.
In particular, we demonstrated that the application of multivariate data analysis can be helpful in understanding and interpreting the dynamics of the quality and coverage of urban infrastructure. We have shown that city level relative diversity in the quality of infrastructure exists within and between the six geopolitical regions of Nigeria. An interesting finding from this preliminary analysis is the influence that the quality and extent of industrial land (and transport to some extent) is having on the overall CIQI, and particularly the positive impact this has had on the overall performance of cities in the North West of Nigeria, which rank higher than would have been anticipated. On the contrary, the influence of industrial land on the overall CIQI has had a negative impact to the performance of several cities in the southern and central parts of the country, including Lagos and Abuja.
However, we note a number of limitations and weaknesses in the analysis. First, we acknowledge that much of the indicators used are proxy indicators due to some deficiency in data availability. That said, there are volumes of data that are largely under-utilised in Nigeria. For piloting CIQI, consideration was given to existing data sources (such as the World Bank’s Enterprise Survey), as this seemed to be more appropriate, feasible and certainly cost-effective.
We also recognise that for some of the policy areas (notably transport and industrial land) there are very few available indicators in the World Bank’s Enterprise Survey. It would be useful if future editions of this survey considered including more questions related to transportation and industrial land and their effects on business enterprises, given their important contributions to productivity as demonstrated by academic and policy literature alike.
Insufficiency in the number of input indicators means there is scope for the integration of multiple datasets. Future analysis could consider bringing together multiple surveys to generate the CIQI. In addition, where possible, informal but validated crowd-sourced data could be considered when trying to fill in data gaps. It is our experience that such datasets also tend to be under-utilised in urban research. This could obviously present complex methodological challenges. However, we believe these challenges could be overcome. Advancements in data management, statistical analysis and retrieval techniques have expanded opportunities for researchers to undertake novel inter-disciplinary research using the datasets available.
The research, policy, and programming relevance and significance of CIQI is three-fold. Firstly, it provides a coherent set of methods and tools for measuring the performance of service and infrastructure quality and extent in Nigerian cities. This includes the CIQI structure and corresponding indicators that are intended to provide a useful analytical framework, the identification and design of innovative and cost-effective methodologies for utilising formal data sources (official statistics) in data-scarce environments like Nigeria, and the development of data visualisation tools utilising Geographic Information System (GIS) for effective communications of spatial information and data on infrastructure.
Secondly, it provides a source of data and information for Nigeria’s development partners, researchers and interested practitioners, as well as non-government and private sector stakeholders, as it intends to provide useful data and information that can be utilised for performing evidence-based analyses on urban infrastructure in cities. This can be enhanced by also looking at the relationship between infrastructure and economic growth and development, through comparing the CIQI results to other economic indicators (such as subnational GDP output) to identify key trends and relationships.
Lastly, CIQI can be used to bolster government and citizen awareness and support at the local, state, and national levels for identifying and establishing priorities in relation to the provision of urban infrastructure and services, and specifically on factors and resources for economic growth and sustainable development [38,40].
Author Contributions
Conceptualization, N.P. and A.O.; Methodology, A.O.; Software, A.O.; Validation, N.P.; Formal Analysis, A.O. and S.I.; Investigation, A.O., and S.I.; Resources, N.P.; Data Curation, A.O.; Writing—Original Draft Preparation, A.O., N.P., and S.I.; Writing—Review & Editing, A.O., N.P.; Visualization, A.O.; Supervision, N.P. and A.O.; Project Administration, N.P.; Funding Acquisition, N.P.
Funding
United Kingdom Department for International Development: PO 6091.
Acknowledgments
This research is part of the Urbanisation Research Nigeria (URN) initiative, a five year (2013-18) United Kingdom Department for International Development (DFID)-funded research programme being implemented by a consortium of Nigerian and UK universities and consultancies. The concept of CIQI originates from the second phase of the Nigerian Infrastructure Advisory Facility (NIAF II), a DFID-funded technical assistance programme that aims to address infrastructure obstacles to economic growth and poverty reduction.
Conflicts of Interest
There is no conflict of interest to declare.
References
- Leff, S.; Petersen, B. Beyond the Scorecard: Understanding the Global City Rankings; The Chicago Council on Global Affairs: Chicago, IL, USA, 2015. [Google Scholar]
- Moonen, T.; Clark, G. The Business of Cities 2013; Jones Lang LaSalle Inc.: London, UK, 2013. [Google Scholar]
- Hoornweg, D.; Nuñez, F.R.; Freire, M.; Palugyai, N.; Villaveces, M.; Herrera, E.W. City Indicators: Now to Nanjing. In Proceedings of the Third World Urban Forum, Vancouver, BC, Canada, 19–23 June 2006. [Google Scholar]
- Westfall, M.; De Villa, V. Urban Indicators for Managing Cities; Asian Development Bank: Manila, Philippines, 2001. [Google Scholar]
- Bhada, P.; Hoornweg, D. The Global City Indicators Programme: A More Credible Voice for Cities. Directions in Urban Development; World Bank: Washington, DC, USA, 2009. [Google Scholar]
- Adenikinju, A. Electric infrastructure failures in Nigeria: A survey-based analysis of the costs and adjustment responses. Energy Policy 2003, 31, 1519–1530. [Google Scholar] [CrossRef]
- Foster, V.; Pushak, N. Nigeria’s Infrastructure: A Continental Perspective; World Bank Policy Research Working Paper 5686; World Bank: Washington, DC, USA, 2011. [Google Scholar]
- OECD. Promoting Pro-Poor Growth: Infrastructure; Organisation for Economic Co-Operation and Development: Paris, France, 2006.
- Prasad, G. Improving access to energy in Sub-Saharan Africa. Curr. Opin. Energy Syst. 2011, 3, 248–253. [Google Scholar] [CrossRef]
- Ogunleye, E.K. Natural Resource Abundance in Nigeria: From Dependence to Development. Resour. Policy 2008, 33, 168–174. [Google Scholar] [CrossRef]
- Ogun, T.P. Infrastructure and Poverty Reduction: Implications for Urban Development in Nigeria. Urban Forum 2010, 21, 249–266. [Google Scholar] [CrossRef] [Green Version]
- Olanipekun, A.S. The Effectiveness of the New Town Policy in Managing Growth and Congestion in Mega Cities: A Case Study of Lagos, Nigeria New Town Policy. Unpublished Master’s Thesis, Western Michigan University, Kalamazoo, MI, USA, 2013. [Google Scholar]
- EIU. Nigeria Country Profile; Economist Intelligence Unit: London, UK, 2012. [Google Scholar]
- Metz, H.C. (Ed.) Nigeria: A Country Study; GPO for the Library of Congress: Washington, DC, USA, 1991.
- World Bank. Nigeria Urban Transport in Crisis; The World Bank: Washington, DC, USA, 1991. [Google Scholar]
- Koskimäki, P.L. Africa Could Take a Leap to Energy Efficiency: What Lessons could Sub-Saharan Countries Learn from European Energy Efficiency Policy Implementation? Energy Sustain. Dev. 2012, 16, 189–196. [Google Scholar] [CrossRef]
- Iarossi, G.; Clarke, G.R.G. Nigeria 2011: An Assessment of the Investment Climate in 26 States; World Bank: Washington, DC, USA, 2011. [Google Scholar]
- AfDB. Benin: Project to Upgrade the Cotonou-Port Novo Road—Project Performance Evaluation Report; AfDB Project and Program Evaluation Division: Abidjan, Côte d’Ivoire, 2010. [Google Scholar]
- Cox, W. Developing Africa: Toward Customer Oriented Urban Transport Policy; CODATU XV Congress; African Union Headquarters: Addis Ababa, Ethiopia, 2012. [Google Scholar]
- Gannon, C.; Liu, Z. Poverty and Transport; The World Bank Group: Washington, DC, USA, 1997. [Google Scholar]
- Cox, W. Urban Transport and Economic Growth; Seminario de Transporte Urbano Inter-American Development Bank: Santiago de Chile, Chile, 2007. [Google Scholar]
- Remy, P.; Lee, C.-W. Size, Sprawl, Speed, and the Efficiency of Cities. Urban Stud. 1998, 36, 1849–1858. [Google Scholar]
- DFID. Growth and Employment in States (GEMS); Department for International Development: Abuja, Nigeria, 2009.
- Waverman, L.; Meschi, M.; Fuss, M. The Impact of Telecoms on Economic Growth in Developing Countries. Vodafone Policy Pap. Ser. 2005, 2, 10–23. [Google Scholar]
- World Bank; DFID. Nigeria Competitiveness and Growth Country Economic Memorandum: Main Report; World Bank: Washington, DC, USA, 2007. [Google Scholar]
- Aker, J.C. Does Digital Divide or Provide? The Impact of Mobile Phones on Grain Markets in Niger; BREAD Working Paper 177; Duke University: Durham, NC, USA, 2008. [Google Scholar]
- Aker, J.C.; Mbiti, I.M. Mobile Phones and Economic Development in Africa. J. Econ. Perspect. 2010, 24, 2017–2232. [Google Scholar] [CrossRef]
- World Bank. Enterprise Surveys: Nigeria Country Profile; International Bank of Reconstruction and Development: Washington, DC, USA, 2007. [Google Scholar]
- Walker, J.T.; Maddan, S. Statistics in Criminology and Criminal Justice: Analysis and Interpretation; Jones and Bartlett: Sudbury, MA, USA, 2013. [Google Scholar]
- Jolliffe, I.T. Principal Components Analysis; Springer: New York, NY, USA, 2002. [Google Scholar]
- Cronbach, L.J. Coefficient Alpha and the Internal Structure of Tests. Psychometrika 1951, 16, 297–334. [Google Scholar] [CrossRef]
- Boscarino, J.A.; Figley, C.R.; Adams, R.E. Compassion Fatigue Following the September 11 Terrorist Attacks: A study of Secondary Trauma among New York City Social Workers. Int. J. Emerg. Ment. Health 2004, 6, 1–10. [Google Scholar]
- Raykov, T. Cronbach’s Alpha and Reliability of Composite with Interrelated Non-homogenous Items. Appl. Psychol. Meas. 1998, 22, 375–385. [Google Scholar] [CrossRef]
- Harris, R.; Sleight, P.; Webber, R. Geodemographics, GIS and Neighbourhood Targeting; Wiley: London, UK, 2005. [Google Scholar]
- Gnanadesikan, R.; Kettenring, J.R.; Tsao, S.L. Weighting and selection of variables for cluster analysis. J. Classif. 2005, 12, 113–136. [Google Scholar] [CrossRef]
- Everitt, B.S.; Landau, S.; Leese, M. Cluster Analysis, 4th ed.; Arnold: London, UK, 2001. [Google Scholar]
- Little, R.J.A.; Rubin, D.B. Statistical Analysis with Missing Data; John Wiley and Sons: New York, NY, USA, 2014. [Google Scholar]
- Ojo, A.; Vickers, D.; Ballas, D. The segmentation of Local Government Areas: Creating a new geography of Nigeria. Appl. Spat. Anal. Policy 2012, 5, 25–49. [Google Scholar] [CrossRef]
- George, D.; Mallery, P. SPSS for Windows Step by Step: A Simple Guide and Reference, 4th ed.; Allyn & Bacon: Boston, MA, USA, 2003. [Google Scholar]
- Ojo, A.; Ezepue, P.O. How Developing Countries Can Derive Value from the Principles and Practice of Geodemographics, and Provide Fresh Solutions to Millennium Development Challenges. J. Geogr. Reg. Plan. 2011, 4, 505–512. [Google Scholar]
Figure 1.
Map of Nigeria showing key administrative boundaries.

Figure 2.
Share of CIQI cities by geopolitical zones (percentage).

Figure 3.
Median Benchmark Analysis of the 2007/09 CIQI.

Figure 4.
The City Infrastructure Quality Index 2007/2009.

Figure 5.
Quality of Transport Infrastructure 2007/2009.

Figure 6.
Quality of Power Infrastructure 2007/2009.

Figure 7.
Quality of Industrial Land Infrastructure 2007/2009.

Figure 8.
Quality of ICT Infrastructure 2007/2009.


Table 1.
City Infrastructure Quality Index (CIQI) Cities and Data Sources.
| City | Data Source |
|---|---|
| Abakaliki | 2009 Enterprise Survey |
| Abeokuta | 2007 Enterprise Survey |
| Abuja | 2007 Enterprise Survey |
| Ado-Ekiti | 2009 Enterprise Survey |
| Akure | 2009 Enterprise Survey |
| Asaba | 2009 Enterprise Survey |
| Awka | 2007 Enterprise Survey |
| Bauchi | 2007 Enterprise Survey |
| Benin City | 2009 Enterprise Survey |
| Birnin Kebbi | 2009 Enterprise Survey |
| Calabar | 2007 Enterprise Survey |
| Damaturu | 2009 Enterprise Survey |
| Dutse | 2009 Enterprise Survey |
| Enugu | 2007 Enterprise Survey |
| Gombe | 2009 Enterprise Survey |
| Gusau | 2009 Enterprise Survey |
| Ibadan | 2009 Enterprise Survey |
| Ilorin | 2009 Enterprise Survey |
| Jalingo | 2009 Enterprise Survey |
| Jos | 2009 Enterprise Survey |
| Kaduna | 2007 Enterprise Survey |
| Kano | 2007 Enterprise Survey |
| Katsina | 2009 Enterprise Survey |
| Lafia | 2009 Enterprise Survey |
| Lagos | 2007 Enterprise Survey |
| Lokoja | 2009 Enterprise Survey |
| Maiduguri | 2009 Enterprise Survey |
| Makurdi | 2009 Enterprise Survey |
| Minna | 2009 Enterprise Survey |
| Osogbo | 2009 Enterprise Survey |
| Owerri | 2009 Enterprise Survey |
| Port-Harcourt | 2009 Enterprise Survey |
| Sokoto | 2007 Enterprise Survey |
| Umuahia | 2007 Enterprise Survey |
| Uyo | 2009 Enterprise Survey |
| Yenagoa | 2009 Enterprise Survey |
| Yola | 2009 Enterprise Survey |
Table 2.
Proxy Indicators for Transport.
| Indicator Proxy | Calculation/Description |
|---|---|
| Transport Availability | Percentage share of business establishments for which transportation constitutes minimal or no obstacle to operations |
| Use of Other Transport | Rate at which business establishments did not use their own transport for shipment of goods |
| Travel Time | Average length of time required to ship production inputs from origin to destination |
| Use of Own Transport | Rate at which business establishments regularly made use of their own transport |
Table 3.
Proxy Indicators for Power.
| Indicator Proxy | Calculation/Description |
|---|---|
| Access to Electricity | Percentage share of business establishments for which electricity constitutes minimal or no obstacle to operations |
| Aggregate Energy Use | Percentage share of business establishments that did not make loses from annual sales due to power outages |
| Connection to Electricity Services | Rate of electricity connection applications successfully implemented within the statutory period of one week |
| Electricity Consumption | Percentage of electricity use that did not emanate from a generator. |
| Power Reliability | Average number of monthly power outages |
Table 4.
Proxy Indicators for Industrial Land.
| Indicator Proxy | Calculation/Description |
|---|---|
| Access to Land | Percentage share of business establishments for which land accessibility constitutes minimal or no obstacle to operations |
| Authorised Housing | Percentage share of business owners who used their homes as collateral for accessing business finance |
| Rent-to-Value Ratio | Based on the entire land occupied by establishment. Ratio of land leased by business establishment to land owned by business establishment |
| Rental Cost | Average rental cost of landed property and related equipment |
| Disputed Land Ownership | Proportion of business establishments for which disputed ownership of land is obstructing business growth and expansion |
| Availability of Commercial Land | Proportion of business establishments for which insufficiency of land is not obstructing business growth and expansion |
| Availability of Government Land | Proportion of business establishments for which government ownership/restriction of land is not obstructing business growth and expansion |
Table 5.
Proxy Indicators for Information and Communication Technologies.
| Indicator Proxy | Calculation/Description |
|---|---|
| Internet Usage | Percentage share of business establishments that communicate with their clients and suppliers by email |
| Cyber Security Concern | Percentage share of business establishments expressing security concerns about internet access |
| Telecoms Penetration | Percentage share of business establishments for which telecommunications constitutes minimal or no obstacle to operations |
| Tele-Density | Percentage share of business establishments that successfully secured a mainline telephone connection |
| Uptake of High Speed Internet | Percentage share of business establishments that have high speed broadband internet |
Table 6.
Correlation Matrix of Preliminary Indicators.
| Transport Availability | Use of Other Transport | Travel Time | Use of Own Transport | Access to Electricity | Aggregate Energy Use | Connection to Electricity Services | Electricity Consumption | Power Reliability | Access to Land | Authorised Housing | Rent-to-Value Ratio | Rental Cost | Disputed Land Ownership | Availability of Commercial Land | Availability of Government Land | Internet Usage | Cyber Security Concern | Telecoms Penetration | Tele-Density | Uptake of High Speed Internet | |
|---|---|---|---|---|---|---|---|---|---|---|---|---|---|---|---|---|---|---|---|---|---|
| 0.06 | 0.18 | −0.06 | 0.44 | 0.49 | 0.37 | 0.16 | 0.23 | 0.57 | −0.23 | 0.09 | 0.10 | 0.34 | −0.01 | 0.27 | 0.22 | −0.18 | 0.70 | 0.13 | 0.20 | Transport Availability | |
| 1.00 | 0.16 | −1.00 | 0.04 | 0.07 | 0.10 | 0.12 | 0.00 | −0.26 | −0.29 | 0.05 | −0.27 | 0.32 | −0.21 | 0.22 | −0.22 | −0.07 | 0.20 | −0.42 | 0.04 | Use of Other Transport | |
| 1.00 | −0.16 | 0.15 | 0.14 | 0.29 | 0.18 | 0.31 | 0.08 | −0.22 | 0.55 | 0.08 | 0.39 | −0.31 | 0.06 | 0.29 | −0.47 | 0.21 | 0.00 | 0.04 | Travel Time | ||
| 1.00 | −0.04 | −0.07 | −0.10 | −0.12 | 0.00 | 0.26 | 0.29 | −0.05 | 0.27 | −0.32 | 0.21 | −0.22 | 0.22 | 0.07 | −0.20 | 0.42 | −0.04 | Use of Own Transport | |||
| 1.00 | 0.35 | 0.64 | 0.43 | 0.04 | 0.44 | −0.42 | 0.16 | −0.09 | −0.06 | −0.30 | 0.12 | 0.26 | 0.01 | 0.58 | 0.26 | 0.18 | Access to Electricity | ||||
| 1.00 | 0.22 | 0.25 | 0.45 | 0.59 | −0.38 | −0.12 | 0.07 | 0.20 | 0.07 | 0.42 | 0.21 | −0.16 | 0.42 | −0.26 | 0.28 | Aggregate Energy Use | |||||
| 1.00 | 0.20 | 0.11 | 0.35 | −0.56 | 0.13 | −0.12 | −0.13 | −0.70 | 0.11 | 0.40 | 0.20 | 0.77 | 0.40 | 0.15 | Connection to Electricity Services | ||||||
| 1.00 | −0.17 | 0.29 | −0.10 | 0.31 | −0.26 | 0.17 | −0.22 | 0.05 | −0.05 | −0.27 | 0.26 | −0.01 | −0.11 | Electricity Consumption | |||||||
| 1.00 | 0.25 | −0.37 | −0.10 | 0.38 | 0.14 | 0.06 | 0.15 | 0.41 | −0.25 | 0.19 | 0.03 | 0.07 | Power Reliability | ||||||||
| 1.00 | −0.56 | 0.06 | 0.30 | 0.19 | −0.02 | 0.30 | 0.47 | −0.30 | 0.56 | 0.18 | 0.11 | Access to Land | |||||||||
| 1.00 | 0.03 | −0.17 | 0.01 | 0.40 | −0.32 | −0.57 | 0.46 | −0.56 | −0.03 | 0.23 | Authorised Housing | ||||||||||
| 1.00 | −0.01 | 0.31 | −0.14 | −0.07 | 0.08 | −0.18 | 0.14 | 0.16 | −0.32 | Rent-to-Value Ratio | |||||||||||
| 1.00 | 0.04 | 0.15 | −0.09 | 0.58 | −0.10 | 0.06 | 0.28 | 0.09 | Rental Cost | ||||||||||||
| 1.00 | 0.05 | 0.05 | −0.07 | −0.55 | 0.12 | −0.16 | 0.00 | Disputed Land Ownership | |||||||||||||
| 1.00 | 0.16 | −0.33 | −0.14 | −0.50 | −0.25 | −0.04 | Availability of Commercial Land | ||||||||||||||
| 1.00 | −0.12 | −0.22 | 0.37 | −0.20 | 0.16 | Availability of Government Land | |||||||||||||||
| 1.00 | −0.31 | 0.34 | 0.53 | 0.34 | Internet Usage | ||||||||||||||||
| 1.00 | −0.11 | 0.33 | −0.47 | Cyber Security Concern | |||||||||||||||||
| 1.00 | 0.24 | 0.12 | Telecoms Penetration | ||||||||||||||||||
| 1.00 | 0.01 | Tele-Density | |||||||||||||||||||
| Uptake of High Speed Internet |
Table 7.
Indicators with the Largest Positive Skew.
| Indicator | Skew |
|---|---|
| Rent-to-Value Ratio | 3.52 |
| Power Reliability | 2.6 |
| Rental Cost | 2.32 |
| Travel Time | 1.52 |
| Aggregate Energy Use | 1.39 |
| Tele-Density | 1.2 |
Table 8.
Loading of the First Principal Component in Descending Order.
| Indicator | Loading |
|---|---|
| Telecoms Penetration | 0.87 |
| Aggregate Energy Use | 0.84 |
| Transport Availability | 0.81 |
| Access to Land | 0.79 |
| Disputed Land Ownership | 0.70 |
| Availability of Government Land | 0.66 |
| Power Reliability | 0.64 |
| Internet Usage | 0.61 |
| Use of Other Transport | 0.57 |
| Connection to Electricity Services | 0.52 |
| Rent-to-Value Ratio | 0.47 |
| Travel Time | 0.41 |
| Access to Electricity | 0.32 |
| Uptake of High Speed Internet | 0.28 |
| Rental Cost | 0.24 |
| Electricity Consumption | 0.09 |
| Tele-Density | −0.41 |
| Availability of Commercial Land | −0.42 |
| Cyber Security Concern | −0.47 |
| Use of Own Transport | −0.57 |
| Authorised Housing | −0.60 |
Table 9.
Final List of CIQI Indicators.
| Domain | Indicator |
|---|---|
| Transport | Transport Availability |
| Travel Time | |
| Use of Own Transport | |
| Power | Access to Electricity |
| Connection to Electricity Services | |
| Electricity Consumption | |
| Power Reliability | |
| Industrial land | Access to Land |
| Disputed Land Ownership | |
| Availability of Commercial Land | |
| Availability of Government Land | |
| Information and communication technologies (ICT) | Internet Usage |
| Telecoms Penetration | |
| Uptake of High Speed Internet |
Table 10.
Weights Used to Construct the CIQI.
| Domain | Domain Weight | Indicator | Indicator Weight |
|---|---|---|---|
| Transport | 25 | Transport Availability | 0.25 |
| Travel Time | 0.50 | ||
| Use of Own Transport | 0.25 | ||
| Power | 35 | Access to Electricity | 0.40 |
| Connection to Electricity Services | 0.20 | ||
| Electricity Consumption | 0.20 | ||
| Power Reliability | 0.20 | ||
| Industrial land | 22 | Access to Land | 0.32 |
| Disputed Land Ownership | 0.18 | ||
| Availability of Commercial Land | 0.32 | ||
| Availability of Government Land | 0.18 | ||
| Information and communication technologies (ICT) | 18 | Internet Usage | 0.50 |
| Telecoms Penetration | 0.25 | ||
| Uptake of High Speed Internet | 0.25 |
© 2018 by the authors. Licensee MDPI, Basel, Switzerland. This article is an open access article distributed under the terms and conditions of the Creative Commons Attribution (CC BY) license (http://creativecommons.org/licenses/by/4.0/).
Share and Cite
MDPI and ACS Style
Ojo, A.; Papachristodoulou, N.; Ibeh, S. The Development of an Infrastructure Quality Index for Nigerian Metropolitan Areas Using Multivariate Geo-Statistical Data Fusion. Urban Sci. 2018, 2, 59. https://doi.org/10.3390/urbansci2030059
AMA Style
Ojo A, Papachristodoulou N, Ibeh S. The Development of an Infrastructure Quality Index for Nigerian Metropolitan Areas Using Multivariate Geo-Statistical Data Fusion. Urban Science. 2018; 2(3):59. https://doi.org/10.3390/urbansci2030059
Chicago/Turabian StyleOjo, Adegbola, Nikolaos Papachristodoulou, and Samuel Ibeh. 2018. "The Development of an Infrastructure Quality Index for Nigerian Metropolitan Areas Using Multivariate Geo-Statistical Data Fusion" Urban Science 2, no. 3: 59. https://doi.org/10.3390/urbansci2030059