Access to Urban Green Space in Cities of the Global South: A Systematic Literature Review


1
Department of Recreation, Sport and Tourism, University of Illinois at Urbana-Champaign, Champaign, IL 61820, USA
2
Department of Informatics, University of Illinois at Urbana-Champaign, Urbana, IL 61801, USA
*
Author to whom correspondence should be addressed.
Urban Sci. 2018, 2(3), 67; https://doi.org/10.3390/urbansci2030067
Submission received: 12 July 2018
/
Revised: 4 August 2018
/
Accepted: 6 August 2018
/
Published: 8 August 2018
Abstract
:This review examines disparities in access to urban green space (UGS) based on socioeconomic status (SES) and race-ethnicity in Global South cities. It was motivated by documented human health and ecosystem services benefits of UGS in Global South countries and UGS planning barriers in rapidly urbanizing cities. Additionally, another review of Global North UGS studies uncovered that high-SES and White people have access to a higher quantity of higher quality UGSs than low-SES and racial-ethnic minority people but that no clear differences exist regarding who lives closer to UGS. Thus, we conducted a systematic review to uncover (1) whether UGS inequities in Global North cities are evident in Global South cities and (2) whether inequities in the Global South vary between continents. Through the PRISMA approach and five inclusion criteria, we identified 46 peer-reviewed articles that measured SES or racial-ethnic disparities in access to UGS in Global South cities. We found inequities for UGS quantity (high-SES people are advantaged in 85% of cases) and UGS proximity (74% of cases). Inequities were less consistent for UGS quality (65% of cases). We also found that UGS inequities were consistent across African, Asian, and Latin American cities. These findings suggest that Global South cities experience similar inequities in UGS quantity and quality as Global North cities, but that the former also face inequities in UGS proximity.
1. Introduction
Cities in the Global South are experiencing many of the same challenges faced by cities in the Global North, including climate change, growing inequality and gentrification, increasing health issues, and aging [1,2,3,4,5,6]. Yet some Global South cities also face a number of additional challenges such as the presence of large informal settlements (e.g., slums and favelas); the legacies of colonialism and post-colonialism; even larger wealth inequalities than Global North cities; higher levels of pollution due to rapidly growing industries; and extremely high rates of population and urban growth [4,5,7,8,9,10,11,12,13]. These particular challenges negatively impact the most vulnerable residents of Global South cities, raising environmental justice concerns related to access to environmental goods and exposure to environmental hazards [13,14,15,16,17].
As part of growing concerns about inequalities in urban areas of the Global South, in the last decade, an increasing number of studies have analyzed whether urban green spaces are equitably distributed in cities of developing countries [12,18,19,20,21]. Much of this research has also been motivated by the documented benefits of urban green space. Indeed, studies conducted in the Global South have shown that urban green spaces have several benefits for human health and ecosystem services [22,23,24,25,26,27,28,29], confirming evidence reported in the Global North [30,31,32,33,34]. In particular, studies have indicated that urban green space can promote physical activity [22,35,36], mental health [22,23,36], and well-being [37,38,39], and it can be a vital part of a city’s infrastructure by helping improve water quality and reduce runoff [24,29]. Yet urban green space might also bring some disservices to some Global South and Global North cities, including fostering the spread of infectious diseases caused by interactions with wildlife (e.g., HIV and Ebola) [40] and water quality and access issues from water lines being damaged by tree roots [41]. Although such disservices need to be acknowledged, the literature points to the fact that, even in the Global South, urban green space is a fundamental element of sustainable, healthy, and livable cities.
Access to high-quality, safe urban green space is an issue of environmental justice because of the benefits that green space can bring to communities and because of documented socioeconomic and racial-ethnic disparities in its provision [42,43,44]. Indeed, two reviews have found that, in cities of the Global North, marginalized populations such as low-income and racial-ethnic minority people (e.g., Black and Latino individuals) experience inequities in urban green space quantity, including the number and surface of green spaces, and quality, including the number of amenities, maintenance standards, and safety levels [33,42]. These reviews also found that there were no clear differences for urban green space proximity (how far is the closest park) based on income or race-ethnicity [33,42]. Although researchers have conducted several studies on access to urban green space in Global South cities, to our knowledge no systematic review has summarized this emerging body of literature.
Analyzing equity issues in the provision of urban green space in Global South cities matters for at least three reasons. First, rapidly growing cities might not adequately plan for green space, thus leaving large parts of the population underserved [12,45,46,47,48]. Second, informal settlements that are common in many regions of the Global South generally lack urban green spaces and other public services [10,18,49,50,51]. Third, people in many countries in the Global South have relatively short life expectancy [52], which can, at least in part, be improved by increasing access to health-promoting environments such as urban green spaces [53,54,55].
Given these emerging issues, we conducted a systematic review of the growing body of literature on access to urban green space in cities of the Global South. We asked two important questions that allow us to uncover issues of distributional justice related to urban green space in developing countries: (1) Do cities of the Global South experience the same inequalities in urban green space quantity and quality experienced by cities of the Global North? (2) Do inequalities in urban green space provision in Global South cities vary by continent?
2. Materials and Methods
We used the PRISMA method [56] to conduct a systematic review of the literature on access to urban green spaces in Global South cities. The PRISMA method provides rigorous standards for performing and reporting systematic reviews, including a checklist of important items to include in papers describing such reviews [56]. For this reason, we chose to use this method over other standardized techniques for systematic reviews.
2.1. Definition of Key Phrases and Terms
In this paper, we use the phrase “urban green space” (or “green space”) to describe accessible open spaces in cities characterized by the presence of vegetation [57], including formal parks, greenways, forest preserves and other natural areas, gardens, informal open spaces, and privately owned public spaces such as shared courtyards in residential communities. Contrary to some definitions of urban green space, we did not include tree canopy and street trees, as we intended to focus on “usable” green space that serves recreation, socialization, or other community purposes.
The concept of “access to urban green space” (or “green space provision”) also deserves a brief discussion. In this paper, we mostly focus on geographic “access to urban green space,” which describes whether residents of a neighborhood or a city have green space available within a certain distance from their home as well as the quantity and quality of such green space [42]. Studies have measured green space provision through objective techniques (e.g., through geographic information systems, or GIS) and through resident surveys that assessed their perceptions of green space presence, quantity, and quality [42]. We acknowledge that, besides geographic availability, a number of social and psychological aspects also influence whether a person will use a green space or not, suggesting that access to green space is a complex phenomenon [58]. Yet most empirical studies analyzing green space provision have only conceptualized access as a geographic construct, as they used GIS to uncover income- and race-based inequalities [42]. A recent review by Rigolon showed that studies used three types of variables to evaluate geographic access to urban green space: Proximity describes “how close is the nearest park;” quantity describes “how many parks, or acres [hectares] of parks, are within reach;” and quality describes “what is the quality and the maintenance level of parks within reach” [42] (p. 162). Although proximity, quantity, and quality all describe features of green space located near one’s residence, they have some fundamental differences [42]. Proximity considers the distance to the closest green space, but it does not account for green space number, size, amenities, maintenance, and safety. Quantity focuses on the size and number of green spaces within reach, but not on their amenities, maintenance, and safety. Additionally, quality considers the amenities, maintenance, and safety of green spaces within reach, but not their number and quantity. Other recent empirical studies in the Global North have made a clear distinction between green space proximity, quantity, and quality [59,60,61]. In this review, we use a similar approach to classify the results of empirical studies on access to urban green space in Global South cities.
We use the phrase “Global South” (or “developing countries”) to describe a part of the world that has not yet achieved the same levels of wealth, economic development, and political stability that many countries in North America and Europe—part of the “Global North”—have accomplished [4,62]. The phrase Global South “emphasize[s] a shared heritage of recent colonial histories in the global peripheries” [4] (p. 4). All countries in Africa, all countries in Latin America, and most countries in Asia are part of the Global South [63]. Notably, China, India, and Pakistan are part of the Global South, while Japan and South Korea are included in the Global North [63].
Finally, we use the term “city” (or “urban area”) to describe concentrated human settlements that have at least 100,000 residents (within the same or different administrative units), which excludes small towns and villages located in rural areas. We chose a threshold of 100,000 residents for human settlements because it has been set by the Economic Co-operation and Development (OECD) for some Global North countries [64] and provides a variable that can be easily accessed for Global South cities.
2.2. Search Strategies and Inclusion Criteria
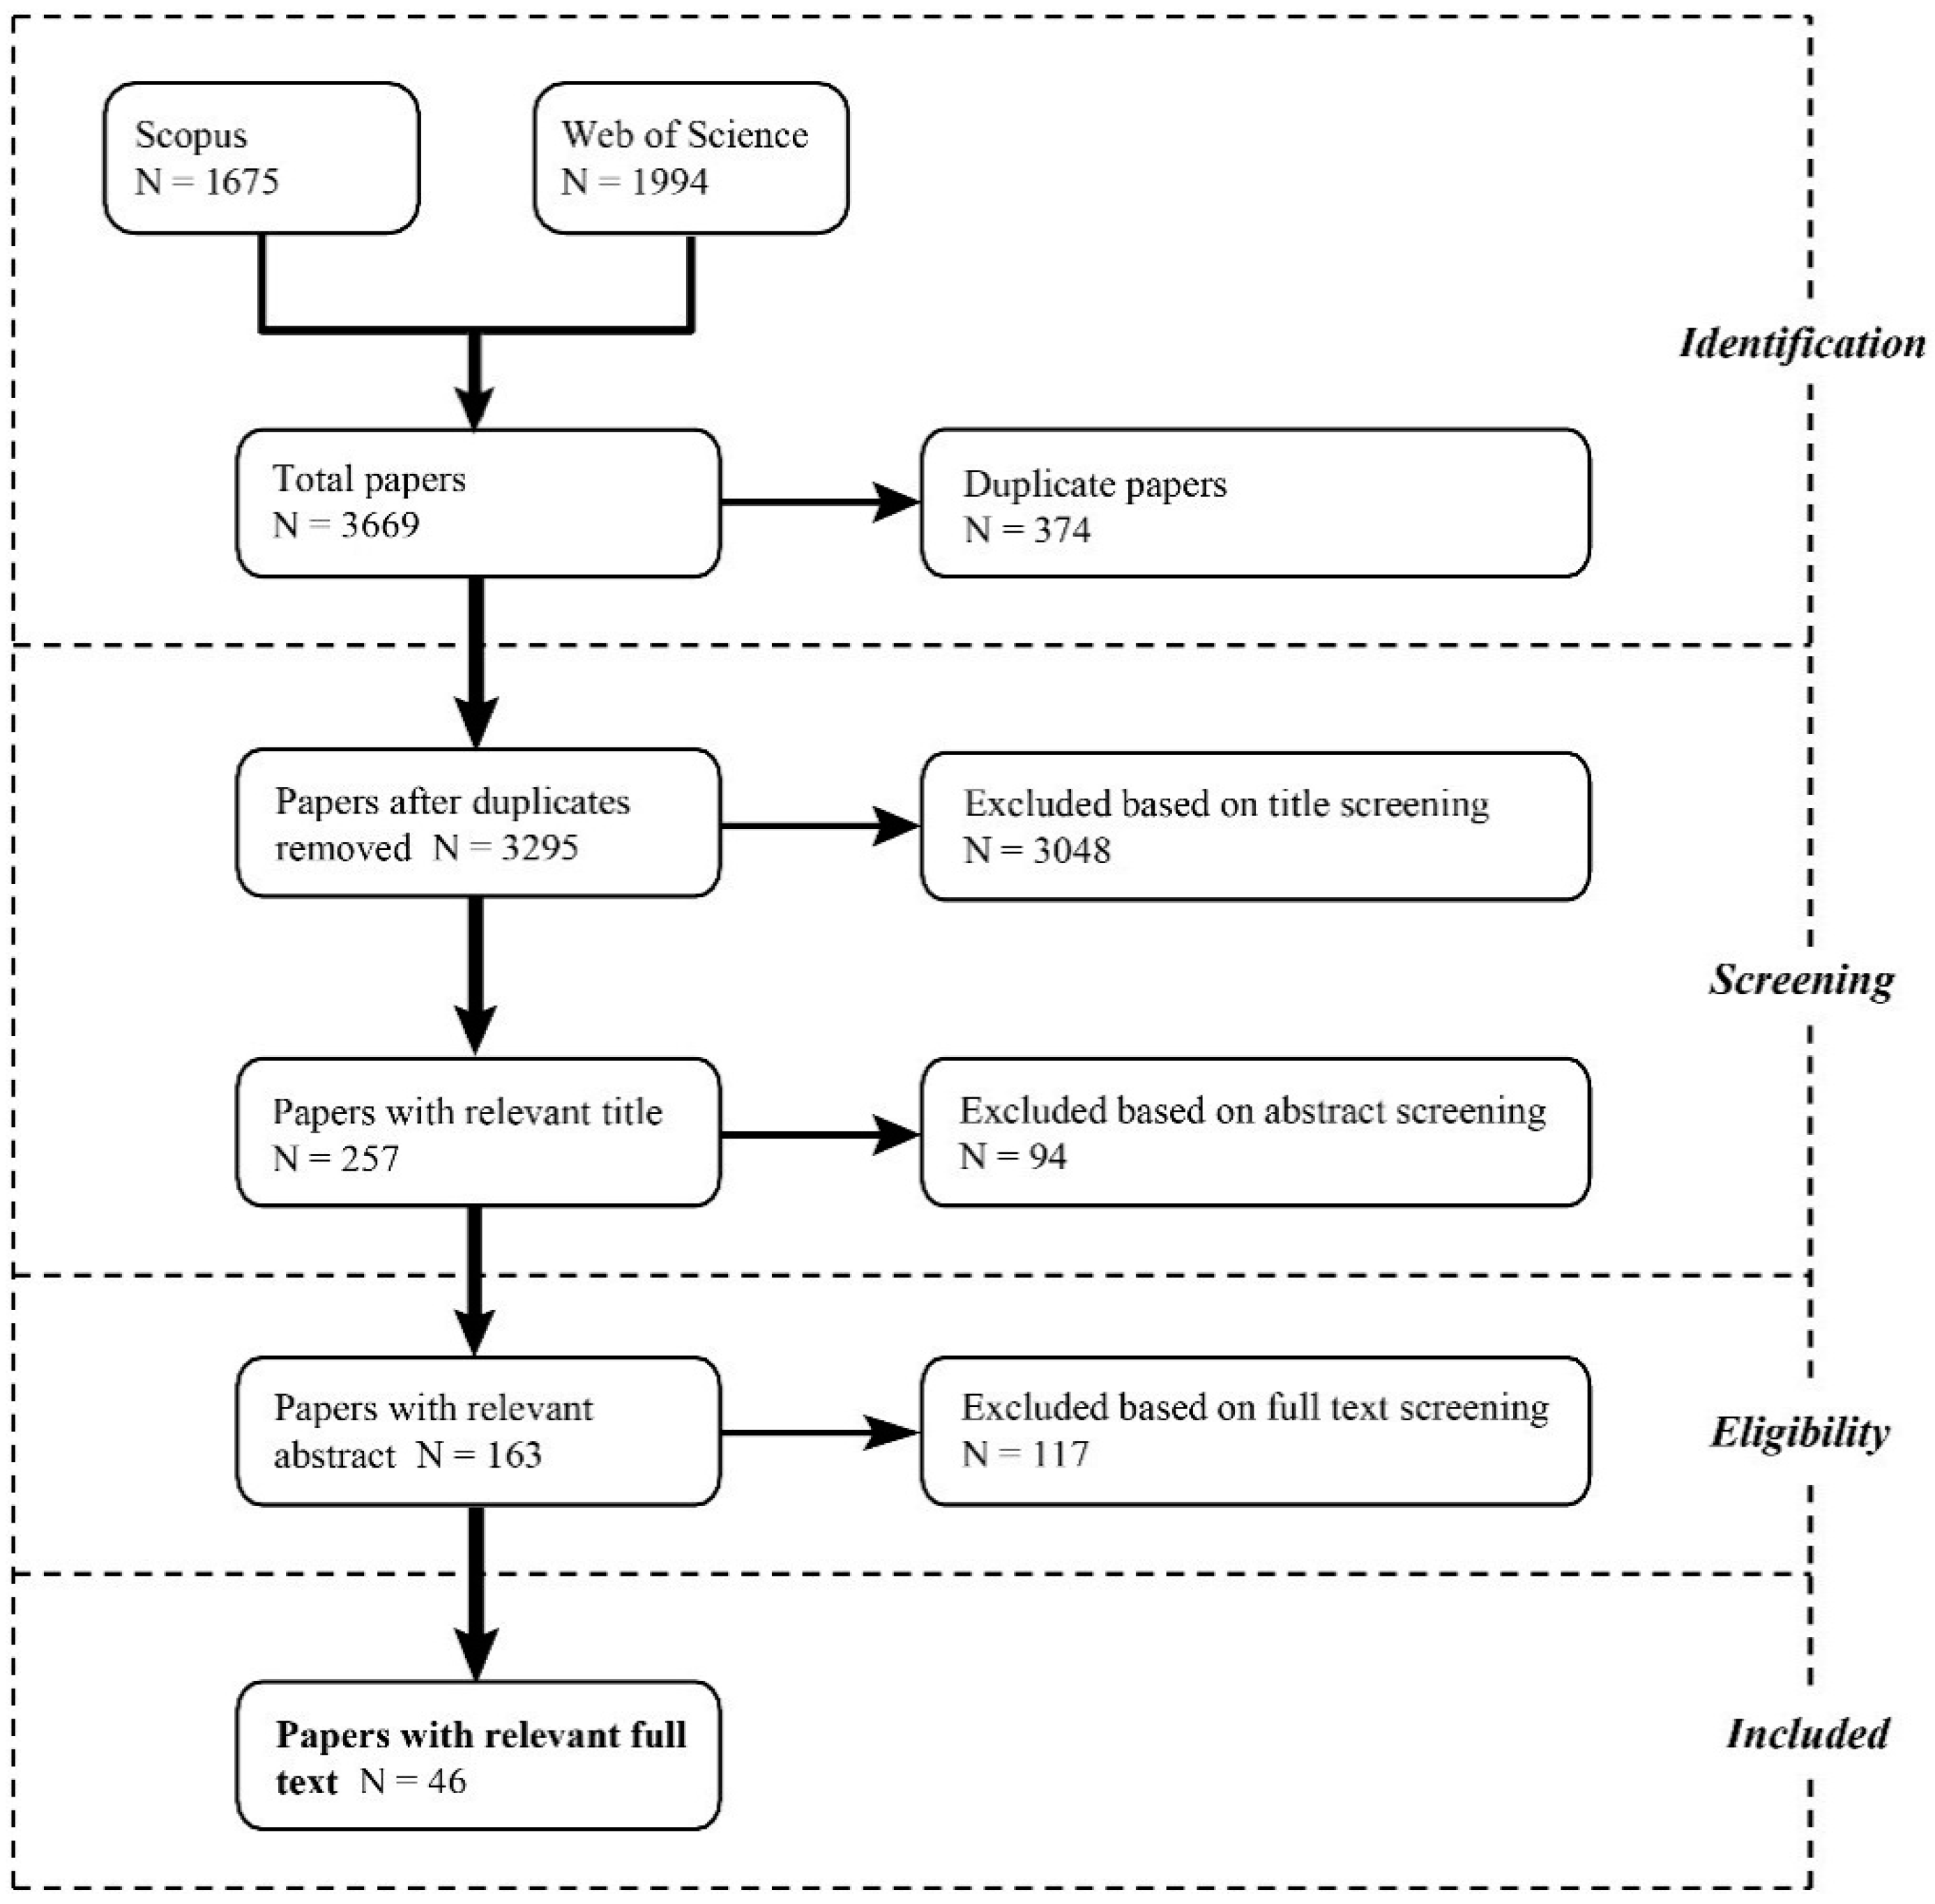
The PRISMA method describes four steps in the selection of empirical articles: identification; screening, which involves reading titles and abstracts; eligibility, involving reading the full texts; and inclusion [56] (Figure 1). Two of the authors independently reviewed titles and abstracts and made decisions about which articles to include in the full-text screening. Three of the authors independently read the full texts, and they subsequently compared their coding to define a final list of included papers. Finally, three of the authors independently coded the full texts.
We conducted a literature search through two electronic databases of scholarly publications: Scopus and Web of Science. While we also considered other academic databases, we chose Scopus and Web of Science because they include peer-review journals in a number of disciplines that have extensively studied the provision of green space, including urban studies and planning, geography, sociology, and environmental studies [42,53]. We restricted the publishing time of relevant articles between January 2009 and May 2018 (the latter date being the month in which we conducted the search) to focus on papers published in the last ten years, when significant advances in geospatial sciences and in studies on green space provision have occurred [42]. We chose to focus on articles published in peer-reviewed journals to ensure that experts in the field vetted study methods and findings, and we limited our search to articles written in English. We acknowledge that some relevant articles may have been published in the most common language of each Global South country. Accurate identification and evaluation of articles in the multitude of languages spoken in Global South countries were not feasible. Therefore, we limited our search to articles written in English, the language in which the most scientific journals are published, and the most systematic literature reviews are conducted [65].
After conducting a preliminary scan of the literature on access to urban green space in Global South cities, we developed search expressions that included a combination of keywords describing urban green space, access or provision, and geographic location. In both databases, we searched for articles that included “urban green space” (or synonym), “access” (or synonym), and a geographic location in the Global South in their title, abstract, or keywords (Table A1 in Appendix A). We used several synonyms of urban green space and access to capture the different terms that authors used to describe those constructs. In addition, we used geographic location keywords that described the Global South, its countries, and the megacities located in this region of the world. Specifically, we included keywords describing the ten largest countries in Latin America, Africa, and Asia (excluding Japan, which is part of the Global North) (see [66]). Because some articles focusing on large cities—or which the location is well known—did not report the country in the title, abstract, or keywords, we also included the names of the 36 megacities located in the Global South, which are generally defined as urban agglomerations with more than 10 million residents [8]. Finally, the search conducted in Web of Science resulted in an excessively large number of entries (~6000) because the search engine also includes “Keywords Plus”, which are terms automatically generated based on the titles of articles that each paper cites [67]. This led to some articles that analyzed geographic locations outside of the Global South, as many papers focusing on Global North cities have cited articles centering on the Global South. For example, a study of a city in the United States citing several articles focusing on China might include “China” in the Keywords Plus. Since it was not possible to exclude Keywords Plus from the main search tool of Web of Science, we decided instead to eliminate papers that Web of Science associated with disciplines that have no nexus with access to urban green space, including entomology, zoology, and many others (Table A1 and Table A2 in Appendix A).
We used five inclusion criteria to select peer-reviewed articles for this systematic review. First, articles had to measure socioeconomic status (SES) and/or racial or ethnic disparities in access to urban green space. Following definitions of SES used in environmental justice studies on green space provision, we considered SES variables such as income (personal or household), poverty, indices of deprivation, educational level [42], occupation, housing or land price [43,68], and population density [69]. Similar SES variables have been used in other related fields such as public health [70]. In this review, measures of SES included individual-level variables in studies that used individuals as the unit of analysis and area-level measures in studies that used geographies like census tracts as the unit of analysis. Second, urban green space had to be operationalized based on the definition provided in Section 2.1. Third, articles had to focus on one or more cities of the Global South with more than 100,000 residents. Fourth, articles had to empirically measure access to urban green space through a variety of quantitative methods, such as geographic information systems (spatial access) or surveys of residents (reported access, perceived quantity, and/or perceived quality). Finally, articles had to report descriptive or inferential statistics. We decided to include articles that only reported descriptive statistics because, due to the limited availability of data on urban green space or SES in some Global South countries [47,71,72,73,74], many articles had relatively small n sizes, which made it not feasible to conduct and report inferential statistics.
We excluded 117 articles during the full-text screening. We excluded the articles that did not measure green space provision in relation to SES or race-ethnicity (75.2%), used qualitative methods only (18.4%), focused on Global North cities (3.4%), did not have full texts in English (2.5%), and studied urban tree canopy (0.9%). At the end of the full-text screening, we included 46 articles that met all inclusion criteria (Table 1).
2.3. Analysis of Selected Journal Articles
We developed a codebook to analyze the methods, results, and potential methodological flaws of the 46 sampled articles. In addition to descriptive codes (e.g., year of publication, journal, and study location), we documented analytical codes including the methodological approaches to measure green space provision and the findings for proximity, quantity, and quality (Table 2). Importantly, we used the methods employed in Rigolon’s recent review [42] to code whether articles measured green space proximity, quantity, and/or quality (Table 2). We also coded the methods that authors used to measure green space provision, including GIS analyses, surveys with residents, and others. Then, to clarify the methods used in GIS studies, we used Talen’s widely used classification of approaches to measuring access to neighborhood facilities, including container, coverage, minimum distance, travel cost, and gravity [106].
Because proximity, quantity, and quality are relatively broad constructs, we classified the findings for each of them into sub-categories. To do so, we combined deductive and inductive approaches. We relied on classifications presented in previous reviews, empirical studies, and conceptualizations of park quality [42,59,108] (deductive approach), and we cross-checked these classifications with the methods and data of the sampled studies for this review (inductive approach). For example, for green space proximity, we relied on distance thresholds used in studies of Global North cities (e.g., 500 m) [42] and on thresholds utilized in some of the sampled papers we reviewed (e.g., 1000 m and 2000 m). Additionally, for green space quality, we distinguished between the studies that operationalized quality as the number and diversity of park amenities—a common approach in Global North countries, where researchers have developed tools to measure park quality [108,109,110]—and investigations that focused on maintenance and safety, satisfaction with green spaces, or other parameters [42]. The resulting classifications for proximity, quantity, and quality are reported in Tables 4–6 in the Results Section.
To answer the first research question, we coded the results of the sampled studies based on which SES or racial-ethnic groups experienced better green space provision for proximity, quantity, and quality. First, we recorded that a study found “equitable” provision if low-SES and/or racial-ethnic minority people had better green space provision. This included cases in which, although findings were slightly mixed across different SES variables, most of such variables showed equitable outcomes. Second, we recorded that a study found “inequitable” outcomes if high-SES and/or racial-ethnic majority people had better green space provision (or slightly mixed findings with mostly inequitable outcomes). Third, we coded a study as “mixed findings-not significant” if the authors did not report statistically significant findings or if the results were mixed for SES and/or race-ethnicity (e.g., equitable for education but inequitable for occupation). We then counted the number of articles that showed equitable, inequitable, or mixed green space provision for proximity, quantity, and quality.
We then tested whether, for the sub-sample of studies analyzing each construct (i.e., proximity, quantity, and quality), findings varied based on the specific measure considered. For example, we tested whether, for studies on green space quantity, the results of articles using green space area per capita (a commonly used variable) were different from those of the whole sub-sample of articles focusing on quantity (including other variables besides green space area per capita). First, we created cross-tabs to calculate the expected number of articles that found inequity, equity, or mixed/null findings for each construct. Next, we compared the expected numbers of articles in each category with the observed number of articles. Last, we calculated chi-squared statistics to determine whether these two counts were statistically significantly different. If the expected number of articles that found inequity, equity, and mixed findings in one measure of green space quantity (e.g., green space area per capita) was significantly different from the observed number of articles for this measure, we could conclude that findings for green space quantity depend on the specific variables used to measure quantity.
We also sought to uncover whether findings for each component of green space provision varied based on the type of SES and unit of analysis considered. To do this, we coded each finding in each paper according to the SES measure (e.g., SES index, income), unit of analysis (e.g., neighborhood, individual), and green space component (i.e., proximity, quantity, or quality). We counted the number of outcomes (i.e., inequity, mixed/null findings, or equity) for each SES and green space component combination. We also counted the number of outcomes for each unit of analysis and green space component. Then we summarized the number of counts for each combination of variables and calculated chi-squared statistics to test for differences in the number of observed and expected counts. We chose to run these additional tests because measures of SES were quite diverse and because units of analysis also varied considerably, from as small as individuals to as large as cities.
Finally, to answer the second research question, we again ran cross-tabs and chi-square tests to determine if the expected number of findings were different from the observed number of findings in different continents. In other words, we tested whether results varied for measures of green space proximity, quantity, and quality varied based on this geographic variable. We performed all inferential statistics in the R statistical software program, Version 3.4.2 (R Foundation for Statistical Computing, Vienna, Austria).
2.4. Quality Assessment Criteria
Following the guidelines of the PRISMA method, we evaluated the sampled articles for methodological biases at the study level, not the outcome or analysis level [56]. The instrument we used to evaluate biases was based on the Effective Public Health Practice Project Quality Assessment Tool (EPHPP) [111]. This tool has been used extensively in reviews of quantitative scientific studies utilizing a broad range of methodologies [112]; further, the tool has been used in at least two reviews of urban science studies [113,114]. In this review, we used the five EPHPP competency categories relevant to observational cross-sectional studies (selection bias, study design, data collection, confounders, and analyses) [114] and selected items for each category based on weaknesses identified in prior systematic literature reviews on park inequalities [42], green space and human health [53], and urban planning and access to neighborhood services [114]. Based on these precedents, we narrowed our criteria to seven items related to the generalizability, validity, and reliability of results and measures (Table 3).
Our chosen criteria for assessing bias allowed us to rank articles into three levels. We designated analyses that met one or fewer criteria as least likely to be biased, those that met between two and three criteria as moderately likely to be biased, and those that met four or more criteria as most likely to be biased.
3. Results
3.1. Descriptive Statistics
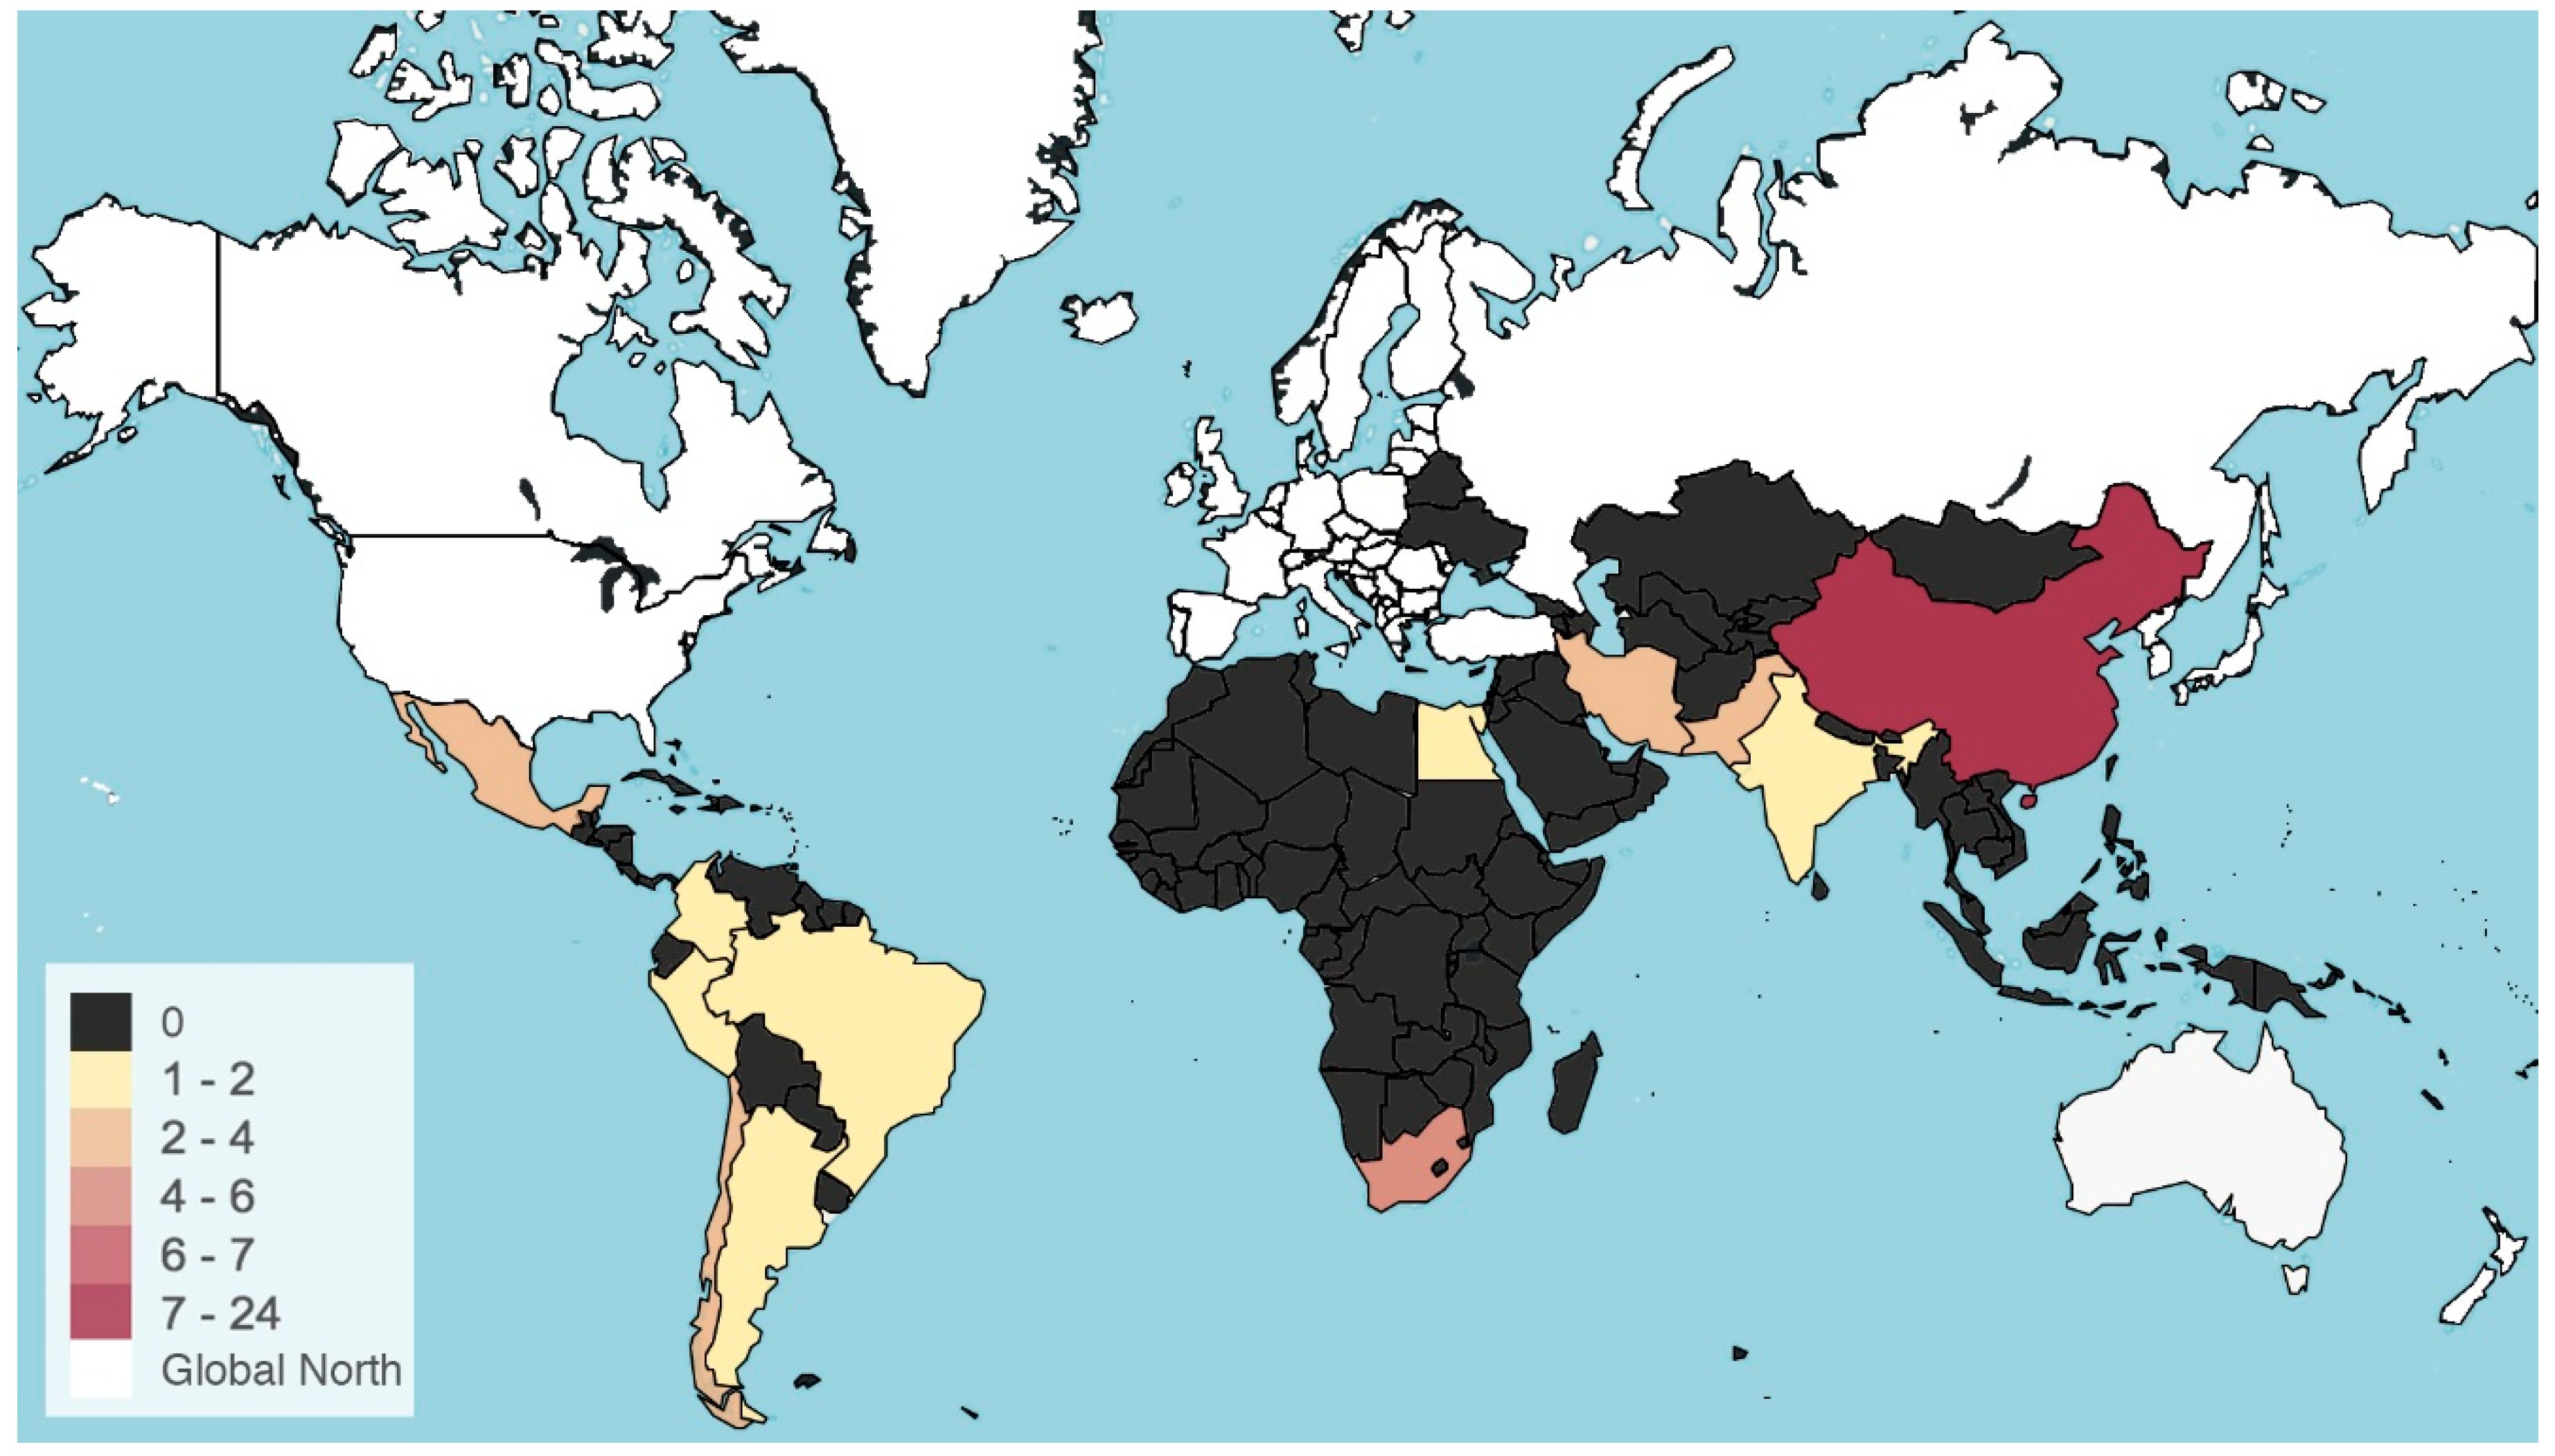
Most papers analyzed inequalities in green space provision in Asian countries (Figure 2). Thirty-two articles (70%) presented the results of studies conducted in Asia, of which 24 (52% of all articles) were conducted in China. Eight articles focused on Latin America, while six studied green space provision in Africa. In total, 13 countries were studied. The most common after China were South Africa (11%, n = 5), Iran (9%, n = 4), and Mexico, Chile, and Pakistan (7%, n = 3 each).
Figure 2 also shows notable geographic unevenness in coverage. We did not find any relevant studies for most African countries and several countries in South Asia, and very few articles emerged for most Latin American countries. While the high number of studies conducted in China might be explained by its very large population size and its tremendous growth in the higher education sector, the lack of articles in other geographical contexts might be partly attributed to data availability issues [47,71,72,73,74].
Within each country, studies mostly examined entire cities (40%, n = 18) or parts of cities (i.e., multiple neighborhoods; 46%, n = 21). Regarding the unit of analysis, most studies centered on neighborhoods (also referred to as “census tracts” or “census areas;” 54%, n = 25). Other units of analysis included individuals (30%, n = 14), districts (groups of neighborhoods; 13%, n = 6), buildings or housing units (10%, n = 5), city blocks (smaller than neighborhoods; 8%, n = 4), and entire cities (7%, n = 3). Some studies used more than one unit of analysis.
Papers were published in a large number of outlets, including 24 peer-reviewed scientific journals in the fields of urban studies and planning, geography, and environmental studies. The most common journal was Habitat International (17%, n = 8), followed by Landscape & Urban Planning (11%, n = 5). All but nine articles were published since 2014, with a significant uptick starting in 2016 (63% of the total sample).
Studies examined inequalities in green space provision for all three constructs identified in previous literature reviews. Green space proximity or quantity were each studied in 59% of the studies (n = 27). Green space quality was studied in just 37% of the sample (n = 17). Additionally, 44% of the sampled studies measured more than one construct (e.g., proximity and quantity; n = 20).
All but one article considered SES as an independent variable. Race-ethnicity was considered in six studies, and, in some of those, the results regarding equity vs inequity were hard to interpret because the authors did not explain which racial-ethnic groups are discriminated against or suffering economic hardship in the studied country. Common SES variables included income, education, indices combining multiple elements, and housing prices.
Researchers used different GIS approaches to measure green space provision, including several studies relying on more than one method. In total, GIS was used in 78% of studies while other measures of park location or access (i.e., self-reported perceptions in surveys) were used in just 28% of studies (some articles combined GIS analyses with surveys). Among the GIS studies, most used the container approach (48%, n = 22), followed by minimum distance (39%, n = 18), gravity (17%, n = 8), coverage (15%, n = 7), and travel cost (4%, n = 2). Some studies used fixed thresholds to define access in a dichotomous way: Thresholds between 501 to 1000 m buffers were the most common (28%, n = 13), and only one article considered thresholds over 2000 m.
Mean comparisons (i.e., t-tests, ANOVAs) were the most common type of statistical analysis used to test for inequalities in green space provision (52%, n = 24) of articles. The next most common were multiple regressions (39%, n = 18), correlation coefficient calculations (26%, n = 12), and chi-square tests (7%, n = 3). The vast majority of article authors reported finding green space inequalities between SES or racial-ethnic groups. For instance, among those that conducted inferential statistics, 95% found statistically significant results. The high share of significant results could be due to confirmation bias, but also to very high n for many studies. Effect sizes for green space inequalities were large in 42% of cases, small in 37% of cases, and medium in 21% of cases.
In addition, less than 20% of studies measured health outcomes (n = 9). Less than half of these (n = 4) found consistent significant positive associations between green space and human health, including increased physical activity, better mental health, less obesity, or enhanced general health. Another third of these studies (three out of nine) found mixed associations between green space and human health.
3.2. Evaluation of Potential Bias
Our review of five categories of potential biases (reported in Section 2.4) showed that methodological biases were relatively uncommon (Table 3). Thirty-two articles (70% of sample) were considered least likely to be biased because they had one or fewer biases present (out of the seven indicators measured). Only two articles (4%) had four or more indicators present and were considered most likely to be biased. The most frequent biases were present in less than one-third of articles: 14 articles had limited generalizability due to a small sample size or homogenous population, and 12 articles had limited validity due to large units of analysis.
3.3. Results: Do Inequities in the Global South Reflect Those in the Global North?
We found that inequities in access to urban green space in Global South cities partially reflect those for cities in the Global North. For proximity, although mixed to equitable findings emerged for the Global North [42], we found inequities for 74% of articles focusing on proximity in Global South cities (Table 4). Our results for quantity reflect the significant inequities uncovered for Global North contexts [42], as we found that 85% of the studies covering quantity in Global South countries uncovered inequities (Table 5). Finally, studies in the Global North found a consistent pattern of inequity for green space quality [42], and our findings for Global South cities were similar but more mixed. We found that 65% of the articles that analyzed quantity highlighted inequities.
3.3.1. Green Space Proximity
Table 4 shows that the vast majority of studies found that high-SES people live in closer proximity to parks than low-SES people (inequity, 74%, n = 20), followed by studies uncovering mixed or non-significant findings (19%, n = 5) and studies highlighting that low-SES people are advantaged (equity, 7%, n = 2). Regarding race-ethnicity, one study found that ethnically advantaged groups in Macau, China live closer to parks [103], while another uncovered mixed findings for Santa Cruz, Bolivia [47]. When classifying findings based on the thresholds used to measure proximity, we found consistently inequitable results among studies that used no thresholds (79%, n = 11), thresholds between 501 and 1000 m (75%, n = 3), and thresholds above 1000 m (100%, n = 3). Findings were mixed for other thresholds (0–500 m and multiples), although relatively few studies used them. Results of chi-squared tests were not significant (χ2 = 5.91, df = 8, p = 0.66), suggesting that inequities did not vary based on the threshold used to measure proximity.
3.3.2. Green Space Quantity
Most of the sampled studies on quantity (85%, n = 23) found that high-SES people have access to more green spaces or larger areas of green space than low-SES people (Table 5). Two studies highlighted equitable findings and two more mixed or non-significant results (7.5%, n = 2 each). One study focused on racial-ethnic differences in Cape Town, South Africa, finding that White residents have significantly more green space area per capita over Black residents [85]. The classification of these studies based on the type of green space quantity they measure sheds additional light on the consistent pattern of inequity. In particular, strong inequities emerged in studies focusing on green space area per capita (87%, n = 13), green space numbers per capita (100%, n = 3), green space area per area (100%, n = 4), and green space number (100%, n = 2). More mixed findings were highlighted in articles focusing on green space area, a more coarse measurement of quantity [42] (Table 5). Chi-squared tests showed non-significant results (χ2 = 4.3307, df = 8, p = 0.8261), suggesting that inequities did not vary based on the type of quantity measured.
3.3.3. Green Space Quality
Studies on quality highlighted a general pattern of inequity, but less consistently than for proximity and quantity (Table 6). Most studies found that high-SES people have higher quality green spaces (inequity, 65%, n = 11), followed by studies highlighting mixed or non-significant findings (29%, n = 5) and studies uncovering that low-SES people are advantaged (equity, 6%, n = 1). The only study focusing on racial-ethnic differences found that, in Karachi, Pakistan, Pathan women felt safer in women-only-parks than Mohajir women [79]; however, the author did not discuss whether one of these ethnic groups is more advantaged in Pakistani society than the other one.
The breakdown into different types of green space quality provides more clarity about our findings. Consistent inequities were found for access to best green spaces (100%, n = 5), maintenance and safety (80%, n = 4), and green space amenities (100%, n = 2). This result suggests that high-SES groups have better access to their city’s largest parks, which include the broadest variety of amenities, and that parks in high-SES areas are in better conditions and safer than those in low-SES areas. Interestingly, only two sampled studies used the number of amenities to operationalize green space quality. None of these studies utilized well-known green space quality tools developed by researchers in the Global North that are mostly based on the number and types of amenities [108,109,110]. Findings are more mixed for green space satisfaction and aesthetics, as half of the studies found inequities and the other half highlighted equal satisfaction between different SES groups. Finally, studies that operationalized quality as green space compactness through landscape ecology metrics showed contrasting findings.
Results of chi-squared tests were significant (χ2 = 16.142, df = 8, p = 0.0403). This showed that, depending on how quality is measured, results vary between inequity, equity, and mixed. The expected number of findings for satisfaction and aesthetic measures was 6 for inequity, 0 for equity, and 2 for mixed/null. These values were significantly different from the observed values reported in Table 6 (4, 0, and 4). Another measure with significantly different values was green space compactness. The expected values were 2 (inequity), 0 (equity), and 0 (mixed), which also contrasted with the observed values (1 for inequity, 1 for equity, and 0 for mixed; see Table 6). That results vary significantly based on the type of quality measured is not surprising, as green space quality includes more diverse sets of variables than proximity and quantity.
3.3.4. Variations by SES Type and Unit of Analysis
The results reported in the previous sections varied by the type of SES measured and the unit of analysis used. For SES type, chi-squared tests showed more mixed findings for green space proximity when using income or occupation as the SES measure than expected, as well as fewer mixed findings for park proximity when using housing price as the SES measure than expected (χ2 = 22, df = 8, p = 0.006). Additionally, chi-squared tests highlighted higher-than-expected numbers of findings showing inequities in green space quantity when using income as the SES measure, as well as higher-than-expected numbers of mixed findings for green space quantity when using income as the SES measure (χ2 = 26, df = 8, p = 0.001). We found no significant differences between observed and expected counts for green space quality and SES measures (χ2 = 7.8, df = 8, p = 0.5). These findings suggest that using income as an SES variable might lead to unexpectedly high numbers of mixed findings for green space proximity and inequity findings for green space quantity.
For differences based on the unit of analysis, chi-squared tests showed fewer inequity findings in green space quantity when using districts as the unit of analysis than expected and more equity findings in green space quantity when using district as the unit of analysis than expected (χ2 = 30, df = 10, p < 0.001). As districts are large units of analysis (incorporating several neighborhoods), these findings suggest that studies using larger geographies might find fewer-than-expected inequities in green space quantity. For green space proximity and quality, the cell counts were too small to perform chi-squared significant tests.
3.4. Results: Do Inequities in the Global South Vary Based on Geography?
Chi-squared tests showed that inequities for green space proximity, quantity and quality did not vary by continent. For proximity, χ2 = 6.57, df = 4, p = 0.16; for quantity, χ2 = 3.906, df = 4, p = 0.6721; and for quality, χ2 = 2.9673, df = 4, p = 0.5633. Table 7 shows the observed and expected values for the number of studies that found inequity, equity, or mixed/null findings. This means that findings on access to green space do not significantly vary between different continents in the Global South. Yet all the studies that found equitable green space provision (for proximity, quantity, and quality) were conducted in Asian countries. In other words, in our sample, no studies in Africa and Latin America uncovered equitable access to urban green spaces. This finding and the lack of significant variations by continent can be attributed, at least in part, to the relatively small sample size of studies in Africa (n = 6) and Latin America (n = 8).
A few studies exemplify the trends displayed in Table 4, Table 5, Table 6 and Table 7. For proximity, studies in six Chinese cities (e.g., Shanghai, Beijing, Zhongshan, Shenzhen, Wuhan, Macau) showed that high-SES people tend to live closer to urban green spaces than low-SES people, with effect sizes ranging from large to very small [74,81,82,91,92,94,95,97,98,100,101,103,104]. Depending on the methods and sample size, studies focusing on the same city found contrasting results. For example, a study on the central neighborhoods of Teheran, Iran found that low-SES people live in closer proximity to green spaces than more affluent residents [83], while an investigation on the entire metropolitan area of Teheran showed the opposite [84]. Contrasting results also emerged for Shanghai, with more studies finding inequity for green space proximity [81,82,91,98] than equity [99]. Three studies in Latin American cities (Santiago de Chile; Hermosillo, Mexico; Bogotá, Colombia) [18,38,80], and three other studies in African cities (Cairo, Egypt; Cape Town, South Africa) [21,86,96] found that high-SES people live closer to parks than low-SES people.
For quantity, studies in Chinese cities show more cases of inequity—high-SES people have higher quantities of green space than low-SES [75,76,78,81,93,95,98,99,102,104]—than equity [12,82] or mixed findings [45,74]. Studies in other Asian cities such as Sheikhupura, Pakistan [69], Tehran, Iran [71,84], and Hamadan, Iran [46] also found inequitable results for green space quantity. All sampled articles that measured quantity in Latin America [18,20,72,73] and Africa [21,77,85,89,96] discovered inequities. Effect sizes for inequities were particularly large in some studies that measured green space area per capita [21,73,85].
For quality, more investigations in Chinese cities found inequitable outcomes [25,81,101,105] than equitable [104] and mixed findings [90]. In particular, studies found that, compared to low-SES people, high-SES people have higher green space satisfaction and perceptions of maintenance and safety in Guangzhou [25], more compact green spaces in Shanghai [81], access to larger green spaces in Shenzhen (in this paper, identified as best green spaces) [101], and higher green space satisfaction in Beijing [105]. Findings in cities in other Asian countries are mixed: One study in Tehran, Iran found inequities for maintenance and best green spaces [71], but three other studies in Dehli, India and Karachi, Pakistan uncovered mixed findings for satisfaction and safety [23,79,87]. In Latin America, more studies found inequities for green space quality—amenities in Curitiba, Brazil [20]; best green spaces in Santa Cruz Bolivia and Buenos Aires, Argentina [47,72]—than mixed findings—green space satisfaction in Bogotá, Colombia [38]. Finally, all sampled studies in Africa uncovered inequities for quality, including best green spaces, satisfaction, amenities, and maintenance and safety [77,89,96].
4. Discussion
In this paper, we analyzed the growing body of literature that has examined SES and racial-ethnic disparities in access to urban green spaces in cities of the Global South. Based on a sample of 46 peer-reviewed empirical articles, we conclude that there is a notable pattern of inequity in the distribution of urban green spaces. We categorized these findings into green space proximity, quantity, and quality to compare results for Global South cities with those of Global North cities [42]. We found that, in developing countries, high-SES people live in closer proximity to green spaces, have access to higher quantities of green spaces, and have higher quality green spaces than low-SES people. The most consistent inequities were for green space quantity, followed by proximity and quality.
These findings partially confirm those in Global North cities. In both contexts, the strongest inequities are for green space quantity; findings for green space proximity are more equitable in the Global North than in the Global South; and findings for green space quality are strongly inequitable in the Global North and still inequitable but with more nuances in the Global South [42]. Some specific findings for green space quantity in the Global South reflect trends seen in the Global North. First, privately owned collective green spaces (e.g., shared areas in residential communities) contribute to inequities in green space quantity [98,99], and this finding was also uncovered in Global North cities [116]. Second, all the studies using cities as units of analysis (all in China) found inequities for green space quantity [75,76,93], a finding that also emerged in a recent study of cities in the United States [117].
Differences in the spatial structure and demographic distributions of SES and racial-ethnic groups in Global North and Global South cities can shed light on the uneven results for green space proximity. In particular, in U.S. cities, low-SES people have traditionally lived in the urban core [42,43,44,59]. Such areas tend to have several small green spaces, which create good walking access to parks (proximity) but provide low coverage of green space (quantity) [42,43,44,59]. In the U.S., many high-SES people live in less central suburban areas of cities, where green spaces are less diffused but significantly larger [42,43,44,59]. Thus, low-SES people tend to have good access in terms of proximity, while high-SES people have higher quantities of green space than low-SES people [42]. Many Global South cities do not have the same spatial and demographic patterns, also due to rapid urbanization in recent years, especially at the urban periphery [25,38,88], and the presence of informal settlements [20]. Indeed, some studies have noted that, in Chinese cities such as Shenzhen, many low-income and green space deprived neighborhoods are located on the outskirts [95,101,104].
The partially inconsistent findings for green space quality between the Global North and Global South are likely the result of different types of green space quality measurements. Most studies focusing on quality included in Rigolon’s review of Global North inequalities used objective measures of green space quality, such as counts of amenities in GIS analyses and systematic observations of green space maintenance levels conducted by trained researchers [42]. In this review of Global South inequalities, many studies of green space quality relied on subjective measures such as green space satisfaction measured through resident surveys [23,25,38,79,87,89,90,96,105]. As such, subjective measures of green space quality may have returned different results than objective measures.
Another important difference between Global North studies and Global South studies is that very few of the latter studies analyzed racial-ethnic inequalities in the provision of urban green spaces. In Rigolon’s review of articles focusing on Global North cities, which is predominantly based on articles centering on the United States, 61% of the sampled studies analyzed racial-ethnic differences in access to green spaces [42], compared to only 13% in this review. This difference suggests that race and ethnicity might not be as relevant to describe disadvantage in the Global South as they are in the United States, where the long history of racial discrimination has led to today’s inequities in access to green space [43,118]. Similarly, a few authors of studies on South Africa attributed the observed inequities in green space provision to the legacy of apartheid policies, which, until the early 1990s, enforced the segregation of White and Black individuals [77,89,96].
The second research question guiding this systematic review asked whether inequities in green space provision varied based on geographic context. We found that, based on the sampled articles, inequities in access to urban green spaces do not significantly vary based on the continent. In other words, inequities in proximity, quantity, and quality are relatively similar in cities located in Africa, Asia, and Latin America.
4.1. Implications
The findings of this systematic review have significant implications for urban planning and public health. Cities in the Global South experiencing extreme urbanization rates and very high population densities have struggled to plan for urban green spaces adequately [20,72,98]. The authors of the studies we reviewed have proposed some strategies to start addressing the inequities they uncovered. Some authors note that the introduction of green space standards in China in 1994, which involved providing equal access to green space for all residents for new developments, might have contributed to decreasing inequities [104,105]. Other authors suggest that urban planners and city officials could use their study’s findings to identify low-SES, green space deprived areas and build more green spaces in such areas [46,81,82,83,91,95,104]. Yet this would require that elected officials had the political will and support to invest in low-SES areas. Other authors argue that institutional and policy changes that overturn the roots of inequities are necessary [73] and that such efforts should include participatory planning processes that include residents’ needs [25,90]. In addition, some authors note that, due to high residential densities and urbanization rates, some Global South cities should focus on building small, walkable parks [20,103] and on transforming unused vacant land [88,119] rather than seeking to build large urban green spaces. Finally, several authors have argued that, in order to address inequities in green space quality, cities should retrofit existing parks by adding new amenities and improving maintenance [21,47,96].
This review also informs how green space may relate to public health concerns in Global South countries, where, due to increasing urbanization [39], such challenges are multifaceted and complex. These concerns have been in part attributed to environmental stressors [39] resulting from inadequate environmental regulation and policy [120]. In particular, air pollution is of extreme concern in Global South cities [121], and studies found that it is linked to cardiovascular and respiratory-related mortality [122], poor maternal outcomes [123], cancer rates and immune system dysfunctions [124]. Increasing the proximity and quantity of green spaces, particularly in low-SES neighborhoods where current green space provision is low, can mitigate these effects by filtering polluted air and improve residents’ health [125].
Other dimensions of green space also matter for public health in Global South contexts. In some cultures, barriers to exercising in green spaces include religious motives and customs; for example, Muslims have to pray five times per day, and this might limit their opportunities for recreation in green spaces if the latter do not include spaces for prayer [84]. Thus, to implement obesity reduction programs, cities should design green spaces to accommodate religious beliefs, for example, by including spaces for prayer in Muslim majority cities. Further, establishing or improving small green spaces [20,103], also by transforming unused vacant lots [88,119], can bring significant health benefits. Indeed, small green spaces that are designed to meet resident’s aesthetic preferences may provide as much psychological restoration, which improves psychological well-being and reduces stress [126], as larger green spaces [39]. In addition, when low-SES neighborhoods contain small green spaces, such green spaces might be impractical for use due to poor maintenance; thus, improved green space maintenance may increase use, perceived aesthetics, and their health benefits [39]. Ultimately, the findings of this review suggest that increased green space proximity, quantity, and quality could translate to public health benefits in Global South cities if all SES groups had equal access to it.
4.2. Limitations and Future Research
This paper has some limitations that future empirical and review articles can help address. First, our search only included journal articles published in English, thus excluding peer-reviewed papers written in other languages and other scholarly sources (e.g., book chapters and dissertations). Thus, our findings are based on a sample of a possibly larger body of literature, which might include studies focusing on countries in Africa, Asia, and Latin America that were not represented in this review. Future systematic reviews could expand our sample by focusing on articles published in languages that are more commonly used in parts of Africa (e.g., French), Asia (e.g., Mandarin), and South America (e.g., Spanish) and by using different inclusion criteria (e.g., by incorporating qualitative studies). Second, we included studies that only reported descriptive statistics and did not conduct inferential statistics. As noted, we made this decision because, due to data limitations in Global South contexts [47,71,72,73,74], some studies have relatively small n sizes and therefore could not run inferential statistical tests. Still, interpreting the results of studies that only relied on descriptive statistics was harder; as such, three of the authors in this review cross-checked such results. As more data on green space and demographics become available in Global South cities, the studies in this review that suffer from data limitations could be replicated with larger n sizes and more sophisticated statistical techniques. Third, we did not explicitly study the policy and historical explanations for inequities in green space provision. Further understanding the historical, political, and environmental reasons why green space provision varies in cities across the world would help inform planning and environmental management.
Future research could also uncover whether, in Global South cities, the streets in proximity to urban green spaces are safe and convenient for pedestrians and cyclists. This is particularly important because one study in the Global South found that having a pleasant route to green spaces was a strong predictor of perceived access to green spaces [94] and another study in the Global North showed SES and racial-ethnic inequities in the walkability of routes to parks [127]. Finally, while informal green spaces such as greened vacant lots are the object of increasing investigation in Global North cities [128], in our review, we did not identify studies on the provision of informal green space. Although this lack of studies could be attributed to limited amounts of vacant land in Global South cities compared to shrinking cities of the Global North, future investigations could uncover the provision and use of informal green spaces in unplanned urban settlements.
5. Conclusions
This systematic review contributes to the environmental justice literature on urban green space in at least four ways. First, we found that cities of the Global South, on average, experience inequities in green space proximity, quantity, and quality. Second, we confirmed the utility of categorizing access to urban green space into proximity, quantity, and quality [42]. This framework allowed us to uncover differentials in green space inequities: High-SES people experience more consistent advantages for quantity (85% of cases) than for proximity (74% of cases) and quality (65% of cases). Third, we identified similarities and differences in green space inequities between Global South and Global North cities [42]. Inequities for green space quantity are consistent in the two contexts; inequities for quality are more frequent in Global North than in Global South cities; and inequities for proximity are more common in Global South than in Global North cities. Fourth, we found that, within the Global South, inequities for green space proximity, quantity, and quantity do not significantly vary based on the continent. This suggests that environmental justice issues in the provision of urban green spaces have some commonalities across countries of the Global South.
Overall, this review portrays a bleak picture for environmental justice. Across many cities of the Global South, on average, low-SES people have access to fewer and smaller parks, live further from parks, and have parks with lower quality than high-SES people. Yet some studies highlighted that, in a few cities, low-SES residents are as well served (equality) or more served (equity) by green spaces than high-SES residents [12,45,74]. Studying the reasons for equal and equitable green space provision can help researchers, urban planners, and elected officials identify ways forward for environmental justice in Global South cities.
Author Contributions
A.R. and M.B. conceived and designed the review; K.L. and S.S. performed the title and abstract screening; K.L., S.S., and A.R. performed the full-text screening; A.R., K.L., and S.S. analyzed the sampled articles; M.B. conducted the inferential statistics; A.R. and M.B. wrote the paper.
Funding
This research was funded by start-up funds for Alessandro Rigolon from the College of Applied Health Sciences and the Department of Recreation, Sport and Tourism at the University of Illinois at Urbana-Champaign.
Acknowledgments
The authors would like to thank the four anonymous reviewers for their comments and Viniece Jennings for her input on an early version of the manuscript.
Conflicts of Interest
The authors declare no conflicts of interest.
Appendix A

Table A1.
Search expressions for Scopus and Web of Science.
| Keywords | |
|---|---|
| Search expression | (greenspace * OR “green space*” OR “green area*” OR “open space*” OR “urban park*” OR park* OR “neighborhood amenit*”) AND (“park use*” OR access* OR “accessibility” OR “distribution” OR “provision” OR equit* OR inequ* OR differenc* OR disparit* OR “spatial pattern*” OR benefit* OR disadvantage* OR “socioeconomic” OR “socio-economic” OR “income”) and (“Global South” OR “Developing countr*” OR “Developing world” OR Chin* OR Iran* OR India* OR Pakistan* OR Bangladesh* OR Indonesia* OR Vietnam* OR Philippin* OR Mexic* OR Brazil* OR Chile* OR Colombia* OR Argentin* OR Peru* OR Venezuela* OR Ecuador* OR Guatemala* OR Cuba* OR Nigeria * OR Ethiopia * OR Egypt * OR Congo* OR “South Africa*” OR Tanzania* OR Kenya* OR Sudan* OR Algeria* OR Uganda* OR Ghana* OR “Shanghai” OR “Jakarta” OR “Delhi” OR “Guangzhou” OR “Beijing” OR “Manila” OR “Mumbai” OR “Shenzhen” OR “São Paulo” OR “Mexico City” OR “Lagos” OR “Cairo” OR “Wuhan” OR “Dhaka” OR “Chengdu” OR “Chongqing” OR “Karachi” OR “Bangkok” OR “Tianjin” OR “Kolkata” OR “Buenos Aires” OR “Tehran” OR “Hangzhou” OR “Rio de Janeiro” OR “Xi’an” OR “Changzhou” OR “Bangalore” OR “Lahore” OR “Shantou” OR “Kinshasa” OR “Nanjing” OR “Jinan” OR “Harbin” OR “Chennai” OR “Bogotá” OR “Lima”) |
Note: The asterisk (*) is wildcard character that expands the search by identifying words that start with the same letters. For example, “Chin*” will yield words such as “China” and “Chinese.”
Table A2.
Additional conditions for searches in Scopus and Web of Science.
| Database | Conditions |
|---|---|
| Scopus | (LIMIT-TO (SRCTYPE, “j“)) AND (LIMIT-TO (PUBYEAR, 2018) OR LIMIT-TO (PUBYEAR, 2017) OR LIMIT-TO (PUBYEAR, 2016) OR LIMIT-TO (PUBYEAR, 2015) OR LIMIT-TO (PUBYEAR, 2014) OR LIMIT-TO (PUBYEAR, 2013) OR LIMIT-TO (PUBYEAR, 2012) OR LIMIT-TO (PUBYEAR, 2011) OR LIMIT-TO (PUBYEAR, 2010) OR LIMIT-TO (PUBYEAR, 2009)) AND (LIMIT-TO (LANGUAGE, “English“)) AND (EXCLUDE (DOCTYPE, “cp”)). |
| Web of Science | LANGUAGE: (English) AND DOCUMENT TYPES: (Article). Refined by: (excluding) WEB OF SCIENCE CATEGORIES: (PALEONTOLOGY OR FOOD SCIENCE TECHNOLOGY OR METEOROLOGY ATMOSPHERIC SCIENCES OR CHEMISTRY MEDICINAL OR ZOOLOGY OR GENETICS HEREDITY OR BIODIVERSITY CONSERVATION OR CELL BIOLOGY OR PHARMACOLOGY PHARMACY OR PHYSIOLOGY OR PLANT SCIENCES OR PSYCHIATRY OR GERONTOLOGY OR IMAGING SCIENCE PHOTOGRAPHIC TECHNOLOGY OR HEALTH CARE SCIENCES SERVICES OR ENGINEERING CHEMICAL OR NEUROSCIENCES OR AGRONOMY OR LIMNOLOGY OR CLINICAL NEUROLOGY OR BIOCHEMISTRY MOLECULAR BIOLOGY OR MICROBIOLOGY OR CHEMISTRY ANALYTICAL OR AGRICULTURE MULTIDISCIPLINARY OR ENDOCRINOLOGY METABOLISM OR GEOCHEMISTRY GEOPHYSICS OR MARINE FRESHWATER BIOLOGY OR INFECTIOUS DISEASES OR HORTICULTURE OR GREEN SUSTAINABLE SCIENCE TECHNOLOGY OR ENERGY FUELS OR PSYCHOLOGY MULTIDISCIPLINARY OR PUBLIC ENVIRONMENTAL OCCUPATIONAL HEALTH OR FISHERIES OR ASTRONOMY ASTROPHYSICS OR SOIL SCIENCE OR TROPICAL MEDICINE OR EDUCATION EDUCATIONAL RESEARCH OR BIOLOGY OR GERIATRICS GERONTOLOGY OR IMMUNOLOGY OR VETERINARY SCIENCES OR INTEGRATIVE COMPLEMENTARY MEDICINE OR OPHTHALMOLOGY OR TOXICOLOGY OR PATHOLOGY OR VIROLOGY OR CONSTRUCTION BUILDING TECHNOLOGY OR BIOPHYSICS OR MYCOLOGY OR ENTOMOLOGY OR REHABILITATION OR ENGINEERING ELECTRICAL ELECTRONIC OR MEDICINE RESEARCH EXPERIMENTAL OR PARASITOLOGY OR THERMODYNAMICS OR BIOTECHNOLOGY APPLIED MICROBIOLOGY OR AGRICULTURAL ENGINEERING OR EVOLUTIONARY BIOLOGY OR CHEMISTRY MULTIDISCIPLINARY OR ORNITHOLOGY OR GEOLOGY OR ENGINEERING GEOLOGICAL OR OCEANOGRAPHY OR BUSINESS OR HISTORY OR ENGINEERING CIVIL OR ARCHAEOLOGY OR MEDICINE GENERAL INTERNAL). Timespan: 2009–2018. Indexes: SCI-EXPANDED, SSCI, A & HCI, CPCI-S, CPCI-SSH, BKCI-S, BKCI-SSH, ESCI, CCR-EXPANDED, IC. |
References
- Shin, H.B.; Lees, L.; López-Morales, E. Introduction: Locating gentrification in the Global East. Urban Stud. 2016, 53, 455–470. [Google Scholar] [CrossRef] [Green Version]
- Lees, L.; Shin, H.B.; López-Morales, E. Planetary Gentrification; Polity Press: Cambridge, UK, 2016. [Google Scholar]
- Redclift, M.; Sage, C. Global environmental change and global inequality: North/South perspectives. Int. Sociol. 1998, 13, 499–516. [Google Scholar] [CrossRef]
- Miraftab, F.; Kudva, N. Cities of the Global South Reader; Routledge: New York, NY, USA, 2015. [Google Scholar]
- Bhan, G.; Srinivas, S.; Watson, V. The Routledge Companion to Planning in the Global South; Routledge: New York, NY, USA, 2018; ISBN 9781138932814. [Google Scholar]
- United Nations. Global Issues Overview. Available online: http://www.un.org/en/sections/issues-depth/global-issues-overview/ (accessed on 19 April 2018).
- Shatkin, G. Global cities of the South: Emerging perspectives on growth and inequality. Cities 2007, 24, 1–15. [Google Scholar] [CrossRef]
- United Nations. The World’s Cities in 2016: Data Booklet; United Nations: New York, NY, USA, 2016; ISBN 978-92-1-151549-7. [Google Scholar]
- Miraftab, F. Insurgent planning: Situating radical planning in the Global South. Plan. Theory 2009, 8, 32–50. [Google Scholar] [CrossRef]
- Dupont, V.; Jordhus-Lier, D.; Sutherland, C.; Braathen, E. The Politics of Slums in the Global South: Urban Informality in Brazil, India, South Africa and Peru; Routledge: New York, NY, USA, 2016. [Google Scholar]
- World Health Organization. Air Pollution Levels Rising in Many of the World’s Poorest Cities. Available online: http://www.who.int/mediacentre/news/releases/2016/air-pollution-rising/en/ (accessed on 20 April 2018).
- Xiao, Y.; Wang, Z.; Li, Z.; Tang, Z. An assessment of urban park access in Shanghai–Implications for the social equity in urban China. Landsc. Urban Plan. 2017, 157, 383–393. [Google Scholar] [CrossRef]
- Leichenko, R.M.; Solecki, W.D. Consumption, inequity, and environmental justice: The making of new metropolitan landscapes in developing countries. Soc. Nat. Resour. 2008, 21, 611–624. [Google Scholar] [CrossRef]
- Agyeman, J.; Schlosberg, D.; Craven, L.; Matthews, C. Trends and directions in environmental justice: From inequity to everyday life, community, and just sustainabilities. Annu. Rev. Environ. Resour. 2016, 41, 321–340. [Google Scholar] [CrossRef]
- Ikeme, J. Equity, environmental justice and sustainability: Incomplete approaches in climate change politics. Glob. Environ. Chang. 2003, 13, 195–206. [Google Scholar] [CrossRef]
- Chakraborty, J. Focus on environmental justice: New directions in international research. Environ. Res. Lett. 2017, 12, 1–4. [Google Scholar] [CrossRef]
- Holifield, R.; Chakraborty, J.; Walker, G. The Routledge Handbook of Environmental Justice; Routledge: New York, NY, USA, 2018. [Google Scholar]
- Lara-Valencia, F.; García-Pérez, H. Space for equity: Socioeconomic variations in the provision of public parks in Hermosillo, Mexico. Local Environ. 2015, 20, 350–368. [Google Scholar] [CrossRef]
- Dadashpoor, H.; Rostami, F. Measuring spatial proportionality between service availability, accessibility and mobility: Empirical evidence using spatial equity approach in Iran. J. Transp. Geogr. 2017, 65, 44–55. [Google Scholar] [CrossRef]
- Macedo, J.; Haddad, M.A. Equitable distribution of open space: Using spatial analysis to evaluate urban parks in Curitiba, Brazil. Environ. Plan. B Plan. Des. 2016, 43, 1096–1117. [Google Scholar] [CrossRef]
- Willemse, L. A flowmap–geographic information systems approach to determine community neighbourhood park proximity in Cape Town. S. Afr. Geogr. J. 2013, 95, 149–164. [Google Scholar] [CrossRef]
- Liu, H.; Li, F.; Li, J.; Zhang, Y. The relationships between urban parks, residents’ physical activity, and mental health benefits: A case study from Beijing, China. J. Environ. Manag. 2017, 190, 223–230. [Google Scholar] [CrossRef] [PubMed]
- Paul, S.; Nagendra, H. Factors influencing perceptions and use of urban nature: Surveys of park visitors in Delhi. Land 2017, 6, 27. [Google Scholar] [CrossRef]
- Zhang, B.; Xie, G.; Zhang, C.; Zhang, J. The economic benefits of rainwater-runoff reduction by urban green spaces: A case study in Beijing, China. J. Environ. Manag. 2012, 100, 65–71. [Google Scholar] [CrossRef] [PubMed]
- Jim, C.Y.; Shan, X. Socioeconomic effect on perception of urban green spaces in Guangzhou, China. Cities 2013, 31, 123–131. [Google Scholar] [CrossRef]
- Shan, X.Z. The socio-demographic and spatial dynamics of green space use in Guangzhou, China. Appl. Geogr. 2014, 51, 26–34. [Google Scholar] [CrossRef]
- Maruthaveeran, S. Establishing performance indicators from the user perspective as tools to evaluate the safety aspects of urban parks in Kuala Lumpur. Pertanika J. Soc. Sci. Humanit. 2010, 18, 199–207. [Google Scholar]
- Hussain, G.; Nadeem, M.; Younis, A.; Riaz, A.; Khan, M.A.; Naveed, S. Impact of public parks on human life: A case study. Pak. J. Agric. Sci. 2010, 47, 225–230. [Google Scholar]
- Brill, G.; Anderson, P.; O’Farrell, P. Urban national parks in the global South: Linking management perceptions, policies and practices to water-related ecosystem services. Ecosyst. Serv. 2017, 28, 185–195. [Google Scholar] [CrossRef]
- Kondo, M.C.; Fluehr, J.M.; McKeon, T.; Branas, C.C. Urban green space and its impact on human health. Int. J. Environ. Res. Public Health 2018, 15, 445. [Google Scholar] [CrossRef] [PubMed]
- Lee, A.C.K.; Maheswaran, R. The health benefits of urban green spaces: A review of the evidence. J. Public Health (Bangkok) 2011, 33, 212–222. [Google Scholar] [CrossRef] [PubMed]
- Konijnendijk, C.C.; Annerstedt, M.; Nielsen, A.B.; Maruthaveeran, S. Benefits of Urban Parks: A Systematic Review; International Federation of Parks and Recreation Administration: Copenhagen, Denmark, 2013. [Google Scholar]
- Wolch, J.R.; Byrne, J.; Newell, J.P. Urban green space, public health, and environmental justice: The challenge of making cities “just green enough”. Landsc. Urban Plan. 2014, 125, 234–244. [Google Scholar] [CrossRef]
- Browning, M.H.E.M.; Rigolon, A. Do income, race and ethnicity, and sprawl influence the greenspace-human health link in city-level analyses? Findings from 496 cities in the United States. Int. J. Environ. Res. Public Health 2018, 15, 1541. [Google Scholar] [CrossRef] [PubMed]
- Schetke, S.; Qureshi, S.; Lautenbach, S.; Kabisch, N. What determines the use of urban green spaces in highly urbanized areas?—Examples from two fast growing Asian cities. Urban For. Urban Green. 2016, 16, 150–159. [Google Scholar] [CrossRef]
- Shan, X.Z. Socio-demographic variation in motives for visiting urban green spaces in a large Chinese city. Habitat Int. 2014, 41, 114–120. [Google Scholar] [CrossRef]
- Ambrey, C.L.; Shahni, T.J. Greenspace and wellbeing in Tehran: A relationship conditional on a neighbourhood’s crime rate? Urban For. Urban Green. 2017, 27, 155–161. [Google Scholar] [CrossRef]
- Scopelliti, M.; Carrus, G.; Adinolfi, C.; Suarez, G.; Colangelo, G.; Lafortezza, R.; Panno, A.; Sanesi, G. Staying in touch with nature and well-being in different income groups: The experience of urban parks in Bogotá. Landsc. Urban Plan. 2016, 148, 139–148. [Google Scholar] [CrossRef]
- Camargo, D.M.; Ramírez, P.C.; Fermino, R.C. Individual and environmental correlates to quality of life in park users in Colombia. Int. J. Environ. Res. Public Health 2017, 14, 1250. [Google Scholar] [CrossRef] [PubMed]
- Keune, H.; Kretsch, C.; De Blust, G.; Gilbert, M.; Flandroy, L.; Van Den Berge, K.; Versteirt, V.; Hartig, T.; De Keersmaecker, L.; Eggermont, H.; et al. Science-policy challenges for biodiversity, public health and urbanization: Examples from Belgium. Environ. Res. Lett. 2013, 8. [Google Scholar] [CrossRef]
- Tomalak, M.; Rossi, E.; Ferrini, F.; Moro, P.A. Negative aspects and hazardous effects of forest environment on human health. In Forests, Trees and Human Health; Nilsson, K., Sangster, M., Gallis, C., Harting, T., de Vries, S., Seeland, K., Schipperijn, J., Eds.; Springer: New York, NY, USA, 2011; pp. 77–124. ISBN 9789048198054. [Google Scholar]
- Rigolon, A. A complex landscape of inequity in access to urban parks: A literature review. Landsc. Urban Plan. 2016, 153, 160–169. [Google Scholar] [CrossRef]
- Boone, C.G.; Buckley, G.L.; Grove, J.M.; Sister, C. Parks and people: An environmental justice inquiry in Baltimore, Maryland. Ann. Assoc. Am. Geogr. 2009, 99, 767–787. [Google Scholar] [CrossRef]
- Wolch, J.R.; Wilson, J.P.; Fehrenbach, J. Parks and park funding in Los Angeles: An equity-mapping analysis. Urban Geogr. 2005, 26, 4–35. [Google Scholar] [CrossRef]
- Wei, F. Greener urbanization? Changing accessibility to parks in China. Landsc. Urban Plan. 2017, 157, 542–552. [Google Scholar] [CrossRef]
- Dadashpoor, H.; Rostami, F.; Alizadeh, B. Is inequality in the distribution of urban facilities inequitable? Exploring a method for identifying spatial inequity in an Iranian city. Cities 2016, 52, 159–172. [Google Scholar] [CrossRef]
- Wright Wendel, H.E.; Zarger, R.K.; Mihelcic, J.R. Accessibility and usability: Green space preferences, perceptions, and barriers in a rapidly urbanizing city in Latin America. Landsc. Urban Plan. 2012, 107, 272–282. [Google Scholar] [CrossRef]
- Ouyang, W.; Wang, B.; Tian, L.; Niu, X. Spatial deprivation of urban public services in migrant enclaves under the context of a rapidly urbanizing China: An evaluation based on suburban Shanghai. Cities 2017, 60, 436–445. [Google Scholar] [CrossRef]
- Li, Z.; Wu, F. Residential satisfaction in China’s informal settlements: A case study of Beijing, Shanghai, and Guangzhou. Urban Geogr. 2013, 34, 923–949. [Google Scholar] [CrossRef]
- Breuste, J.; Rahimi, A. Many public urban parks, but who profits from them? The example of Tabriz, Iran. Ecol. Process. 2015, 4, 6. [Google Scholar] [CrossRef]
- Rumbach, A. Do new towns increase disaster risk? Evidence from Kolkata, India. Habitat Int. 2014, 43, 117–124. [Google Scholar] [CrossRef]
- World Health Organization. Global Health Observatory (GHO) Data: Life Expectancy. Available online: http://www.who.int/gho/mortality_burden_disease/life_tables/situation_trends_text/en/ (accessed on 29 May 2018).
- Browning, M.; Lee, K. Within what distance does “greenness” best predict physical health? A systematic review of articles with GIS buffer analyses across the lifespan. Int. J. Environ. Res. Public Health 2017, 14, 675. [Google Scholar] [CrossRef] [PubMed]
- Fong, K.C.; Hart, J.E.; James, P. A review of epidemiologic studies on greenness and health: Updated literature through 2017. Curr. Environ. Heal. Rep. 2018, 77–87. [Google Scholar] [CrossRef] [PubMed]
- James, P.; Banay, R.F.; Hart, J.E.; Laden, F. A review of the health benefits of greenness. Curr. Epidemiol. Rep. 2015, 2, 131–142. [Google Scholar] [CrossRef] [PubMed]
- Moher, D.; Liberati, A.; Tetzlaff, J.; Altman, D.G.; Altman, D.; Antes, G.; Atkins, D.; Barbour, V.; Barrowman, N.; Berlin, J.A.; et al. Preferred reporting items for systematic reviews and meta-analyses: The PRISMA statement. PLoS Med. 2009, 6. [Google Scholar] [CrossRef] [PubMed]
- Taylor, L.; Hochuli, D.F. Defining greenspace: Multiple uses across multiple disciplines. Landsc. Urban Plan. 2017, 158, 25–38. [Google Scholar] [CrossRef]
- Wan, C.; Shen, G.Q. Salient attributes of urban green spaces in high density cities: The case of Hong Kong. Habitat Int. 2015, 49, 92–99. [Google Scholar] [CrossRef]
- Rigolon, A. Parks and young people: An environmental justice study of park proximity, acreage, and quality in Denver, Colorado. Landsc. Urban Plan. 2017, 165, 73–83. [Google Scholar] [CrossRef]
- Hoffimann, E.; Barros, H.; Ribeiro, A. Socioeconomic inequalities in green space quality and accessibility—Evidence from a Southern European city. Int. J. Environ. Res. Public Health 2017, 14, 916. [Google Scholar] [CrossRef] [PubMed]
- Kabisch, N.; Strohbach, M.; Haase, D.; Kronenberg, J. Urban green space availability in European cities. Ecol. Indic. 2016, 70, 586–596. [Google Scholar] [CrossRef]
- Mimiko, N.O. Globalization: The Politics of Global Economic Relations and International Business; Carolina Academic Press: Durham, NC, USA, 2012; ISBN 9781611631296. [Google Scholar]
- United Nations. World Economic Situation and Prospects 2018; United Nations: New York, NY, USA, 2018; ISBN 9789211091779. [Google Scholar]
- The Organisation for Economic Co-operation and Development (OECD). Redefining “Urban”: A New Way to Measure Metropolitan Areas; OECD Publishing: Paris, France, 2012; ISBN 9789264174054. [Google Scholar]
- Wang, Z.; Brito, J.P.; Tsapas, A.; Griebeler, M.L.; Alahdab, F.; Murad, M.H. Systematic reviews with language restrictions and no author contact have lower overall credibility: A methodology study. Clin. Epidemiol. 2015, 7, 243–247. [Google Scholar] [CrossRef] [PubMed]
- The World Bank Data: Population, Total. Available online: https://data.worldbank.org/indicator/SP.POP.TOTL (accessed on 30 May 2018).
- Zhang, J.; Yu, Q.; Zheng, F.; Long, C.; Lu, Z.; Duan, Z. Comparing Keywords Plus of WOS and author keywords: A case study of patient adherence research. J. Assoc. Inf. Sci. Technol. 2015, 67, 967–972. [Google Scholar] [CrossRef]
- Rigolon, A.; Flohr, T.L. Access to parks for youth as an environmental justice issue: Access inequalities and possible solutions. Buildings 2014, 4, 69–94. [Google Scholar] [CrossRef]
- Arshad, H.S.H.; Routray, J.K. From socioeconomic disparity to environmental injustice: The relationship between housing unit density and community green space in a medium city in Pakistan. Local Environ. 2018, 23, 536–548. [Google Scholar] [CrossRef]
- Galobardes, B.; Shaw, M.; Lawlor, D.A.; Lynch, J.W.; Smith, G.D. Indicators of socioeconomic position (part 1). J. Epidemiol. Community Health 2006, 60, 7–12. [Google Scholar] [CrossRef] [PubMed] [Green Version]
- Bahrini, F.; Bell, S.; Mokhtarzadeh, S. The relationship between the distribution and use patterns of parks and their spatial accessibility at the city level: A case study from Tehran, Iran. Urban For. Urban Green. 2017, 27, 332–342. [Google Scholar] [CrossRef]
- De Mola, U.L.; Ladd, B.; Duarte, S.; Borchard, N.; La Rosa, R.A.; Zutta, B. On the use of hedonic price indices to understand ecosystem service provision from urban green space in five Latin American megacities. Forests 2017, 8, 478. [Google Scholar] [CrossRef]
- Fernández-Álvarez, R. Inequitable distribution of green public space in the Mexico City: An environmental injustice case. Econ. Soc. Territ. 2017, 17, 399–428. [Google Scholar] [CrossRef]
- Wu, W.; Dong, G. Valuing the “green” amenities in a spatial context. J. Reg. Sci. 2014, 54, 569–585. [Google Scholar] [CrossRef]
- Chen, W.Y.; Hu, F.Z.Y. Producing nature for public: Land-based urbanization and provision of public green spaces in China. Appl. Geogr. 2015, 58, 32–40. [Google Scholar] [CrossRef]
- Chen, W.Y.; Hu, F.Z.Y.; Li, X.; Hua, J. Strategic interaction in municipal governments’ provision of public green spaces: A dynamic spatial panel data analysis in transitional China. Cities 2017, 71, 1–10. [Google Scholar] [CrossRef]
- Donaldson, R.; Ferreira, S.; Didier, S.; Rodary, E.; Swanepoel, J. Access to the urban national park in Cape Town: Where urban and natural environment meet. Habitat Int. 2016, 57, 132–142. [Google Scholar] [CrossRef]
- Gao, W.; Lyu, Q.; Fan, X.; Yang, X.; Liu, J.; Zhang, X. Building-based analysis of the spatial provision of urban parks in Shenzhen, China. Int. J. Environ. Res. Public Health 2017, 14, 1521. [Google Scholar] [CrossRef] [PubMed]
- Iqbal, A. How safe are women-only parks perceived to be? Secur. J. 2018, 1–23. [Google Scholar] [CrossRef]
- Krellenberg, K.; Welz, J.; Reyes-Päcke, S. Urban green areas and their potential for social interaction—A case study of a socio-economically mixed neighbourhood in Santiago de Chile. Habitat Int. 2014, 44, 11–21. [Google Scholar] [CrossRef]
- Li, H.; Liu, Y. Neighborhood socioeconomic disadvantage and urban public green spaces availability: A localized modeling approach to inform land use policy. Land Use Policy 2016, 57, 470–478. [Google Scholar] [CrossRef]
- Liang, H.; Chen, D.; Zhang, Q. Walking accessibility of urban parks in a compact megacity. Proc. Inst. Civ. Eng.-Urban Des. Plan. 2017, 170, 59–71. [Google Scholar] [CrossRef]
- Lotfi, S.; Koohsari, M.J. Measuring objective accessibility to neighborhood facilities in the city (A case study: Zone 6 in Tehran, Iran). Cities 2009, 26, 133–140. [Google Scholar] [CrossRef]
- Lotfi, S.; Koohsari, M.J. Proximity to neighborhood public open space across different socio-economic status areas in metropolitan Tehran. Environ. Just. 2011, 4, 179–184. [Google Scholar] [CrossRef]
- McConnachie, M.M.; Shackleton, C.M. Public green space inequality in small towns in South Africa. Habitat Int. 2010, 34, 244–248. [Google Scholar] [CrossRef] [Green Version]
- Mowafi, M.; Khadr, Z.; Bennett, G.; Hill, A.; Kawachi, I.; Subramanian, S.V. Is access to neighborhood green space associated with BMI among Egyptians? A multilevel study of Cairo neighborhoods. Health Place 2012, 18, 385–390. [Google Scholar] [CrossRef] [PubMed]
- Qureshi, S.; Breuste, J.H.; Jim, C.Y. Differential community and the perception of urban green spaces and their contents in the megacity of Karachi, Pakistan. Urban Ecosyst. 2013, 16, 853–870. [Google Scholar] [CrossRef]
- Rojas, C.; Páez, A.; Barbosa, O.; Carrasco, J. Accessibility to urban green spaces in Chilean cities using adaptive thresholds. J. Transp. Geogr. 2016, 57, 227–240. [Google Scholar] [CrossRef]
- Shackleton, C.M.; Blair, A. Perceptions and use of public green space is influenced by its relative abundance in two small towns in South Africa. Landsc. Urban Plan. 2013, 113, 104–112. [Google Scholar] [CrossRef]
- Shan, X.-Z.; Yu, X. Citizen assessment as policy tool of urban public services: Empirical evidence from assessments of urban green spaces in China. Sustainability 2014, 6, 7833–7849. [Google Scholar] [CrossRef]
- Shen, Y.; Sun, F.; Che, Y. Public green spaces and human wellbeing: Mapping the spatial inequity and mismatching status of public green space in the Central City of Shanghai. Urban For. Urban Green. 2017, 27, 59–68. [Google Scholar] [CrossRef]
- Tu, X.; Huang, G.; Wu, J. Contrary to common observations in the West, urban park access is only weakly related to neighborhood socioeconomic conditions in Beijing, China. Sustainability 2018, 10, 1115. [Google Scholar] [CrossRef]
- Wan, C.; Su, S. China’s social deprivation: Measurement, spatiotemporal pattern and urban applications. Habitat Int. 2017, 62, 22–42. [Google Scholar] [CrossRef]
- Wang, D.; Brown, G.; Zhong, G.; Liu, Y.; Mateo-Babiano, I. Factors influencing perceived access to urban parks: A comparative study of Brisbane (Australia) and Zhongshan (China). Habitat Int. 2015, 50, 335–346. [Google Scholar] [CrossRef]
- Wang, Q.; Zhang, Z. Examining social inequalities in urban public leisure spaces provision using principal component analysis. Qual. Quant. 2017, 51, 2409–2420. [Google Scholar] [CrossRef]
- Willemse, L. A class-differentiated analysis of park use in Cape Town, South Africa. GeoJournal 2017. [Google Scholar] [CrossRef]
- Wu, C.; Ye, X.; Du, Q.; Luo, P. Spatial effects of accessibility to parks on housing prices in Shenzhen, China. Habitat Int. 2017, 63, 45–54. [Google Scholar] [CrossRef]
- Xiao, Y.; Li, Z.; Webster, C. Estimating the mediate effect of privately green space on the relationship between urban public green space and property value: Evidence from Shanghai, China. Land Use Policy 2016, 54, 439–447. [Google Scholar] [CrossRef]
- Xiao, Y.; Lu, Y.; Guo, Y.; Yuan, Y. Estimating the willingness to pay for green space services in Shanghai: Implications for social equity in urban China. Urban For. Urban Green. 2017, 26, 95–103. [Google Scholar] [CrossRef]
- Xing, L.; Liu, Y.; Liu, X.; Wei, X.; Mao, Y. Spatio-temporal disparity between demand and supply of park green space service in urban area of Wuhan from 2000 to 2014. Habitat Int. 2018, 71, 49–59. [Google Scholar] [CrossRef]
- Xu, M.; Xin, J.; Su, S.; Weng, M.; Cai, Z. Social inequalities of park accessibility in Shenzhen, China: The role of park quality, transport modes, and hierarchical socioeconomic characteristics. J. Transp. Geogr. 2017, 62, 38–50. [Google Scholar] [CrossRef]
- Yang, J.; Li, C.; Li, Y.; Xi, J.; Ge, Q.; Li, X. Urban green space, uneven development and accessibility: A case of Dalian’s Xigang District. Chin. Geogr. Sci. 2015, 25, 644–656. [Google Scholar] [CrossRef]
- Ye, C.; Hu, L.; Li, M. Urban green space accessibility changes in a high-density city: A case study of Macau from 2010 to 2015. J. Transp. Geogr. 2018, 66, 106–115. [Google Scholar] [CrossRef]
- You, H. Characterizing the inequalities in urban public green space provision in Shenzhen, China. Habitat Int. 2016, 56, 176–180. [Google Scholar] [CrossRef]
- Zhang, W.; Yang, J.; Ma, L.; Huang, C. Factors affecting the use of urban green spaces for physical activities: Views of young urban residents in Beijing. Urban For. Urban Green. 2015, 14, 851–857. [Google Scholar] [CrossRef]
- Talen, E. Neighborhoods as service providers: A methodology for evaluating pedestrian access. Environ. Plan. B Plan. Des. 2003, 30, 181–200. [Google Scholar] [CrossRef]
- Cohen, J. A power primer. Psychol. Bull. 1992, 112, 155–159. [Google Scholar] [CrossRef] [PubMed]
- Rigolon, A.; Németh, J. A QUality INdex of Parks for Youth (QUINPY): Evaluating urban parks through geographic information systems. Environ. Plan. B 2018, 45, 275–294. [Google Scholar] [CrossRef]
- Kaczynski, A.T.; Stanis, S.A.; Besenyi, G.M. Development and testing of a community stakeholder park audit tool. Am. J. Prev. Med. 2012, 42, 242–249. [Google Scholar] [CrossRef] [PubMed]
- Broomhall, M.H.; Giles-Corti, B.; Lange, A. Quality of Public Open Space Tool (POST). Available online: http://www.see.uwa.edu.au/research/cbeh/projects/post (accessed on 2 January 2016).
- Thomas, B.H.; Ciliska, D.; Dobbins, M.; Micucci, S. A process for systematically reviewing the literature: Providing the research evidence for public health nursing interventions. Worldviews Evid.-Based Nurs. 2004, 1, 176–184. [Google Scholar] [CrossRef] [PubMed]
- Armijo-Olivo, S.; Stiles, C.R.; Hagen, N.A.; Biondo, P.D.; Cummings, G.G. Assessment of study quality for systematic reviews: A comparison of the Cochrane Collaboration Risk of Bias Tool and the Effective Public Health Practice Project Quality Assessment Tool: Methodological research. J. Eval. Clin. Pract. 2012, 18, 12–18. [Google Scholar] [CrossRef] [PubMed]
- Grasser, G.; Van Dyck, D.; Titze, S.; Stronegger, W. Objectively measured walkability and active transport and weight-related outcomes in adults: A systematic review. Int. J. Public Health 2013, 58, 615–625. [Google Scholar] [CrossRef] [PubMed]
- Wang, L.; Wen, C. The relationship between the neighborhood built environment and active transportation among adults: A systematic literature review. Urban Sci. 2017, 1, 29. [Google Scholar] [CrossRef]
- Babicki, S.; Arndt, D.; Marcu, A.; Liang, Y.; Grant, J.R.; Maciejewski, A.; Wishart, D.S. Heatmapper: Web-enabled heat mapping for all. Nucleic Acids Res. 2016, 8, W147–W153. [Google Scholar] [CrossRef] [PubMed]
- Rigolon, A.; Németh, J. Privately owned parks in new urbanist communities: A study of environmental privilege, equity, and inclusion. J. Urban Aff. 2018, 40, 543–559. [Google Scholar] [CrossRef]
- Rigolon, A.; Browning, M.; Jennings, V. Inequities in the quality of urban park systems: An environmental justice investigation of cities in the United States. Landsc. Urban Plan. 2018, 178, 156–169. [Google Scholar] [CrossRef]
- Rigolon, A.; Németh, J. What shapes uneven access to urban amenities? Thick injustice and the legacy of racial discrimination in Denver’s parks. J. Plan. Educ. Res. 2018. [Google Scholar] [CrossRef]
- Barbosa, O.; Villagra, P. Socio-ecological studies in urban and rural ecosystems in Chile. In Earth Stewardship: Linking Ecology and Ethics in Theory and Practice; Rozzi, R., Chapin, F.S., May, J.B.C., Pickett, S.T.A., Armesto, J.J., May, R.H.J., Eds.; Springer: Cham, Switzerland; Heidelberg, Germany, 2015; pp. 297–311. [Google Scholar]
- Greenstone, M.; Hanna, R. Environmental regulations, air and water pollution, and infant mortality in India. Am. Econ. Rev. 2014, 104, 3038–3072. [Google Scholar] [CrossRef]
- World Health Organization. Global Urban Air Pollution Trends. Available online: http://www.who.int/en/news-room/detail/12-05-2016-air-pollution-levels-rising-in-many-of-the-world-s-poorest-cities (accessed on 9 July 2018).
- Lu, F.; Xu, D.; Cheng, Y.; Dong, S.; Guo, C.; Jiang, X.; Zheng, X. Systematic review and meta-analysis of the adverse health effects of ambient PM2.5 and PM10 pollution in the Chinese population. Environ. Res. 2015, 136, 196–204. [Google Scholar] [CrossRef] [PubMed]
- Fleischer, N.L.; Merialdi, M.; van Donkelaar, A.; Vadillo-Ortega, F.; Martin, R.V.; Betran, A.P. Outdoor air pollution, preterm birth, and low birth weight: Analysis of the World Health Organization global survey on maternal and perinatal health. Environ. Health Perspect. 2014, 122, 425–430. [Google Scholar] [CrossRef] [PubMed]
- Ghorani-Azam, A.; Riahi-Zanjani, B.; Balali-Mood, M. Effects of air pollution on human health and practical measures for prevention in Iran. J. Res. Med. Sci. 2016, 21, 65–72. [Google Scholar] [CrossRef] [PubMed]
- Janhäll, S. Review on urban vegetation and particle air pollution—Deposition and dispersion. Atmos. Environ. 2015, 105, 130–137. [Google Scholar] [CrossRef]
- Markevych, I.; Schoierer, J.; Hartig, T.; Chudnovsky, A.; Hystad, P.; Dzhambov, A.M.; de Vries, S.; Triguero-Mas, M.; Brauer, M.; Nieuwenhuijsen, M.J.; et al. Exploring pathways linking greenspace to health: Theoretical and methodological guidance. Environ. Res. 2017, 158, 301–317. [Google Scholar] [CrossRef] [PubMed]
- Rigolon, A.; Toker, Z.; Gasparian, N. Who has more walkable routes to parks? An environmental justice study of Safe Routes to Parks in neighborhoods of Los Angeles. J. Urban Aff. 2018, 40, 576–591. [Google Scholar] [CrossRef]
- Rupprecht, C.D.D.; Byrne, J.A. Informal urban green-space: Comparison of quantity and characteristics in Brisbane, Australia and Sapporo, Japan. PLoS ONE 2014, 9, e99784. [Google Scholar] [CrossRef] [PubMed]
Figure 1.
Literature search process based on the PRISMA flow diagram.

Figure 2.
Number of articles studying each Global South country. Map created with heatmapper [115].
Figure 2.
Number of articles studying each Global South country. Map created with heatmapper [115].

Table 1.
Articles included in the sample.
| Author(s), Date, and Citation | Location | Scale | Type of Green Space Provision Measured |
|---|---|---|---|
| Arshad et al. 2018 [69] | Sheikhupura, Pakistan | Parts of city | Quantity |
| Bahrini et al. 2017 [71] | Tehran, Iran | Parts of city | Quantity and Quality |
| Chen & Hu 2015 [75] | 285 prefecture cities, China | Country | Quantity |
| Chen et al. 2017 [76] | 258 prefecture cities, China | Country | Quantity |
| Dadashpoor et al. 2016 [46] | Hamadan, Iran | City | Quantity |
| de Mola et al. 2017 [72] | Bogotá (Colombia), Buenos Aires (Argentina), Lima (Peru), Mexico City (Mexico), and Santiago de Chile (Chile) | Parts of city | Quantity and Quality |
| Donaldson et al. 2016 [77] | Cape Town, South Africa | Metro area | Quantity and Quality |
| Fernández-Álvarez 2017 [73] | Mexico City, Mexico | City | Quantity |
| Gao et al. 2017 [78] | Shenzhen, China | City | Quantity |
| Iqbal 2018 [79] | Karachi, Pakistan | City | Quality |
| Jim & Shan 2013 [25] | Guangzhou, China | Parts of city | Quality |
| Krellenberg et al. 2014 [80] | Santiago de Chile, Chile | Neighborhood | Proximity |
| Lara-Valencia & García-Pérez 2015 [18] | Hermosillo, Mexico | City | Proximity and Quantity |
| Li & Liu 2016 [81] | Shanghai, China | City | Proximity, Quantity, and Quality |
| Liang et al. 2017 [82] | Shanghai, China | City | Proximity and Quantity |
| Lotfi & Koohsari 2009 [83] | Tehran, Iran | Parts of city | Proximity |
| Lotfi & Koohsari 2011 [84] | Tehran, Iran | Metro area | Proximity and Quantity |
| Macedo & Haddad 2016 [20] | Curitiba, Brazil | City | Proximity, Quantity, and Quality |
| McConnachie & Shackleton 2010 [85] | Nine towns in Southeast South Africa | Parts of city | Quantity |
| Mowafi et al. 2012 [86] | Cairo, Egypt | Parts of city | Proximity |
| Paul & Nagendra 2017 [23] | Delhi, India | Parts of city | Proximity and Quality |
| Qureshi et al. 2013 [87] | Karachi, Pakistan | Parts of city | Quality |
| Rojas et al. 2016 [88] | Valdivia and Temuco, Chile | City | Proximity |
| Scopelliti et al. 2016 [38] | Bogotá, Colombia | Parts of city | Proximity and Quality |
| Shackleton & Blair 2013 [89] | Fort Beaufort and Port Alfred, South Africa | Parts of city | Proximity, Quantity, and Quality |
| Shan & Yu 2014 [90] | Guangzhou, China | Parts of city | Quality |
| Shen et al. 2017 [91] | Shanghai, China | Parts of city | Proximity |
| Tu et al. 2018 [92] | Beijing, China | Parts of city | Proximity |
| Wan & Su 2017 [93] | 333 cities, China | Country | Quantity |
| Wang et al. 2015 [94] | Zhongshan, China | Parts of city | Proximity |
| Wang & Zhang 2017 [95] | Shenzhen, China | City | Proximity and Quantity |
| Wei 2017 [45] | Hangzhou, China | Parts of city | Quantity |
| Willemse 2013 [21] | Cape Town, South Africa | City | Proximity and Quantity |
| Willemse 2017 [96] | Cape Town, South Africa | City | Proximity, Quantity, and Quality |
| Wright Wendel et al. 2012 [47] | Santa Cruz, Bolivia | City | Proximity and Quality |
| Wu et al. 2017 [97] | Shenzhen, China | City | Proximity |
| Wu & Dong 2014 [74] | Beijing, China | City | Proximity and Quantity |
| Xiao, Li, et al. 2016 [98] | Shanghai, China | Parts of city | Proximity and Quantity |
| Xiao, Lu, et al. 2017 [99] | Shanghai, China | Parts of city | Proximity and Quantity |
| Xiao, Wang, et al. 2017 [12] | Shanghai, China | Metro area | Quantity |
| Xing et al. 2018 [100] | Wuhan, China | Parts of city | Proximity |
| Xu et al. 2017 [101] | Shenzhen, China | City | Proximity and Quality |
| Yang et al. 2015 [102] | Dalian, China | Parts of city | Quantity |
| Ye et al. 2018 [103] | Macau, China | City | Proximity |
| You 2016 [104] | Shenzhen, China | City | Proximity, Quantity, and Quality |
| Zhang et al. 2015 [105] | Beijing, China | Parts of city | Quality |
Table 2.
Analytical codes to record studies’ methods and results (adapted from Rigolon [42]).
Table 2.
Analytical codes to record studies’ methods and results (adapted from Rigolon [42]).
| Codes | Coding Options |
|---|---|
| Method to measure provision | Open-ended (e.g., GIS, survey, secondary data) |
| Unit of analysis | Open-ended (e.g., neighborhood, city, bloc, individual) |
| N size | Open-ended |
| GIS method type—Talen [106] | Container, coverage, minimum distance, travel cost, and gravity |
| Type of green space access measured | Proximity, Quantity, and/or Quality. For GIS studies: Proximity (Talen’s minimum distance, gravity, and travel cost methods, and studies with a set distance threshold). Quantity (Talen’s container and coverage methods). Quality (presence of green space amenities and types of green spaces). For surveys: Proximity (perceived distance to green spaces). Quantity (perceived quantity or crowding of green spaces). Quality (reported satisfaction about green spaces, perceived maintenance and safety) |
| Threshold to define access | Open-ended (e.g., 500 m), if applicable |
| Demographic predictor variables measured | Categorized between SES, race-ethnicity, and control variables |
| Health outcomes measured | Open-ended (e.g., mental health, well-being) |
| Type of statistical analysis | Inferential or descriptive; if inferential, the type of test was recorded (e.g., ANOVA, regression) |
| Methods details | Open-ended description of methods |
| Results on green space proximity | “Equity” (low-SES and/or racial-ethnic minority advantaged), “inequity” (high-SES and/or racial-ethnic majority advantaged), or “mixed findings-not significant” (if applicable) |
| Results on green space quantity | Equity, inequity, or mixed-findings-not significant (if applicable) |
| Results on green space quality | Equity, inequity, or mixed-findings-not significant (if applicable) |
| Effect size | Small, medium, or large. For correlations, small if 0.1 < r < 0.3, medium if 0.3 < r < 0.5, and large if r > 0.5. For mean differences, small if 0.2 < d < 0.5, medium if 0.5 < d < 0.8, and large if d > 0.8 [107]. For other coefficients, see Cohen [107]. |
| Results on health outcomes | Open-ended (if applicable) |
| Results details | Open-ended information on results |
| Methodological flaws | Open-ended (e.g., unit of analysis, type of statistical test) |
Table 3.
Methodological biases in sampled papers.
| Bias Category | Biases Identified | Articles with Bias | |
| n | % | ||
| Selection bias | Limited generalizability due to small sample size or homogenous demographic characteristics | 14 | 30% |
| Study design | Limited validity due to a large unit of analysis (i.e., city or district level) | 12 | 26% |
| Data collection | Limited validity due to a subjective measure of park access | 8 | 17% |
| Confounders | Limited validity due to lack of inadequate control for confounders | 8 | 17% |
| Analyses | Limited reliability due to inadequate operationalization or description of socioeconomic, income, or deprivation measure(s) | 6 | 13% |
| Analyses | Limited validity of results due to no inferential statistical significance(s) reported | 5 | 11% |
| Data collection | Limited validity due to a subjective measure of park location | 4 | 9% |
| Bias Probability | Articles in Grouping | ||
| n | % | ||
| Least likely to be biased (1 or fewer biases present) | 32 | 70% | |
| Moderately likely to be biased (2 or 3 biases present) | 12 | 26% | |
| Most likely to be biased (4 or more biases present) | 2 | 4% | |
Note: The Bias Categories are the five EPHPP competency categories relevant to observational cross-sectional studies [114].
Table 4.
Findings for green space proximity, organized by distance thresholds with article citations.
Table 4.
Findings for green space proximity, organized by distance thresholds with article citations.
| Total (n = 27) | No Threshold (n = 14) | 0–500 m | 501–1000 m | Above 1000 m | Multiple Thresholds | |
|---|---|---|---|---|---|---|
| Inequity | 74.1%, n = 20 [18,21,38,74,80,81,82,84,86,91,92,94,95,96,97,98,100,101,103,104] | 78.6%, n = 11 [21,38,74,80,84,86,94,96,97,98,104] | 50%, n = 1 [95] | 75%, n = 3 [18,81,92] | 100%, n = 3 [91,100,101] | 50%, n = 2 [82,103] |
| Equity | 7.4%, n = 2 [83,99] | 7.1%, n = 1 [99] | 0%, n = 0 | 0%, n = 0 | 0%, n = 0 | 25%, n = 1 [83] |
| Mixed or not sig. | 18.5%, n = 5 [20,23,47,88,89] | 14.2%, n = 2 [23,89] | 50%, n = 1 [88] | 25%, n = 1 [20] | 0%, n = 0 | 25%, n = 1 [47] |
Note: The threshold categories are mutually exclusive. Articles classified as “multiple thresholds” used more than one distance (e.g., 500 m and 1000 m).
Table 5.
Findings for green space quantity, organized by types of quantity measured with article citations.
Table 5.
Findings for green space quantity, organized by types of quantity measured with article citations.
| Total (n = 27) | GS 1 Area (n = 5) | GS Number (n = 2) | GS Area per Capita (n = 15) | GS Number per Capita (n = 3) | GS Area per Area (n = 4) | |
|---|---|---|---|---|---|---|
| Inequity | 85.2%, n = 23 [18,20,21,46,69,71,72,73,75,76,77,78,81,84,85,89,93,95,96,98,99,102,104] | 60%, n = 3 [75,76,93] | 100%, n = 2 [46,77] | 86.6%, n = 13 [18,20,21,69,71,73,81,85,89,95,96,102,104] | 100%, n = 3 [21,77,84] | 100%, n = 4 [72,78,98,99] |
| Equity | 7.4%, n = 2 [12,82] | 20%, n = 1 [12] | 0%, n = 0 | 6.7%, n = 1 [82] | 0%, n = 0 | 0%, n = 0 |
| Mixed or not sig. | 7.4%, n = 2 [45,74] | 20%, n = 1 [74] | 0%, n = 0 | 6.7%, n = 1 [45] | 0%, n = 0 | 0%, n = 0 |
1 Green space. Note: The types of quantity measured are not mutually exclusive. Some studies measured different types of quantity. “GS Area per Area” describes the total surface of green space divided by the surface of the unit of analysis (e.g., neighborhood).
Table 6.
Findings for green space quality, organized by types of quality measured with article citations.
Table 6.
Findings for green space quality, organized by types of quality measured with article citations.
| Total (n = 17) | Best Green Spaces (n = 5) | Maintenance and Safety (n = 7) | Satisfaction and Aesthetics (n = 8) | Amenities (n = 2) | Green Space Compactness (n = 2) | |
|---|---|---|---|---|---|---|
| Inequity | 64.7%, n = 11 [20,25,47,71,72,77,81,89,96,101,105] | 100%, n = 5 [47,71,72,77,101] | 80%, n = 4 [25,71,89,96] | 50%, n = 4 [25,89,96,105] | 100%, n = 2 [20,96] | 50%, n = 1 [81] |
| Equity | 5.8%, n = 1 [104] | 0%, n = 0 | 0%, n = 0 | 0%, n = 0 | 0%, n = 0 | 50%, n = 1 [104] |
| Mixed or not sig. | 29.4%, n = 5 [23,38,79,87,90] | 0%, n = 0 | 20%, n = 1 [79] | 50%, n = 4 [23,38,87,90] | 0%, n = 0 | 0%, n = 0 |
Note: The types of quality measured are not mutually exclusive. Some studies measured different types of quality. “Best green spaces” refer to a city’s largest green spaces and with the widest variety of amenities [59]. “Maintenance and safety” describe observed and perceived levels of maintenance and safety from crime. “Satisfaction and Aesthetics” refer to reported levels of appreciation for green spaces, including their visual quality. “Amenities” describe the number and diversity of amenities included in green spaces, such as playgrounds, sports fields, and picnic areas. “Green space compactness” refers to the degree to which parks and open spaces are connected or fragmented.
Table 7.
Cross-tabs for green space inequalities broken down by continent.
| Proximity | Quantity | Quality | |||||||
|---|---|---|---|---|---|---|---|---|---|
| Ineq. | Mixed | Equity | Ineq. | Mixed | Equity | Ineq. | Mixed | Equity | |
| Africa | 3 (3) | 1 (1) | 0 (0) | 5 (5) | 0 (0) | 0 (0) | 3 (2) | 0 (1) | 0 (0) |
| Asia | 14 (13) | 1 (3) | 2 (1) | 14 (15) | 2 (1) | 2 (1) | 5 (6) | 4 (3) | 1 (1) |
| Latin America | 3 (4) | 3 (1) | 0 (0) | 4 (4) | 0 (0) | 0 (0) | 3 (3) | 1 (1) | 0 (0) |
Note: Observed values are shown first; expected values (rounded up to the closest integer) are shown in parentheses.
© 2018 by the authors. Licensee MDPI, Basel, Switzerland. This article is an open access article distributed under the terms and conditions of the Creative Commons Attribution (CC BY) license (http://creativecommons.org/licenses/by/4.0/).
Share and Cite
MDPI and ACS Style
Rigolon, A.; Browning, M.H.E.M.; Lee, K.; Shin, S. Access to Urban Green Space in Cities of the Global South: A Systematic Literature Review. Urban Sci. 2018, 2, 67. https://doi.org/10.3390/urbansci2030067
AMA Style
Rigolon A, Browning MHEM, Lee K, Shin S. Access to Urban Green Space in Cities of the Global South: A Systematic Literature Review. Urban Science. 2018; 2(3):67. https://doi.org/10.3390/urbansci2030067
Chicago/Turabian StyleRigolon, Alessandro, Matthew H. E. M. Browning, Kangjae Lee, and Seunguk Shin. 2018. "Access to Urban Green Space in Cities of the Global South: A Systematic Literature Review" Urban Science 2, no. 3: 67. https://doi.org/10.3390/urbansci2030067