Evaluating Urban Odor with Field Olfactometry in Camden, NJ


1
Department of Geography, Planning, & Sustainability, Rowan University, Glassboro, NJ 08028, USA
2
Monell Chemical Senses Center, Philadelphia, PA 19104, USA
*
Author to whom correspondence should be addressed.
Urban Sci. 2019, 3(3), 93; https://doi.org/10.3390/urbansci3030093
Submission received: 1 July 2019
/
Revised: 14 August 2019
/
Accepted: 15 August 2019
/
Published: 18 August 2019
(This article belongs to the Special Issue Urban Health: Emission Sources, Pollutant Transport, and Associated Health Impacts)
Abstract
:Odor annoyance negatively impacts residents of communities adjacent to persistent nuisance industries. These residents, often with a high percentage of minority or otherwise marginalized residents, experience subjective and objective impacts on health and well-being; yet, reliable methods for quantifying and categorizing odors have been elusive. Field olfactometry is integral to the study of odor annoyance experienced by communities as it includes both qualitative (human perception) and quantitative (intensity measurement) dimensions of human odor experience and has been employed by municipalities in the U.S. to evaluate odor pollution levels. Cartographic visualization of odor data recorded using a field olfactometer offers further opportunity to evaluate potential patterns of odor annoyance, yet the use of field olfactometry and geographic information systems have not been frequently employed by geographers. By employing a mixed-methods approach to evaluate odor pollution, this study addresses the environmental justice context by quantifying and categorizing the presence of odor pollution in Waterfront South, a neighborhood in Camden, NJ previously identified for its disproportionate malodor burden. This study offers support to mixed methods research and the need for monitoring subjective and objective impacts in communities with compounding odor nuisance industries.
1. Introduction
While malodors have always been integral to the sensory experience of urban life [1,2], industrialization, modernization, and land-use zoning in American cities have relegated malodors to localized point and area sources. In comparison to other forms of air pollution, exposure to odor resulting from human activity is generally recognized to be a nuisance, rather than a public health risk or environmental hazard. Unlike noise pollution, for which measurement, regulation, and human health impacts are well known, odor pollution is not perceived to be a widespread problem for most Americans, contributing to the limited research on environmental odors and their effects [3]. The study of environmental odor is also limited by the complexity of both aromatic compounds (odorants) and the human sense of smell (olfaction). Yet, interest in the health consequences of malodors has increased in recent decades, often as a result of residential exposure to odor emitting ‘nuisance industries,’ such as municipal waste and wastewater disposal and treatment facilities, application of sewage sludge, industrial animal agriculture, and the production, storage and transport of industrial chemicals [4]. In many instances, persistent malodor exposure is considered an environmental stressor, capable of generating negative impacts for health and well-being due to stress-related symptoms and illnesses, even if the odorous air is not toxic [3].
Environmental odor impact assessment approaches usually include the consideration of five interacting factors known as FIDOL, an acronym for: Frequency, intensity, duration, offensiveness, and location of the odor. Within the context of these factors, methods for measuring odor are varied, each containing merits and limitations. A key challenge in odor measurement is that chemical odor (gas) analysis is poorly correlated with the human perception of odor; chemical lab testing and ‘electronic noses’ (portable device with sensors for specific compounds) can be used to analyze air samples collected in the field, but they must be employed in conjunction with other odor assessment strategies involving human receptors (noses). Chemical testing is also a cost prohibitive method, especially for community-based organizations. A second challenge, in assessing odor impacts on communities, is the complexity of measuring odor in-situ; the laboratory-based analysis of odor samples cannot represent the spatiotemporal dimensions of odor emissions affecting the human perception in the field. As such, the primary methods used to measure odor pollution in the U.S. include community surveys, dispersion modeling, and olfactometry (lab and field) [5].
Methods for evaluating the impacts of residential odor annoyance have largely focused on directly surveying the affected community [6], or simulated models of odor dispersion [7]. Community-based odor surveys can also serve as important records in understanding community perceptions over time and as catalysts for community organizing and activism, especially within the environmental justice context [6], but they are most effective when employed in conjunction with more objective odor measurements [8]. Despite the potential of various models, their use is limited by the limited study of their reliability and their inability to account for the human perception of odor. Dispersion modeling continues to be used in conjunction with other sensorial methods, such as field olfactometry, which remains the most important method for assessing odor pollution in the context of odor annoyance [9].
The most prevalent and reliable method for sensory quantification of odors is olfactometry, the use of a device (olfactometer) to detect and measure odor dilution in conjunction with the human perception [10]. Two olfactometry techniques are employed in the study of odor pollution: Laboratory-based analysis of containerized samples or in-situ ambient air measurement. Both approaches involve the human perception of air samples containing a mixture of odorous air with non-odorous (carbon-filtered) air at specific dilutions. The process begins with exposing an odor judgment panel or individual assessor to a highly diluted air sample (in which the odor is undetectable) and is followed by progressively lower dilution levels (greater odorous air) in methodical steps. The dilutions-to-threshold (D/T) point corresponds to an odor concentration in which the subject can detect a difference about the air relative to the previous instrument setting. Detection of an odor at a high dilution (high D/T) indicates the presence of a strong odor whereas a low dilution (low D/T) indicates a weak odor. While laboratory-based dynamic olfactometry is the most accurate instrumentation-wise, it is costly, time-consuming, does not include real-time measurement, and often includes sample container preservation issues [10].
Field olfactometry, a technique developed through a 1958 U.S. Public Health Service grant, involves the use of a relatively inexpensive, hand-held olfactometer device for an in-situ human sensory quantification of odor D/T. For the study of odor pollution, field olfactometry has several advantages including lower / more sensitive detection thresholds, real-time readings reflecting the daily / seasonal impacts of temperature and humidity (e.g., increased microbial activity), elimination of sample collection and preservation, cost and convenience. While there are challenges to odor measurement in the field, such as dynamic meteorological conditions, it is the most prevalent technique employed by municipalities (using a trained assessor) in the U.S. to assess odor pollution levels [11]. Among states and localities (e.g., Denver, CO, Bay Area Air Quality District, CA, NJ) that quantify odor nuisance regulations using field olfactometry, five and seven D/T are the most commonly used thresholds for waste-related and urban odor nuisance assessment [12,13].
The spatiality of olfaction has largely been explored through qualitative cultural geography approaches and quantitative approaches in environmental engineering; this research seeks to bridge these two approaches through piloting a digital cartography methodology for use in urban geography. The first systematic study of place, smell, and public well-being is attributed to Jean-Noël Hallé, the first Chair of Public Hygiene in Paris (1794), who developed smell walking and mapping as a methodology for identifying environmental hazards industrializing cities [1]. Drawing on the legacy of walking as an urban methodology, Porteous [14] revived the use of experiential smellwalks and mental maps for “smellscape” studies; this methodology remains integral to olfactory geographies [15] exploring the sensuous study of place [16,17] and the “pleasantness of smellscapes” [18]. The homogenization of the smell experience resulting from urbanization, industrialization, and modernization [1,19,20] has generated recent interest in smell walking and mapping as a placemaking strategy [16,17,21].
The use of GIS in the study of odor pollution has been undertaken primarily for applied, site-specific environmental odor assessment of nuisance industries such as municipal waste treatment facilities and confined animal feeding operations (CAFO) [22] by environmental engineers. Several types of odor data have been studied using GIS. The spatial analysis of odor intensity data collected from lab-based (dynamic) olfactometry [23] and field panels/assessors (human receptors) [24] have proved valuable in evaluating spatial pattern. Sówka et al. [24] contend that the use of GIS for the analysis of odor data recorded using a field olfactometer is one of the most promising methodologies for the study of odor, yet few studies have employed these methods together. Similarly, Intarakosit [25] invoked spatial distribution of perceptible odors related to the agricultural application of biosolids. Municipal odor-related complaint mapping using GIS is another valuable strategy to assess odor annoyance [26] which has been utilized by municipalities in successful ways (e.g., Smell Pittsburgh).
This study contributes to the development of affordable and feasible field methods for community assessment and monitoring of environmental odor pollution (qualitatively and quantitatively) within urban geography contexts by directly addressing two research questions: (1) Do measured environmental odors in the Waterfront South neighborhood meet or exceed the New Jersey nuisance threshold (five D/T)? (2) Is there a spatial and categorical pattern to the observed odors? By answering these, this study seeks to offer insight into a final question: What does the spatial pattern suggest about the role of odor pollution as an environmental stressor in this urban neighborhood with a history of nuisance industries?
2. Materials and Methods
2.1. Study Area
This study was conducted in the Waterfront South neighborhood of Camden, New Jersey, a highly environmentally degraded area due to past and present industrial land uses, including continuous diesel-truck traffic. Less than one square mile, the Waterfront South neighborhood is straddled between the Camden County Municipal Authority (CCMUA) sewage treatment plant to the west, Interstate 676 to the east, a large U.S. Gypsum plant to the north, and the Camden County trash-to-steam incinerator, Covanta Energy Recovery Center, to the south. It is also home to many additional odor pollution activities (see Table 1). The proximity of these industries to the Waterfront South residential area (including approximately 268 homes and eight churches) has resulted in longstanding environmental health and quality of life concerns in the community, including odor annoyance. In the decades after WWII, the City of Camden transitioned demographically (Table 2) from a predominantly white to nonwhite population resulting from county suburbanization and racial discrimination in housing policy and practice [27,28].
By the 1990s, the disproportionate environmental burdens experienced by the predominantly African American and Latino Waterfront South neighborhood, especially those benefiting suburban residents of the rest of Camden County, became the impetus for environmental justice activism among neighborhood residents. Malodors generated from the CCMUA’s expanding sewage treatment operations became the catalyst for a study by Dalton and Dilks [6] into the relationship between reported odors and their effects for residents through a comparative study surveying a total of 200 residents in two neighborhoods, Waterfront South and North Camden. They found that Waterfront South residents reported more frequent and intense reports of odor, annoyance, sensory irritation, and health symptoms than those in North Camden. Waterfront South residents also reported to engage more frequently in avoidance behaviors that disrupted their daily and outdoor activities. Additionally, Waterfront South residents were found to be significantly more adapted to the lowest concentration of a sewage odor test, indicating that even with sensory adaptation to malodors resulting from repeated exposure, their well-being and quality-of-life was negatively affected. In 1999, residents sued the CCMUA for toxic emissions and odor violations resulting from new sewage treatment facilities, which resulted in approximately $5 million of pollution and odor mitigation improvements.
Repeated complaints and a 2001 lawsuit against the New Jersey Department of Environmental Protection (NJDEP) for discriminatory permitting practices allowing polluters to locate in a low-income nonwhite neighborhood [32] led to the formation of the New Jersey Environmental Justice Task Force (NJEJT) in 2002, which initiated air quality inquiries in the Waterfront South neighborhood [29]. These reports found severe and persistent odor pollution resulting from three primary neighborhood activities: Sewage treatment, industrial activities, and diesel emissions resulting from increased truck traffic. In response to the NJEJT efforts, air pollution risk reduction and enforcement strategies, including the formation of an Odor Abatement Team, were initiated by multiple agencies [31]. Recent efforts to reduce odor pollution and improve air quality have continued in Waterfront South, largely through new CCMUA leadership, including the creation of several new greenspaces.
2.2. Field Sampling
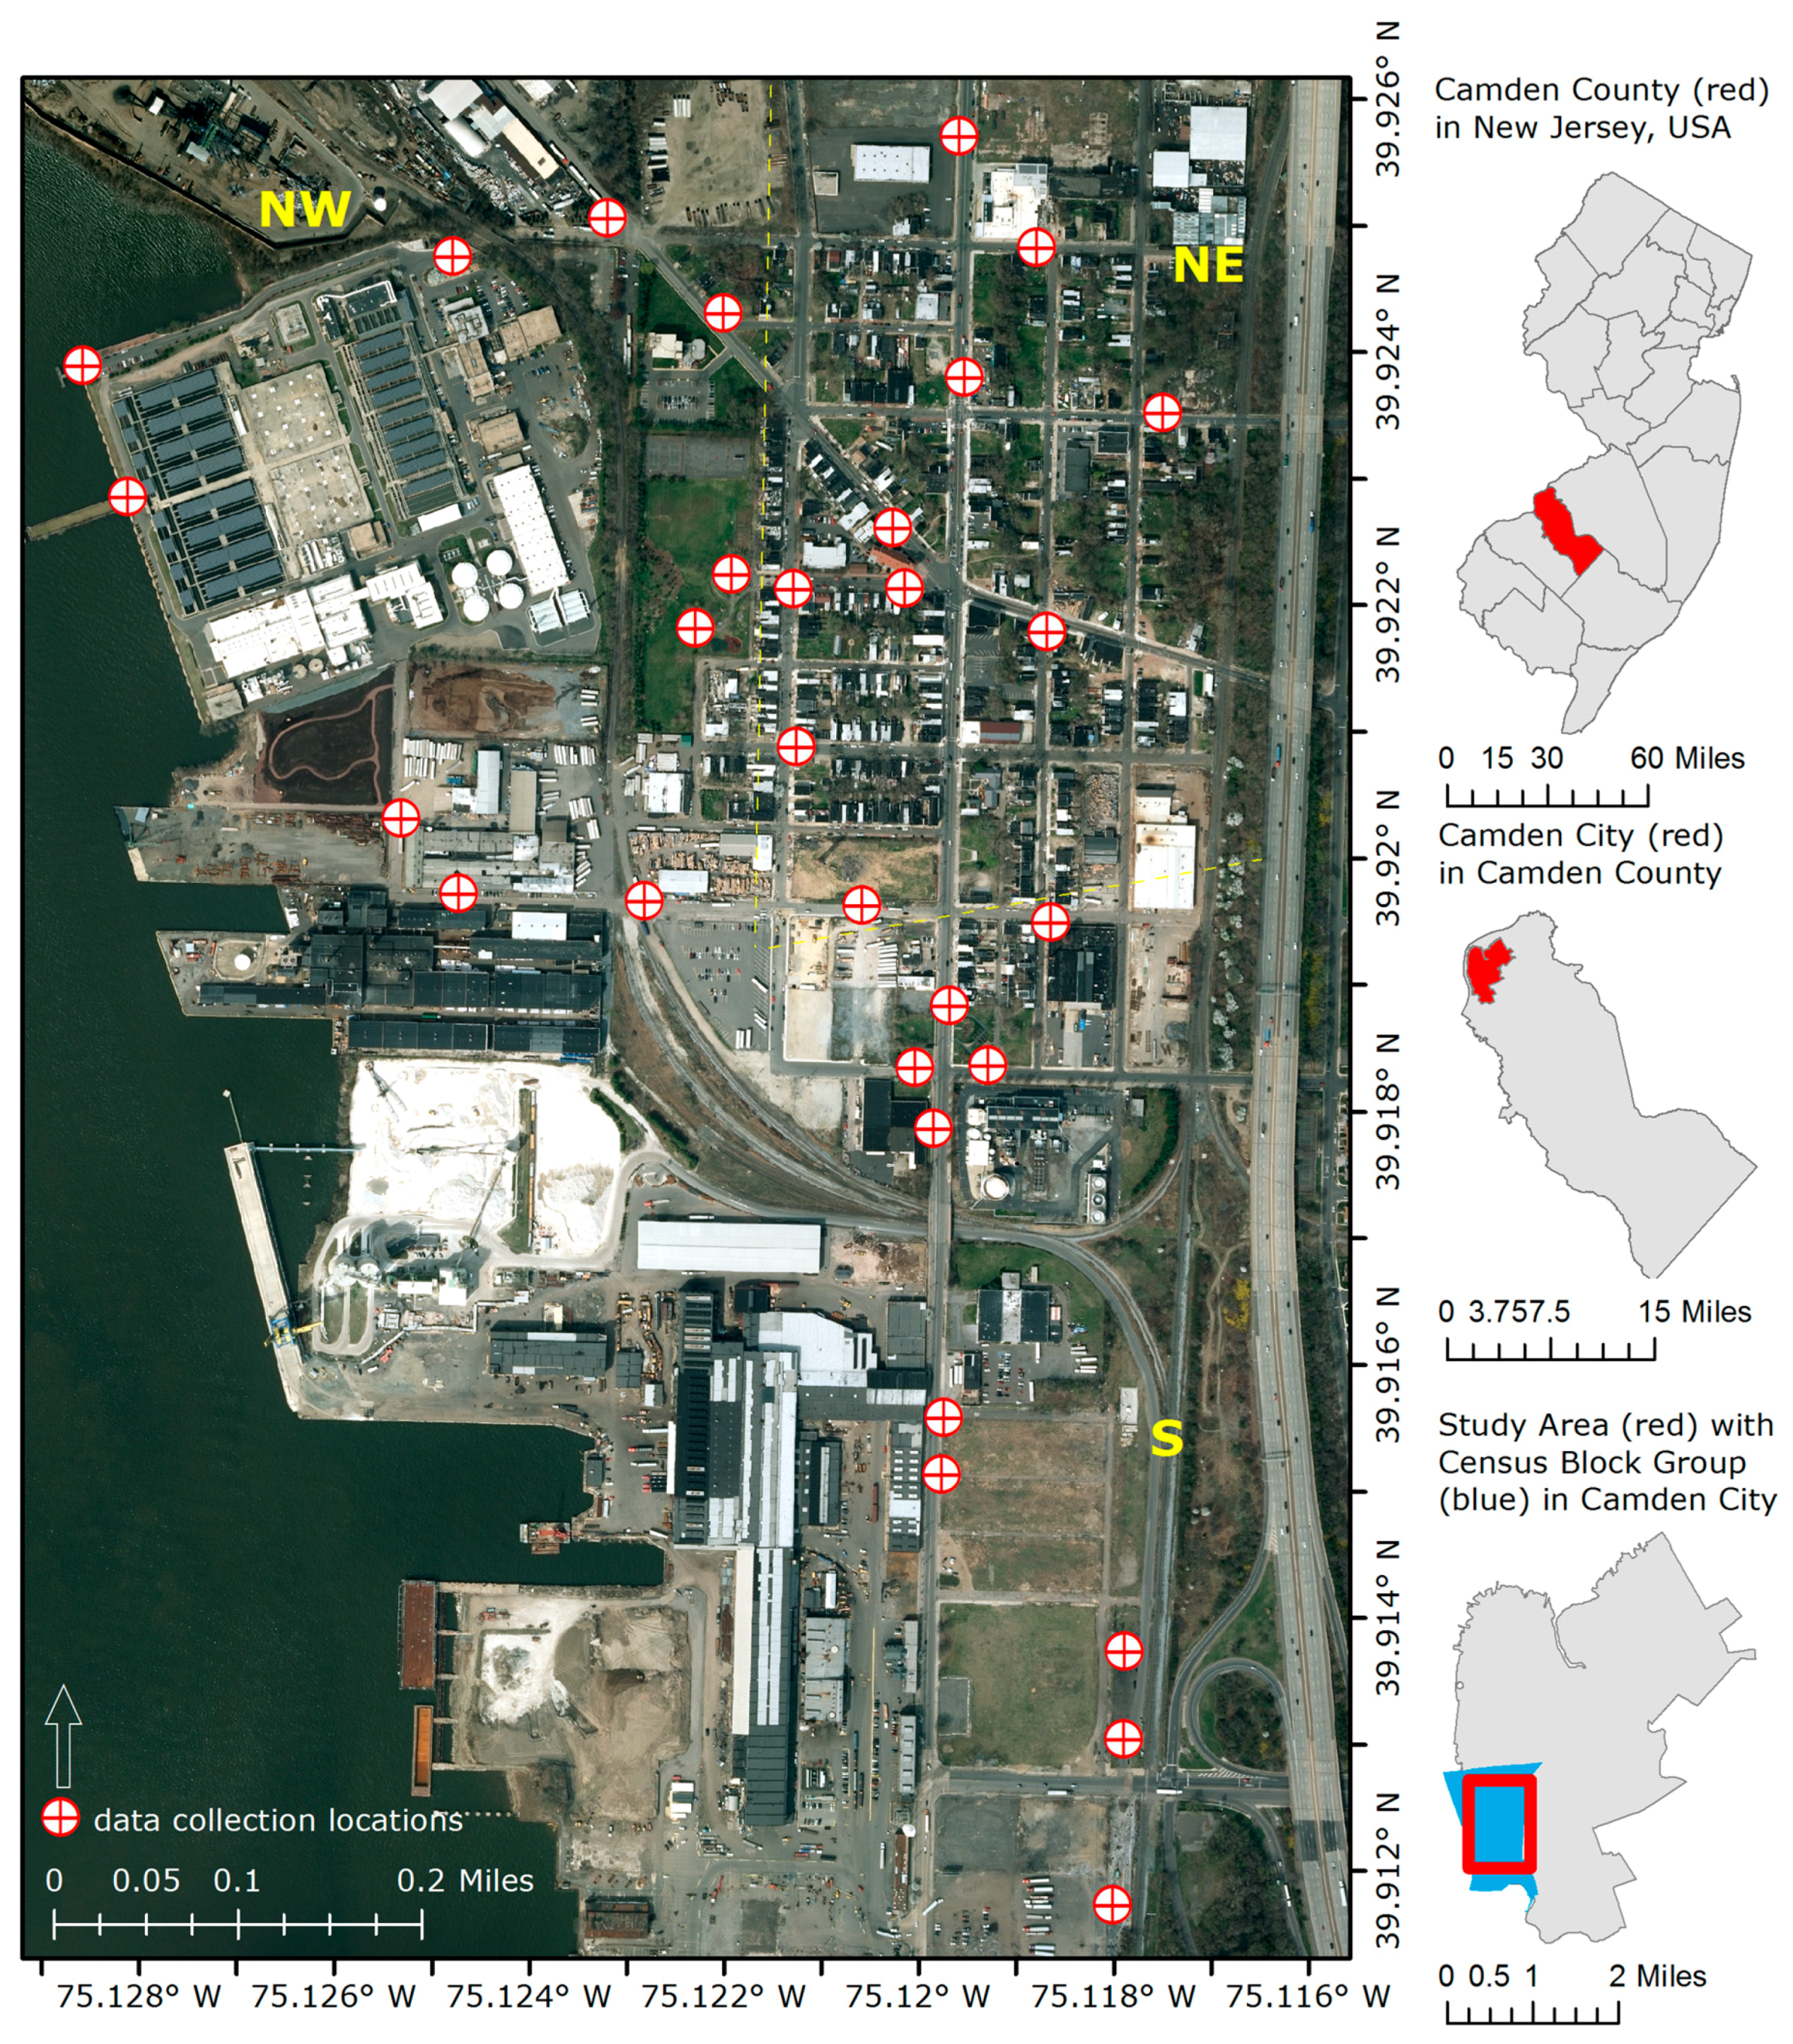
The sampling region in the Camden Waterfront South neighborhood was delineated by the publicly accessible streets southeast of Interstate-676 between Pearl Street and 8th Street. Site navigation was verified using orthographic natural color 2015 imagery from the New Jersey Geographic Information Network. A sample of thirty sample points were generated in ArcGIS 10.5, restricted to the target neighborhood, with at least 100-foot separation, and avoiding inaccessible industrial centers and large impervious surfaces (e.g., parking lots); actual sampled locations were the nearest safely accessible street location. Locations sampled are plotted over the orthographic imagery in Figure 1, with contextual information for the study area, surrounding the US Census Block Group, City of Camden, County of Camden, and State of New Jersey. For analysis, the study area was further subdivided into northwestern, northeastern, and southern sectors, as delineated in Figure 1 and summarized in Table 3.
2.3. Data Collection
Field sampling was conducted on a total of two weekend days in November 2017, between 10:00 a.m. to 2:00 p.m. On 4 November, 10 locations were visited; the weather was sunny with no precipitation. On 18 November, 20 locations were visited; the weather was overcast with brief rain. In total, 30 sites were sampled, with an average observation time of 15 min per location. Location of samples was recorded by Garmin eTrex GPS device, a Kestrel Weather Meter was used to record wind speed and direction, and a Nasal Ranger Field Olfactometer was used to record odor intensity. Field collection variables included observed latitude and longitude, site description, weather conditions, wind speed, odor intensity in cardinal directions, and human-perceived odor type in cardinal directions. The human-perceived odor character was classified into five categories: food, emission/fuel, waste, nature, and smoking. Additional observations were made in a research diary and photographs were captured at each location.
In all cases, the estimated Dilution of Precision of the GPS measurements ranged from 7–10 feet (2.13–3.05 m), with an average of 9 feet (2.74 m), consistent with the highest measurable precision for this equipment with no negative influence from the surrounding urban environment [33]. The Kestrel Weather Meter has a maximum combined uncertainty of 1.04% for the wind speeds measured by this study [34].
Measurement of ambient odor intensity was recorded using St. Croix’s Nasal Ranger Field Olfactometer, which mixes odorous ambient air with filtered air in discrete volume ratios or dilution-to-threshold ratios (D/T) with an estimated accuracy of +/− 10% [35]. The odor intensity is quantified in a ratio of D/T 60, 30, 15, 7, 4, 2, or <2, with 60 as the strongest odor intensity and <2 as odorless. The D/T number recorded is the dilution ratio needed to make the ambient air sample non-detectable, with a D/T of seven commonly used as a threshold for odor nuisance in municipal codes [26], and a D/T of five as the threshold in the state of New Jersey [36].
2.4. Data Preparation
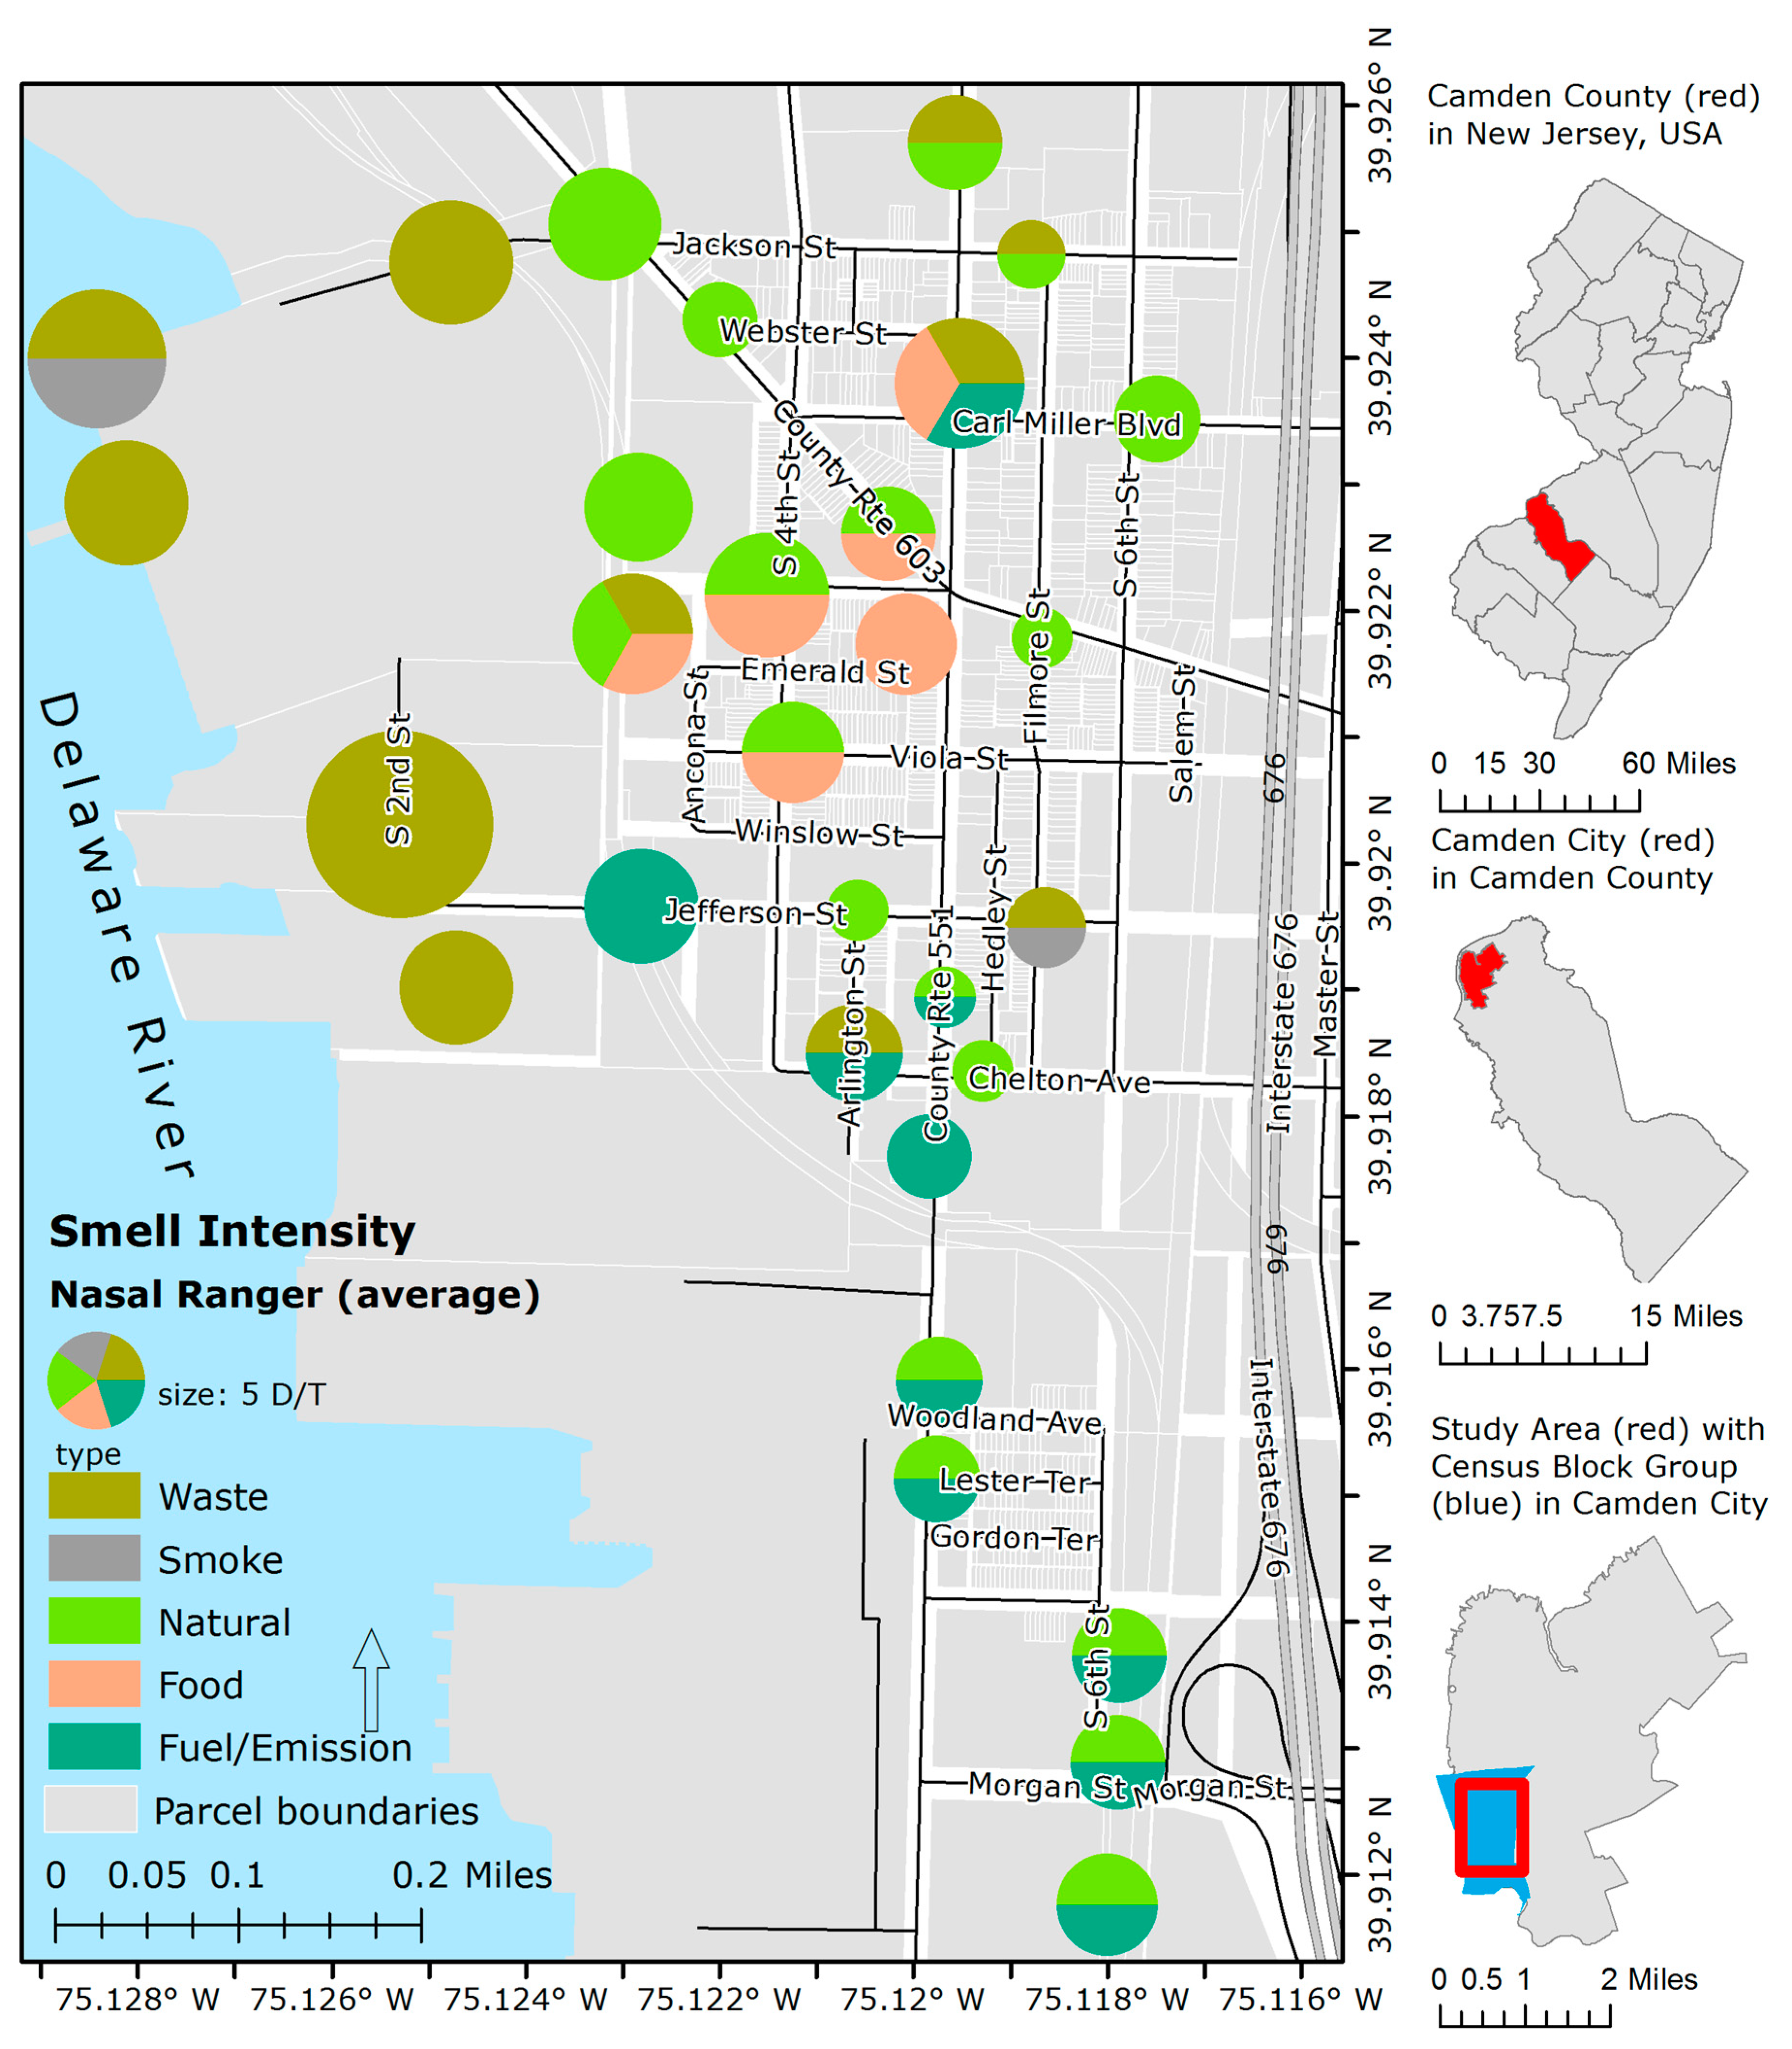
All location information and recorded observations were mapped in ArcGIS 10.5 and sample sites were symbolized with pie charts, displaying the different odors perceived at each location, with size varying by the average intensity for each location via the Nasal Ranger measurements. To evaluate the spatial pattern of the odors, the study area was delineated by the natural boundaries of South 4th Street and Chelton Avenue to yield three equally sized subregions representations the northwestern, northeastern, and southern sectors.
3. Results
3.1. Odor Intensity
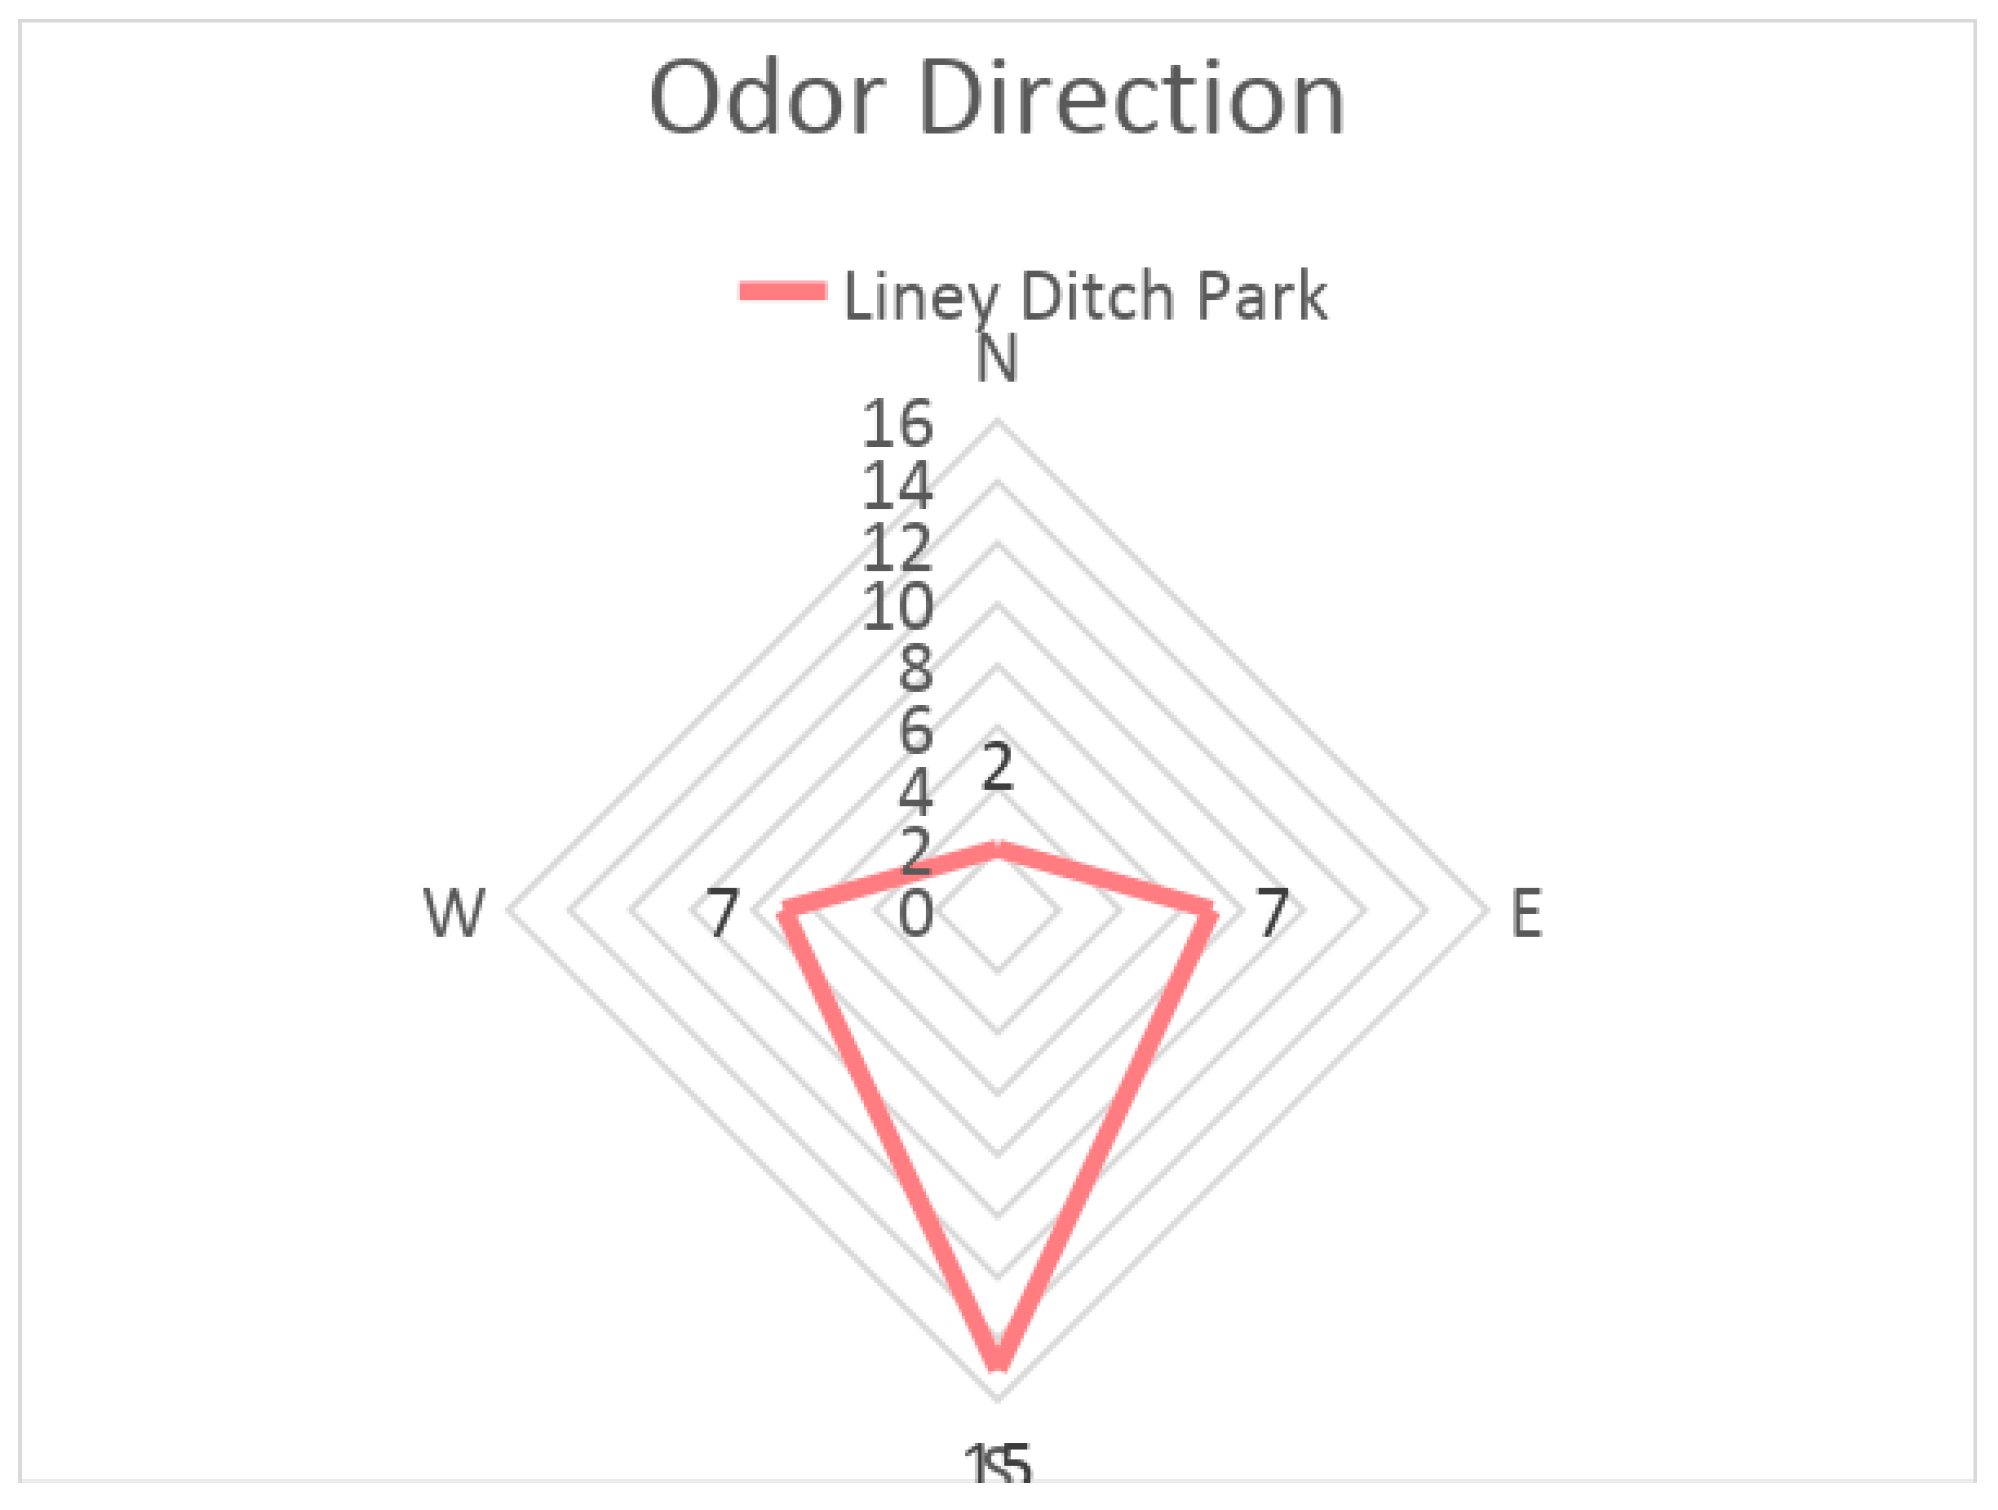
By numerous metrics, the intensity of odor exceeded the threshold of nuisance odor in New Jersey, confirming the first research question. Areas in the northwestern sector, adjacent to the various industrial operations, had the highest recorded intensities of odor, up to 18.75 D/T average location value, diminishing toward the eastern perimeter, with the lowest average value of 2.0 D/T. Average odor intensities exceeded five D/T, the threshold commonly used to indicate odor nuisance in the state of New Jersey, at 50% of the locations, and the overall average across all sites was 5.70 D/T. Odor intensity varied by cardinal direction (e.g., Figure 2, Table 3), with most frequent intense odors coming from the southern sector, but the highest intensity recorded in the northwest sector, along the industrial waterfront, with 8.3 D/T. Overall, 38.3% of the cardinal direction odor intensity measurements exceeded five D/T. Mapped results of odor intensity and smell category are depicted in Figure 3 and summarized in Table 3.
3.2. Odor Frequency and Spatial Distribution
The perceived odors did vary across the study area, with a distinct spatial pattern to the intensity and type of odor, confirming the second research question. Across all sites, approximately 40% of the odors were attributable to natural sources, including lawn clippings, trees, and other vegetation; waste was the second most frequently identified smell (23%), followed by fuel emissions (21%). Food smells and cigarette smoke comprised 13% and 4% respectively. There was a distinct spatial pattern to the perceived presence of odors, with waste-related odors concentrated in the northwestern sector, food odors in the northeastern sector, and emission-related odors in the southern sector, especially as the distance between the industrial operations on the Delaware River and Interstate-676 diminished. Table 3 details the spatial pattern of the intensity and frequency of perceived odors by study area sector.
4. Discussion
The study extends previous work, which found a relationship between proximity to odor emitting sites and higher levels of odor annoyance in the Waterfront South neighborhood of Camden, especially in comparison to residents of North Camden [6]. In this study, the presence and intensity and spatial pattern of three primary odor types (waste treatment, industrial activity, diesel/auto emissions) observed in Waterfront South, suggest that malodor and air pollution mitigation efforts have not eliminated odor pollution in this neighborhood. Given the history and prevalence of nuisance activities in this community, the findings suggest that odor pollution may continue to function as an environmental stressor. Below, we further consider the implications of these findings within the environmental odor literature and case study context.
Since temporal fluctuations in urban activity influence both odor emission and perception, it is important to note that observations for this study were conducted on Saturdays in November, which may experience lower volumes of waste treatment, industrial and truck activity, and freeway traffic in the Waterfront South neighborhood. Additionally, the average temperature during data collection was 50 degrees Fahrenheit. Seasonal effects including humidity, atmospheric pressure, and temperature influence odor emissions, with warmer, humid conditions leading to increased microbial concentrations and waste-related malodors [37]. Seasonal conditions can also influence odor detection by the human olfactory system [38], yet there is no consensus on the scale of these effects for environmental odor perception and annoyance [39]. In the Waterfront South context, the intensity and distribution of odors may exacerbate the experience of malodors when they occur or contribute to low-level annoyance there is little relief of nonodorous air.
The human nose is capable of detecting at least a trillion odors; yet, unlike most other human sensing abilities, the human nose resists technological replacement, and chemical testing of aromatic compounds cannot easily identify odors as humans perceive them [40]. The human olfactory system involves the perception and interpretation of odor through both bottom-up (affective and somatic response) and top-down (knowledge, belief, expectation) processing systems [8]. Odors can cause toxological responses, of irritation of the eyes, nose, and throat, or other effects [8], and additional responses such as odor aversion, annoyance and stress can generate negative health reactions such as psychological feelings of displeasure or worry, nausea, vomiting, headaches, sleep disturbance, appetite loss, and irritation of eyes, nose, and throat [41]. Physical reactions can occur in response to a malodor, even when the odor itself does not present a health risk, depending on the intensity (strength), quality, recognition, and type of odor [42].
Odor perception and concern about environmental health effects strongly correlate with increased symptom reporting, thus odor annoyance is a prevalent (nontoxicological) mechanism, offering insight regarding adverse community health effects from industrial odor pollution [42]. Experienced as a background, non-life threatening condition, odor pollution is considered an environmental stressor [3] and often an early warning signal of potentially, long-term health effects [43]. Environmentally related health worry has been identified as a stronger predictor for illness than actually living in proximity to industry [44]. Malodors have also been found to negatively affect home prices in rural communities near livestock facilities [45], in coastal communities near polluted water resources [46], and in particular building units downwind of a landfill [47].
While odor annoyance is reported to be the top air pollution complaint received by many air quality management authorities, regulatory response is varied. In the U.S., there is no federal regulatory framework for odor pollution. The U.S. Clean Air Act does not regulate odors as an airborne pollutant, though, federal agencies have also commissioned several important studies on the effects of odors for human health and methodologies for measuring odor pollution [48,49,50,51]. In their survey of odor regulations in the U.S., Epstein and Freeman [13] find that 42 states address odor pollution through regulations related to nuisance or quality of life, with about half of the agencies using some type of odor measurement technology and half relying on the judgment of an agency inspector; most states do not include odor pollution in the environmental review and permitting process.
Yet, persistent community odor pollution is an environmental stressor, occurring in proximity to odor nuisance industries, many of which are disproportionately located in low-income, nonwhite communities, including hazardous waste facilities, an impetuous of the environmental justice movement [52,53]. Recent research on the efforts to investigate urban smellscapes and celebrate olfactory heritage often omit considerations of environmental justice. This research the Waterfront South neighborhood contributes to efforts to study odor pollution as an environmental justice concern [54,55].
5. Conclusions
This study quantitatively and qualitatively assessed odor nuisance in the Waterfront South neighborhood of Camden, New Jersey, offering new insight to the spatial pattern of odor in this urban context with residential and industrial activity. Odors in the Waterfront South neighborhood were found to exceed the threshold of nuisance odor, defined by the State of New Jersey, across many locations and statistical summaries of the field observations, and there was a distinct spatial pattern to the type and intensity of odor across the neighborhood. Twenty years after the Dalton and Dilks [6] study, this study of spatially explicit field olfactometry in the Waterfront South zone also identified malodors at sample sites in the residential areas, with spatial variability in the type and intensity and concentrated odors from industrial activities and transportation corridors. Further research should examine the fine-scale variability in odor perception across space and time and relate it to the perception by residents and their health outcomes.
Author Contributions
Conceptualization, J.K., M.L., and Z.C.; Methodology, J.K., M.L., and Z.C.; Validation, M.L.; Formal analysis, Z.C. and M.L.; Data curation, M.L. And Z.C.; Writing—original draft preparation, J.K., M.L., and Z.C.; Writing—review and editing, J.K., Z.C., and P.D.; Visualization, M.L., and Z.C.; Supervision, J.K., Z.C., and P.D.; Project administration, J.K.
Funding
This project was conducted with support from a Rowan University Seed Grant 10110-60319-7460-12.
Conflicts of Interest
The authors declare no conflict of interest.
References
- Reinarz, J. Past Scents: Historical Perspectives on Smell; University of Illinois Press: Chicago, IL, USA, 2014; ISBN 978-0-252-07979-5. [Google Scholar]
- Kiechle, M.A.; Sutter, P.S. Smell Detectives: An Olfactory History of Nineteenth-Century Urban America; University of Washington Press: Seattle, WA, USA, 2017; ISBN 978-0-295-74193-2. [Google Scholar]
- Sucker, K.; Both, R.; Winneke, G. Adverse effects of environmental odours: Reviewing studies on annoyance responses and symptom reporting. Water Sci. Technol. 2001, 44, 43–51. [Google Scholar] [CrossRef] [PubMed]
- Schiffman, S.S.; Williams, C.M. Science of odor as a potential health issue. J. Environ. Qual. 2005, 34, 129–138. [Google Scholar] [PubMed]
- Hayes, J.; Stevenson, R.; Stuetz, R. The impact of malodour on communities: A review of assessment techniques. Sci. Total Environ. 2014, 500, 395–407. [Google Scholar] [CrossRef] [PubMed]
- Dalton, P.; Dilks, D. Odor, Annoyance and Health Symptoms in a Residential Community Exposed to Industrial Odors; Monell Chemical Senses Center, The Science Preparation Alliance of Rutgers and Camden, The Forum for Education in Neuroscience and Applied Cognition: Philadelphia, PA, USA, 1997. [Google Scholar]
- Nicell, J.A. Assessment and regulation of odour impacts. Atmos. Environ. 2009, 43, 196–206. [Google Scholar] [CrossRef]
- Smeets, M.A.; Dalton, P.H. Evaluating the human response to chemicals: Odor, irritation and non-sensory factors. Environ. Toxicol. Pharmacol. 2005, 19, 581–588. [Google Scholar] [CrossRef] [PubMed]
- Capelli, L.; Sironi, S.; Del Rosso, R.; Guillot, J.-M. Measuring odours in the environment vs. dispersion modelling: A review. Atmos. Environ. 2013, 79, 731–743. [Google Scholar] [CrossRef]
- Brandt, R.C.; Adviento-Borbe, M.A.A.; Elliott, H.A.; Wheeler, E.F. Protocols for Reliable Field Olfactometry Odor Evaluations. Appl. Eng. Agric. 2011, 27, 457–466. [Google Scholar] [CrossRef]
- Brancher, M.; Griffiths, K.D.; Franco, D.; Lisboa, H.D.M. A review of odour impact criteria in selected countries around the world. Chemosphere 2017, 168, 1531–1570. [Google Scholar] [CrossRef]
- Mahin, T.; Pope, R.; McGinley, C. When Is a Smell a Nuisance? An overview of different approaches taken around the world in setting odor-control regulations. Water Environ. Technol. 2000, 12, 49–53. [Google Scholar]
- Epstein, E.; Freeman, B.C. Legal and regulatory aspects related to odors. Proc. Water Environ. Fed. 2004, 2004, 104–110. [Google Scholar] [CrossRef]
- Porteous, J.D. Landscapes of the Mind: Worlds of Sense and Metaphor; University of Toronto Press: North York, ON, Canada, 1990; ISBN 978-0-8020-5857-7. [Google Scholar]
- Rodaway, P. Sensuous Geographies: Body, Sense and Place; Routledge: London, UK, 1994; ISBN 978-0-415-51339-5. [Google Scholar]
- Henshaw, V. Urban Smellscapes: Understanding and Designing City Smell Environments; Routledge: London, UK, 2013. [Google Scholar]
- Henshaw, V.; McLean, K.; Medway, D.; Perkins, C.; Warnaby, G. Designing with Smell: Practices, Techniques and Challenges; Routledge: New York, NY, USA, 2018. [Google Scholar]
- Xiao, J.; Tait, M.; Kang, J. A perceptual model of smellscape pleasantness. Cities 2018, 76, 105–115. [Google Scholar] [CrossRef] [Green Version]
- Classen, C.; Howes, D.; Synnott, A. Aroma: The Cultural History of Smell; Routledge: London, UK, 1994; ISBN 978-0-415-11473-8. [Google Scholar]
- Drobnick, J. The Smell Culture Reader; Bloomsbury Academic: New York, NY, USA, 2006; ISBN 978-1-84520-213-2. [Google Scholar]
- Pink, S. An urban tour: The sensory sociality of ethnographic place-making. Ethnography 2008, 9, 175–196. [Google Scholar] [CrossRef]
- Schiffman, S.S.; Studwell, C.E.; Landerman, L.R.; Berman, K.; Sundy, J.S. Symptomatic Effects of Exposure to Diluted Air Sampled from a Swine Confinement Atmosphere on Healthy Human Subjects. Environ. Health Perspect. 2005, 113, 567–576. [Google Scholar] [CrossRef] [Green Version]
- Sówka, I.; Pachurka, Ł.; Bezyk, Y.; Grzelka, A.; Miller, U. Application of field studies and geostatistical methods in assessment of odour nuisance based on selected examples from municipal, industrial and agricultural environments. Ochr. Sr. Zasobów Nat. 2017, 28, 16–21. [Google Scholar] [CrossRef] [Green Version]
- Sόwka, I.; Grzelka, A.; Bezyk, Y.; Miller, U. GIS-based modelling of odour emitted from the waste processing plant: Case study. E3S Web Conf. 2017, 17, 85. [Google Scholar] [CrossRef]
- Intarakosit, E. GIS-Based Odor Impact Assessment from Biosolids Land Application Sites—ProQuest; Universtiy of Maryland, College Park: College Park, MD, USA, 2010. [Google Scholar]
- Jairam, S. Development of An Odor Management Plan for Industrial Stationary Sources in An Urban Environment: A Case Study for Broward County, Florida—ProQuest; Florida International University: Miami, FL, USA, 2006. [Google Scholar]
- Dorwart, J.M. Camden County, New Jersey: The Making of a Metropolitan Community, 1626–2000; Rutgers University Press: New Brunswick, NJ, USA, 2001; ISBN 978-0-8135-2958-5. [Google Scholar]
- Gillette, H. Camden after the Fall: Decline and Renewal in a Post-Industrial City; University of Pennsylvania Press: Philadelphia, PA, USA, 2006; ISBN 978-0-8122-1968-5. [Google Scholar]
- Pomar, O.; Cole, L. Camden, New Jersey, and the struggle for environmental justice. Clgh. Rev. J. Poverty Law Policy 2002, 36, 94–108. [Google Scholar]
- New Jersey Environmental Justice Task Force. Camden Waterfront South Report Jan. 2002–Dec. 2005 and Action Plan; New Jersey Environmental Justice Task Force: Trenton, NJ, USA, 2006.
- New Jersey Department of Environmental Protection. Camden Waterfront South Air Toxics Pilot Project; Division of Air Quality: Salt Lake City, UT, USA, 2005.
- NJDEP. Camden Waterfront South Air Toxics Pilot Project: Qualitative Assessment of Stressors; NJDEP: Trenton, NJ, USA, 2004.
- Garmin Ltd. eTrex Owner’s Manual. Available online: https://static.garmin.com/pumac/eTrex_10_20x_30x_OM_EN.pdf (accessed on 14 August 2019).
- Nielsen-Kellerman. Kestrel Weather Meters Model Numbers 1000–3500. Available online: https://kestrelinstruments.com/mwdownloads/download/link/id/23/ (accessed on 14 August 2019).
- St. Croix Sensory, Inc. The Nasal Ranger Field Olfactometer Operation Manual 6.2. Available online: http://www.fivesenses.com/equipment/nasalranger/nasalranger/ (accessed on 14 August 2019).
- New Jersey Department of Environmental Protection; Bureau of Stationary Sources. Guidance Document for Odor Control at Municipal Wastewater/Sludge Handling Treatment Facilities. Available online: https://www.state.nj.us/dep/aqpp/techman.html (accessed on 16 August 2019).
- Kaarakainen, P.; Meklin, T.; Rintala, H.; Hyvärinen, A.; Kärkkäinen, P.; Vepsäläinen, A.; Hirvonen, M.-R.; Nevalainen, A. Seasonal Variation in Airborne Microbial Concentrations and Diversity at Landfill, Urban and Rural Sites. Soil Air Water 2008, 36, 556–563. [Google Scholar] [CrossRef]
- Kuehn, M.; Welsch, H.; Zahnert, T.; Hummel, T. Changes of pressure and humidity affect olfactory function. Eur. Arch. Oto-Rhino-Laryngol. Head Neck 2008, 265, 299–302. [Google Scholar]
- Bull, M. Design with smells: The environmental scientist’s perspective. In Designing with Smell: Practices, Techniques and Challenges; Henshaw, V., McLean, K., Medway, D., Perkins, C., Warnaby, G., Eds.; Routledge: London, UK, 2018; pp. 111–118. [Google Scholar]
- Philpott, C.M.; Bennett, A.; Murty, G.E.; Philpott, C. A brief history of olfaction and olfactometry. J. Laryngol. Otol. 2008, 122, 657–662. [Google Scholar] [CrossRef]
- National Research Council. Odors from Stationary and Mobile Sources: Executive Summary; The National Academies Press: Washington, DC, USA, 1979; ISBN 978-0-309-02877-6. [Google Scholar]
- Claeson, A.-S.; Lidén, E.; Nordin, M.; Nordin, S. The role of perceived pollution and health risk perception in annoyance and health symptoms: A population-based study of odorous air pollution. Int. Arch. Occup. Environ. Health 2013, 86, 367–374. [Google Scholar] [CrossRef]
- Baird, J.C.; Berglund, M.B.; Berglund, U.; Lindvall, T. Symptom patterns as an early warning signal of community health problems. Environ. Int. 1990, 16, 3–9. [Google Scholar] [CrossRef]
- Shusterman, D. The health significance of environmental odour pollution: Revisited. J. Environ. Med. 1999, 1, 249–258. [Google Scholar] [CrossRef]
- Herriges, J.A.; Secchi, S.; Babcock, B.A. Living with Hogs in Iowa: The Impact of Livestock Facilities on Rural Residential Property Values. Land Econ. 2005, 81, 530–545. [Google Scholar] [CrossRef] [Green Version]
- Liu, T.; Opaluch, J.J.; Uchida, E. The impact of water quality in Narragansett Bay on housing prices. Water Resour. Res. 2017, 53, 6454–6471. [Google Scholar] [CrossRef]
- Li, R.Y.M.; Li, H.C.Y. Have housing prices gone with the smelly wind? Big data analysis on landfill in Hong Kong. Sustainability 2018, 10, 341. [Google Scholar] [CrossRef]
- Copley International Corporation. National Survey on the Odor Problem: Phase I of a Study on the Social and Economic Impacts of Odors; Prepared for the National Air Pollution Control Administration; Copley International Corporation: Boston, MA, USA, 1970. [Google Scholar]
- Copley International Corporation. A Study on the Social and Economic Impacts of Odors Phase II; Prepared for the Environmental Protection Agency; Copley International Corporation: Boston, MA, USA, 1971. [Google Scholar]
- Copley International Corporation. A Study on the Social and Economic Impacts of Odors: Phase III Development and Evaluation of a Model Odor Control Ordinance; Prepared for the Environmental Protection Agency; Copley International Corporation: Boston, MA, USA, 1973. [Google Scholar]
- Wahl, G.H. Regulatory Options for the Control of Odors; U.S. Environmental Protection Agency: Research Triangle Park, NC, USA, 1980.
- Bullard, R.D. Solid Waste Sites and the Black Houston Community. Sociol. Inq. 1983, 53, 273–288. [Google Scholar] [CrossRef]
- Mohai, P.; Saha, R. Racial Inequality in the Distribution of Hazardous Waste: A National-Level Reassessment. Soc. Probl. 2007, 54, 343–370. [Google Scholar] [CrossRef] [Green Version]
- Wing, S.; Cole, D.; Grant, G. Environmental injustice in North Carolina’s hog industry. Environ. Health Perspect. 2000, 108, 225–231. [Google Scholar] [CrossRef]
- Wing, S.; Horton, R.A.; Marshall, S.W.; Thu, K.; Tajik, M.; Schinasi, L.; Schiffman, S.S. Air Pollution and Odor in Communities near Industrial Swine Operations. Environ. Health Perspect. 2008, 116, 1362–1368. [Google Scholar] [CrossRef]
Figure 1.
Field sample locations in the Waterfront South Neighborhood, Camden, NJ.

Figure 2.
Sample of nasal ranger readings at Liney Ditch Park.

Figure 3.
Example of odor data collected at each randomly selected sampling site in the Waterfront South neighborhood in Camden, NJ.
Figure 3.
Example of odor data collected at each randomly selected sampling site in the Waterfront South neighborhood in Camden, NJ.


Table 1.
The timeline of odor pollution activities affecting the Waterfront South neighborhood, compiled by the authors [28,29,30]. Unless otherwise indicated, all activities are still operational in 2019. Facilities indicated with an asterisk were identified by the New Jersey Environmental Taskforce as having a significant impact in contributing to one or more air pollutants between 2002–2005 [31].
| Year | Industry | Activity Generating Odor Pollution |
|---|---|---|
| 1898–1999 | American Minerals * | Chalk factory grinding earth materials |
| 1903 | Mafco * | Licorice processing resulting in odor annoyance complaints of “burnt organic matter” odors |
| 1929 | Camden Iron and Metal * | Metal recycling |
| 1948 | State Metal Industries * | Melts, recycles, and demilitarizes aluminum |
| 1952 | City of Camden primary wastewater treatment plant opens | Sewage treatment for the City of Camden (on the site that is now the CCMUA) |
| 1957 | Walt Whitman Bridge opens to traffic | Auto-emissions |
| 1962 | GP Gypsum * | Upwind facility gypsum (chalk) processing for wallboards |
| 1965 | Plastic Consulting * | Manufactures and applies plastic non-stick coatings for equipment |
| 1971 | Colonial Processing Inc. * | Iron and steel foundry manufacturing steel castings |
| 1977 | State Metal Industries opens a secondary aluminum smelter | Aluminum smelting and processing |
| 1977 | CCMUA* takes over City of Camden wastewater treatment plant | Sewage treatment for 37 municipalities in Camden County |
| 1978 | CCMUA constructs an open-air waste sludge composting facility | Composts 2000 tons of sewage sludge resulting in noxious odors |
| 1980s | North-South Freeway in Camden (Interstate-676) | Heavy traffic and increased air pollution by linking the Benjamin Franklin Bridge crossing into Philadelphia with routes to southern NJ |
| 1987 | CCMUA secondary sewage treatment plan (Del. No. 1) | Treats 58 million gallons of sewage a day |
| 1991 | Covanta Energy Recovery Center * | Trash-to-steam incinerator burns refuse from 37 towns in the Camden County (1050 tons per day) to generate electricity |
| 2001 | St. Lawrence Cement * | Processes 848,771 tons of granulated blast furnace slag per day (60 tons of fine dust annually); increased traffic through the area from some 20,000 to 77,00 truck movements a year |
Table 2.
Demographic characteristics by geography, 2017 estimates, US Census Quick Facts.
| Characteristic | Units | Camden City | Camden County | New Jersey | USA |
|---|---|---|---|---|---|
| Total Population | total persons | 74,532 | 510,719 | 9,005,644 | 325,719,178 |
| Population Density | persons/sq mi | 8669.9 | 2321.5 | 1195.5 | 87.4 |
| Median Income | USD | $26,214.00 | $63,028.00 | $73,702.00 | $55,322.00 |
| % NonWhite | percentage | 94.70% | 43.50% | 44.90% | 39.30% |
| Persons per Household | persons/household | 2.96 | 2.71 | 2.73 | 2.64 |
| High School degree or more | percentage | 68.80% | 88.30% | 88.90% | 87.00% |
| In labor force | percentage | 56.20% | 66.20% | 65.70% | 63.10% |
Table 3.
Odor intensity and frequency of category by sector.
| Odor Intensity | NW | NE | S |
| Avg. NR D/T | 8.325 | 4.824 | 3.925 |
| Odor Type 1 | NW | NE | S |
| Waste | 60% | 30% | 20% |
| Smoke | 10% | 0% | 10% |
| Natural | 4% | 80% | 70% |
| Food | 10% | 50% | 0% |
| Fuel/Emission | 80% | 10% | 80% |
1 More than one odor category may be recorded at each location, so values do not total 100%.
© 2019 by the authors. Licensee MDPI, Basel, Switzerland. This article is an open access article distributed under the terms and conditions of the Creative Commons Attribution (CC BY) license (http://creativecommons.org/licenses/by/4.0/).
Share and Cite
MDPI and ACS Style
Kitson, J.; Leiva, M.; Christman, Z.; Dalton, P. Evaluating Urban Odor with Field Olfactometry in Camden, NJ. Urban Sci. 2019, 3, 93. https://doi.org/10.3390/urbansci3030093
AMA Style
Kitson J, Leiva M, Christman Z, Dalton P. Evaluating Urban Odor with Field Olfactometry in Camden, NJ. Urban Science. 2019; 3(3):93. https://doi.org/10.3390/urbansci3030093
Chicago/Turabian StyleKitson, Jennifer, Monica Leiva, Zachary Christman, and Pamela Dalton. 2019. "Evaluating Urban Odor with Field Olfactometry in Camden, NJ" Urban Science 3, no. 3: 93. https://doi.org/10.3390/urbansci3030093