Exploration of the 3D World on the Internet Using Commodity Virtual Reality Devices


School of Engineering, Computer & Mathematical Sciences, Auckland University of Technology,55 Wellesley Street East, Auckland Central, Auckland, 1010, New Zealand.
*
Author to whom correspondence should be addressed.
Multimodal Technol. Interact. 2017, 1(3), 15; https://doi.org/10.3390/mti1030015
Submission received: 27 April 2017
/
Revised: 12 July 2017
/
Accepted: 17 July 2017
/
Published: 21 July 2017
(This article belongs to the Special Issue Virtual Reality and Games)
Abstract
:This article describes technical basics and applications of graphically interactive and online Virtual Reality (VR) frameworks. It automatically extracts and displays left and right stereo images from the Internet search engines, e.g., Google Image Search. Within a short waiting time, many 3D related results are returned to the users regarding aligned left and right stereo photos; these results are viewable through VR glasses. The system automatically filters different types of available 3D data from redundant pictorial datasets on the public networks (the Internet). To reduce possible copyright issues, only the search for images that are “labelled for reuse” is performed; meaning that the obtained pictures can be used for any purpose, in any area, without being modified. The system then automatically specifies if the picture is a side-by-side stereo pair, an anaglyph, a stereogram, or just a “normal” 2D image (not optically 3D viewable). The system then generates a stereo pair from the collected dataset, to seamlessly display 3D visualisation on State-of-the-art VR devices such as the low-cost Google Cardboard, Samsung Gear VR or Google Daydream. These devices are used to provide an immediate, controllable 3D display. In this article, we propose an image type classification technique that dynamically extracts co-aligned stereo pairs with rich 3D visualisation to VR viewers. This system is portable, simple to set up and operate. From some initial experiment results; our system is shown to be relatively fast, accurate, and easy to implement. With such system, Internet users all over the World could easily visualise millions of real life stereo datasets publicly available on the Internet; which are believed to be useful for VR testing and learning purposes.
1. Introduction
Colour and depth signals deliver visual information about the scene around us. Human brain continuously receives visual cues (from the two eyes) which are analysed to rebuild a spatial 3-dimensional (3D) structure of the world effortlessly; In other words, it is natural for a human to see things in 3D. This enables human to discover the appearance, shape, and distance of distinct objects on their surroundings. However, a visual illusion of 3D perception can be created based on 2D flat images; e.g., the pictures of a 3D cinema, the LCD screen of a 3D television, and the image panels of Virtual Reality (VR) systems. When people view these with special eye-wears, the 3D illusion of stereoscopic scenes still appear. Human brain attempts to determine which patterns viewed from the left eye corresponding to patterns viewed from the right eye, to represent the same scene points or regions [1]. This is scientifically known as the “binocular vision” or “stereo vision” system. Virtual Reality (VR) employs this knowledge to bring 3D perception to a single flat 2D image. Today, there are many commodity VR systems such as what are shown in Figure 1. Underneath such systems, there are simply one flat stereoscope picture or an LCD screen that project two stereo images to our left and right eyes synchronously and simultaneously.
1.1. Binocular Problems with Traditional VR Kit
While traditional stereoscopic kits and VR devices have the same principal in binocular vision, the recent VR technology still has two advantages over the former. The first advantage is the constant distance and angle between stereoscopic images and human eyes. Even though 3D cinemas and 3DTVs also have digital processing computers to display multiple stereoscopic images and videos to the users, their binocular vision can be affected by the binocular disparity.
On the first hand, with 3D cinemas and 3DTVs, The closer the viewers to the stereoscopic images, the greater the binocular disparity is [6]. The overly wide binocular disparity can cause double vision and strain human eyes. The same issue can also happen if the viewers are on the far left or the far right of the stereoscopic images. To reduce this binocular disparity, the viewers can sit further from the stereoscopic images. However, sitting too far from the display is prone to create a conflict between accommodation (a process which the eyes are keeping the sharpness picture a particular object while focusing on it) and vergence (the movement of two eyes toward the same point of vision) [7]. To allow the viewers perceive the depth of image, 3D cinemas and 3DTVs trick the eyes converge to a virtual object on the display while still maintain the accommodation on the picture background. When the distance between the viewers and the display is large, the object will appear very small; thus makes it difficult for the eyes to focus. Moreover, other objects that either move around the screen or have high luminance are prone to distract the users; they can create accommodation-vergence conflicts which can cause significant eye fatigue and visual discomfort [8].
On the other hand, VR devices allow the viewers to adjust the distance and angle of the image suitable for their preferences. Since there is no other object of the viewers’ vision besides the stereoscopic image when using the devices, accommodation-vergence conflict is avoidable.
It is true that the old stereoscopic kit created by O. Holmes can get rid of these issues as well; however, the lack of digital processing power makes it impossible for the viewers to enjoy different stereoscopic images seamlessly. On the contrary, VR devices are capable of displaying not only static stereoscopic images but also stereoscopic videos; which is its second advantage.
1.2. Limited Dataset in VR Applications
VR allows people to visualise the realistic 3D scenes without getting out of the offices; with VR, people can safely and comfortably explore the tropical forests, swim in the deep oceans, or fly in the sky. It is ideal for entertainment, education, and training. Today, there exist many free or paid applications; however, the datasets are very limited. Most current systems only provide very few viewable high-quality scenes, due to the limitation of data acquisition, storages, and copyrights.
There are billions of images publicly available on the Internet (e.g., the Google Image Search database). Just a tiny percentage of them are 3D visible by VR (e.g., images that contain left and right stereo parts); however, these small bits still count millions. These publicly available datasets are significantly larger than any others provided by existing tools.
1.3. Current Goal of the Project
Our goal is to provide a computational filter, to search the “messy” Internet for valuable 3D datasets, categorise, and deliver them for free to the VR end-users. The filter is required to be available in an affordable VR platform. To achieve this goal, we design an image classification algorithm and build a mobile app. The app is compatible with Google Cardboard, a VR platform that is available on most of the smartphones on today’s market. The app consists of two main features: (1) it can view stereoscopic images, and (2) it can retrieve stereoscopic images from the Internet.
There are no issues with the first feature; the viewers can view stereoscopic images correctly with no report of problem-related to their eyes or binocular vision. On the contrary, the limited hardware power of our developer’s smartphone makes us realise that it is not wise to implement the stereoscopic images filtering system onboard, which is due to the severe effect on battery life or the app performance. Because of this, we propose the use of cloud computing for the image classification; the app only retrieves the stereoscopic images from an online server, which is hosted by the Auckland University of Technology, New Zealand.
2. Background of Virtual Reality
The concept of VR has been established since the early 1930s; when author Stanley G. Weinbaum introduced a pair of goggles that put the user in a movie where, each object, each character can be interacted, in his science fiction named Pygmalion’s Spectacles [9]. From there, many organisations have used VR as a new platform that supports a variety of fields, such as military training, entertainment, flight simulation, medical education, and scientific visualisation [10].
Before the time of digital photography, 3D cinemas, and 3DTVs, stereoscopy had been noticed and investigated by C. Wheatstone since the 1840s [11], who had produced some early explanations of binocular vision. Motivated by his research, O. Holmes invented a stereoscope [12] a few years later (as shown in Figure 1–top-left). Back in those days, this was a relatively popular kit which had a lens for each eye, to make the image appear larger. It also horizontally translated the images to obtain a similar real-life stereoscopic view. The same ideas still apply in today’s state-of-the-art VR devices such as the low-cost Google Cardboard [3], Samsung Gear VR [4], and the premium Google Day Dream [5] (shown in Figure 1). In short, the LCD screen on each device displays a side by side image similar to what is seen in Figure 2a; here, each of the human eyes sees a different view, and the human brain does the hard work to merge these views and reconstruct a corresponding 3D scene.
2.1. VR Concept
Virtual reality (VR) is a set of technology which is used to create a computer-generated virtual environment where the users can experience and interact just as if they would do in real life [13]. It consists of four main components: Stereoscopic Displays, Motion Tracking Hardware, Input Devices, and Software Platforms [14]. The stereoscopic displays are designed as head-mounted displays for the users. However, in some virtual reality sets such as Cave Automatic Virtual Environment, these displays are in combination with physical areas to create multi-displays environments surrounding the users [15].
Figure 2b demonstrates the background theory of stereo vision that makes VR work. Shown in the figures are two points: B is a point virtually lying on the background, and P is a point lying in front of the background (they may look different in shape or colour). Human eyes have a base distance . These two points are projected on to the screen at different points: and for B, and and for P. Many 3D points will appear in our brain when the eyes see a set of two projected correspondence points. Theoretically, the distance between two correspondence points , will determine how close/far the point is, in space:
If , the point P will appear at infinity. When gets smaller, the point P gets closer to us. This establishes the optical principle of today’s Virtual Reality (VR).
While there were many successful applications for VR, the limitation of technology prevented it from becoming widely available for consumers. It was not until the 2010s that VR has become a system that people can set up in their home, which focuses on the use of VR head-mounted displays.
Currently, there are two main types of VR headsets which are available on the market: they are the dedicated-hardware type , and the smartphone-based type. The former consists of a custom head-mounted display and a custom input device, which delivers superior quality when compared with the smartphone-based type. However, the premium price-tag has prevented them from becoming ubiquitous.
On the contrary, smartphone-based VR headset is designed to make use of the smartphone display, processor, and sensor; thus reducing the cost of the head-mounted display to as low as a couple of dollars. One of the most popular examples is Google Cardboard introduced in 2014, which has been shipped over 10 million units in March 2017 [16]. By using a cardboard box as a head-mounted holder for the smartphone display, the users can experience VR through their smartphones. Since this type of VR headset is the most affordable one, more research is conducted on this platform. This is to identify the most potential VR headset that our project development is based on.
2.2. Google Cardboard
According to [17], Google Cardboard headset (Figure 1–top-right) consists of three main parts. The first part is a pair of lenses which have a diameter of 34 mm. These lenses are designed to achieve 80-degrees field of view, which is narrower than the lenses from the dedicated hardware VR such as HTC Vive (110-degrees field of view) [18]. Consequently, the users may experience “goggle effect”, the effect that makes the Google Cardboard headset case still visible to the users’ visual during the VR experience [19].
The second part is a mechanical body made of corrugated cardboard. This body is a combination of three separated cardboards, namely “chassis”, “t-shirt”, and “button”. To make the headset lighter and easy to handle, Google requires the thickness of the cardboard material to be approximately 1.7 mm. Moving on to the final part, a button for Google Cardboard. Google has replaced the “magnetic switch” button introduced in 2014 to a capacitive button, which consists of two conductive parts named as “pillow” and “strip”; both parts are made from metallized fabric (polyester Ni/Cu), a type of material that can trigger the capacitive sensing system when it touches the smartphone screen. Moreover, Google also uses Velcro and rubber band to assemble Google Cardboard headset securely.
One of the main limitation of Google Cardboard is its control mechanism; this smartphone-based VR platform only has one single button to navigate through VR contents. In the first generation of Google Cardboard, the button is designed as a magnetic switch attached to the side of the cardboard. The newest second generation of the platform still keeps the design of one single navigating button; however, the magnetic switch is replaced with a capacitive button, which is more durable.
Wendy Powell [20] has conducted a performance test to determine if the Google Cardboard control is efficient to navigate smoothly through the 3D environment. They create a virtual environment through Unity game engine and ask the testers to perform some straightforward and complex navigation through it. There are three control methods in this test, which are continuous motion, magnetic switch, and Bluetooth controller. The continuous motion is the most disliked method, due to the lack of control and the difficulty of turning while moving forward. The magnetic switch has better feedbacks from the testers, but it does not respond accurately. The Bluetooth controller is the most favoured method, due to its direct control of forwarding and backwards travel. However, this is not a part of Google Cardboard and may have some compatibility issues with some smartphones. Since the headset material is low-cost and widely available on the market, Google Cardboard is the most affordable platform for consumers.
2.3. Google Daydream
In 2016, Google has introduced a successor of Google Cardboard named Google Daydream (Figure 1–bottom-right). This new platform contains many improvements from the predecessor such as a new controller, a better build material, a new requirement for the smartphone hardware [21].
To be able to experience VR through Google Daydream, users are required to have three main components: A Daydream View headset, a Daydream controller, and a Daydream-ready phone. The headset is made mainly of thermos-bonded cloth, which is an improvement to Google Cardboard. With this new material, the headset is lighter and more comfortable than other similar headsets on the market. Its phone compartment contains six capacitive nubs which are used as directives for the phone automatic image alignment system [22].
Google Daydream also addresses the lack of a controller present in Google Cardboard. In this new VR headset, the company also develops a small controller consists of a clickable touchpad, two physical buttons, a gyroscope, an accelerometer, and a magnetometer [23].
Based on the review of [24], unlike Google Cardboard, the control system of Google Daydream is versatile. Its functionality varies from a virtual laser pointer, virtual steering wheels to a motion detector. The device is very similar to Nintendo Wii Remote, a controller from Wii game console. Google Daydream also requires smartphones that meet certain specifications to operate. With the addition of a new controller and a requirement of certain smartphones with a powerful processor, Google Daydream can deliver better VR experience when compared to Google Cardboard. However, the platform still has several issues like the predecessor, which are a narrow field of views, glare on display due to light from the outside of the VR headset case.
Currently, there are only four compatible phones: Google Pixel, Motorola Moto Z, Huawei Mate 9 Pro, and ZTE Axon 7. They are pricing from 400 USD to 869 USD. The headset itself also costs 79 USD [25]. With this fee barrier, it is tough for this device to be available as widely as Google Cardboard.
2.4. Samsung Gear VR
Samsung Gear VR (Figure 1–bottom-left) is a smartphone-based VR platform designed exclusively for Samsung Galaxy S and Samsung Galaxy Note product lines from 2015 onward. The product is a collaboration between Samsung and Oculus VR; the current generation, Gear VR 2017, is made mainly of plastic. Unlike Google VR platform, the Gear VR headset is equipped with a gyroscope, an accelerometer, a proximity sensor, and a head tracking system, which ensures that users can achieve virtual reality with low latency [26].
In the current generation, besides four physical buttons and a touchpad for navigating, Samsung also introduces a Bluetooth controller similar to the Google Daydream controller. One advantage of Gear VR when compared with Google Daydream is that the device has a wider field of view, which is 101 degree. With this, the VR experience can be more immersive and more natural; however, the headset still requires users to adjust centre alignment and focus whenever they put the phone into the headset [27].
2.5. VR Sickness
When exposure to virtual reality content, the users may experience some negative side effects called virtual reality sickness. Similar to motion sickness, virtual reality sickness symptoms are seen as discomfort, headache, nausea, pallor, disorientation, stomach awareness, and apathy [30].
Since the early 1990s, negative side effect in virtual reality has been examined by researchers such as Cobb [31], Sharples [32]. Based on the work of from other researchers, Stanney [33] states that after viewing virtual environment through a head-mounted display, 80–95% of testers experienced some negative side effects. Another research from Sharples [32] concludes that 60–70% of testers experienced sickness symptoms after experiencing various presentations of the virtual environment.
While they have similar symptoms, the cause of virtual reality sickness is different from motion sickness. It is because of the disruption in the vestibular system. When the head moves, this system sends the motion signals to the brain, which helps it identify where the body is in the space. When viewing a fast-moving virtual reality content, the eyes send fake motion signals to the brain. On the contrary, the vestibular system still tells the brain that the body is not moving. The mismatch between these two systems is the reason for virtual reality sickness [34].
In the Google I/O developer conference in 2014, Alex Faaborg, a designer of Google virtual reality technology, stated that it was essential for the VR system to have a connection with the user body. For more detail, VR mobile apps need to have a stable camera system with responsive head tracking sensor, which helps the users navigate smoothly; the transition between scenes in VR content is also required to be seamless without any flashing image or sudden moving object. These characteristics will help avoid nausea problem in the users [35].
2.6. Limited VR Contents
VR contents for smartphone-based VR currently are limited by the capability of smartphone hardware. Most VR apps have a very simple graphic and a short playtime, which makes the platform only a gimmick. Moreover, current smartphone hardware has a very high latency when compared with the dedicated hardware VR [36,37], which causes discomfort and nausea to the users after a period using the platform. While Google has addressed this issue with the introduction of a new VR platform named Google Daydream, there are only 4 compatible phones available on the market [25]. Another reason for the lack of VR apps is that most consumers are not familiar with the VR technology and Google Cardboard; content creators do not find the market large enough to develop quality experience [38]. Some successful VR content providers can be found in [39,40,41,42,43].
3. Smartphone VR Development Environment
Our main goal is to deliver a ubiquitous approach to 3D vision through VR. Thanks to the very low-cost headset and the vast list of compatible smartphones on the market, Google Cardboard is the most potential VR platform in the current time. Even though Google Cardboard supports both Android and iOS, our project will just focus on Android development; this is because iOS is available exclusively on iPhone, a line of smartphones developed solely by Apple Inc., Cupertino, CA, USA [44]. According to Google, an Android Google Cardboard app can be developed through three development environments: Android IDE, Unity Engine, and Unreal Engine [45].
3.1. Android IDE
With Android IDE, developers can choose either Android SDK or Android NDK to develop the app. Each option has its pros and cons. The main benefit of Android SDK is its use of Java, one of the most popular programming language [46]. While using Android SDK may make the app demand more powerful hardware power than it truly needs, the development time is shorter when compared with developing an app using native code [47]. The second option, Android NDK, is a toolset that helps developers access directly to smartphone hardware and native functions. It also allows the app to utilise the hardware power as well as achieving low latency in smartphone sensors. However, to use this set of tools, developers are required to have sound knowledge of C or C++ programming languages. They also need to understand how to find or create a suitable native code library of necessary functions for their app development [48]. There is no doubt that both options provide excellent development environments for Android apps; however, developing a VR app through these options requires more knowledge in API and a new set of function codes designed for VR [49,50].
3.2. Unity Engine
Unity is a game engine developed by Unity Technologies. The engine is utilised to work in over 20 popular platforms, such as iOS, Android, Windows; however, its focus is the mobile platform, which has the result of 34% of top 1000 free mobile games are based on the engine [51]. There are several features that make Unity as a top choice for the game engine. Firstly, it supports many modern game development tools, including multi-threaded job system, State Machine hierarchies and transitions, NVIDIA® PhysX®, and Real-time Global Illumination. These tools not only help create games that are suitable for the current users but also dramatically reduce development time. Secondly, there are four versions of Unity: Personal (Free), Plus ($35 monthly), Pro ($125 monthly), Enterprise (custom-made for enterprise); which are suitable for all types of game developers. The free Personal version is good enough for students and beginners to develop their games as well as release them on the market. Finally, Unity has a huge community which includes a library of tutorial suitable for all types of developers; an asset store that houses over 1700 free & paid extension tools. There is also an online forum where developers across the world discuss and help each other in game development [52].
3.3. Unreal Engine
Unreal Engine is a game engine by Epic Games, one of the leading gaming technology company. In 2006, Unreal Engine 3 was released; from there, it became one of the most popular engines that were not only used for developing blockbuster games such as Gears of War, XCOM: Enemy Unknown; but also, a low-cost but high-quality development platform for students and independent developers [53,54]. When Unity, a game engine competitor, announced a free model for independent developers, Epic Games also decided that it was the time for its game engine to become ubiquitous. In 2015, all the features from the latest version, Unreal Engine 4, is getting free of charge for personal usage. The commercial developers only have to pay 5% of their profit when their games are on sale on the market. The company also states that they expect virtual reality will be the highlight of the gaming industry; therefore, it is a vital part of the future of Unreal Engine [55]. Unreal Engine 4 has many advanced features that are suitable for developing high budget games, which includes DirectX 12 Rendering, Cascade Visual Effects, Artificial Intelligence, Post-Process Effects. Moreover, Unreal Engine 4 introduces Blueprints Visual Scripting, a tool that simplifies the game scripting process [56].
3.4. Unity Engine & Unreal Engine Comparison
Since Android IDE demands much more knowledge and development time to achieve the project goal, only Unity Engine and Unreal Engine have a potential to deliver the project in the time-frame. Each of the engines has their advantages and disadvantages; we compare features of both the engines to find the most suitable development platform. We group them into three aspects: Development feature, Development fee, Community. The comparison is displayed in Table 1.
In the comparison table, it is noticeable that Unity Engine provides better performance for smartphone apps; It also has a much bigger asset and tutorial library for novice developers. Moreover, the engine ability to export the project a wide range of platforms, including Android, iOS, the Web app will help make the app ubiquitous.
4. Publicly Available 3D Related Datasets on the Internet
Today, there exist many keyword-based image search, as embeded in web-based search engines such as Google Image Search, AltaVista Image Search, Corbis, GettyImages, and MS Office Clipart. Most of them offer a content filter to help users find the wanted datasets. By searching images on these engines using keyword “3D”, millions of publicly available images can be found. Amongst, there are at least three different types of optical 3D related images:
- Side by side combined stereo images (searching keyword: “side by side stereo 3D”, “cross eye 3D”, or “parallel eye 3D”).
- Anaglyph images (searching keyword: “anaglyph 3D”, “red cyan 3D”, or “red blue 3D”).
- Stereogram images (searching keyword: “stereogram 3D”, “autostereogram 3D”, or “magic eye 3D”).
Figure 3 displays the results of a quick Google Search on keyword: “cross eye 3D”. Notice that the search engine is set to find only images labeled for reuse; in other words, these images can be used for any purpose, and in any area, without being modified. Even more, Google also provide categories of the images for the users, as seen in the figure, some of the categories are: “woman”, “minecraft”, “skyrim”, “dragon”, “snake”, “dog”, “cat”, “spider”.
4.1. Side by Side Parallel- and Cross-Eyed Views
Parallel- and Cross-eyed Viewing are two popular methods for viewing 3D scenes with the naked eye. Correspondingly, parallel- and cross-eyed side-by-side stereo pairs are made for each method. They are single images stored in general image formats such as JPEG, PNG, BMP, GIF. The internal arrangements of the two images are straightforward: the images are placed horizontally side-by-side either left/right or right/left. These specific arrangements have the advantage of allowing users to see the 3D illusion by converging the eye viewing directions. To see the cross-eyed images, a viewer must converge his views in a way that his left eye looks at the right image and his right eye looks at the left picture. For the parallel-eyed pair, his left eye must look at the left image and his right eye looks at the right picture. Alternatively, the viewer can look “through” the photo as if he focused on a far point behind for the same effect.
4.2. Anaglyph
Anaglyph or anaglyphic image (as shown in Figure 4a) is another type of stereoscopic image developed in 1852 by W. Rollmann in Germany [60]. It is a single image in which views of a stereo pair are colour coded with red/blue, red/green or more frequently red/cyan channels before merging. When viewing with red/cyan filtering glasses, most of the left (red) and right (cyan) features in images are filtered to be perceived by the corresponding eye. After the golden age of 3D in the 1950s, anaglyph once again strongly revived around the year 2000, thanks to the recent renaissance of low-cost 3D movies in cinemas. A large number of anaglyphic images are returned when searching for the keyword “3D images” on the Internet.
4.3. Stereogram
Another special type of stereoscopic image is the single-image stereogram or autostereogram (as shown in Figure 4b). Tyler et al. first introduced the autostereogram in 1990 [61] and quickly gained significant interest from the public. Tyler managed to demonstrate the ability to generate depth illusions by using image patterns consisting of many random dots. The entire image is achieved by encoding three-dimensional images into distortions of symmetrical patterns which can then be decoded by misleading the eye convergences. In particular, viewers can focus on a point in front of or behind the image surface. The repeating patterns will thus be moved sideways, and the brain attempts to fuse them together by focusing on certain pairs at different parallax angles. The image patterns, thus, appear to float at different depths correspondingly.
5. System Design and Implementation
We propose a system for users to retrieve automatically aligned stereo left and right photos from different categories. The system combines human-computer interaction as well as with local and global systems collaboration. The system is divided into three main modules as shown in Figure 5. They are Client Side, Data Acquisition and Preprocessing.
5.1. Client Side Search Engine
System client layer provides a user-interface application which could be a mobile or desktop application. The layer contains two different parts: user-input and presentation. In this system, we opt to use Google Image Search as it is one of the most popular searching engine. We start with loading the client-side Image Search API:
<script type="text/javascript" src="www.google.com/jsapi"></script>
Images can be searched using the following codes with the SEARCHING_TEXT is replaced by the actual keywords:
<script type="text/javascript">
  google.load("search", "SEARCHING_TEXT");
</script>
Thus, to get all the 3D related images available on the Internet, we only need to make:
SEARCHING_TEXT = ("side by side stereo 3D" OR "cross eye 3D" OR
"parallel eye 3D" OR "anaglyph 3D", "red cyan 3D", OR "red blue 3D"
OR "stsereogram 3D" OR "autostereogram 3D" OR "magic eye 3D")
Besides, the user-input allows user to choose extra search keywords such as: “Travel", “Sports", “Animals", “Nature”, etc. Those can be added to the SEARCHING_TEXT as:
SEARCHING_TEXT = SEARCHING_TEXT + AND + "EXTRA_KEYWORDS"
After the requests are sent to the global Google Image Searching server, then downloaded and processed by the local system, the presentation layer will return a large number of ready-to-refine photos.
5.2. Data Acquisition and Image Type Classification
Images found from keywords are downloaded and resized to proper sizes. The returned images are mostly 3D-related (e.g., side-by-side, anaglyph, or stereogram images). However, there are still some “normal” images presented. To simplify the process, we just make the clients download all the available pictures and temporarily stored locally for the next image processing part.
The returned global image dataset is classified to determine whether each of them is falling into any of the following types:
- side-by-side photos (type SBS)
- anaglyphs (type ANAG)
- stereograms (type STE)
Or the image is just ordinary type and will be discarded:
- “normal” (type NOR)
If an image is determined as type SBS, we can just cut it in two halves: left stereo and right stereo image, and send them to the corresponding screen of the VR devices. In the case of type ANAG, Red, Green, Blue channels are separated from the input image; and Red and Green ones are selected to show. Lastly, if type STE is detected, we crop the left 90% of the input image and send it to the left view of VR device; and the right 90% to the right view. This process is straight-forward; thus, we will only concentrate on the Classification of the types, as described below.
Our Image Type classification is based on the properties of the human stereo vision system. Human has two eyes which are horizontally separated by a small distance. Thus, a person could “see” 3D illusion on a flat surface when there are similar features on the surface, which are also horizontally separated. This is the case of stereograms or magic eye pictures. All the three 3D-related types (SBS, ANAG, and STE) discussed above have such property; while NOR type does not. Therefore, we can classify these types using feature matching in images, and look for the horizontal separation of features (demonstrated in Figure 6).
Feature matching is used intensively in Computer Vision. We apply feature point detection to select informative pixels (such as corners) from two half of an image. Correspondence matching is the process which decides corresponding pairs between the two sets of feature points. Many comparable algorithms can be deployed in the correspondence matching process. Our task is to find the most suitable approaches at each step to achieve the best outcomes under the shortest period of waiting time. There are many available algorithms, in this section, we will determine the best to be used.
5.2.1. KLT, SIFT, and SURF Feature Extraction for Correspondence Matching
Feature matching can obtain a relatively large set of correspondences between left and right images. This image processing technique is often called feature or salient point detection. It is widely used for tracking [62], stereo matching [63], object recognition [64], and so on. In general, it initially finds a decent set of points/pixels on a reference image, then it is used to match to another set of correspondences in another picture.
Among the three, the earliest tracker is Kanade-Lucas-Tomasi (KLT). KLT finds, between two images, a set of correspondences of informative points, which is based on Shi and Tomasi’s good feature to track (GFT) [65] and Lucas-Kanade optical flow in a pyramid [66] of Lucas et al. KLT is fast and relatively reliable. It is fairly easy to implement; thus, we built our first tracker in the system based on KLT; however, it may return a large number of outliers in some situations. More recent and reliable methods are the Scale-Invariant Feature transform (SIFT) by Lowe et al. [67] or the Speeded Up Robust Features (SURF) by Bay et al. [68]. Both of them are among the most favourably and popularly used feature trackers [69] nowadays; they are relatively robust in various situations where there are large scale changes and affine transformation of features between the two images. Although being effective, SIFT and SURF are known to be time consuming [70]. Consequently, it was difficult to determine whether they are more suitable than the KLT tracker due to the processing constraints of our remote computing system of stereo vision.
To find out, both SIFT and SURF feature trackers are implemented to replace the current KLT in our system; thus the evaluation between the methods is equivalent. First of all, the three methods detect correspondences in a significant number of image pairs; then the total processing time and correspondence matching accuracy are collected to determine their overall performances. Two sets of images were tested:
- Laboratory-produced stereo images (Figure 7) with the correspondences between images are known (Section 5.2.2).
- Real-life near stereo images (Figure 8) with ground truth correspondences are not known (Section 5.2.3).
5.2.2. Evaluation of KLT, SIFT, and SURF trackers on 2005 and 2006 Middlebury Stereo Datasets
The 2005 and 2006 Middlebury datasets contain in total 30 pairs of indoor images at a resolution of 430 by 370 pixels. The images are carefully acquired in the Middlebury’s Vision lab and ground truth is obtained using Structured Light techniques [71]. Here, we assume that all the image pairs are relatively aligned (horizontally); hence, the correspondences are lying on the same or adjacent scan-lines. KLT, SIFT and SURF trackers are applied on these images to obtain 30 sets of correspondences for each tracker. Initially, each method collects up to 1000 correspondence points, and the strongest 500 pairs are selected.
On average, KLT obtains 811 correspondences in 1.15 s, SURF collects 810 correspondences in 1.72 s, and SIFT collects 714 correspondences in the longest time −2.04. Overall, the measurements are summarised in Table 2.
As the images are aligned, the matched points should also be aligned. The misalignment in y-direction can be used to determine the accuracy of a method. We, therefore, calculate the average and standard deviation for each set of correspondences (displayed in Table 3). From these data, if all are taken into account, the averages are all very large (21 to 31-pixel misalignment). This indicates that all three methods return a large number of outliers. When outliers are discarded by three thresholds , , and , the average misalignments are relatively close to zero. SIFT yields the best; its averages are the smallest; however, with large standard deviation values, there are many cases SURF and KLT are better than SIFT. Overall from the 2005 and 2006 Middlebury datasets, the experiment result indicates KLT, SURF and SIFT are efficient tracking systems, the obtained correspondence sets do contain mismatches, moreover, are not significantly different in the correspondences’ vertical misalignment. To conclude, SURF and SIFT, in general, take longer to process (see Table 2); however, do not obtain better correspondence sets than KLT. Nevertheless, these Middlebury images are “extreme’’ cases, the images are sharp and horizontally aligned; there are no large scale changes and affine transformation of features between images. The situation might be different on real-life photos.
5.2.3. Evaluation of KLT, SIFT, and SURF on Real-Life Images
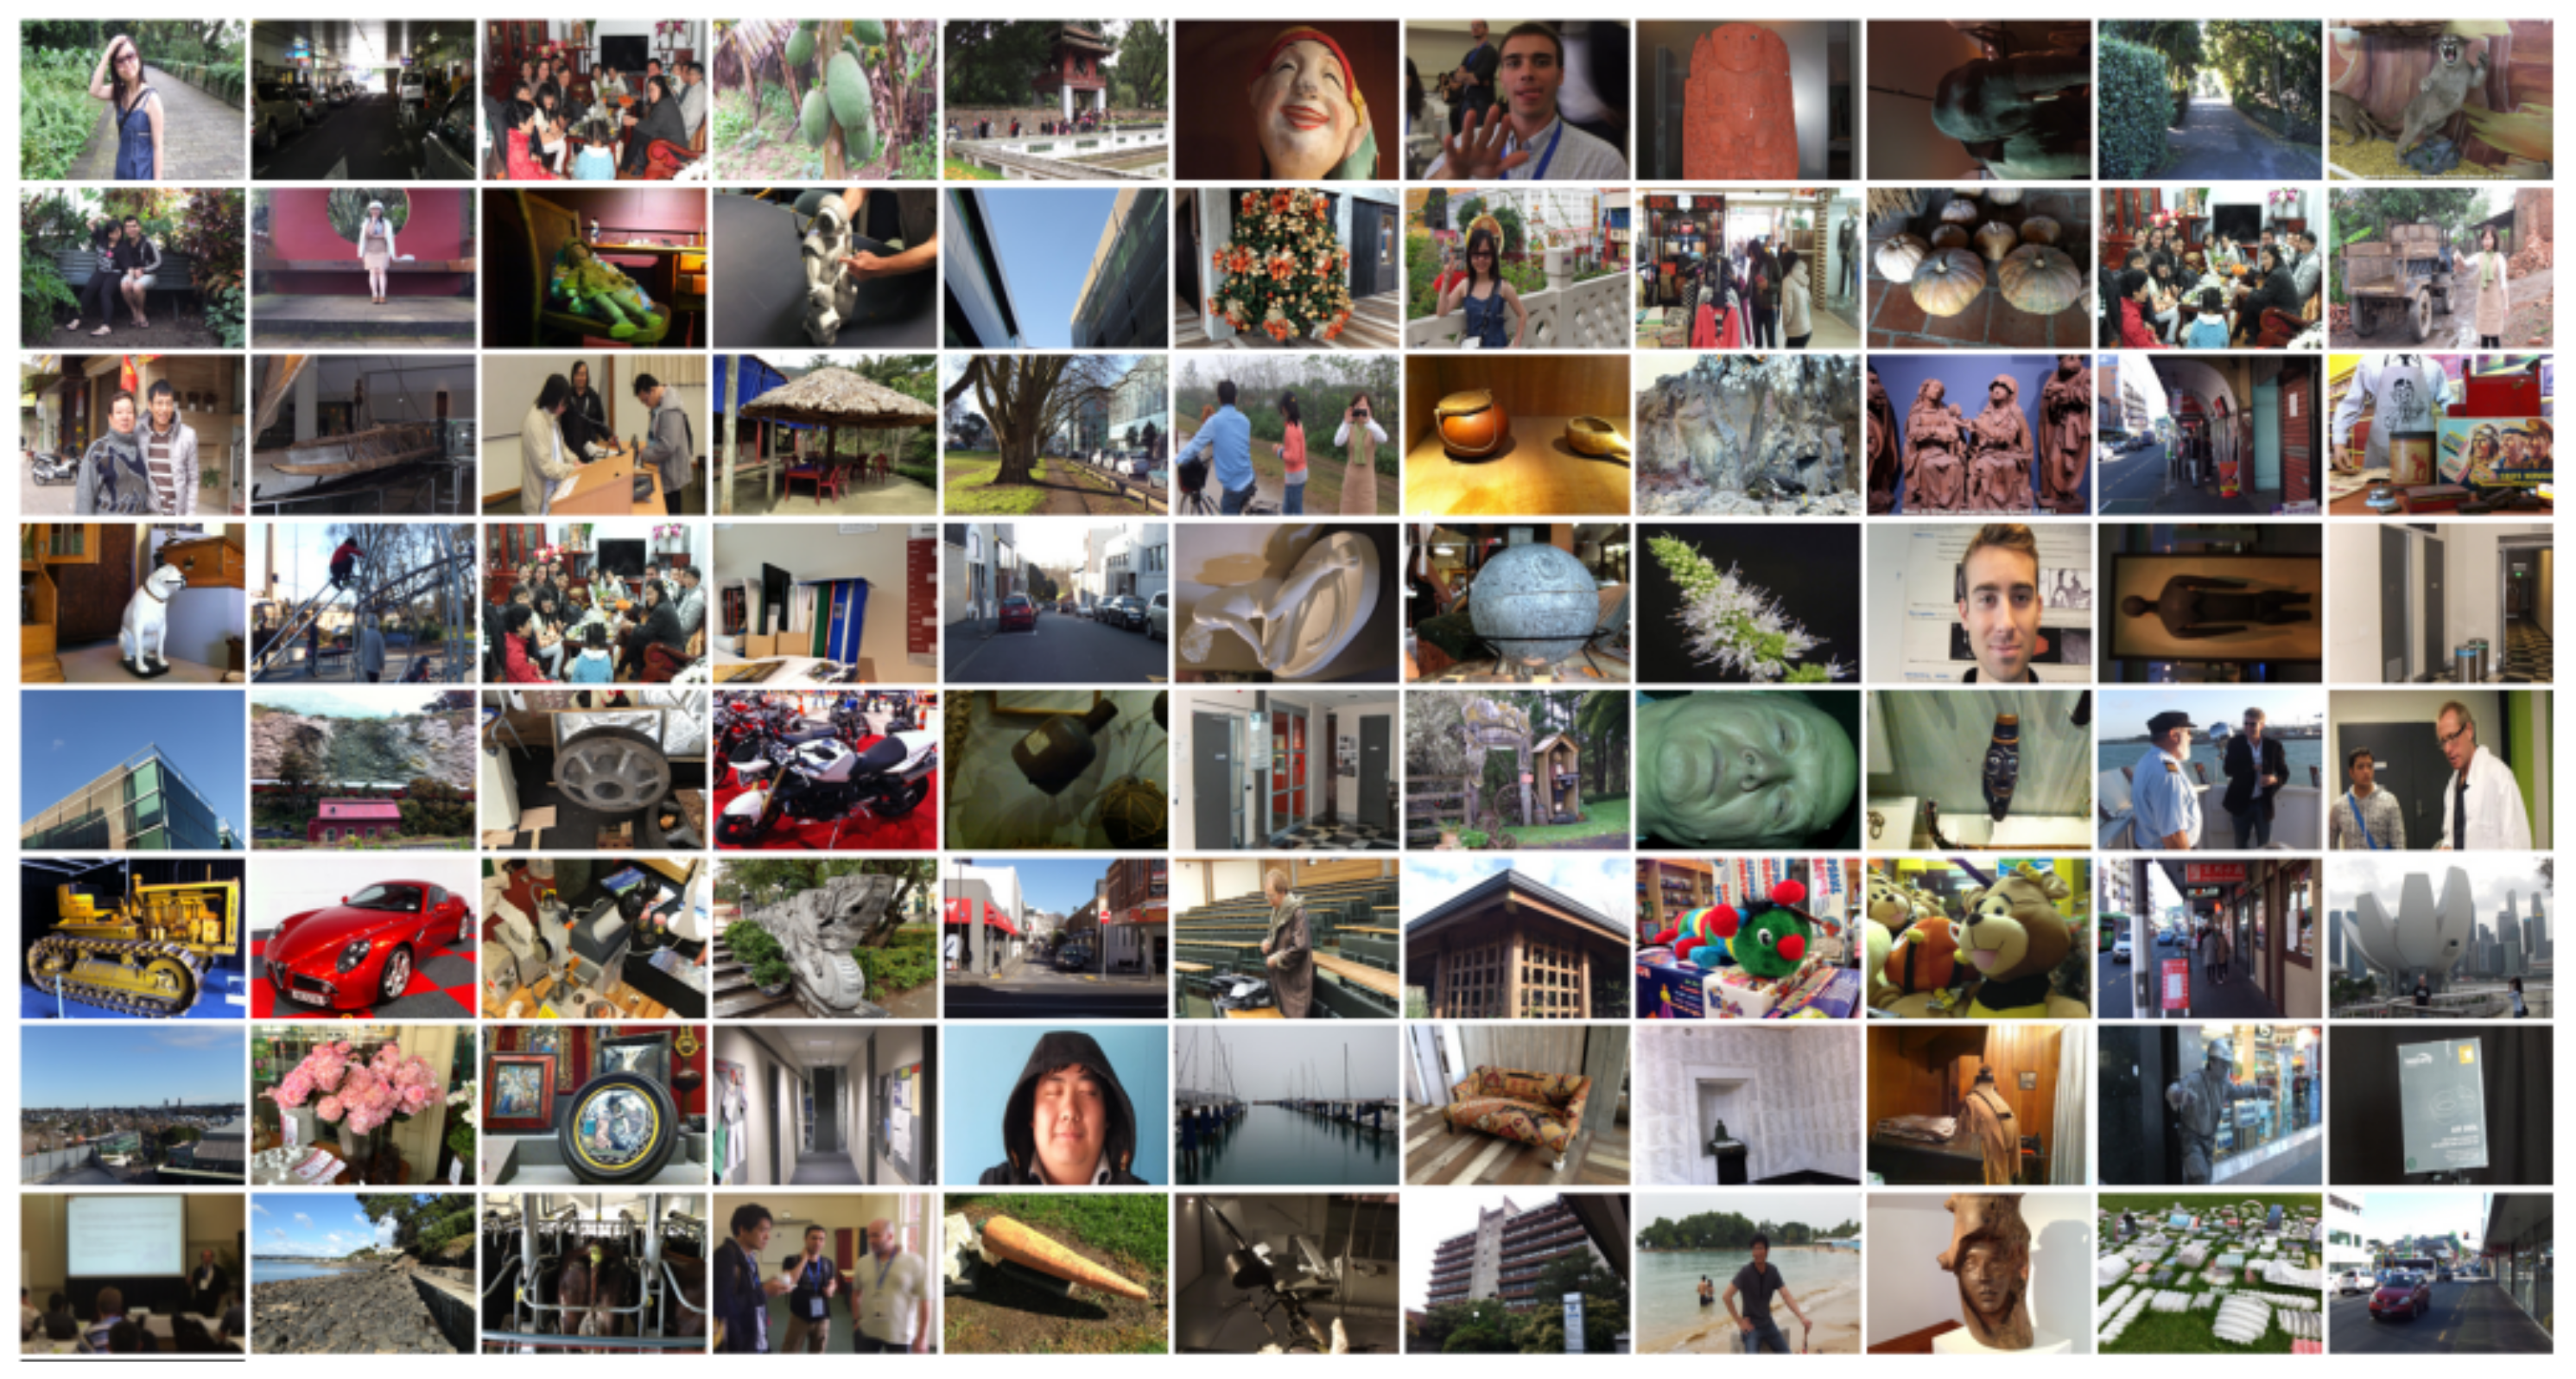
In the second test case, the three trackers: KLT, SIFT and SURF are evaluated on 200 real-life images which are randomly selected from our shared image database [72]; a part of them is shown in Figure 8. These images are resized to resolution of pixels (larger than the images tested in the Section 5.2.2). Moreover, rather than only indoor, they are acquired under four different conditions: (i) outdoor under a bright daylight condition, (ii) outdoor under an overcast light condition, (iii) indoor under a daylight condition, (iv) indoor under a fluorescent light condition.
Similarly, all image pairs are tracked with KLT, SURF, and SIFT for correspondences. In this experiment, all the matched points and processing times are collected. On average, KLT runs in s, SURF runs in s, and SIFT takes s to obtain up to 500 strongest correspondences. With the standard deviation of 0.70 s, KLT is found significantly faster than both SURF (∼2 times) and SIFT (∼3 times).
In conclusion, KLT is found sufficient enough for this project; it is fast and free to use. Therefore, KLT is opted to be used for matching features in images to create our automatic stereo image type classification.
5.2.4. KLT Features for Stereo Image Type Classification
KLT feature matching returns to us two sets of corresponding points on the first image and on the second picture. Brute-force is used to match the two set. Thus, there are N pairs of points: is corresponding to , each of them is a sub-pixel coordinate on the pair of images. We calculate the absolute horizontal differences , and vertical differences between corresponding points. From them, we identify how many matched points are horizontally aligned and how many are vertically aligned: is the number of pairs that have and is the number of pairs that have . T is a threshold, and we have set it to be 5.0 pixels; and . The percentage of horizontally and vertically aligned matches are calculated as:
From some initial experience, we explore that different types of images are having different values of and when detected on regions or colour channels of images.
The following types of comparison are applied with feature matching ( is the original image):
- left/right half: is vertically cut into two and features are searched between those.
- 1st/2nd quarters: is vertically cut into four, and first two quarters are chosen.
- red/green channels: Red, Green, Blue channels are separated from , Red and Green ones are selected for feature matching.
To classify the images, we firstly resize them to the same dimension: pixels. After carefully checking the distance of correspondences between different types of images. We categorize the in to three classes:
- Small: Average distance is less than 50 pixels
- Large: Average distance is more than 200 pixels
The ranges of and collected from the four different image types are shown in Table 4.
From the table, we saw a significant difference in between “Normal” & Anaglyphic and Stereogram & Side by Side images; thus, could be used to separate these two classes.
For side by side pictures; there is a strong correlation between two halves of the pictures; however, there should not be many matched points between the two-quarters of the picture. On the other hand, a strong correlation is still maintained in two-quarters of the Stereogram image. Such information could be used to identify Stereogram and Side by Side images. Lastly, we can use to separate between “Normal” and Anaglyphic images. Here, we only look at red and green channels of an image. From which, we propose a process to identify these type from an arbitrary image on the Internet base on thresholding the values of and . The process is simplified in Flowchart displayed in Figure 9.
5.3. Final Results
The previous section describes the Image Type classification of our system. We make use of our stereo image dataset at [72]. This is an extensive gallery of stereo images (totally nearly 4000 stereo image sets, grouped in 34 categories), each set contains 3D images of all discussed types (type SBS, ANAG, STE, and “normal” left or right image). The gallery stores the correct types, so we have the ground truth to evaluate. Due to time constraint, at this stage, we only randomly select 50 side-by-side photos, 50 anaglyphs, 50 stereograms, and also 50 “normal” images from this gallery. Each set of images is sent to our proposed classification, and we collect the positive detection rates; in other words, if the system detects a true anaglyph as an anaglyph, it is positive, any others return, it is negative.
Table 5 displays the percentage of positive detection of our Image type Classification system. From it, we saw an excellent correct detection rate of side-by-side photos (type SBS), anaglyphs (type ANAG), and stereograms (type STE), all are at 100%. The rate is at 96% for “normal” (type NOR) images. Such confusion is perhaps created by the natural repetition of feature patterns in images such as building windows, floor tiles.
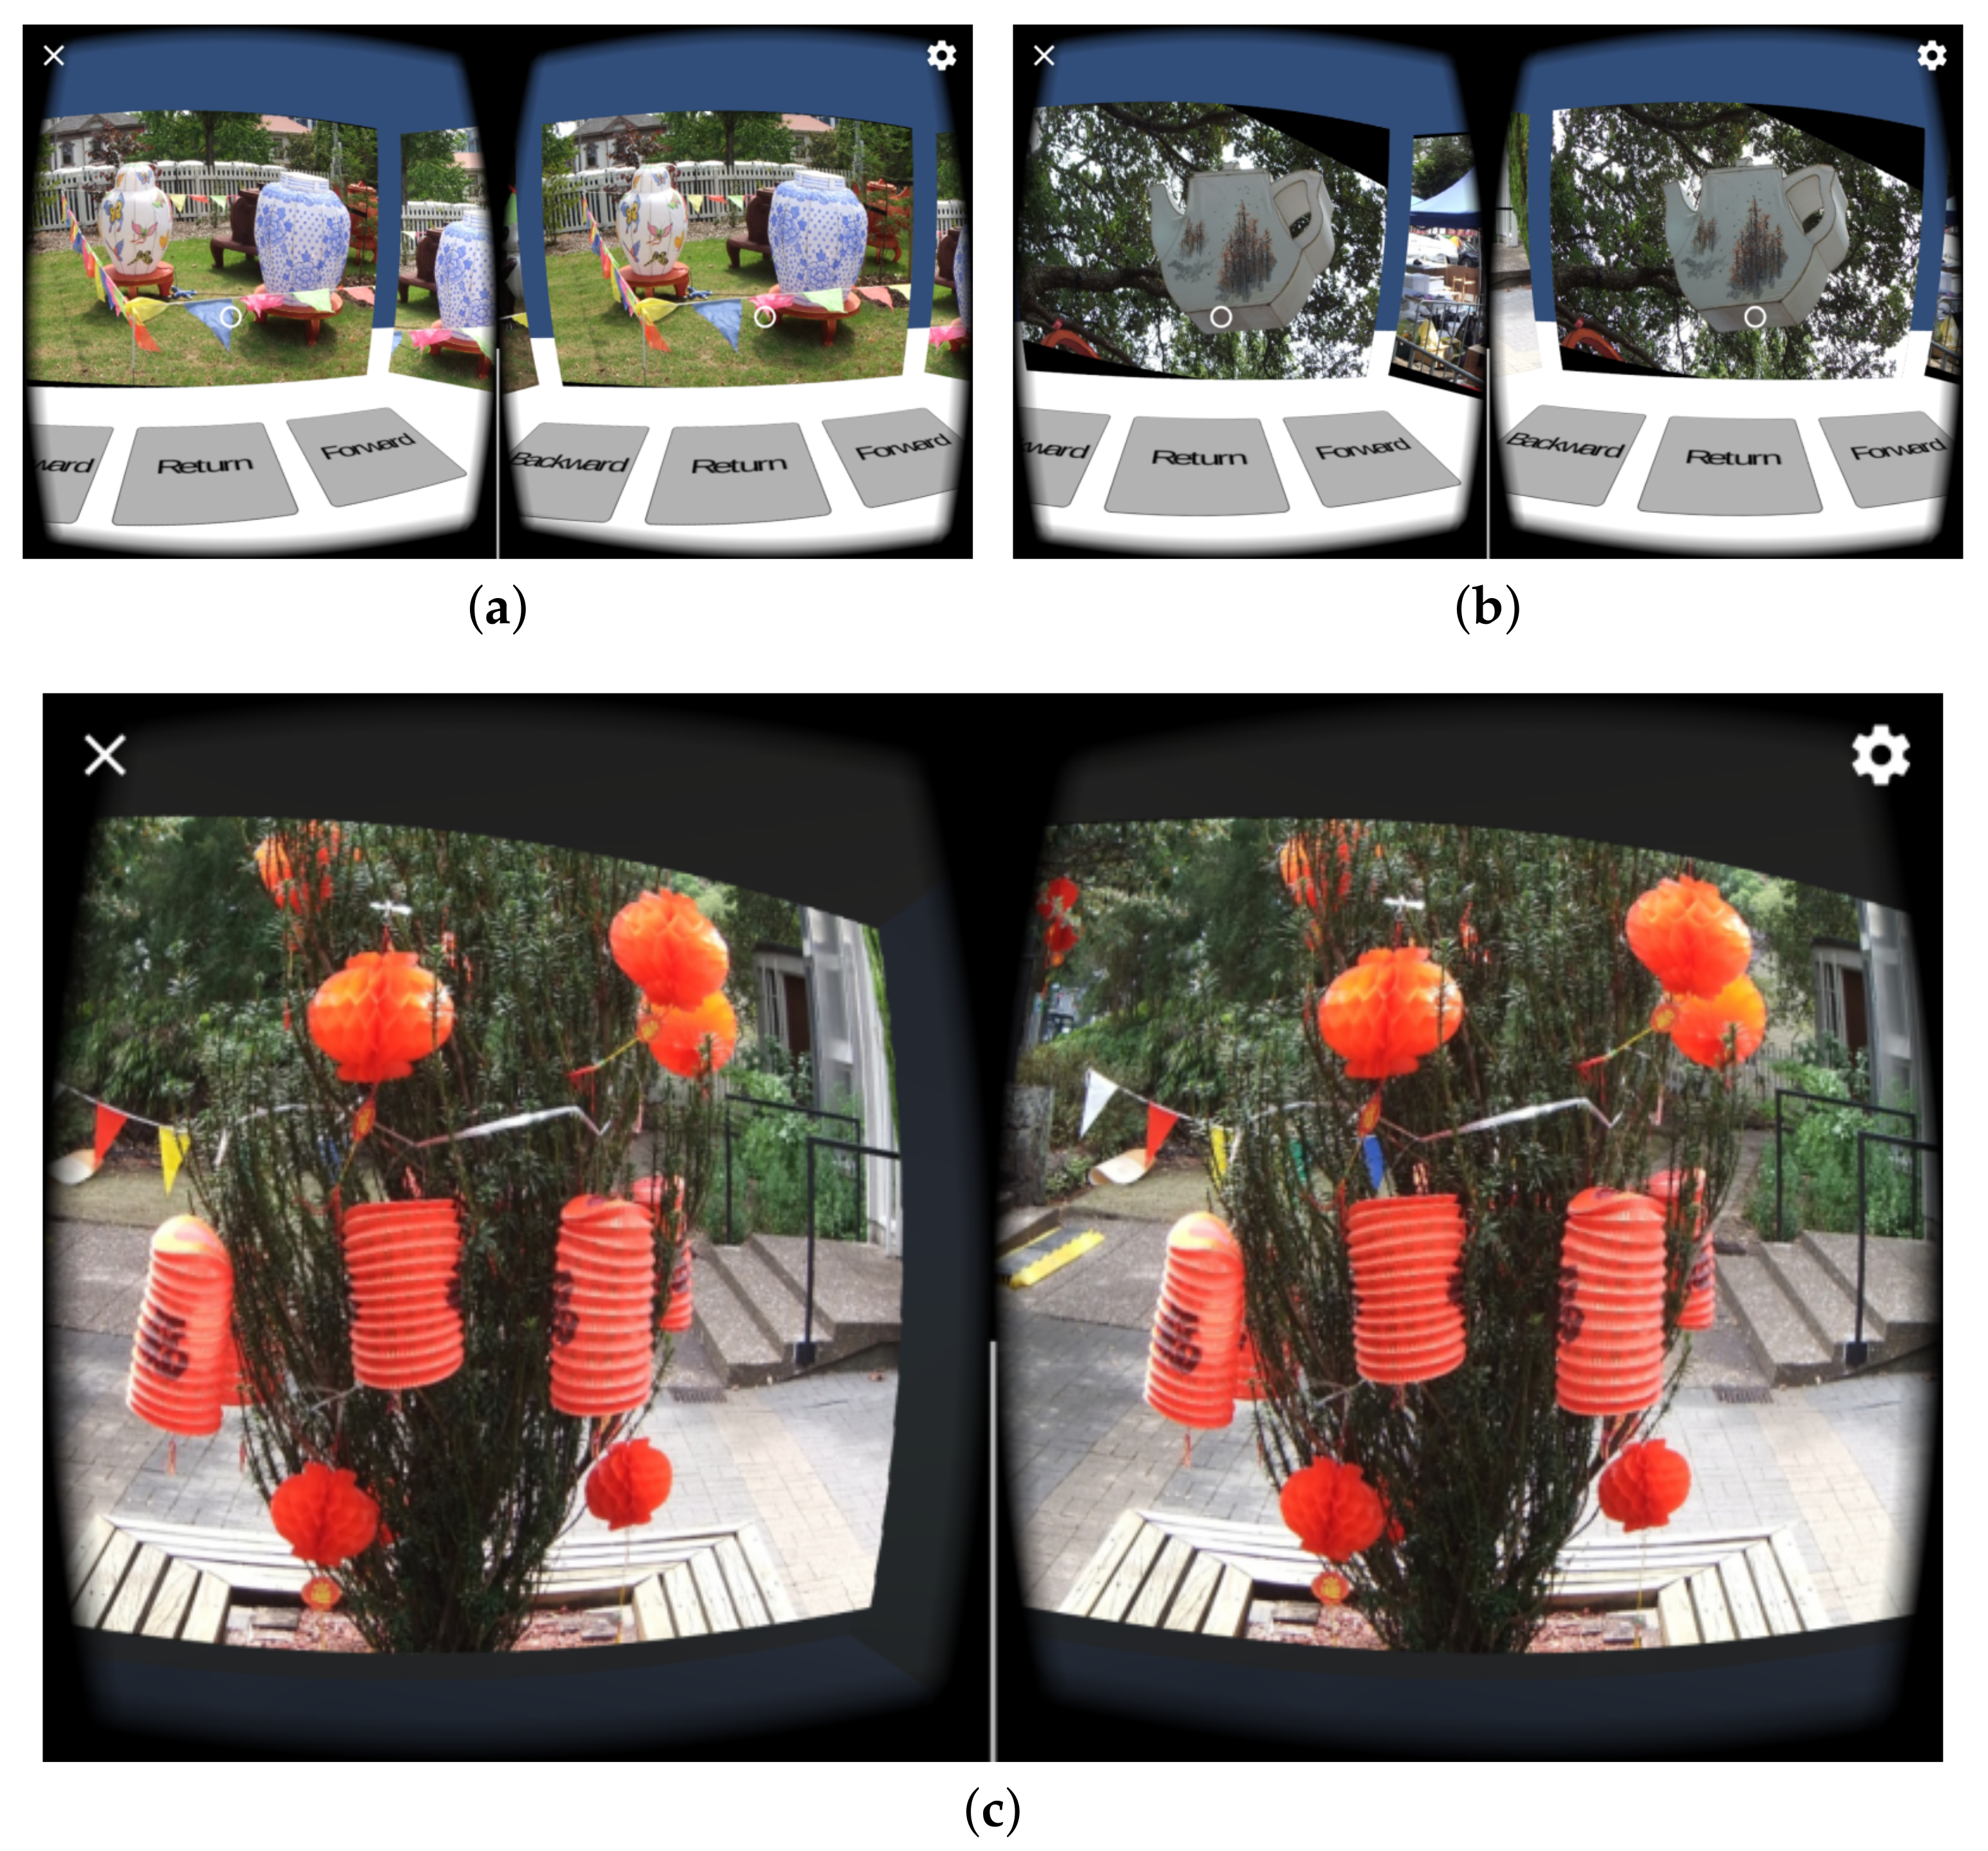
The testing size of 50 is limited; in the near future, we will test our system on the entire gallery of nearly 4000 image sets. Also, at this stage, we have started building an initial version of the software running on Android smartphones. Some screenshots can be seen in Figure 10. Each is a side-by-side view of the phone screen to be observed by a standard VR headset. Initially, the users will be placed in a virtual room with many doors; each door leads to another room of specific category. Many pictures are hanging on the wall of each chamber. On the floor, there are three buttons: “Backward”, “Forward” are used to navigate next and last collection, and “Return” is used to go back to category selection room. In each chamber, the users can look around to find which they are interested and click the button to move closer to the picture (Figure 10c). We are in the final stage of testing the App. Hopefully, we can release that in the very near future. An iOS and Web VR version of the system are also planned in our next milestones.
6. Conclusions
This article describes a graphically interactive and online Virtual Reality (VR) frameworks which automatically extract left and right stereo images. These are tailored to show on to a VR devices such as a portable pocket stereoscope [2], a low-cost Google Cardboard [3], a Samsung Gear VR [4], moreover, a premium Google Day Dream [5]. Our system automatically searches images from the publicly available image database from the Internet via searching engines using different pre-defined keywords. These devices are used to provide an immediate, controllable, 3D display. This portable, simple to set up and operate the system, currently very rare on the Internet. We have also proposed an Image type classification system which use the state-of-the-art feature matching process to determine if an image is one the 3D-related types: side-by-side photos (type SBS), anaglyphs (type ANAG, stereograms (type STE) or just a “normal” (type NOR) image on the net. From a number of initial experiment results; our system is shown to be relatively fast, accurate, and easy to implement. With such system, Internet users all over the World could easily visualise millions of real life stereo datasets publicly available on the Internet; which are believed to be useful for VR testing and learning purposes.
Author Contributions
Minh Nguyen and Huy Tran provided the concept and design for these frameworks. Minh Nguyen created the back-end; Huy Tran implemented the experimental application for the front-end; Huy Le helped design some of the back-end architecture. All authors contributed to the paper writing and reviews.
Conflicts of Interest
The authors declare no conflict of interest.
References
- Churchland, P.S.; Sejnowski, T.J. The Computational Brain, 1st ed.; MIT Press: Cambridge, MA, USA, 1994. [Google Scholar]
- Alan Gordon Enterprises, Inc. The Pocket Stereoscope—From the Website. Available online: http://stereoinstruments.com (accessed on 21 July 2017).
- Bavor, C. Folding a Virtual Journey with Google Cardboard. Available online: https://www.blog.google/products/google-vr/unfolding-virtual-journey-cardboard/ (accessed on 21 July 2017).
- Samsung Electronics. The Samsung Gear VR—From the Website. Available online: http://www.samsung.com/global/galaxy/gear-vr (accessed on 21 July 2017).
- Wee, A. Huawei Digs into Google Daydream: VR Gadgets Will Be Available by This Year. Available online: http://en.zinggadget.com/huawei-digs-into-vr-daydream-vr-gadgets-will-be-available-by-this-year/ (accessed on 21 July 2017).
- Leroy, L. 3.2 Too much depth. In Eyestrain Reduction in Stereoscopy; John Wiley & Sons: Hoboken, NJ, USA, 2016. [Google Scholar]
- Patterson, R.E. Accommodation-Vergence Conflict. In Human Factors of Stereoscopic 3D Displays; Springer: Dayton, OH, USA, 2015; pp. 33–41. [Google Scholar]
- Hoffman, D.M.; Girshick, A.R.; Akeley, K.; Banks, M.S. Vergence–accommodation conflicts hinder visual performance and cause visual fatigue. J. Vis. 2008, 8, 1–30. [Google Scholar] [CrossRef] [PubMed]
- Sural, I. Chapter 10 mobile augmented reality applications in education. In Mobile Technologies and Augmented Reality in Open Education; Kurubacak, G., Altinpulluk, H., Eds.; IGI Global: Hershey, PA, USA, 2017; pp. 200–201. [Google Scholar]
- Jerald, J. 1.3 What is vr good for? 2. A history of vr. In The vr Book: Human—Centered Design for Virtual Reality; Jerald, J., Ed.; Morgan & Claypool: San Rafael, CA, USA, 2015. [Google Scholar]
- Wheatstone, C. Contributions to the physiology of vision on some remarkable, and hitherto unobserved, phenomena of binocular vision. Philos. Trans. R. Soc. Lond. 1838, 128, 371–394. [Google Scholar] [CrossRef]
- Holmes, O.W. The stereoscope and the stereograph. Atl. Mon. 1859, 3, 738–748. [Google Scholar]
- Emspak, J. What Is Virtual Reality? Available online: https://www.livescience.com/54116-virtual-reality.html (accessed on 21 July 2017).
- Parisi, T. Learning Virtual Reality: Developing Immersive Experiences and Applications for Desktop, Web, and Mobile; O’Reilly Media, Inc.: Sebastopol, CA, USA, 2015. [Google Scholar]
- Ng, A.K.; Chan, L.K.; Lau, H.Y. Depth Perception in Virtual Environment: The Effects of Immersive System and Freedom of Movement. In Proceedings of the Virtual, Augmented and Mixed Reality: 8th International Conference VAMR, Toronto, ON, Canada, 17–22 July 2016. [Google Scholar]
- Jonnalagadda, H. Google Has Shipped 10 Million Cardboard vr Headsets Since 2014. Available online: http://www.androidcentral.com/google-has-shipped-10-million-cardboard-vr-headsets-2014 (accessed on 21 July 2017).
- Google. Google Cardboard—Technical Specification Version 2.0. Available online: https://vr.google.com/cardboard/downloads/wwgc_manufacturers_kit.zip (accessed on 21 July 2017).
- Oscillada, J. Comparison Chart of fov (Field of View) of vr Headsets. Available online: http://www.virtualrealitytimes.com/2015/05/24/chart-fov-field-of-view-vr-headsets/ (accessed on 21 July 2017).
- Machkovech, S. How Side-Mounted LEDs Can Help Fix VR’s “Tunnel Vision” and Nausea Problems. Available online: https://arstechnica.com/gaming/2016/05/how-side-mounted-leds-can-help-fix-vrs-tunnel-vision-and-nausea-problems/ (accessed on 10 August 2017).
- Powell, W.; Powell, V.; Brown, P.; Cook, M.; Uddin, J. Getting around in google cardboard—Exploring navigation preferences with low cost mobile vr. In Proceedings of the 2016 IEEE 2nd Workshop on Everyday Virtual Reality (WEVR 2016), Greenville, SC, USA, 20–20 March 2016. [Google Scholar]
- Faulkner, C.; Phones, M. Google Daydream Release Date, News and Features. Available online: http://www.techradar.com/news/phone-and-communications/mobile-phones/android-vr-release-date-news-features-1321245 (accessed on 21 July 2017).
- Amadeo, R. Daydream VR Hands—On: Google’s “Dumb” VR Headset Is Actually Very Clever. Available online: https://arstechnica.com/gadgets/2016/10/daydream-vr-hands-on-googles-dumb-vr-headset-is-actually-very-clever/ (accessed on 21 July 2017).
- Novet, J. How Google’s Daydream Mobile VR System Will Work. Available online: https://venturebeat.com/2016/05/21/google-daydream-standards/ (accessed on 21 July 2017).
- Orland, K. Google Daydream Review: The Fast—Casual Restaurant of the VR World. Available online: https://arstechnica.com/gaming/2016/11/google-daydream-review-the-fast-casual-restaurant-of-the-vr-world/ (accessed on 21 July 2017).
- Google. Daydream—Phones. Available online: https://vr.google.com/daydream/phones (accessed on 21 July 2017).
- Samsung. Specifications | Samsung Gear VR with Controller. Available online: http://www.samsung.com/global/galaxy/gear-vr/specs/ (accessed on 21 July 2017).
- Smith, S.L. Samsung Gear VR Guide: Everything You Need to Know. Available online: http://www.tomsguide.com/us/samsung-gear-vr-guide,review-3267.html (accessed on 21 July 2017).
- Amazon. Samsung SM-R323NBKAXAR Gear Virtual Reality. 2016. Available online: https://www.amazon.com/Samsung-SM-R323NBKAXAR-Virtual-International-Warranty/dp/B01M0YDS2A/ (accessed on 21 July 2017).
- Peckham, J. Samsung Gear VR Review. Available online: http://www.techradar.com/reviews/samsung-gear-vr-2017 (accessed on 21 July 2017).
- Kolasinski, E. Simulator Sickness in Virtual Environments (ARI 1027); U.S. Army Research Institute for the Behavioral and Social Sciences: Alexandria, VA, USA, 1995.
- Cobb, S.V.G.; Nichols, S.C. Static posture tests for the assessment of postural instability after virtual environment use. Brain Res. Bull. 1998, 47, 459–464. [Google Scholar] [CrossRef]
- Sharples, S.; Cobb, S.; Moody, A.; Wilson, J.R. Virtual reality induced symptoms and effects (vrise): Comparison of head mounted display (hmd), desktop and projection display systems. Displays 2008, 29, 58–69. [Google Scholar] [CrossRef]
- Stanney, K.M.; Kennedy, R.S. Simulation sickness. In Human Factors in Simulation and Training; CRC Press: Boca Raton, FL, USA, 2009; pp. 117–127. [Google Scholar]
- Pappas, S. Why Does Virtual Reality Make Some People Sick? Available online: http://www.livescience.com/54478-why-vr-makes-you-sick.html (accessed on 21 July 2017).
- O’Connor, F. Google to Cardboard Eevelopers: Keep It Short and Simple, and Watch out for Nausea. Available online: https://www.pcworld.idg.com.au/article/576233/google-cardboard-developers-keep-it-short-simple-watch-nausea/ (accessed on 21 July 2017).
- Petrovan, B. Google Clarifies Requirements for Daydream VR—Ready Phones. Available online: http://www.androidauthority.com/daydream-vr-ready-phones-specs-727780/ (accessed on 21 July 2017).
- Google. Android 7.1 Compatibility Definition. Available online: https://source.android.com/compatibility/android-cdd (accessed on 21 July 2017).
- Simonite, T. Inside Google’s Plan to Make Virtual Reality Mainstream Before Facebook Can. Available online: https://www.technologyreview.com/s/542991/google-aims-to-make-vr-hardware-irrelevant-before-it-even-gets-going/ (accessed on 21 July 2017).
- Freefly, V.R. Virtual Reality Content for Android and I—Phone Users. Available online: https://freeflyvr.com/content/ (accessed on 21 July 2017).
- Jaunt. All Virtual Reality Videos. Available online: https://www.jauntvr.com/title/ (accessed on 21 July 2017).
- Google. Apps for Google Cardboard. Available online: https://vr.google.com/cardboard/apps/ (accessed on 21 July 2017).
- Matterport. Content Creation for Virtual Reality. Available online: https://matterport.com/virtual-reality/ (accessed on 21 July 2017).
- RIZE. Virtual Reality 360 Video. Available online: https://www.360rize.com/vr/ (accessed on 21 July 2017).
- Apple Inc. Welcome to iOS. Available online: https://support.apple.com/ios (accessed on 21 July 2017).
- Navarro, A.; Pradilla, J.V.; Rios, O. Open source 3D game engines for serious games modeling. In Modeling and Simulation in Engineering; InTech: Rijeka, Croatia, 2012. [Google Scholar]
- Stack Overflow. Stack Overflow Developer Survey. 2017. Available online: https://insights.stackoverflow.com/survey/2017 (accessed on 21 July 2017).
- Horton, J.; Portales, R. Why Java, Android, and Games? In Android: Game Programming; Packt Publishing Ltd.: Birmingham, UK, 2016; pp. 8–10. [Google Scholar]
- Google. Google VR NDK Overview | Google VR. Available online: https://developers.google.com/vr/android/ndk/gvr-ndk-overview (accessed on 21 July 2017).
- Google. Getting Started with the NDK | Android Developers. Available online: https://developer.android.com/ndk/guides/index.html (accessed on 21 July 2017).
- Mullis, A. Developing with the Google VR SDK and NDK. Available online: http://www.androidauthority.com/developing-with-the-google-vr-sdk-and-ndk-699472/ (accessed on 21 July 2017).
- Unity Technologies. Fast Facts. Available online: https://unity3d.com/public-relations (accessed on 21 July 2017).
- Unity Technologies. Unity-Editor. Available online: https://unity3d.com/unity/editor (accessed on 21 July 2017).
- Busby, J.; Parrish, Z.; Wilson, J. Mastering Unreal Technology, Volume I: Introduction to Level Design with Unreal Engine 3; Pearson Education: London, UK, 2009. [Google Scholar]
- Tavakkoli, A. A. A history of unreal technology. In Game Development and Simulation with Unreal Technology; CRC Press: Hoboken, NJ, USA, 2015. [Google Scholar]
- Crecente, B. The Future Is Unreal (Engine). Available online: https://www.polygon.com/a/epic-4-0/the-future-is-unreal-engine (accessed on 21 July 2017).
- Epic Games. Unreal Engine-Features. Available online: https://epicgames.com/ (accessed on 21 July 2017).
- VR Status Unreal Engine VS Unity. Available online: https://www.vrstatus.com/news/unreal-engine-vs-unity.html (accessed on 21 July 2017).
- Pluralsight. Unreal Engine 4 vs. Unity: Which Game Engine Is Best for You? Available online: https://www.pluralsight.com/blog/film-games/unreal-engine-4-vs-unity-game-engine-best (accessed on 10 August 2017).
- Eisenberg, A. Unity vs. Unreal Engine—Best VR Gaming Platforms. Available online: https://appreal-vr.com/blog/unity-or-unreal-best-vr-gaming-platforms (accessed on 21 July 2017).
- Rollmann, W. Zwei neue stereoskopische Methoden (Two new stereoscopic methods). Ann. Phys. 1853, 166, 186–187. [Google Scholar] [CrossRef]
- McAllister, D.F. Stereo and 3D Display Technologies. Encycl. Imaging Sci. Technol. 2006, 1327–1344. [Google Scholar] [CrossRef]
- Tomasi, C.; Kanade, T. Detection and Tracking of Point Features; School of Computer Science, Carnegie Mellon University: Pittsburgh, PA, USA, 1991. [Google Scholar]
- Hoff, W.; Ahuja, N. Surfaces from stereo: Integrating feature matching, disparity estimation, and contour detection. IEEE Trans. Pattern Anal. Mach. Intell. 1989, 11, 121–136. [Google Scholar] [CrossRef]
- Bicego, M.; Lagorio, A.; Grosso, E.; Tistarelli, M. On the use of SIFT features for face authentication. In Proceedings of the IEEE Computer Vision and Pattern Recognition Workshop, New York, NY, USA, 17–23 June 2006; p. 35. [Google Scholar]
- Shi, J.; Tomasi, C. Good features to track. In Proceedings of the Computer Society Conference on Computer Vision and Pattern Recognition, New York, NY, USA, 15–17 June 1993; pp. 593–600. [Google Scholar]
- Lucas, B.D.; Kanade, T. An iterative image registration technique with an application to stereo vision. In Proceedings of the International Joint Conference on Artificial Intelligence, Vancouver, BC, Canada, 24–28 August 1981; pp. 674–679. [Google Scholar]
- Lowe, D.G. Object recognition from local scale-invariant features. In Proceedings of the IEEE International Conference on Computer Vision, Kerkyra, Greece, 20–27 September 1999; Volume 2, pp. 1150–1157. [Google Scholar]
- Bay, H.; Ess, A.; Tuytelaars, T.; Gool, L.V. Speeded-up robust features (SURF). Comput. Vis. Image Underst. 2008, 110, 346–359. [Google Scholar] [CrossRef]
- Tuytelaars, T.; Mikolajczyk, K. Local invariant feature detectors: a survey. Found. Trends Comput. Graph. Vis. 2008, 3, 177–280. [Google Scholar] [CrossRef] [Green Version]
- Juan, L.; Gwun, O. A Comparison of SIFT, PCA-SIFT and SURF. Int. J. Image Process. 2009, 3, 143–152. [Google Scholar]
- Scharstein, D.; Szeliski, R. High-accuracy stereo depth maps using structured light. In Proceedings of the IEEE Computer Society Conference on Computer Vision and Pattern Recognition, Madison, WI, USA, 16–22 June 2003; Volume 1, pp. 195–202. [Google Scholar]
- Computational Stereo Vision Gallery—From the Website. Available online: http://www.ivs.auckland.ac.nz/web/scene_gallery.php (accessed on 21 July 2017).
Figure 1.
A portable pocket stereoscope [2], a low-cost Google Cardboard [3], a Samsung Gear VR [4], and a premium Google Day Dream [5].

Figure 2.
Principle of perceiving 3D from a VR screen. (a) A typical VR Screen; (b) Perceiving 3D from a VR screen.
Figure 2.
Principle of perceiving 3D from a VR screen. (a) A typical VR Screen; (b) Perceiving 3D from a VR screen.
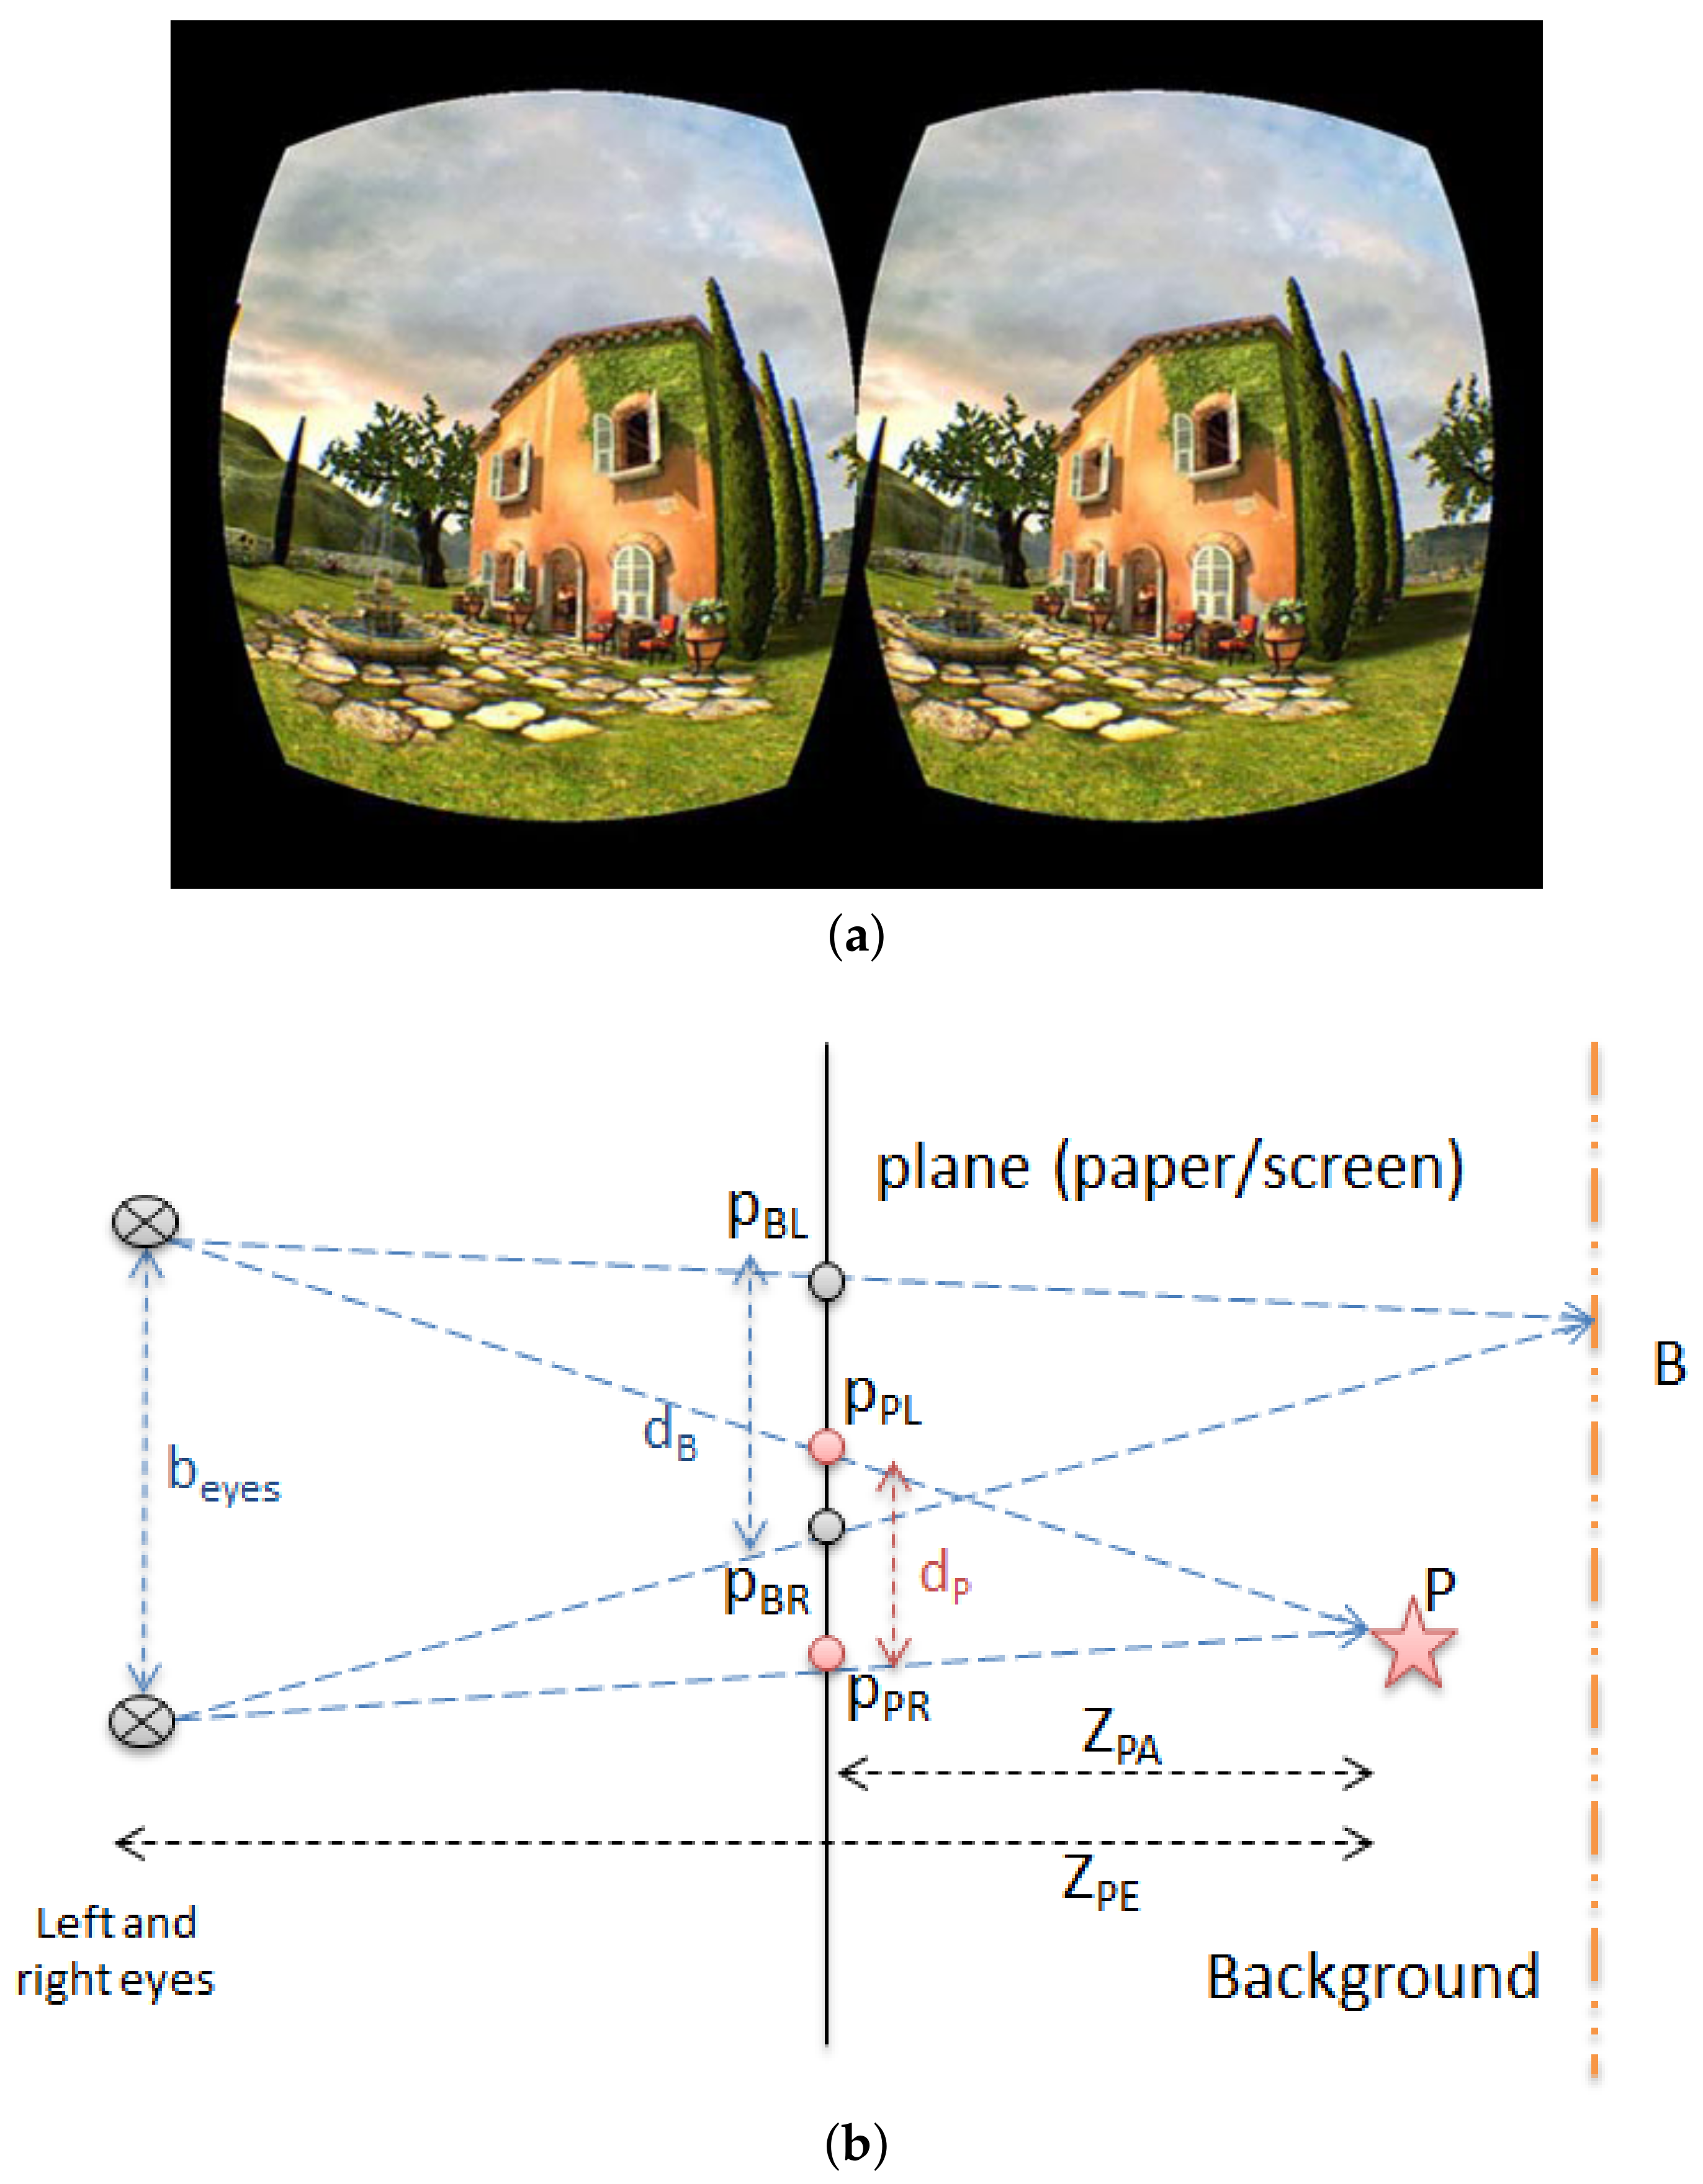
Figure 3.
Publicly available images returned from keyword “cross eye 3D” on Google Search.
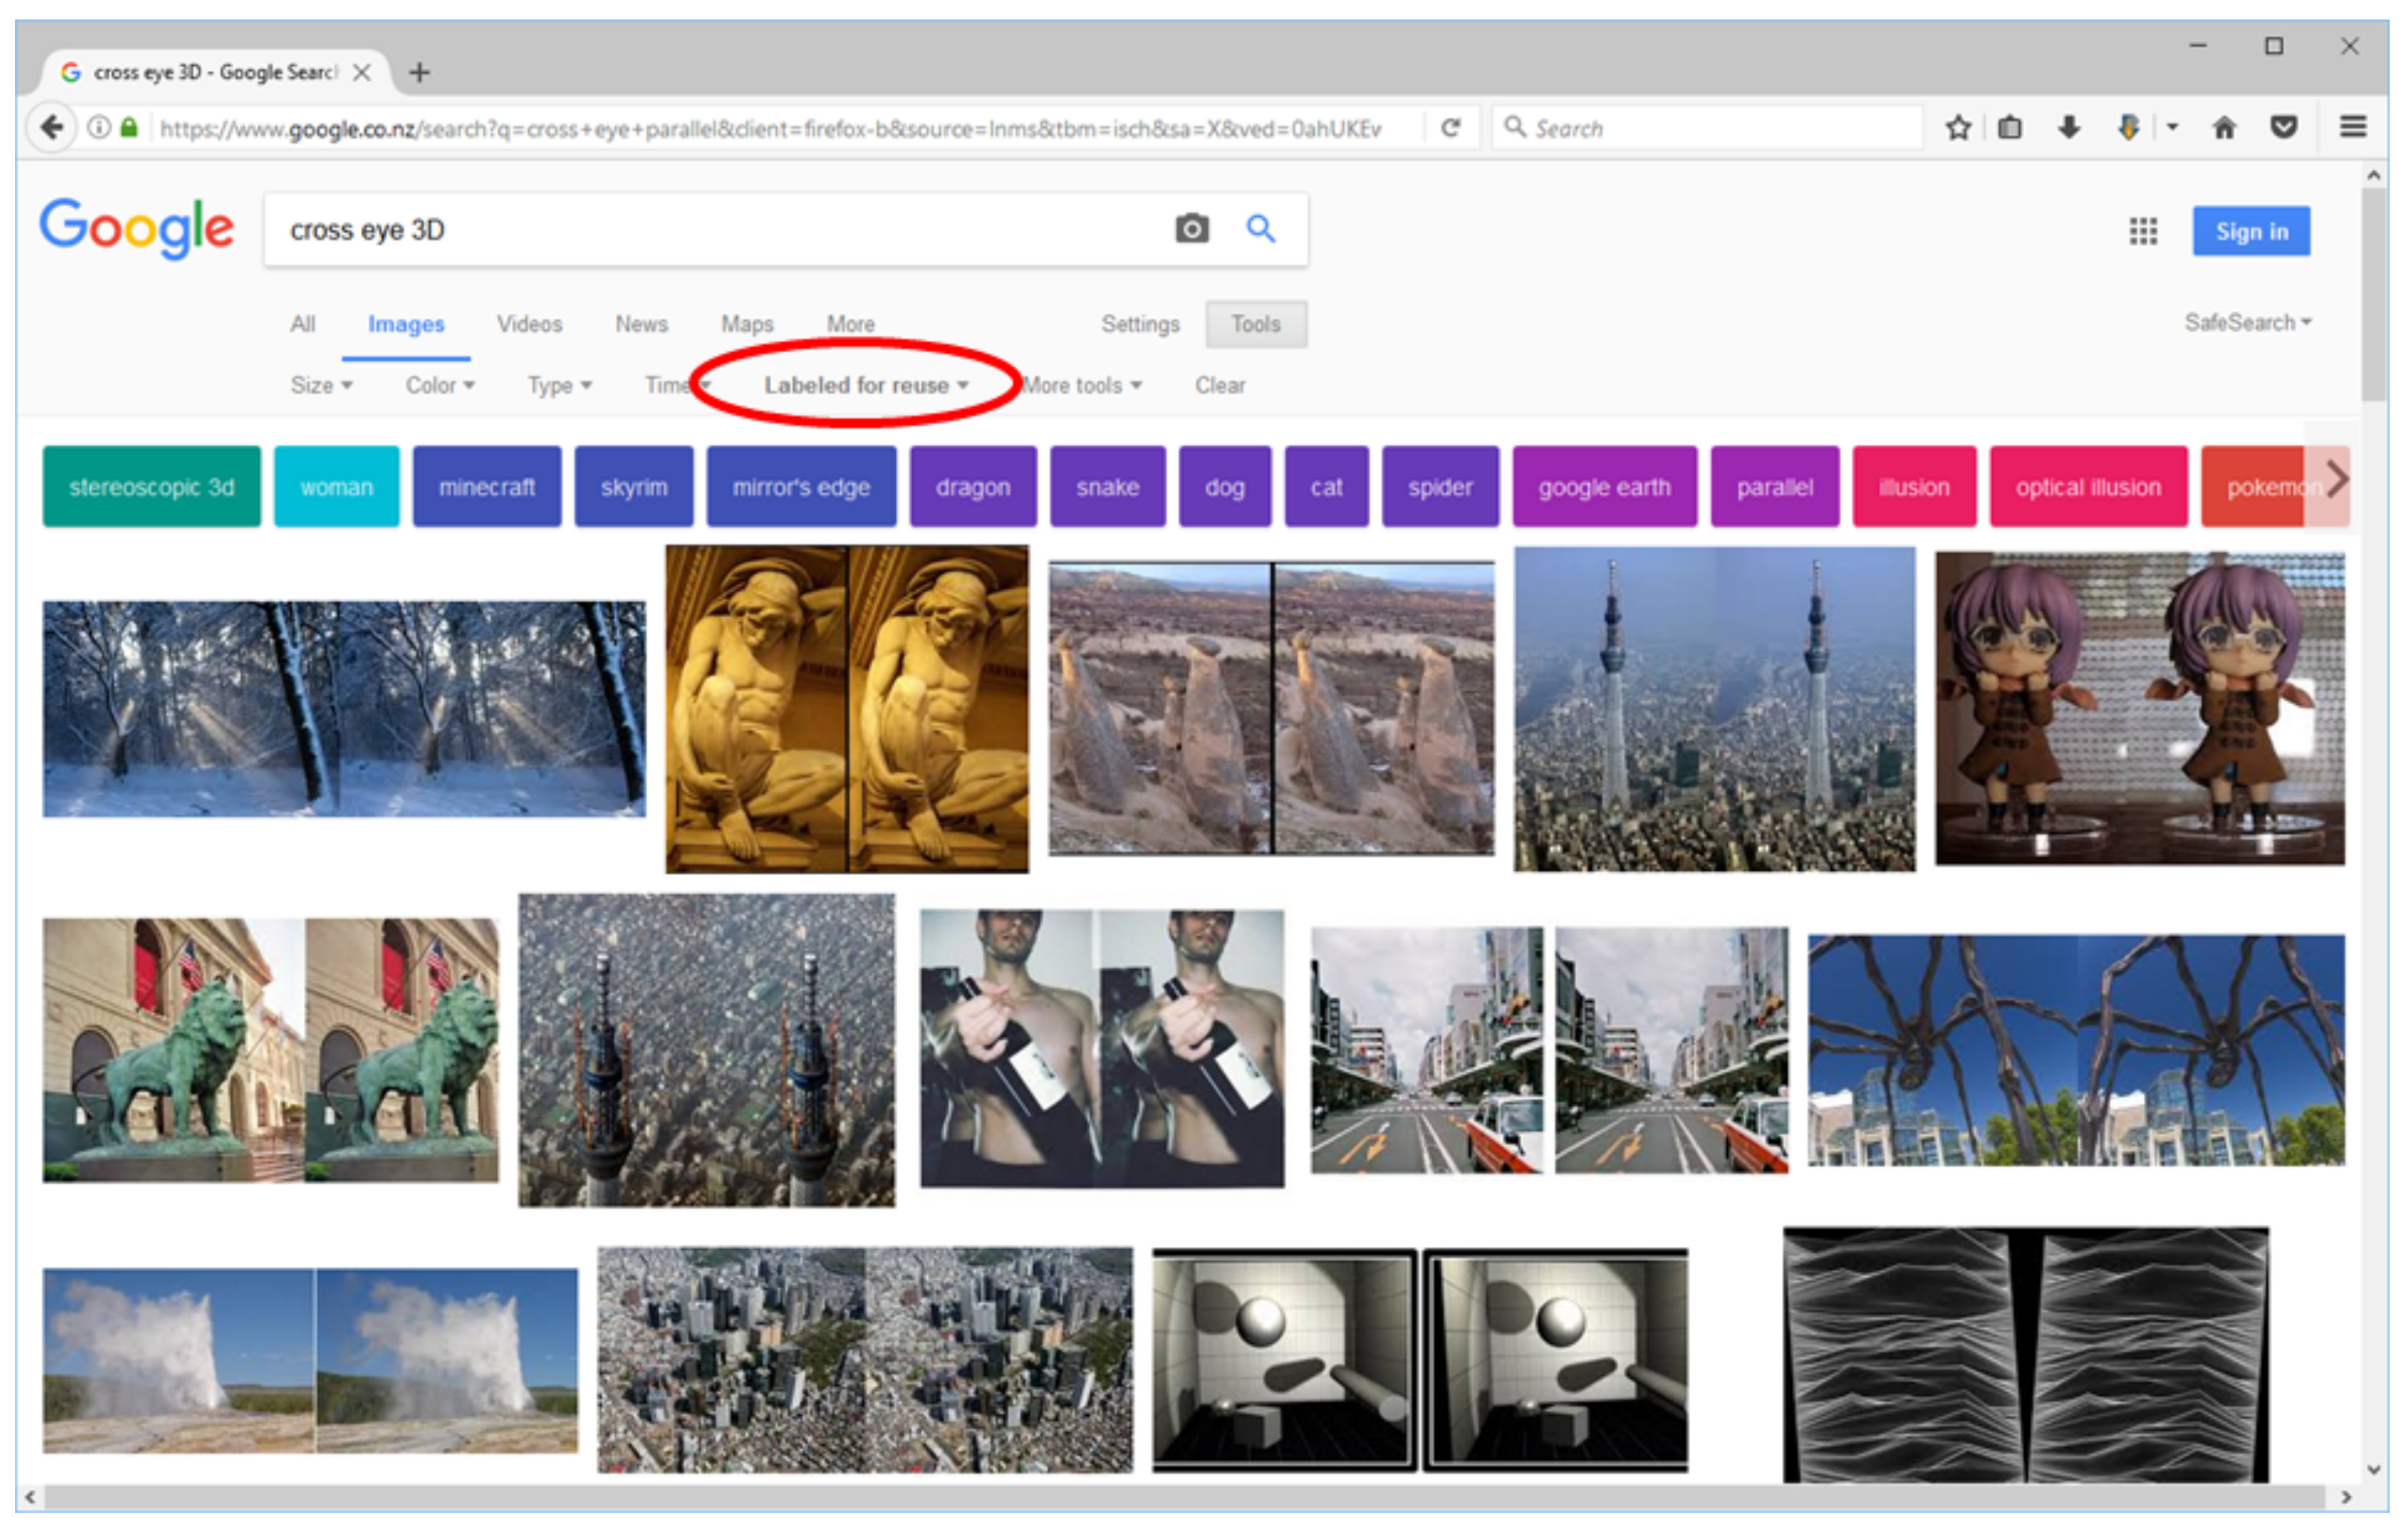
Figure 4.
Examples of anaglyphic and stereogram images. (a) A anaglyphic image; (b) A stereogram image.
Figure 4.
Examples of anaglyphic and stereogram images. (a) A anaglyphic image; (b) A stereogram image.
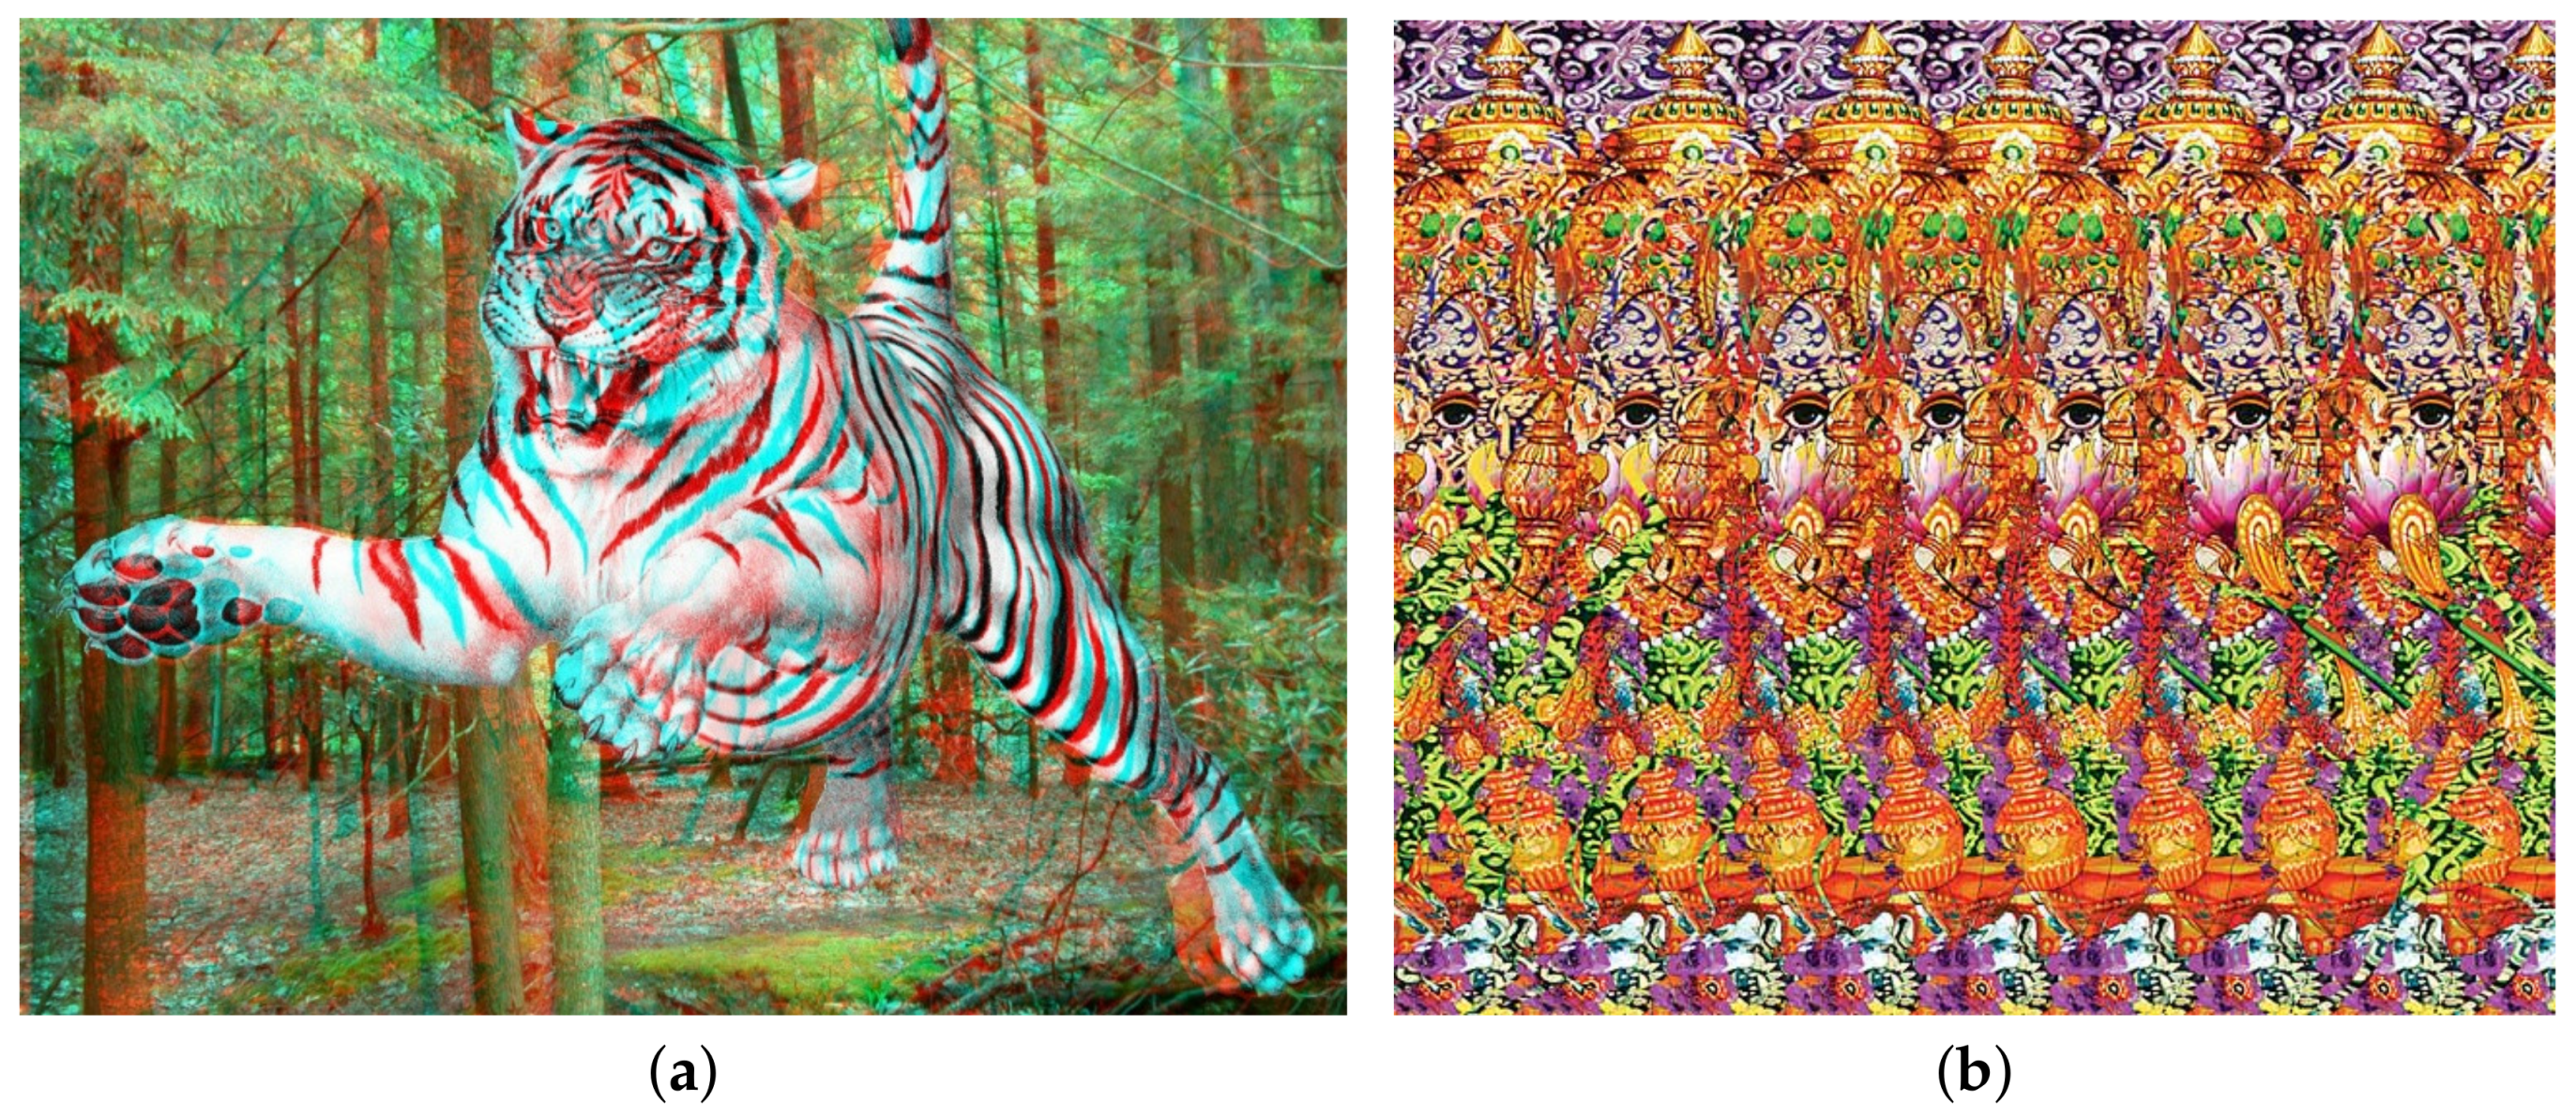
Figure 5.
Architecture and Procedure of the Proposed System.
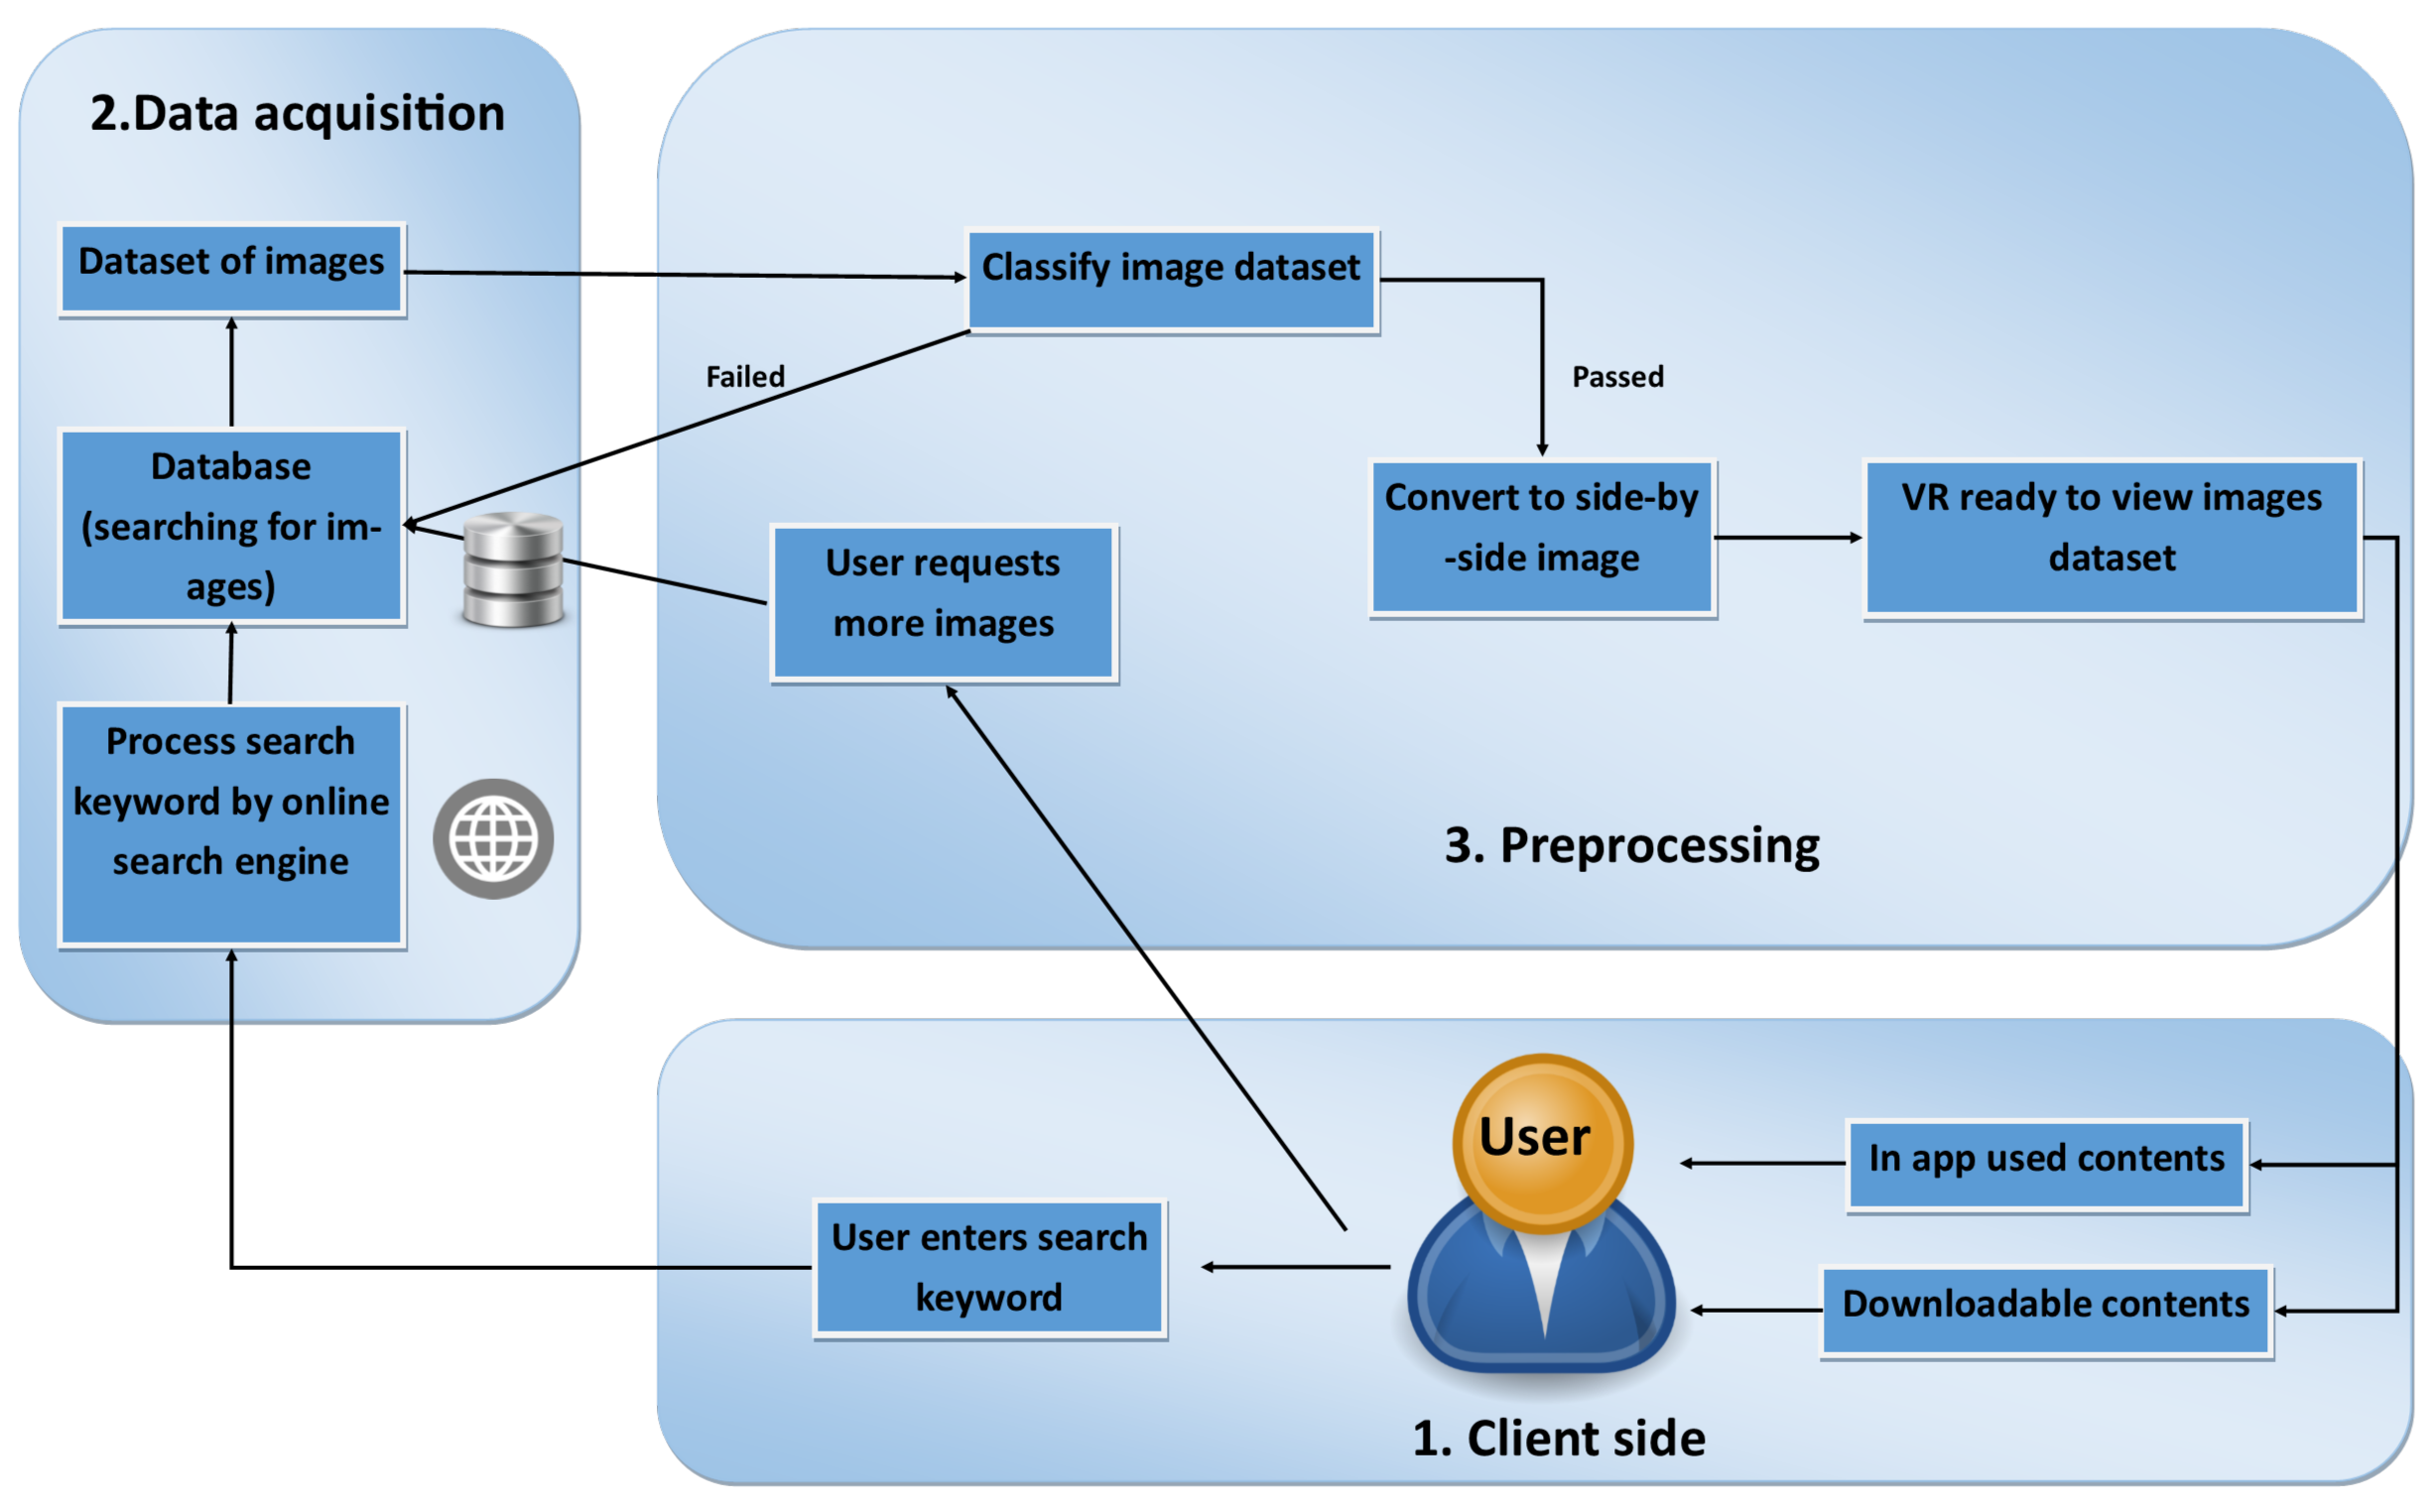
Figure 6.
Feature Matching between two halves could determine the types of 3D images. (a) Matches are not horizontally aligned on “normal " image; (b) Matches are horizontally aligned on side by side image.
Figure 6.
Feature Matching between two halves could determine the types of 3D images. (a) Matches are not horizontally aligned on “normal " image; (b) Matches are horizontally aligned on side by side image.
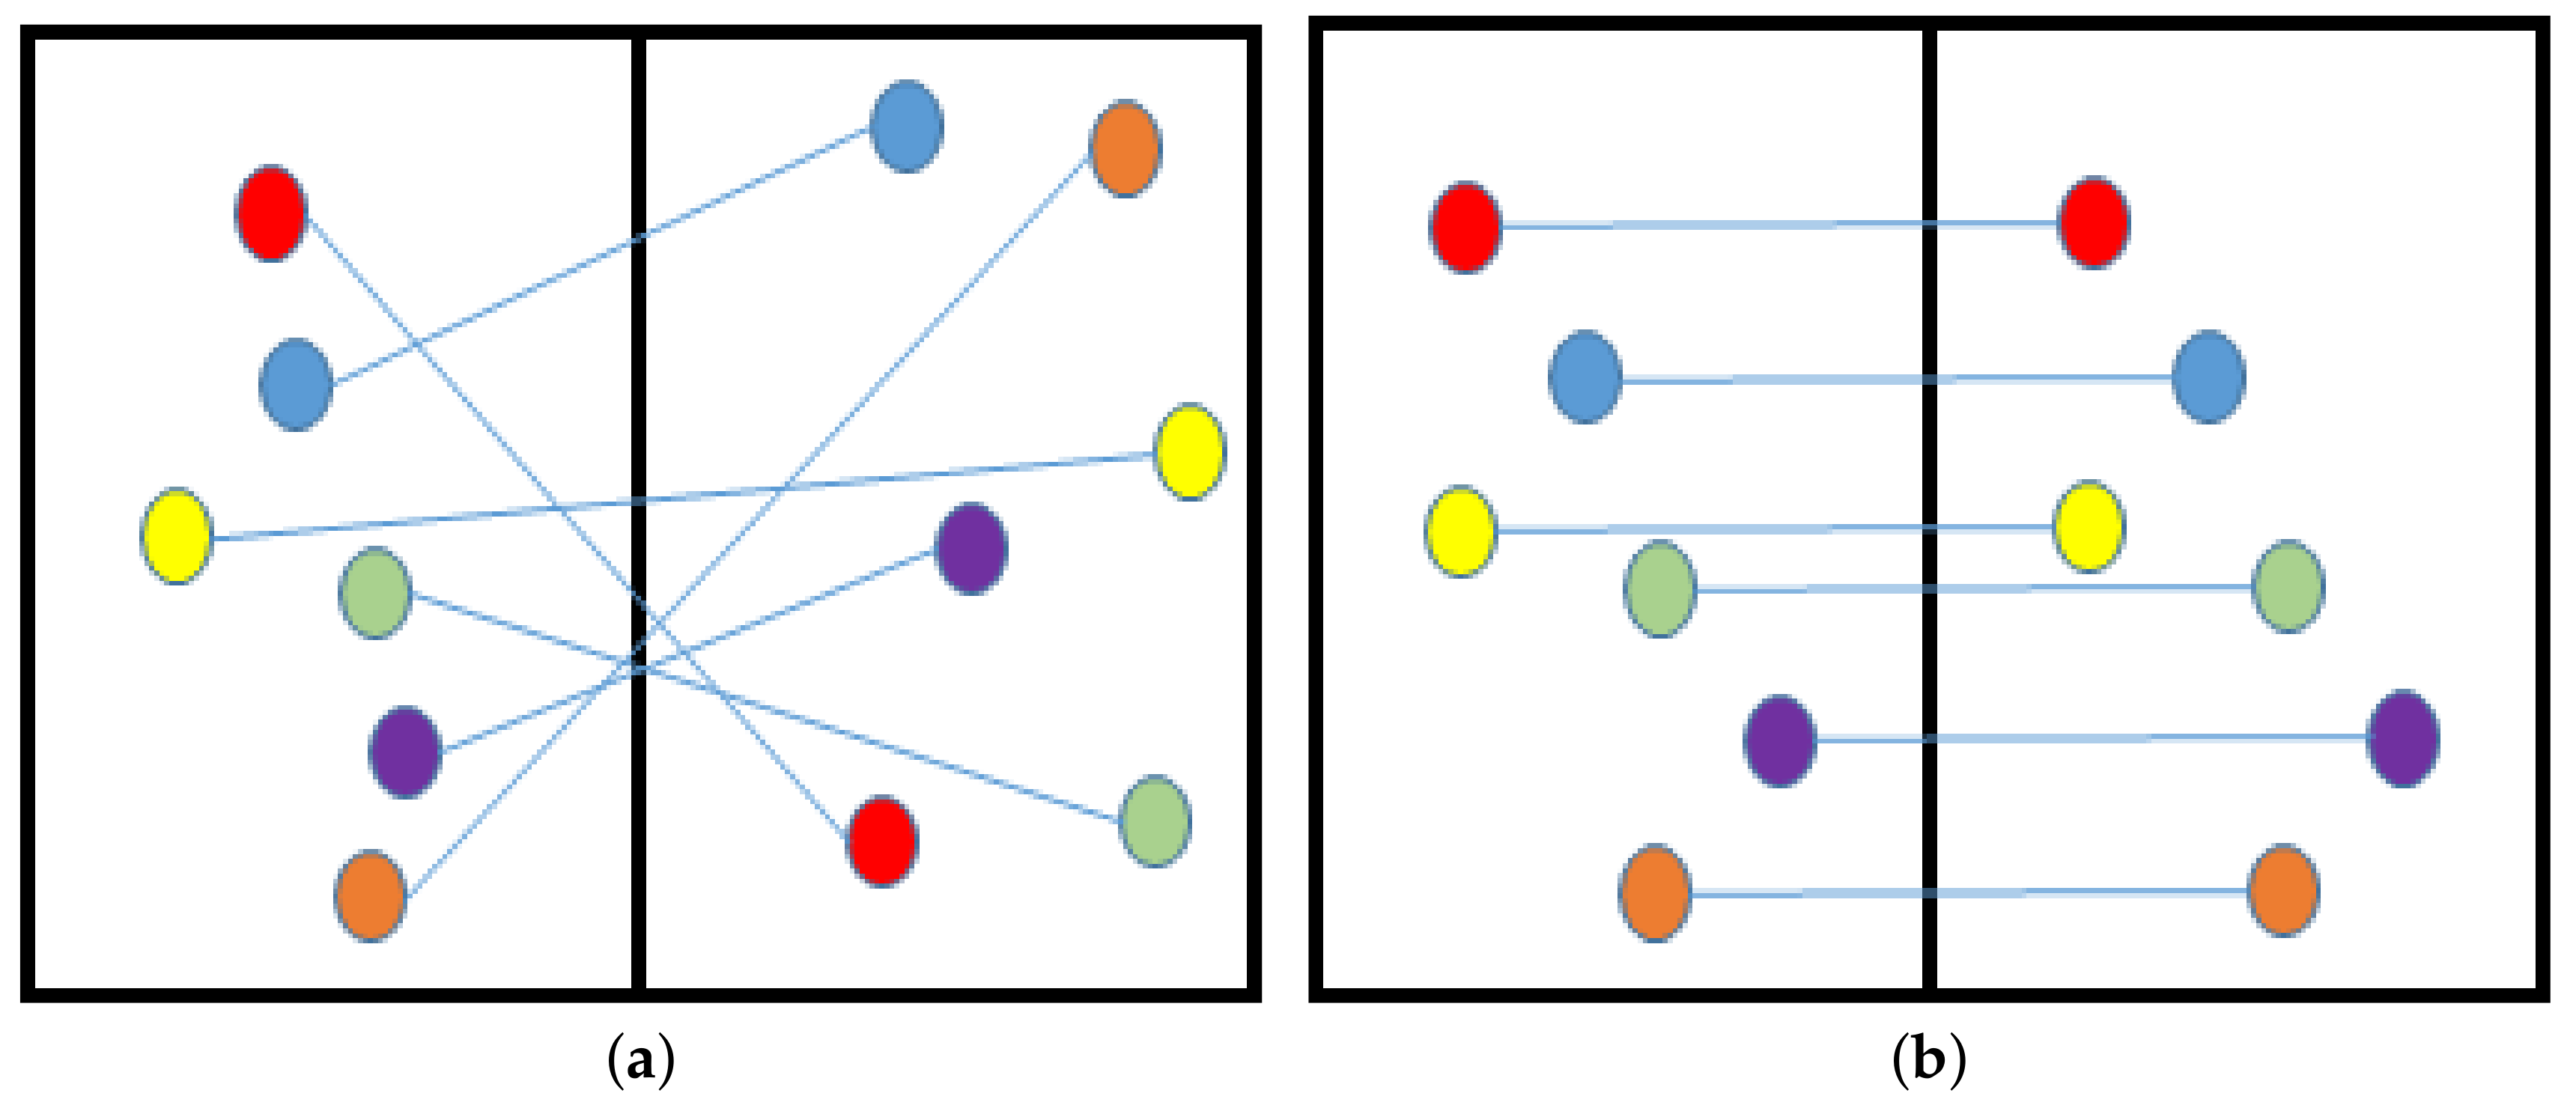
Figure 7.
30 image pairs from Middlebury 2005 and 2006 datasets (only left images are shown).
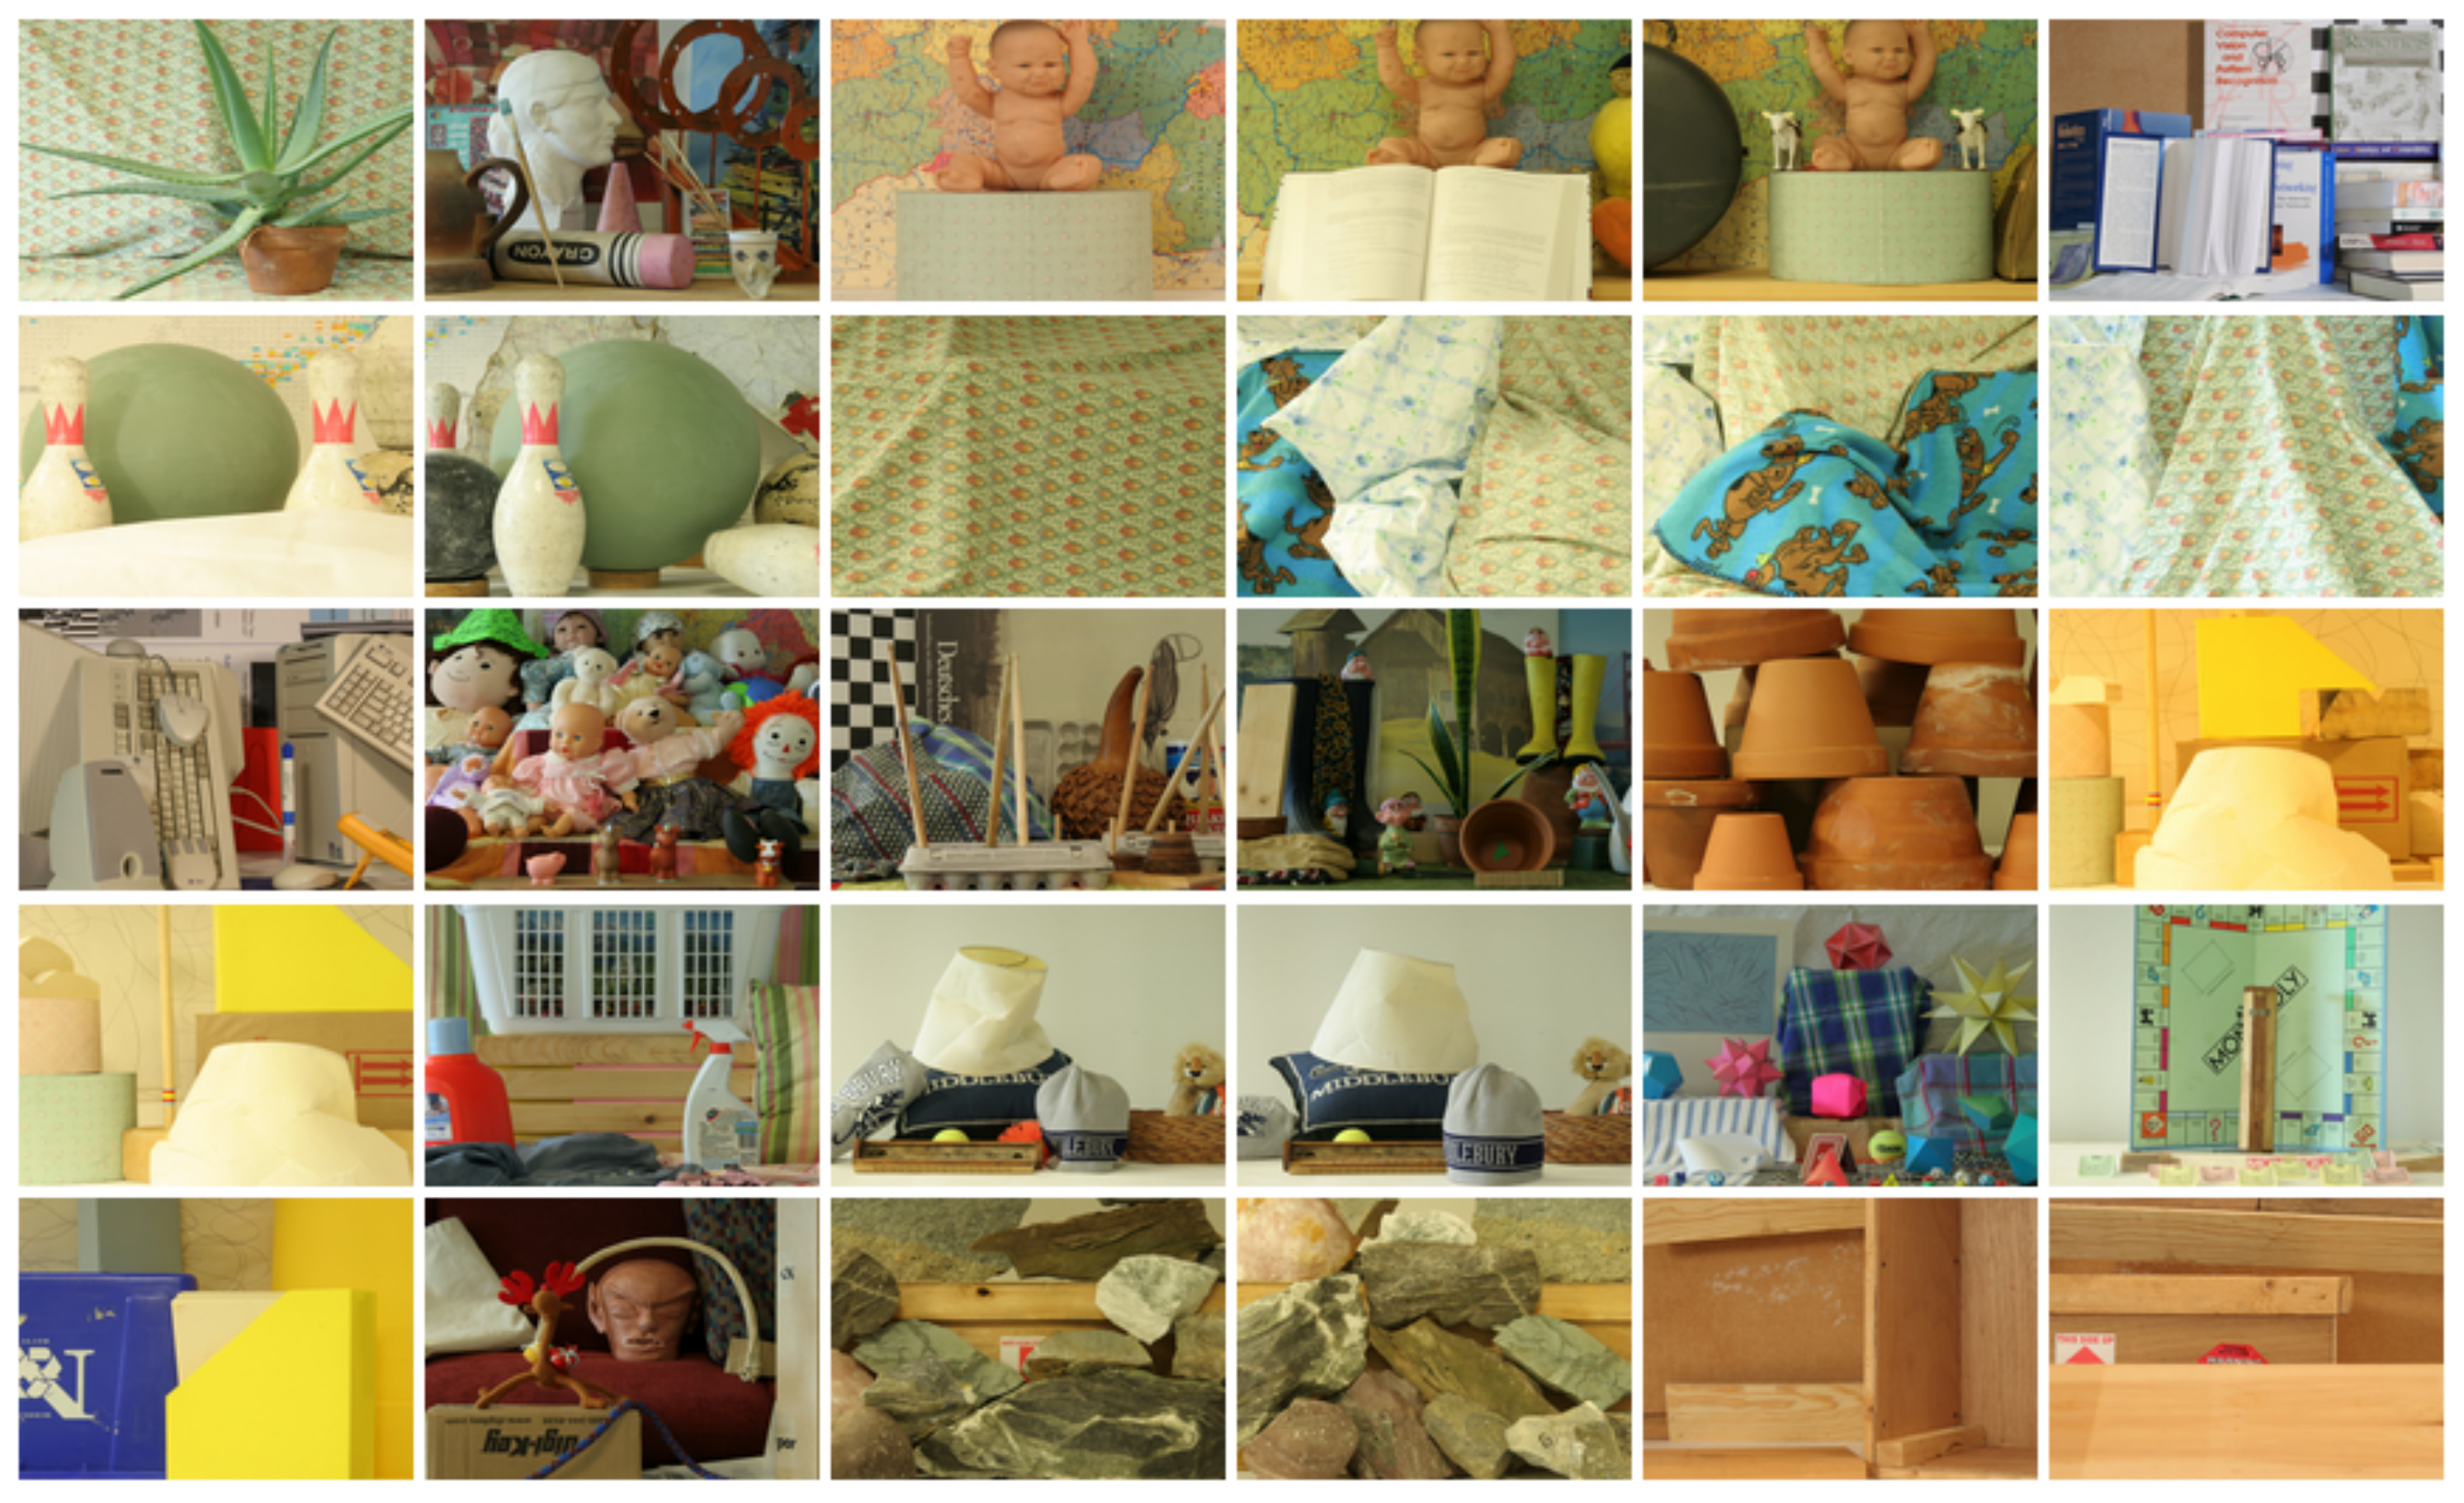
Figure 8.
A portion of 200 pairs of real-life images are randomly selected from different categories for image feature point matching (only left images are shown).
Figure 8.
A portion of 200 pairs of real-life images are randomly selected from different categories for image feature point matching (only left images are shown).

Figure 9.
Flow Chart of Our Classification base on KLT matched features.
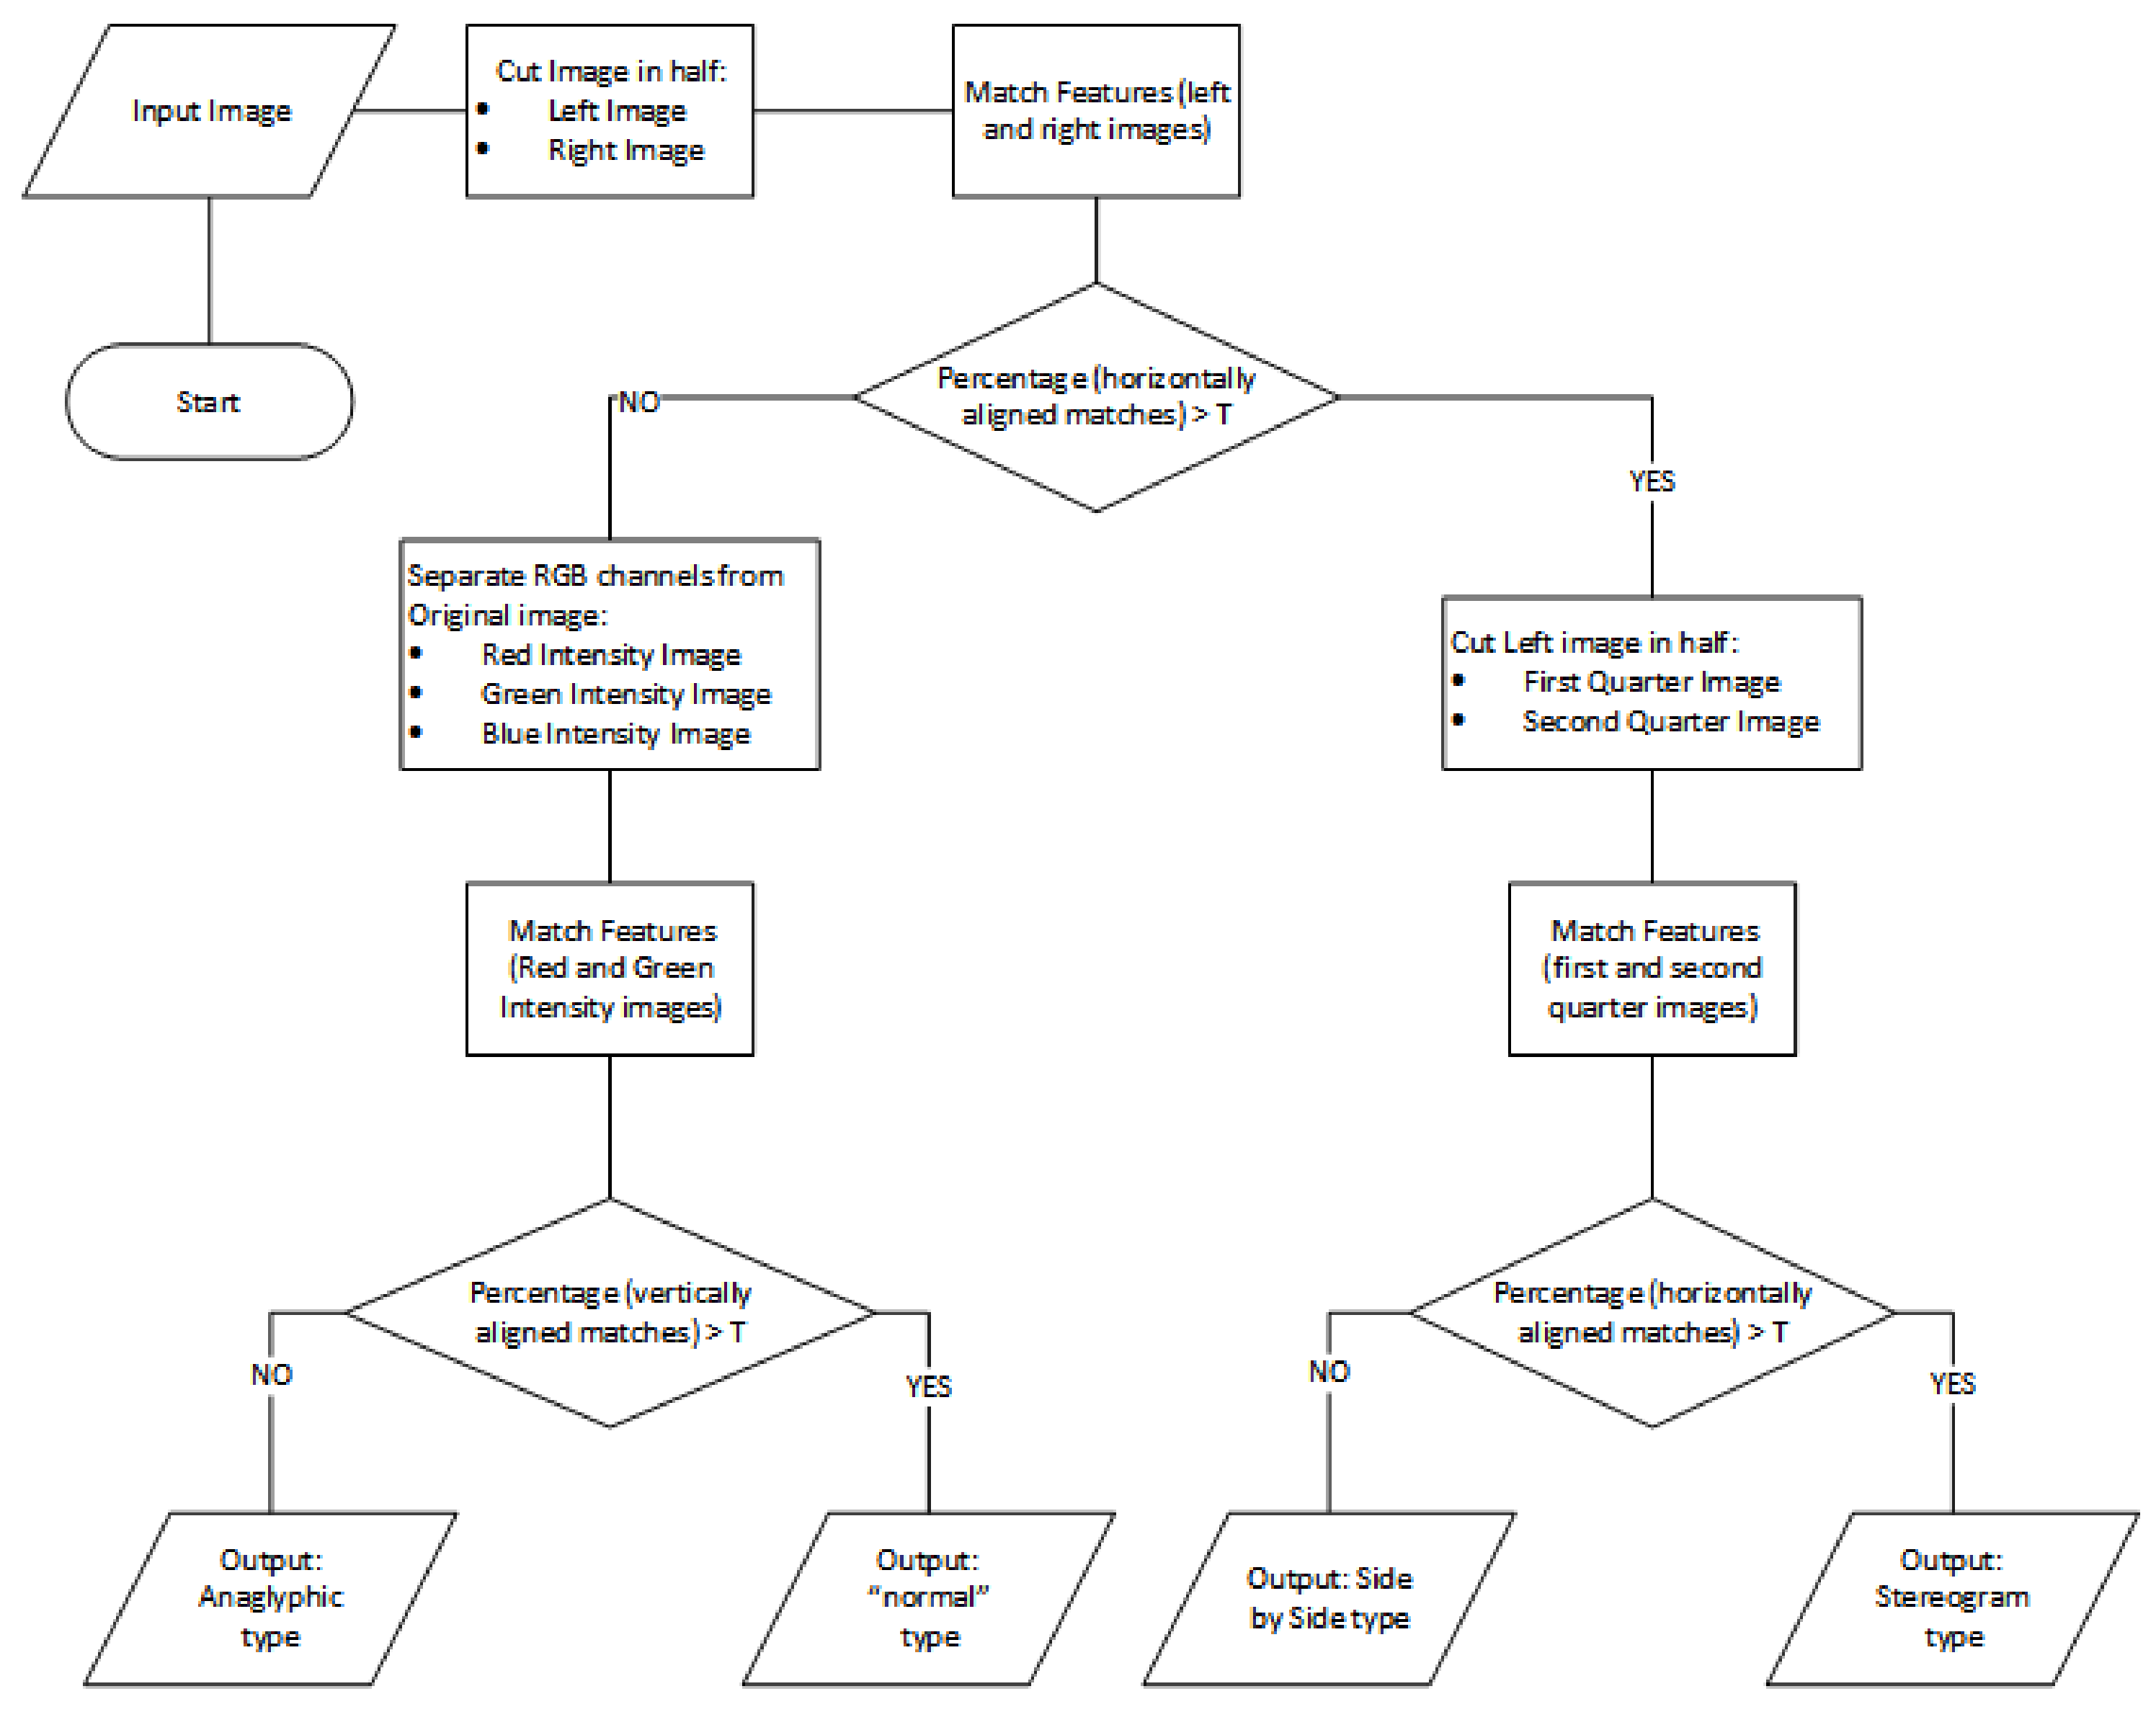
Figure 10.
Screen-shots of our current application. (a) Demo screen shot 1; (b) Demo screen shot 2; (c) Demo screen shot 3.
Figure 10.
Screen-shots of our current application. (a) Demo screen shot 1; (b) Demo screen shot 2; (c) Demo screen shot 3.


| Unity 5 | Unreal Engine 4 |
|---|---|
| Development feature | |
| Mainly based on C# & JavaScript | Mainly based on C++ & UnrealScript |
| Requires knowledge of programming (at least C# or JavaScript) for project development | Include Blueprint feature, which allows developing a project with minimum knowledge of Coding |
| Provides wider tweak & settings for the environment and object | Environment & object settings in Blueprint are limited. Requires custom-made model & platform for more settings |
| Graphic is good enough for mobile users, but limited compared with Unreal Engine | Graphic is generally better, including better shadow, physic, terrain |
| Better performance for mobile use | Better performance for PC & Console |
| Supports a wide range of platforms, including mobile & web | Supports mainly PC and Console |
| Development fee | |
|
|
| Community | |
| Huge user base | Moderate user base |
| Extensive asset library, including objects, scripts, animation, tools required for a complete game with low fee | Small asset library. High fee of use |
| Huge database of the tutorial, including videos, demo & scripts. Requires less time for training | Limited database of tutorial |
| Community & Tutorials suitable for all types of developers, including beginners and hobbyist | Tutorials largely are designed for designers rather than programmers |
Table 2.
Statistic details of correspondence matching using KLT, SURF and SIFT on 2005 and 2006 Middlebury stereo datasets.
Table 2.
Statistic details of correspondence matching using KLT, SURF and SIFT on 2005 and 2006 Middlebury stereo datasets.
| Method | AVG Matches | STD Matches | AVG Time (Seconds) | STD Time (Seconds) |
|---|---|---|---|---|
| KLT | 811 | 60 | 0.95 | 0.29 |
| SURF | 810 | 167 | 1.72 | 0.36 |
| SIFT | 714 | 235 | 2.04 | 0.67 |
Table 3.
Statistic details of vertical misalignment in pixels between correspondences found by KLT, SURF and SIFT on 2005 and 2006 Middlebury stereo datasets.
Table 3.
Statistic details of vertical misalignment in pixels between correspondences found by KLT, SURF and SIFT on 2005 and 2006 Middlebury stereo datasets.
| Method | AVG | STD | AVG | STD | AVG | STD | AVG | STD |
|---|---|---|---|---|---|---|---|---|
| KLT | 0.16 | 0.12 | 0.27 | 0.24 | 0.47 | 0.50 | 24 | 46 |
| SURF | 0.16 | 0.12 | 0.26 | 0.23 | 0.43 | 0.47 | 31 | 53 |
| SIFT | 0.13 | 0.11 | 0.17 | 0.18 | 0.21 | 0.29 | 27 | 60 |
Table 4.
Ranges of mean and standard deviation found on four image types.
| Image Types | Matched between | ||
|---|---|---|---|
| “Normal” & Anaglyphic | left/right half | Small | Small |
| Stereogram & Side by Side | left/right half | Large | Small |
| “Normal” | red/green channels | Large | Large |
| Anaglyphic | red/green channels | Large | Small |
| Stereogram | 1st/2nd quarters | Large | Small |
| Side by Side | 1st/2nd quarters | Small | Small |
Table 5.
Detection rate of our Classification.
| Image Type | Correct Detection | Incorrect Detection | Percentage |
|---|---|---|---|
| “normal” images (type NOR) | 48 | 2 | 96% |
| anaglyphs (type ANAG) | 50 | 0 | 100% |
| side-by-side photos (type SBS) | 50 | 0 | 100% |
| stereograms (type STE) | 50 | 0 | 100% |
© 2017 by the authors. Licensee MDPI, Basel, Switzerland. This article is an open access article distributed under the terms and conditions of the Creative Commons Attribution (CC BY) license (http://creativecommons.org/licenses/by/4.0/).
Share and Cite
MDPI and ACS Style
Nguyen, M.; Tran, H.; Le, H. Exploration of the 3D World on the Internet Using Commodity Virtual Reality Devices. Multimodal Technol. Interact. 2017, 1, 15. https://doi.org/10.3390/mti1030015
AMA Style
Nguyen M, Tran H, Le H. Exploration of the 3D World on the Internet Using Commodity Virtual Reality Devices. Multimodal Technologies and Interaction. 2017; 1(3):15. https://doi.org/10.3390/mti1030015
Chicago/Turabian StyleNguyen, Minh, Huy Tran, and Huy Le. 2017. "Exploration of the 3D World on the Internet Using Commodity Virtual Reality Devices" Multimodal Technologies and Interaction 1, no. 3: 15. https://doi.org/10.3390/mti1030015