Pictorial AR Tag with Hidden Multi-Level Bar-Code and Its Potential Applications


School of Engineering, Computer and Mathematical Sciences, Auckland University of Technology, 55 Wellesley St E, Auckland 1010, New Zealand
*
Author to whom correspondence should be addressed.
Multimodal Technol. Interact. 2017, 1(3), 20; https://doi.org/10.3390/mti1030020
Submission received: 15 July 2017
/
Revised: 11 September 2017
/
Accepted: 15 September 2017
/
Published: 19 September 2017
(This article belongs to the Special Issue Recent Advances in Augmented Reality)
Abstract
:For decades, researchers have been trying to create intuitive virtual environments by blending reality and virtual reality, thus enabling general users to interact with the digital domain as easily as with the real world. The result is “augmented reality” (AR). AR seamlessly superimposes virtual objects on to a real environment in three dimensions (3D) and in real time. One of the most important parts that helps close the gap between virtuality and reality is the marker used in the AR system. While pictorial marker and bar-code marker are the two most commonly used marker types in the market, they have some disadvantages in visual and processing performance. In this paper, we present a novelty method that combines the bar-code with the original feature of a colour picture (e.g., photos, trading cards, advertisement’s figure). Our method decorates on top of the original pictorial images additional features with a single stereogram image that optically conceals a multi-level (3D) bar-code. Thus, it has a larger capability of storing data compared to the general 1D barcode. This new type of marker has the potential of addressing the issues that the current types of marker are facing. It not only keeps the original information of the picture but also contains encoded numeric information. In our limited evaluation, this pictorial bar-code shows a relatively robust performance under various conditions and scaling; thus, it provides a promising AR approach to be used in many applications such as trading card games, educations, and advertisements.
1. Introduction and Motivation
1.1. Augmented Reality and Our Motivation
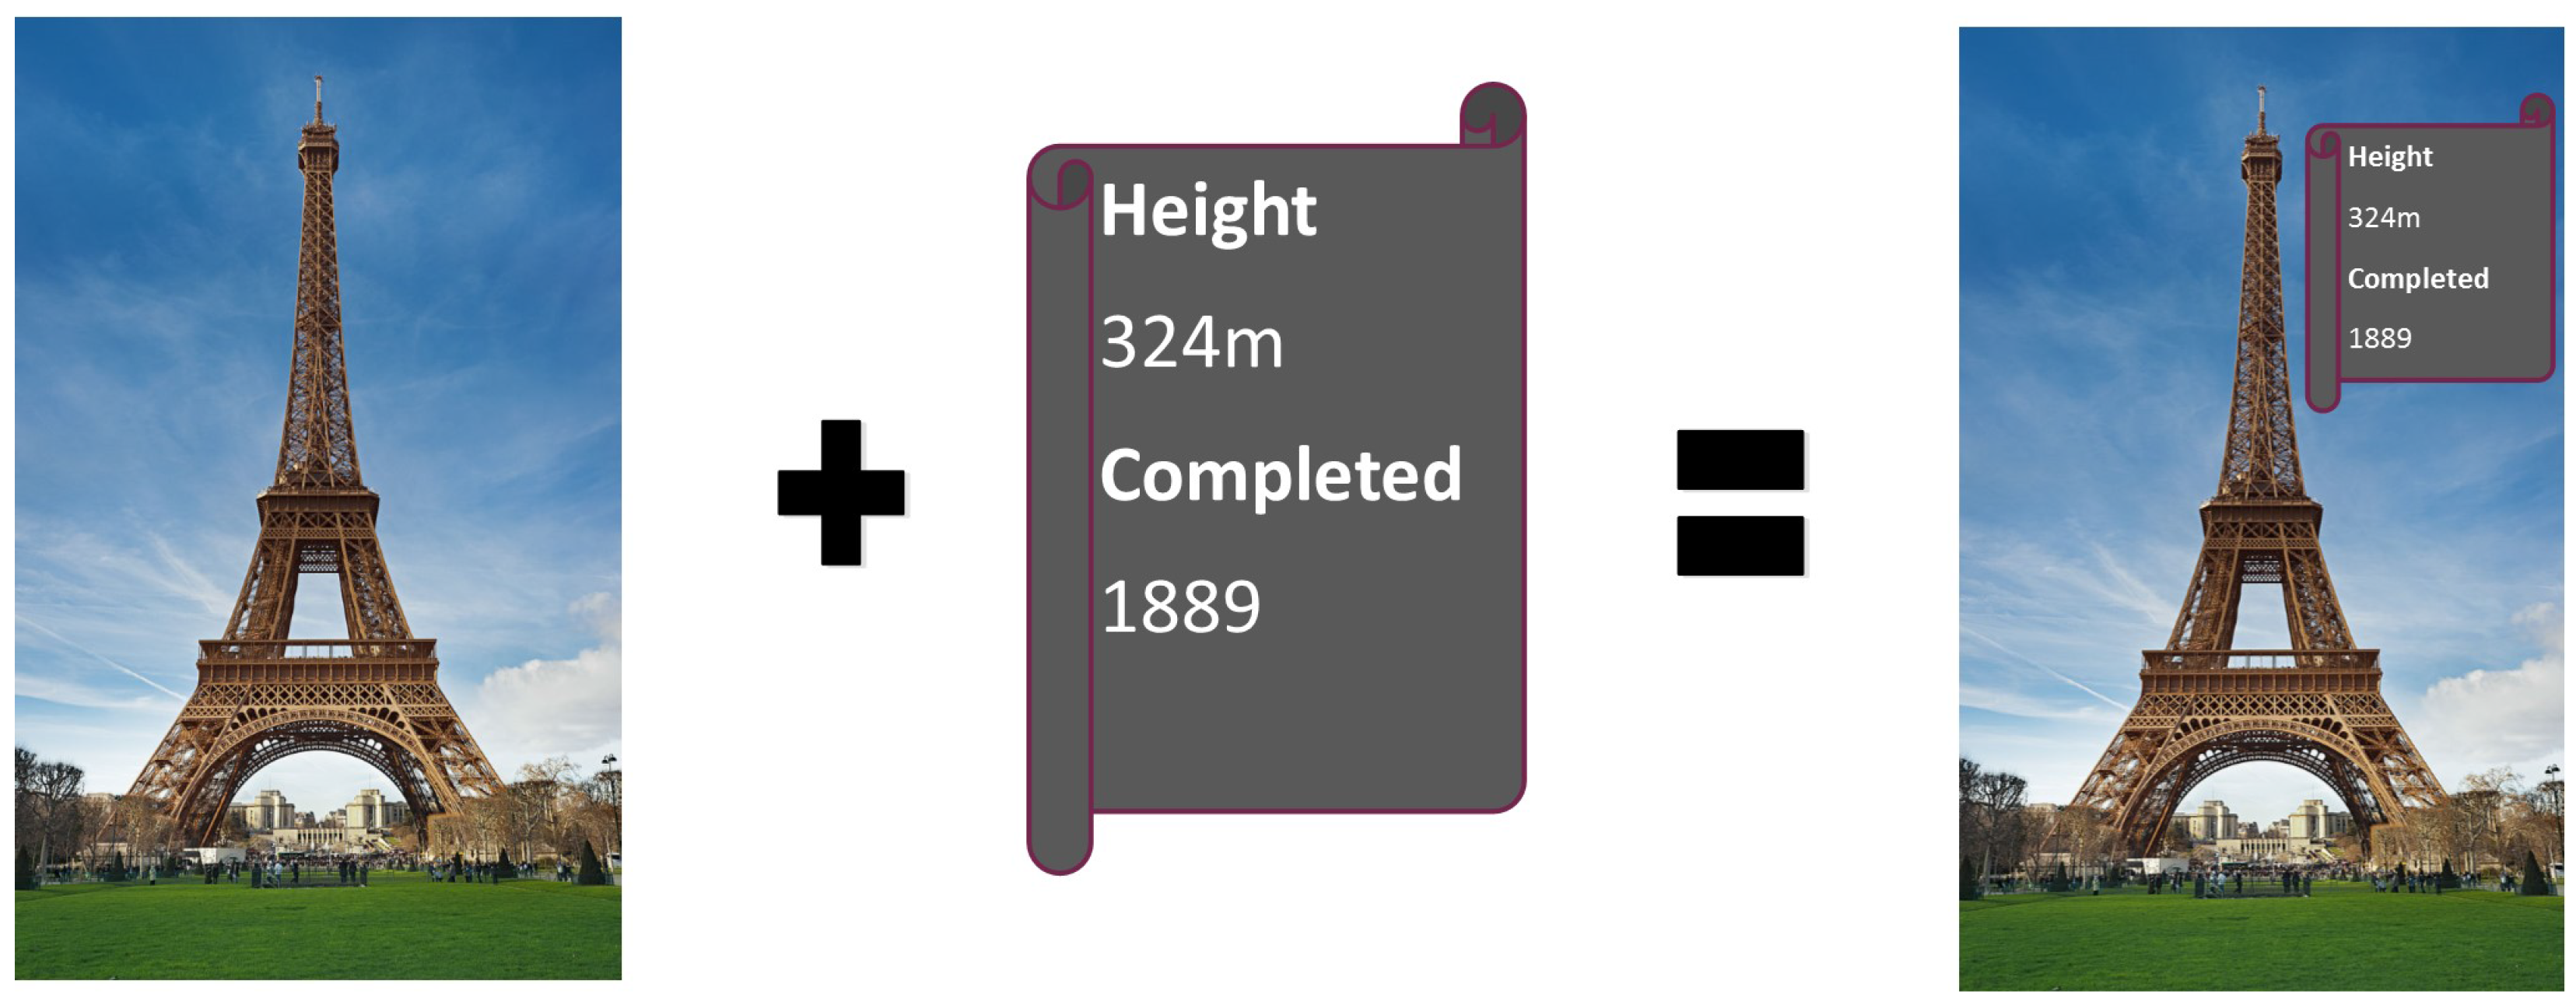
Augmented reality (AR) technology is a revolutionary solution to make things more efficient and attractive by overlaying 3D virtual objects onto the real world in real time. AR seems like something straight out of a science fiction movie, but it is here today and available on many current information devices. AR also presents a particular form of human–computer interaction (HCI). The initial concept of AR is to replace parts of reality with additional information; the latter can be computer-generated and hidden from the human senses. Azuma in 1997 [1] defined AR as technologies that combine real-world objects with virtual 3D objects, thereby creating interactivity between them (real and virtual) in real time; the virtual objects, however, could not be perceived directly. AR has been used extensively in many systems such as military operations in urban terrain and air forces [2], architecture systems [3], and games [4]. Figure 1 shows an example of an AR application for tourism. Here, a virtual information label augments the real scene of the Eiffel Tower; the virtual information label is computer-generated and overlaid on a partial area of the actual Eiffel Tower scene.
Creating an effective AR experience requires the use of various tools such as graphics rendering tools, tracking and registration tools, and various display or interaction techniques. When creating AR displays [1], one faces numerous problems such as the need to avoid producing confusing visuals, the need to reduce processing complexity, and the limited number of allowed virtual items. However, one central problem is the determination of computer-generated objects and their position and orientation so that they could be aligned accurately with the physical objects in the real world. In many existing applications, graphical content is often put on pre-defined markers as they provide a convenient way for detecting the encoded contents and calculating the camera poses. For example, an image tag system such as BazAR [5,6] uses natural (colour) picture as markers. The camera position related to the marker is calculated to blend the virtual information into the real world environment. This relationship is called pinhole camera model [7] or pose estimation in computer vision.
For robust and unambiguous applications [8], black and white markers with thick borders are often used [9,10,11]. They include at least the three types: (1) template markers; (2) barcode markers; and (3) circular marker (Figure 2). These markers are made up of a white/light coloured padding, surrounded by a thick black/dark coloured border and a high contrast pattern of either a template figure, a square or a circular 2D bar code. The pattern is what makes these markers unique. The black border of markers is recognised, tracked, and used to calculate the position in 3D space. Some other newly invented fiducial marker designs combining payload with the structure of the tag, such as [12,13], are still collections of black and white squares or dots.
Both template and bar-code tags have their pros and cons. Template tags may contain some meaningful pictures of the objects they are presenting, such as a flying eagle in Figure 2. For this type of marker, one could use feature matching techniques for identifying them (by comparing the appearances with other markers stored in a database). However, this system must be trained sufficiently for the proper template matching; moreover, template recognition could be unreliable due to the undesired similarity between template markers [14]. Consequently, in such a system, the number of different templates need to be small for reliable matching results.
On the other hand, bar-code and circular markers are encoded in “0” or “1” by arranging the marker region into many black and white bars. Examples are CyberCode [9], Bokode [15], and AprilTag [16]. Decoding techniques are used to decrypt the encoded data. It is relatively easy to detect and recognise bar-code using various feature detection technologies [17]. However, these markers display no useful information for the users. It is thus difficult to know which marker represents which virtual object just by looking at the black and white pattern themselves.
Our goal is to not only address the issues of the current marker types, but also utilise the advantages from these markers. In this paper, we introduce a new AR marker that optically hides a multi-level barcode code [18] inside a colour picture. The details will be described in this article.
1.2. The Rise of Augmented Reality and Its Applications
Since 1990, AR has been used in many different applications. It is now believed to be the next step in how people collect, process and interact with information [19]. For example, in health care, suddenly collapsed patients can be saved more quickly by using AED4EU designed by Lucien Engelen from the University Nijmegen Medical Centre, The Netherlands [20]. It helps users add places where automated external defibrillator (ADEs) are located. They are then able to project the exact location of the nearest AEDs through their phones when needed.
Another example is in ultrasound imaging [21], whereby physicians could use AR to see directly inside a patient for accurate positioning of the surgical site [22]. Their surgical team now can easily view the imaging data in real time while they are processing the procedure. In 2007, Christoph Bichlmeier and his team introduced a new AR system for intuitive viewing on the deep-seated anatomy of the patient in real time [23]. They also proposed that the system could be integrated surgical tools for rendering volumetrics of computerised tomography scans or magnetic resonance imaging data directly without wasting time.
AR has also been used for gaming purposes popularly. ARQuake is an indoor/outdoor AR first person game [24]. It allows players to shoot down virtual demons while moving in the physical world, using a large Head-mounted display to interact with virtual objects. However, it is not a practical idea when people are focusing on handy and light accessories nowadays. Pokémon GO is an indicative AR based game that addicts many people around the world [25]. Players can use their mobile devices to catch virtual Pokémon characters in the real world and interact with other users via Wi-Fi or 3/4G networks.
1.3. Current Technical Pros and Cons of Augmented Reality
Creating an effective AR experience requires the use of different tools such as tracking, registration (for aligning the virtual objects with the real scene), and rendering (for displaying the virtual information). These tools are easy to implement with the advantage of today’s technologies. However, there are still a few long-term AR disadvantages that should be concerning, such as system processing complexity and information orientation. The main principle behind AR technology is finding the target (could be a pictorial marker or a bar-code marker) and orienting the digital information on the detected target.
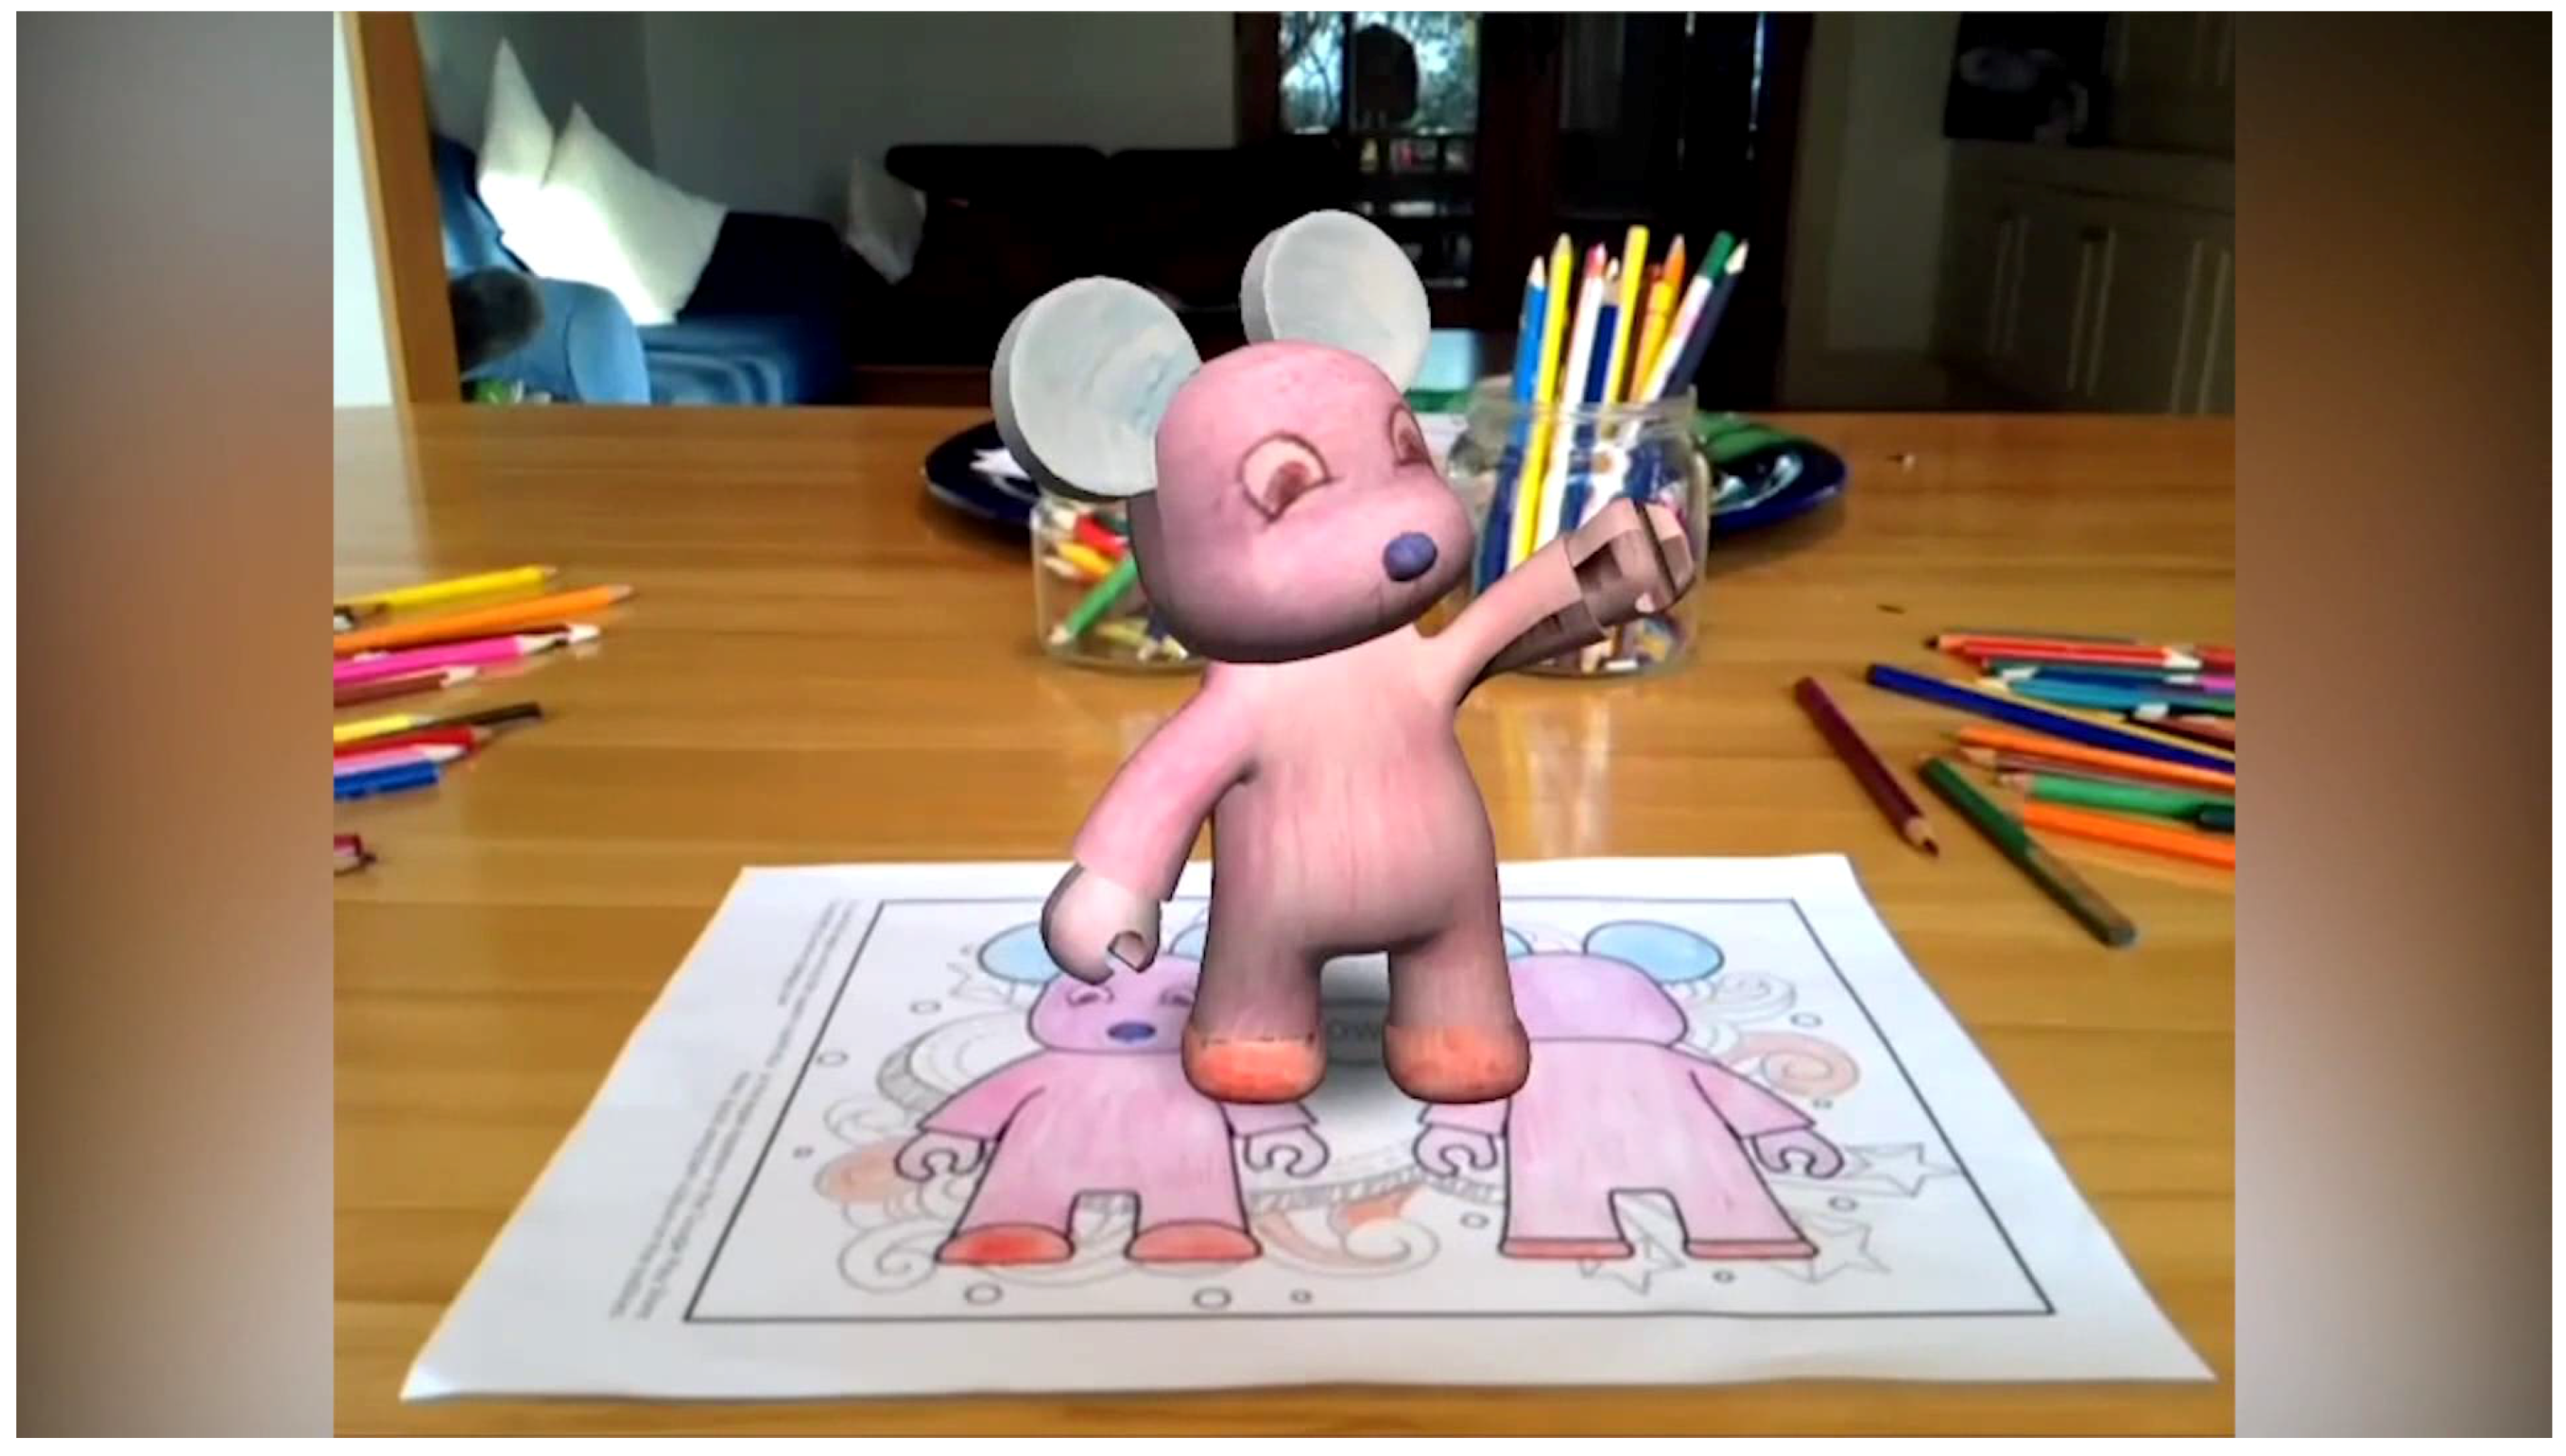
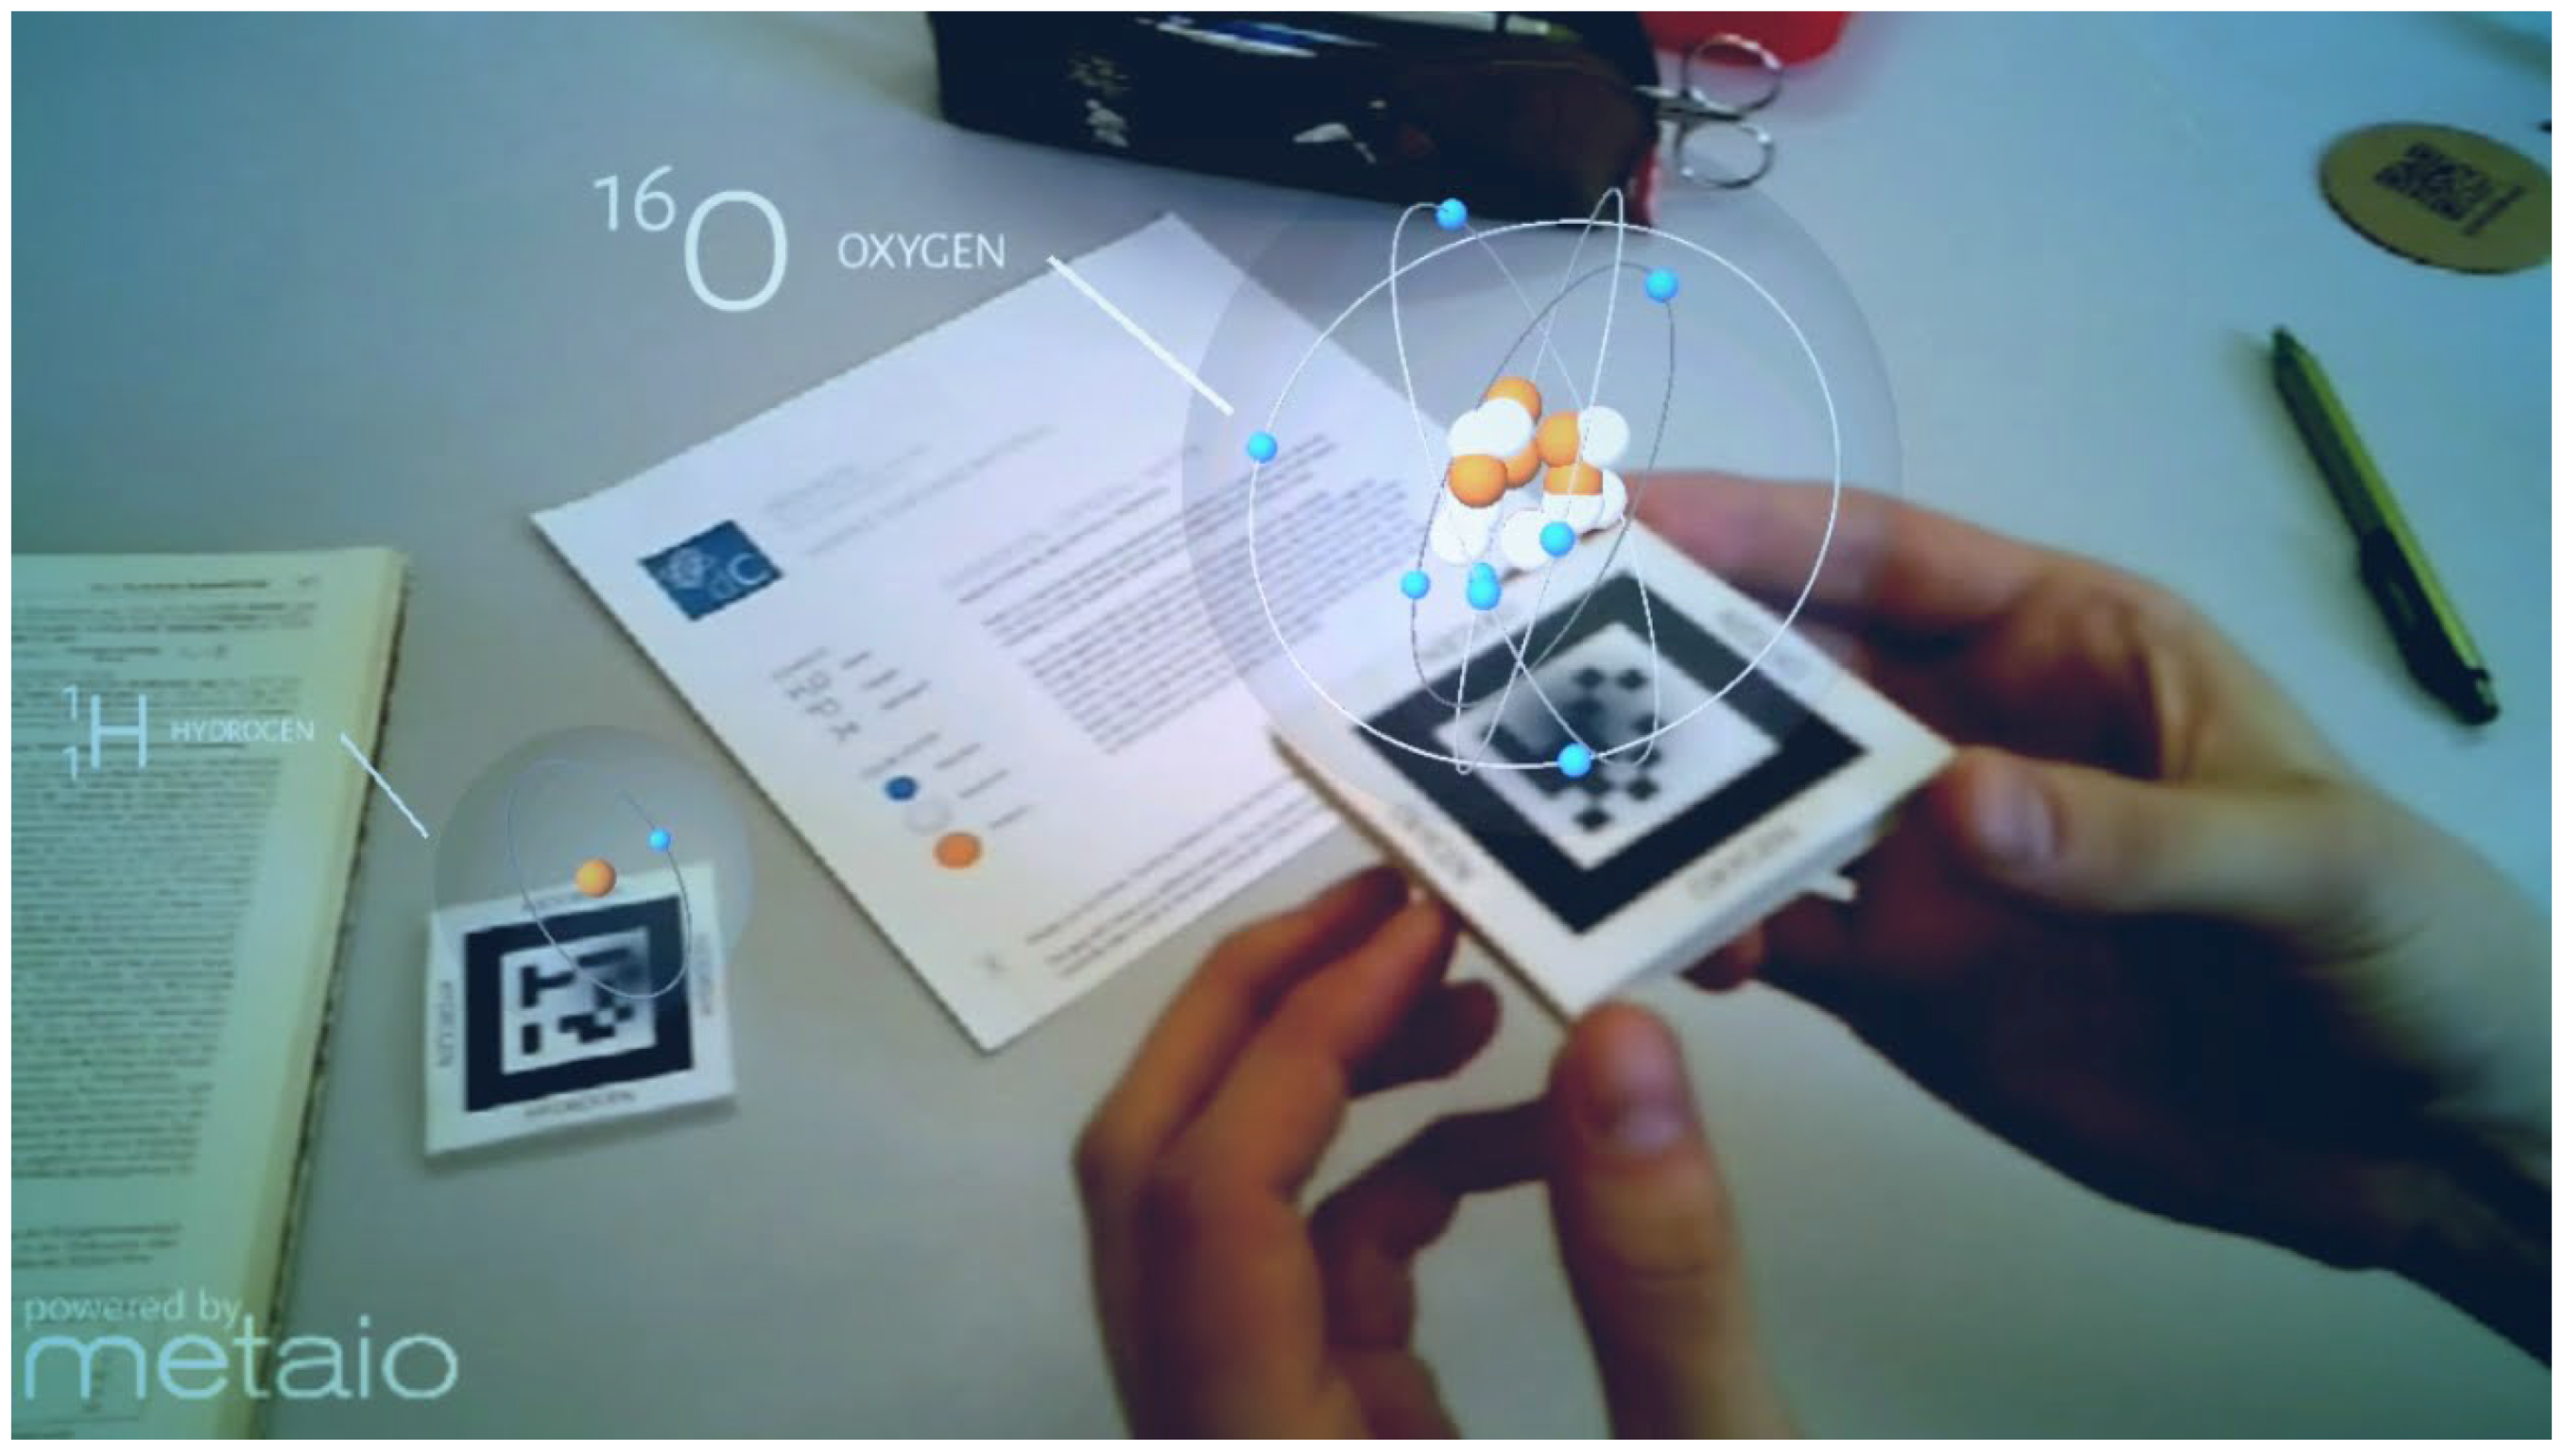
Pictorial markers as shown in Figure 3 are often used as they are convenient for detecting and displaying content. They are also more meaningful to the users and especially the younger ones. However, this approach requires image registrations, and the recognition processing becomes unreliable sometimes due to the undesired similarity between images [14]. Consequently, the method is used mostly in AR applications with small data sets such as Magic books [26], an application designed for children usage. Processing complexity issue can occur if this method is applied for AR applications with large datasets such as AR Chemistry application as shown in Figure 4. These chemistry education applications usually include an extensive data set that contains the information of over hundreds chemical elements and compounds. For this reason, this type of application is designed to work best with barcode markers.
As stated, the bar-code markers are more popularly used within the larger sized, robust and unambiguous applications. These markers are normally designed with black and white data cells surrounding with a thick dark-coloured border. The data cells are encoded as a binary number that made them unique from each other. The decoded binary number on each marker will be compared with stored binary numbers in the dataset. The advantage of this method compared to pictorial markers is that the system processing complexity issue will be minimised. Another advantage is that, besides encoding information, it is possible to use the binary bits for error detection and correction. Hamming codes [27] and Reed–Solomon [28] codes are two methods that are often used for error detection and correction; some examples are ALVAR and ARTag [29]. Even though there are advantages over pictorial markers, these data cells are meaningless to the users unless some pictorial and/or explanatory information are added along side.
Both pictorial and bar-code makers have their advantages and disadvantages, as shown in Table 1. The pictorial approach has a meaningful appearance to the users, but the system processing complexity and reliability could be problematic. The bar-code markers overcome the problems and facilitate error detection and correction; however, they provide no useful information to the users and thus appear unattractive.
1.4. Related and Previous Works
There exist some digital watermarking systems trying to solve the aforementioned AR issues. Visual Syncar [30] is one example, the Japanese telecommunications company NTT (Tokyo, Japan) embeds digital watermarks as time codes into the video sequences. A smart device can read those time codes, and display the augmented virtual graphics in sync with the live content on the screen. This is an ingenious approach, but it can only be used for images displaying on a computer/TV’s screen.
CyberCode [9] is another visual tag used for the AR environment, which place a 2D barcode next to a graphic business card or other physical spaces. The problem is: if the barcode is too small, it is not easily readable/scannable by general webcam. On the other hand, if the barcode is too large, it is getting distracting and leaving little spaces for presenting the pictorial or literature information of the marker.
Another way to fix the issue is to combine both pictorial markers and barcode marker in one single AR Tag. For instance, Alvarez [31] proposed an approach of using a 2D barcode in the centre of the tag and the border is used to present the meaning of the tag, regarding texts (as seen in Figure 5a). This marker looks distracting with strong colours, and vertical texts are not easily readable.
Qualcomm Vuforia Marker (as shown in Figure 5) is the more decent AR marker. This marker is capable of storing a few bytes of binary codes by adding some black and white dots next to the black border of the marker; the central region is used to display the pictorial content. This concept works well in some simple applications. However, the appearance of the barcode is still quite obvious and distracting. Moreover, the inner images must have lighter backgrounds so that they do not confuse the detection of the binary codes.
We tackle the problem with a different but novel approach. We use graphic patterns of the original image to encode the binary information. As a result, no obvious binary barcode is presented on the appearance of the AR tag. The pictorial, graphic region itself holding the barcode; thus, it has the same size as the picture. The detected tag is therefore readable/scannable by the general colour camera. We have introduced its initial designs briefly in some short conference papers, such as [33,34,35]. In this manuscript, the proposed idea, design, and implementation will be covered in much more details.
2. Pictorial Marker with Hidden 3D Bar-Code (PMBC)
2.1. Overview
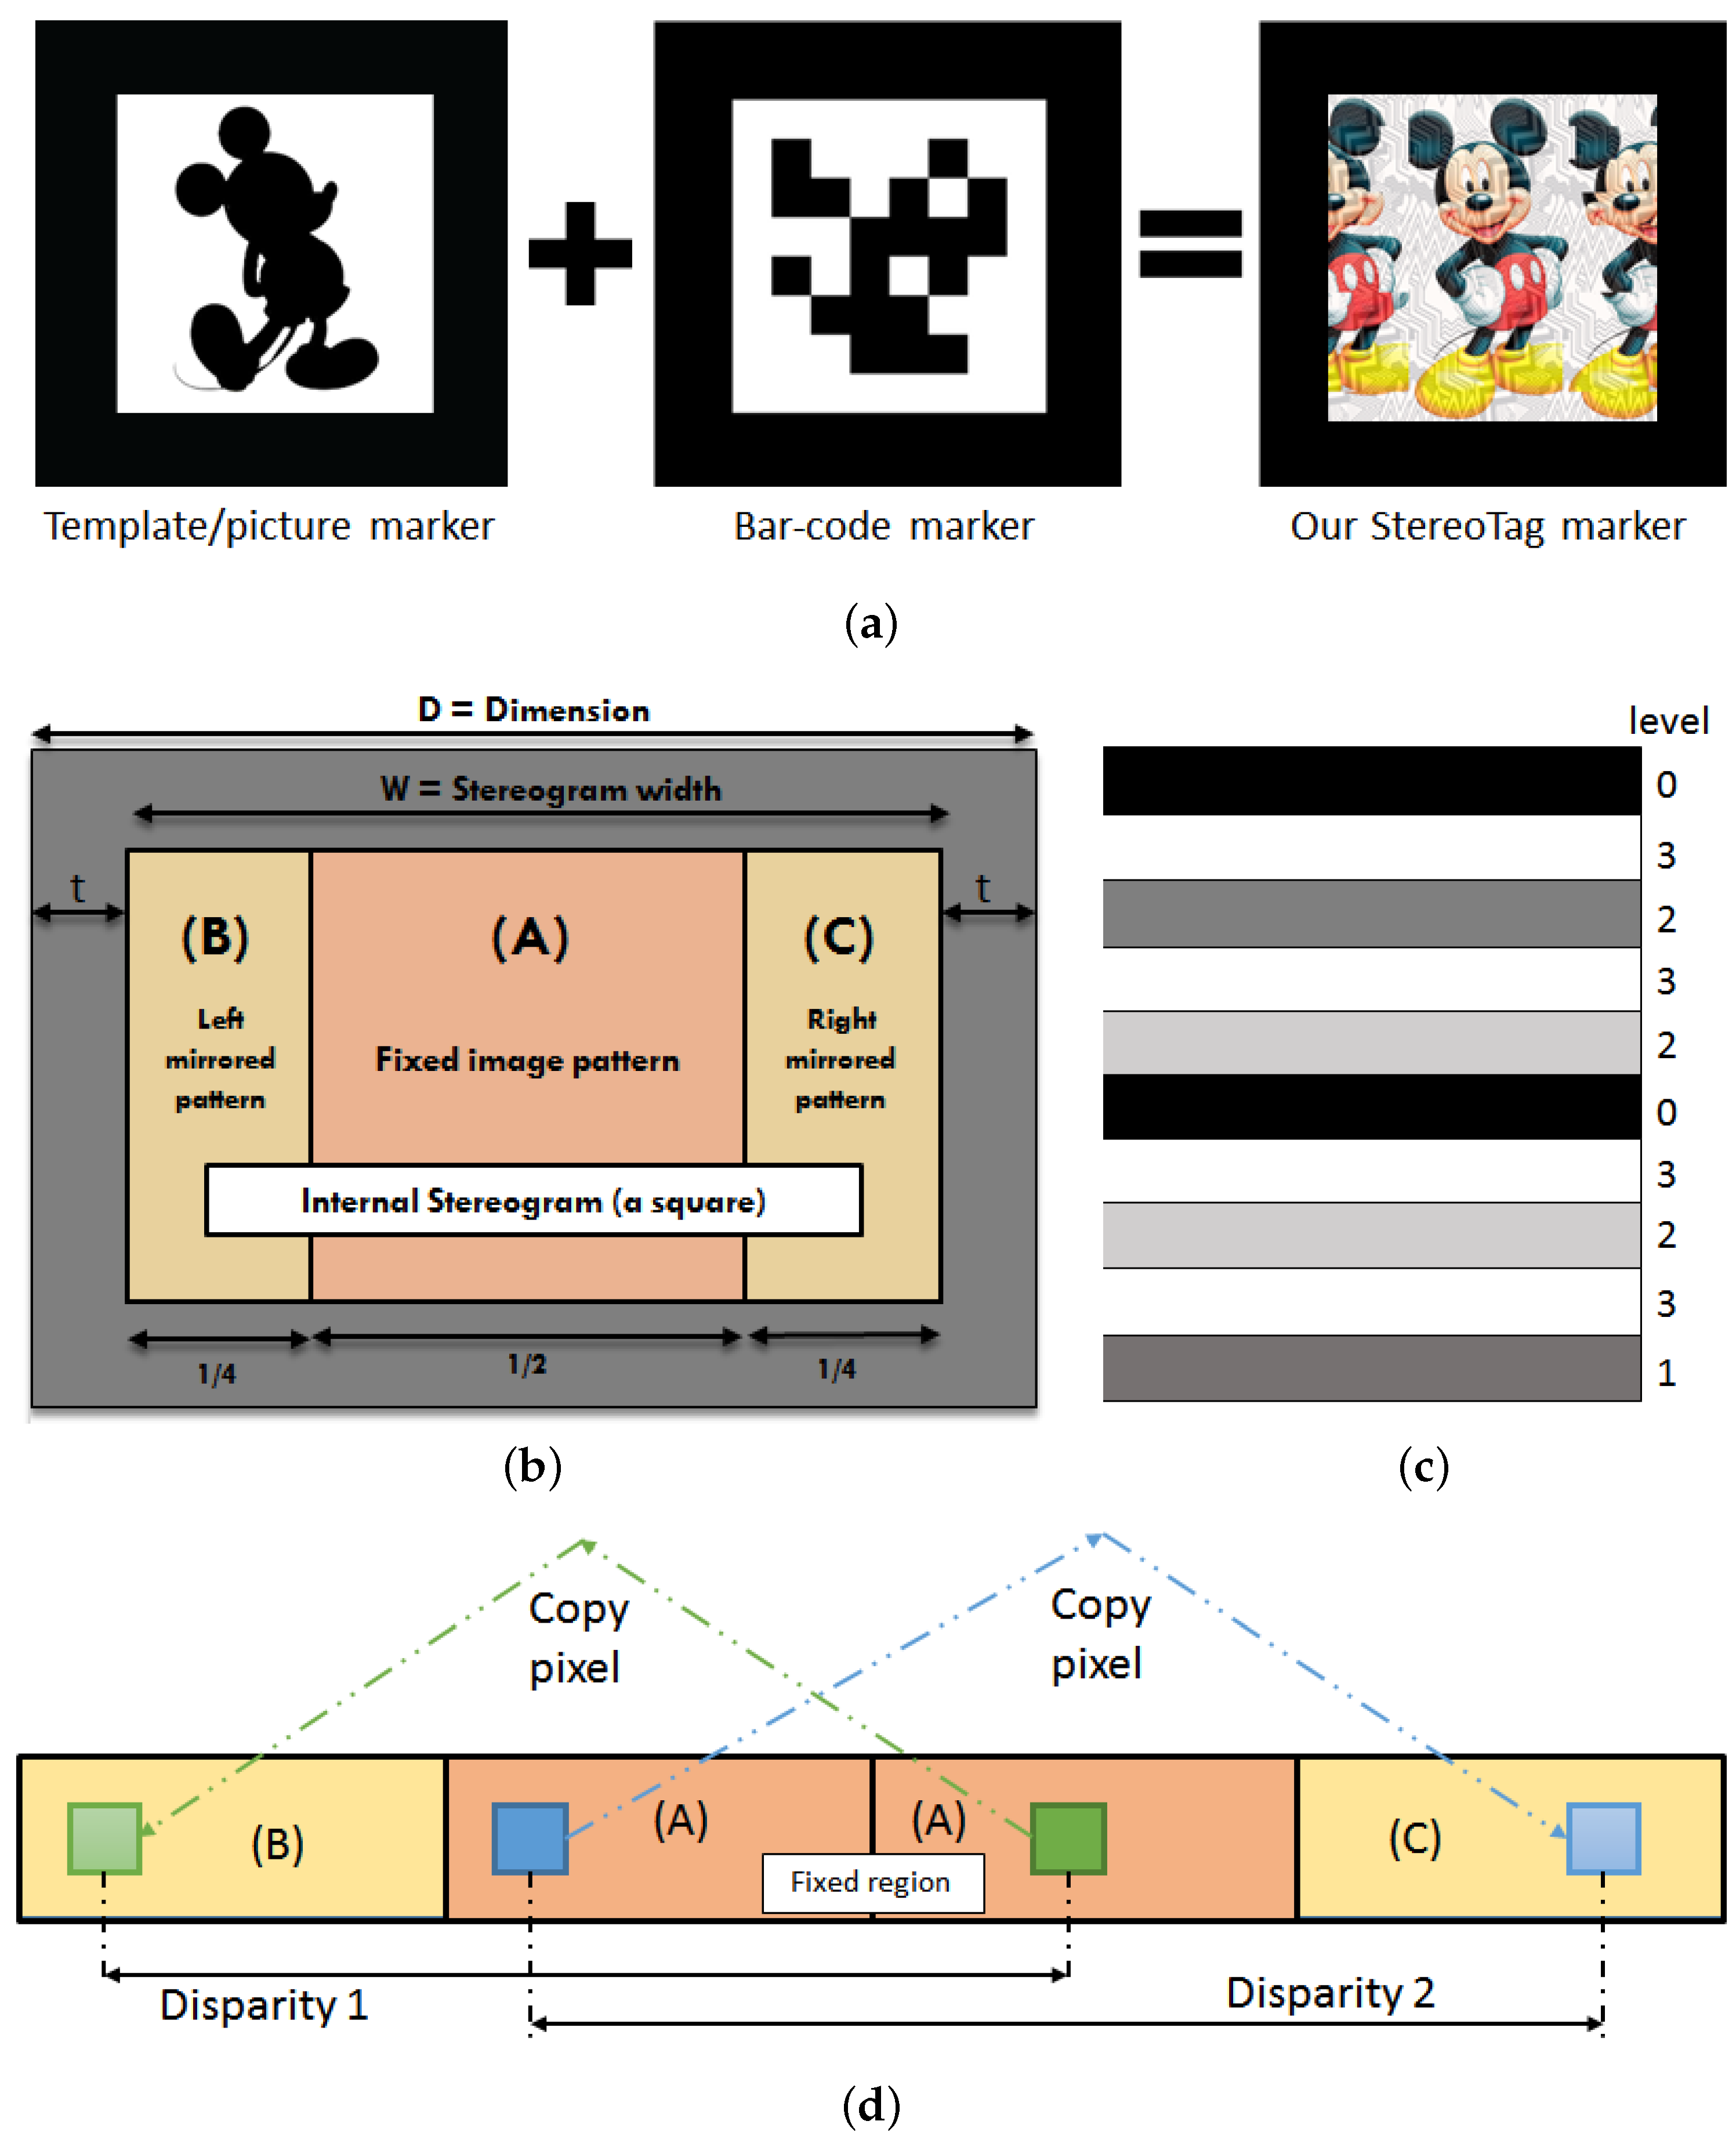
In this paper, we propose the use of stereogram to conceal a multi-level bar-code optically. The end product is the proposed PMBC tag; its initial design is demonstrated in Figure 6b, which its detail will be described further in this section. Our proposed tag presents some notable advantages over others:
- Large range of data: The multi-level bar-code can hold different numbers, with L being the number of levels in each bar, and N, the number of bars.
- Virtually Pictorial: The image inside each PMBC tag is made from meaningful illustrations rather than black bars, squares, or dots.
- Flexibility of Pattern: The decoded information is independent of image patterns; a broad range of images can be used to encode the same bar-code.
Each PMBC tag is a rectangle with a dimension measured in pixels or millimeters; border thickness t is relatively small (we set of D). The quadrilateral property of the rectangles can be used to detect their four straight lines and four corners; these are used for detecting the tag. The internal image is a stereogram (size ) made of three regions. The central area is a fixed image (region A that fills up ≥50% of the stereogram) and two repeated patterns on both sides of region A (region B and region C with ≤25% of the stereogram each).
Hidden inside each stereogram is a bar-code with many horizontal bars with the same thickness. Each bar is coated with different grey levels between black and white; these levels are used to represent different depth levels inside the stereogram. Figure 6c displays an example of 4-level binary bar-code with 10 horizontal bars. Each bar can hold four different levels: 0, 1, 2, 3; corresponding to black, dark grey, light grey, and white. Thus, this barcode can store as many as = 1,048,576 different numbers.
Figure 6d demonstrates basic steps of creating our proposed tag. As described, our PMBC Tag has a black border so that it is easily and reliably detectable under various circumstances. In theory, the internal stereogram of the PMBC tag can encode any 1D or 2D barcode such as Code11, Code 32, Code 49, Code 93, Code 128, EAN-8, EAN-13, VSCode, Aztec Code, Data Matrix, Maxi Code, PDF417, and Quick Response (QR) Code [36,37]. However, we opt to use a home-made Multi-level Barcode for taking the advantages of being able to store depth at each bar.
Multi-Level Bar-Code
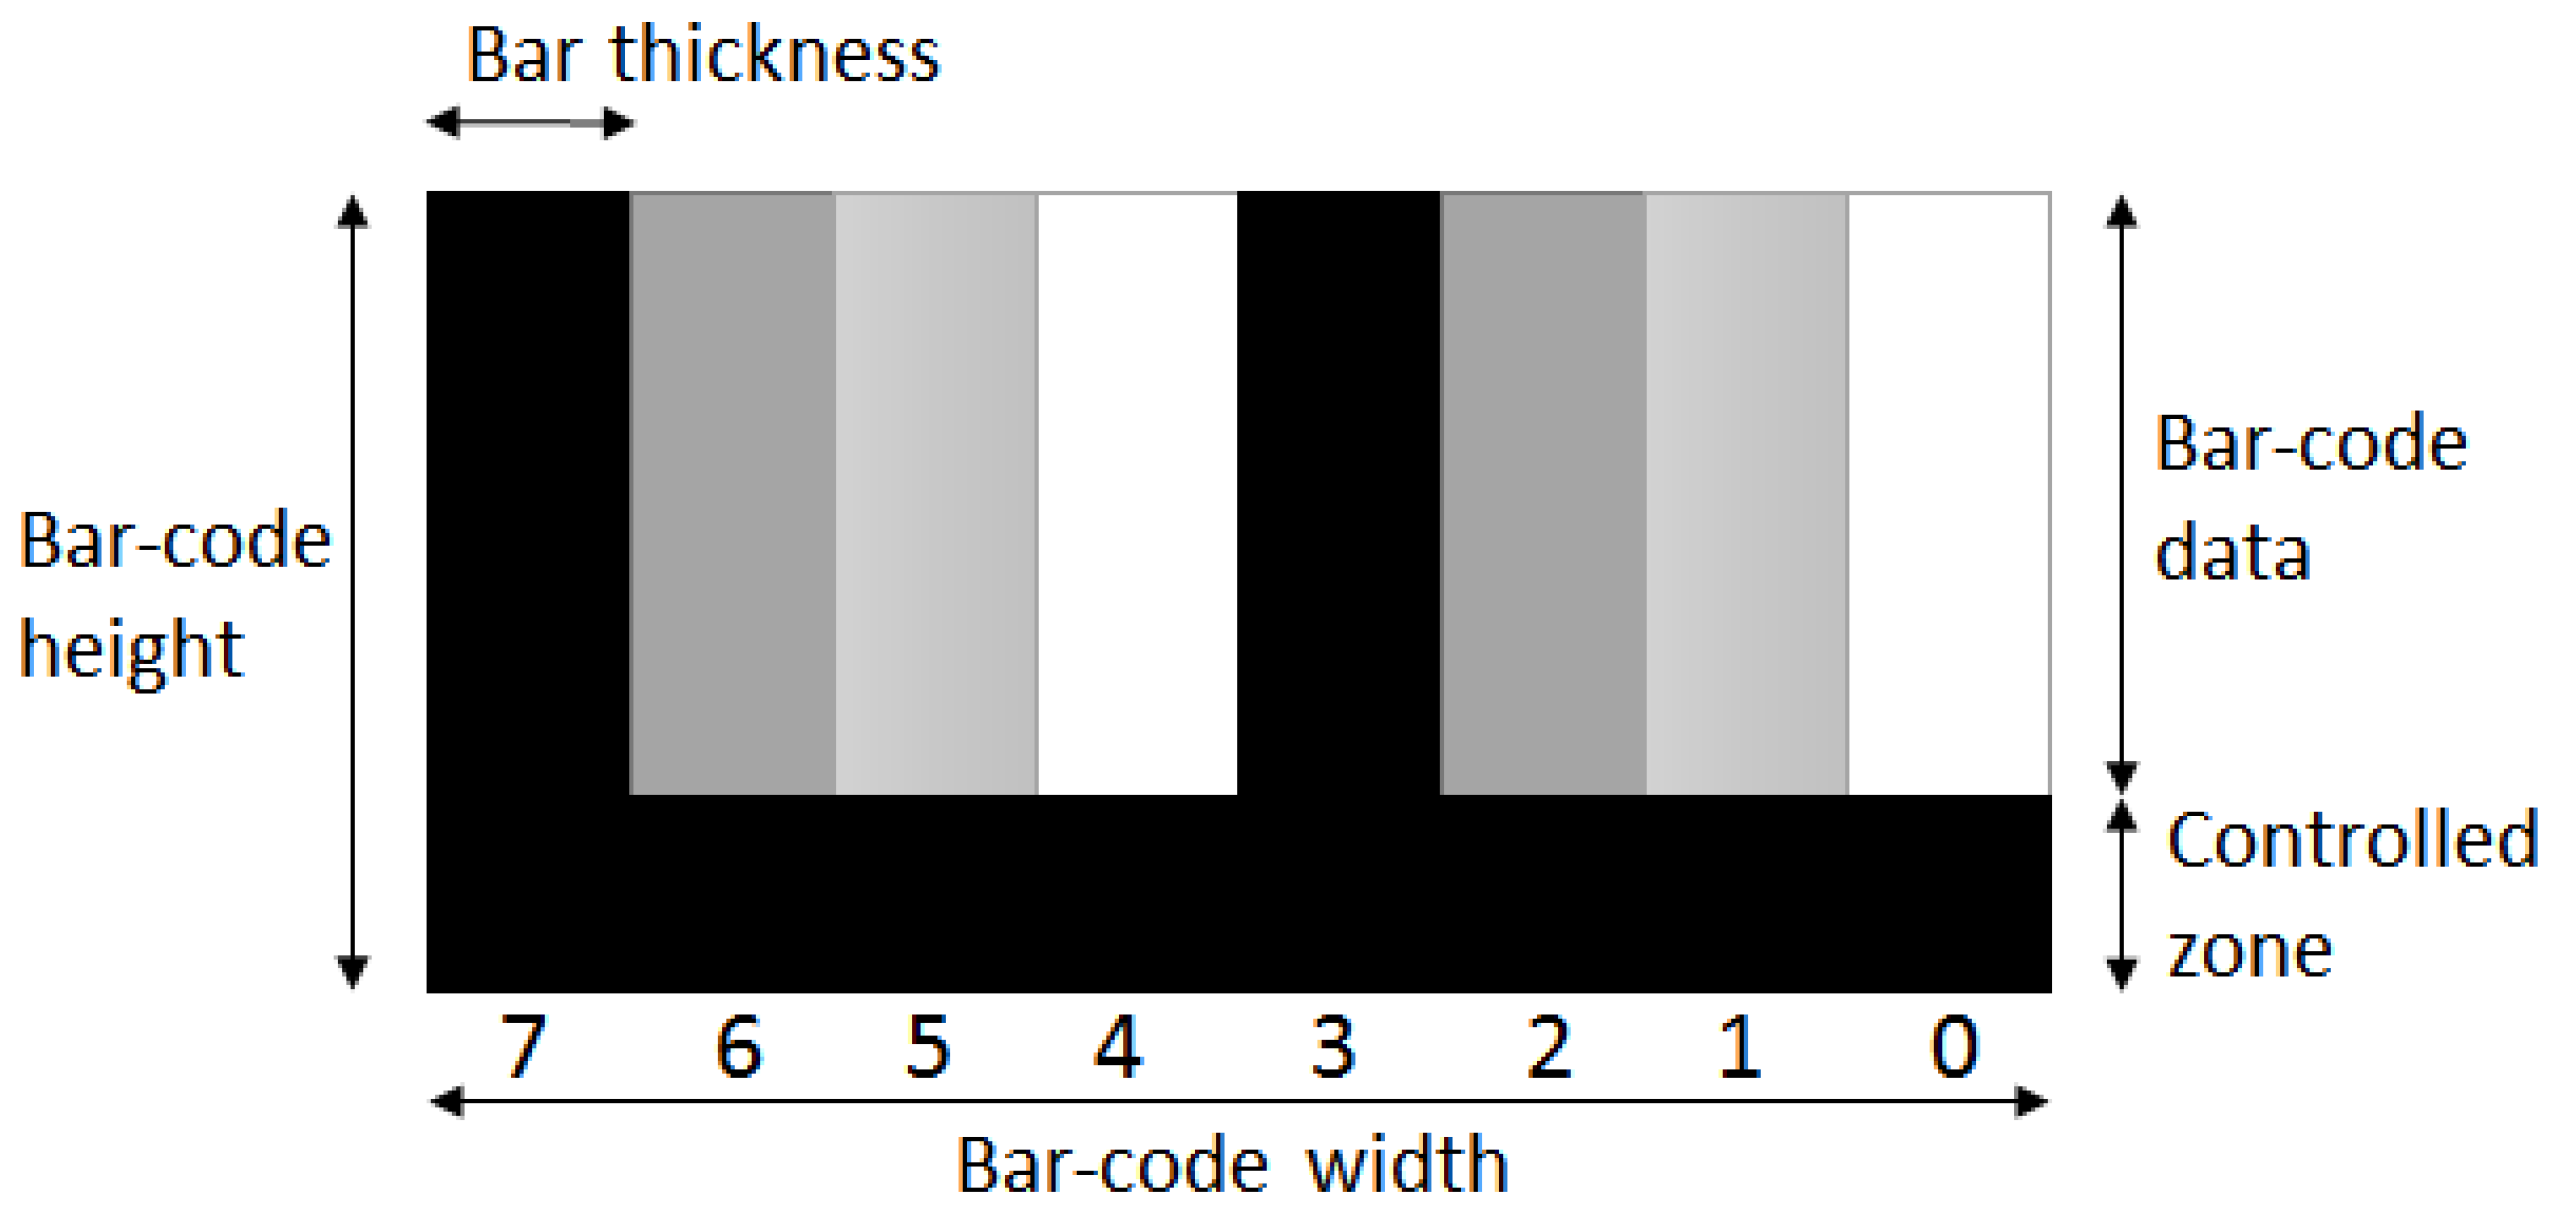
Its initial design is shown in Figure 7. This Multi-level Barcode has a dimension of . It may have many vertical bars; each has thickness T, the data held in each bar is one number, corresponding to depth levels (level 1, 2, 3, behind the surface). We represent it using grey levels (the darker, the lower depth, the brighter, the higher depth); thus, black represents lowest level depth and white represents the highest level depth.
The number A presented by this bar-code is:
where is depth level at ith bar, L is number of depth levels at each bar, and N is the number of bars.
The controlled zone is a horizontal bar at the bottom of the barcode; it is used to self-check the validity of the barcode and specifies the bar-code version. The controlled bar has the same thickness as a vertical bar, and always has the lowest depth level (black colour).
Currently, we define five different versions of this Multi-level Bar-code as shown in Table 2. The higher version has more vertical bars and more levels presenting in each bar, thus storing a larger range of numbers. For instance, version 0 can only represent numbers between 0 and 63 using six bars and two levels each. On the other hand, version 6 may store up to different numbers using 24 bars and 12 levels each.
2.2. Pre-Processing: Decoration of the Tag’s Central Image
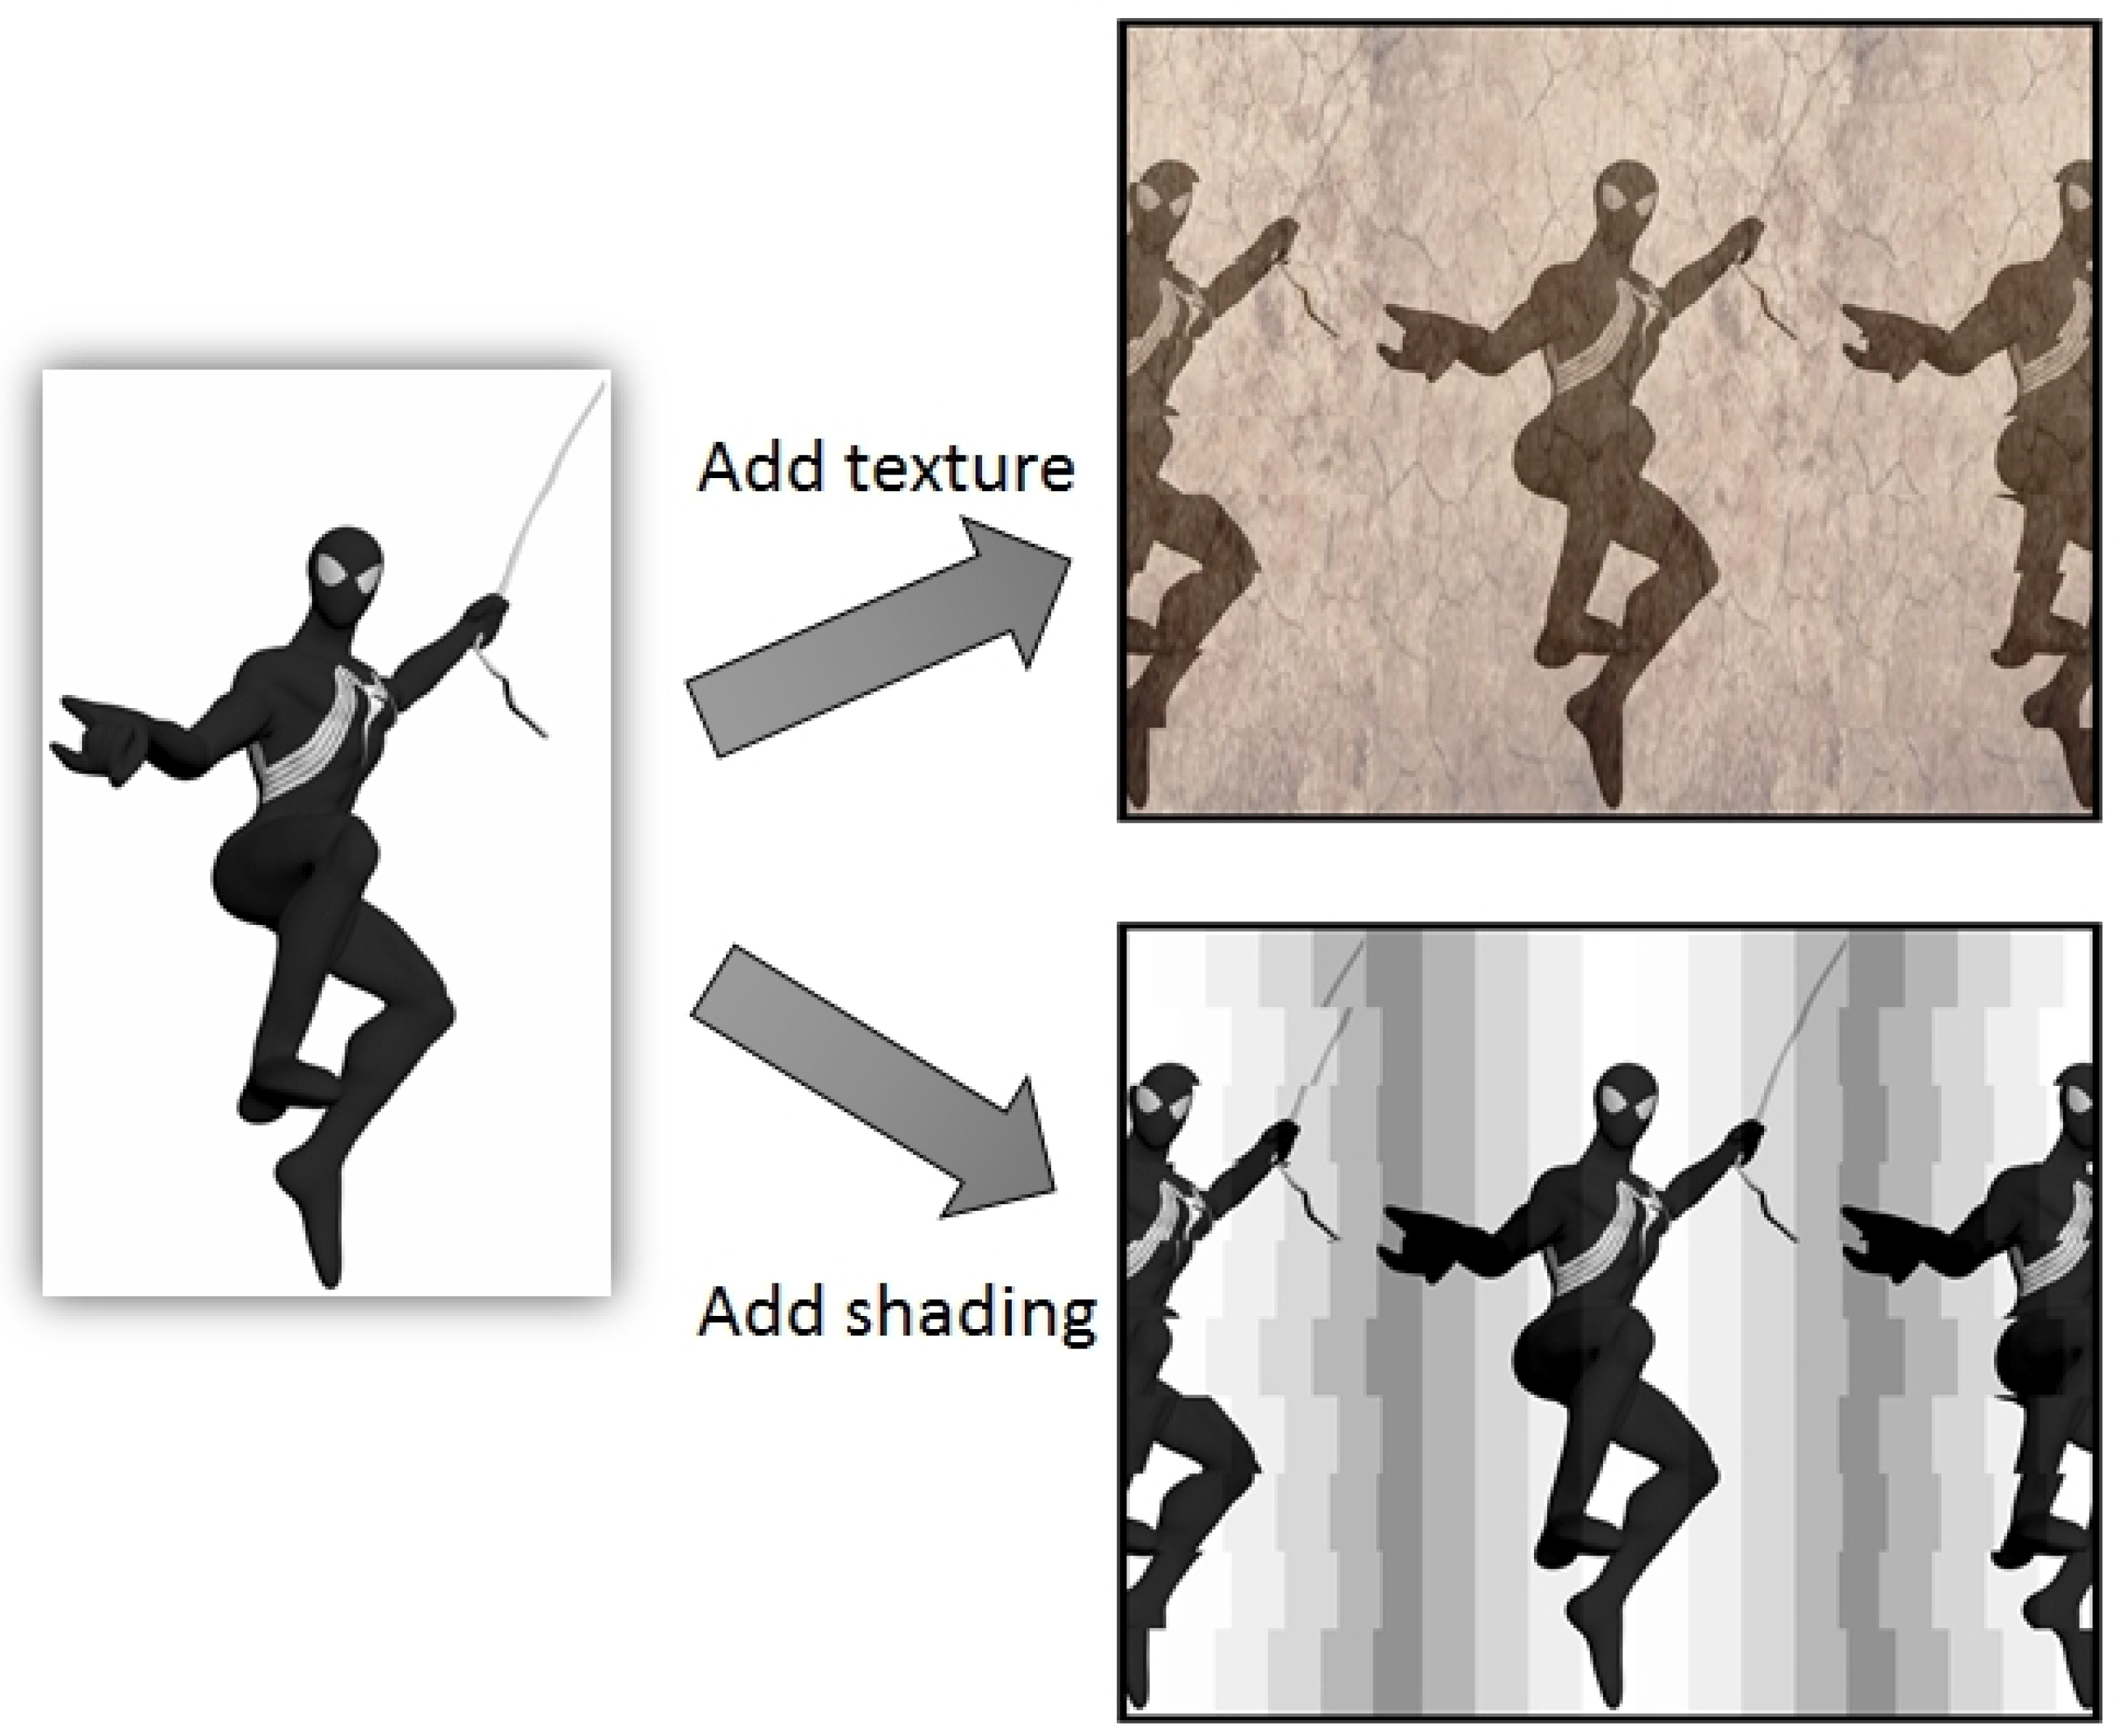
As discussed, we use the central image regions to build a side-by-side stereo image, so that is capable of storing 3D dense map. In general, feature points are needed to efficiently describe the 3D distance of points on the stereo pair. However, some of the chosen images might lack feature points (corners, distinct pixels), e.g., it contains a large blank background as seen in Figure 8-left. Some other images with many horizontally repeating patterns could also affect the 3D stereo reconstruction process.
To tackle the problem, we need to decorate the central image. There are two ways as seen in Figure 8-right: (1) combining the image with random colour texture, (2) adding vertical shading illumination to the picture. We prefer the second method as the colour of the central image is well-kept. However, from our experiments, both the methods work well on reducing the monotone background of the pictures.
2.3. Bar-Code as a Disparity Map
A disparity map is needed to create a stereogram; it holds disparity value of each pixel on the left stereo image compared to its corresponding pixel on the right stereo image [38]. Two pixels with the same colour act as virtual conjugate pixel projections in 3D and relate to one pixel in the disparity map; these two pixels are the correspondent points.
A multi-level bar-code is capable of storing thousands of unique numbers using some bars. To turn it into a disparity map, the bar-code block needs to rotate 90 degrees clockwise; it is then scaled and converted to a corresponding disparity map (a matrix where each element is a number ranging between 0 and ). The map is used to code to the distance, regarding how many pixels are between a pair of corresponding points in a stereogram.
We can encode 0-level pixels in the barcode block as a 0-level disparity point, and white coloured pixels is coded as -level disparity point (). A final disparity map can be presented as a grey-scaled image with intensity ranged between . N represents the shift of a point from its origin in the stereogram image at each depth level. By this, if a bar is at a depth level 3, a pixel of the image will be copied to a location that is pixels away to create the final stereogram.
2.4. Stereogram Construction
The internal image of PMBC tag has a dimension of . First, we select a illustration image to be placed at the center of the stereogram. Let is the ratio between the height of and ; pixels of is defined as:
Occasionally, image may contain large blank monotone regions like the walls and the tabletop and this could cause stereo correlation to fail. We opt to add artificial textures on to eliminate the blank regions if any. A texture image is chosen and the new image is:
where k is the transmission coefficient ().
The central 50% region of is kept intact (region A—Figure 6b) and will be used to repeat itself on the left and the right of the figure (regions B and C). In other words, pixels with identical/same colours to the left and right of a selected pattern are added with different horizontal shifts according to the disparity map . Detail can be found in the pseudo-code below:
| for h in range (0, H): |
| for w in range (0, H/4): |
| k = barcodeLevel [H/L] |
| stereogram [h,w + k] = pattern [h,H/2 + w] |
| stereogram [h,3*H/4 + w] = pattern [h,H/4 + w + k]. |
The final image is then decorated with a thick black border to generate our proposed tag. As stated, the value stored is independent to the look of our tags. Three examples of the PMBC tags are shown in Figure 9. All of them hide the same Multi-level Bar-code storing number 29,984.
3. System Design and Implementation
We propose a new method that implements the bar-code marker into the original image of an advertisement. The system applies the advantages of AR technology to enhance perception and usability of the audiences. Moreover, we also provide the audiences with the ability to retrieve pictorial markers for more meaningful information. The system architecture is divided into five main modules as shown in Figure 10; they are (1) Data Acquisition; (2) Preprocessing; (3) Hidden Code Tracking; (4) Information Rendering; and (5) Client User Interface.
3.1. Data Acquisition and Storage
The system data acquisition is divided into two tiers for internal database and input image stream data, which are captured by camera devices. The system internal database stores the hidden codes that are used for comparison with the decrypted code from the input marker. In this system, we use binary numbers (1 and 0) as stored comparable data to replace the original coloured image data. Because binary numbers are simple, they have a limitation on how many items can be stored based on the number of available bits. They absorb fewer spaces in the database and also require shorter processing time than the original data. Assuming that we have to process twenty 24-bit colours of advertisement posters with the average size of . According to Table 3, there will be Megabyte or Kilobyte spaces need to be reserved in the database. However, there are only 1-Kilobyte spaces that are more than a thousand times less than the needed amount in the case of using 8-bit binary numbers for the same quantity of items. Another advantage of using binary numbers is the dramatic improvement of processing performance when compared with the manual image registration technique. This is because the binary number indexing technique does not require the image comparison process. The image similarity issue is also minimised as each stored number is unique.
3.2. Pictorial Bar-Code Detection and Decryption
3.2.1. Detection
Firstly, we need to find closed contours on the pictorial bar-code. Some basic image processing steps are required; they are outlined below:
- Convert the input image from Red-Green-Blue (RGB) to greyscale
- Perform an adaptive binary thresholding method.
- Detect contours, if there are four vertices, it should be a quadrilateral.
- Apply Perspective Transform [39] to retrieve the internal image of the tag.
Once the border is detected, we can obtain the internal image for decryption.
3.2.2. Numerical Decryption
The internal stereogram image of the detected Pictorial Bar-code is used to rebuild the hidden multi-level bar-code. This step is equivalent to a stereo reconstruction process applied on two stereo images and ; is the left half of the stereogram and is the right half of the stereogram. The disparity levels (ranged between 0, ) are known from the width of the internal stereogram.
3.2.3. Stereo Reconstruction
Intensity-based stereo matching is a complex algorithm, and they can be categorised into at least three families below:
We use a technique that guides DPS using pre-computed BMS depth map, thus restricting and guiding the DPS search for optimal profile related to signals in 2D. Previously being evaluated in [45], both DPS and BMS are fast, but GCS is not; therefore, to achieve a good speed, we combine BMS and DPS for the guidance method: Stereo SGBM—the semi block matching algorithm. The profiles made from BMS are used as a guiding profile. In addition to its general dynamic programming calculation, quantitative guiding scores are added to DPS’s structure so that the method can follow these guiding profiles to establish a more accurate stereo matching. The algorithm uses Dynamic Programming described by Birchfield and Tomasi [41], in order to make the stereo matching more robust as the computation of disparities is casted as an energy minimization problem. BMS uses windows to match correspondences; its results are influenced by pixels in multiple scanlines. The cooperation of BMS and DPS should eliminate the effect of the horizontal strikes made by single scanline reconstruction of DPS. On the Middlebury Stereo Evaluation website [46], this SGBM algorithm obtains approx. 76% matching accuracy.
Figure 11 displays a disparity map results of some sample AR Tags. The disparity range d is set to be between −32 and +31 pixels (64 levels). We calculate the SAD value at each disparity d:
The disparity map is normalised to 0 and 255 and displays to users along with the left and right stereo images. Mainly, the brighter the pixel, the closer the 3D point is, and vice-versa. If dynamic programming fails to obtain a disparity value for a point, it returns a value of .
This barcode can be recognised using basic image processing methods, depth level of each bar is averaged, and a unique number can be calculated accordingly using the formula of Equation (1). As correspondence matching is a complex process, we test the system for its processing speed to see if the real-time speed is achievable. The system is implemented in Python 2.7 with OpenCV 3.0; it is running on an i5 CPU computer with a clock speed of 3.60 GHz, no parallelization and optimisation have been yet employed. The processing only takes less than 50% of the CPU power. The system segments the full image to obtain left and right stereo images with three different resolutions: 235,000, 353,000, and 525,000 pixels. Each pair of images is used to reconstruct 3D maps with disparity ranges: 32, 64, and 128 pixels. The results are shown in Table 4.
In the table, half of the results are at real-time speed (30+ frames per second), while the others are close to it. Only at 30+ fps speeds, the system could be beneficial for practical purposes. Thus, we should scale each half of the image to 353,000 pixels and use 32 pixels as the disparity range.
3.3. Preprocessing
The preprocessing module is also divided into two-tiers for preparing virtual information and process captured image frames, which were captured by camera devices. The system is necessary to convert the captured image to grey-scale format from RGB format for the requirement of hidden code tracking module. Equation (5) shows the relationship of gray-scale value and RGB color components. Grayscale conversion can be easily obtained by most available open source computer vision libraries such as OpenCV [39]:
After the detected code is checked and matched with a stored code in the database, the related virtual information will be prepared for rendering module. The virtual information could be a 3D model or video stream depending on the situation requirements.
3.4. Information Rendering
After pictorial bar-code and its hidden number are detected and determined, virtual information is prepared according to the secret code information. Then, the camera position related to the marker should be calculated to blend the virtual information into the real world environment. The orientation of a virtual object on the top of a fixed physical marker depends on the relationship between the camera coordinates and marker coordinates, which is shown in Figure 12a.
The relationship is also called pinhole camera model [7] or pose estimation in computer vision. There are three different coordinate systems presented in this situation; they are (1) camera coordinates, (2) camera screen coordinates, and (3) marker coordinates in the real world. A 3D object has only two kinds of motions on a static camera, which are translation and rotation. Translation motion occurred when camera is moved from its current location to a new location in 3D space. It has three degrees of freedom and represented by vector t, which can be calculated as in Equation (6). Other motion is rotation, which is absorbed when the camera is rotated about the X-, Y- and Z-axes. Camera rotation motion is often represented by using Euler angles [47] (roll, pitch and yaw), a matrix R or a direction of rotation and angle as shown in Equation (7):
To obtain the 3D pose estimation, we should have 2D coordinates of the object on the camera screen , 3D locations of the same 2D coordinates and intrinsic parameters of the camera or camera matrix. Let us assume that we want to present a 3D cube (Figure 12b) with 10 units long for each edge and our camera is viewing from the top of the cube. The cube has eight vertices that are eight different 3D points. Therefore, we should have four 2D point coordinates for the bottom of the cube and the other four 2D point coordinates for the top. The same principle applies for 3D coordinates with an extra z-value for each of those locations as shown in Table 5.
The camera matrix A can be easily calculated by Equation (8), where and are the focal lengths in the x and y directions; and (, ) is the optical center:
The pinhole camera model projects 3D points (3D coordinates of P) into the camera screen using a perspective transformation. Equation (9) shows the relationship between known variables such as the coordinates of the object on the camera display (): the camera matrix (A), coordinates of a 3D point in the world coordinate space () and unknown variables, which are translation and rotation (). We also assume that the scale factor (s) is 1.0 as the size of the object remains unchanged:
4. Experimental Results
Is our proposed PMBC tag sensitive to different lighting conditions, noises, and scaling? We have tested these criteria using some PMBC tags as shown in Figure 13. The tag also optically hides the same unique number 29,984. We have carried out three experiments to observe the ability to correctly decoded the unique number 29,984 after the following effects:
- alternating the brightness and contrast of the tag;
- scaling its original image;
- adding noises and raindrops.
IrfanView tool (http://www.irfanview.com/) was used to alternate the sizes, apply effects, and add noises to the samples before checking the decoded results. Some IrfanView’s output examples are shown in Figure 13.
4.1. Lighting Conditions (Brightness and Contrast)
Different brightness (from −200 to +200) and contrast (from −100 to +100) levels were applied on top of the “Superman” tag (Top rows of Figure 13). The numerical results achieved from the affected images were compared with the original number 29,984, and the correctness is recorded in Table 6. Overall, the reconstructed barcodes were scanned correctly in all tested brightness and contrast effects.
4.2. Different Scaling
We also rescaled the “Superman” tag to many different sizes: , , , , , . For each tag sample, we collected the decoded number again; results are shown in Table 7. The decryption only failed when the image size was reduced to pixels.
4.3. Noises and Raindrop Effects
We have applied some of the other IrfanView’s built-in effects: random noises and raindrops on the “Superman” tag (Figure 13). The correctness of decoded numbers at each test is collected and showed in Table 8. From the results, random noises in the image seem to create noises in the reconstructed disparity map. However, the decoded number stay correct at 29,984 for all the testing images. In fact, an image with maximised noise level: +255 (added in InfraView) is still correctly decoded. Raindrops also create effects on disparity maps; however, it is not strong enough to affect the correctness of the result.
The above three effects have been tested; overall, our PMBC tag is found to be relatively robust under various changes in brightness, contrast, noises, and raindrop effects. The only failure is detected when image sample is smaller than pixels. This can be improved by employing other image processing methods such as histogram equalisation, to identify different levels of depths more reliably.
4.4. Experiment Evaluation Using Computer Webcam
To further test the proposed method, we have carried out some real-life tests using available commodity webcam. The webcam we used has a relatively low resolution of pixels, and the detected tag was also quite small. The image tag was created storing a base four array: “0323203231”. Thus, in the built AR Tag, there were ten bars, and each contains four levels of depths. It was equivalent to 20 bits of binary numbers. In experiment one, shown in Figure 14, we pointed the webcam to acquire a live picture of the marker. At the same time, the rectangular tag was detected and segmented to reconstruct the raw disparity map, as shown on the right of the figure. To reduce the effects of noises, we read each bar and take the median intensity value (of the whole bar) as the decoded element to store in the decoded array. A cleaner multi-level barcode was then displayed on the top left of the screen (as shown). The decoded array was compared with the original array to find the percentage of correct detection and decryption. As displayed in the screenshot, 98% of the detected tag returned correct results (over 476 frames).
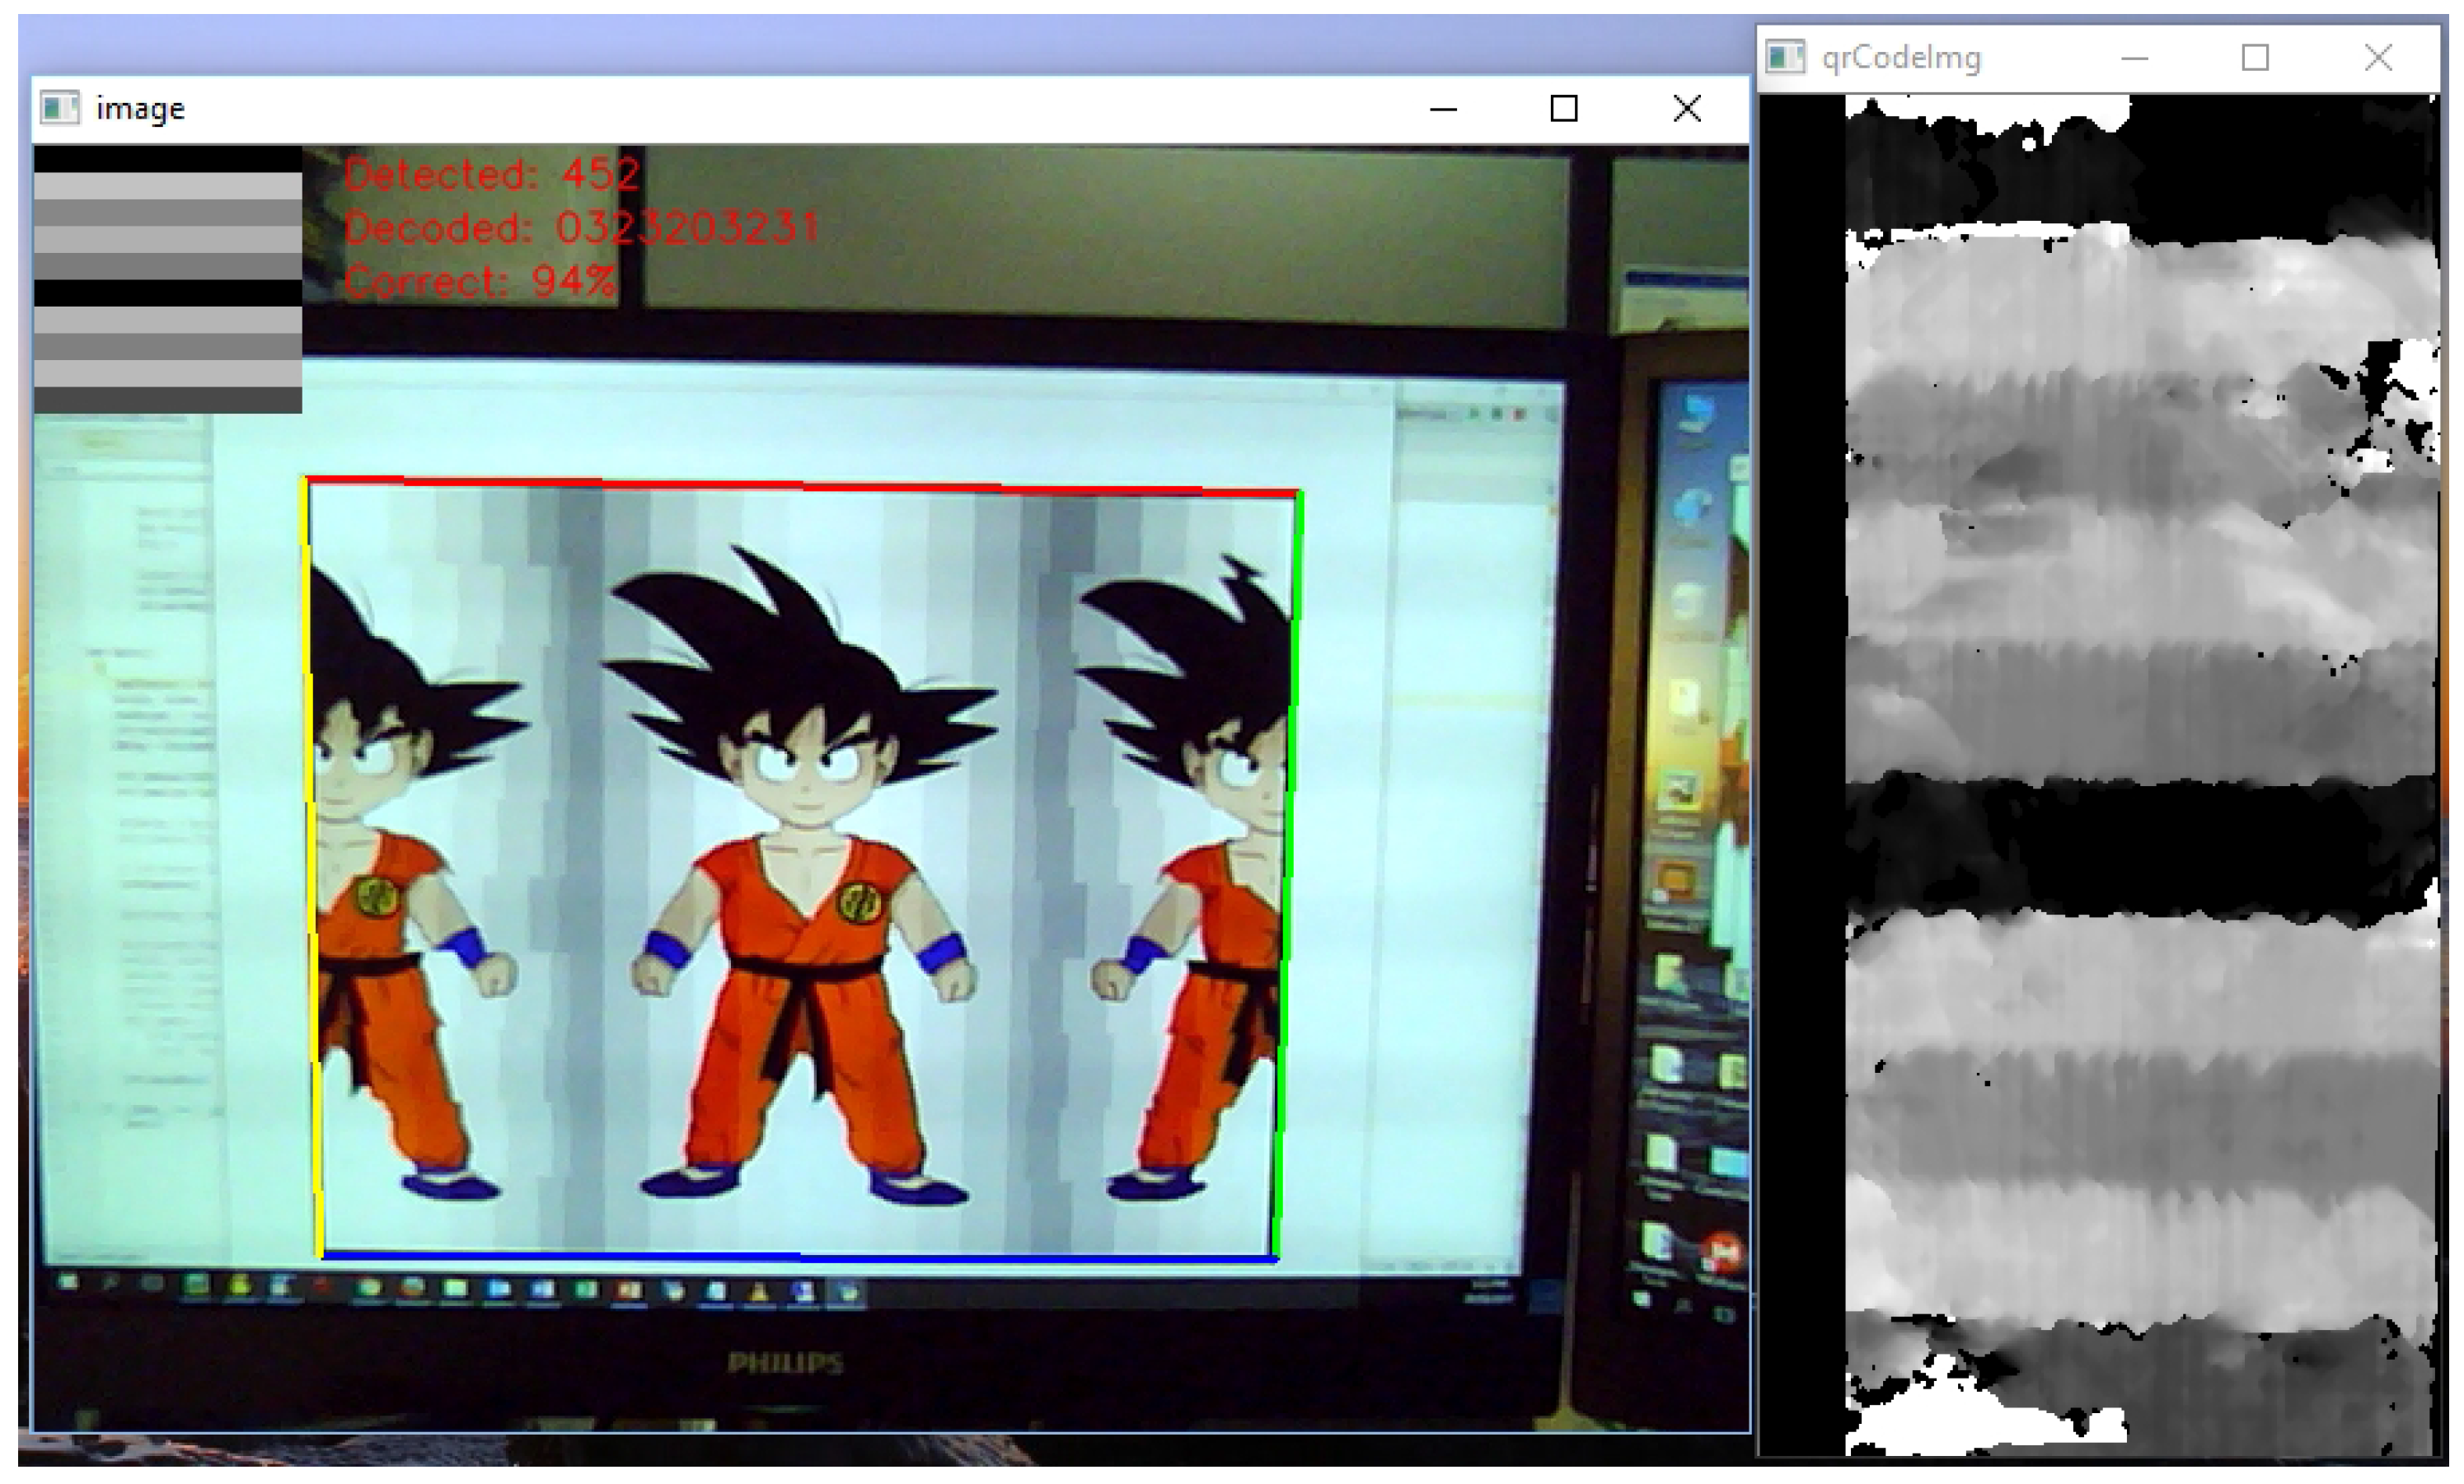
Similarly, we tested the system with another image holding the same array of “0323203231”. However, the encoding image contained a large blank white background (as shown in Figure 15). The correct detection rate was now slightly reduced, to 94%, over 452 frames of testing video stream.
In both cases, we have retrieved a relatively high success rate of detection and decryption. On those that return incorrect results, only one or two elements of the ten are different. Therefore, a self-correction mechanism can be applied to the stored array, in order to increase the chance of the correct decryption data, which is the plan for our future work.
5. Limitation and Future Work of Embedding QR Codes
While our evaluation shows a promising result for Pictorial Marker with Hidden 3D Bar-code (PMBC), there are still some limitations that deem this marker not fully ready for the market. Firstly, we were unable to perform the test on different camera models. The current camera has a resolution of 1920 × 1080, which is considered a high standard for the camera models being used around the world. Secondly, the time constraints and limited budget prevented a usability test from being set up. Even though we managed to receive positive feedback from around five persons (all of them are our colleagues), stating that this marker had a better appearance than the traditional ones; it is still uncertain if PMBC can provide a more attractive AR marker for the general public. Shortly, we will try to fine-tune the marker algorithm as well as address any possible issues. Bigger evaluations with more test devices and users will also be performed to ensure that PMBC is suitable for the mass public.
Furthermore, some may argue that our AR Tag is only capable of encoding a small amount of information (similar to 1D bar-code styles). However, our method of embedding binary data can be extended to hold 2D bar-codes such as VSCode, Aztec Code, Data Matrix, Maxi Code, PDF417, Visual Code, ShotCode, and QR Code [37]. Much more information can be encoded with almost no extra cost. In this research, we opt to use QR code, as it is one of the most popularly used today.
The embedding of a QR code in this AR Tag is similar to the method described above previously—except, half of the black dots of the QR code are mirrored on the left edge of the coloured picture, and the other half is on the right. Two example results are shown in Figure 16. The QR code stores the URL of the AUT website http://aut.ac.nz, which was then optically presented in two different AR Tag images: AUT campus study space (top) and an image of the Hobbiton village (bottom).
To extract back the QR code, we simply cut the image in half and subtract one from another to get : . Ater that, an adaptive threshold process on is applied to retrieve the binary raw QR code image.
At this stage, a threshold is chosen at 20; thus, any pixel in is black if its intensity is less than 20 in value. The resulting QR code is shown in Figure 17-left. This image is relatively noisy, presented with many thin black lines and it may not be reliably readable by many bar-code scanners.
Fortunately, such thin lines can easily be cleared using simple image morphology [48]. We start with N times dilation to clear away the unreliable thin lines:
Then, it follows by another N times erosion to retrieve back the reliable black pixels of the QR codes:
with is a morphology kernel.
The final extracted result of QR code after image morphology is shown in Figure 17-right. Most of the unreliable think lines are erased. It is clearly readable by the Bakodo Scanner Phone App (http://bako.do), one of the available bar-code scanning software programs.
6. Conclusions
We propose a new way that combines the bar-code marker into the original picture of the advertisements. The method employs our proposed Pictorial Marker with a Hidden 3D Bar-code (PMBC) and current AR technology to enhance perception and usability of the viewers. PMBC is an AR tag that is capable of hiding multi-level optically (3D) bar-codes. It is a single image stereogram concealing a depth-coded bar-code while maintaining a complete colour picture of what it is presenting. Most of today’s similar applications are using either pictorial markers or barcode markers; each has its own disadvantages. Firstly, pictorial markers have meaningful appearances, but they are computationally expensive and indecisively identified by computers. Secondly, bar-code markers contain decodable numeric data, but they look uninteresting and uninformative. Our method not only keeps the original information of the advertisement but also encodes a broad range of numeric data. Moreover, a PMBC tag is relatively robust under various conditions; thus, it could be a promising approach to be used in future AR applications.
Acknowledgments
Firstly, we would like also thank to the AUT staffs and technicians who have provided such a wonderful IT services among various softwares which are used by us of completing this research paper. Especially to AUT’s School of Computing and Mathematical Sciences for also providing us amazing espresso facility such as: free coffee, sugar and milk. Secondly, to other colleges who gave us ideas, proof-read our work and offered us help whenever we need.
Author Contributions
Huy Le and Minh Nguyen provided the concept and design for these frameworks. Minh Nguyen created the back-end; Huy Le implemented the experimental application for the front-end; Huy Tran helped design some of the back-end architecture. Wai Yeap helped with language edition and correction. All authors contributed to the paper writing and reviews.
Conflicts of Interest
The authors declare no conflict of interest.
References
- Azuma, R.T. A survey of augmented reality. Presence Teleoper. Virtual Environ. 1997, 6, 355–385. [Google Scholar] [CrossRef]
- Livingston, M.A.; Rosenblum, L.J.; Brown, D.G.; Schmidt, G.S.; Julier, S.J.; Baillot, Y.; Swan, J.E., II; Ai, Z.; Maassel, P. Military applications of augmented reality. In Handbook of Augmented Reality; Springer: Berlin, Germany, 2011; pp. 671–706. [Google Scholar]
- Dahne, P.; Karigiannis, J.N. Archeoguide: System architecture of a mobile outdoor augmented reality system. In Proceedings of the International Symposium on Mixed and Augmented Reality (ISMAR 2002), Darmstadt, Germany, 1 October 2002; pp. 263–264. [Google Scholar]
- Bernardes, J.; Tori, R.; Nakamura, R.; Calife, D.; Tomoyose, A. Augmented reality games. Ext. Exp. Struct. Anal. Des. Comput. Game Play. Exp. 2008, 1, 228–246. [Google Scholar]
- Lepetit, V.; Lagger, P.; Fua, P. Randomized trees for real-time keypoint recognition. In Proceedings of the IEEE Computer Society Conference on Computer Vision and Pattern Recognition (CVPR 2005), San Diego, CA, USA, 20–25 June 2005; Volume 2, pp. 775–781. [Google Scholar]
- Lepetit, V.; Fua, P. Keypoint recognition using randomized trees. IEEE Trans. Pattern Anal. Mach. Intell. 2006, 28, 1465–1479. [Google Scholar] [CrossRef] [PubMed]
- Sturm, P. Pinhole camera model. In Computer Vision; Springer: Berlin, Germany, 2014; pp. 610–613. [Google Scholar]
- Siltanen, S. Theory and Applications of Marker-Based Augmented Reality; VTT: Espoo, Finland, 2012. [Google Scholar]
- Rekimoto, J.; Ayatsuka, Y. CyberCode: Designing augmented reality environments with visual tags. In Proceedings of the DARE 2000 on Designing Augmented Reality Environments, Elsinore, Denmark, 12–14 April 2000; pp. 1–10. [Google Scholar]
- Kan, T.W.; Teng, C.H.; Chou, W.S. Applying QR code in augmented reality applications. In Proceedings of the 8th International Conference on Virtual Reality Continuum and Its Applications in Industry, Tokyo, Japan, 14–15 December 2009; pp. 253–257. [Google Scholar]
- Liu, T.Y.; Tan, T.H.; Chu, Y.L. QR code and augmented reality-supported mobile English learning system. In Mobile Multimedia Processing; Springer: Berlin, Germany, 2010; pp. 37–52. [Google Scholar]
- Bergamasco, F.; Albarelli, A.; Cosmo, L.; Rodola, E.; Torsello, A. An Accurate and Robust Artificial Marker based on Cyclic Codes. IEEE Trans. Pattern Anal. Mach. Intell. 2016, 38, 2359–2373. [Google Scholar] [CrossRef] [PubMed]
- Bergamasco, F.; Albarelli, A.; Torsello, A. Pi-Tag: A fast image-space marker design based on projective invariants. Mach. Vis. Appl. 2013, 24, 1295–1310. [Google Scholar] [CrossRef] [Green Version]
- Tikanmäki, A.; Röning, J. Markers—Toward general purpose information representation. In Proceedings of the IROS2011 Workshop: Knowledge Representation for Autonomous Robots, San Fransisco, CA, USA, 25 September 2011. [Google Scholar]
- Mohan, A.; Woo, G.; Hiura, S.; Smithwick, Q.; Raskar, R. Bokode: Imperceptible visual tags for camera based interaction from a distance. In ACM Transactions on Graphics (TOG); ACM: New York, NY, USA, 2009; Volume 28, p. 98. [Google Scholar]
- Olson, E. AprilTag: A robust and flexible visual fiducial system. In Proceedings of the 2011 IEEE International Conference on Robotics and Automation (ICRA), Shanghai, China, 9–13 May 2011; pp. 3400–3407. [Google Scholar]
- Lindeberg, T. Feature detection with automatic scale selection. Int. J. Comput. Vis. 1998, 30, 79–116. [Google Scholar] [CrossRef]
- Soon, T.J. QR code. Synth. J. 2008, 2008, 59–78. [Google Scholar]
- Feiner, S.K. Augmented reality: A new way of seeing. Sci. Am. 2002, 286, 48–55. [Google Scholar] [CrossRef] [PubMed]
- Aase, L. AED4EU and the Power of Twitter. Available online: https://social-media-university-global.org/2009/10/aed4eu-and-the-power-of-twitter/ (accessed on 28 October 2009).
- State, A.; Chen, D.T.; Tector, C.; Brandt, A.; Chen, H.; Ohbuchi, R.; Bajura, M.; Fuchs, H. Observing a volume rendered fetus within a pregnant patient. In Proceedings of the IEEE Conference on Visualization (Visualization’94), Washington, DC, USA, 21 October 1994; pp. 364–368. [Google Scholar]
- Fuchs, H.; Livingston, M.A.; Raskar, R.; Keller, K.; Crawford, J.R.; Rademacher, P.; Drake, S.H.; Meyer, A.A. Augmented reality visualization for laparoscopic surgery. In International Conference on Medical Image Computing and Computer-Assisted Intervention; Springer: Berlin/Heidelberg, Germany, 1998; pp. 934–943. [Google Scholar]
- Bichlmeier, C.; Wimmer, F.; Heining, S.M.; Navab, N. Contextual anatomic mimesis hybrid in-situ visualization method for improving multi-sensory depth perception in medical augmented reality. In Proceedings of the 6th IEEE and ACM International Symposium on Mixed and Augmented Reality (ISMAR 2007), Nara, Japan, 13–16 November 2007; pp. 129–138. [Google Scholar]
- Thomas, B.; Close, B.; Donoghue, J.; Squires, J.; De Bondi, P.; Morris, M.; Piekarski, W. ARQuake: An outdoor/indoor augmented reality first person application. In Proceedings of the Fourth International Symposium on Wearable Computers, Atlanta, GA, USA, 16–17 October 2000; pp. 139–146. [Google Scholar]
- Serino, M.; Cordrey, K.; McLaughlin, L.; Milanaik, R.L. Pokémon Go and augmented virtual reality games: A cautionary commentary for parents and pediatricians. Curr. Opin. Pediatrics 2016, 28, 673–677. [Google Scholar] [CrossRef] [PubMed]
- Billinghurst, M.; Kato, H.; Poupyrev, I. The magicbook-moving seamlessly between reality and virtuality. IEEE Comput. Graph. Appl. 2001, 21, 6–8. [Google Scholar]
- Hamming, R.W. Error detecting and error correcting codes. Bell Labs Tech. J. 1950, 29, 147–160. [Google Scholar] [CrossRef]
- Reed, I.S.; Solomon, G. Polynomial codes over certain finite fields. J. Soc. Ind. Appl. Math. 1960, 8, 300–304. [Google Scholar] [CrossRef]
- Fiala, M. ARTag, a fiducial marker system using digital techniques. In Proceedings of the 2005 IEEE Computer Society Conference on Computer Vision and Pattern Recognition (CVPR’05), San Diego, CA, USA, 20–25 June 2005; Volume 2, pp. 590–596. [Google Scholar]
- Yamamoto, S.; Tanaka, H.; Ando, S.; Katayama, A.; Tsutsuguchi, K. Visual syncar: Augmented reality which synchronizes video and overlaid information. J. Inst. Image Electron. Eng. Jpn. 2014, 43, 397–403. [Google Scholar]
- Álvarez, H.; Leizea, I.; Borro, D. A new marker design for a robust marker tracking system against occlusions. Comput. Animat. Virtual Worlds 2012, 23, 503–518. [Google Scholar] [CrossRef]
- Shatte, A.; Holdsworth, J.; Lee, I. Mobile augmented reality based context-aware library management system. Expert Syst. Appl. 2014, 41, 2174–2185. [Google Scholar] [CrossRef]
- Nguyen, M.; Yeap, A. StereoTag: A novel stereogram-marker-based approach for Augmented Reality. In Proceedings of the 2016 23rd International Conference on Pattern Recognition (ICPR), Cancun, Mexico, 4–8 December 2012; pp. 1059–1064. [Google Scholar]
- Nguyen, M.; Yeap, W.; Hooper, S. Design of a new trading card for table-top augmented reality game environment. In Proceedings of the 2016 International Conference on Image and Vision Computing New Zealand (IVCNZ), Palmerston North, New Zealand, 21–22 November 2016; pp. 1–6. [Google Scholar]
- Le, H.; Nguyen, M. Enhancing Textbook Study Experiences with Pictorial Bar-Codes and Augmented Reality. In International Conference on Computer Analysis of Images and Patterns; Springer: Berlin/Heidelberg, Germany, 2017; pp. 139–150. [Google Scholar]
- Palmer, R.C.; Eng, P. The Bar Code Book: A Comprehensive Guide to Reading, Printing, Specifying, Evaluating and Using Bar Code and Other Machine-Readable Symbols; Trafford Pub.: Bloomington, IN, USA, 2007. [Google Scholar]
- Kato, H.; Tan, K.T. Pervasive 2D barcodes for camera phone applications. IEEE Pervasive Comput. 2007, 6, 76–85. [Google Scholar] [CrossRef]
- Szeliski, R. Computer Vision: Algorithms and Applications; Springer: Berlin/Heidelberg, Germany, 2010. [Google Scholar]
- Bradski, G.; Kaehler, A. Computer Vision with the OpenCV Library; O’Reilly Media, Inc.: Sebastopol, CA, USA, 2008. [Google Scholar]
- Konolige, K. Small vision systems: Hardware and implementation. In Robotics Research; Springer: London, UK, 1997; Volume 8, pp. 203–212. [Google Scholar]
- Birchfield, S.; Tomasi, C. Depth discontinuities by pixel-to-pixel stereo. Int. J. Comput. Vis. 1999, 35, 269–293. [Google Scholar] [CrossRef]
- Gimel’farb, G. Stereo terrain reconstruction by dynamic programming. Handb. Comput. Vis. Appl. Signal Process. Pattern Recognit. 1999, 2, 505–530. [Google Scholar]
- Gong, R. Belief Propagation Based Stereo Matching with Due Account of Visibility Conditions. Master’s Thesis, Computer Science Department, The University of Auckland, Auckland, New Zealand, 2001. [Google Scholar]
- Kolmogorov, V.; Zabih, R. Multi-camera Scene Reconstruction via Graph Cuts. In European Conference on Computer Vision; Springer: Berlin/Heidelberg, Germany, 2002; Volume 2352, pp. 82–96. [Google Scholar]
- Nguyen, M.; Chan, Y.H.; Delmas, P.; Gimel’farb, G. Symmetric dynamic programming stereo using block matching guidance. In Proceedings of the 2013 28th International Conference on Image and Vision Computing New Zealand (IVCNZ 2013), Wellington, New Zealand, 27–29 November 2013; pp. 88–93. [Google Scholar]
- Scharstein, D.; Szeliski, R. A taxonomy and evaluation of dense two-frame stereo correspondence algorithms. Int. J. Comput. Vis. 2002, 47, 7–42. [Google Scholar] [CrossRef]
- Diebel, J. Representing attitude: Euler angles, unit quaternions, and rotation vectors. Matrix 2006, 58, 1–35. [Google Scholar]
- Soille, P. Morphological Image Analysis: Principles and Applications; Springer: New York, NY, USA, 2013. [Google Scholar]
Figure 1.
Augmented Reality (AR) scenario example for tourism: Eiffel Tower AR.

Figure 2.
State-of-the-art AR markers.
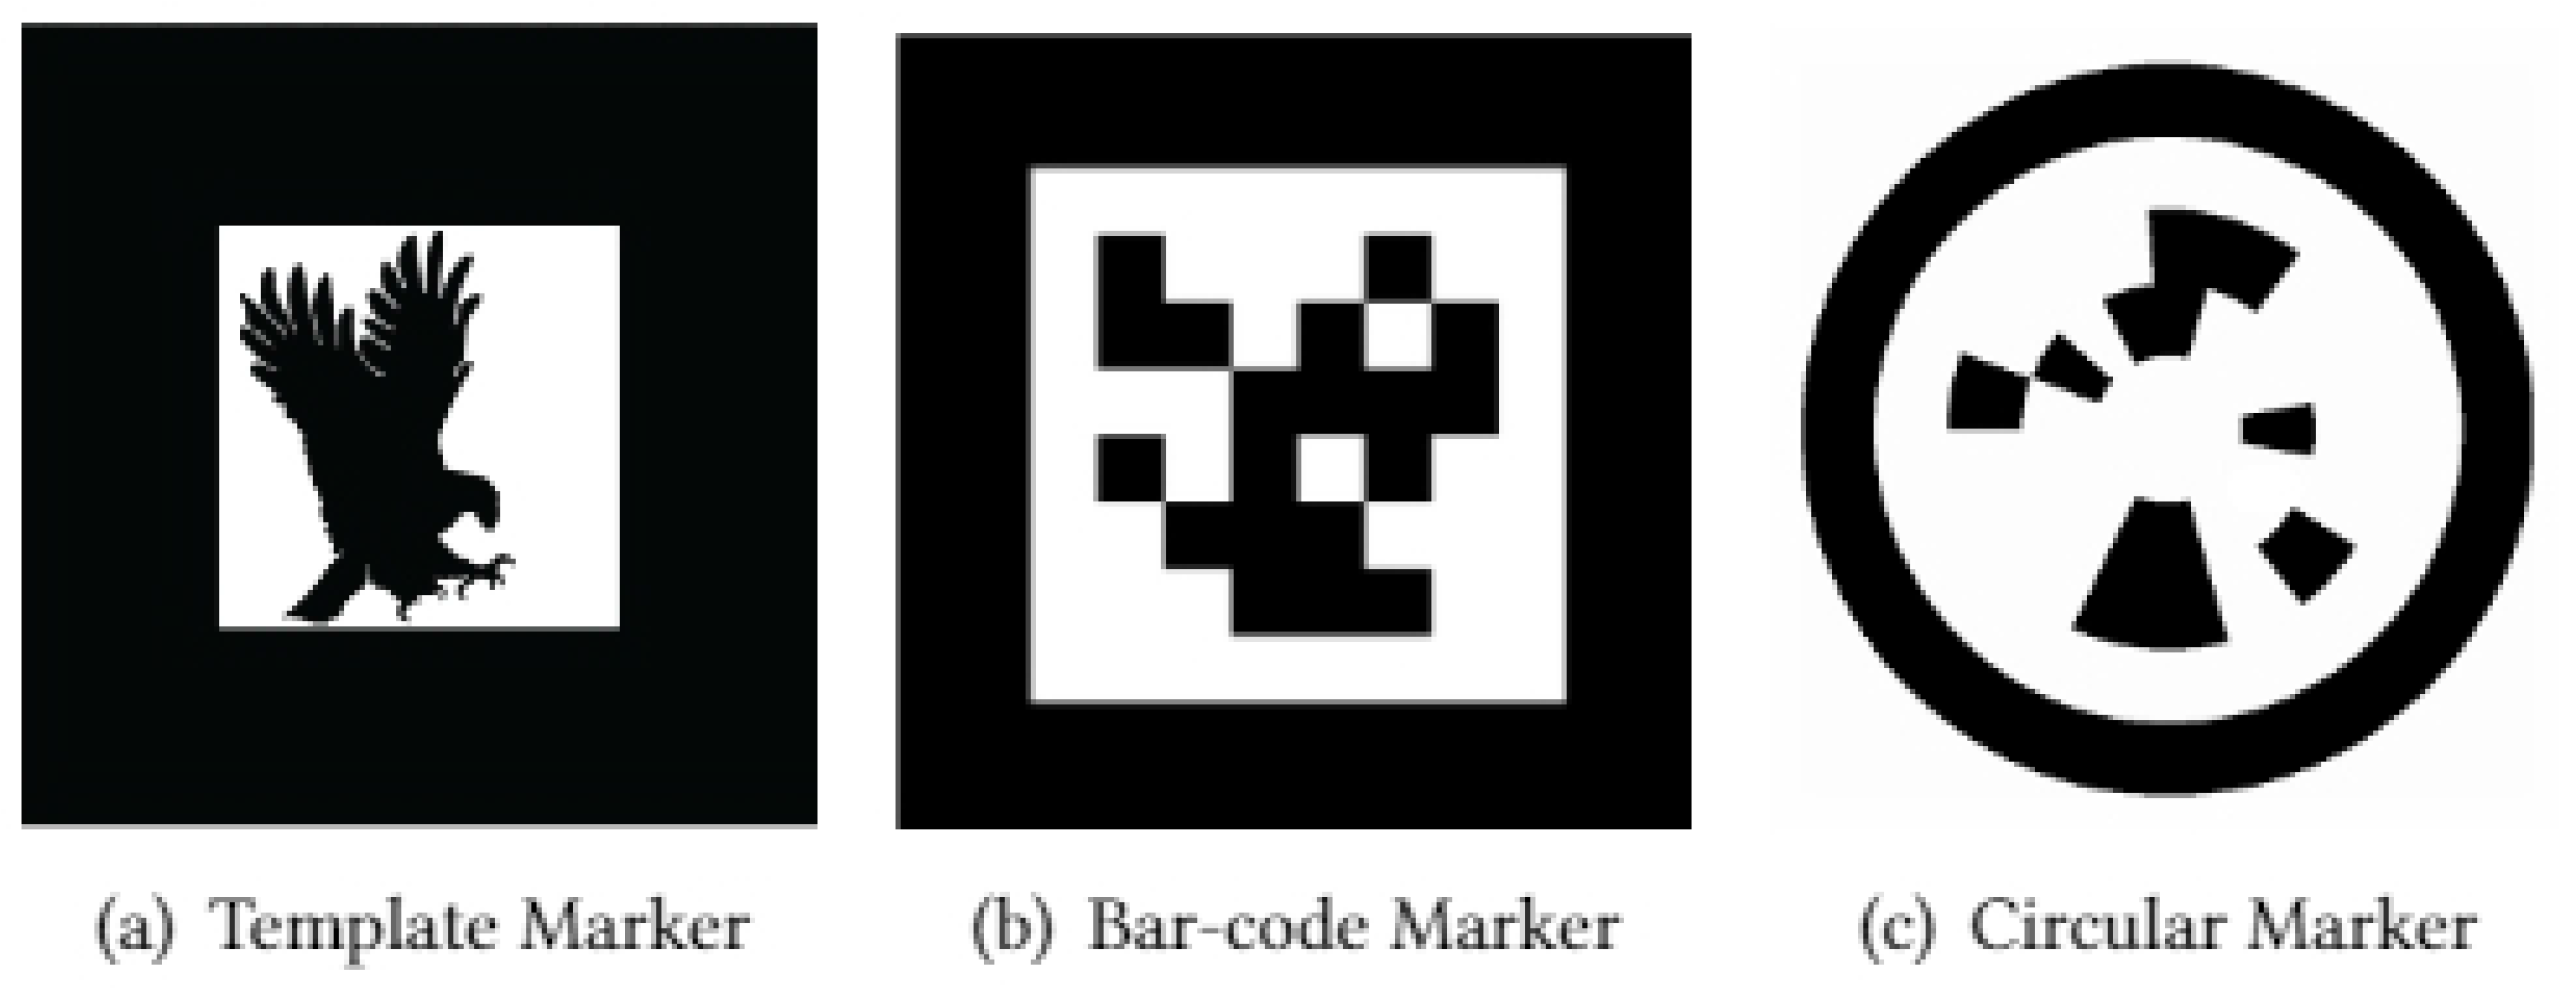
Figure 3.
A sample of AR using a pictorial marker.

Figure 4.
2D bar-codes are used to display Hydrogen and Oxygen elements in 3D.

Figure 5.
Some other newly proposed AR markers [32] that combines both barcode and picture. (a) Alvarez Marker; (b) Vuforia Marker.
Figure 5.
Some other newly proposed AR markers [32] that combines both barcode and picture. (a) Alvarez Marker; (b) Vuforia Marker.
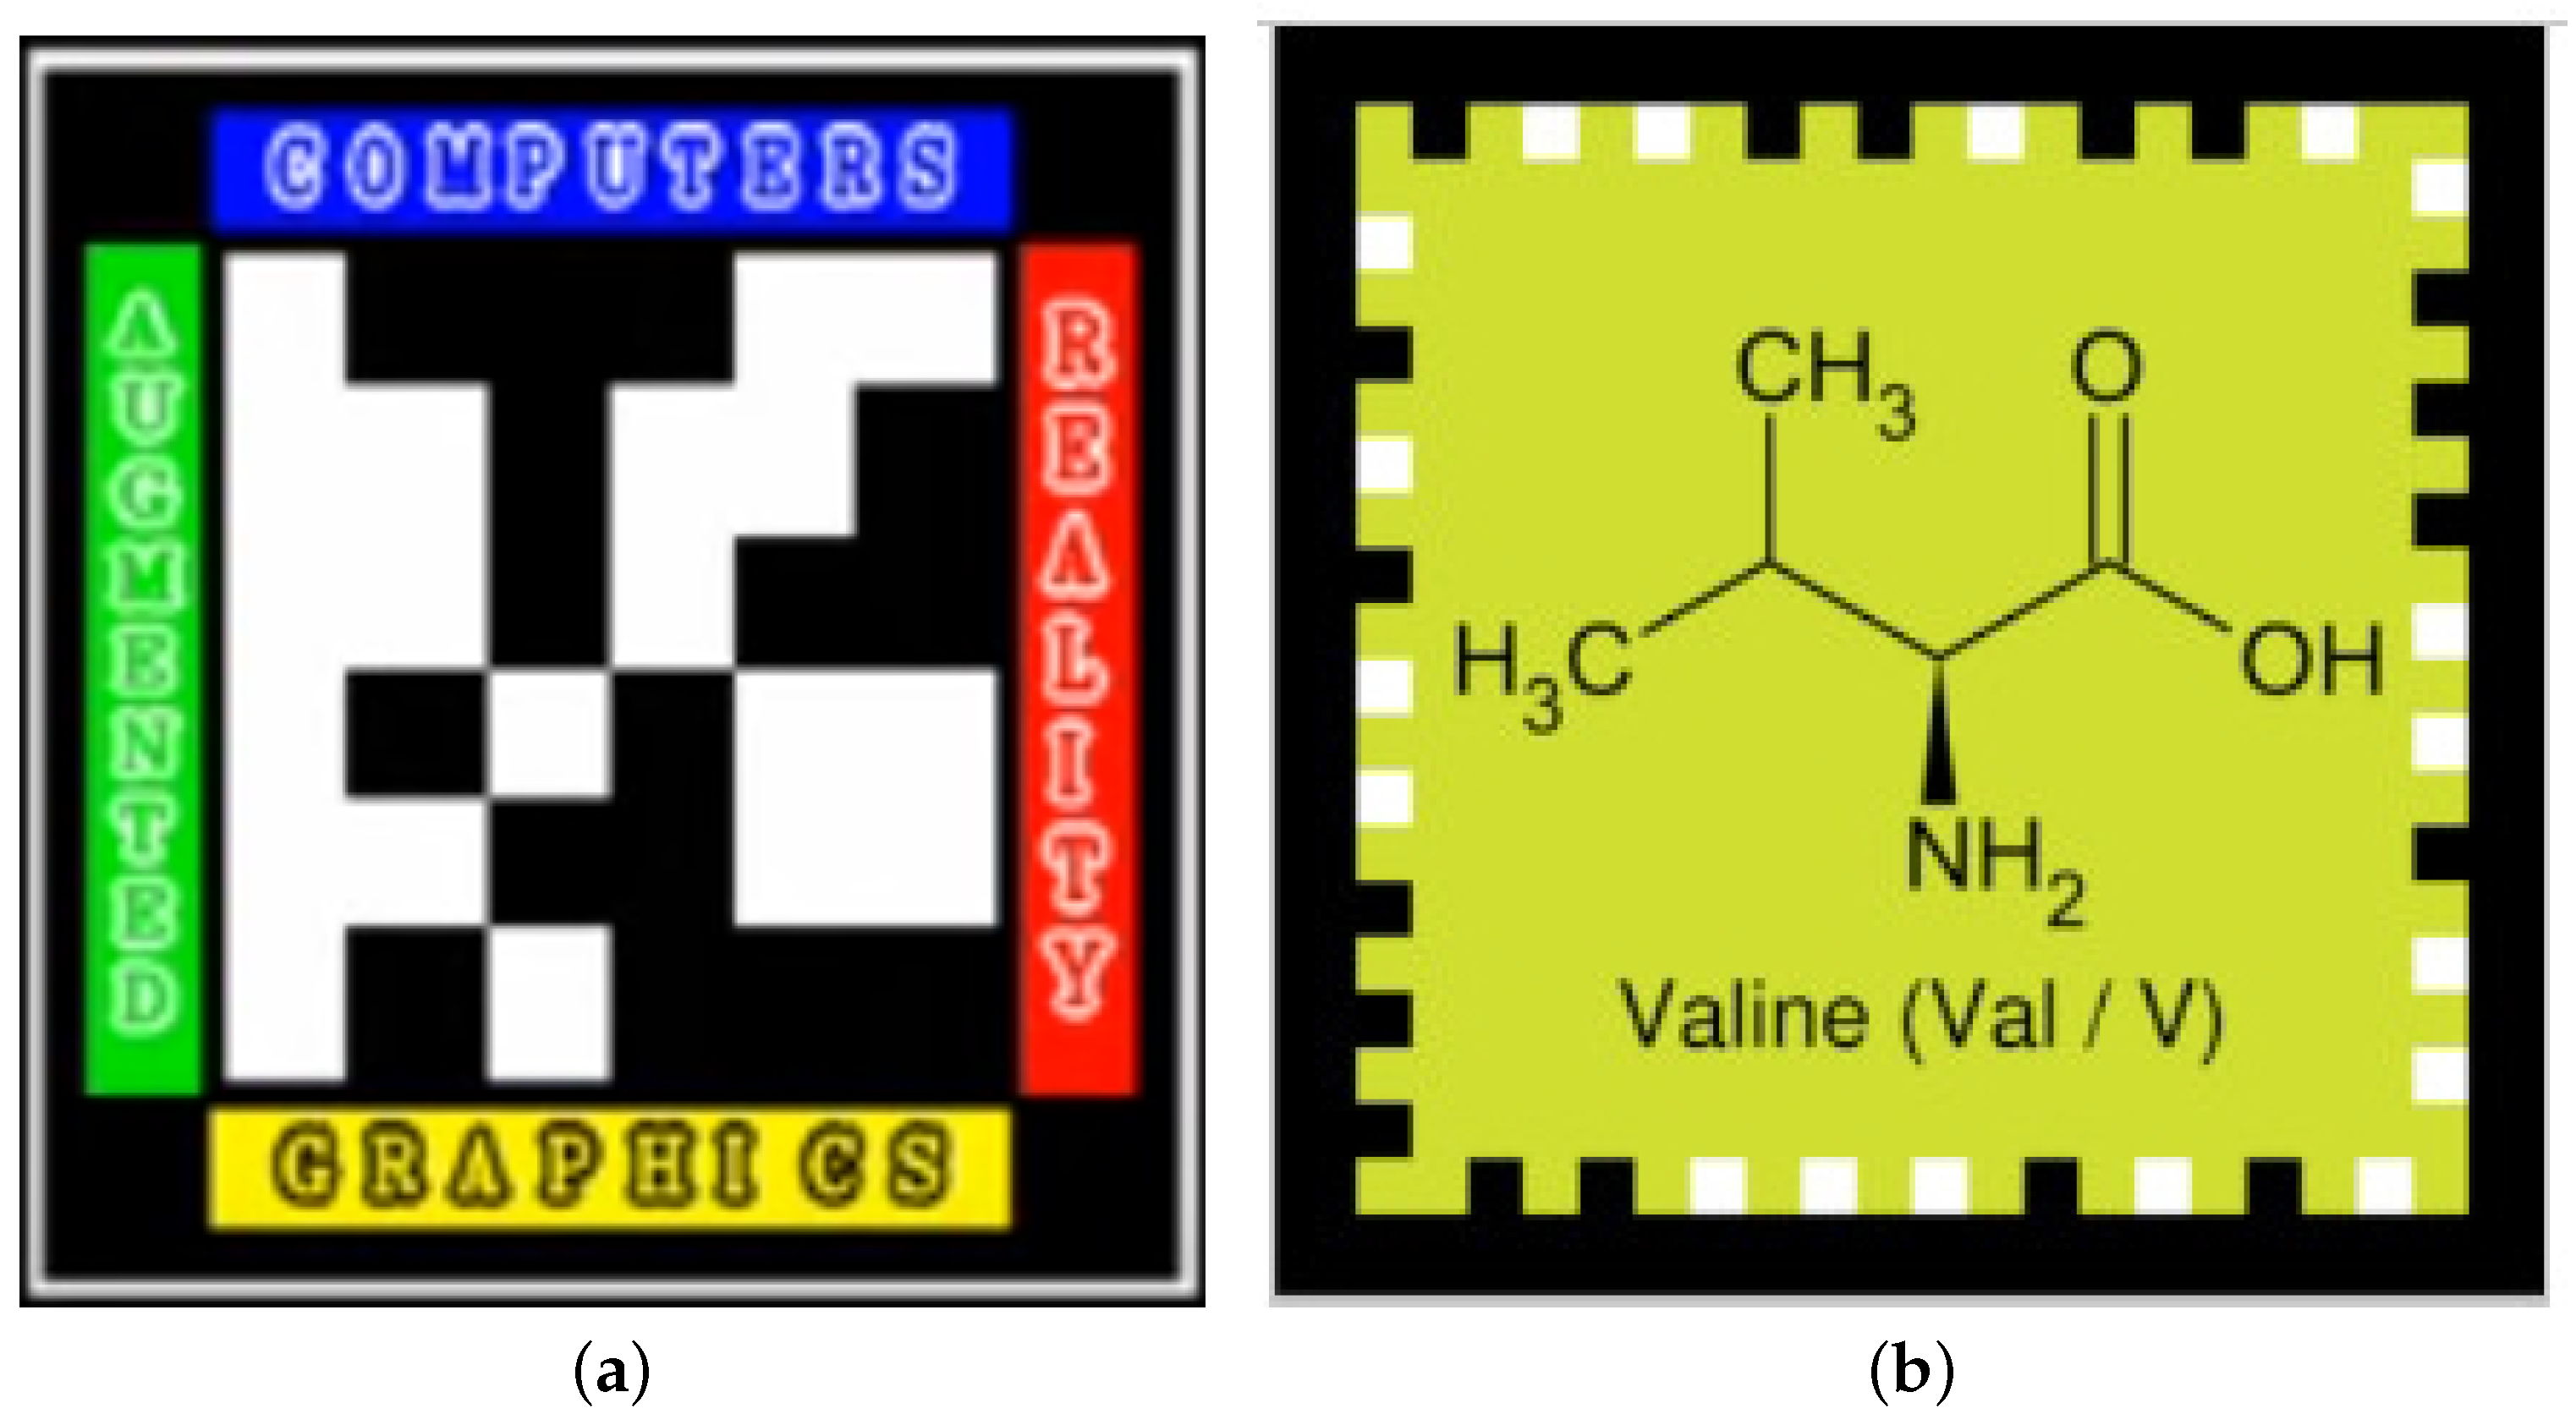
Figure 6.
Design of Pictorial Marker with Hidden 3D Bar-Code (PMBC) tag that optically hides a multi-level bar-code. (a) idea of our Pictorial Marker.; (b) design of proposed PMBC Tag.; (c) multi-level bar-code.; (d) principle of the tag creation.
Figure 6.
Design of Pictorial Marker with Hidden 3D Bar-Code (PMBC) tag that optically hides a multi-level bar-code. (a) idea of our Pictorial Marker.; (b) design of proposed PMBC Tag.; (c) multi-level bar-code.; (d) principle of the tag creation.

Figure 7.
Proposed multi-level bar-code (version 1).

Figure 8.
Our two methods to decorate the inner tag image: (1) adding textures and (2) adding shading gradients.
Figure 8.
Our two methods to decorate the inner tag image: (1) adding textures and (2) adding shading gradients.

Figure 9.
Three examples of PMBC tags that conceal the same multi-level bar-code. (a) Mickey tag; (b) Spider-Man tag; (c) Iron Man tag.
Figure 9.
Three examples of PMBC tags that conceal the same multi-level bar-code. (a) Mickey tag; (b) Spider-Man tag; (c) Iron Man tag.
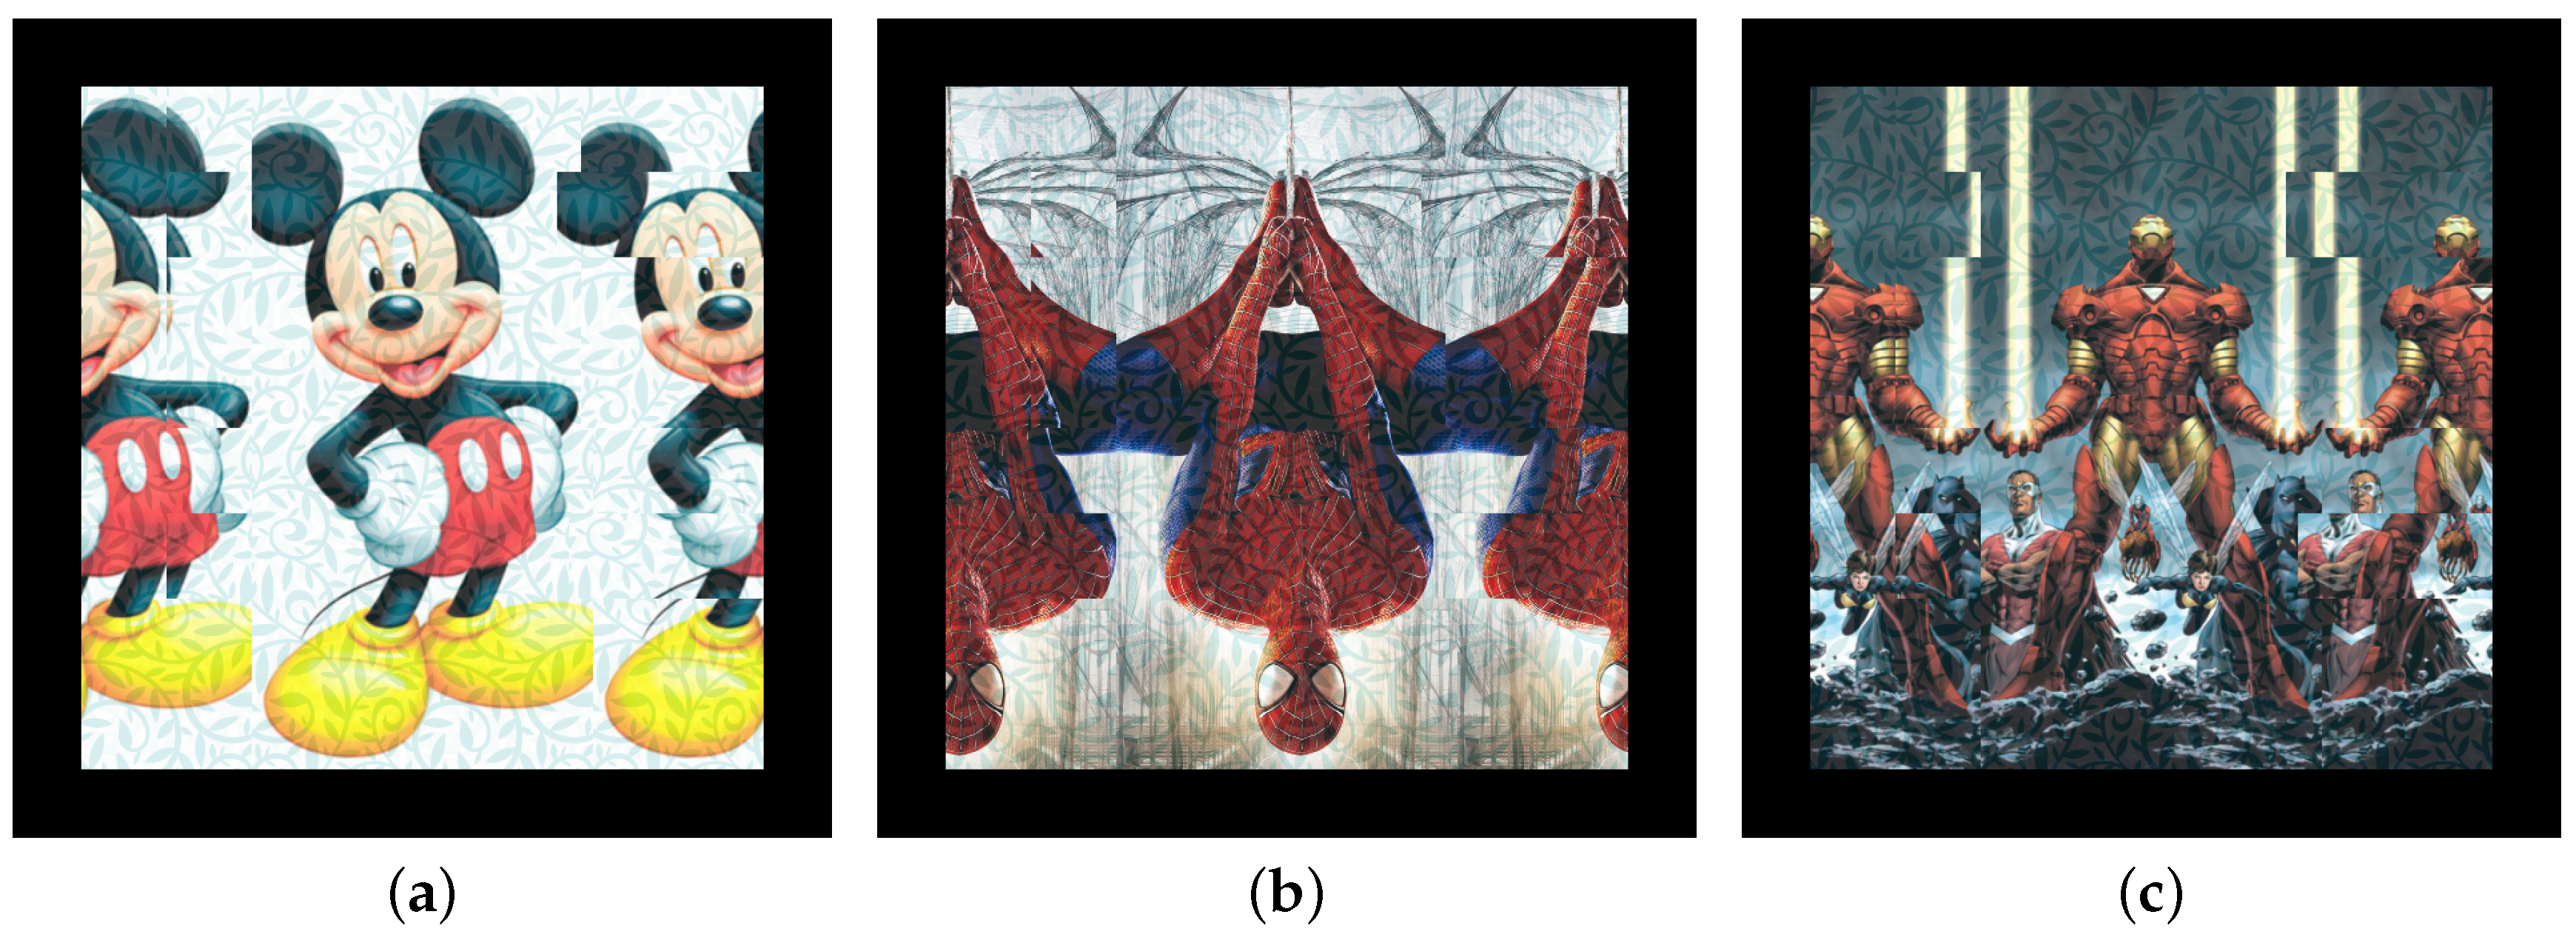
Figure 10.
Design of our system architecture.
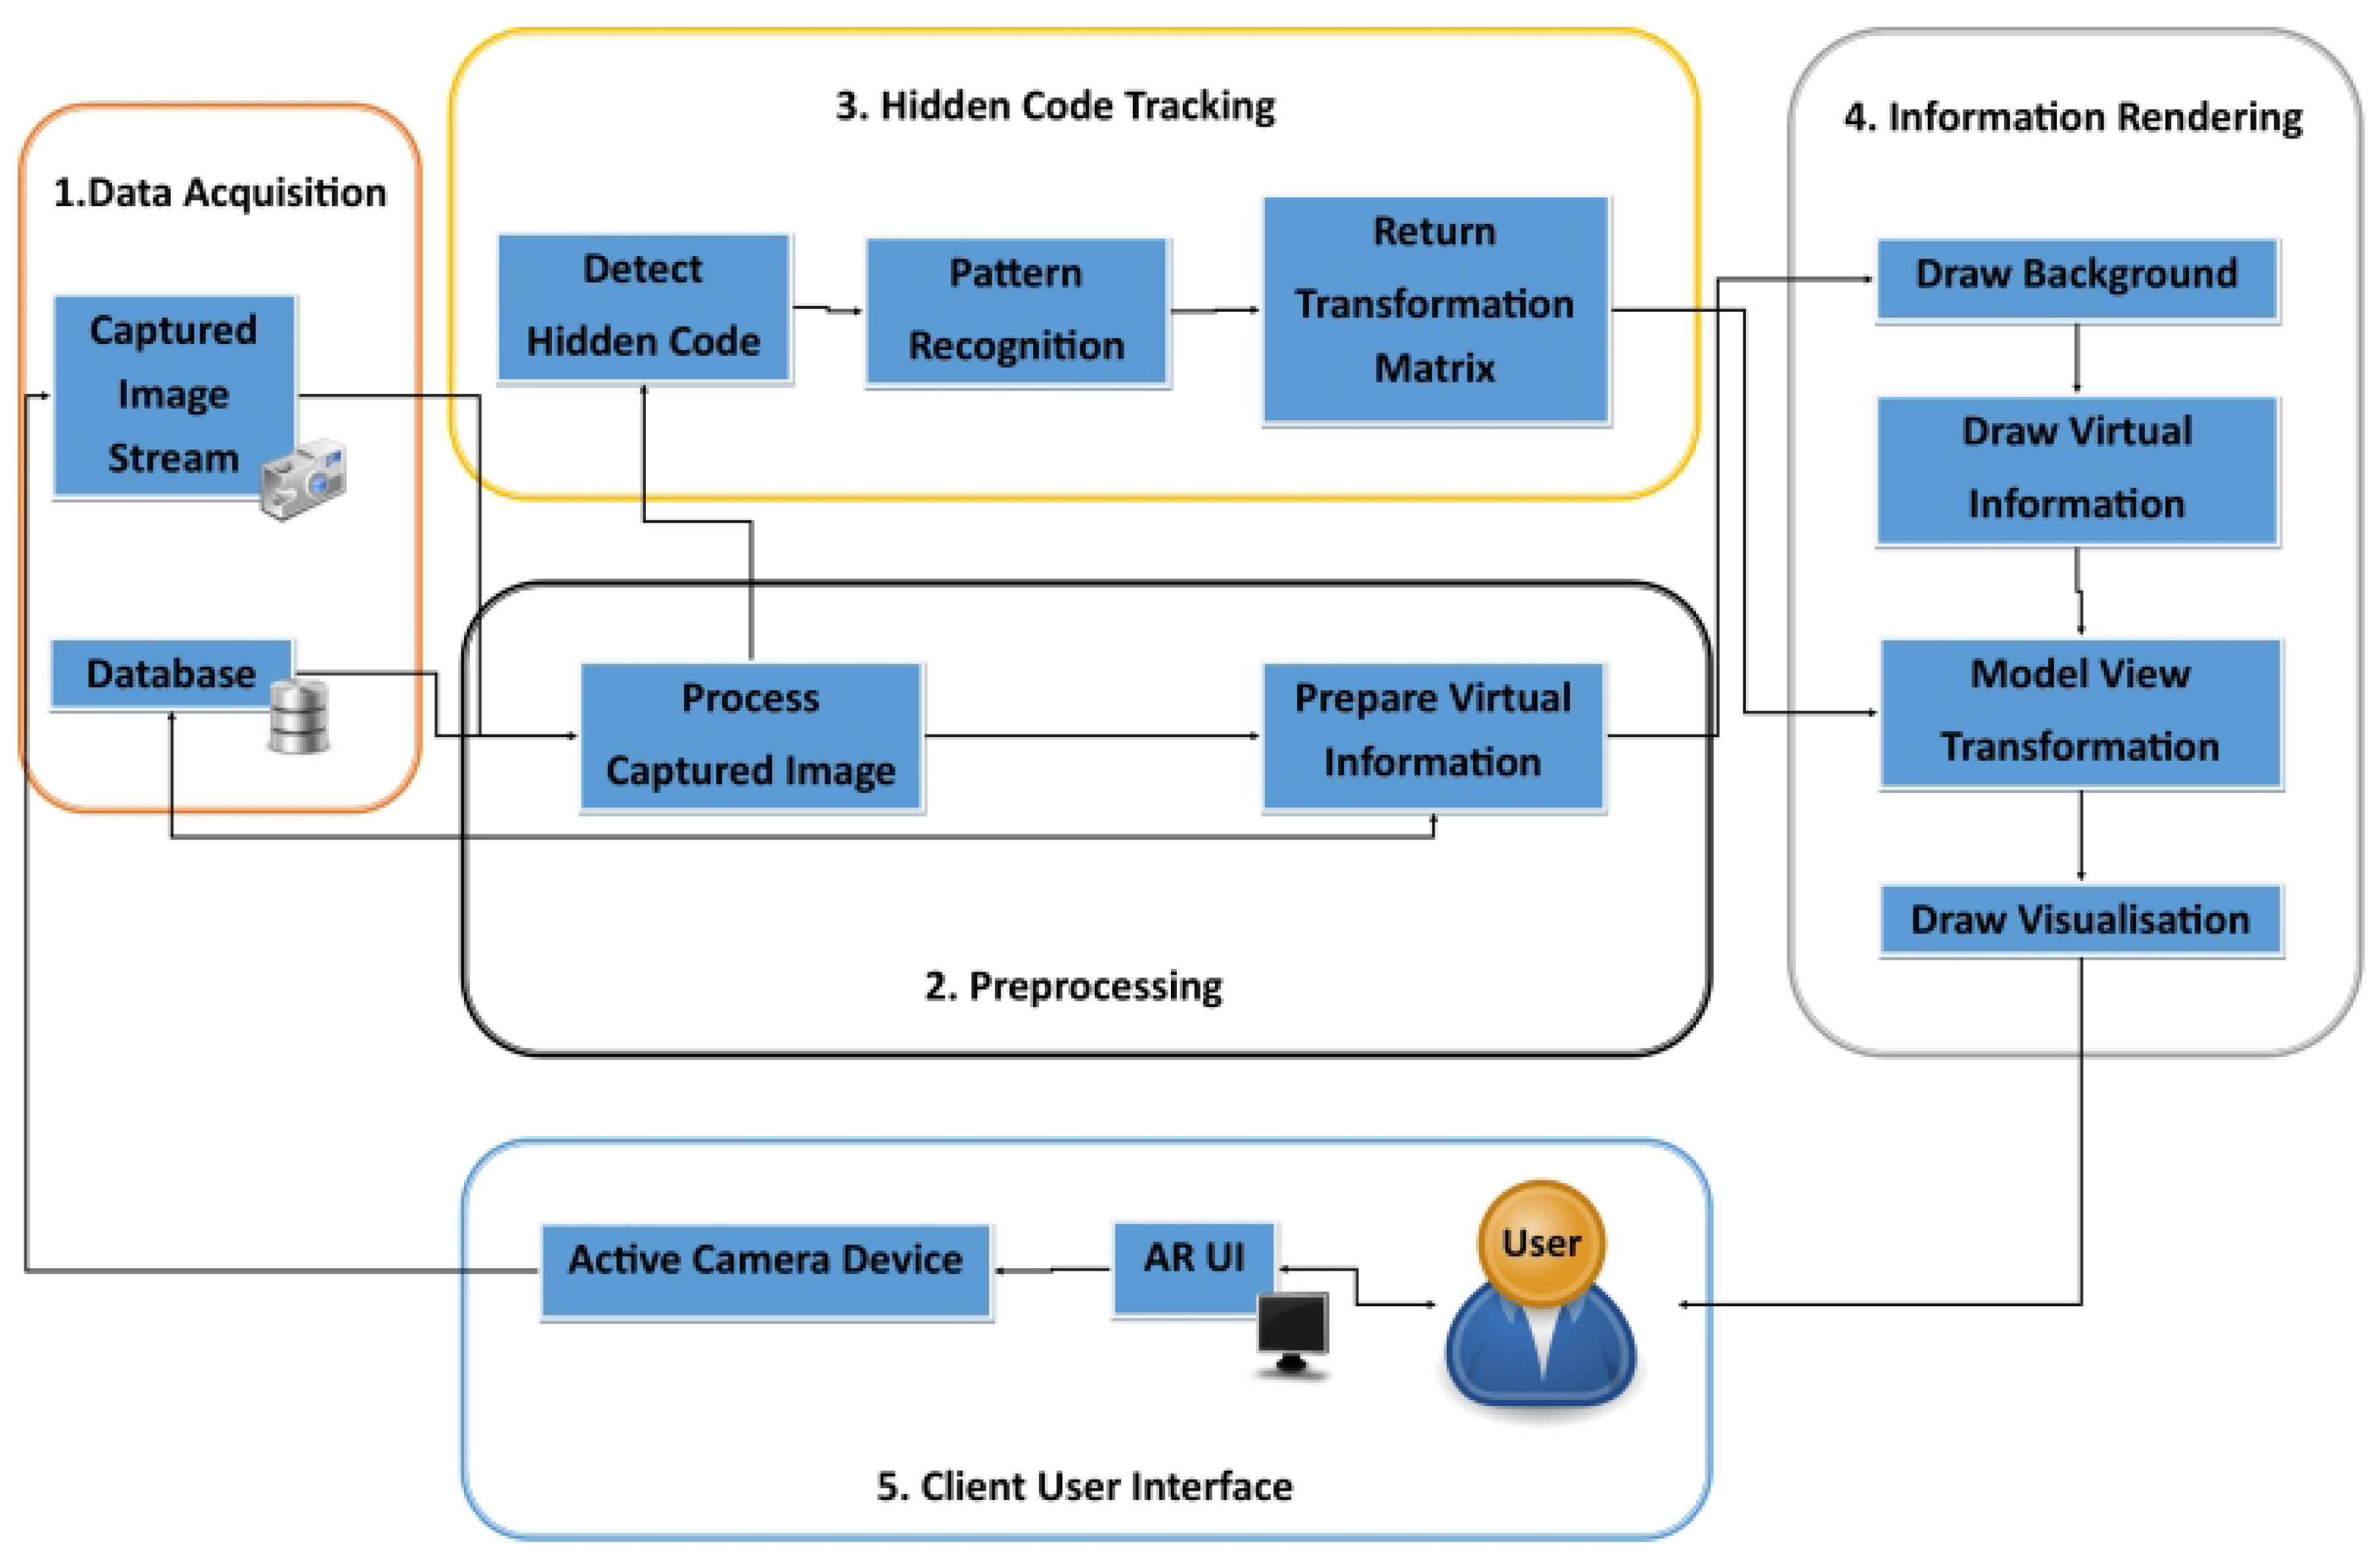
Figure 11.
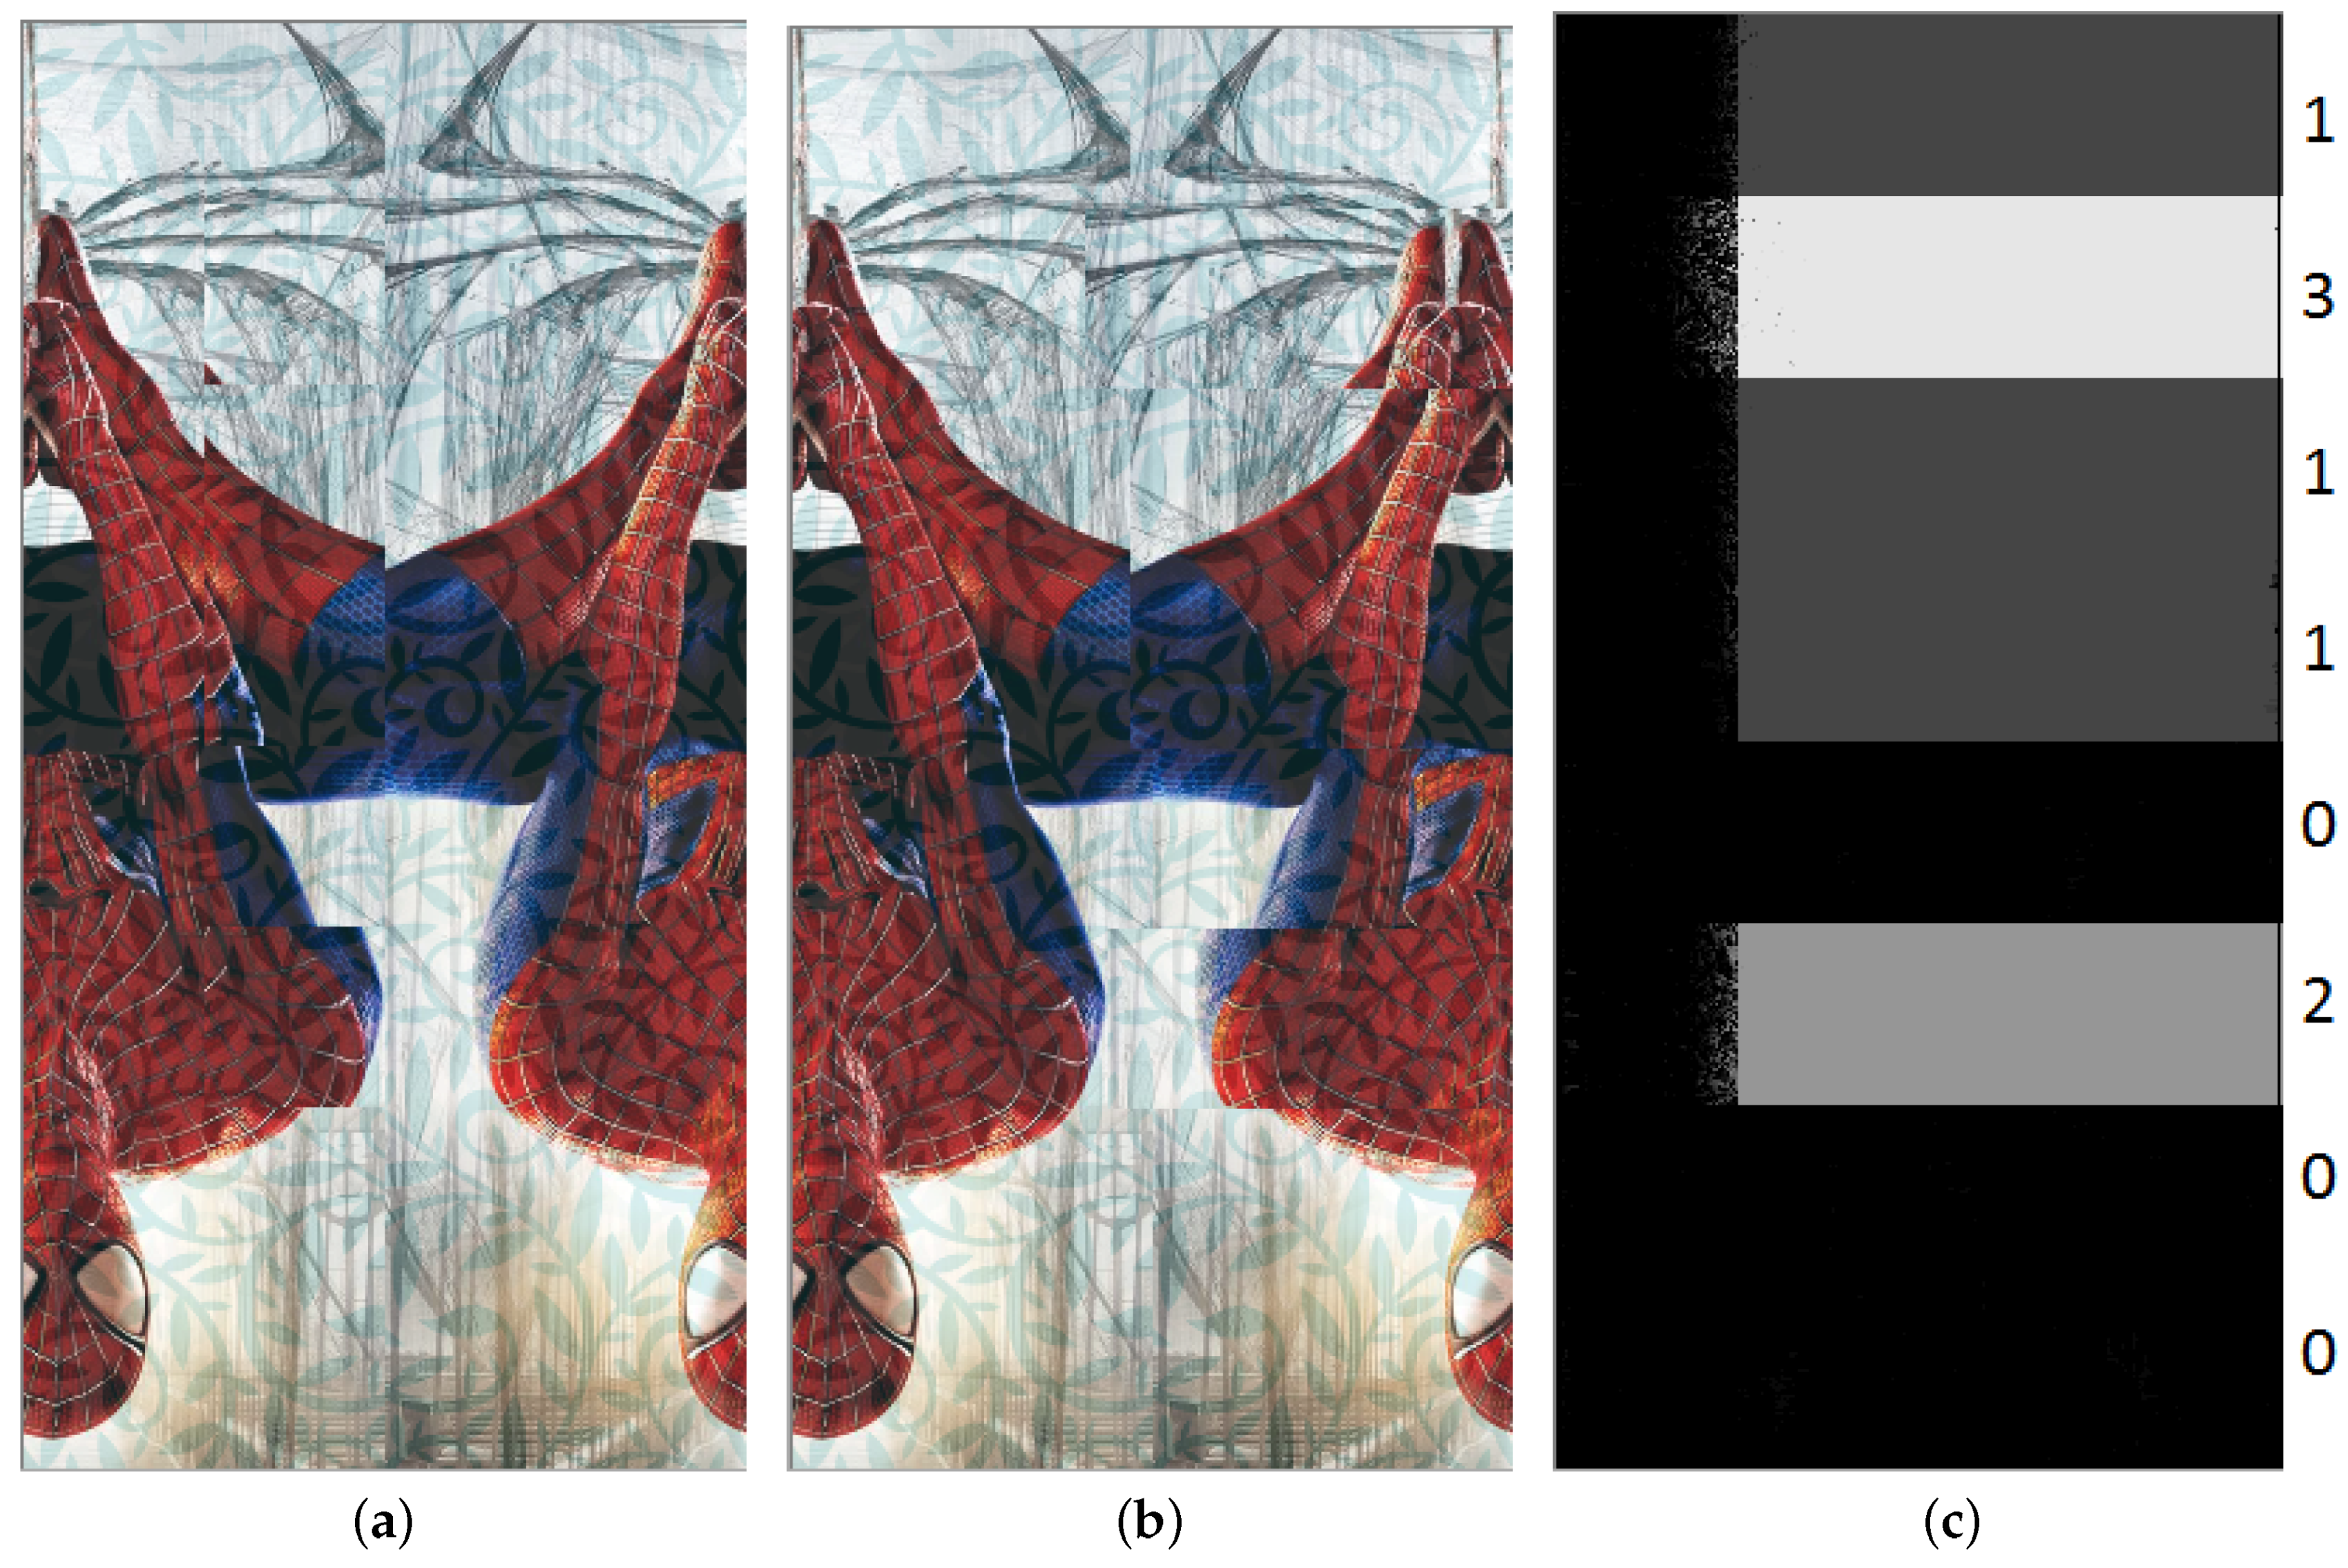
Left and right stereo images extracted from the Spider-Man tag shown in Figure 9b and its disparity map, read from top down: 13,110,200 = 29,984. (a) left stereo image; (b) right stereo image; (c) resulted disparity.
Figure 11.
Left and right stereo images extracted from the Spider-Man tag shown in Figure 9b and its disparity map, read from top down: 13,110,200 = 29,984. (a) left stereo image; (b) right stereo image; (c) resulted disparity.

Figure 12.
(a) relationship between the marker coordinates and the camera coordinates; (b) sample virtual 3D shape rendered on the top of the marker.
Figure 12.
(a) relationship between the marker coordinates and the camera coordinates; (b) sample virtual 3D shape rendered on the top of the marker.

Figure 13.
Four examples of PMBC tags after various effects added by IrfanView (top row) and their corresponding decoded disparity maps (bottom row).
Figure 13.
Four examples of PMBC tags after various effects added by IrfanView (top row) and their corresponding decoded disparity maps (bottom row).
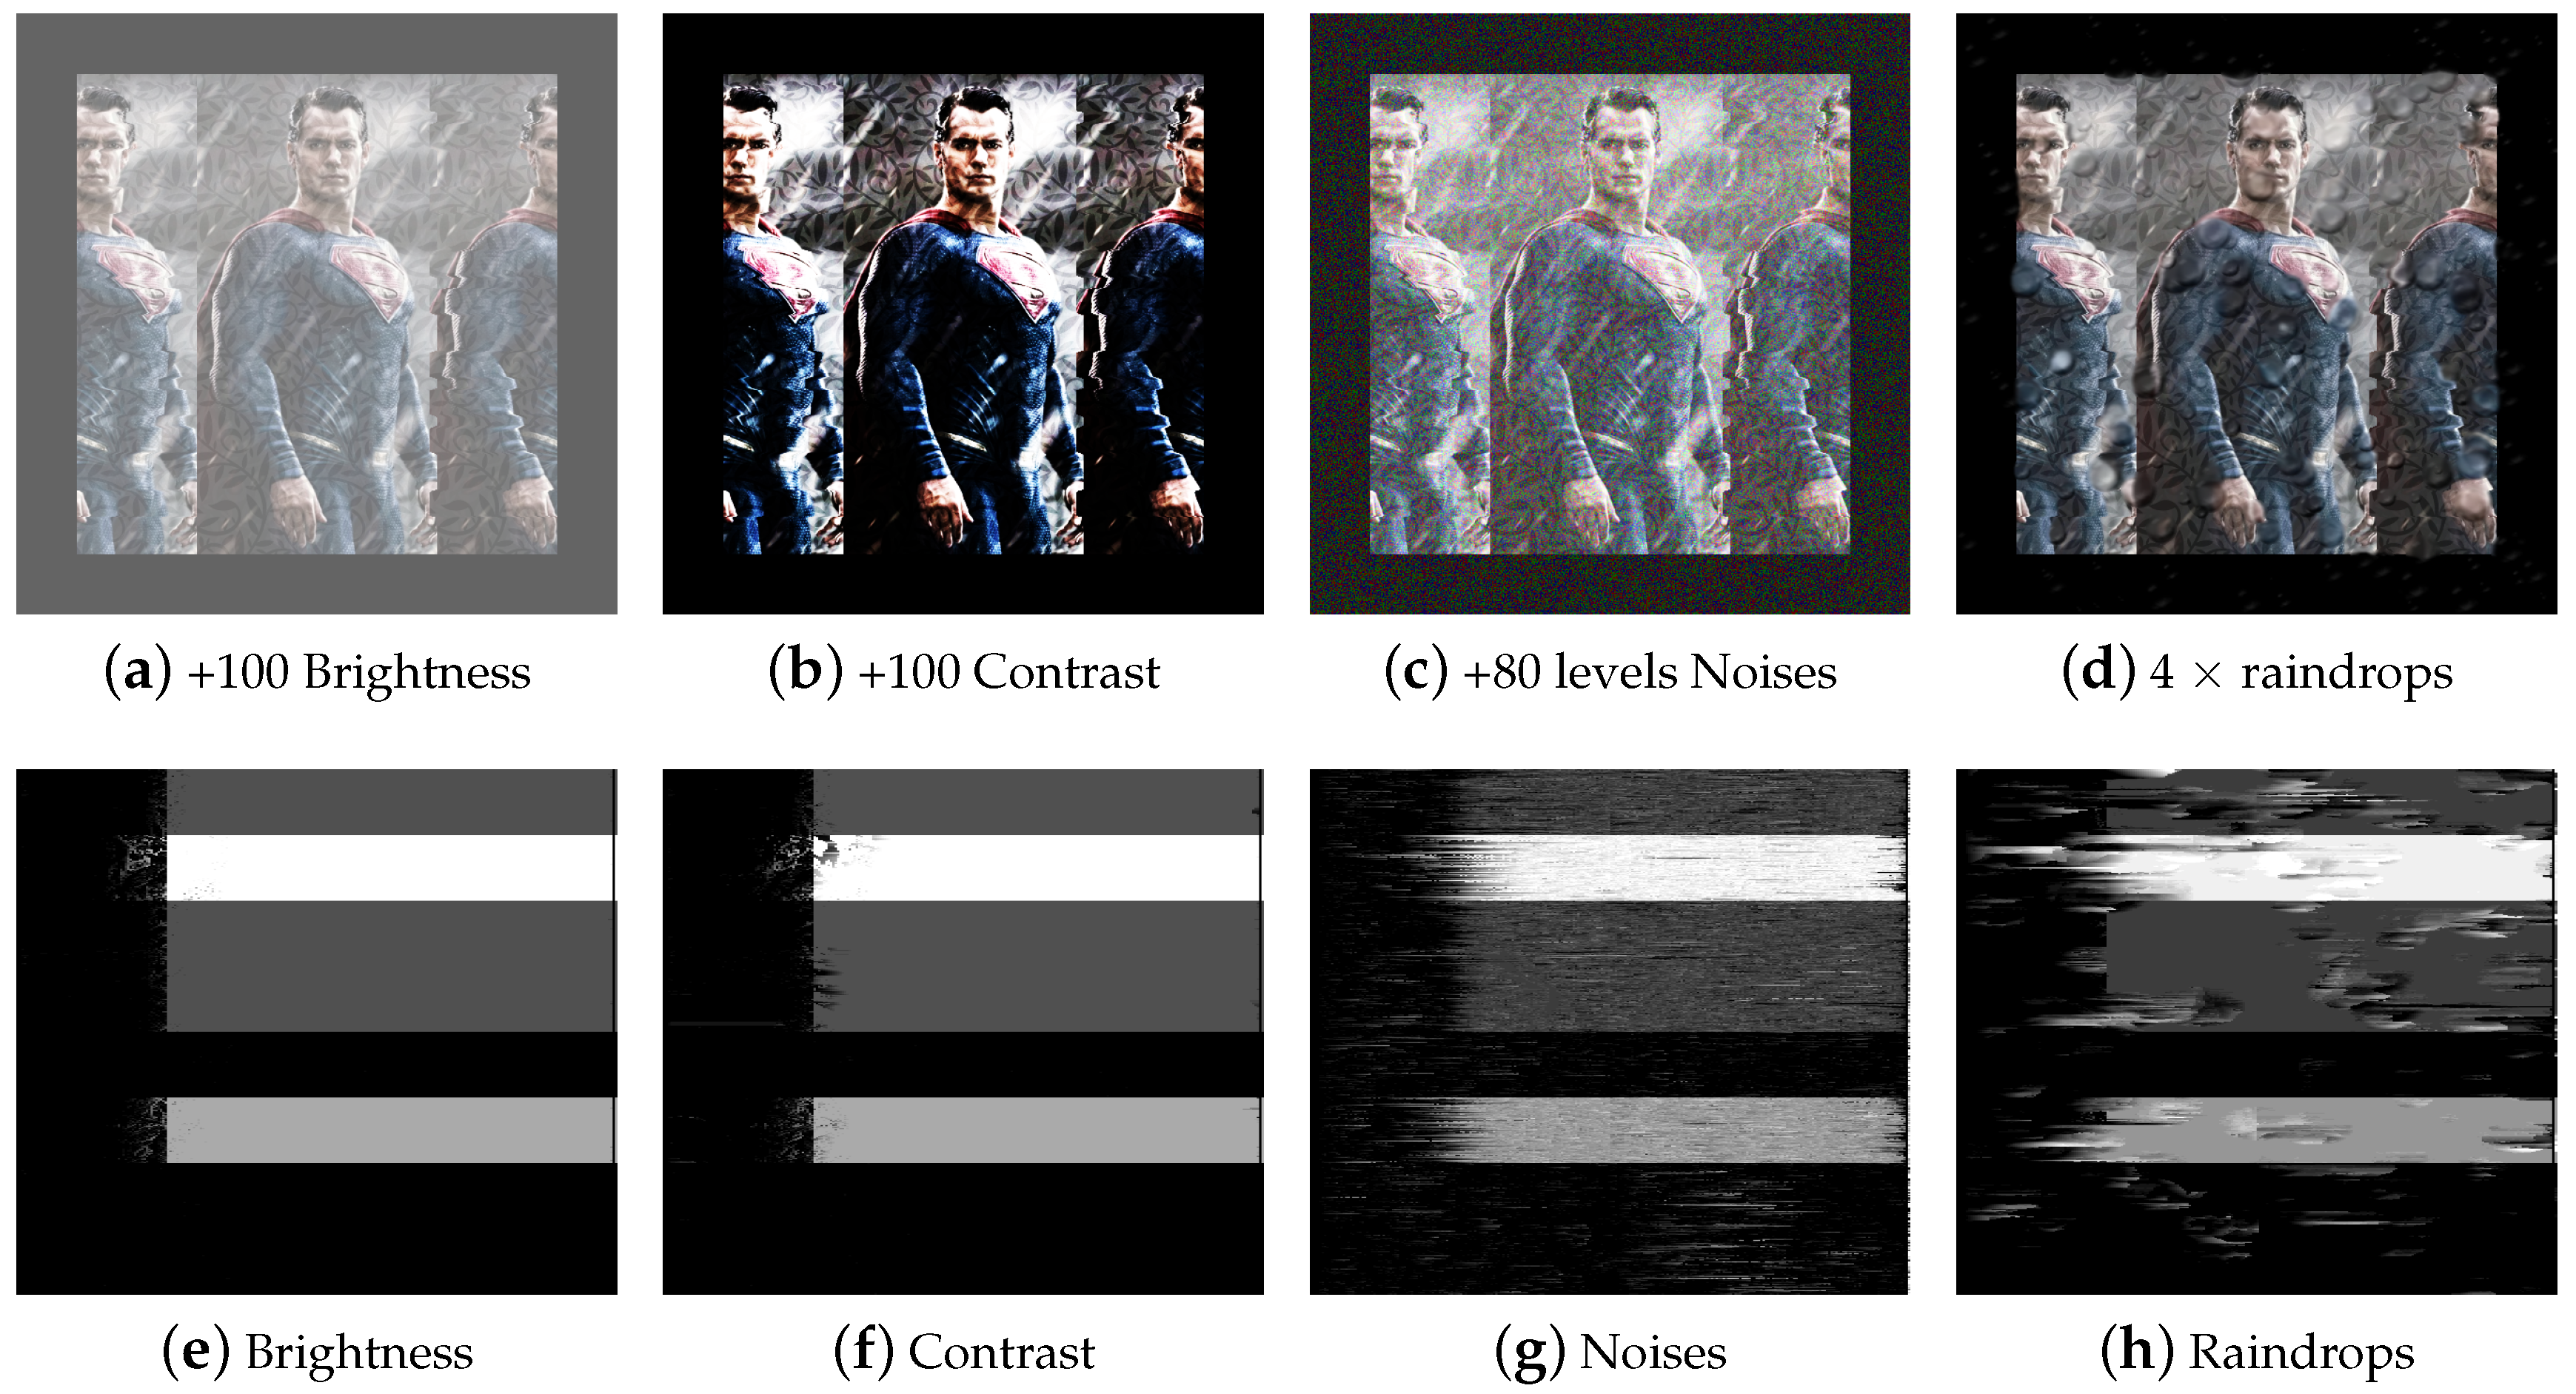
Figure 14.
Screenshot 1 of the tag detection and decryption.
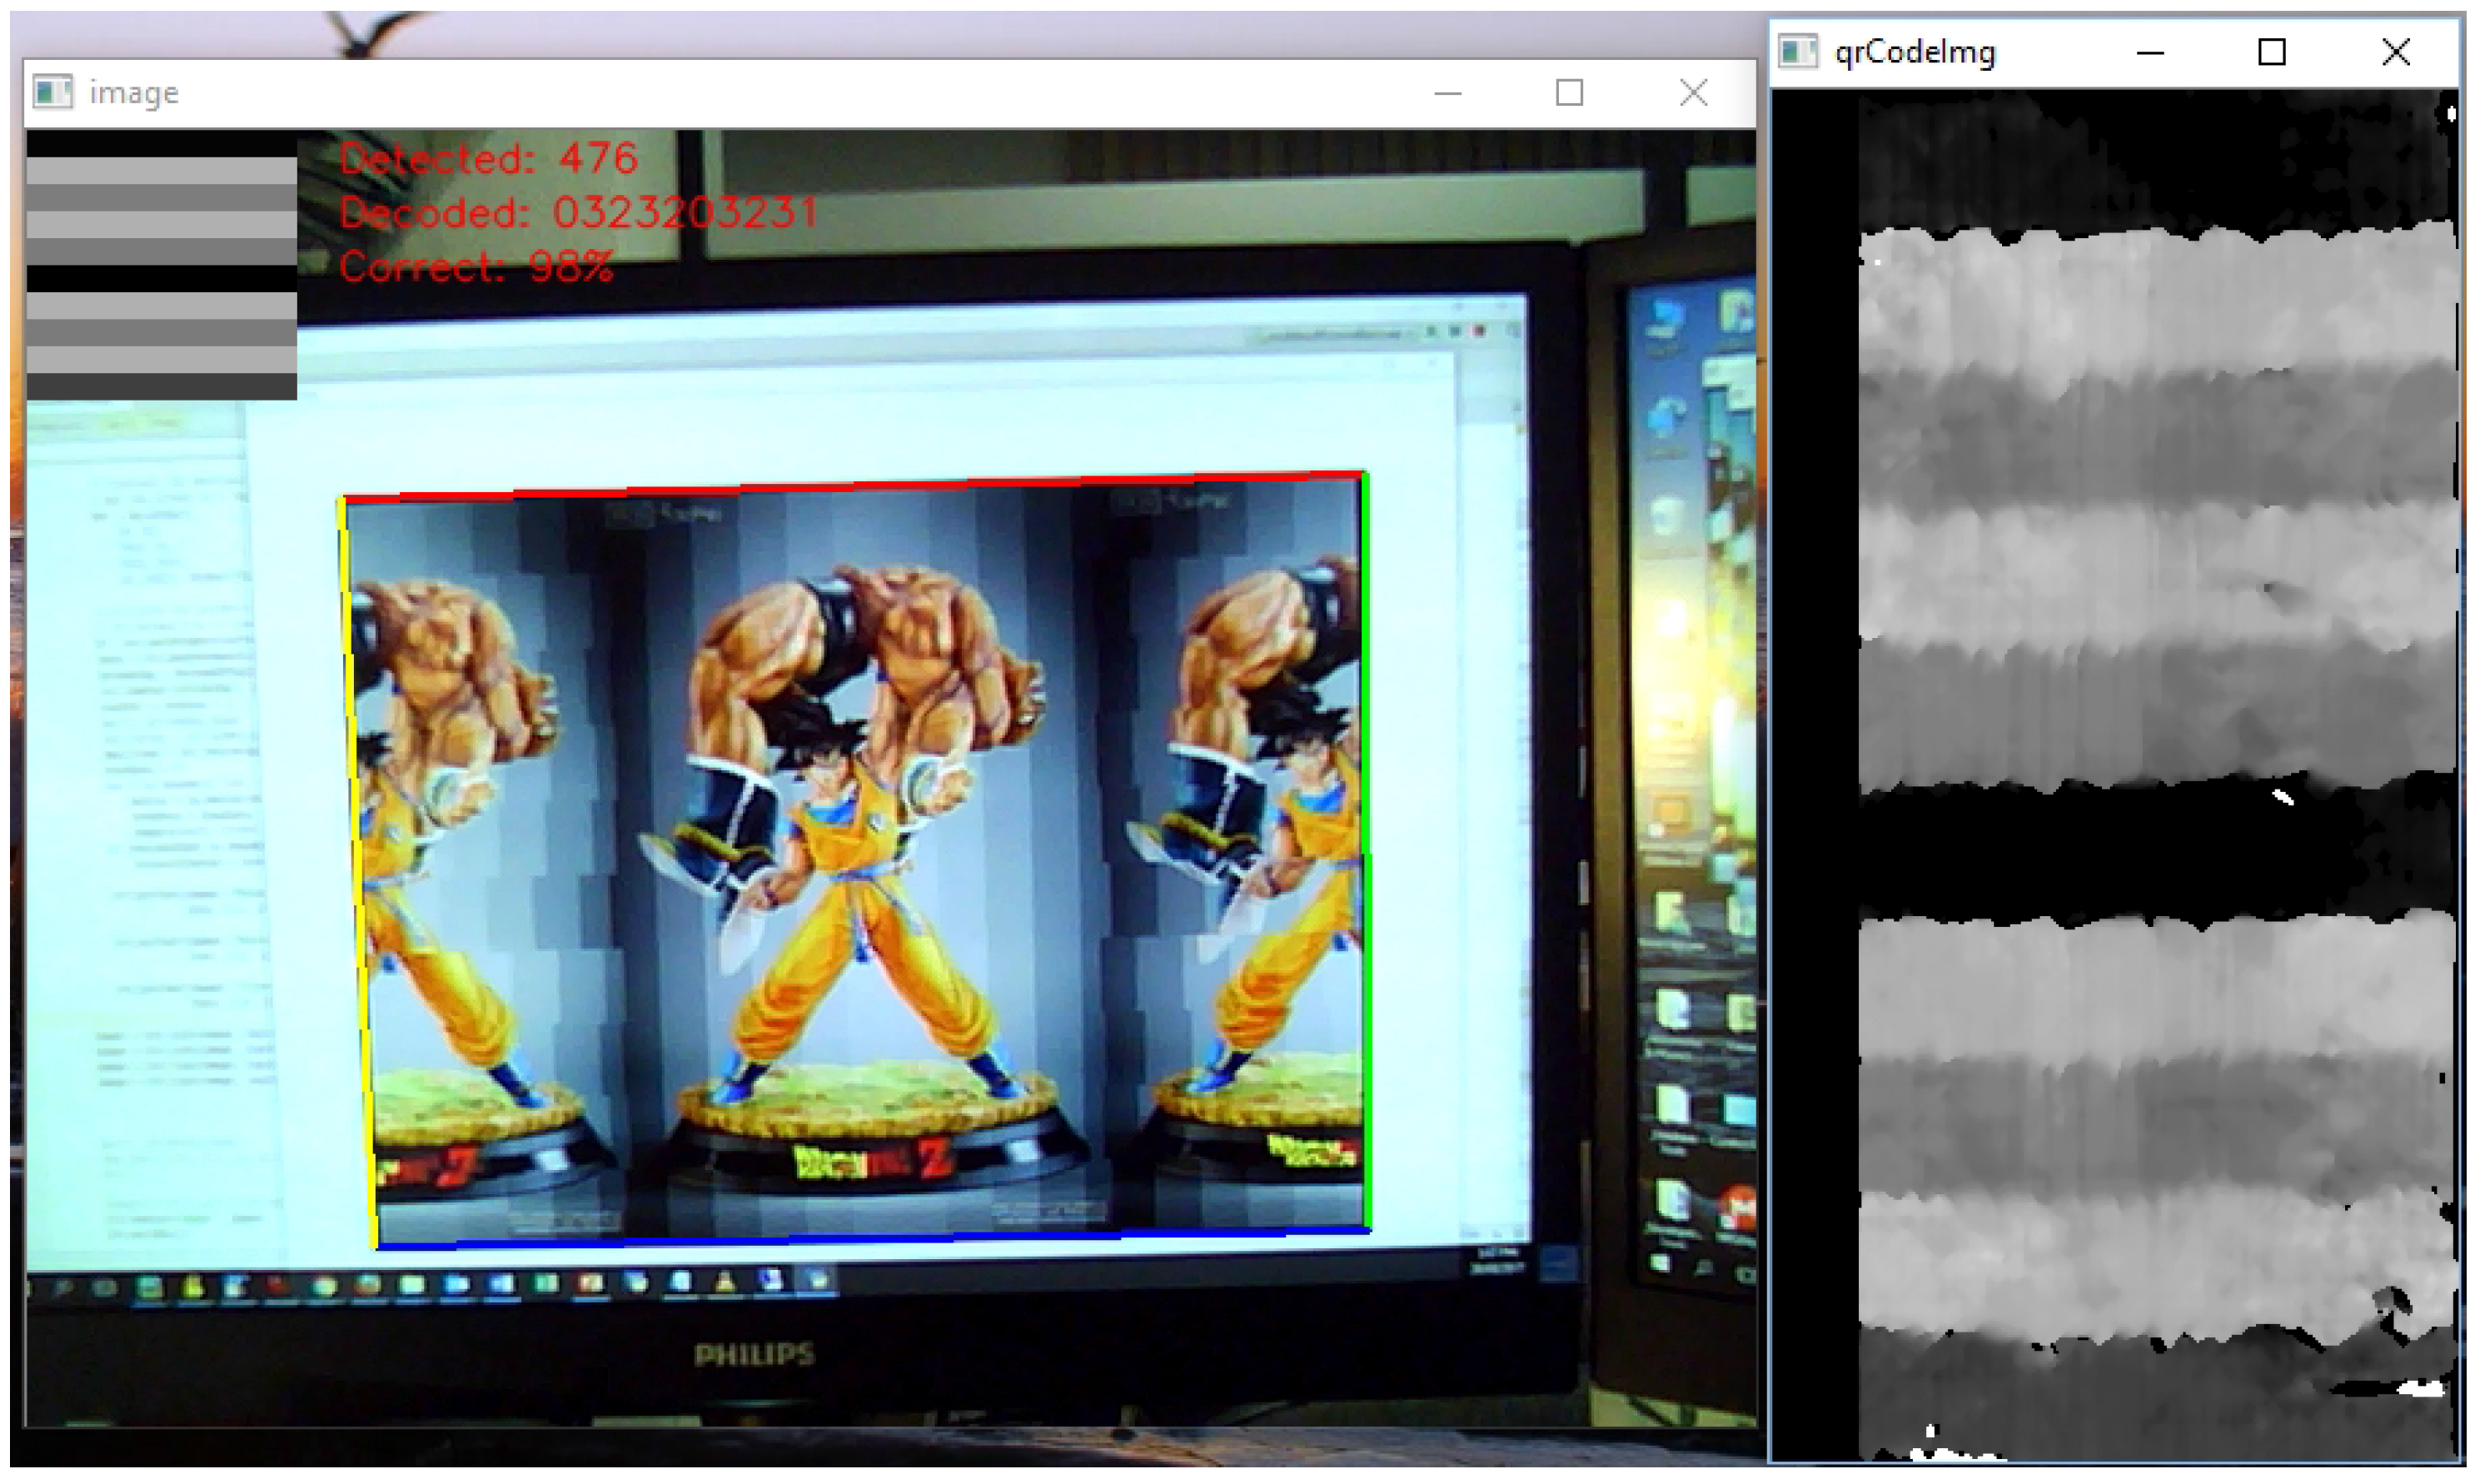
Figure 15.
Screenshot 2 of the tag detection and decryption.

Figure 16.
Examples of stereo card images that embed a full QR code.
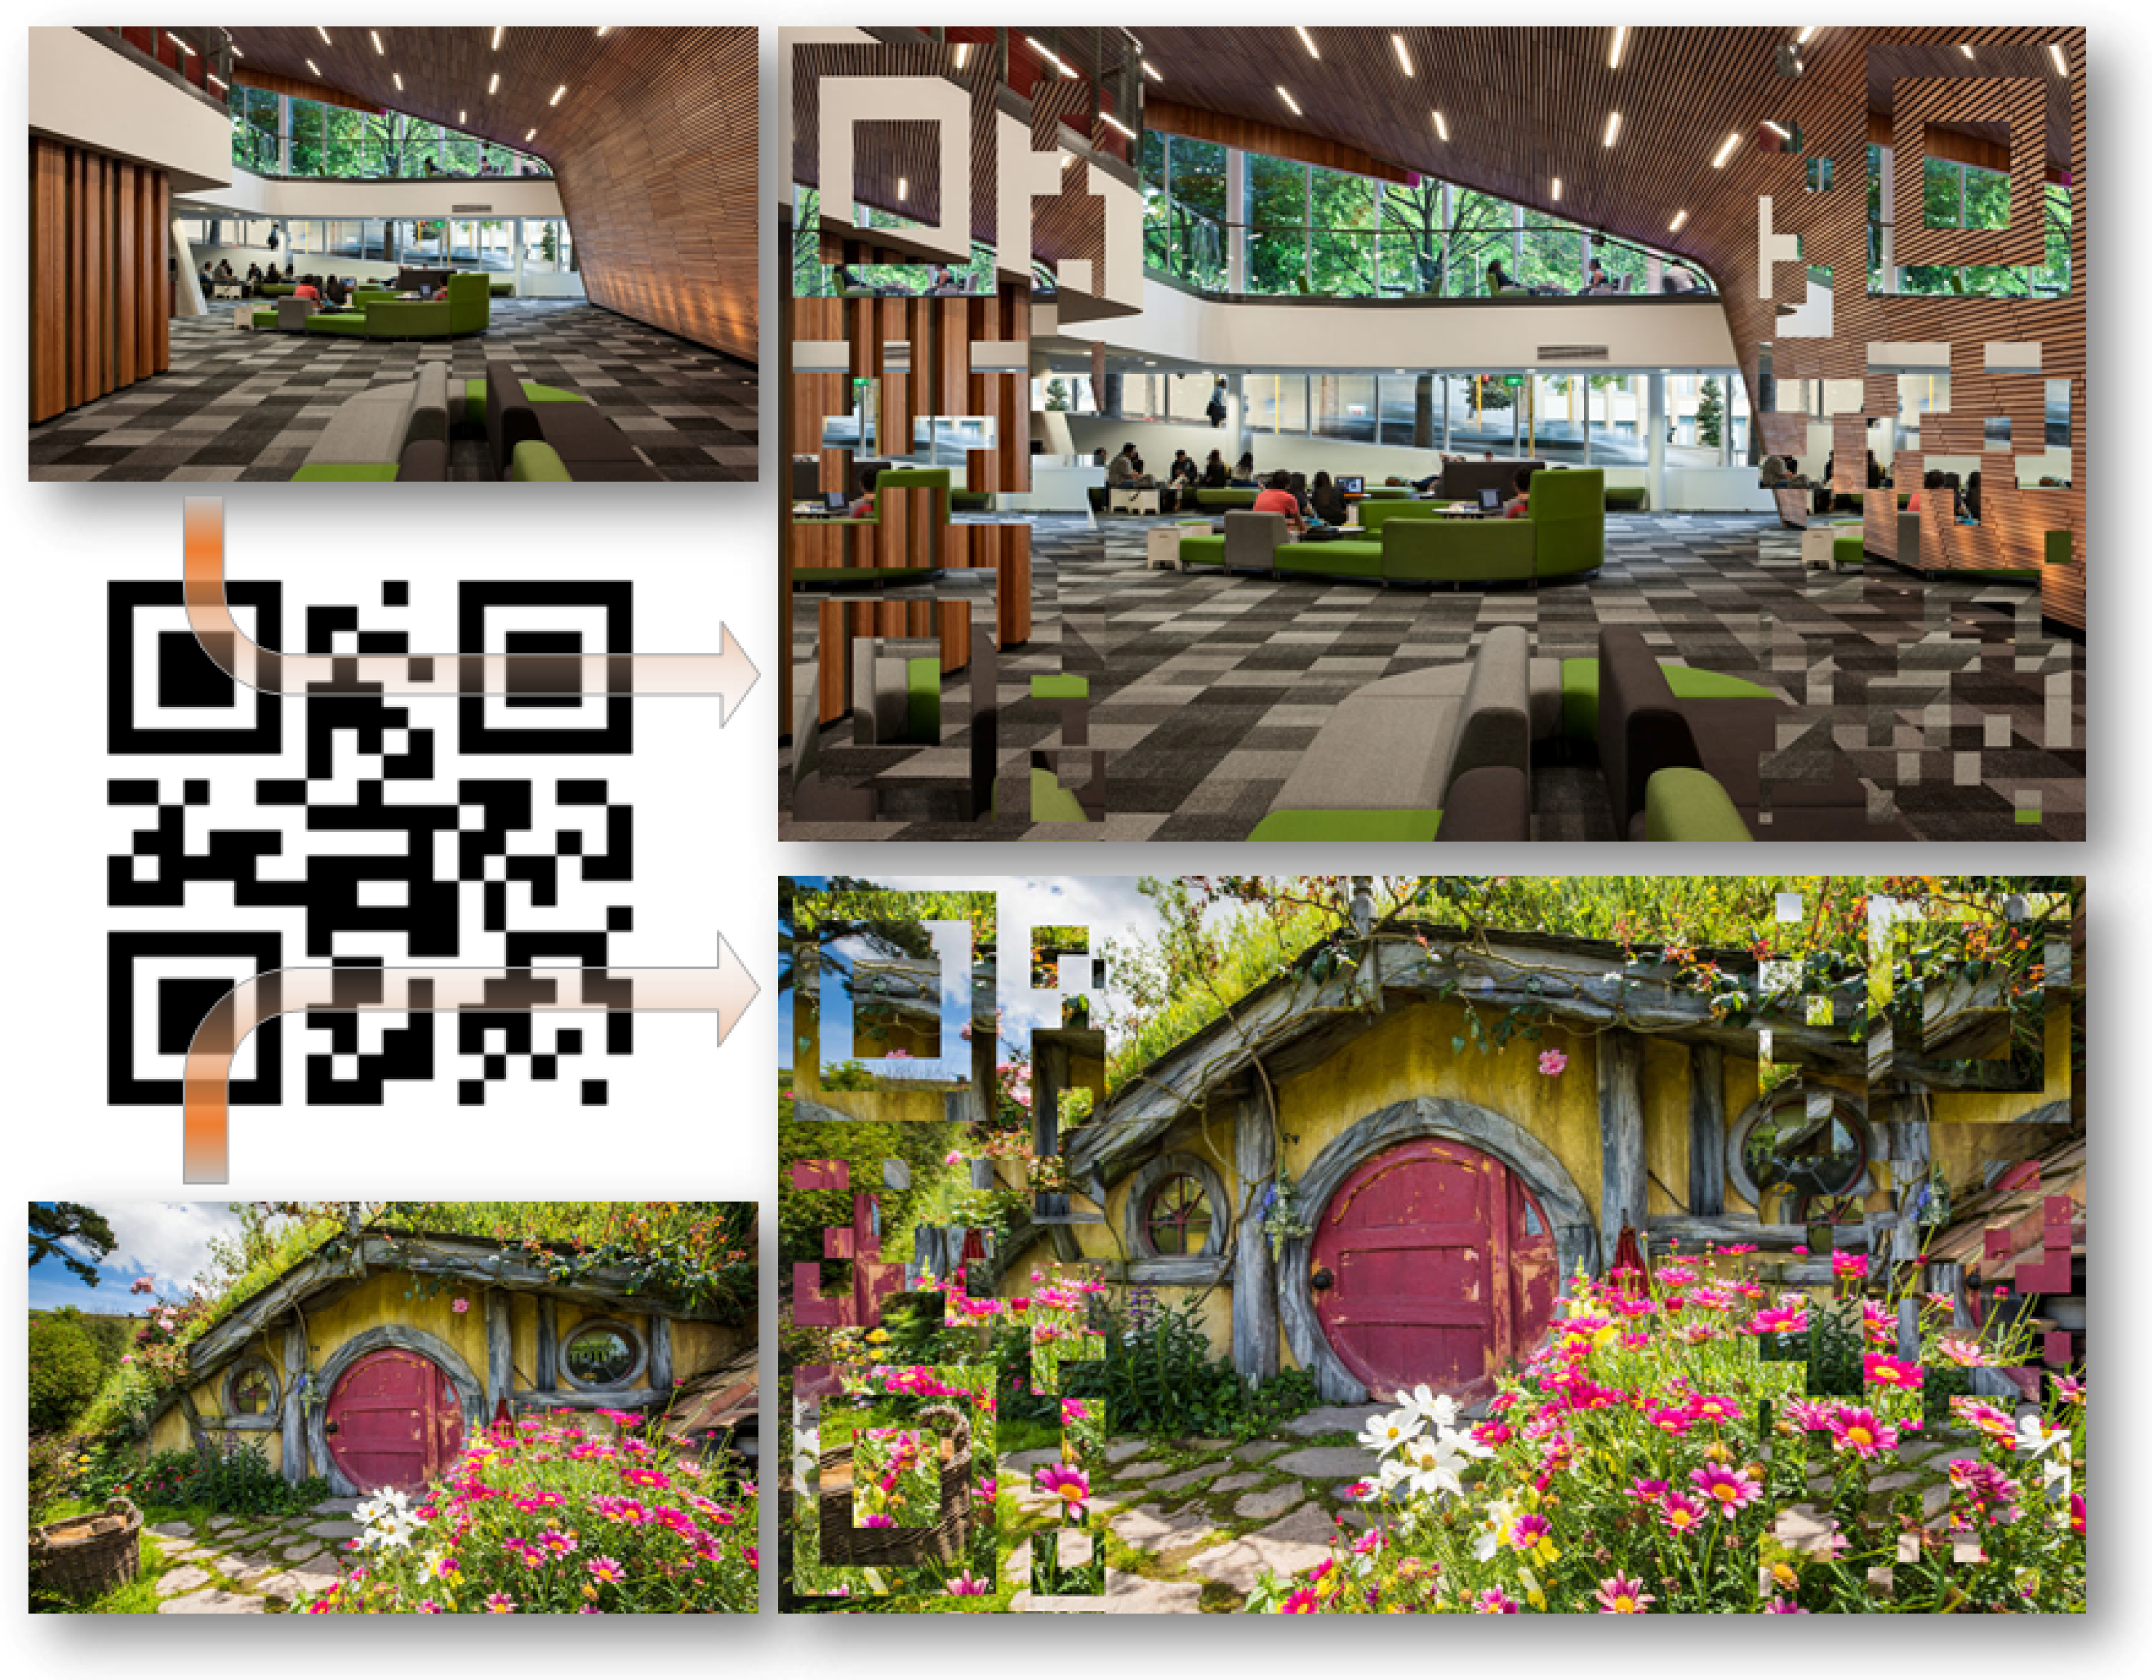
Figure 17.
Dilation and erosion to clear noises in extracted QR code.


Table 1.
Pictorial markers versus bar-code markers in augmented reality applications.
| Pictorial Makers | Bar-Code Markers | |
|---|---|---|
| Advantages |
|
|
| Disadvantages |
|
|
Table 2.
Specification of different versions of multi-level bar-code.
| Version | Controlled Zone | Number of Bars (N) | Depth Levels (L) | Presentation Range |
|---|---|---|---|---|
| 0 | width | 6 | 2 | 0–63 |
| 1 | width | 8 | 4 | 0– |
| 2 | width | 12 | 6 | 0– |
| 3 | width | 16 | 8 | 0– |
| 4 | width | 24 | 12 | 0– |
Table 3.
Comparison of absorbed storage by different marker types.
| Marker Type | Storage (Kilobyte) | Presentation Quantity |
|---|---|---|
| 8 bits binary number | 1 | 1 |
| 12 bits binary number | 1.5 | 1 |
| 600 × 1200 24-bit color image | 1 | |
| 600 ×1200 32-bit color image | 1 | |
| 600 × 1200 48-bit color image | 1 |
Table 4.
Processing speeds vs. left/right image resolution.
| Disparity Range | |||
|---|---|---|---|
| Left/Right Image Resolution | 32 pixels | 64 pixels | 128 pixels |
| 235,000 pixels | 56 fps | 37 fps | 25 fps |
| 353,000 pixels | 35 fps | 24 fps | 18 fps |
| 525,000 pixels | 24 fps | 17 fps | 12 fps |
Table 5.
Respective cube vertex coordinates in 2D and 3D.
| Vertex | 2D Coordinate [x, y] | 3D Coordinate [U, V, W] |
|---|---|---|
| Bottom close left | [0, 0] | [0, 0, 0] |
| Bottom close right | [10, 0] | [10, 0, 0] |
| Bottom far left | [0, 10] | [0, 10, 0] |
| Bottom far right | [10, 10] | [10, 10, 0] |
| Top close left | [0, 0] | [0, 0, 10] |
| Top close right | [10, 0] | [10, 0, 10] |
| Top far left | [0, 10] | [0, 10, 10] |
| Top far right | [10, 10] | [10, 10, 10] |
Table 6.
Quality of decoded bar-codes affected by changes in brightness and contrast.
| Brightness | Detected Number | Correctness | Contrast | Detected Number | Correctness |
|---|---|---|---|---|---|
| +100 | 29,984 | Yes | +50 | 29,984 | Yes |
| −100 | 29,984 | Yes | −50 | 29,984 | Yes |
| +200 | 29,984 | Yes | +100 | 29,984 | Yes |
| −200 | 29,984 | Yes | −100 | 29,984 | Yes |
Table 7.
Quality of decoded bar-codes affected by scaling of images.
| Size | Detected Numbers | Correctness | Size | Detected Number | Correctness |
|---|---|---|---|---|---|
| 600 × 600 | 29,984 | Yes | 300 × 300 | 29,984 | Yes |
| 500 × 500 | 29,984 | Yes | 200 × 200 | 29,984 | Yes |
| 400 × 400 | 29,984 | Yes | 150 × 150 | 25,876 | No |
Table 8.
Quality affected by noises, blurs, and raindrops.
| Noise | Detected Numbers | Correctness | Rain Drops | Detected Numbers | Correctness |
|---|---|---|---|---|---|
| +20 | 29,984 | Yes | 1 iteration | 90.3% | Yes |
| +40 | 29,984 | Yes | 2 iterations | 88.7% | Yes |
| +60 | 29,984 | Yes | 3 iterations | 87.3% | Yes |
| +80 | 29,984 | Yes | 4 iterations | 85.5% | Yes |
© 2017 by the authors. Licensee MDPI, Basel, Switzerland. This article is an open access article distributed under the terms and conditions of the Creative Commons Attribution (CC BY) license (http://creativecommons.org/licenses/by/4.0/).
Share and Cite
MDPI and ACS Style
Le, H.; Nguyen, M.; Tran, H.; Yeap, W. Pictorial AR Tag with Hidden Multi-Level Bar-Code and Its Potential Applications. Multimodal Technol. Interact. 2017, 1, 20. https://doi.org/10.3390/mti1030020
AMA Style
Le H, Nguyen M, Tran H, Yeap W. Pictorial AR Tag with Hidden Multi-Level Bar-Code and Its Potential Applications. Multimodal Technologies and Interaction. 2017; 1(3):20. https://doi.org/10.3390/mti1030020
Chicago/Turabian StyleLe, Huy, Minh Nguyen, Huy Tran, and Wai Yeap. 2017. "Pictorial AR Tag with Hidden Multi-Level Bar-Code and Its Potential Applications" Multimodal Technologies and Interaction 1, no. 3: 20. https://doi.org/10.3390/mti1030020