Strengthening Engagement in Science Understanding with Learning Trails
by
 ,
,
Wolfgang Leister
1,* ,
,
Ingvar Tjøstheim
1,
Göran Joryd
2,3,
Jan Alfred Andersson
4 and
Håvard Heggelund
4 1
Norsk Regnesentral, Postboks 114 Blindern, 0314 Oslo, Norway
2
Expology AS, Sagveien 23F, 0459 Oslo, Norway
3
Museum of Cultural History, Postboks 6762 St. Olavs plass, 0130 Oslo, Norway
4
Norwegian Museum of Science and Technology, Kjelsåsveien 143, 0491 Oslo, Norway
*
Author to whom correspondence should be addressed.
Multimodal Technol. Interact. 2019, 3(3), 48; https://doi.org/10.3390/mti3030048
Submission received: 14 May 2019
/
Revised: 28 June 2019
/
Accepted: 30 June 2019
/
Published: 3 July 2019
Abstract
:The Norwegian Museum of Science and Technology has developed a learning concept for school classes in science centres named “learning trails”. In this concept, groups of students perform a series of thematically related experiments with installations in the science centre. The learning trails are designed to support the generic learning outcomes for science centre visits. We argue that the previously developed Engagement Profile can be used to translate exhibit properties into both media forms and generic learning outcomes for such learning concepts. Further, we implemented the learning trails in two modes: one mode used paper-based content to guide the students, while the other mode supported the use of tablet PCs where engaging content is triggered when the students approach the location of an experiment in the learning trail. We studied the engagement factors of the learning trails and observed how school classes use these. In a study with 113 students from lower secondary school (age 16), they answered short questionnaires that were integrated into the implementation of the learning trails. While the concept of the learning trails was evaluated positively, we could not find significant differences in how engaging the two implemented modes were.
1. Introduction
Science centres are informal learning environments [1] that offer exhibits supporting free-choice learning, as well as specific programmes for organised school class visits. We sought to explore to what degree such learning programmes engage students and find means to strengthen the engaging factors of an exhibit [2].
The Norwegian Museum of Science and Technology (NTM) introduced the concept of learning trails around science centre installations grouped thematically. The learning trails combine physics experiments with technology history from the exhibitions in the science centre. The motivation for this is to foster learning from using these installations and to create dialogues and narratives [3] that explain science phenomena. The activities of the learning trails are designed for groups of up to four students at a time.
The objective of this paper is to explore how the elements in the learning trail concept can be used to create engaging content that supports learning activities in science centres. NTM wanted to obtain evidence alongside two research questions:
- (RQ1)
- (RQ2)
- What is the impact of presenting location-based content on a tablet PC versus a paper-based version of the learning trails? We hypothesised that the location-based content would be more engaging than the paper-based version. To study this, we implemented a prototype that presents content upon arrival at an experiment, using unobtrusive and affordable in-door location technology. Further, we evaluated the learning trails in an empirical study with students from secondary school classes (tenth grade, age 16).
Our work does not intend to measure the direct learning outcomes from science centre visits that may last some few hours in a school class setting. The outcomes of such learning experiences are diverse and may be short and long term. They include increased knowledge and understanding, development of new skills, abilities or inspiration to learn more, and to reinforce the knowledge that learners already have [4]. Instead, our work is based on engagement as a construct that is positively related to learning outcomes [5].
In the following, we present an overview of related work including a review of learning outcomes, the Engagement Profile, and location technology in museums and science centres (Section 2), before we show how to translate the Engagement Profile to terms related to media forms and learning outcomes (Section 3). Thereafter, we present the concept of the learning trails and their implementation (Section 4) and develop the Engagement Profile s for the learning trail concept and the single experiments, before deriving their related media forms and relation to the GLO (Section 5). Section 6 presents an empirical study where the prototype of the learning trails was evaluated with students from secondary school classes. Section 7 concludes our essay.
2. Related Work
We focus on school classes visiting science centres as the main target group for our work. As these students may have diverse learning agendas and prefer diverse ways of learning (such as reading, interacting with others, touching and doing) [4], science centres offer a diversity of exhibits that can be explored during the visit. Science centres such as NTM have the ambition that the design of their exhibits [6] should address factors such as learning outcome, learning styles, levels of engagement, and context.
As an informal learning environment [1], science centres offer free-choice learning [7,8], i.e., visitors can choose which activities to participate in and they can leave at any time. However, in connection with school class visits, the use of certain installations can be made mandatory when topics from the curriculum shall be practised in depth.
In the literature, the majority of evaluations in science centres deal with the assessment of learning, often using a longitudinal approach [9], i.e., observing a subject or installation over time. Šuldová and Cimler [10] suggested that engagement can be assessed more instantaneously and be used as a part of learning assessment, supporting Sanford’s [11] claim that “some compelling evidence links visitor engagement to learning”. Engagement as a construct is positively related to learning outcomes [5].
2.1. Observing Experience in Science Centres and Museums
We classified the approaches to study engagement into a visitor-centric (observing visitors) versus an installation-centric view (assessing properties of exhibits) (Leister et al. [2], p. 51)). Visitor studies have been performed since the late nineteenth century when Higgins [12] mentioned that observations of visitors and asking them for remarks might lead to valuable information. Lindauer [13] presented a historical perspective of methodologies and philosophies of exhibit evaluations, mostly mentioning counting and time-measurement.
According to McManus [14], the visitor instead of the artefact has been the focus in visitor studies since the 1980s. These visitor studies included demographic characteristics and segmentation, behavioural and knowledge gain studies, and visitor-focused studies. Yalowitz and Bronnenkant [15] gave a review of methodologies for timing and tracking visitors in exhibitions, including advice on how to perform assessments of visitor behaviour. Various methodologies have been developed to examine the behaviour of visitors in detail [16,17,18,19].
Dierking and Falk [20] presented the Interactive Experience Model, which is a visitor-centric model. They defined the interactive experience influenced by three contexts:
- (a)
- personal context;
- (b)
- physical context; and
- (c)
- social context.
Falk and Storksdieck [21] used the principle of identity-related motivation to place visitors into five identity types:
- (1)
- the explorer;
- (2)
- the facilitator;
- (3)
- the professional and hobbyist;
- (4)
- the experience seeker; and
- (5)
- the spiritual pilgrim.
Variables, such as prior knowledge, experience, interest, visitor agenda, and social group are encapsulated in these identity types. This line of research has been further studied [22,23].
Barriault and Pearson [24] presented frameworks that analyse the learning experience near instantaneously by identifying learning-specific behaviour observed by cameras and microphones installed within an installation. Šuldová and Cimler [10] refined these methods but still depended on manual analysis.
In longitudinal visitor studies, observations and sense-making [25] are often used. Sense-making describes qualitative mental models, understanding events, and an iterative approach to interpreting situations (e.g., the data/frame theory of sense-making [26,27]). In contrast, we were interested in concrete measurements and quantitative and descriptive data based on machine-retrievable data and questionnaires that allow us to get an instant result.
In the installation-centric view, the science centre assesses installations rather than the visitors. The developers of installations need to consider the aspects of attractiveness, usability, being educational, etc. Shettel et al. [28] presented an installation-centric approach where they evaluated exhibits by means of visitor observations and questionnaires using the technology available at the time, such as videotape recordings. They observed how visitors behave toward installations to determine how effective an exhibit was. Alt and Shaw [29] presented a study where visitors characterise installations using a list of phrases, both positively and negatively loaded. The phrases mentioned most often are then compared with the goals of the museum to identify where the installations can be improved.
2.2. Learning Outcomes in Science Centres
Learning outcomes in science centres are difficult to specify and to measure, even if we consider the compulsory participation of school children. The pedagogical tool Generic Learning Outcomes (GLO) [4] describes the impact of learning in museums in terms of
- (a)
- knowledge and understanding;
- (b)
- skills;
- (c)
- change in attitudes and values;
- (d)
- enjoyment, inspiration and creativity; and
- (e)
- activity, behaviour and progression.
These five aspects cannot be used as guidelines to control the design process of exhibits, as these aspects are yet unrelated to design properties. However, we note that design and implementation elements will have a considerable impact on the GLO. Therefore, we seek a way to predict how changes in design and implementation will affect the GLO.
Brown [30] remarked that the GLO are subjective, do not measure learning directly, and are most effective as post hoc measures, that is, after the learning experience. He suggested consulting Laurillard’s taxonomy of educational media [31] that is based on the teacher’s concepts and constructed environment, and the student’s concepts and specific actions. The four kinds of activities in her framework are discussion, adaptation, interaction, and reflections. Unlike the GLO, Laurillard’s framework is not specifically developed for science centres, and adjustments for its use in science centre learning might be necessary.
In Laurillard’s framework, the related learning experiences and adjacent media forms (in parentheses) are:
- (i)
- attending, apprehending (narrative);
- (ii)
- investigating, exploring (interactive);
- (iii)
- discussing, debating (communicative);
- (iv)
- experimenting, practising (adaptive); and
- (v)
- articulating, expressing (productive).
In the exhibits, all five learning experience types and media forms are present in science centre learning to a varying degree. In science centres, experimenting and practising, as well as investigating and exploring are the most prevalent forms of experiences, while specific concepts, such as the learning trails, can extend learning to other learning experience types.
Therefore, we wanted to elaborate to which degree Laurillard’s framework can be applied to exhibits in science centres. Notice that the works by Laurillard [31] and by Brown [30] were published before many of the current media technologies were introduced in science centres; thus, the methods and technologies described there might be somewhat outdated and could need adjustment.
The GLO are used as a basis for evaluations in science centres and museums. For instance, Ayudhya and Vavoula [32] used the GLO to guide the design of questions about the outcomes in an assessment of a mobile app used by families in a science museum. In their analysis, they encoded observations captured on video according to the attention-value model by Bitgood [33], which comprises the actions: capture, focus, and engage (and an extra class: engage together [32]). Visitor observations and encoding activities belong to the visitor-centric view of assessment. In contrast, we focused on the installation-centric view described above.
2.3. Quantitative Evaluation of User Engagement
Behavioural engagement is one of the factors that have a positive correlation to achievement-related outcomes (cf. [5] p. 70ff). In informal learning arenas, this implies that engaging exhibits and installations will foster better learning outcomes than exhibits that do not engage.
To evaluate how engaging installations are, the Engagement Profile [2] has been used alongside with sensors, observations, and questionnaires to measure engagement and user satisfaction. The Engagement Profile has been applied to the design process at museums and science centres [6], to analyse engagement and narratives for installations [3], and to develop a robotic teaching assistant for students at a university college [34].
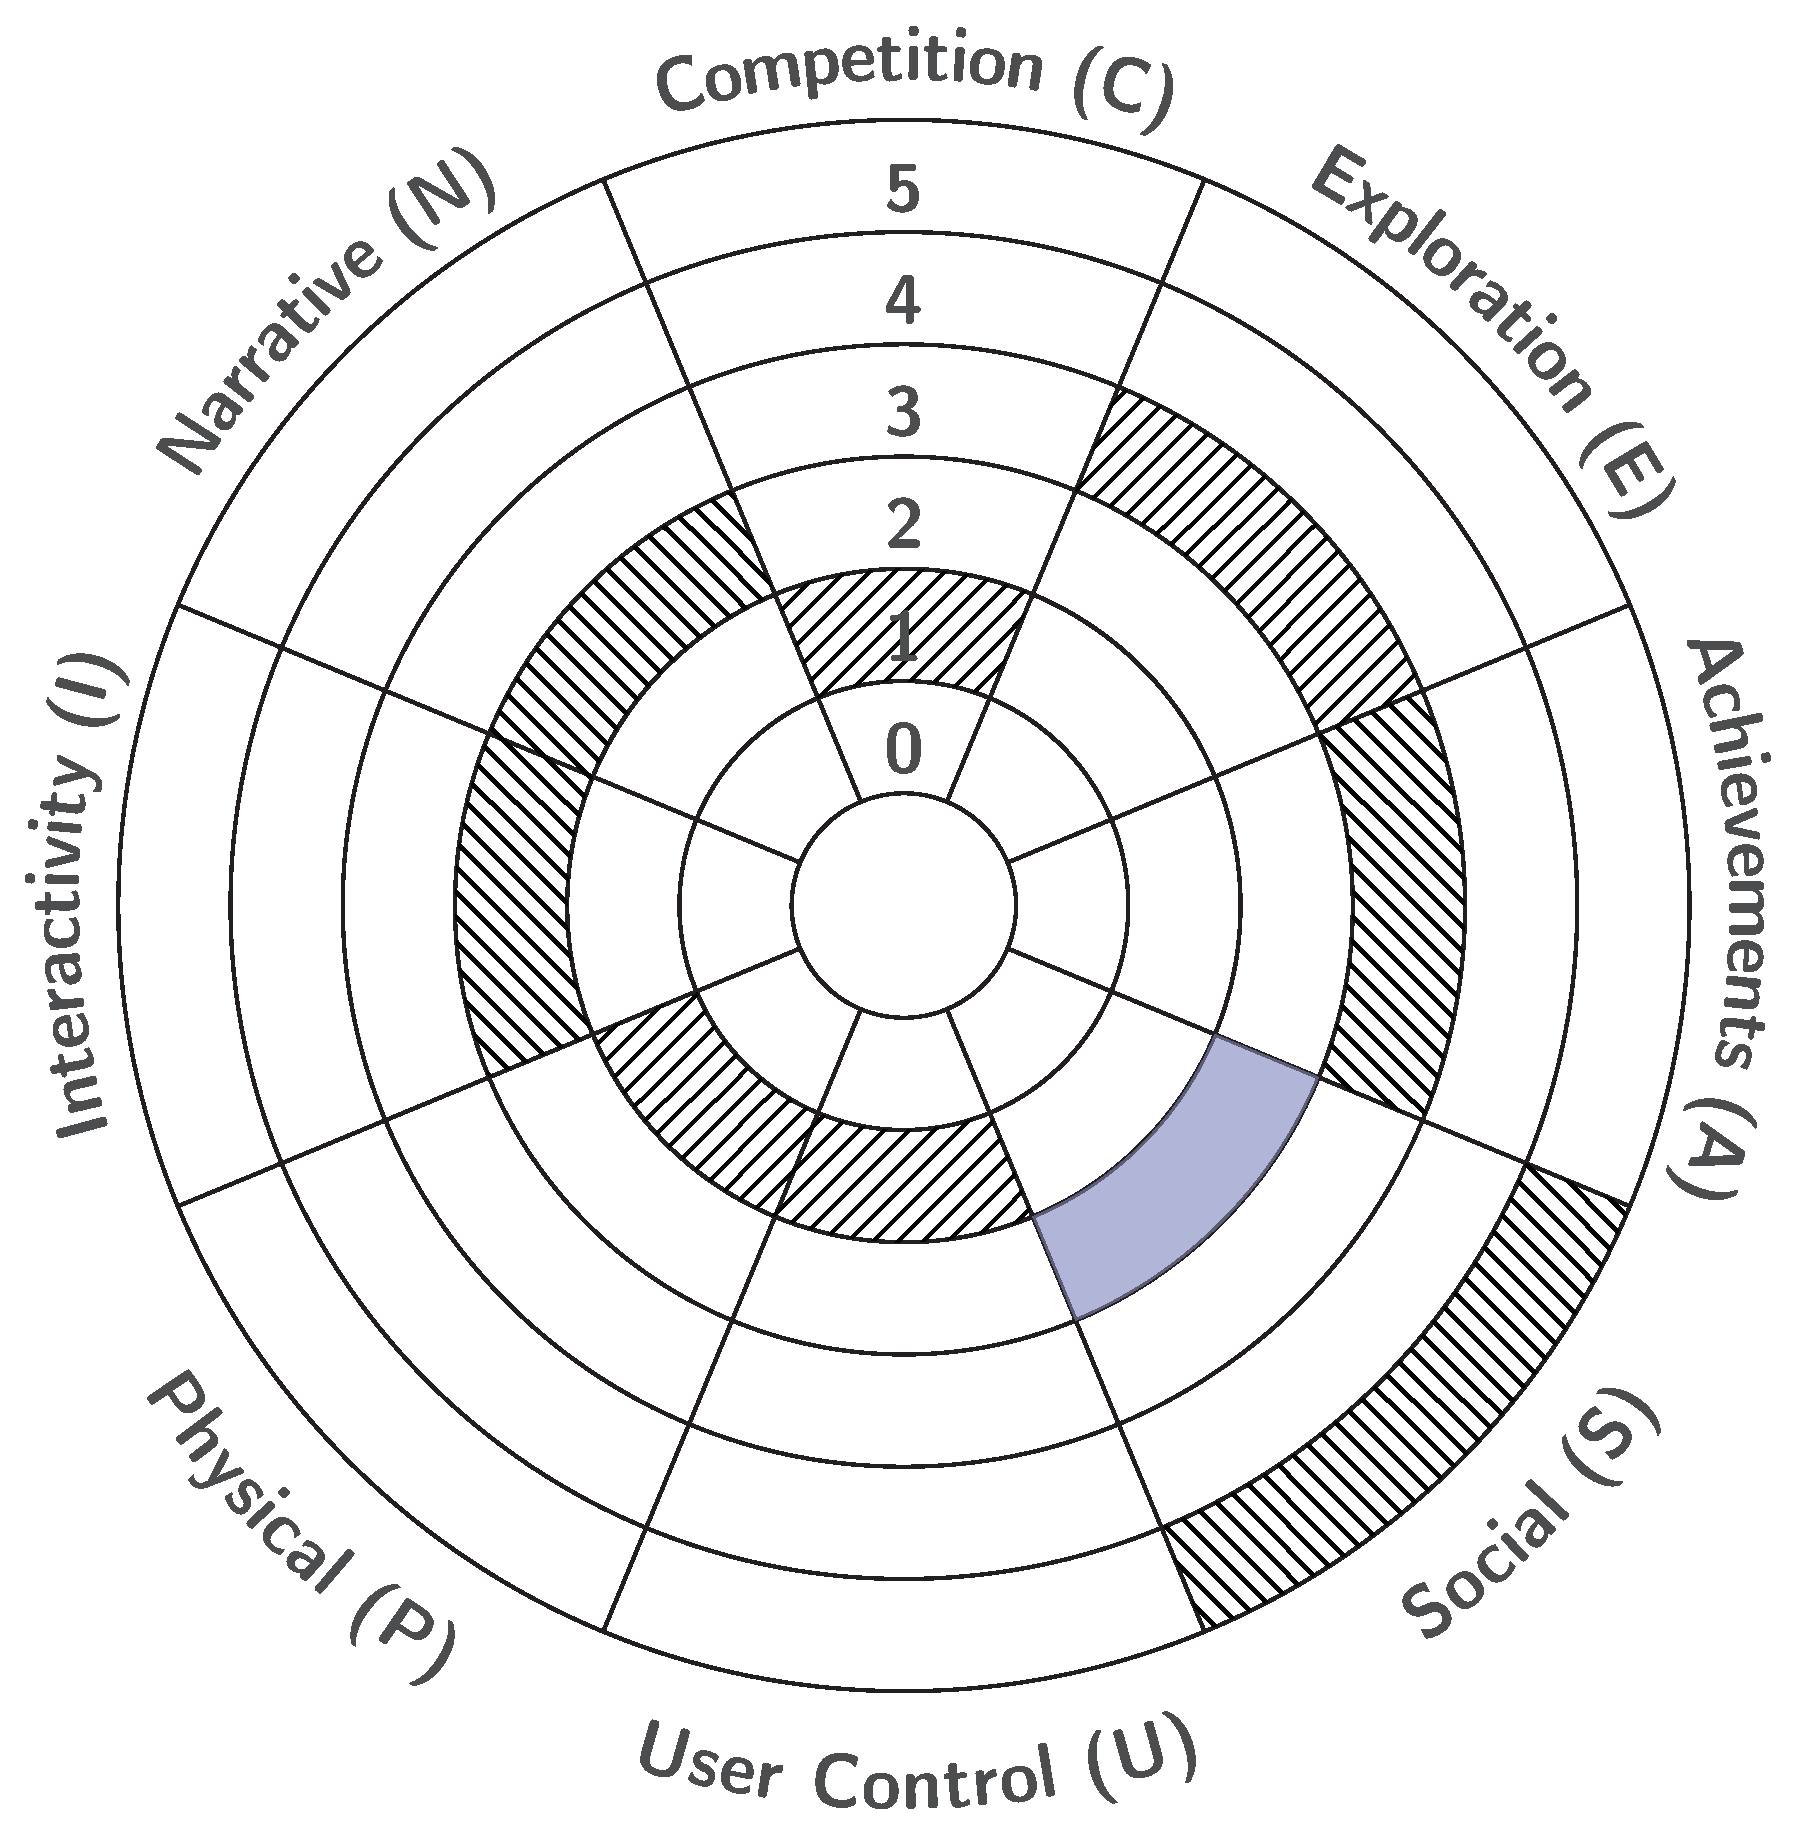
The Engagement Profile quantifies the characteristics of installations along eight dimensions, each of which is given a value between 0 and 5. The dimensions of the Engagement Profile represent the degrees of: competition (C); narrative elements (N); interaction (I); physical activity (P); user control (U); social aspects (S); achievements awareness (A); and exploration possibilities (E). A graphical presentation of the Engagement Profile is shown in Figure 1 as a reference.
External influences are not taken into account in the Engagement Profile since these are not properties of the direct learning environment. Physical factors, such as noise, light, or smell, could play a role in the perception of engagement, but need to be handled outside of the Engagement Profile. Properties that belong to the context, such as social factors, institutional factors, or recent incidents personally or globally are excluded. However, these factors still need to be taken into account in the assessment process, e.g., as suggested in the framework for the design of experience-centred exhibits (DEX) [35].
2.4. Location-Based Systems in Science Centres and Museums
Location-based systems can offer tailored content to the visitors, as well as being part of visitor studies and exhibit evaluations [13]. Several authors (e.g., [36,37]) suggest to adapt content to the visitor’s current situation or to adjust the visiting path using online tracking. In our approach, we used online tracking to trigger engaging content based on the location of the visitor.
Location-based systems can be used to retrieve viewing times, itinerary, speed, group behaviour, and so on. Yalowitz and Bronnenkant [15] presented methods for visitor tracking and timing in museums. They classified the variables to be recorded into:
- (a)
- stopping behaviour;
- (b)
- other behaviours;
- (c)
- observable demographic variables; and
- (d)
- situational variables.
Further, they addressed practical issues, technology, and ethics to collect, analyse, and interpret these variables.
Baldwin and Kuriakose [36] presented several technologies for tracking visitors. Tracking data are used:
- (a)
- to predict a visitor’s future path in the museum;
- (b)
- to recommend exhibits of potential interest to the visitor; and
- (c)
- to personalise content delivered to visitors.
They also explored the impact of physical proximity and visitor gaze on exhibit engagement.
Yoshimura et al. [38] presented a study where they used Bluetooth proximity data of visitors’ smartphones to measure the visitors’ transition between places in a museum. Moussouri and Roussos [39] discussed cultural itineraries of visitors and present a study where outdoor tracking devices are used to extract the paths of visitors in the London zoo. Further, Moussouri and Roussos [40] proposed a methodology for representing location-based data collected by the use of smart-phones. They presented three ways:
- (a)
- trail-based representation;
- (b)
- functional representation; and
- (c)
- statistical distributions of displacement.
The prediction of visitor’s sentiments and future behaviour can be based on current observations. Parsons et al. [37] suggested using viewing times as an indicator of preference, and they proposed a recommendation system based on this idea. Bohnert and Zukerman [41] used viewing times to predict interest. They proposed non-intrusive personalisation of the museum experience based on viewing times of previous visitor behaviour and evaluated two prediction approaches.
Besides outlining exhibit design approaches and strategies, Bitgood [42] presented three types of visitor measures of success:
- (a)
- behaviour measures including stopping (attracting power), viewing time (holding power), social impact, human factors impact, and trace or decay measures;
- (b)
- knowledge acquisition (memory and comprehension); and
- (c)
- affective measures (attitude change, interest level, and satisfaction).
2.5. Indoor-Location Technologies
In-door location can be used both for analysis and to adapt and control the stream of content to the visitor. Mautz [43] presented a variety of indoor-tracking systems based on ample technologies. One can employ infrastructure-free technologies (WiFi, geomagnetic, and sound signals) or infrastructure-based technologies (RF-beacons, RFID, infrared, ultrasound, Bluetooth, short-range FM transmitters, lights, and magnetic signal modulators) [44]. To track mobile phones in museums, technologies such as the Temporary Mobile Subscriber Identity (TMSI), Bluetooth, and WiFi can be employed [45]. We have also seen location approaches based on QR-codes and camera-based tracking [46]. In our implementation, we decided to use beacons based on Bluetooth Low Energy (BLE). Although infrastructure-based, this beacon technology is commercially available, relatively cheap to install, gives suitable accuracy, and, once switched on, the user does not need to interact with the location functionality.
3. Relating the Engagement Profile to Generic Learning Outcomes and Media Forms
Engagement in science centres is strongly related to learning outcomes [4]. Engagement depends on how students use the installations within the context of their science centre visit and how the installations and activities are designed. As outlined above, the GLO defines the outcomes of a science centre visit, while Laurillard’s taxonomy qualitatively describes activities and media forms for learning. In contrast, the Engagement Profile describes the properties of exhibits quantitatively.
We posit that the implementation of an exhibit, characterised by the Engagement Profile, supports the GLO through the student’s activities in the science centre and that the media form can be described by the Engagement Profile. To support this claim, we related the terms of Laurillard’s taxonomy to the terms used in the Engagement Profile. Further, we defined thresholds that indicate which media forms an exhibit has out of the characteristics of the Engagement Profile.
To relate these terms, we used the description of the media forms, adapted from the work by Brown [30] as a starting point. Further, we used the description of the Engagement Profile (see Figure 1 for the graphical short form or the textual description in ([2] p.56, Table II)). For each of the five media forms, we checked the 48 terms of the Engagement Profile to evaluate whether these terms are compatible with the description of the media forms. A dimension was presumed to have an impact on the choice of the media form when the evaluation of a dimension’s fields resulted in different outcomes. For instance, this could be the case when low values suggested a specific media form, while high values did not.
This process of checking the term compatibility resulted in Figure 1, which outlines the relationship between the Engagement Profile and Laurillard’s framework. We give the following rationale to match the media forms with the Engagement Profile:
- Narrative media forms are described to be linear, highly structured, and non-interactive. To fit into the narrative media form, most values of competition, interactivity, user control, social, and exploration possibilities in the Engagement Profile need to be rather low, i.e., between 0 and 2. Values above the threshold of 2 need to be considered regarding their impact from case to case. Interestingly, the entire range of the narrative-dimension applies to the narrative media form.
- Interactive media forms allow learners to explore in a non-linear way, but the content remains unchanged. This description aligns with high values of interactivity, exploration possibilities, and user control in the Engagement Profile; however, the highest values for these three variables are not suitable.
- Communicative media forms support feedback and foster discussions. High values of the social dimension are compatible with this, while the other dimensions do not seem to have an impact.
- Adaptive media forms adapt responses to the student’s actions. This is supported by high values of interactivity, exploration possibilities, and achievements awareness, as well as medium-high or high values of user control and competition in the Engagement Profile.
- Productive media forms are tools where learners can express themselves to demonstrate their understanding. This implies high values of the competition, narrative, interactivity, user control, and social dimensions in the Engagement Profile.
In conclusion, this resulted in the following findings: The variables for competition, interactivity, user control, and exploration possibilities in the Engagement Profile have an impact on the narrative, interactive, and adaptive media forms. We also observed that the productive media form requires several high values in the Engagement Profile (including the narrative dimension). Further, the physical dimension in the Engagement Profile appeared to be irrelevant to indicate the media form as defined by Laurillard’s framework.
By identifying which values of the Engagement Profile suited the description of the media forms, we were able to set up conditions for which media form a given exhibit potentially can have. These conditions and their respective thresholds are summarised in Table 1. Our reflections thus far were done by comparing descriptions of the frameworks, without considering the learning trails that we introduce in the next section, before analysing them.
4. Learning Trails
The learning trails at NTM are designed for school classes. They combine physics experiments with technology history from the exhibitions, grouped thematically. To increase the learning effect, these installations are intended to create a wider dialogue and narratives that explain science phenomena. From the perspective of the GLO, increased knowledge and understanding are the most important outcomes, while the visit to the science centre shall be enjoyable and inspiring.
NTM has organised learning objectives for topics that have been discussed in class before the museum visit. Further, the museum also expected that students understand the task better when they, additionally, can listen to content from an audio file.
As in many science centres, noise from school classes in the exhibition area can be annoying. To reduce the noise level, the learning trails have been designed so that the single experiments and tasks are performed at different locations in the museum.
4.1. Concept of the Learning Trails
The learning trails are designed for self-experience in small groups of up to four students, led by the teacher. The total activity in a learning trail is meant to last less than 30 min. Upon arrival, the students are divided into groups of up to four. Each group receives a set of experiments that the members of one group shall solve together. These experiments take place in the exhibition of the science centre and are related to exhibits (e.g., objects, boards, and pictures), installations, and areas where the necessary ingredients for the experiment are available.
Each group needs at least one smart device (smartphone or tablet PC) with the possibility to use Bluetooth for interaction with the beacon technology that provides the location service. The smart devices are used to present tasks and extra content. Alternatively, tasks and content can be handed out on paper.
The learning trails are compatible with the Bring Your Own Device (BYOD) paradigm, so that science centres do not need to distribute these devices to visitors. However, NTM can provide such devices for school classes to avoid compatibility problems, as students might not have their own device or bring devices that are incompatible with the science centre’s content and services.
During their visit to the science centre, each group performs the given tasks and experiments at the stations of the learning trail. Afterwards, all students participate in a Kahoot! quiz. In our context, we used Kahoot! [47,48,49] as a game-based quiz tool in a classroom setting with the purpose of repetition and assessment on the students’ own devices.
4.2. Implementation of the Learning Trails
Thus far, NTM has developed three learning trails that offer content on the physical phenomena of forces, sound, and light. Each learning trail has been implemented in two modes:
- (I)
- the learning trail is paper-based, i.e., instructions to the participants are printed on laminated cards; and
- (II)
- the learning trail and its content are available on a device such as a smart-phone or tablet PC. This device automatically pushes instructions and extra content (such as illustrating videos and audio) to the participants. The content is triggered as soon as the students approach the location of the respective experiment of the learning trail.
The indoor-localisation technology was implemented using beacons that are based on Bluetooth Low Energy (BLE). At each location of a learning trail experiment, one beacon is placed. Actions are triggered by the proximity of the device (smartphone or tablet PC) to the respective beacon. The proximity level is classified into five zones (A–E) using the following thresholds: A: ; B: ; C: ; D: ; and E: above. Depending on characteristics of the installation, we assume that a participant is close by when being in Zone C, but for some exhibits Zone B is more appropriate. This can be configured per exhibit.
While the student groups perform the learning trails, the students’ devices check the beacon proximity about once every second. Notice that too high sampling rates could drain the device for battery power.
4.3. The Experiments of the Learning Trails
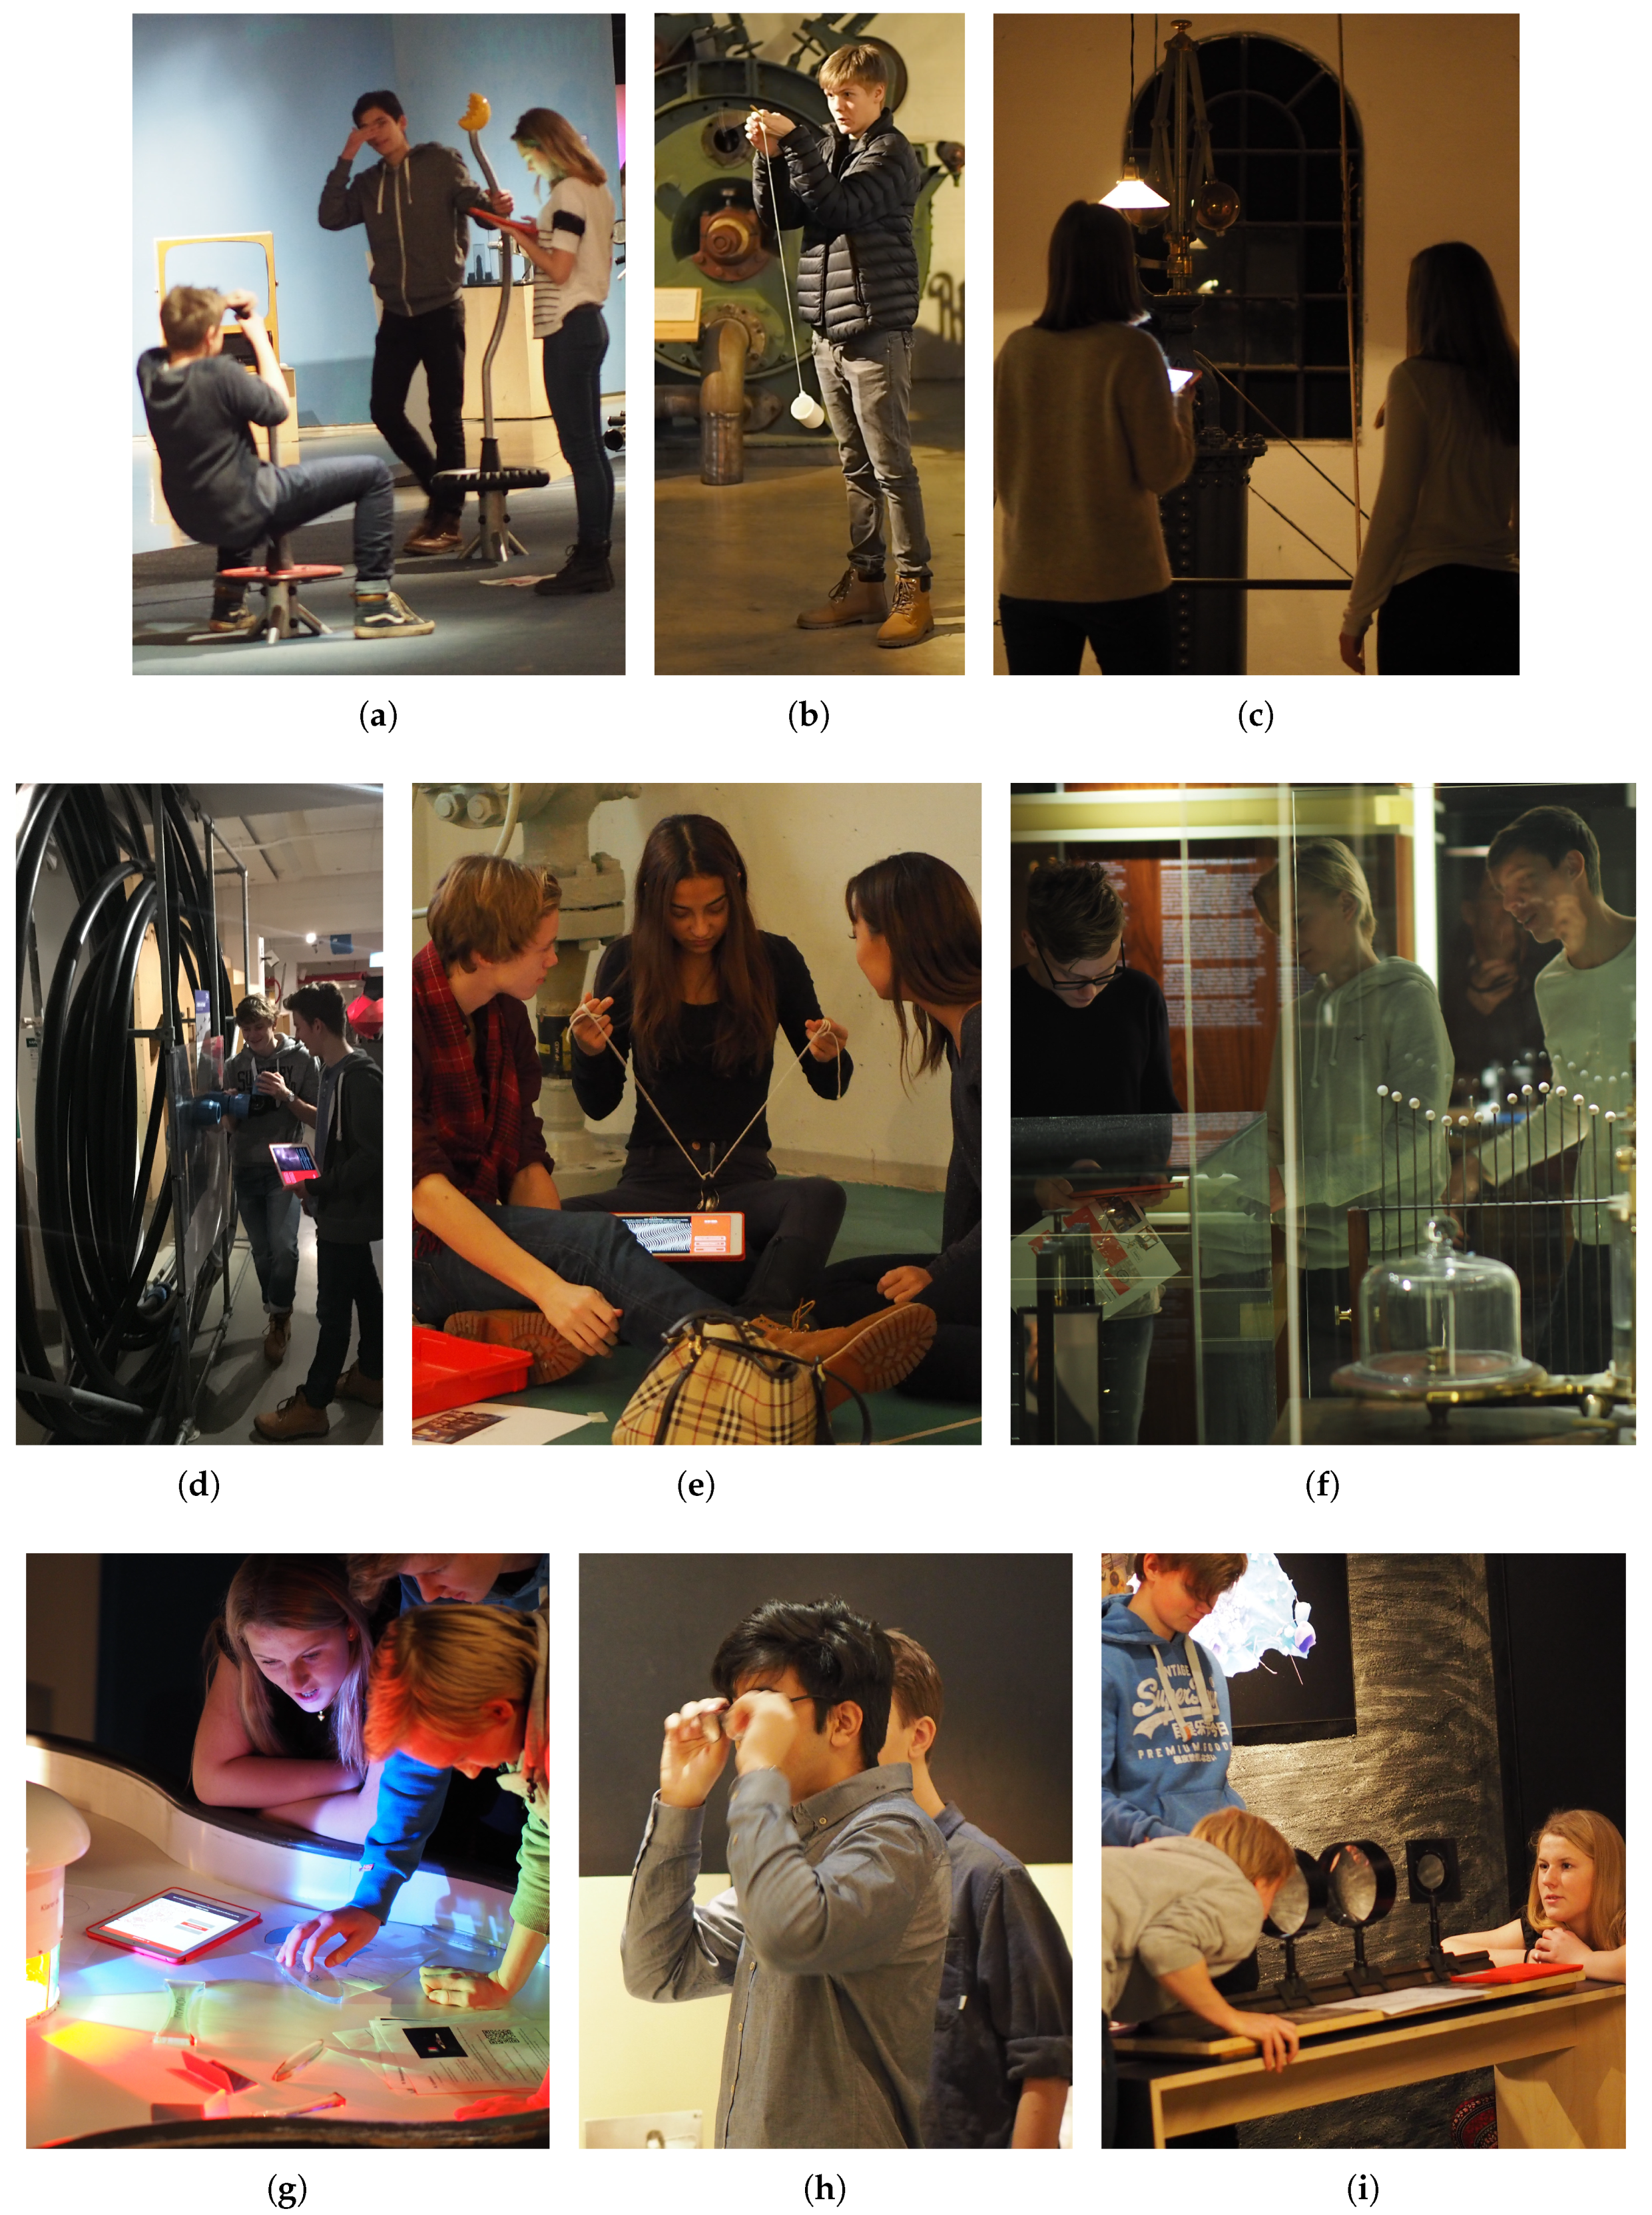
Each learning trail consists of three experiments, which are performed according to a pre-defined schedule. In total, nine experiments have been developed, each of them described as a sequence of presentations, questions, and experiments to be performed by the student groups. The experiments include discussions in a group to reflect on the topic of the respective experiment. Table 2 gives a short overview of these experiments, and illustrative photos taken during class visits are shown in Figure 2.
For the learning trail “Forces”, Pirouette is an installation that can be used to explore rotation movements. The students are asked to use the installation and change rotation speed through their body movements (Figure 2a). Cup is an experiment, where a cup is attached to a lace. Given the lace is led over a pencil and the cup is released, does it hit the ground? The students are asked to perform this experiment (Figure 2b). In a third experiment, the students watch and discuss a model of a centrifugal regulator (Figure 2c).
For the learning trail “Sound”, Thunder is an experiment where the students watch the video of a thunderstorm, and they count the seconds from when they see the lightning until they notice the sound of the thunder through a long pipe (Figure 2d). Spoon is an experiment where the students listen to two spoons hitting each other through air and through a lace as a transmission medium (Figure 2e). In the installation Vacuum Bell, a doorbell is installed under a cheese dome, where a pump can generate a vacuum. The students shall observe when they stop hearing the sound from the bell (Figure 2f).
5. Engagement Profile, Media Forms, and GLO of the Learning Trails
To analyse the learning trails, we considered the Engagement Profile of the generic learning trail concept separately from the Engagement Profile of each experiment. In practice, we overlaid the Engagement Profile of each experiment with the Engagement Profile of the generic learning trail. We also used the aforementioned translation in Table 1 to determine the media forms of the generic learning trail.
5.1. Engagement Profile of the Learning Trails
In Figure 3, we show the Engagement Profile of a generic learning trail. The values for each of the eight Engagement Profile dimensions were determined by considering which of the phrases in the description was best suited (see Figure 1). As this process was based on subjective considerations, we note the following: Since learning trails are usually performed in groups, we set the social dimension S = 5 (for a single visitor S = 2). Regarding the narrative dimension, the learning trails are structured sequentially without the possibility for the student to alter this. Thus, we set narrative and user control to N = 2 and U = 1, respectively.
5.2. Engagement Profiles for the Single Experiments
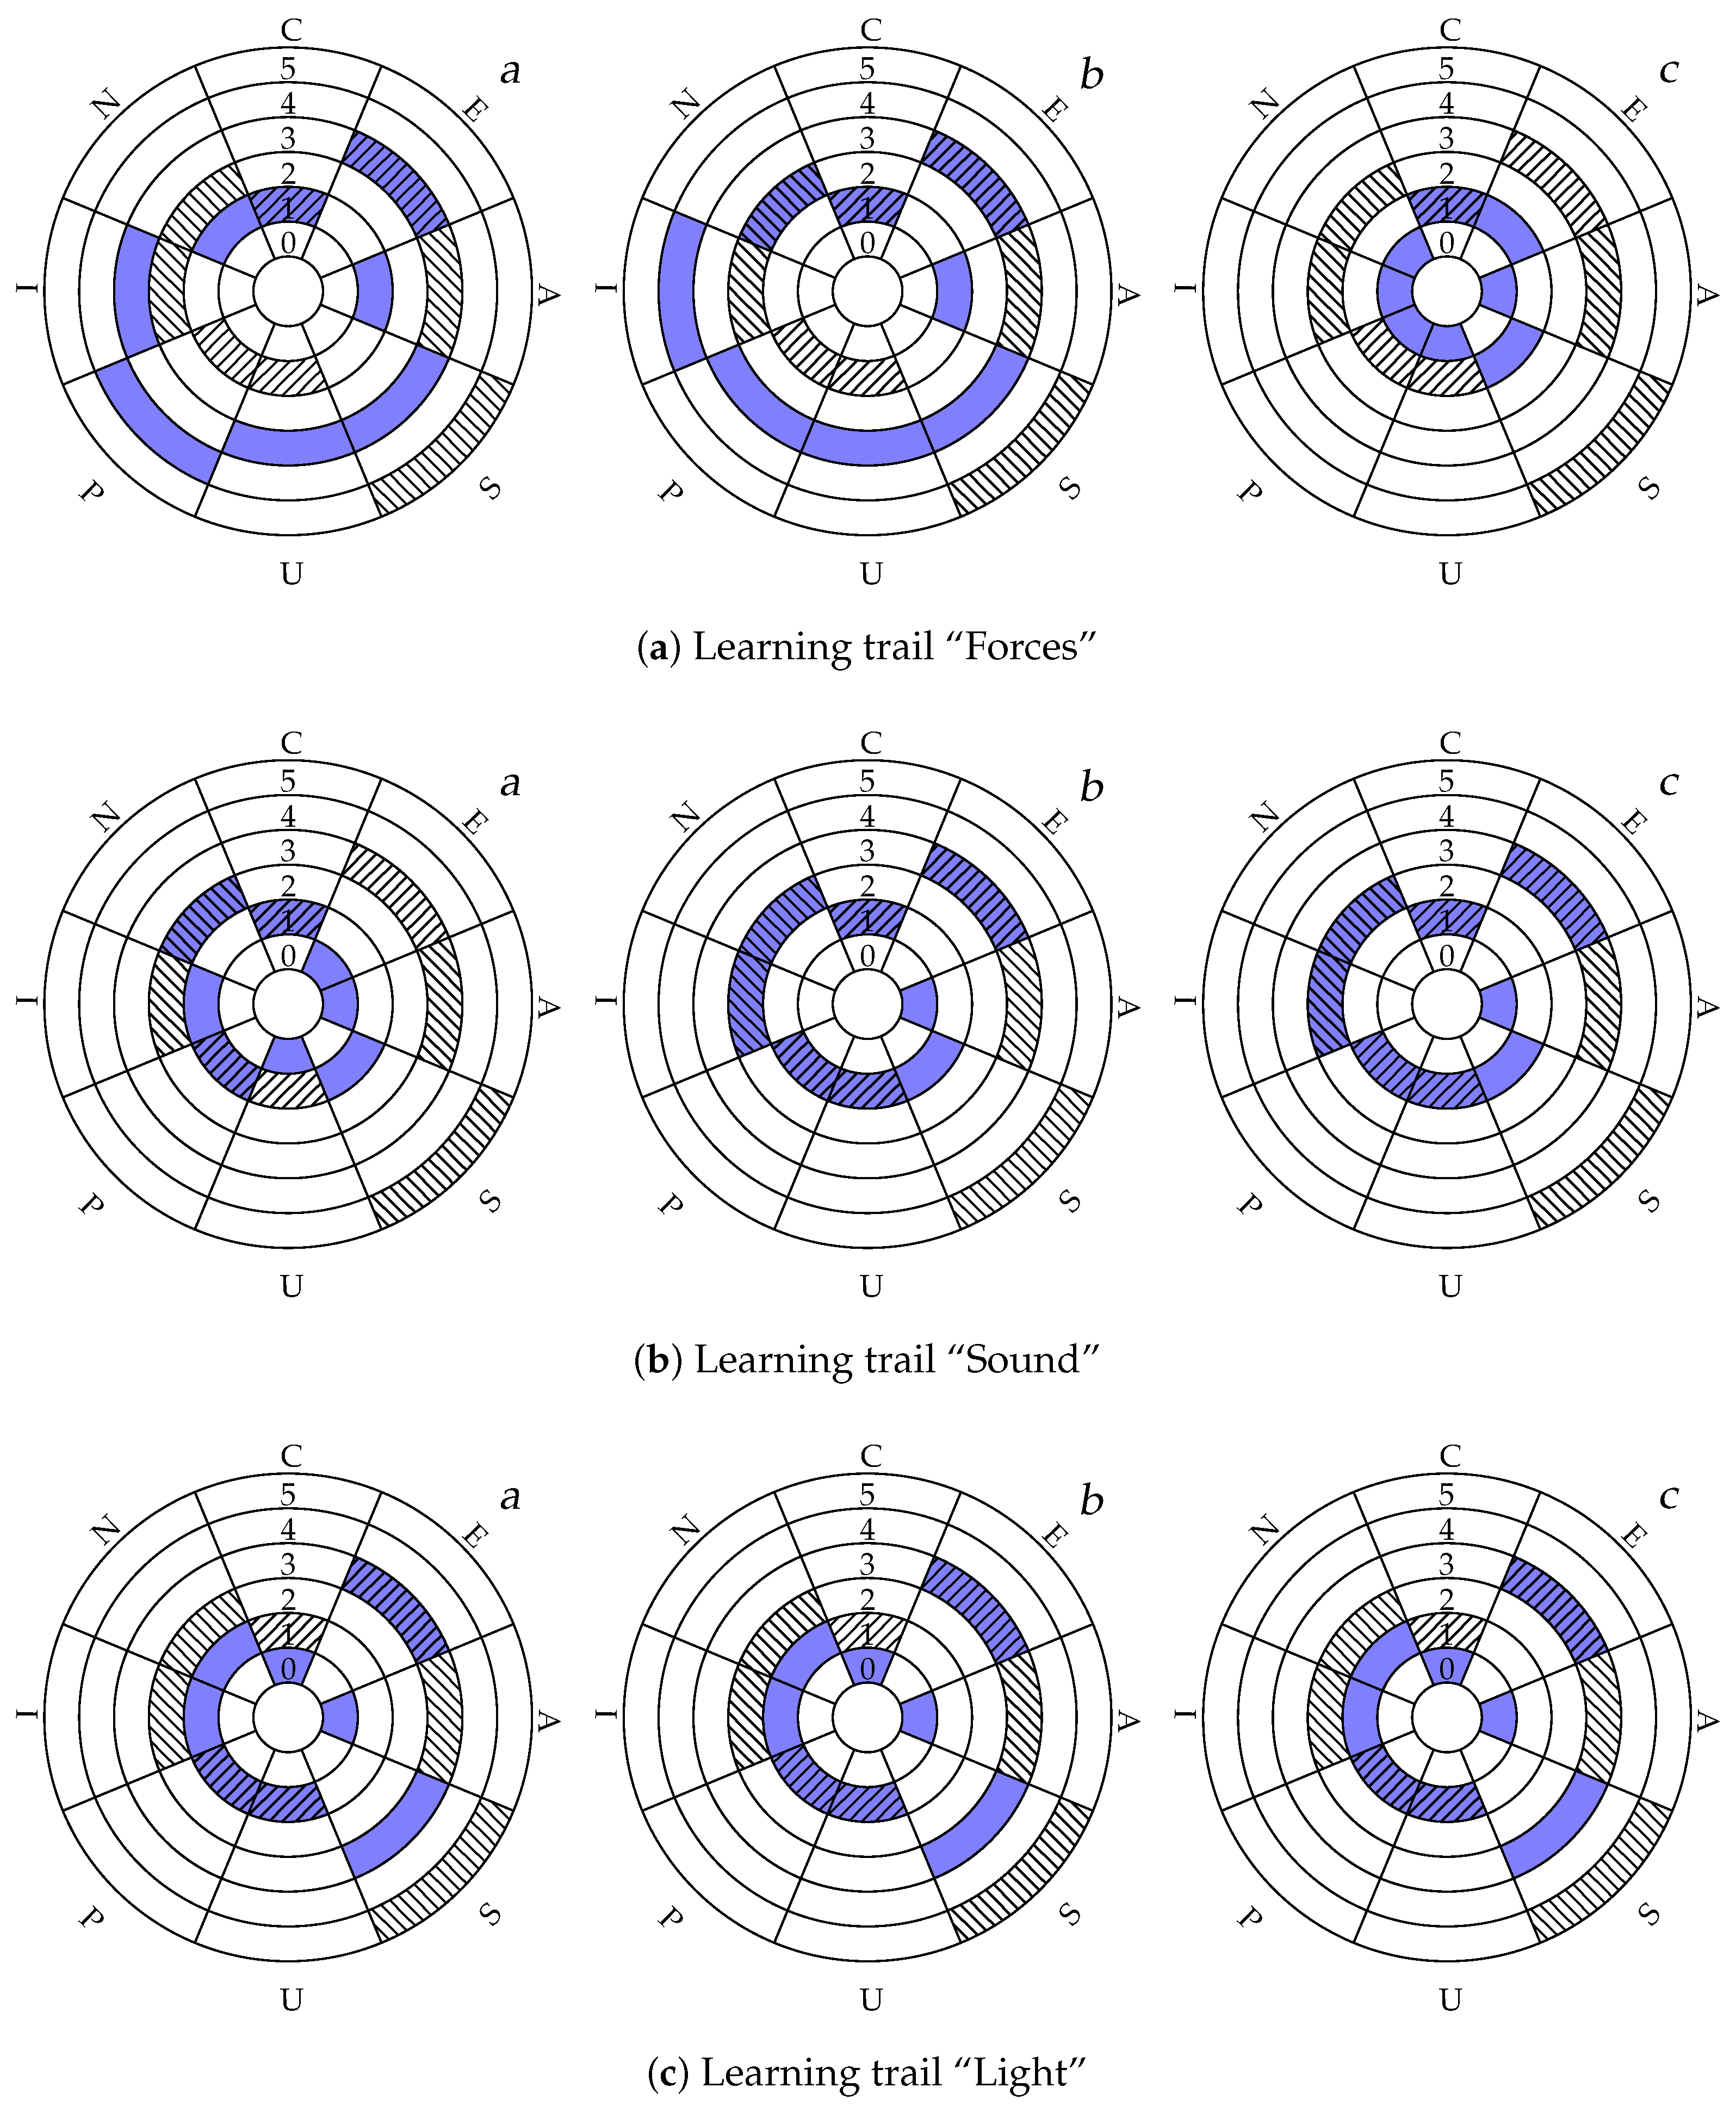
We created the Engagement Profile for all nine of the experiments by subjectively determining the phrase from Figure 1 that fits best. The charts for the experiments of the learning trails “Forces”, “Sound”, and “Light” are presented in Figure 4.
To determine the Engagement Profile for each experiment that is used in the context of the learning trails, we overlaid the Engagement Profile of the generic learning trail with that of each experiment. Note that some of the characteristics of a generic learning trail might be dominant over the individual rating. Thus, changing the characteristics of a single experiment might not have an impact. For instance, increasing the social dimension for an experiment might not have an impact, as the social dimension of the generic learning trail is already high.
5.3. Media Forms of the Learning Trails
Using the Engagement Profile of the generic learning trail and the translation conditions in Table 1, we determined the applicable media forms of the learning trail concept. Table 3 shows the outcome of this analysis, indicating with ✓ the conditions that applied and with ✗ those that failed. Unmarked entries do not contribute to the respective media form.
Note that not all values of the Engagement Profile are equally important, and considerations on the impact on each value need to be made. For instance, we considered the impact of the exploration possibilities dimension to be weak, as time constraints that apply for school class visits will not allow the students to explore the exhibits extensively (i.e., the duration of the visit is limited).
From the results in Table 3 we conclude that the narrative and the communicative media forms apply for the learning trails in their generic formation. However, when a learning trail is performed by a single student, the communicative media form does obviously not apply. Consequently, the concept of the learning trails supports predominantly the activities of attending, apprehending, discussing, and debating. Note, however, that the concept of the learning trails does not focus on debating as an activity, by design. Elements of investigating, exploring, and experimenting are present, but not predominantly. The activities of practising, articulating, and expressing are the least present, and we recognise that the learning trails are not designed for these activities.
The experiments in a learning trail can contribute to support media types that are not covered by the generic learning trails if the majority of the experiments trigger the translation conditions of Table 3. For instance, learning trails comprising of experiments with high values of interactivity, user control, and explore in their Engagement Profile can support the interactive media form.
5.4. Learning Trails and the GLO
To answer which of the GLO are supported by the learning trails, we revisit the descriptions of the five outcomes types [4]. For each of these, we reason whether these are supported by the description of the relevant media type or activity according to Table 1, by the description of the relevant Engagement Profile factors, or by potential findings of the study presented in the next section.
- Knowledge and understanding: Increase in knowledge and understanding is described as learning new facts or information, using prior knowledge in new ways, and coming to a deeper understanding. According to Table 3, activities of apprehending and investigating are supported by the generic learning trail, as well as discussing. Further, learning trails comprising of experiments with high values of interactivity and user control can support investigating and exploring. All these activities can increase knowledge and understanding, and we conclude that this type of learning outcomes is supported by the learning trail concept.
- Skills: Having a skill is described as knowing how to do something. The activities of practising, but also investigating, exploring, and experimenting are not predominant in the learning trails (Table 3). Although these activities might be supported by some of the experiments in a learning trail, the learning trail concept does not support this type of outcomes in general.
- Attitude and values: Change in attitudes and values is described as a change in feelings, perceptions, or opinions about self, other people and things, and the wider world. We consider the concept of the learning trails too generic to support this outcomes type in general. However, specific experiments in the learning trails might support this outcome.
- Enjoyment, inspiration, and creativity: This type of outcomes is described as the evidence of having fun or being surprised while using exhibits, as well as evidence of exploration, experimentation, and making. To get evidence for enjoyment, we borrowed findings from the study presented in the next section of this paper. We found that the mean value of the responses for “I liked the experiment”, “I want to repeat the experiment”, and “I recommend the experiment” on a Likert scale from 2 to 7 for all participants and all experiments were 4.4, 4.3 and 4.2, respectively, i.e., they were on the positive side (>4.0). These values can be used as a proxy for engagement [50]. High ratings for these variables cannot be expected, as the participation in the study was mandatory for the students. We consider the average rating being on the positive side as an indication that the students had a positive attitude to the learning trail concept. Further, we interpreted these results as weak evidence that the learning trails support this type of outcomes.
- Activity, behaviour, and progression: This type of outcomes is described as what people do, intend to do, or have done assessed by observations or self-reporting. This type of outcomes cannot be measured when students solely use the learning trails. The scope of the learning trails is too short to have a measurable impact on this type of outcomes.
In summary, this discussion suggests that the concept of the learning trails supports knowledge and understanding as well as enjoyment as the most predominant terms of the GLO. The design of single experiments in each trail has the potential to increase the outcomes.
6. Studying the Learning Trails
We wanted to explore the learning trails in general and, particularly, assess whether we can observe differences for the Modes I and II, as well as other characteristics of the learning trails. We studied this by collecting data from school classes performing the learning trail and analysed these data by aligning them with observations.
6.1. Test Setup
Each of the three learning trails consisted of three experiments, here denoted as , , and for learning trail t. After each performed experiment, the participants answered a micro-survey with four questions; after the last micro-survey, there was one further question denoted as survey . See Table 4 for the survey questions. Finally, all participants answered a Kahoot! quiz where the correctness of the students’ answers was evaluated. Thus, each group undergoes one of the sequences , , or . The positioning data and the answers given in the micro-surveys were stored in the respective tablet PCs and analysed later.
We implemented this entire procedure for both modes, that is Mode I for the paper-based version and Mode II where interactive content is pushed to the students’ devices when approaching the respective experiment. In our study, the participants were divided into groups of two to four; one person from each group was pointed out as their leader. All group leaders received a tablet PC that was used for answering the micro-surveys, for logging the relative position of the device, and for accessing the content (Mode II only). Participants that were not group leaders could answer survey questions on tablet PCs that were placed near the installations they visited. The participants were not aware of the test setup of other groups.
As each session included up to nine groups of students with two to four participants each, we took some precautions that groups do not interfere with each other, e.g., use the same installation concurrently.
We developed separate apps for each of both modes to support micro-surveys, position logging, content (if applicable), and providing a similar setup for all participants: App I for the paper-based version implemented the micro-surveys and logged the relative positions to the beacons. The micro-surveys were automatically triggered when a group left an area or time was up. This version did not give access to extra content. App II automatically presented tailored content when the participants approached an experiment; it also implemented the micro-surveys and logs. Note that all participating groups were given a tablet PC under the trials to avoid an extra bias when some groups used a tablet PC while others would not.
The questions of the micro-surveys, given in Table 4, reflected whether the participants liked an experiment, recommendation to others, the willingness to use the experiment again, and which of the three experiments they liked best. These factors can give a good indication of whether a participant liked an experiment [50]. Additionally, we asked for a self-report on pre-visit knowledge. We had planned a further question about whether the participants had enough time to use the installation. However, after preliminary tests, we recognised that the learning trails were absolved much faster than anticipated. Consequently, this question was obsolete and removed from the survey.
6.2. Test Participants
Students from school classes at the lower secondary school (tenth grade, age 16) in the Oslo area participated in the study. In total, five sessions were performed between Autumn 2016 and Spring 2017. In total, participants appear in our log files; the numbers in parenthesis denoting participants in the learning trails “Forces”, “Sound”, and “Light”, respectively. The students were divided into groups of two to four to enable discussion and interaction between them. One student of each group was selected as the spokesperson, here denoted as the group leader. The number of group leaders was ; for Mode I and for Mode II.
6.3. Test Analysis and Results
We expected that the variables L, R, and A would show a higher rating for most of the nine experiments in Mode II. We also expected that the ratings would be higher in Mode II for all experiments together. Although we observed variations in the response scores, tests showed that most of the differences between the two modes were not significant. Thus, our expectation was not supported.
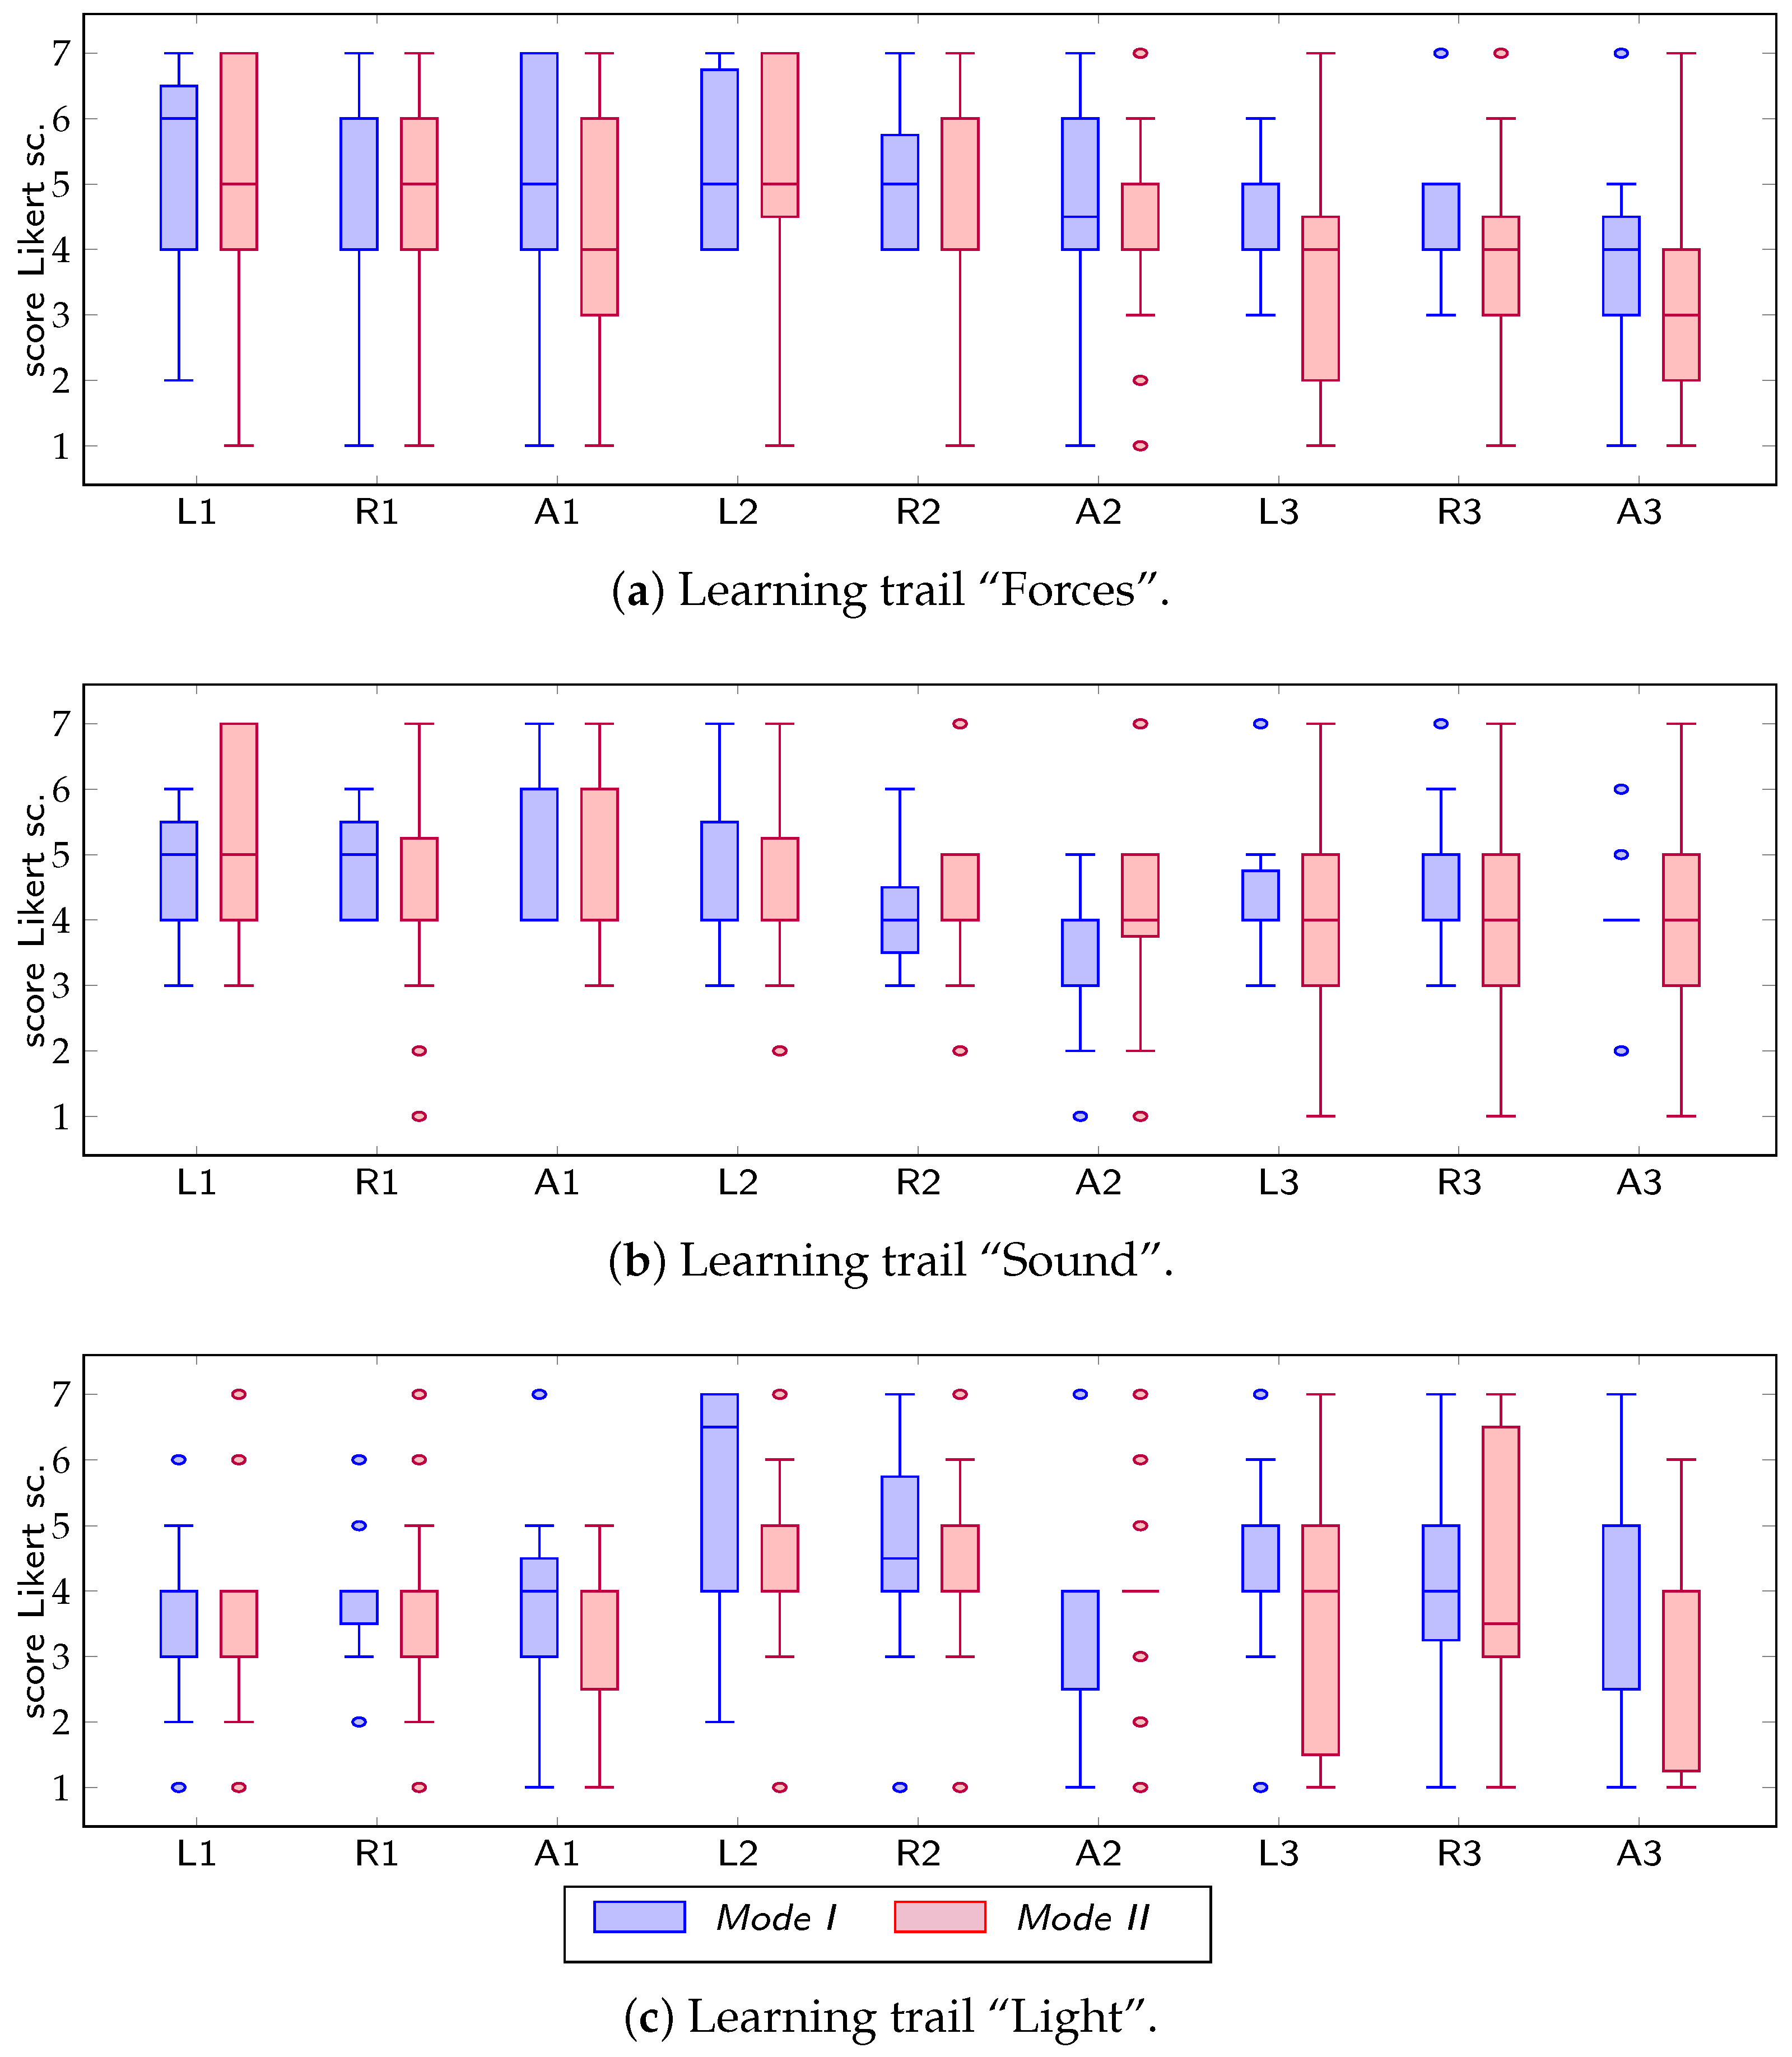
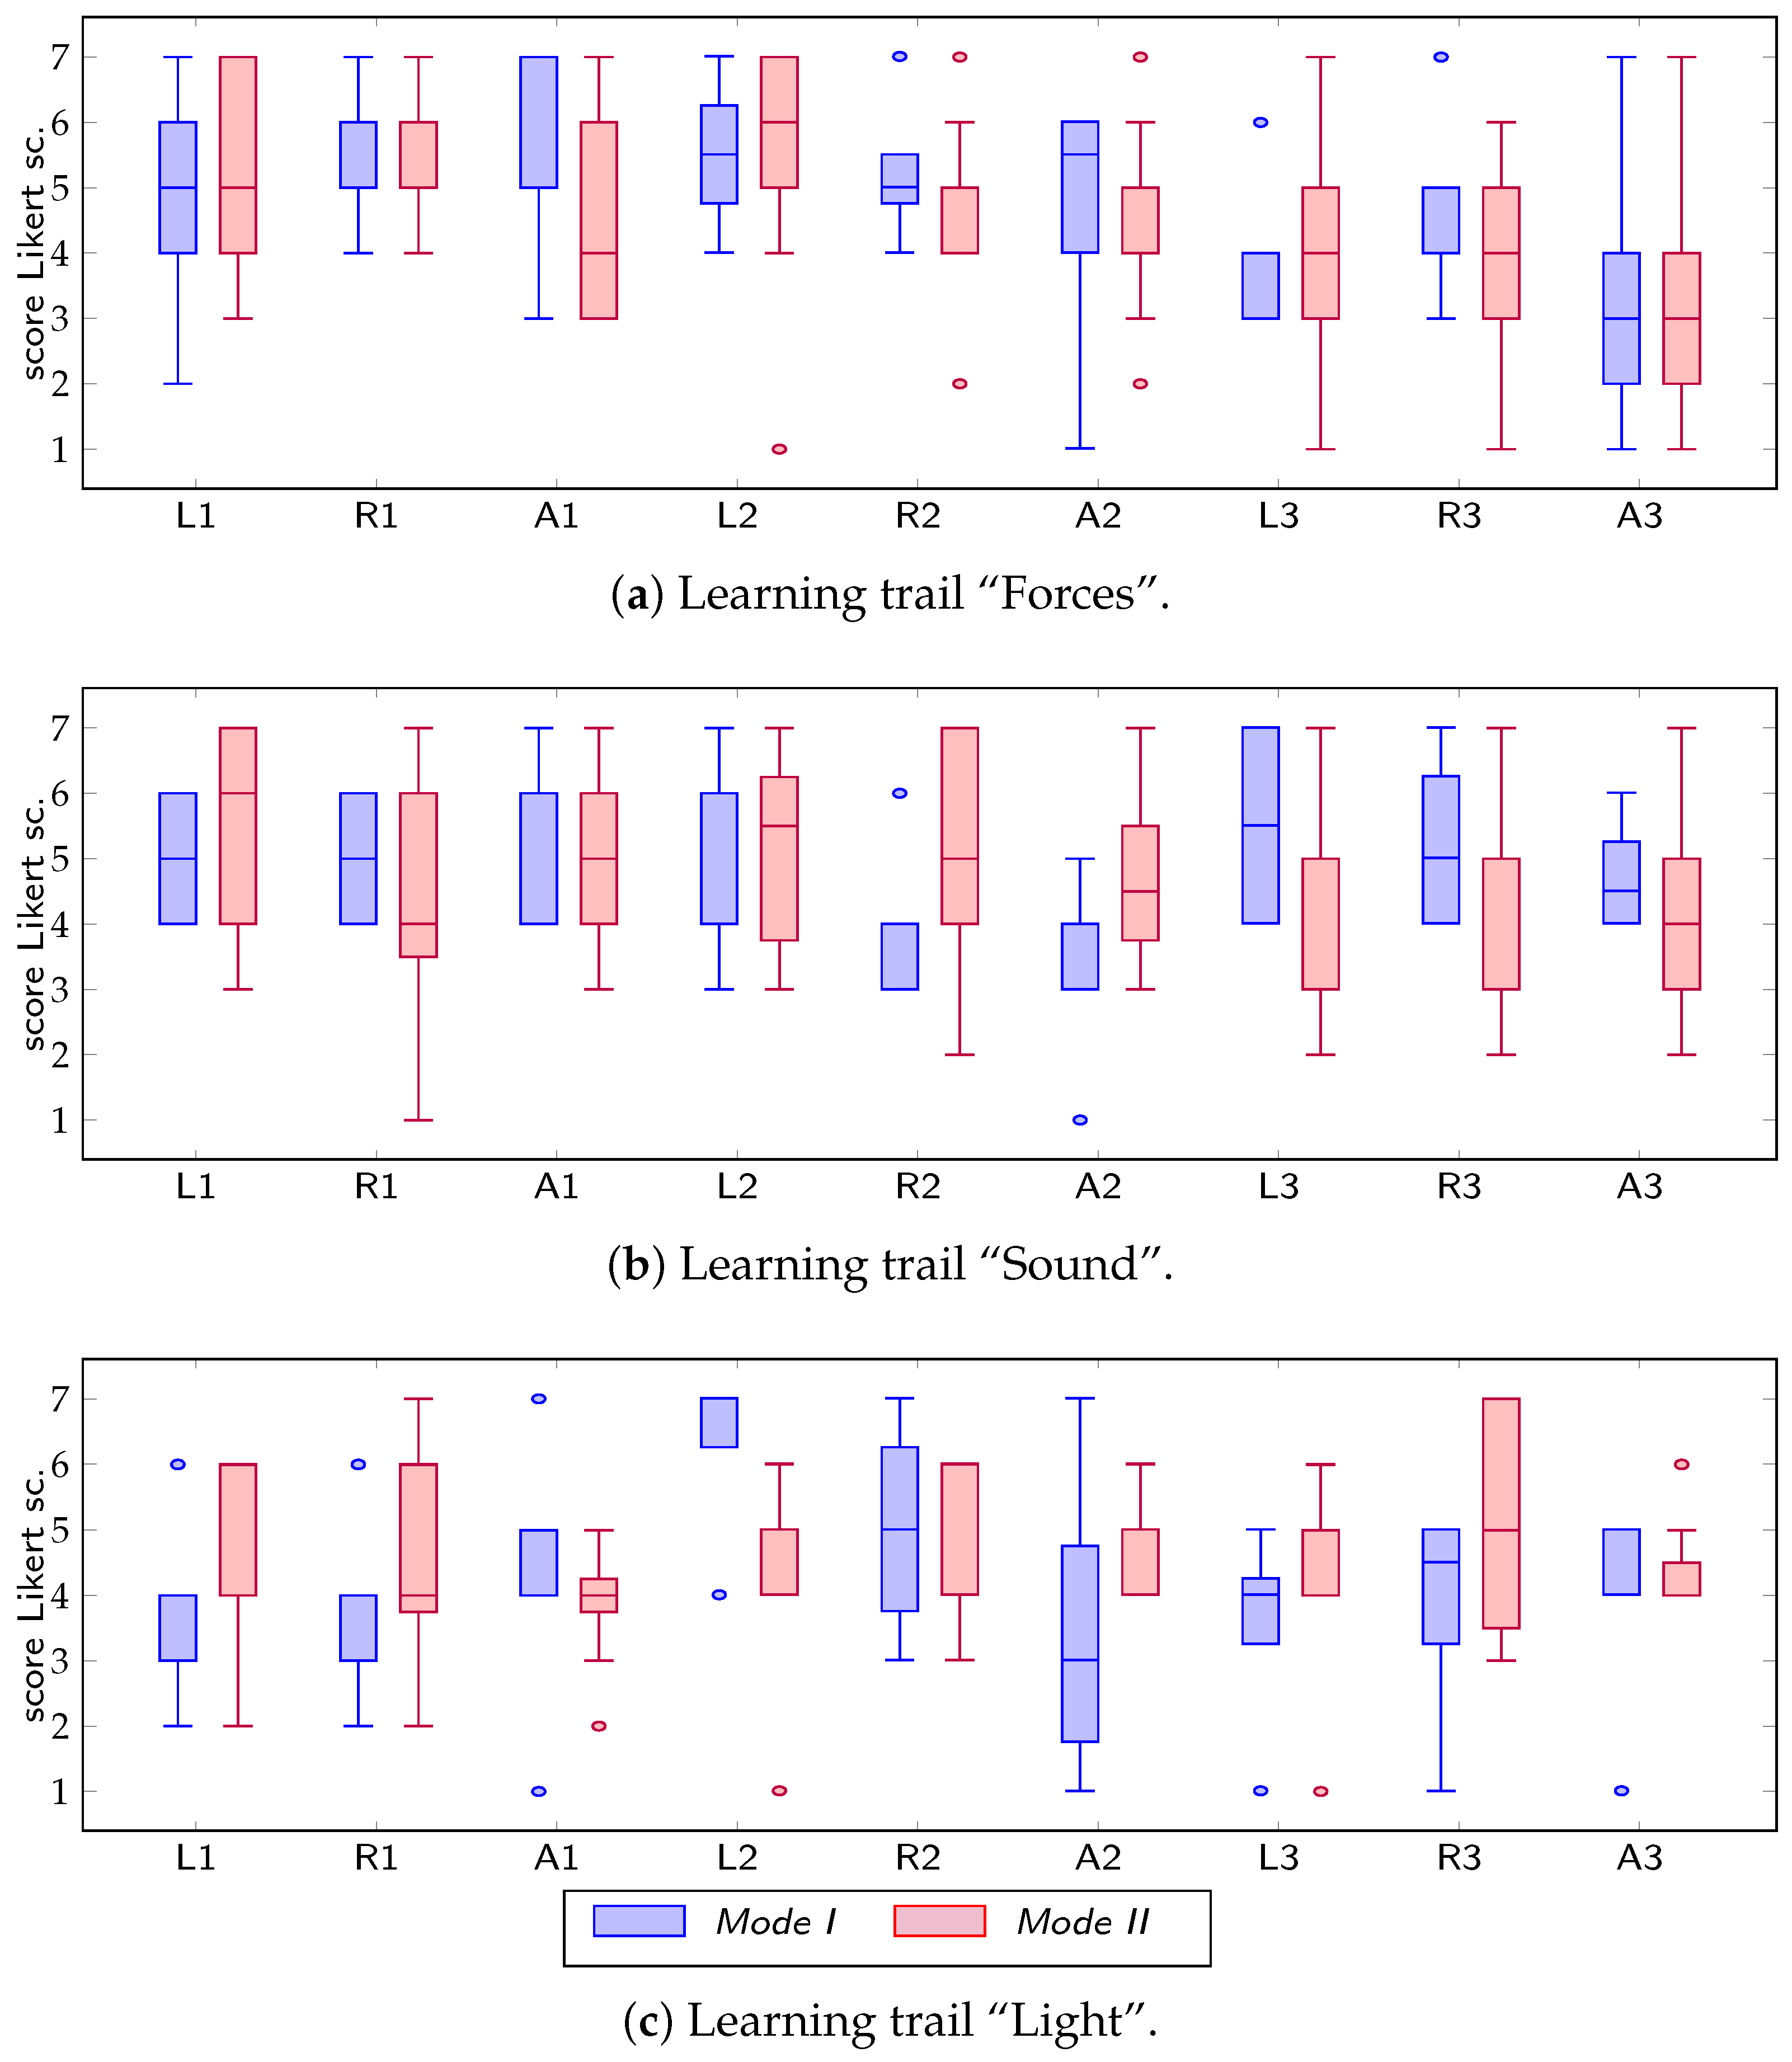
6.3.1. Results for All Participants
Figure 5 shows the results from the questionnaires for the variables L, R, and A for each of the nine experiments and for all participants. As expected, the installations in the learning trails received different ratings. This result can be used by the science centre to evaluate which of the experiments are liked better than other experiments. As an observation, it seems that the leaning trail “Light” received a lower rating than the two other ones. Further, the experiment Centrifugal Governor received a lower rating than most of the others. We observed some unexpectedly high values for the learning trail “Light” in one of the experiments for Mode I.
6.3.2. Results for Group Leaders
As we suspected irregularities in the dataset caused by the technical setup of stationary tablet PCs used for the micro-surveys, we selected the data for the group leaders for an analysis. The results for group leaders are shown in Figure 6. Differences between the two modes are not significant, and it is still not obvious which of the two modes was more engaging.
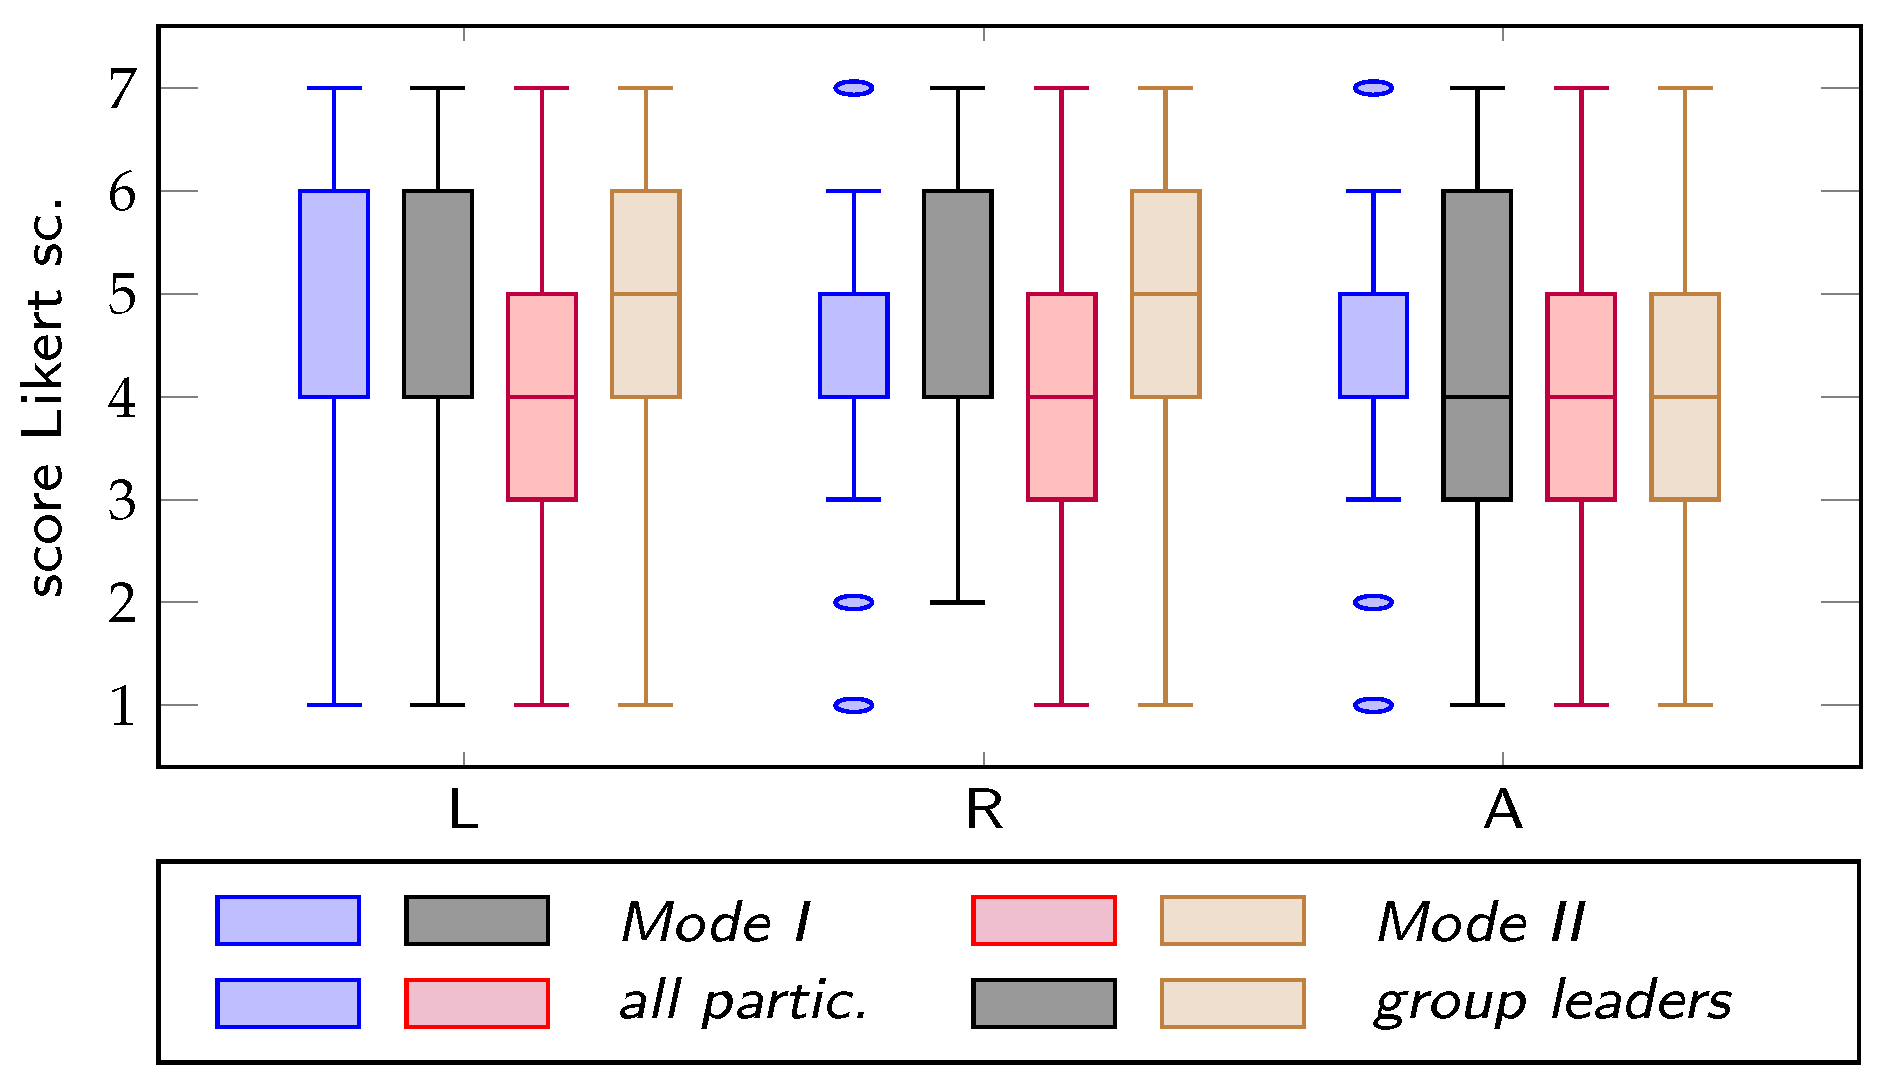
6.3.3. Group Leaders vs. Ordinary Participants
We aggregated the responses over all experiments for the variables L, R, and A for both modes. We selected the responses from group leaders and compared these with the responses from all participants for Mode I and Mode II. These results are shown in Figure 7. For the variables L, R, and A, there are no significant differences for group leaders, while there is a significant difference for all participants. However, the participants in Mode II gave lower scores for all three variables. We note that we did not observe a possible bias due to different pre-visit knowledge scores, as can be seen in Figure 8.
6.3.4. Experiment Preferences
We show in Table 5 the results for the question which of the learning trail experiments the group leaders liked best. Note that some group leaders failed to register for this question. For “Forces” and “Sound”, these numbers are compatible with the results in Figure 6. However, for “Light”, there is a discrepancy, as Experiment #2 received no likes while it was rated rather high in the scores. As a further observation, the experiment Pirouette (see Figure 2a) received the highest number of mentions.
6.3.5. Knowledge Questions
We evaluated the number of correct answers to knowledge questions. Each question had four alternatives where one of these was correct. Of the questions, there was always one “odd” alternative; it does not seem that the participants chose these to a large degree. Table 6 shows the percentage of correct answers. We marked questions that are about content that has not been presented during the experiment with an asterisk (∗).
For the knowledge question, it was not significant whether Mode I or Mode II was used, nor whether the participants are group leaders. As a further observation, the overall pre-visit knowledge was rather low (see Figure 8).
6.4. Discussion of the Results
We went into the study with the expectation that Mode II would be preferred by the participants and, thus, resulting in higher scores. Thus far, we did not find evidence for this. We recognised that the number of participants in the single parts of the study is too small to show significant preferences.
The low impact of the mode to the result might be caused by a rather large impact of the design, activities, and use of other modalities to convey the content. In other words, the students might experience the learning trail themselves to be multi-modal so that introducing a further modality (such as Modes I and II) had only a minor impact. Another source of error might be the research setting that the students might not have been used to. Further, in our study, the presented content in Mode II did not fully use the extra possibilities for transferring content automatically to the students.
As a note, there are other studies where the mode of presentation did not have the expected impact. For instance, Vogt et al. [51] reported from a study where social robots were used to tutor children in second language learning. They could not find the expected differences in the learning effect between modes that were different in their implementation (tablet only vs. use of a social robot, the latter with and without the use of gestures), although they performed a large-scale study.
In our study, there was an indication that participants that were not group leaders in Mode II give lower ratings for the variables for like and recommend by one step of the Likert scale. Possibly, these participants are not adequately included when the group leader is working with the tablet PC. Although this effect is rather small (see Figure 7), that might be an indication that all participants should be given a tablet PC while performing a learning trail.
We observed that the Engagement Profile for Experiments #1 and #2 of the learning trail “Forces” show high degrees of the dimensions physical and user control. From our previous work [3], we inferred that the target group (school children) prefers high values of the dimensions physical, user control, and social. At the same time, our study shows that these experiments score high (see Figure 5 and Figure 6). There might be a connection, but we cannot prove this from two observations. Further, although experiments might have had similar values of physical and user control in their Engagement Profiles, these experiments scored quite differently. Thus, we cannot predict scores from the Engagement Profile.
There are indications that the selection of experiments in a learning trail may contribute essentially to the scores given by the participants. For instance, the content of the learning trail “Light” received low scores, which could be explained by the content being built up more theoretically and having less engaging video content than the other two learning trails. However, note that the learning outcome is not necessarily related to the scores or to the Engagement Profile.
As a further note, the low scores for the experiment Centrifugal Governor could be a result of this experiment consisting of observations and solving a simple task. This is also visible in Chart c of Figure 4a. In contrast, the experiment Cup (see Chart b in Figure 4a) seems to be more engaging and evokes more enjoyment, inspiration, creativity, activity, behaviour, and progression.
For NTM, the correctness level for the knowledge questions was in the usual range, compared to internal studies at the science centre. In addition, the observed pre-visit knowledge (cf. Figure 8) was in the usual range. As the subjects treated by the learning trails are rather theoretical, we expected that only a few students were able to answer correctly.
The Kahoot! quiz was performed right after the learning trails had been performed, and the new experiences had not yet been internalised by the students. Thus, a Kahoot! quiz could act as an engaging repetition that would have helped in the internalising process of the learnt knowledge. A repetition of the Kahoot! quiz some weeks after the science centre visit could have given more evidence.
NTM had tried several location-based concepts before; these have not worked well. In contrast, the learning trails using location-based services worked well.
7. Conclusions
The science centre NTM has developed the concept of learning trails where a number of thematically connected experiments are performed by groups of students. A learning trail can be implemented based on laminated sheets or using apps on a tablet PC and location-based online content. In a study with students from secondary school classes (tenth grade, age 16), we could not find evidence for which of these two modes is preferred or gives a better learning outcome. Therefore, when considering how to implement learning trails, science centres must use other criteria to make design decisions. Although the selection of experiments in our study worked equally well in both modes, there might be science phenomena that could be presented better in apps using enriched content. In such cases, the tablet PCs and their content could be used as an integral part of a learning trail experiment. Further, app-based content has the advantage that it potentially can be adapted individually to personal preferences and requirements.
We discussed the scores for the learning trails and single experiments from the findings in our study. The learning trail “Forces” received the highest scores in our study, particularly the experiments Pirouette and Cup. We can speculate whether the relatively high Engagement Profile values of these experiments, in particular in the dimensions interactivity, physical, and user control, could be a reason.
We also recognised that we need a more focused study or a larger sample size to evaluate the reasons of why some learning trails or experiments score better than others do. To design future studies with learning trails, several of the technical issues we experienced need to be addressed. For instance, to avoid problems when registering results, one should consider that all participants have their own tablet PC during the study. Setting up separate terminals for students that are not group leaders had the tendency to be error-prone.
Further, we have developed a translation table to determine the media form of exhibits. According to this translation table and related conditions, the concept of the learning trails implements mostly the narrative and communicative form, supporting the activities of attending, apprehending, and discussing. To evaluate which of the GLO are supported by the learning trails, we related the Engagement Profile and the media forms to the GLO for the learning trails as a case. This evaluation suggested that the concept of the learning trails supports knowledge and understanding, as well as enjoyment as the most predominant terms of the GLO. Additional outcomes can potentially be enforced by using experiments in the learning trails with increased engaging factors.
For NTM, the learning trail concept is promising and will be further developed to give students an engaging experience in the science centre. From the ratings for the constructs “like”, “recommend”, and “use again” both for regarding most of the single experiments and aggregated, we conclude that the students had a positive attitude towards the learning trail concept.
A variety of parameters could be modified to improve the learning trail concept. Obviously, the number of experiments per learning trail could be increased, limited by the duration of the museum visit and the students’ ability to focus over a longer time. Further, one could consider altering some of the characteristics of the learning trail concept, informed by the Engagement Profile. For instance, one could:
- (a)
- increase competition by letting students compete within each group or groups with each other;
- (b)
- increase the narrative dimension by using clues to find the next experiment;
- (c)
- increase user control by letting students select experiments;
- (d)
- increase achievements awareness by presenting tokens or diplomas; or
- (e)
- increase the physical dimension by adding physical exercises in between the experiments.
A walk-through of the Engagement Profile and considering various other possibilities are left to the reader’s imagination. Further, the selection of experiments and considering their Engagement Profile is another possibility to increase engagement. To study the impact of such changes, our previously presented evaluation methodology [6] can be employed, including performing studies similar to the one presented in this paper.
Author Contributions
All authors contributed to this paper as joint work in the context of the VisitorEngagement project. W.L. and I.T. developed the concept, while W.L. prepared the scientific background. J.A.A. and H.H. developed the concept of the learning trails. G.J. and I.T. implemented the learning trails at the NTM and performed the experiments at the NTM together with J.A.A. and H.H., W.L. and I.T. analysed and discussed the data. The paper was written by W.L. with text contributions by all co-authors.
Funding
This research was carried out in the context of the project VisitorEngagement funded by the Research Council of Norway in the BIA programme, grant number 228737. Further, this research has been supported through basic institute funding at Norsk Regnesentral, RCN grant number 194067.
Acknowledgments
The authors wish to thank Michel de Brisis for his contributions in the research project and Anders Havskjold for the implementation work of the learning trail apps and the questionnaires used during the study. We also thank Ivar Solheim at Norsk Regnesentral for discussions while preparing the paper and all our colleagues in the VisitorEngagement project for their input and comments.
Conflicts of Interest
The experiments were performed at the NTM, where two of the authors (J.A.A. and H.H.) are affiliated. The learning trails were implemented as a potential product by Expology, where one of the authors (G.J.) is affiliated. Beyond these facts, the authors declare that the research was conducted in the absence of any commercial or financial relationships that could be construed as a potential conflict of interest.
Data Protection Statement
The VisitorEngagement project is registered with the Norwegian Centre for Research Data (NSD) who acts as a data protection ombud for studies performed in the project. Personal data gathered during the study have been anonymised or deleted after analysis. We state that the participants’ personal data cannot be retrieved from the here published results.
Photographs
The photographs in Figure 2 were taken by some of the authors during the study at NTM. The persons depicted on these images have given their written consent that photographs taken during the study can be used in scientific publications.
Project Information
The objective of the VisitorEngagement project was to measure the degree of engagement and user experience in science centres and museums. This was done by means of sensor and camera technology and the registration of user behaviour, in combination with short surveys. Project partners were Expology, Norsk Regnesentral (Norwegian Computing Centre), The Norwegian Museum of Science and Technology, The Norwegian Maritime Museum, Engineerium, and the Department of Education at the University of Oslo. For information about the project, we refer to the project base entry at the Research Council of Norway [52] and previous publications [2,3,6,34,50,53].
Abbreviations
The following abbreviations and names are used in this manuscript:
| BLE | Bluetooth Low Energy |
| BYOD | Bring Your Own Device |
| EP | Engagement Profile |
| FM | Frequency Modulated |
| GLO | Generic Learning Outcomes |
| GPS | Global Positioning System |
| NSD | Norwegian Centre for Research Data (Norsk Senter for Forskningsdata) |
| NTM | Norwegian Museum for Science and Technology (norw. Norsk Teknisk Museum) |
| PC | Personal Computer |
| RFID | Radio Frequency IDentification |
| TMSI | Temporary Mobile Subscriber Identity |
References
- Hofstein, A.; Rosenfeld, S. Bridging the gap between formal and informal science learning. Stud. Sci. Educ. 1996, 28, 87–112. [Google Scholar] [CrossRef]
- Leister, W.; Tjøstheim, I.; Joryd, G.; Schulz, T.; Larssen, A.; de Brisis, M. Assessing Visitor Engagement in Science Centres and Museums. J. Adv. Life Sci. 2016, 8, 49–63. [Google Scholar]
- Leister, W.; Tjøstheim, I.; Norseng, P.G.; Joryd, G.; Bagle, E.; Sletten, H.T. Digital Storytelling and Engagement in Exhibitions about Shipping. Norsk Museumstidsskrift 2018, 4, 50–73. [Google Scholar] [CrossRef]
- Hooper-Greenhill, E. Measuring Learning Outcomes in Museums, Archives and Libraries: The Learning Impact Research Project (LIRP). Int. J. Herit. Stud. 2004, 10, 151–174. [Google Scholar] [CrossRef]
- Fredricks, J.A.; Blumenfeld, P.C.; Paris, A.H. School Engagement: Potential of the Concept, State of the Evidence. Rev. Educ. Res. 2004, 74, 59–109. [Google Scholar] [CrossRef]
- Leister, W.; Tjøstheim, I.; Joryd, G.; de Brisis, M.; Lauritzsen, S.; Reisæter, S. An Evaluation-Driven Design Process for Exhibitions. Multimodal Technol. Interact. 2017, 1, 25. [Google Scholar] [CrossRef]
- Falk, J.H.; Dierking, L.D. Learning from the outside in. In Lessons without Limit: How Free-Choice Learning Is Transforming Education; Altamira Press: New York, NY, USA, 2002; pp. 47–62. [Google Scholar]
- Wang, J.; Agogino, A.M. Cross-Community Design and Implementation of Engineering Tinkering Activities at a Science Center. In Proceedings of the FabLearn 2013: Digital Fabrication in Education, Stanford, CA, USA, 27–28 October 2013; pp. 1–4. [Google Scholar]
- Pierroux, P.; Kluge, A. Bridging the Extended Classroom: Social, Technological and Institutional Challenges. Nordic J. Digit. Literacy 2011, 6, 115–120. [Google Scholar]
- Šuldová, A.; Cimler, P. How to Assess Expirience—The new Trend in Research Technique, Use in Nonprofit Sector of Entertainment and Educational Industries. Mark. Obchod 2011, 4, 115–124. [Google Scholar]
- Sanford, C.W. Evaluating Family Interactions to Inform Exhibit Design: Comparing Three Different Learning Behaviors in a Museum Setting. Visit. Stud. 2010, 13, 67–89. [Google Scholar] [CrossRef]
- Higgins, H.H. Museums of Natural History: Part I. Museum Visitors; Transactions of the Literary and Philosophical Society of Liverpool: London, UK, 1884; Volume 38, pp. 185–188. [Google Scholar]
- Lindauer, M. What to ask and how to answer: A comparative analysis of methodologies and philosophies of summative exhibit evaluation. Museum Soc. 2005, 3, 137–152. [Google Scholar]
- McManus, P.M. Museum and Visitor Studies Today. Visit. Stud. 1996, 8, 1–12. [Google Scholar] [CrossRef]
- Yalowitz, S.S.; Bronnenkant, K. Timing and Tracking: Unlocking Visitor Behavior. Visit. Stud. 2009, 12, 47–64. [Google Scholar] [CrossRef]
- Baur, J. (Ed.) Museumsanalyse—Methoden und Konturen eines neuen Forschungsfeldes; Kultur- und Museumsmanagement, Transcript: Bielefeld, Germany, 2010. (In German) [Google Scholar]
- Kirchberg, V. Besucherforschung in Museen: Evaluation von Ausstellungen. In Museumsanalyse—Methoden und Konturen eines neuen Forschungsfeldes; Baur, J., Ed.; Kultur- und Museumsmanagement, Transcript: Bielefeld, Germany, 2010; pp. 171–184. (In German) [Google Scholar] [Green Version]
- Macdonald, S. (Ed.) A Companion to Museum Studies, 1st ed.; Wiley-Blackwell: Hoboken, NJ, USA, 2010. [Google Scholar]
- Martindale, C. Recent Trends in the Psychological Study of Aesthetics, Creativity, and the Arts. Empirical Stud. Arts 2007, 25, 121–141. [Google Scholar] [CrossRef]
- Dierking, L.D.; Falk, J.H. Redefining the museum experience: The interactive experience model. Visit. Stud. 1992, 4, 173–176. [Google Scholar]
- Falk, J.; Storksdieck, M. Using the contextual model of learning to understand visitor learning from a science center exhibition. Sci. Educ. 2005, 89, 744–778. [Google Scholar] [CrossRef]
- Falk, J.H. The impact of visit motivation on learning: Using identity as a construct to understand the visitor experience. Curator 2006, 49, 151–166. [Google Scholar] [CrossRef]
- Falk, J.H.; Heimlich, J.; Bronnenkant, K. Using Identity-Related Visit Motivations as a Tool for Understanding Adult Zoo and Aquarium Visitors’ Meaning-Making. Curator Museum J. 2008, 51, 55–79. [Google Scholar] [CrossRef]
- Barriault, C.; Pearson, D. Assessing Exhibits for Learning in Science Centers: A Practical Tool. Visit. Stud. 2010, 13, 90–106. [Google Scholar] [CrossRef]
- Russell, D.M.; Stefik, M.J.; Pirolli, P.; Card, S.K. The Cost Structure of Sensemaking. In Proceedings of the INTERACT ’93 and CHI ’93 Conference on Human Factors in Computing Systems, Amsterdam, The Netherlands, 24–29 April 1993; ACM: New York, NY, USA, 1993; pp. 269–276. [Google Scholar] [CrossRef]
- Klein, G.; Moon, B.; Hoffman, R.R. Making Sense of Sensemaking 1: Alternative Perspectives. IEEE Intell. Syst. 2006, 21, 70–73. [Google Scholar] [CrossRef]
- Klein, G.; Moon, B.; Hoffman, R.R. Making Sense of Sensemaking 2: A Macrocognitive Model. IEEE Intell. Syst. 2006, 21, 88–92. [Google Scholar] [CrossRef]
- Shettel, H.H.; Butcher, M.; Cotton, T.S.; Northrup, J.; Slough, D.C. Strategies for Determining Exhibit Effectiveness; Technical Report Report No. AIR E-95-4/68-FR; American Institutes for Research: Washington, DC, USA, 1968. [Google Scholar]
- Alt, M.B.; Shaw, K.M. Characteristics of ideal museum exhibits. Br. J. Psychol. 1984, 75, 25–36. [Google Scholar] [CrossRef]
- Brown, S. A critique of generic learning outcomes. J. Learn. Des. 2007, 2, 22–30. [Google Scholar] [CrossRef] [Green Version]
- Laurillard, D. Rethinking University Teaching: A Conversational Framework for the Effective Use of Learning Technologies; RoutledgeFalmer: Oxford, UK, 2002. [Google Scholar]
- Ayudhya, W.S.N.; Vavoula, G. Mobile Family Learning in the Science Museum. In Proceedings of the 16th World Conference on Mobile and Contextual Learning, mLearn 2017, Larnaca, Cyprus, 30 October–1 November 2017; ACM: New York, NY, USA, 2017; pp. 22:1–22:8. [Google Scholar] [CrossRef]
- Bitgood, S. An Attention-Value Model of Museum Visitors; Jacksonville State University: Jacksonville, AL, USA, 2010. [Google Scholar]
- Cooney, M.; Leister, W. Using the Engagement Profile to Design an Engaging Robotic Teaching Assistant for Students. Robotics 2019, 8, 21. [Google Scholar] [CrossRef]
- Ocampo-Agudelo, J.; Maya, J.; Roldán, A. A Tool for the Design of Experience-Centred Exhibits in Science Centres. In Proceedings of the Poster at Science Centre World Summit–SCWS2017, Tokyo, Japan, 15–17 November 2017. [Google Scholar] [CrossRef]
- Baldwin, T.; Kuriakose, L.T. Cheap, Accurate RFID Tracking of Museum Visitors for Personalized Content Delivery. In Proceedings of the Museums and the Web, Indianapolis, IN, USA, 15–18 April 2009. [Google Scholar]
- Parsons, J.; Ralph, P.; Gallagher, K. Using Viewing Time to Infer User Preference in Recommender Systems. In Proceedings of the AAAI Workshop on Semantic Web Personalization Held in Conjunction with the 9th National Conference on Artificial Intelligence (AAAI’04), San Jose, CA, USA, 25–29 July 2004. [Google Scholar]
- Yoshimura, Y.; Sobolevsky, S.; Ratti, C.; Girardin, F.; Carrascal, J.P.; Blat, J.; Sinatra, R. An analysis of visitors’ behavior in the Louvre Museum: A study using Bluetooth data. Environ. Plann. B Plann. Des. 2014, 41, 1113–1131. [Google Scholar] [CrossRef]
- Moussouri, T.; Roussos, G. Examining the Effect of Visitor Motivation on Observed Visit Strategies Using Mobile Computer Technologies. Visit. Stud. 2013, 16, 21–38. [Google Scholar] [CrossRef]
- Moussouri, T.; Roussos, G. Conducting Visitor Studies Using Smartphone-Based Location Sensing. J. Comput. Cult. Herit. 2015, 8, 12:1–12:16. [Google Scholar] [CrossRef]
- Bohnert, F.; Zukerman, I. Non-Intrusive Personalisation of the Museum Experience. In Proceedings of the 17th International Conference on User Modeling, Adaptation, and Personalization (UMAP-09), Trento, Italy, 22–26 June 2009; pp. 197–209. [Google Scholar]
- Bitgood, S. Designing Effective Exhibits: Criteria for Success, Exhibit Design Approaches, and Research Strategies. Visit. Behav. 1994, IX, 4–15. [Google Scholar]
- Mautz, R. Indoor Positioning Technologies. Habil Thesis, ETH Zürich, Environmental and Geomatic Engineering, Institute of Geodesy and Photogrammetry, Zürich, Switzerland, 2012. [Google Scholar]
- Lymberopoulos, D.; Liu, J.; Yang, X.; Choudhury, R.R.; Handziski, V.; Sen, S. A Realistic Evaluation and Comparison of Indoor Location Technologies: Experiences and Lessons Learned. In Proceedings of the 14th International Conference on Information Processing in Sensor Networks, IPSN ’15, Vienna, Austria, 11–14 April 2015; ACM: New York, NY, USA, 2015; pp. 178–189. [Google Scholar] [CrossRef]
- Bickersteth, J.; Ainsley, C. Mobile Phones and Visitor Tracking. In Proceedings of the Museums and the Web, Philadelphia, PA, USA, 6–9 April 2011. [Google Scholar]
- Noldus, L.P.J.J.; Loke, B.; Kelia, M.; Spink, A.J. Automated Mobile User Experience Measurement: Combining Movement Tracking with App Usage Logging. In Creating the Difference, Proceedings of the Chi Sparks 2014; The Hague University of Applied Sciences: The Hague, The Netherlands, 2014. [Google Scholar]
- Wang, A. The wear out effect of a game-based student response system. Comput. Educ. 2015, 82, 217–227. [Google Scholar] [CrossRef] [Green Version]
- Wang, A.; Lieberoth, A. The effect of points and audio on concentration, engagement, enjoyment, learning, motivation, and classroom dynamics using Kahoot! In Proceedings of the 10th European Conference of Game Based Learning, Paisley, UK, 6–7 October 2016; Connolly, T., Boyle, L., Eds.; Academic Conferences and Publishing International Limited: Sonning Common, UK, 2016; pp. 737–748. [Google Scholar]
- Wu, B.; Wang, A.I.; Børresen, E.A.; Tidemann, K.A. Improvement of a Lecture Game Concept—Implementing Lecture Quiz 2.0. In Proceedings of the 3rd International Conference on Computer Supported Education, CSEDU 2011, Noordwijkerhout, The Netherlands, 6–8 May 2011; Verbraeck, A., Helfert, M., Cordeiro, J., Shishkov, B., Eds.; SciTePress: Setúbal, Portugal, 2011; Volume 2, pp. 26–35. [Google Scholar]
- Tjøstheim, I.; Leister, W.; Larssen, A.; Schulz, T. The Role of Emotion and Enjoyment for QoE—A Case Study of a Science Centre Installation. In Proceedings of the 7th Intl. Workshop on Quality of Multimedia Experience, QoMeX 2015, Messinia, Greece, 26–29 May 2015; Skodras, A., Ed.; pp. 1–6. [Google Scholar]
- Vogt, P.; van den Berghe, R.; de Haas, M.; Hoffmann, L.; Kanero, J.; Mamus, E.; Montanier, J.M.; Oranc, C.; Oudgenoeg-Paz, O.; Garcia, D.H.; et al. Second Language Tutoring using Social Robots. A Large-Scale Study. In Proceedings of the 2019 ACM/IEEE International Conference on Human-Robot Interaction (HRI 2019), Daegu, Korea, 11–14 March 2019. [Google Scholar]
- Visitor Engagement. Entry in PROSJEKTBANKEN, Research Council of Norway. 2017. Available online: https://www.forskningsradet.no/prosjektbanken/#/project/NFR/228737/Sprak=en (accessed on 8 September 2018).
- Leister, W.; Tjøstheim, I.; Joryd, G.; Schulz, T. Towards Assessing Visitor Engagement in Science Centres and Museums. In Proceedings of the Fifth International Conference on Performance, Safety, and Robustness in Complex Systems and Applications, PESARO 2015, Barcelona, Spain, 19–23 April 2015; IARIA: Wilmington, DE, USA, 2015; pp. 21–27. [Google Scholar]
Figure 1.
The dimensions of the Engagement Profile explained with short definitions. To define the value of a property, find the adjacent number of the phrases that fit best.
Figure 1.
The dimensions of the Engagement Profile explained with short definitions. To define the value of a property, find the adjacent number of the phrases that fit best.

Figure 2.
Examples for the experiments in the three learning trails: “Forces” (a–c); “Sound” (d–f); and “Light” (g–i).
Figure 2.
Examples for the experiments in the three learning trails: “Forces” (a–c); “Sound” (d–f); and “Light” (g–i).

Figure 3.
The hatched fields show the Engagement Profile of a generic learning trail. The shaded field indicates the Social dimension value when the learning trail is performed as a single visitor instead of in a group.
Figure 3.
The hatched fields show the Engagement Profile of a generic learning trail. The shaded field indicates the Social dimension value when the learning trail is performed as a single visitor instead of in a group.

Figure 4.
Engagement Profile of the three experiments in the three learning trails (blue markings are for the respective experiment; values for the generic learning trail are hatched).
Figure 4.
Engagement Profile of the three experiments in the three learning trails (blue markings are for the respective experiment; values for the generic learning trail are hatched).

Figure 5.
Response scores for tests with three learning trails and the three stations i on a Likert scale for the variables for like , recommend and play again . The number of participants is .
Figure 5.
Response scores for tests with three learning trails and the three stations i on a Likert scale for the variables for like , recommend and play again . The number of participants is .

Figure 6.
Group leader response scores for tests with three learning trails and the three stations i on a Likert scale for the variables for like , recommend and play again . The number of group leaders is ; for Mode I and for Mode II.
Figure 6.
Group leader response scores for tests with three learning trails and the three stations i on a Likert scale for the variables for like , recommend and play again . The number of group leaders is ; for Mode I and for Mode II.

Figure 7.
Response scores for tests with learning paths for the variables like (), recommend () and play again ().
Figure 7.
Response scores for tests with learning paths for the variables like (), recommend () and play again ().

Figure 8.
Response scores for pre-visit knowledge ().


Table 1.
The entries marked with • show the properties of the Engagement Profile that have an impact on the media forms of Laurillard’s taxonomy. The last column shows the translation conditions when a media form is relevant.
Table 1.
The entries marked with • show the properties of the Engagement Profile that have an impact on the media forms of Laurillard’s taxonomy. The last column shows the translation conditions when a media form is relevant.
| Laurillard’s Taxonomy | Engagement Profile | Translation | ||||||||
|---|---|---|---|---|---|---|---|---|---|---|
| activity | Media Form | C | N | I | P | U | S | A | E | Conditions |
| attending | narrative | • | • | • | • | • | most values | |||
| apprehending | ||||||||||
| investigating | interactive | • | • | • | most values | |||||
| exploring | ||||||||||
| discussing | communicative | • | S | |||||||
| debating | ||||||||||
| experimenting | adaptive | • | • | • | • | • | most of | |||
| practising | ||||||||||
| articulating | productive | • | • | • | • | • | most values | |||
| expressing | ||||||||||
Table 2.
List of experiments of the learning trails and reference to illustration image.
| Learning Trail | # | Name | Description, Activity | Figure |
|---|---|---|---|---|
| #1 | Pirouette | use installation, change speed through body movements | Figure 2a | |
| “Forces” | #2 | Cup | cup, lace, pencil; does the cup break? | Figure 2b |
| #3 | C. regulator | observe model, watch video | Figure 2c | |
| #1 | Thunder | video: thunderstorm; count seconds: sound through tube | Figure 2d | |
| “Sound” | #2 | Spoon | listen via medium air/laces: two teaspoons hit each other | Figure 2e |
| #3 | Vacuum Bell | listen while pump makes vacuum around ringing bell | Figure 2f | |
| #1 | Light-table | try out convex and concave lenses | Figure 2g | |
| “Light” | #2 | Letterboard | experiments with long- and short-sightedness | Figure 2h |
| #3 | Up-Down | observe projected image through lenses, film | Figure 2i |
Table 3.
Media form evaluation of generic learning trails. Relevant parameters are marked with ✓ if the condition is met and with ✗ otherwise. Unmarked entries do not have an impact according to Table 1. Values with a weak impact are shown for completeness.
Table 3.
Media form evaluation of generic learning trails. Relevant parameters are marked with ✓ if the condition is met and with ✗ otherwise. Unmarked entries do not have an impact according to Table 1. Values with a weak impact are shown for completeness.
| Media Form | C | N | I | P | U | S | A | E a | Decision |
|---|---|---|---|---|---|---|---|---|---|
| Narrative | ✓ | ✓ | ✓ | ✓ b | ✗ | ✓ | |||
| Interactive | ✗ | ✗ | ✓ | ✗ | |||||
| Communicative | ✓ c | ✓ c | |||||||
| Adaptive | ✗ | ✗ | ✗ | ✓ | ✓ | ✗ | |||
| Productive | ✗ | ✗ | ✗ | ✗ | ✓ c | ✗ |
a impact is considered weak for the generic learning trails; b if visitor is alone; c if visitor is in a group.
Table 4.
Formulation of the questions and scales for experiment i and learning trail t. The second column indicates the category (L, like; R, recommend; A, use again; and K, knowledge).
Table 4.
Formulation of the questions and scales for experiment i and learning trail t. The second column indicates the category (L, like; R, recommend; A, use again; and K, knowledge).
| Q.Id. | Cat. | Formulation |
|---|---|---|
| L | How much did you like Experiment ? — scale: 1–7 (not at all–very much) | |
| R | I recommend Experiment to others who visit the science centre. Scale: 1–7 (totally disagree–totally agree) | |
| A | When I’ll visit the science centre next time, I’ll use Experiment . Scale: 1–7 (totally disagree–totally agree) | |
| K | How much did you know from your school classes about the topic of Experiment . Scale: 1–5 (1 = nothing, 2 = a little, but don’t remember much, 3 = something, 4 = quite a lot, 5 = very much) | |
| LB | Which of the experiments , , did you like best? |
Table 5.
Number of group leaders who liked each experiment best.
| Experiment | #1 | #2 | #3 | No Vote |
|---|---|---|---|---|
| “Forces” | 9 | 4 | 0 | 1 |
| “Sound” | 3 | 5 | 5 | 1 |
| “Light” | 4 | 0 | 6 | 3 |
Table 6.
Results from the knowledge questions shown as the percentages of correct answers (all participants, ). Questions to content not addressed in the respective experiment are marked with *.
Table 6.
Results from the knowledge questions shown as the percentages of correct answers (all participants, ). Questions to content not addressed in the respective experiment are marked with *.
| Question | “Forces” | “Sound” | “Light” |
|---|---|---|---|
| #1 | 73% | 69% | 44% |
| #2 | 21% | 21% | 19% |
| #3 | 24% | 72% | 14% |
| #4 | 9% | * 13% | 11% |
| #5 | 65% | * 71% | 50% |
| #6 | * 3% | 14% | 88% |
| #7 | 21% | 56% | 0% |
| #8 | 12% | 15% | 42% |
| #9 | * 56% | 78% | 54% |
| mean | 32% | 45% | 36% |
© 2019 by the authors. Licensee MDPI, Basel, Switzerland. This article is an open access article distributed under the terms and conditions of the Creative Commons Attribution (CC BY) license (http://creativecommons.org/licenses/by/4.0/).
Share and Cite
MDPI and ACS Style
Leister, W.; Tjøstheim, I.; Joryd, G.; Andersson, J.A.; Heggelund, H. Strengthening Engagement in Science Understanding with Learning Trails. Multimodal Technol. Interact. 2019, 3, 48. https://doi.org/10.3390/mti3030048
AMA Style
Leister W, Tjøstheim I, Joryd G, Andersson JA, Heggelund H. Strengthening Engagement in Science Understanding with Learning Trails. Multimodal Technologies and Interaction. 2019; 3(3):48. https://doi.org/10.3390/mti3030048
Chicago/Turabian StyleLeister, Wolfgang, Ingvar Tjøstheim, Göran Joryd, Jan Alfred Andersson, and Håvard Heggelund. 2019. "Strengthening Engagement in Science Understanding with Learning Trails" Multimodal Technologies and Interaction 3, no. 3: 48. https://doi.org/10.3390/mti3030048