Article

Film Cooling Effectiveness Downstream of Trailing Edge Slots Including Cutback Surface Protuberances †

1
Department of Engineering Science, University of Oxford, Oxford OX1 3PJ, UK
2
Rolls-Royce plc., Bristol BS34 7QE, UK
*
Author to whom correspondence should be addressed.
This paper is an extended version of our paper published in Proceedings of the European Turbomachinery Conference, ETC’11, 2015, Paper No. 254.
Int. J. Turbomach. Propuls. Power 2016, 1(1), 4; https://doi.org/10.3390/ijtpp1010004
Submission received: 17 October 2016 / Accepted: 5 December 2016 / Published: 17 December 2016

Abstract

:
The trailing edge of the high pressure turbine blade and vane presents significant challenges to the turbine cooling engineer. The current research has focused specifically on the effect of cutback surface protuberance, or “land”, shapes on film cooling effectiveness. A set of six different land geometries has been investigated in a large scale model of the trailing edge pressure side ejection slot exit. Slot height and width and lip height was maintained. Pressure sensitive paint was used to measure adiabatic film cooling effectiveness at five blowing ratios ranging from 0.6 to 1.4 in increments of 0.2. High-resolution full surface distributions of film cooling effectiveness both on the cutback surface and the top of the lands were recorded. It was found that tapering the lands did not significantly increase effectiveness on the lands and slightly reduced effectiveness near the lands. Using a diffuser shape improved average effectiveness greatly and gave the best overall performance up to the end of the lands except at the lowest blowing ratio of 0.6, where having no lands was slightly better.

1. Introduction

1.1. The Need for Trailing Edge Cooling Research

In order to increase the fuel efficiency of civil turbofan engines, manufacturers have continued to increase the operating temperatures and pressures of new engine designs. Current designs feature high pressure turbine entry temperatures that far exceed the blade and vane material melting point, and thus require the use of air film cooling to shield the exterior surface from the hot mainstream gas and maintain an acceptable metal temperature and component life. This use of air is detrimental to engine efficiency since a reduced amount of work is extracted from it by the engine and its introduction back into the mainstream incurs aerodynamic losses. This means that if the amount of cooling air required becomes too large, the reduction of efficiency due to cooling can outweigh the increase in efficiency due to a high turbine entry temperature [1].
A particularly challenging part of the high pressure blade and vane is the trailing edge. This section endures very high temperatures and mechanical stresses, but aerodynamic efficiency requirements dictate that it must be tapered to the end with minimal thickness. The thin profile makes it difficult to feed directly with coolant internally and necessitates the use of film cooling. A common method of film cooling the trailing edge is to position film cooling holes or slots just upstream of the trailing edge on the pressure surface side. Modern designs may include a cutback region where material is removed from the pressure surface between the film hole exits and the trailing edge to allow the coolant to exit almost tangentially to the mainstream and also reduce the risk of blockage. Cooling slots have an advantage over cooling holes in that the film is uniform along the spanwise width, which provides even surface coverage, and the Coanda effect causes the film to stick to the surface more readily rather than lifting off into the mainstream gas [2]. However, continuous cooling slots are not mechanically robust as the slot weakens the design. This makes them poorly suited to areas that undergo severe mechanical and thermal stresses like the trailing edge. These considerations cause designers to use interrupted cooling slots that have an internal “bridge” connecting the two sides and dividing the continuous slot into discrete slots, as well as an external protuberance, or “land”, which extends from the bridge to the trailing edge, dividing and stiffening the cutback area. An example of a pressure surface slot cooling design is shown in Figure 1. Aside from blades and vanes, slot cooling also has applications in other components that require film cooling and use rows of film cooling holes, such as those studied by Cresci et al. [3].

1.2. Literature Review

There have been many studies investigating general film cooling slots experimentally. Goldstein [4] provided a review of much relevant work up to that year on various slot designs including tangential and angled slots. Kacker and Whitelaw [5] showed that the effect of mainstream boundary layer thickness on adiabatic film effectiveness is small. Mukherjee [6] performed a literature survey to form a number of correlations for predicting film effectiveness and the length of the initial “potential core” region of unity effectiveness. Sturgess [7] and Sturgess and Pfeifer [8] investigated the film cooling of practical combustor slots. They formed a geometric parameter, MIX N , for characterising practical combustor slot geometries and reported the relationship between potential core length, blowing ratio, and M I X N .
Several studies have focused on slots applied to the turbine blade trailing edge. Taslim et al. [9] studied the film cooling effectiveness on the cutback surface downstream of the slot with straight bridges and lands dividing the slots. They varied injection angle, lip thickness to slot height ratio, slot width to slot height ratio, blowing ratio and density ratio. Martini et al. [10] investigated how three different slot designs used in modern blades affect the film cooling effectiveness, heat transfer coefficients and discharge coefficients in the near slot region of the cutback. These geometries featured different internal slot geometries but no external lands on the cutback surface. Murata et al. [11] used the transient infrared thermography method to compare four different slot geometries for film cooling effectiveness and heat transfer coefficients. Two of these featured plain slots with straight lands and tapered lands respectively. Yang and Hu [12,13] used stereoscopic particle image velocimetry (PIV) to take flow field measurements of an interrupted slot geometry with and without tapered diffuser lands and compared these with film cooling effectiveness maps acquired using the pressure sensitive paint (PSP) technique. Ling et al. [14] used an MRI technique to take velocity field and film effectiveness measurements using tapered straight and diffuser lands. The work in this paper is an extension of the conference proceedings published in Wong et al. [15]. This was later developed further using slot modifications in Wong et al. [16]. Gurram et al. [17] used PSP to measure effectiveness on a full blade profile at engine Mach numbers. Telisinghe et al. [18] studied the aerodynamics of various engine cutback geometries.

1.3. Aim of Work

To the best of the authors’ knowledge, there has been little detailed study in the open literature focusing on the effect of land shapes on film cooling effectiveness, both on the cutback surface after the slot and on top of the land itself. The scope of the current work is to provide a set of experimental data with detailed film cooling effectiveness maps for six different land shapes similar to modern blade designs. These will then be compared with the literature where possible and then back-to-back with each other in order to make recommendations for cooling engineers.

2. Materials and Methods

2.1. Experimental Set-Up

The experiments were conducted in one of the low speed facilities of the Osney Thermo-Fluids Laboratory (University of Oxford, UK). A large scale model of a portion of the trailing edge pressure side slot and cutback was manufactured. A schematic of the rig is shown in Figure 2. A detailed cross-sectional plan and side views of the test section are shown in Figure 3.
The mainstream flow was ambient air drawn in through the open intake by a water ring vacuum pump. The air passed through an air filter at the intake, a flow restriction and a settling section before entering the test section. The settling section was sufficiently long to reduce any influence of the inlet restrictions on the velocity profile at the test section. Following the test section, the mixed flow entered an outlet plenum before exiting through five hoses. The hoses combined into a single long pipe with an orifice plate for mass flow measurement and a valve for mass flow control before going to the vacuum pump.
The coolant flow was made up of a mixture of air from the 689 kPa laboratory compressed air supply and nitrogen from a compressed nitrogen bottle, both at ambient temperature. The coolant air–nitrogen ratio and flow rate were controlled by two automatic mass flow controllers, one for each source. The two streams were mixed in a hose manifold system before entering the coolant plenum, which contained a perforated plate to dissipate the jets from the hose inlets. The coolant then passed through the slot and onto the test plate where it mixed with the mainstream flow.
The permanent portion of the test section was laser cut from stainless steel (Microkerf, Leicester, UK). The removable Perspex window manufactured in-house was positioned above the test plate and slot to allow for easy removal of the slot geometry and lands while also allowing full optical access. The slot geometry was manufactured using stereolithography (Rolls-Royce rapid prototyping facility, Bristol, UK) as a plain rectangular slot divided into three by bridges and lands with dimensions as shown in Figure 3. Three slots were included so that any lateral effects due to the boundary layers of the test section walls would not significantly affect the central slot where the measurements were taken. The test plate and lands were made from aluminum in-house and were removable to allow painting and testing of different land geometries. The six land geometries tested are shown in Figure 4 and are denoted L1–L6. Except for the “no lands” configuration, they all have the same height, width and depth. The mainstream channel height was small, with a low aspect ratio to allow easy access to the removable components inside.

2.2. Measurement Technique

The UniFIB PSP (Supplied by Aircraft Research Association, Bedford, UK) used contained a blend of fluoro/isopropyl/butyl polymer (FIB), platinum tetra(pentafluorophyenyl)porphine (PtTFPP) and white pigment. PtTFPP is a luminophore that is sensitive to oxygen. FIB is a gas-permeable polymer binder used to suspend the luminophore on the painted surface while allowing oxygen molecules to diffuse into the polymer and interact with the luminophore. When exposed to light of a wavelength range of 380 nm to 520 nm , the luminophore molecule is excited to a higher electronic state. The molecule returns to its ground state by emitting photons with a wavelength in the range from 620 nm to 750 nm . Alternatively, the luminophore molecule can follow a non-radiative process and return to its ground state if it comes in contact with an external molecule of oxygen. This is known as oxygen quenching as explained by Quinn et al. [19]. The intensity of the emitted light reduces with an increase in partial pressure of oxygen in contact with the painted surface. This feature can be used to measure the partial pressure of oxygen at all points on the painted surface. If the concentration of oxygen in the fluid is known, then the absolute pressure on the surface can be found. Alternatively, if two streams of fluid with different, known concentrations are used, then PSP can be used to determine the proportions of the two streams present in the mixed gas at any particular location. In the case of a film cooled surface, the adiabatic film cooling effectiveness can be calculated using the mass transfer analogy as explained by Han and Rallabandi [20]. A comparison between the PSP technique and the thermochromic liquid crystal technique for measuring film cooling effectiveness can be found by Caciolli et al. [21].
In the present research, the test plate and lands were painted with UniFIB by airbrushing and illuminated by a grid of 12 blue LED lamps at a wavelength of approximately 470 n m . The intensity images were taken using an Allied Vision Technologies Bigeye G-283B Cool monochrome CCD (Supplied by Stemmer Imaging, Tongham, UK) camera with a 610 n m long pass filter at a resolution of 1928 × 1452 pixels. The entire test section, lights and camera were surrounded by black sheets to maintain as dark an environment as possible and reduce PSP degradation over time. In order to reduce the effects of noise in the image, 30 frames were taken for every experimental condition and each pixel was averaged over the 30 frames to create the intensity images used for post processing. A dark image was also taken with the blue LEDs turned off to take into account any remaining ambient light and sensor inconsistencies. The images, pressure and temperature data were recorded using MATLAB Image Acquisition Toolbox (Version 4.6 (R2013b), MathWorks, Cambridge, UK) and LabVIEW (Version 13.0f2, National Instruments, Newbury, UK).

2.3. Calibration

The PSP was calibrated in situ by taking eleven intensity images at known partial pressures of oxygen I mix , eleven corresponding reference intensity images at ambient conditions I ref , and one dark image I dark . The partial pressure was set by flushing the test section with a steady mixture of air and nitrogen at known mass flow rates. The mass flow rate was kept low, at only several g · s 1 and maintained for a few minutes to ensure full coverage without significant local pressure variations. The absolute pressure on the painted surface p s , surf , was measured using a static pressure tapping on the surface. The ambient pressure p atm , was measured using a mercury barometer situated nearby.
Air and nitrogen have known molecular weights, M W air = 28.95 kg · kmol 1 and M W N 2 = 28.01 kg · kmol 1 , respectively. The molecular flow rate of the air and nitrogen streams at each calibration point was calculated using Equation (1). The streams were mixed before entering the test section and the mole fraction of oxygen in the combined air and nitrogen mixture, n mix was calculated using Equation (2), where the mole fraction of oxygen in the air stream was n air = 20.95 % . The partial pressure of oxygen on the painted surface p ( O 2 ) surf was calculated by multiplying with the measured surface pressure from the pressure tappings using Equation (3). The partial pressure of oxygen under reference (ambient) conditions p ( O 2 ) ref was simply the ambient pressure multiplied by the mole fraction of oxygen in air, Equation (4). The ratio of intensities was adjusted for the dark as in Equation (5) and averaged over the entire investigated area to give 11 mean values of intensity ratio, I ratio . This was then plotted against the ratio of the two partial pressures, p ( O 2 ) surf / p ( O 2 ) ref to create a mean calibration curve using a cubic fit as shown in Figure 5a. An alternate calibration curve using only a 400 pixels square sample around the pressure tapping was also created and found to be practically identical (see Figure 5b), showing that there was no significant non-uniformity over the investigated area.
M ˙ = m ˙ M W ,
n mix = n air × M ˙ air M ˙ air + M ˙ N 2 ,
p ( O 2 ) surf = n mix × p s , surf ,
p ( O 2 ) ref = n air × p atm ,
I ratio = I ref I dark I mix I dark .

2.4. Calculating Effectiveness

The film cooling effectiveness measurements were taken by running the experiment twice for each geometry at each blowing ratio —once using nitrogen as the coolant, and once using air as the coolant. Intensity images were taken at each condition just as in the calibration and converted to values of p ( O 2 ) surf / p ( O 2 ) ref for each pixel with nitrogen and with air as the coolant. This was related to film effectiveness by Equation (6), where the coolant gas has a similar molecular weight as air, as derived by Han and Rallabandi [20]:
η = T aw T T c T 1 p ( O 2 ) surf , N 2 / p ( O 2 ) ref p ( O 2 ) surf , air / p ( O 2 ) ref .
The second run with air as the coolant is necessary in order to account for the local changes in p ( O 2 ) surf caused by the geometry and flow field rather than by nitrogen mixing. In a low speed test like this, where local pressure variations are very small, p ( O 2 ) surf , air / p ( O 2 ) ref is close to 1. The post-processing and analysis codes used to process the data were written in MATLAB.

2.5. Operating Conditions

The total exit flow including both mainstream and coolant gas was set at 31 g · s 1 and the blowing ratio was set by adjusting the mass flow ratio between the mainstream and coolant streams using the mass flow controllers. Mainstream air was at ambient conditions of approximately 293 K , 101 kPa , with a mean flow velocity in the range from 6.6 m · s 1 to 7.8 m · s 1 (calculated from the measured mainstream mass flow rate, density and area). Coolant gas was also at ambient temperature, giving a density ratio of approximately 1. The coolant stream velocity varied from 4.8 m · s 1 to 9.5 m · s 1 depending on the blowing ratio. The Reynolds number of the coolant stream Re c , based on the slot height, varied from 1400 to 2750. Blowing ratio M was defined as in Equation (7), and, in this study, varied from 0.6 to 1.4 in increments of 0.2:
M = ρ c u c ρ m u m = m ˙ c A m m ˙ m A c .

2.6. Experimental Uncertainties

The position and intensity of the lighting was not changed throughout the calibration and tests to ensure as consistent lighting as possible. The camera aperture and exposure was set such that the majority of the sensor’s intensity range was used without causing saturation at any local point. Maximum local intensity was 90% and maximum mean intensity was 60% for zero p ( O 2 ) / p ( O 2 ) ref . Calibration showed a maximum deviation of recorded data from the cubic fit curve to be less than 3%. Since there is some calibration drift over time, it was ensured that the calibration curve used for tests was not older than ten days. Following the perturbation method of Moffat [22], the greatest uncertainty in film effectiveness measurements is at lower effectiveness when the difference in intensity between the reference and test images is smaller. For η = 0.2 , uncertainty is ≈0.071 in absolute effectiveness value and for η = 0.8 , uncertainty is ≈0.015. Blowing ratio uncertainty was calculated to be ≈9%.
In order to take into account temperature effects on the response of the PSP, a gas thermocouple was used to measure the coolant temperature just before entry into the slot. Han and Rallabandi [20] showed that temperature effects can be reduced by ensuring that a reference image is taken at the same temperature as each test image during calibration and during the experiments. By monitoring the coolant temperature and taking a separate reference image immediately after each test image, the temperature effects were minimised for the current study.
The density ratio used in the current study was different to a typical real engine density ratio of over 2. However, relative effectiveness comparisons between the different geometries in the current study as well as other studies conducted at similar density ratios is still possible, and the data forms a basis for co-validation with numerical simulations in the future.
The low height of the mainstream channel at 3.25 slot heights potentially causes suppression of the vortex shedding from the slot lip, while the lack of an accelerating mainstream flow as in a full turbine blade will also have an effect on coolant mixing. This limits the direct applicability of the effectiveness measurements taken in this study to a real blade model. However, by comparing to the baseline plain slot geometry, it is still possible to make back-to-back comparisons and judge the suitability of each cross corrugated slot design when applied to trailing edge cooling designs, reducing the number of geometries that must be tested in the high speed facility developed as a continuation of this work and published by Gurram et al. [17].

3. Results

The PSP technique allows high resolution full surface adiabatic film effectiveness measurements over the cutback surface and top of the lands to be made. The approximate view area and coordinate system is defined in Figure 3, where x is the downstream distance from the slot exit and z is the spanwise displacement from the centreline. These are non-dimensionalised by the slot height of the plain rectangular slot to give x / H and z / H , where H = H slot = 4.6   m m . Measurements were taken for M = 0.6 , 0.8 , 1.0 , 1.2 , 1.4 .
Figure 6 shows all the plots of effectiveness taken. All of the figures show a plan view of the cutback region and lands. The slot exit and lip is aligned with the top border of the plots, i.e., where x / H = 0 . The centreline is at the midpoint between the lands where z / H = 0 . Blue regions show poor coverage from the nitrogen coolant and correspond to low film cooling effectiveness and red regions correspond to high effectiveness. The lands, where applicable, can be seen as the predominantly blue regions in the top left and top right corners of each plot. Some marks are consistently visible in the same position over the lands for all the geometries. These are due to scratches on the Perspex window.

4. Discussion

4.1. Land Effectiveness

Figure 7 shows a close-up view of the right-hand side land of geometry L2 with effectiveness shown using 10 contour bands at all five blowing ratios. It can be seen that film cooling effectiveness was very low on top of the land, not exceeding 0.3 over the majority of its surface. This shows that very little coolant was able to wash over the land and is common to all the land shapes with the exception of L1. It does appear to show that effectiveness increased very slightly with M from the 0.1 0.2 band to the 0.2 0.3 band. However, this higher effectiveness band appeared to grow away from the slot exit in tandem with the 0.9 1.0 band on the cutback surface as M increased. The low effectiveness also corresponds to low emission intensity and a smaller difference in intensity with the reference image. This makes it more sensitive to other sources of illumination and increases the measurement uncertainty. Therefore, it is possible that this small observed increase in effectiveness on the land was actually due to the high intensity red light from the cutback surface reflecting on the inside of the window on to the land surface.
Figure 8a shows a close-up view of geometry L1, where the right-hand side land would normally be. There was better film cooling effectiveness in the gap region where the land would have been, as the recirculation region created by the end of the internal bridges encouraged the coolant flow to enter the gap.
Figure 8b shows the same view of geometry L4, where the land was tapered down to meet the cutback surface. While the majority of the land surface had low effectiveness as mentioned previously, there was a small increase in effectiveness apparent along the left and right edges of the land, an effect more apparent at low M. Here, the mainstream air appeared to stick to the land surface all the way to the end, encouraging some mixing with the coolant air as it was brought down to the cutback level. This increased the effectiveness slightly on the sides of the land but reduced the effectiveness on the cutback next to the land. This same small increase in effectiveness along the edges of the land was also apparent in geometry L6 (Figure 8d), the tapered diffuser land, when compared to its non-tapered counterpart, L5 (Figure 8c).

4.1.1. Comparison with Literature

Yang and Hu [12] showed surface plots of film cooling effectiveness using a “no land” geometry similar to geometry L1 and a tapered diffuser geometry similar to geometry L6. They used the same H lip / H slot = 1 , but a much smaller W slot / H slot = 2 compared to the current study’s W slot / H slot = 12 . Their report showed a similar result for the “no land” geometry, with the coolant flow able to spread into the gap region. However, their report for the tapered diffuser geometry showed significantly higher film effectiveness on top of the land, as much as 0.4 near the lip and 0.7 towards the end. This discrepancy could be due to the difference in Re c ( Re c = 2800 for Yang and Hu [12] and Re c = 1400 2750 for the current study) and also W slot / H slot used in the two studies. Their stereoscopic PIV measurements identified the vortices originating from the corners of the slot channels as the main factor encouraging coolant flow to wash over the top of the lands, especially when M < 1.0 . The proximity of the two corners of the slot channels may be a factor in determining how the vortices form and to what extent they encourage flow to wash over the lands, although no 3D or unsteady flow data was taken in the current study to confirm this.
Murata et al. [11] reported effectiveness measurements taken over the top of the lands for straight and diffuser lands using W slot / H slot = 4.6 . They found very low effectiveness down the length of the lands, not exceeding 0.25 along the centre, with higher effectiveness along the edges. Ling et al. [14] used an MRI technique to take effectiveness measurements over the top of the lands for straight and diffuser lands using W slot / H slot = 3 . They also found very low effectiveness on top of the lands for the straight and weakly diffused lands, not exceeding 0.2 along the centre. Both of these reports are in agreement with the current study. However, Ling et al. [14] also tested a strongly diffused land with a high diffusion angle and tapering which showed some effectiveness up to 0.4 near the start of the land. They theorised that this was due to the strong tapering of the land in that case, rather than the diffusion, which caused flow separation at the start of the land leading to greater coolant mixing and higher effectiveness in that region. This bears some similarity in shape and results in the tapered diffuser geometry used by Yang and Hu [12], and may also be related to the relatively low W slot / H slot used in both studies.

4.2. Effectiveness Downstream of Land

In Figure 6, regions of medium film effectiveness are distinctly visible downstream of the lands (bridges in the case L1) where both mainstream air and coolant was drawn in to the gap to mix, resulting in effectiveness levels in the range 0.4 to 0.6. Geometry L5 had less pronounced wakes due to its sharp tips compared to the blunt trailing edges of the other geometries.
For the tapered geometries L4 and L6, the wakes downstream of each land had much lower effectiveness levels and were larger and more pronounced than the corresponding non-tapered equivalents, geometries L2 and L5, respectively. This was due to the tapered land surface creating a ramp for the mainstream air to follow directly down to the cutback surface without also allowing the coolant to mix after the land. The non-tapered land, on the other hand, created a sudden gap, which encouraged both the mainstream and coolant flow to mix together in more equal amounts, resulting in higher film effectiveness levels.

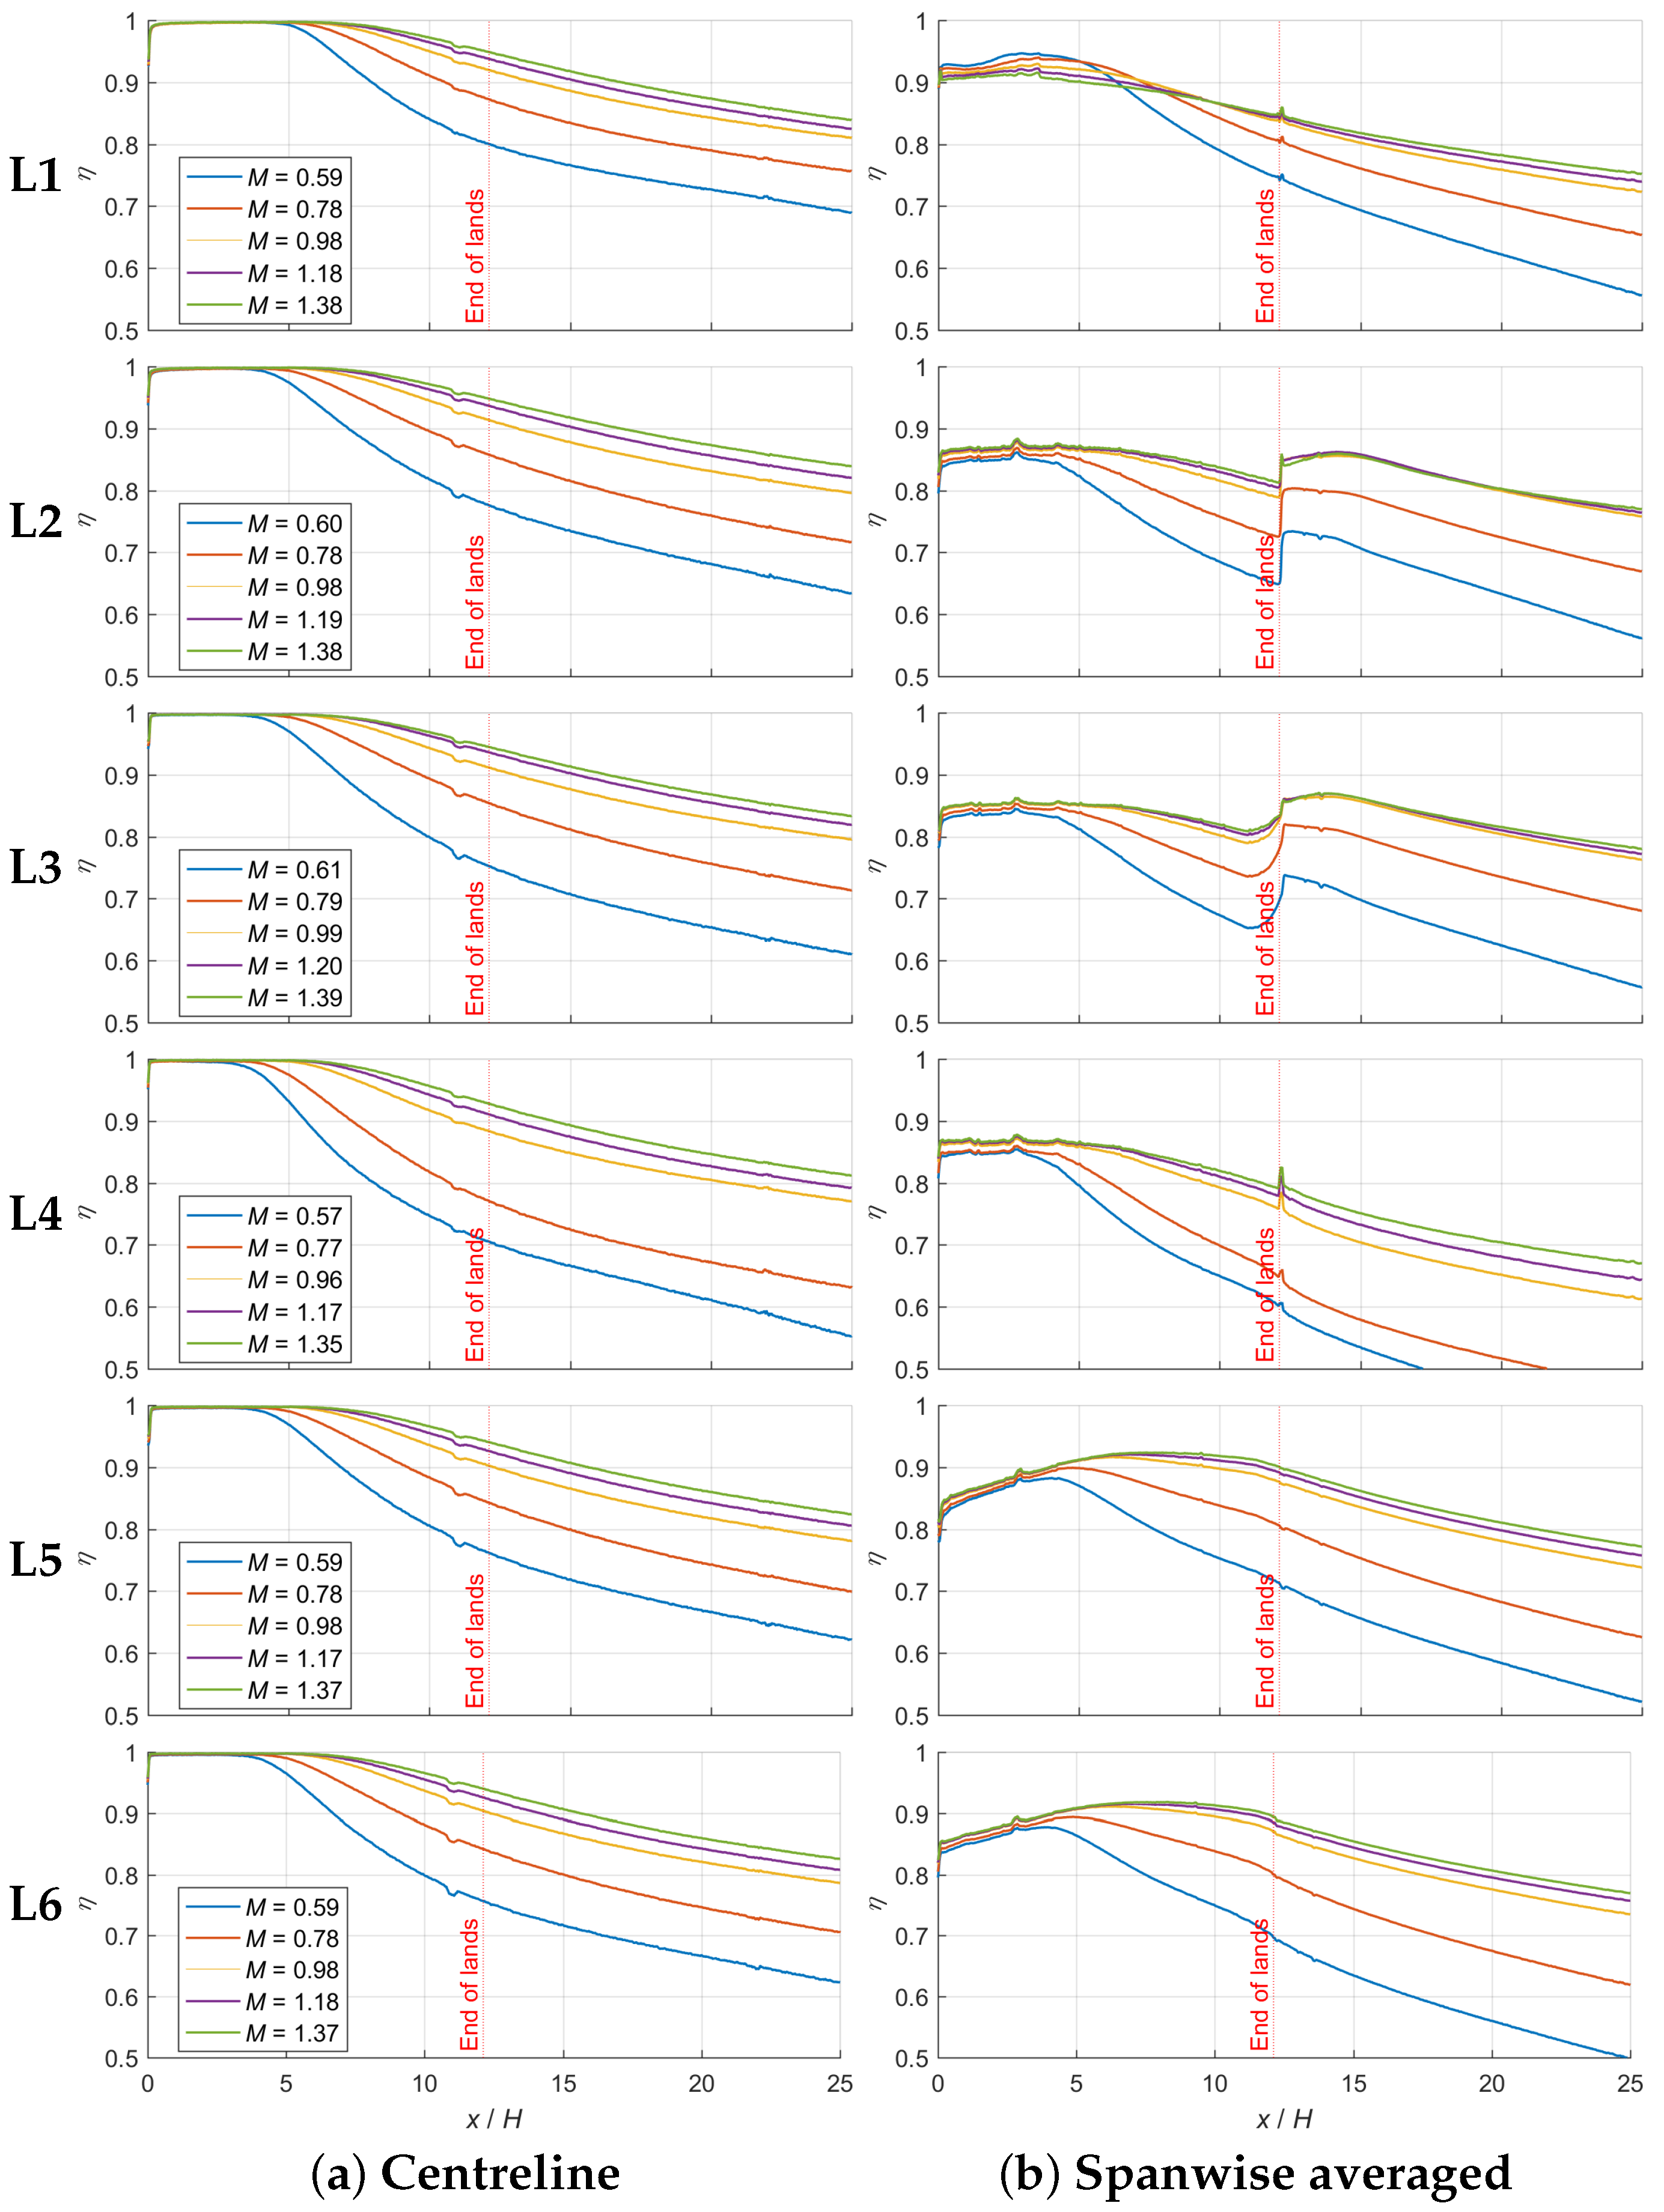
4.3. Centreline Effectiveness

Figure 9a shows plots of film cooling effectiveness down the slot centreline for each geometry. This included only a 100 pixel (8.43 m m ) wide strip down the centre of the cutback region extending downstream from the slot. The position of the end of the lands is marked in the plots.
Considering only the centreline effectiveness, all geometries show a similar overall picture, with initial unity effectiveness for some distance, called the “potential core” length x p , before decaying. This length is non-dimensionalised by the slot height of the plain rectangular slot to give x p / H , where H = H slot = 4.6   m m . In the current study, x p / H was determined by plotting the natural logarithm of the centreline effectiveness against the natural logarithm of x / H and taking a straight line extrapolation through the data to the point of implied unity effectiveness. This process is illustrated in Figure 10a using the block land as an example. x p / H increased with M for all geometries, as shown in Figure 10, to a maximum value of 8.6. The increase in x p / H becomes smaller as M increased, suggesting a non-linear relationship between the two. Aside from the tapered case, the shape of the land appeared to have little effect on x p / H .
The rate at which effectiveness decreased was greater for lower M. This agrees with the trends shown by Martini et al. [10] and Murata et al. [11] in their film effectiveness studies. Geometry L1 with no lands showed the highest effectiveness, followed by geometries L2, L3, L5 and L6, all with very similar centreline effectiveness for all M. Geometry L4 showed the lowest effectiveness, illustrating the previously mentioned issue of the mainstream flow being pulled down by the ramped surface, encroaching into the cutback region before the end of the lands and leaving a large “hot gas” wake behind each land which also affected the central slot region.

4.3.1. Comparison with Literature

Sturgess and Pfeifer [8] found that the potential core length to slot height ratio x p / H , increased with M to a peak value before reducing to a plateau value at very high M. x p / H was also found to increase with a reduction in the M I X N parameter (where M I X N = 0 corresponds to a clean slot with realistically thick lip) and H lip / H slot for the same M. No relationship between the optimum M with the largest x p / H and M I X N or H lip / H slot was found. The M I X N parameter is specific to combustor slot geometries, so not all the terms have a direct equivalent in a trailing edge slot. However, the current study can be approximated as a clean slot with an equivalent M I X N = 0 and H lip / H slot = 1 . Their data for M I X N = 0.04 and H lip / H slot = 0.4 , the closest available to the current study, is plotted in Figure 11, showing a maximum x p / H of 6.2 for M = 1.05 . When compared with the Sturgess and Pfeifer [8] data, x p / H is greater for all M, which may be due to the lower M I X N . The current study does demonstrate the non-linear relationship between M and x p / H , but there is insufficient data for a detailed comparison and the range of M in the current study did not show a peak value in x p / H .
Taslim et al. [9], using a clean tangential slot with H lip / H slot = 1 , W slot / H slot = 5 and Re c = 1400 12 , 000 , reported a linear correlation x p / H = 5 M , which is also plotted on Figure 11. This is slightly lower than the current study and could be due to the difference in Re c and W slot / H slot used. The proximity of the lands in their study may have encouraged mainstream and coolant mixing, resulting in the shorter x p / H compared to the current study. Predictions of x p / H , based on the correlations of Mukherjee [6], are also plotted on Figure 11. The correlations take Re c into account but are based on 2D slots without a finite slot width. These agree largely in magnitude with the current study while also being slightly higher than the data of Taslim et al. [9]. This indicates that the W slot / H slot used in the current study is sufficiently high to nearly approximate a 2D slot along the centreline. However, the correlations of Mukherjee [6] do predict a linear relationship between x p / H and M, which is not apparent in the current study. This could be due to the 3D effects of the flow.

4.4. Spanwise Averaged Effectiveness

Figure 9b shows plots of spanwise averaged film cooling effectiveness including the lands. The average was taken over the entire region in between the centre-points of the two lands.
Including the lands results in a lower spanwise average for all of the geometries, particularly up to the end of the lands. Geometry L1 had a starting effectiveness higher than the others at approximately 0.92. Since it had no lands, it was able to recover some effectiveness due to the coolant being able to spread into the gaps where the lands would be. This effect was more apparent for lower M due to the lower coolant exit velocity relative to the mainstream, resulting in higher near-slot effectiveness at low M, but this reversed before x / H = 7.5 . Even with this enhancement, however, the effectiveness at the end of the lands still reduced to 0.84, even for M = 1.4 .
All of the other geometries began with an effectiveness of approximately 0.85, since they all start with unity effectiveness across the slot and less than 0.2 on the lands. Geometries L2 and L3 both showed a sudden increase in effectiveness at the end of the lands due to the coolant spreading into the gap remaining, but this decayed quickly. The rounded geometry had a smoother jump owing to its curvature, but overall was almost identical to the block geometry. After the lands, the effectiveness shown by both geometries was slightly higher than L1, showing that the presence of the lands, while reducing the average effectiveness up to the end of the lands, also slightly delayed mixing with the mainstream by delaying the creation of the wake of low effectiveness.
As in the plots of centreline effectiveness, geometry L4 showed substantially lower effectiveness, as the mainstream was pulled towards the cutback surface, encouraging earlier mixing with the coolant next to the lands, reducing effectiveness between the lands. Unlike with geometries L2 and L3, the plot does not exhibit a sudden increase in effectiveness because the mainstream air followed the land surface all the way down to the cutback surface, which did not allow the coolant to spread into the gap.
The diffuser geometries L5 and L6 initially showed a gradual increase in average effectiveness down the length of the lands due to the coolant being allowed to spread over a larger cutback region by the gradually reducing land width, replacing the low effectiveness lands that brought down the average for the other geometries. This resulted in a peak effectiveness of 0.92 at x / H = 7.5 for M = 1.4 and 0.88 at x / H = 4.0 for M = 0.6 . For M > 0.8 , the effectiveness from x / H = 5 onwards was highest of all the geometries, reaching 0.89 at the end of the lands for M = 1.4 . However, for M < 0.8 , the coolant flow was insufficient to fill the entire region, resulting in effectiveness at the end of the lands becoming lower than geometry L1, although still higher than the other geometries. Effectiveness after the lands was slightly lower compared to L2 and L3, since there was no recovery at the end of the lands. The tapered version of the diffuser geometry, L6, showed effectiveness levels almost identical to the non-tapered version L5 up to the end of the lands. At this point, however, the wake of low effectiveness became apparent with the tapered version, resulting in slightly lower average effectiveness after the lands.

5. Conclusions

While the simplified nature of the experimental model limits the direct applicability of the measurements to a real blade or vane, the current research has successfully compared six land shape designs and shown the relative performance of each in terms of effectiveness.
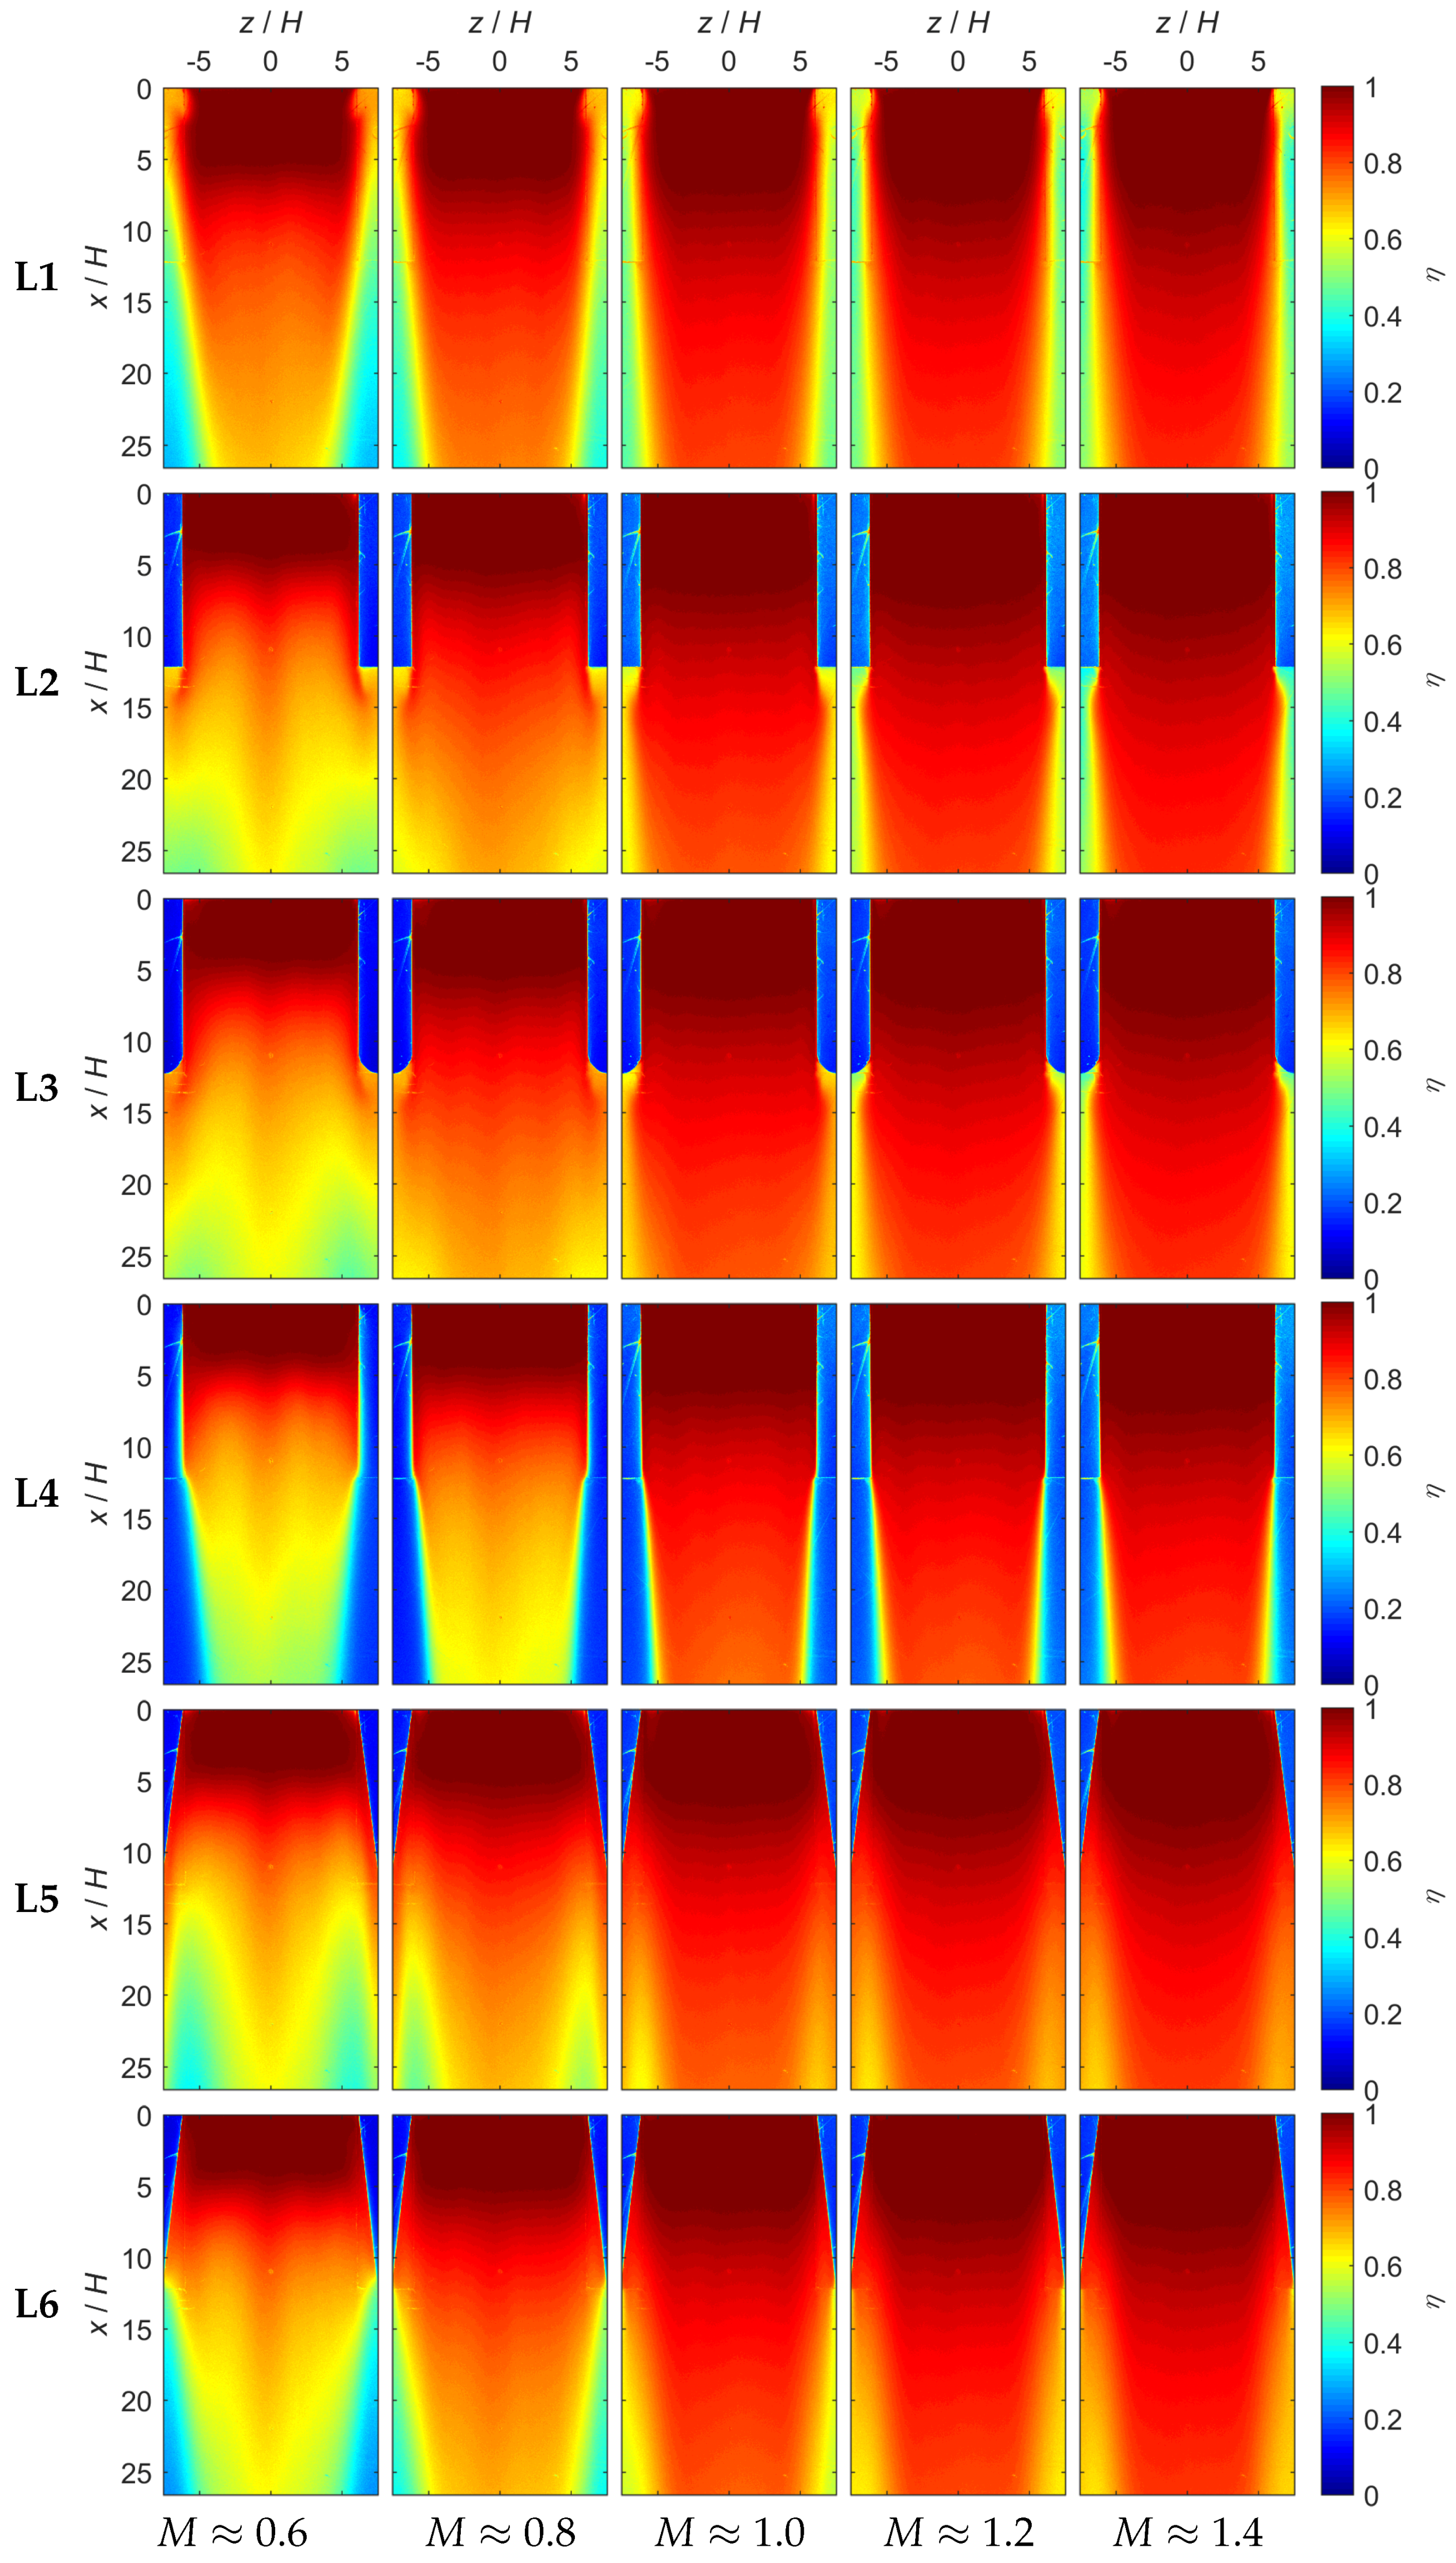
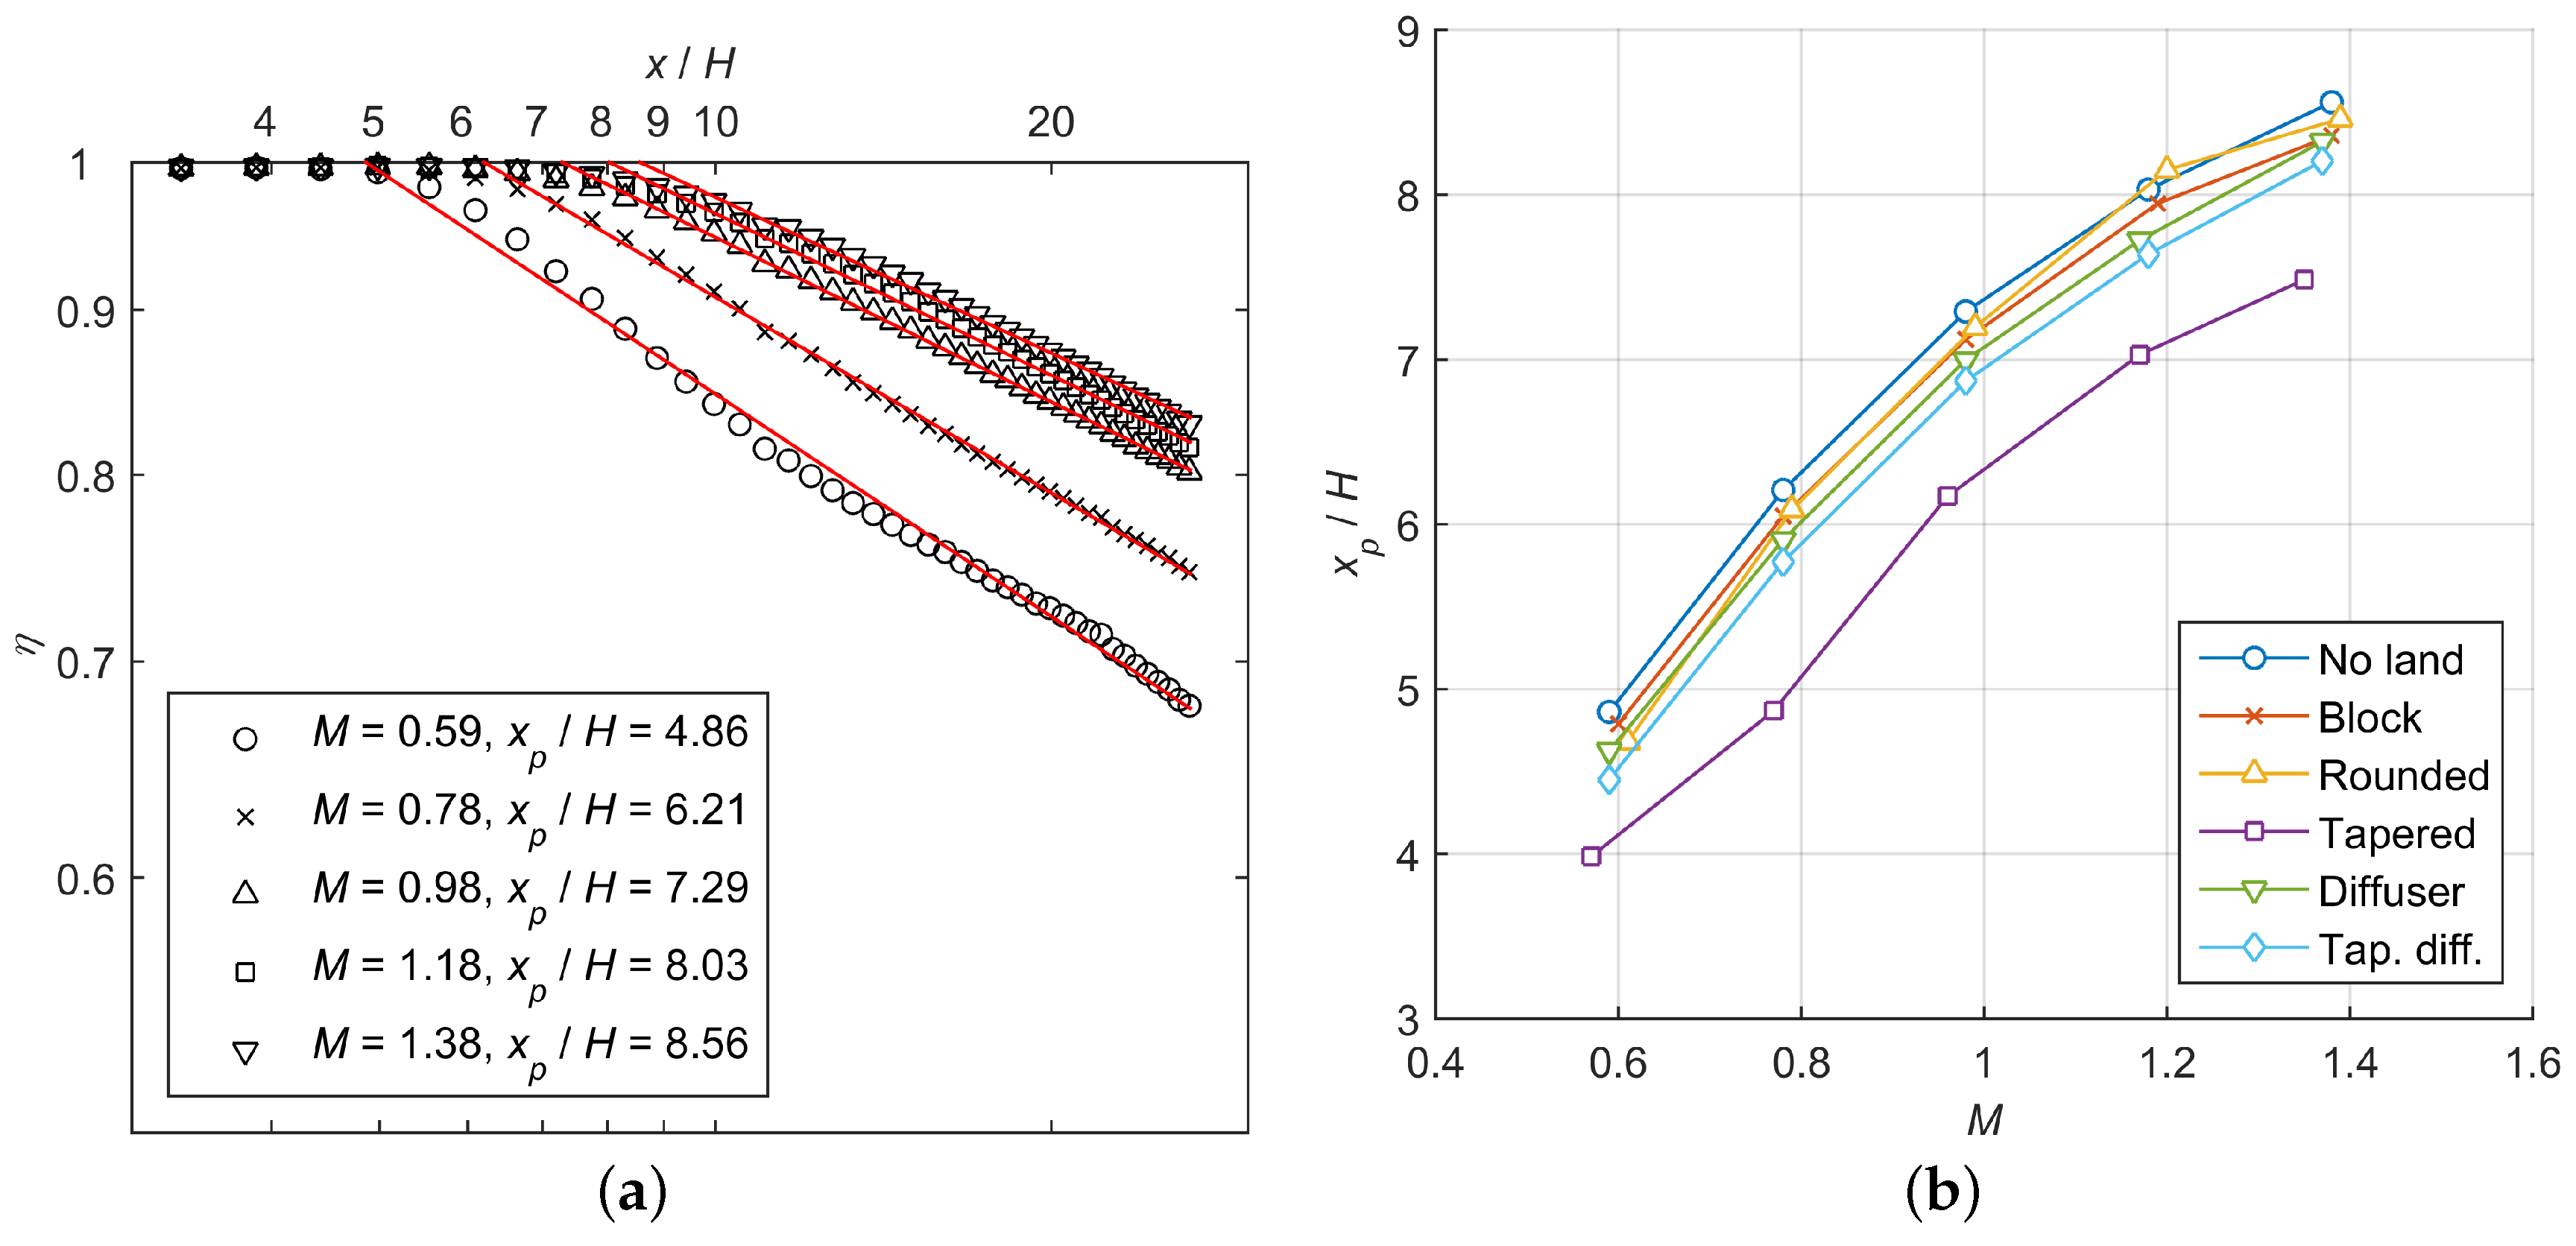
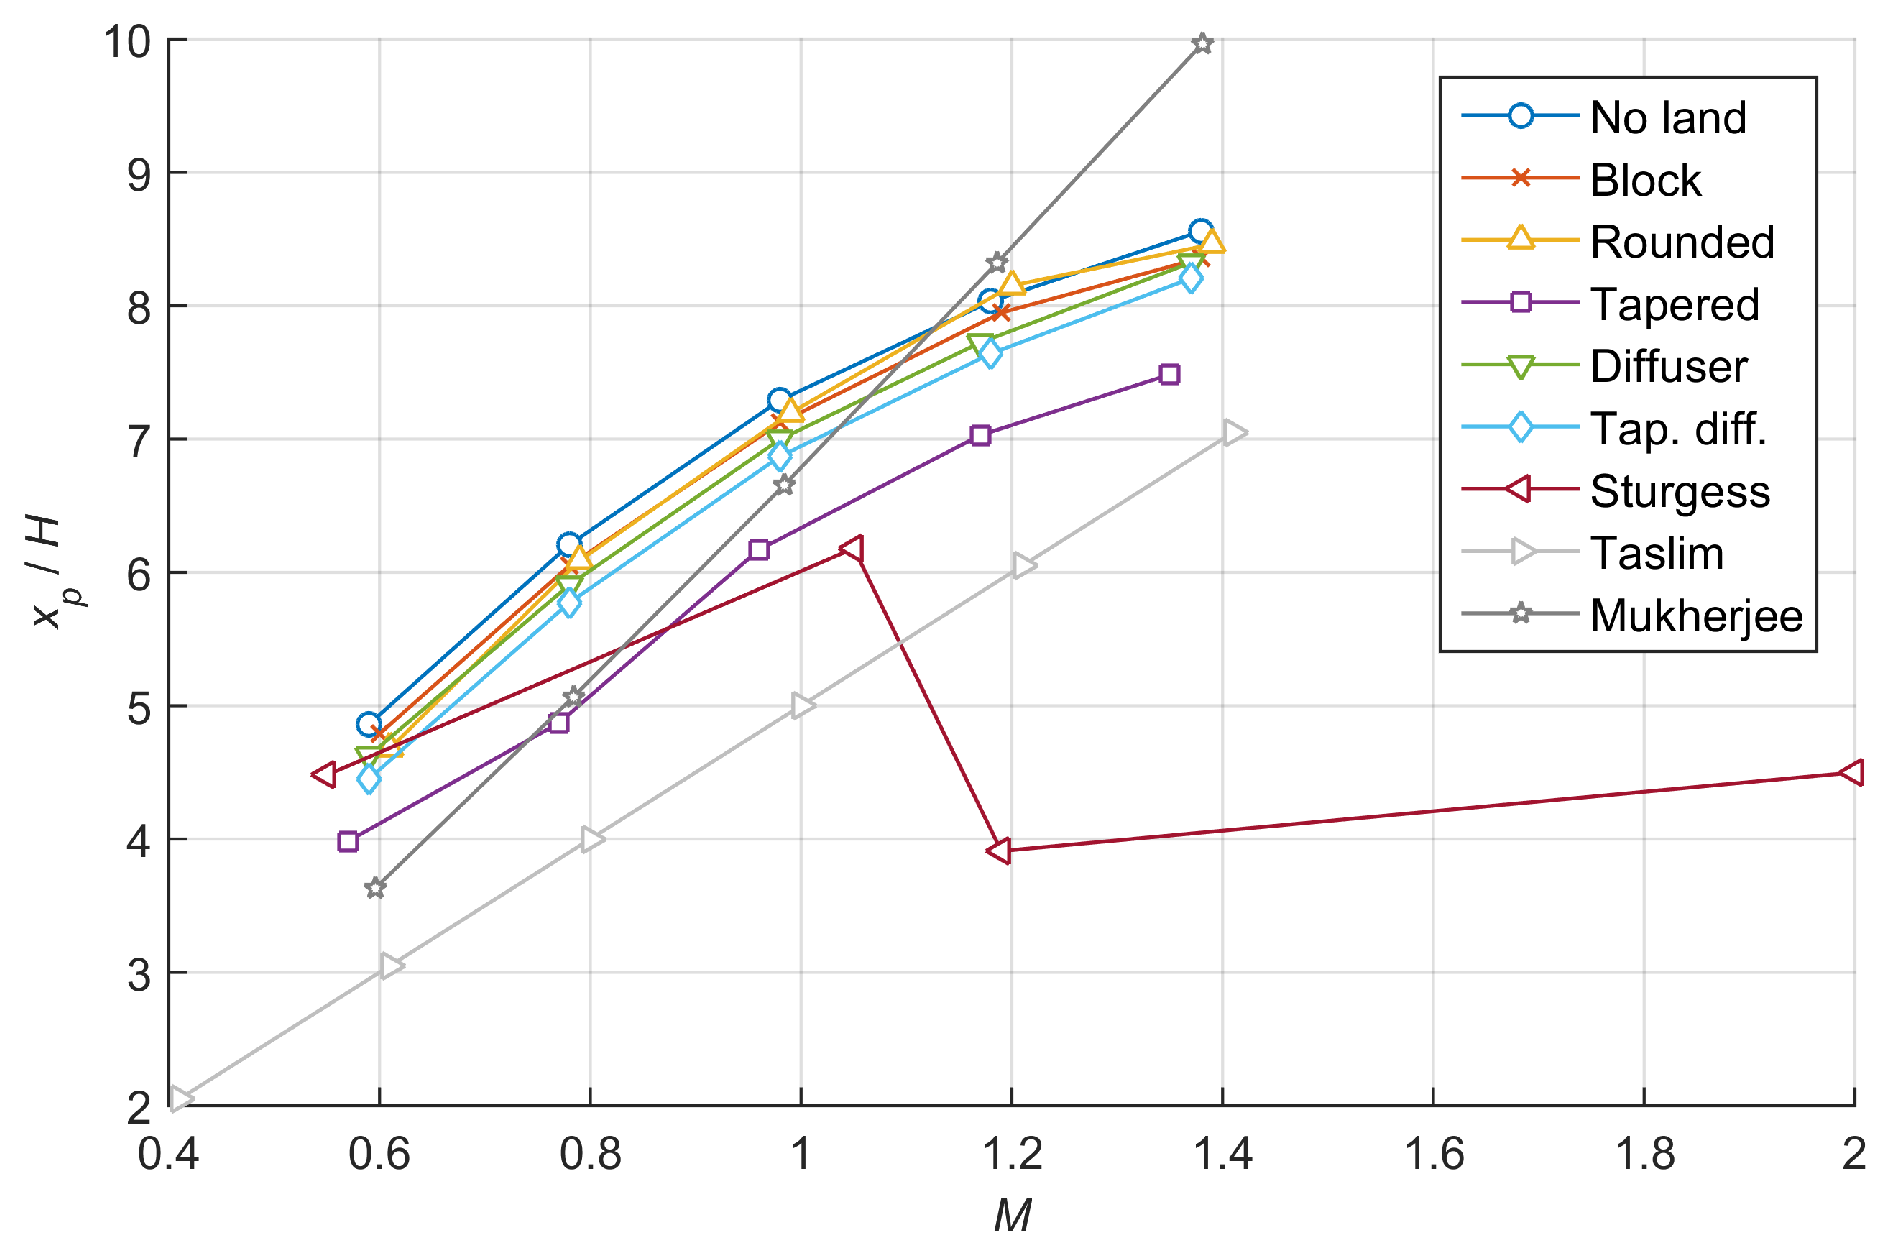
  • Increasing M increased the length of the potential core and also reduced the rate at which effectiveness decayed.
  • The length of the potential core, x p was mostly insensitive to the land geometry.
  • A non-linear relationship was found between M and x p / H , which could be due to 3D effects in the flow.
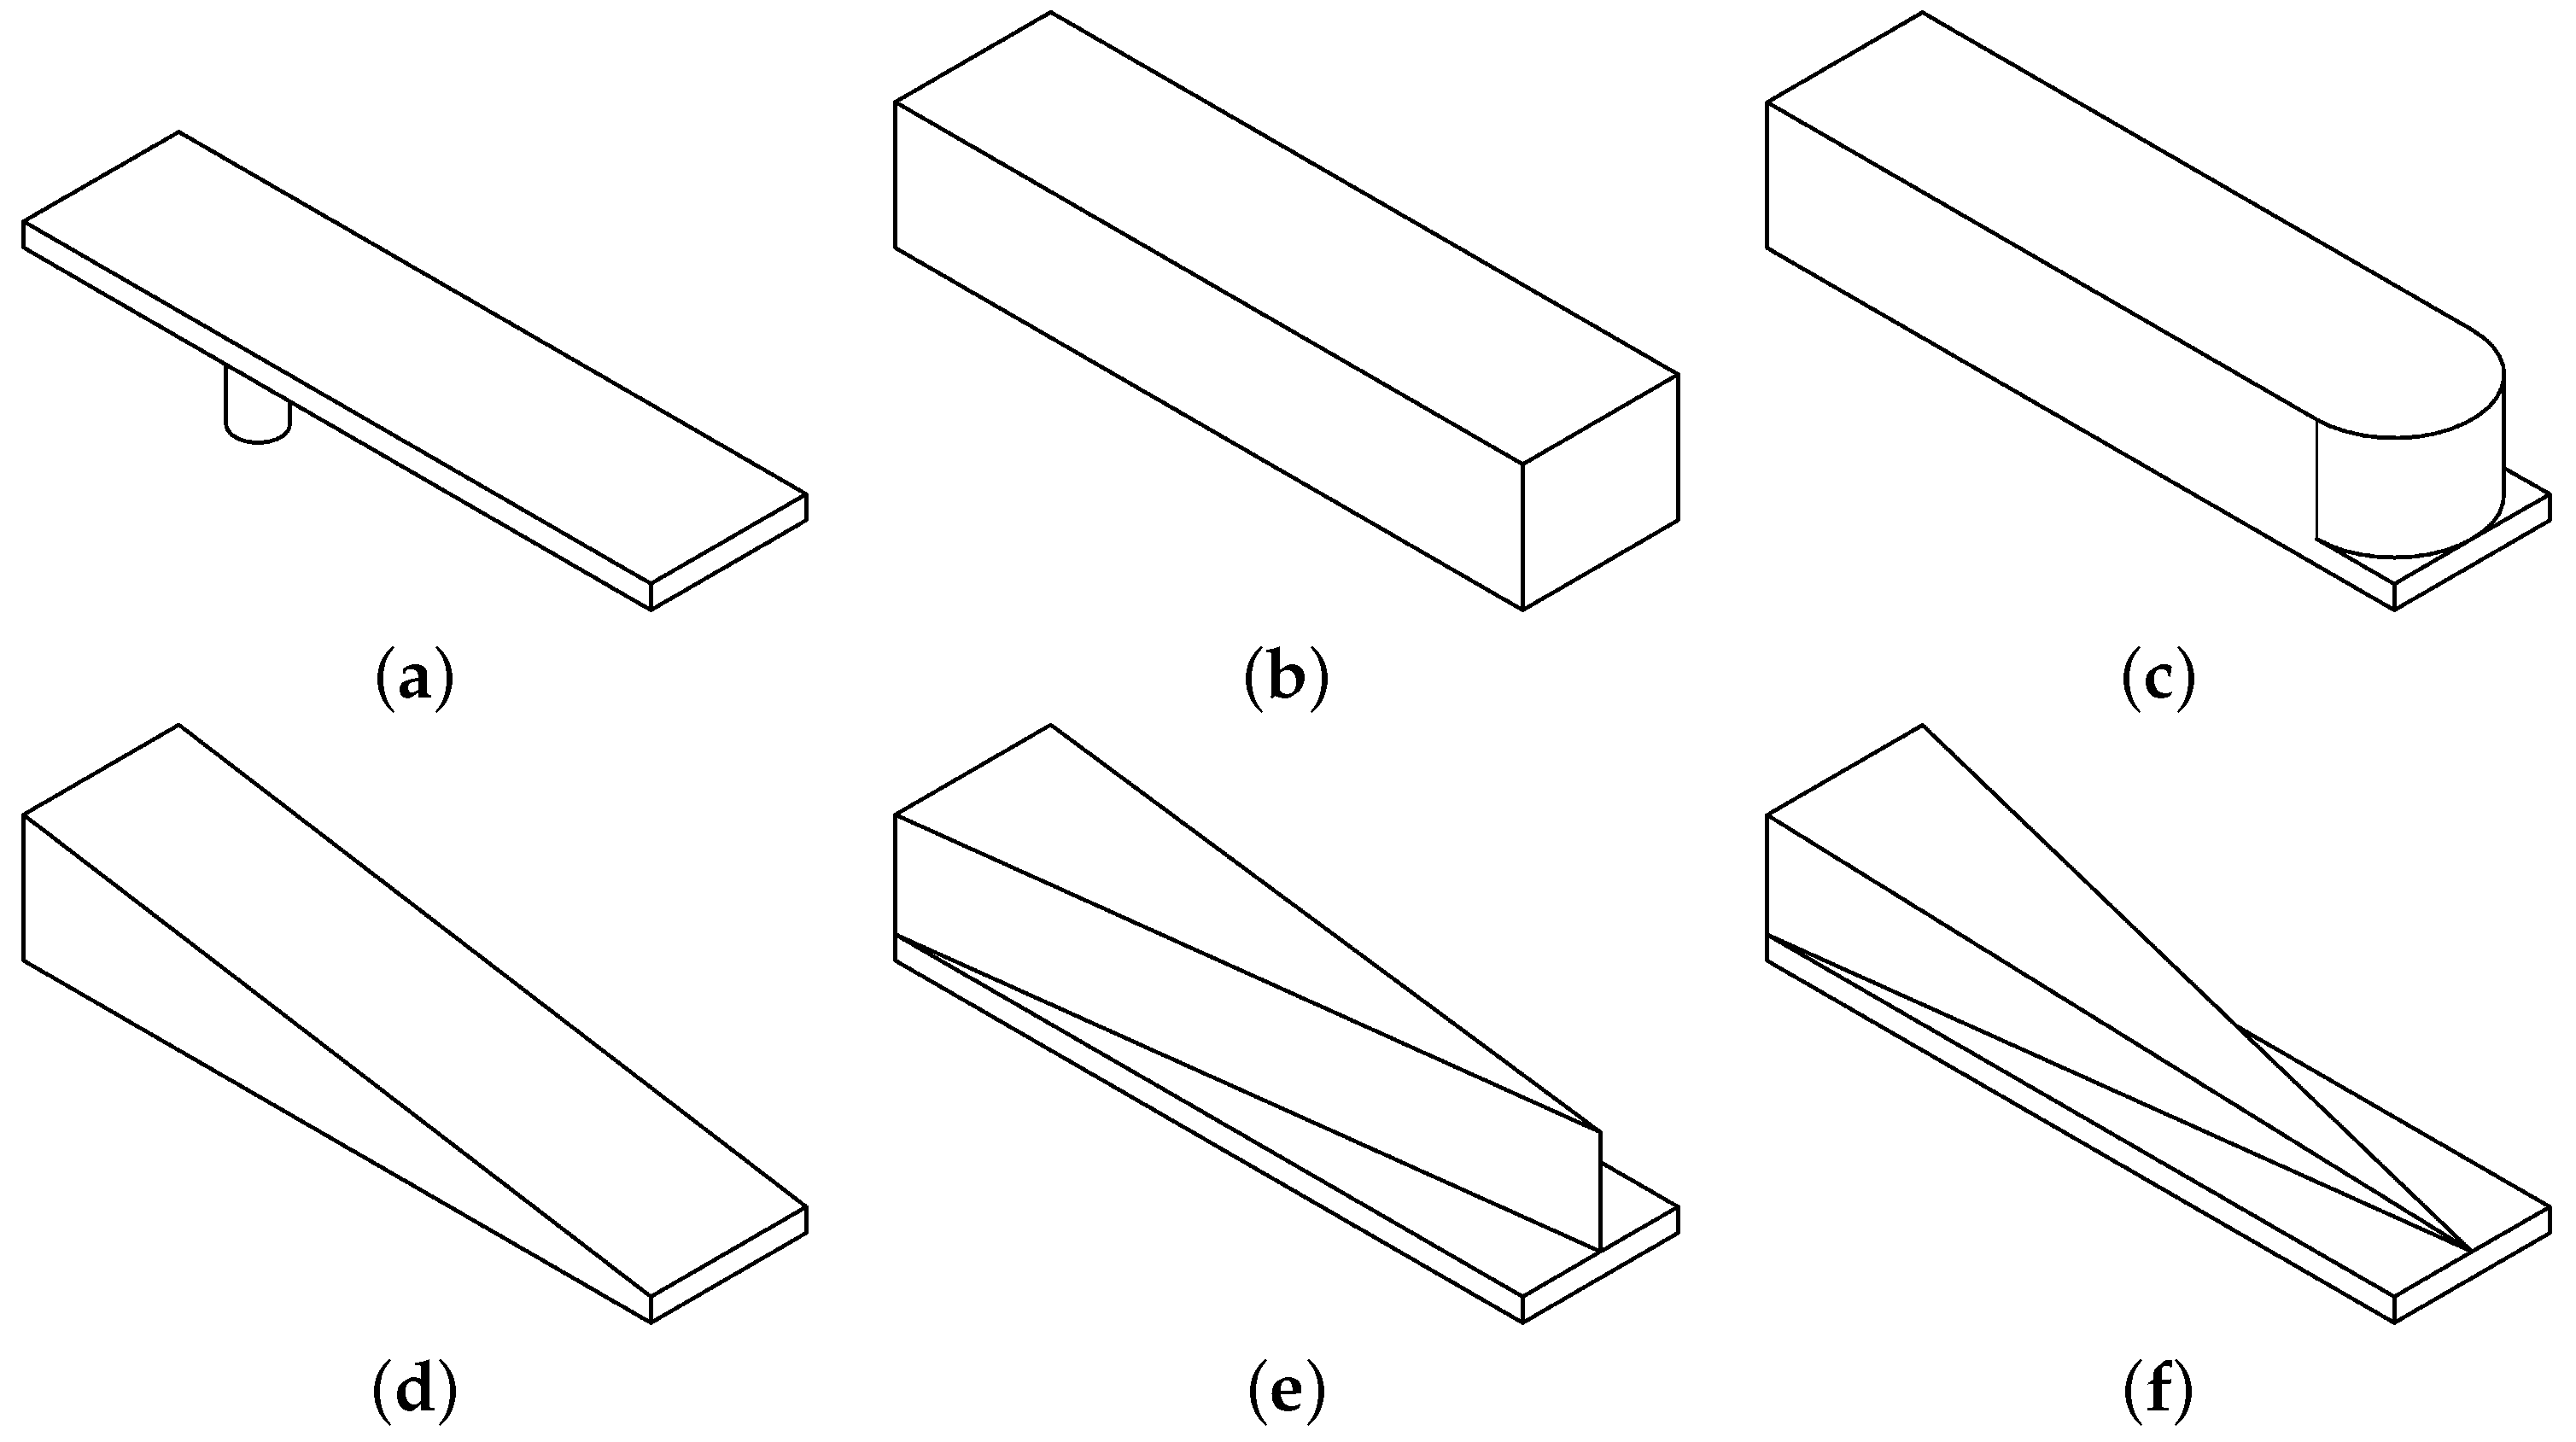
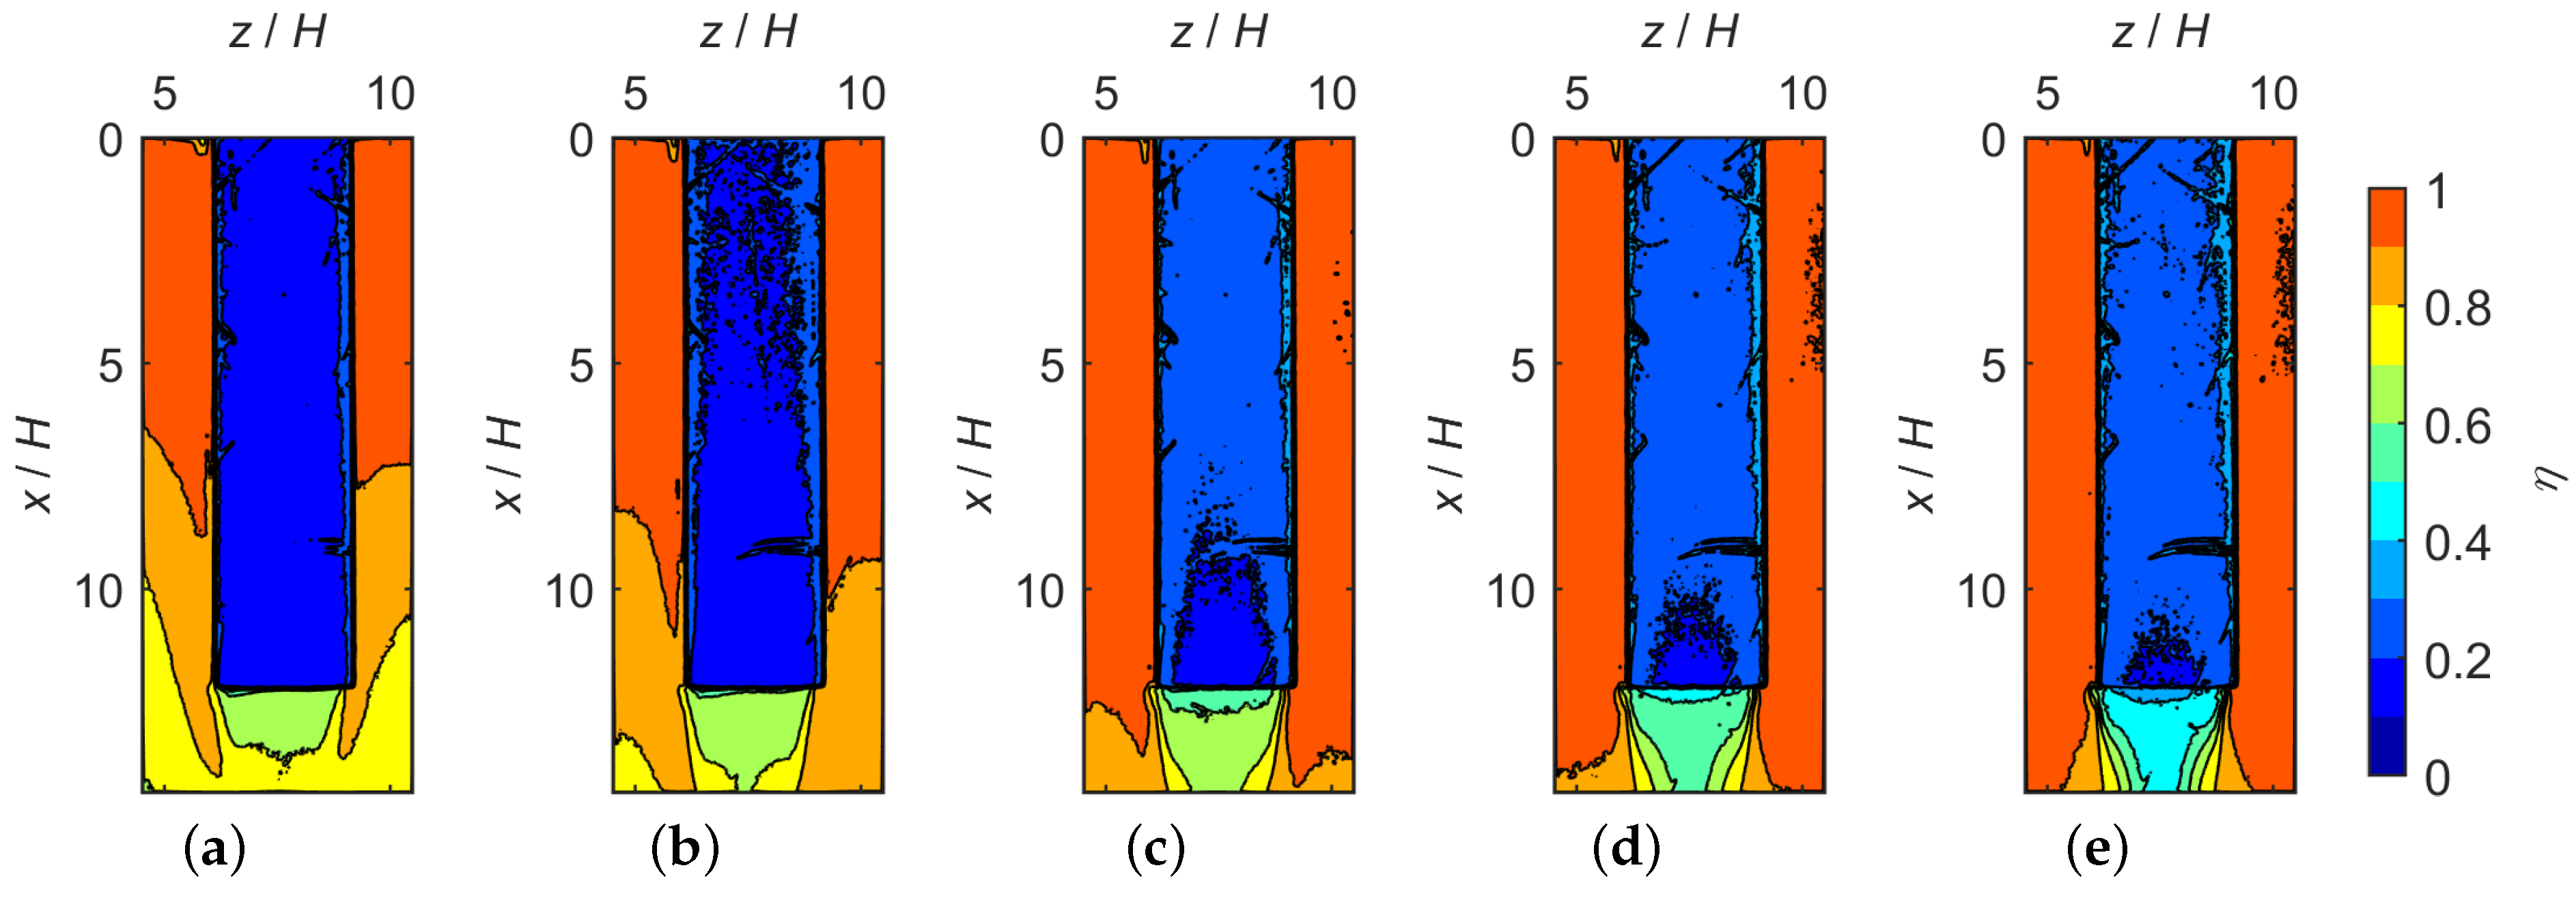
  • With all geometries, at all M tested, the coolant was largely unable to wash over the top surfaces of the lands, resulting in low effectiveness on the land top surface.
  • Having no lands at all increased the spanwise averaged effectiveness since the coolant was able to spread into the gap left by the lands.
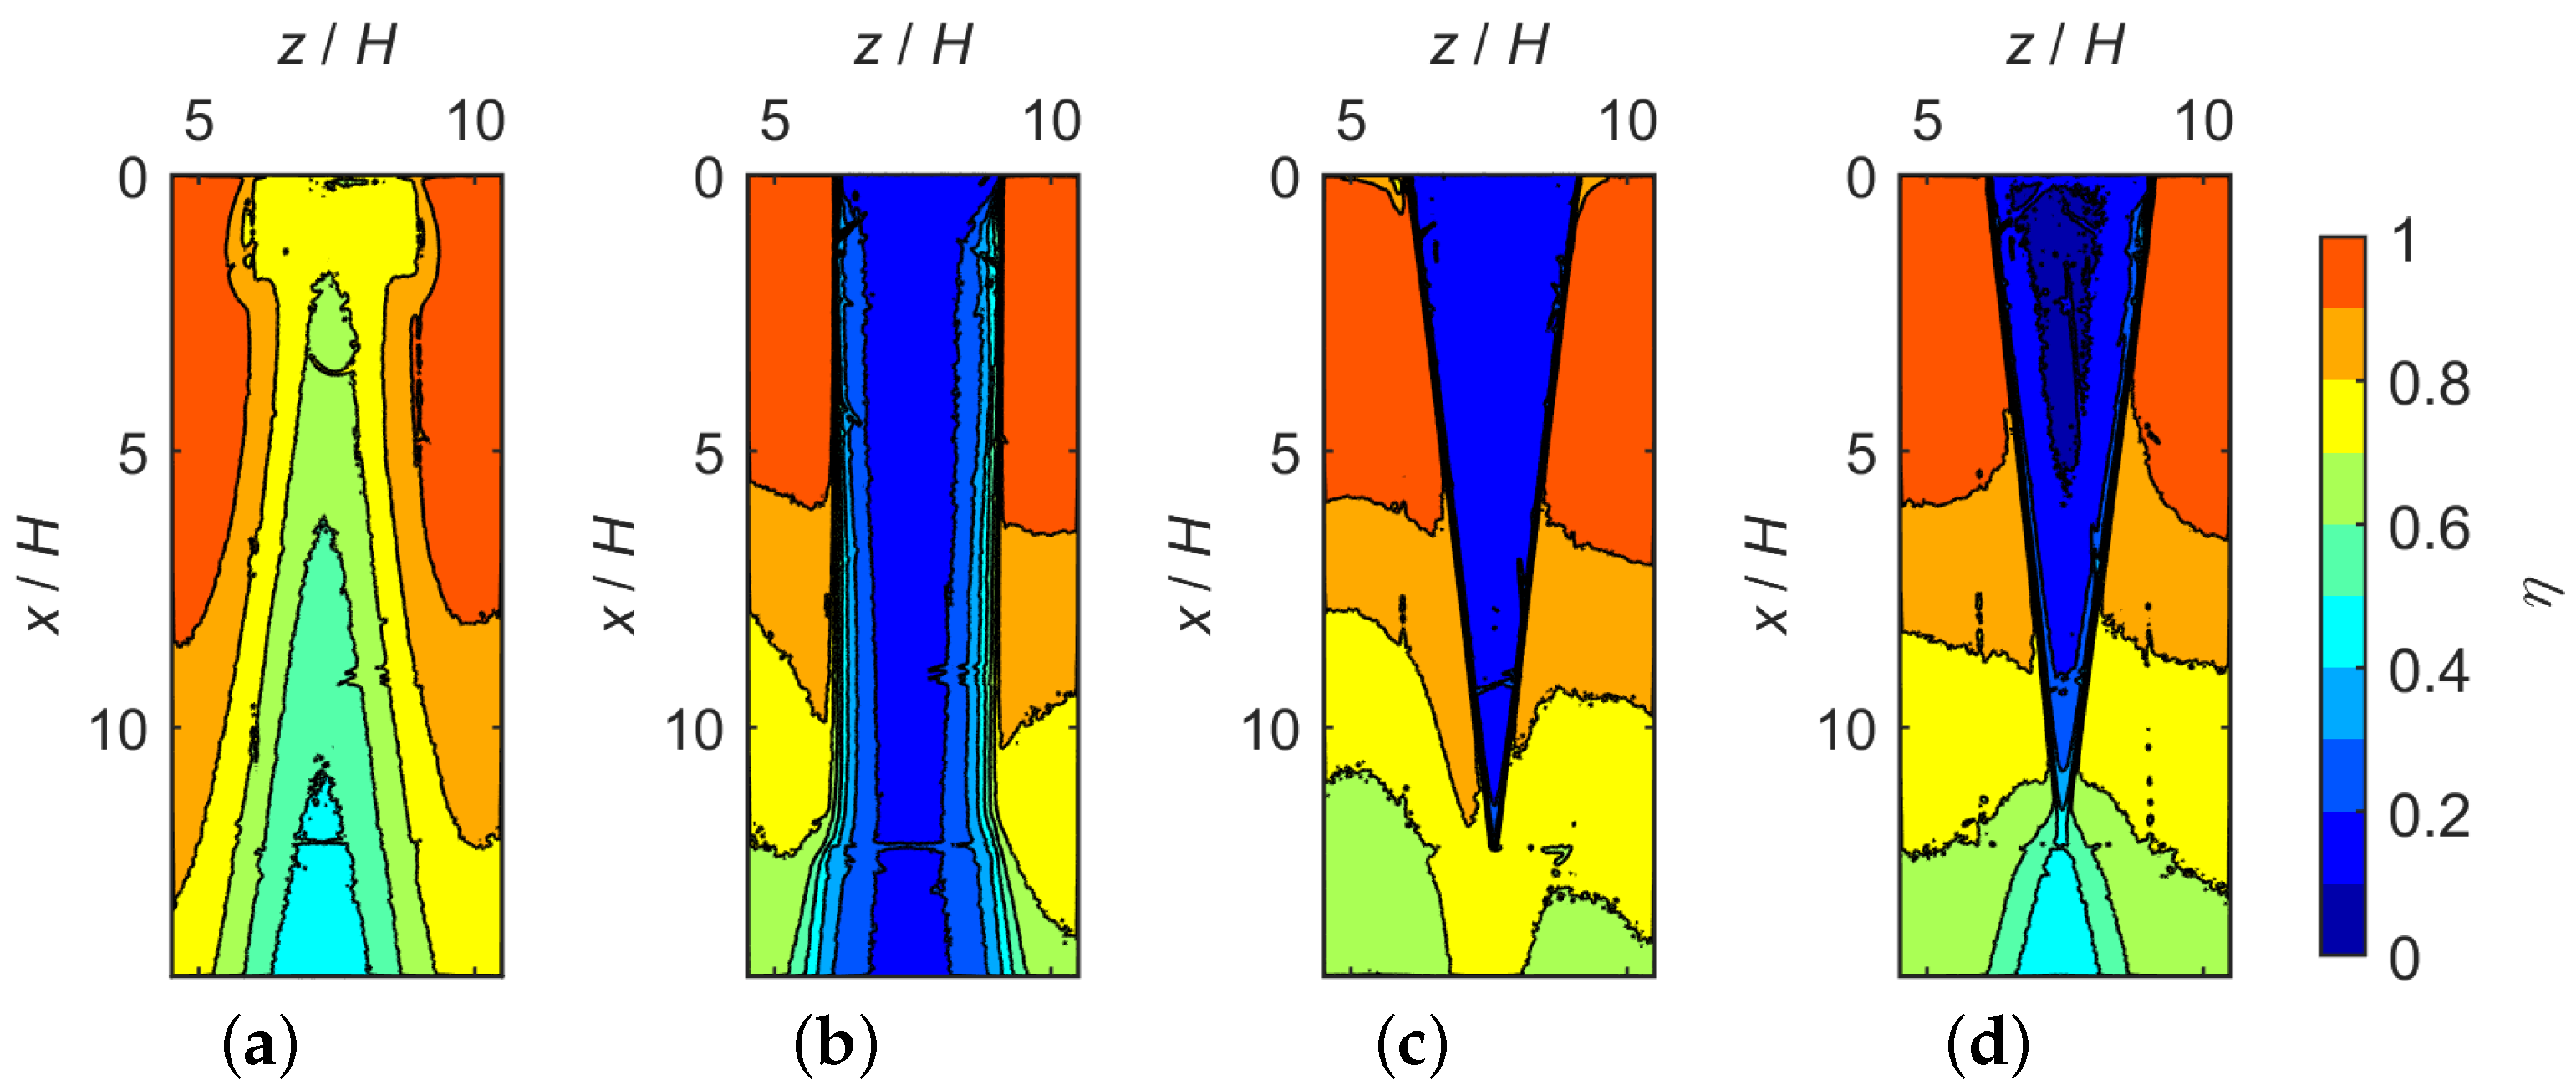
  • Tapering the lands did not significantly encourage coolant flow to wash over the top.
  • Tapering the lands pulled the mainstream flow down to the cutback surface, creating a wake of mainstream flow after the lands that the coolant flow was unable to penetrate.
  • This also encouraged mixing with the flow on the cutback, reducing effectiveness next to the lands.
  • The diffuser geometries performed well for M > 0.8 , as the coolant was able to spread and fill out the increased cutback area, resulting in a higher spanwise average effectiveness than all other geometries, including the “no lands” geometry from approximately x / H = 5 onwards up until the end of the lands.
  • The non-tapered diffuser geometry performed best, but the tapered diffuser geometry more closely approximates the land on a real turbine blade with a very small reduction in effectiveness.
  • At M = 0.6 , the coolant was unable to fill the expanding cutback surface and the film decayed faster, resulting in a lower effectiveness than the “no lands” case at the end of the lands, although still better than the other geometries.
In the case of turbine blades and vanes, the end of the lands is also typically at the trailing edge, so the effectiveness after that point is not of great concern (although it may be important in other slot cooling applications, for example, in a combustor liner). The region nearest the trailing edge is generally one of the hottest and most challenging parts to cool, so the effectiveness just before the end of the lands is very important. For this particular application, the tapered diffuser land is recommended overall for M = 0.8 1.4 . At M = 0.6 , no lands is preferable, although if this is not structurally possible, the tapered diffuser land is the next best choice.

Acknowledgments

The authors would like to express their thanks to Rolls-Royce plc (Bristol, UK) for supporting this research and to the technicians of the Osney Thermo-Fluids laboratory (Oxford, UK) for their assistance in manufacturing and assembling the experimental apparatus.

Author Contributions

Tsun Holt Wong, Peter T. Ireland and Kevin P. Self conceived and designed the experiments; Peter T. Ireland and Kevin P. Self provided access to resources and materials from Rolls-Royce and the University of Oxford for the experiments. Tsun Holt Wong contributed the analysis tools, performed the experiments, analysed the data and wrote the paper under the supervision of Peter T. Ireland.

Conflicts of Interest

Rolls-Royce as the funding sponsor provided input into the general scope of interest in the study and the decision to publish the results. They had no direct role in the collection, analyses, or interpretation of data.

Nomenclature

Abbreviations
CCDCharge-coupled device
MFCMass Flow Controller
MRIMagnetic resonance imaging
PIVParticle Image Velocimetry
PSPPressure sensitive paint
Greek
ηAdiabatic film cooling effectiveness
ρDensity [ Pa ]
Roman
AArea [ m 2 ]
HEquivalent to H s l o t [ m m ]
H l i p Lip thickness [ m m ]
H s l o t Slot height [ m m ]
IIntensity image
m ˙ Mass flow rate [ k g   s 1 ]
M ˙ Molar flow rate [ kmol   s 1 ]
MBlowing ratio
M I X N Sturgess geometric parameter
M W Molecular weight [ k g   kmol 1 ]
nMole fraction of oxygen
pPressure [ Pa ]
p ( O 2 ) Partial pressure of oxygen [ Pa ]
Re Reynolds number
TTemperature [ K ]
uVelocity [ m   s 1 ]
W s l o t Slot width [ m m ]
xDownstream distance [ m m ]
x p Potential core length [ m m ]
zSpanwise displacement [ m m ]
Subscripts
Mainstream flow
a i r Air coolant
a t m At atmospheric conditions
a w Adiabatic wall
cCoolant flow
d a r k In darkness
mMainstream flow
m i x Air-nitrogen mixture
N 2 Nitrogen coolant
r a t i o Ratio
r e f At Reference conditions
s Static
s u r f On the surface

References

  1. Haselbach, F.; Parker, R. Hot End Technology for Advanced, Low Emission Large Civil Aircraft Engines. In Proceedings of the 28th International Congress of the Aeronautical Sciences, Brisbane, Australia, 23–28 September 2012; Volume 2, p. 3.
  2. Sargison, J.E. Development of a Novel Film Cooling Hole Geometry. Ph.D. Thesis, University of Oxford, Oxford, UK, 2001. [Google Scholar]
  3. Cresci, I.; Ireland, P.T.; Bacic, M.; Tibbott, I.; Rawlinson, A. Velocity and Turbulence Intensity Profiles Downstream of a Long Reach Endwall Double Row of Film Cooling Holes in a Gas Turbine Combustor Representative Environment. In Proceedings of the ASME Turbo Expo 2015, Montreal, QC, Canada, 15–19 June 2015; ASME: New York, NY, USA, 2015. [Google Scholar]
  4. Goldstein, R.J. Film cooling. Adv. Heat Transf. 1971, 7, 321–379. [Google Scholar]
  5. Kacker, S.C.; Whitelaw, J.H. The dependence of the impervious wall effectiveness of a two-dimensional wall-jet on the thickness of the upper lip boundary layer. Int. J. Heat Mass Transf. 1967, 10, 1623–1624. [Google Scholar] [CrossRef]
  6. Mukherjee, D.K. Film Cooling With Injection Through Slots. J. Eng. Gas Turbines Power 1976, 98, 556–559. [Google Scholar] [CrossRef]
  7. Sturgess, G.J. Design of Combustor Cooling Slots for High Film Effectiveness: Part I-Film General Development. J. Eng. Gas Turbines Power 1986, 108, 354–360. [Google Scholar] [CrossRef]
  8. Sturgess, G.J.; Pfeifer, G.D. Design of Combustor Cooling Slots for High Film Effectiveness: Part II-Film Initial Region. J. Eng. Gas Turbines Power 1986, 108, 361–369. [Google Scholar] [CrossRef]
  9. Taslim, M.E.; Spring, S.D.; Mehlman, B.P. Experimental investigation of film cooling effectiveness for slots of various exit geometries. J. Thermophys. Heat Transf. 1992, 6, 302–307. [Google Scholar] [CrossRef]
  10. Martini, P.; Schulz, A.; Bauer, H.J. Film Cooling Effectiveness and Heat Transfer on the Trailing Edge Cutback of Gas Turbine Airfoils With Various Internal Cooling Designs. J. Turbomach. 2005, 128, 196–205. [Google Scholar] [CrossRef]
  11. Murata, A.; Nishida, S.; Saito, H.; Iwamoto, K.; Okita, Y.; Nakamata, C. Effects of Surface Geometry on Film Cooling Performance at Airfoil Trailing Edge. J. Turbomach. 2012, 134, 051033. [Google Scholar] [CrossRef]
  12. Yang, Z.; Hu, H. Study of Trailing-Edge Cooling Using Pressure Sensitive Paint Technique. J. Propuls. Power 2011, 27, 700–709. [Google Scholar] [CrossRef]
  13. Yang, Z.; Hu, H. An experimental investigation on the trailing edge cooling of turbine blades. Propuls. Power Res. 2012, 1, 36–47. [Google Scholar] [CrossRef]
  14. Ling, J.; Elkins, C.J.; Eaton, J.K. The Effect of Land Taper Angle on Trailing Edge Slot Film Cooling. J. Turbomach. 2015, 137, 071003. [Google Scholar] [CrossRef]
  15. Wong, T.H.; Ireland, P.T.; Self, K.P. Film Cooling Effectiveness Measurements on Engine Representative Trailing Edge Slots Including Cutback Surface Protuberances. ETC2015-254. In Proceedings of the 11th European Turbomachinery Conference, Madrid, Spain, 23–27 March 2015; ETC: Madrid, Spain, 2015. [Google Scholar]
  16. Wong, T.H.; Ireland, P.T.; Self, K.P. Film Cooling Effectiveness Measurements on Trailing Edge Cutback Surface and Lands Following Novel Cross Corrugated Slot Geometry. In Proceedings of the ASME Turbo Expo 2016, Seoul, Korea, 13–17 June 2016; ASME: New York, NY, USA.
  17. Gurram, N.; Ireland, P.T.; Wong, T.H.; Self, K.P. Study of Film Cooling in the Trailing Edge Region of a Turbine Rotor Blade in High Speed Flow Using Pressure Sensitive Paint. In Proceedings of the ASME Turbo Expo 2016, Seoul, Korea, 13–17 June 2016; ASME: New York, NY, USA.
  18. Telisinghe, J.C.; Ireland, P.T.; Jones, T.V.; Barrett, D.; Son, C. Comparative Study between a Cut-Back and Conventional Trailing Edge Film Cooling System. In Proceedings of the ASME Turbo Expo 2006: Power for Land, Sea, and Air, Barcelona, Spain, 8–11 May 2006; ASME: New York, NY, USA.
  19. Quinn, M.K.; Gongora-Orozco, N.; Kontis, K.; Ireland, P. Application of pressure-sensitive paint to low-speed flow around a U-bend of strong curvature. Exp. Therm. Fluid Sci. 2013, 48, 58–66. [Google Scholar] [CrossRef]
  20. Han, J.C.; Rallabandi, A. Turbine Blade Film Cooling Using PSP Technique. Front. Heat Mass Transf. 2010, 1, 013001. [Google Scholar] [CrossRef]
  21. Caciolli, G.; Facchini, B.; Picchi, A.; Tarchi, L. Comparison between PSP and TLC steady state techniques for adiabatic effectiveness measurement on a multiperforated plate. Exp. Therm. Fluid Sci. 2013, 48, 122–133. [Google Scholar] [CrossRef]
  22. Moffat, R.J. Describing the uncertainties in experimental results. Exp. Therm. Fluid Sci. 1988, 1, 3–17. [Google Scholar] [CrossRef]
Figure 1. Generic slot cooled blade with terminology.
Ijtpp 01 00004 g001
Figure 2. Rig schematic.
Ijtpp 01 00004 g002
Figure 3. Detailed views of the test section with a large scale trailing edge slot and coordinate system.
Ijtpp 01 00004 g003
Figure 4. Land geometries. (a) L1: No lands; (b) L2: Block; (c) L3: Rounded; (d) L4: Tapered; (e) L5: Diffuser; (f) L6: Tapered Diffuser.
Ijtpp 01 00004 g004
Figure 5. Pressure sensitive paint (PSP) calibration curves. (a) full image mean calibration curve; (b) comparison between full image and sample mean calibration curve.
Ijtpp 01 00004 g005
Figure 6. η distributions for all geometries, x and z are defined in Figure 3.
Ijtpp 01 00004 g006
Figure 7. Land η distributions, L2. (a) M = 0.60 ; (b) M = 0.78 ; (c) M = 0.98 ; (d) M = 1.19 ; (e) M = 1.38 .
Ijtpp 01 00004 g007
Figure 8. Land η distributions. (a) L1, M = 0.59 ; (b) L4, M = 0.57 ; (c) L5, M = 0.59 ; (d) L6, M = 0.59 .
Ijtpp 01 00004 g008
Figure 9. Centreline and spanwise averaged η. (a) Centreline; (b) Spanwise averaged.
Ijtpp 01 00004 g009
Figure 10. Potential core length, x p . (a) Determining x p / H for L1 using centreline η; (b) x p / H at different M.
Ijtpp 01 00004 g010
Figure 11. Potential core length comparison with literature [6,8,9].
Ijtpp 01 00004 g011

