
Advanced Endwall Contouring for Loss Reduction and Outflow Homogenization for an Optimized Compressor Cascade

Abstract
:1. Introduction
2. Numerical Setup
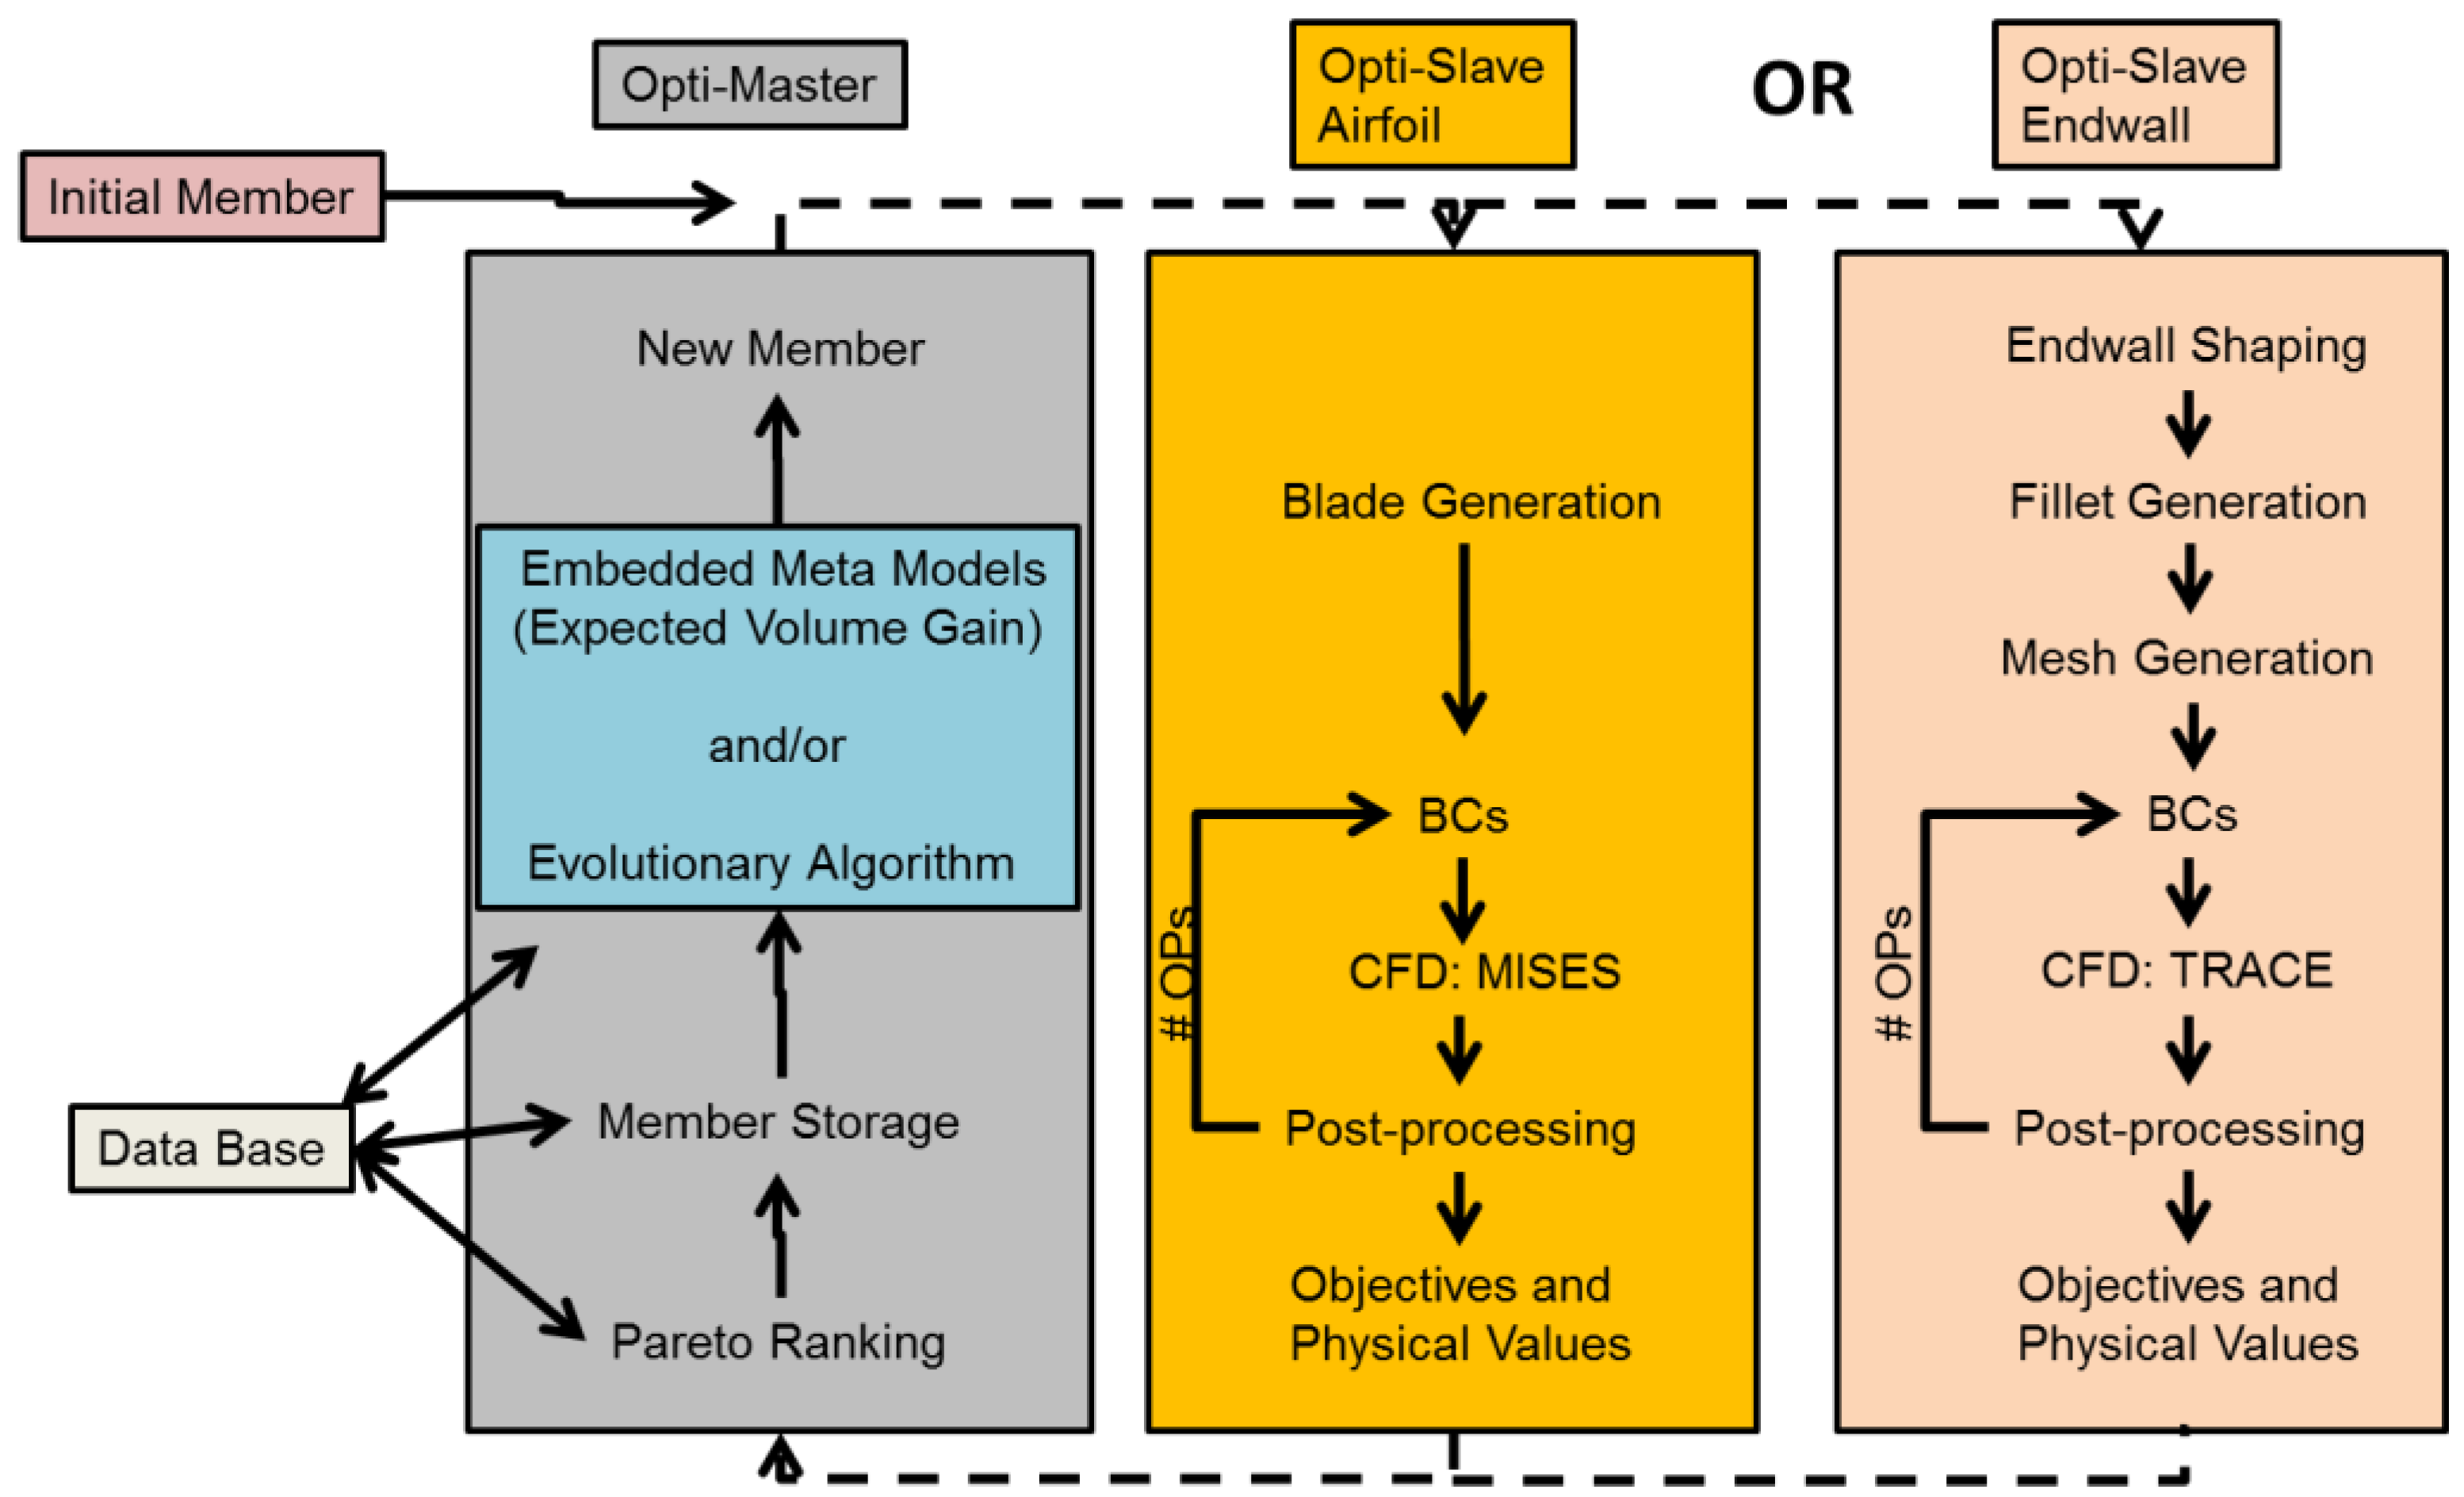
2.1. Optimization Tool AutoOpti
2.2. Airfoil Optimization
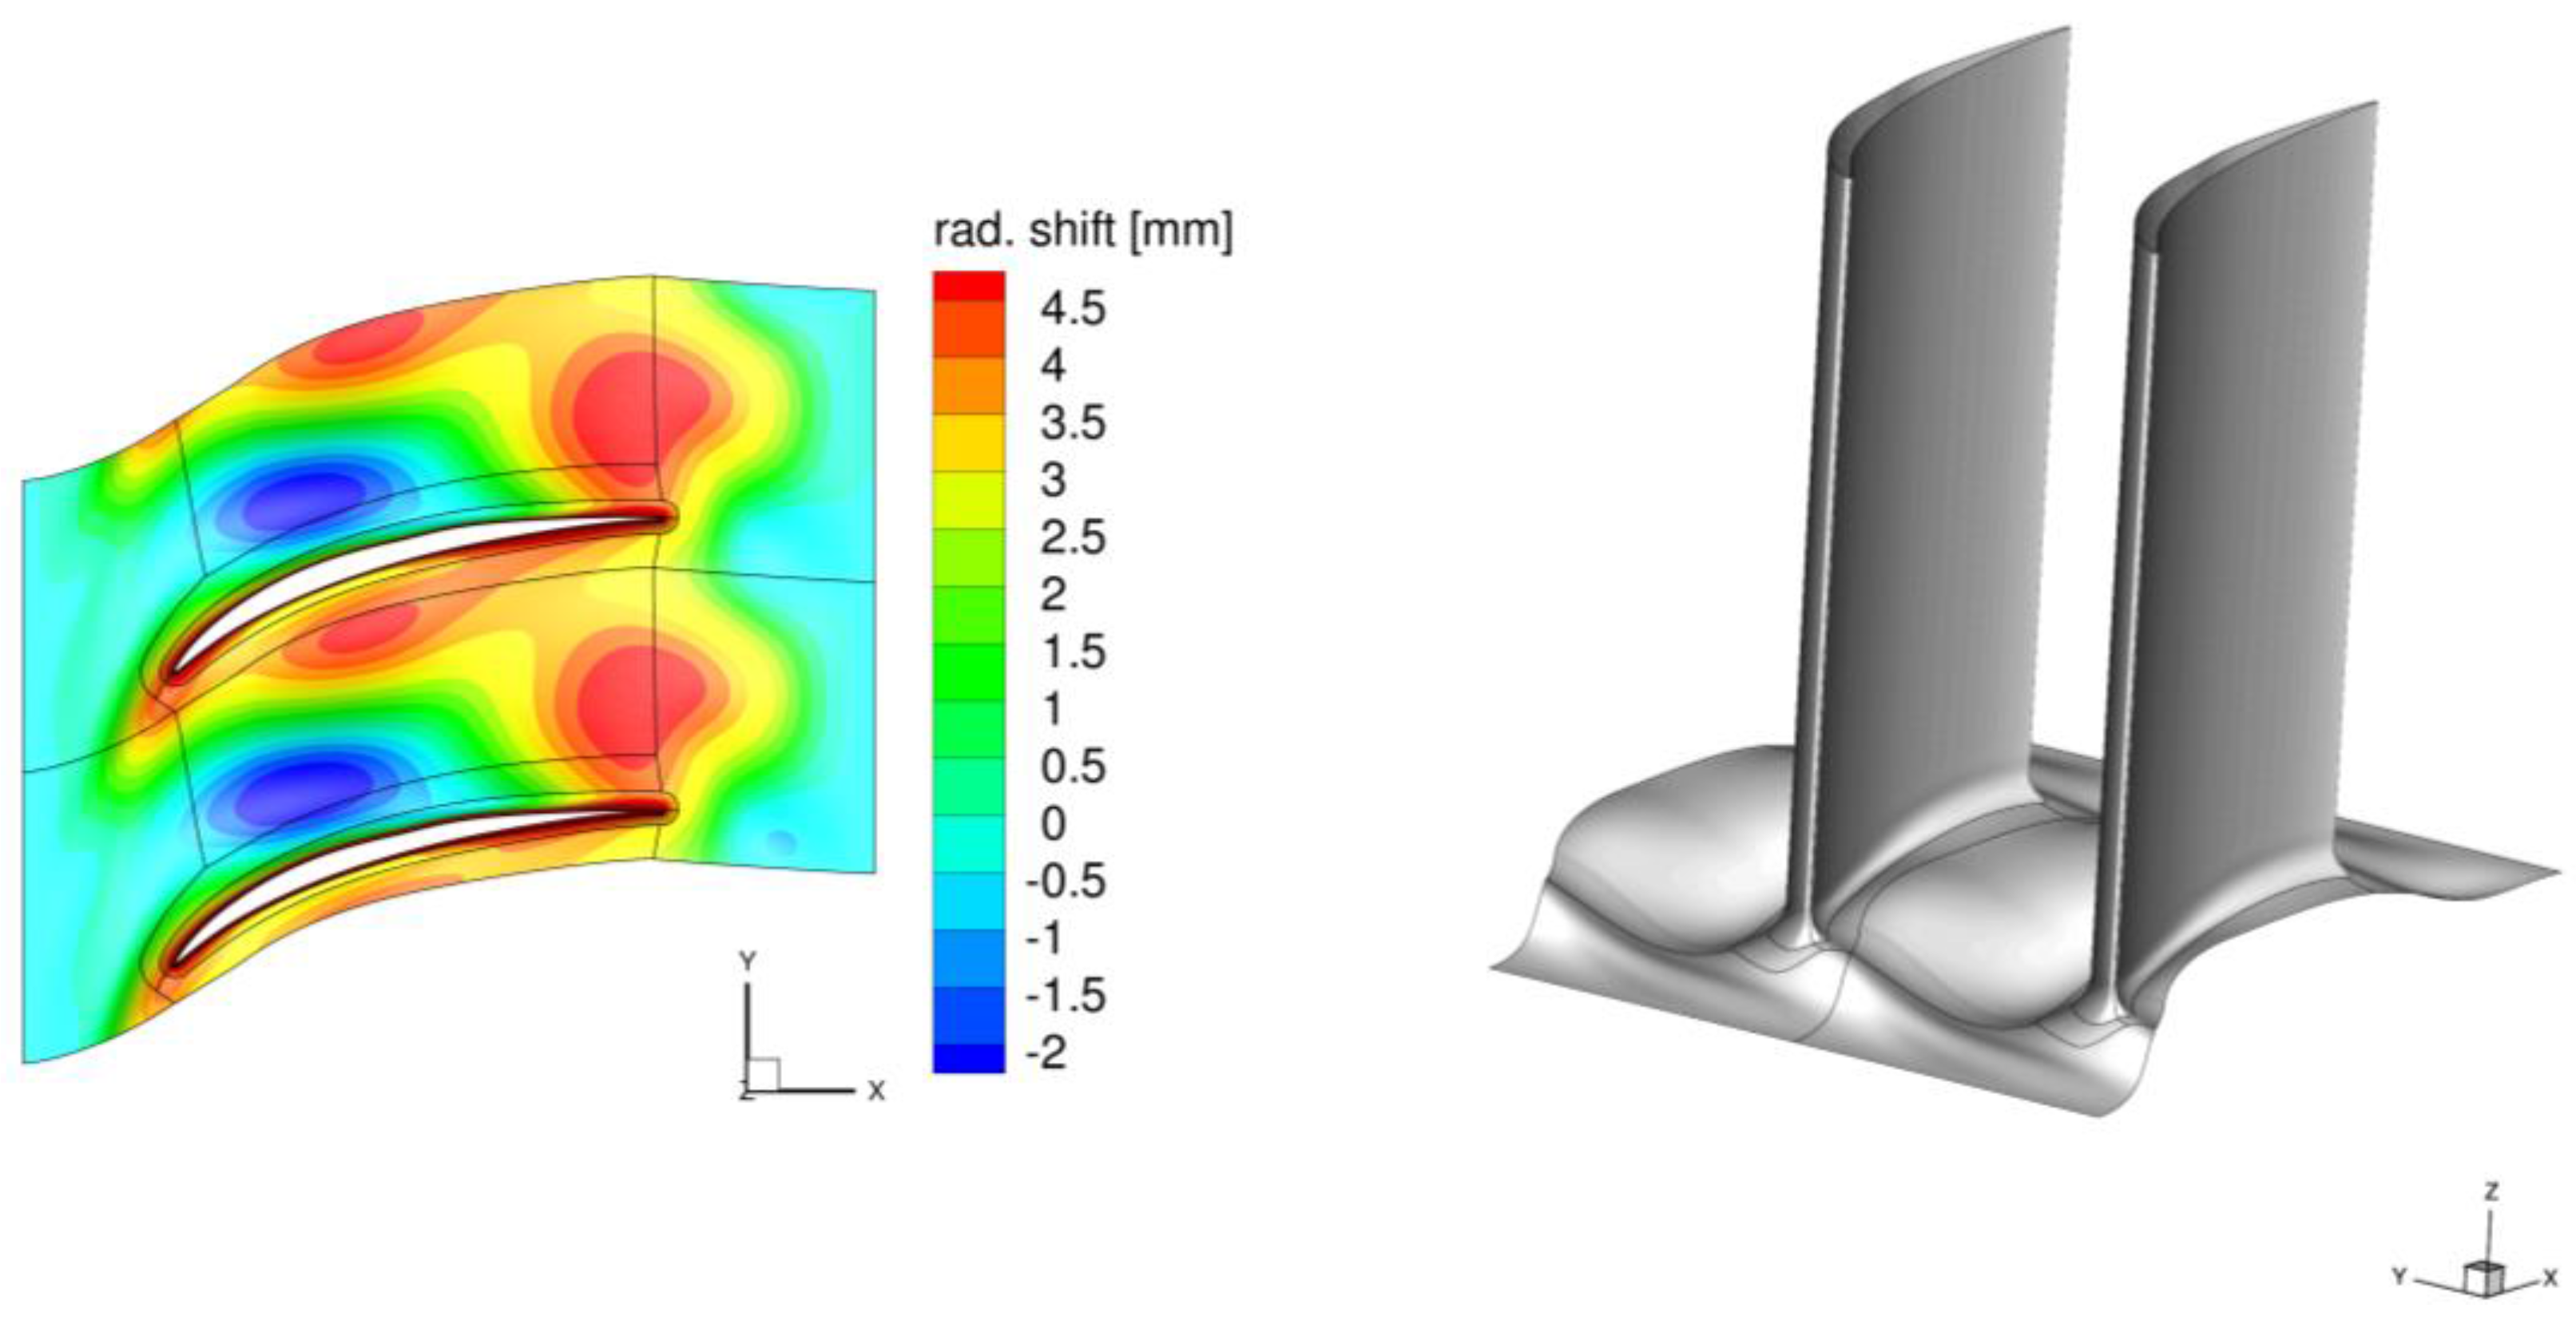
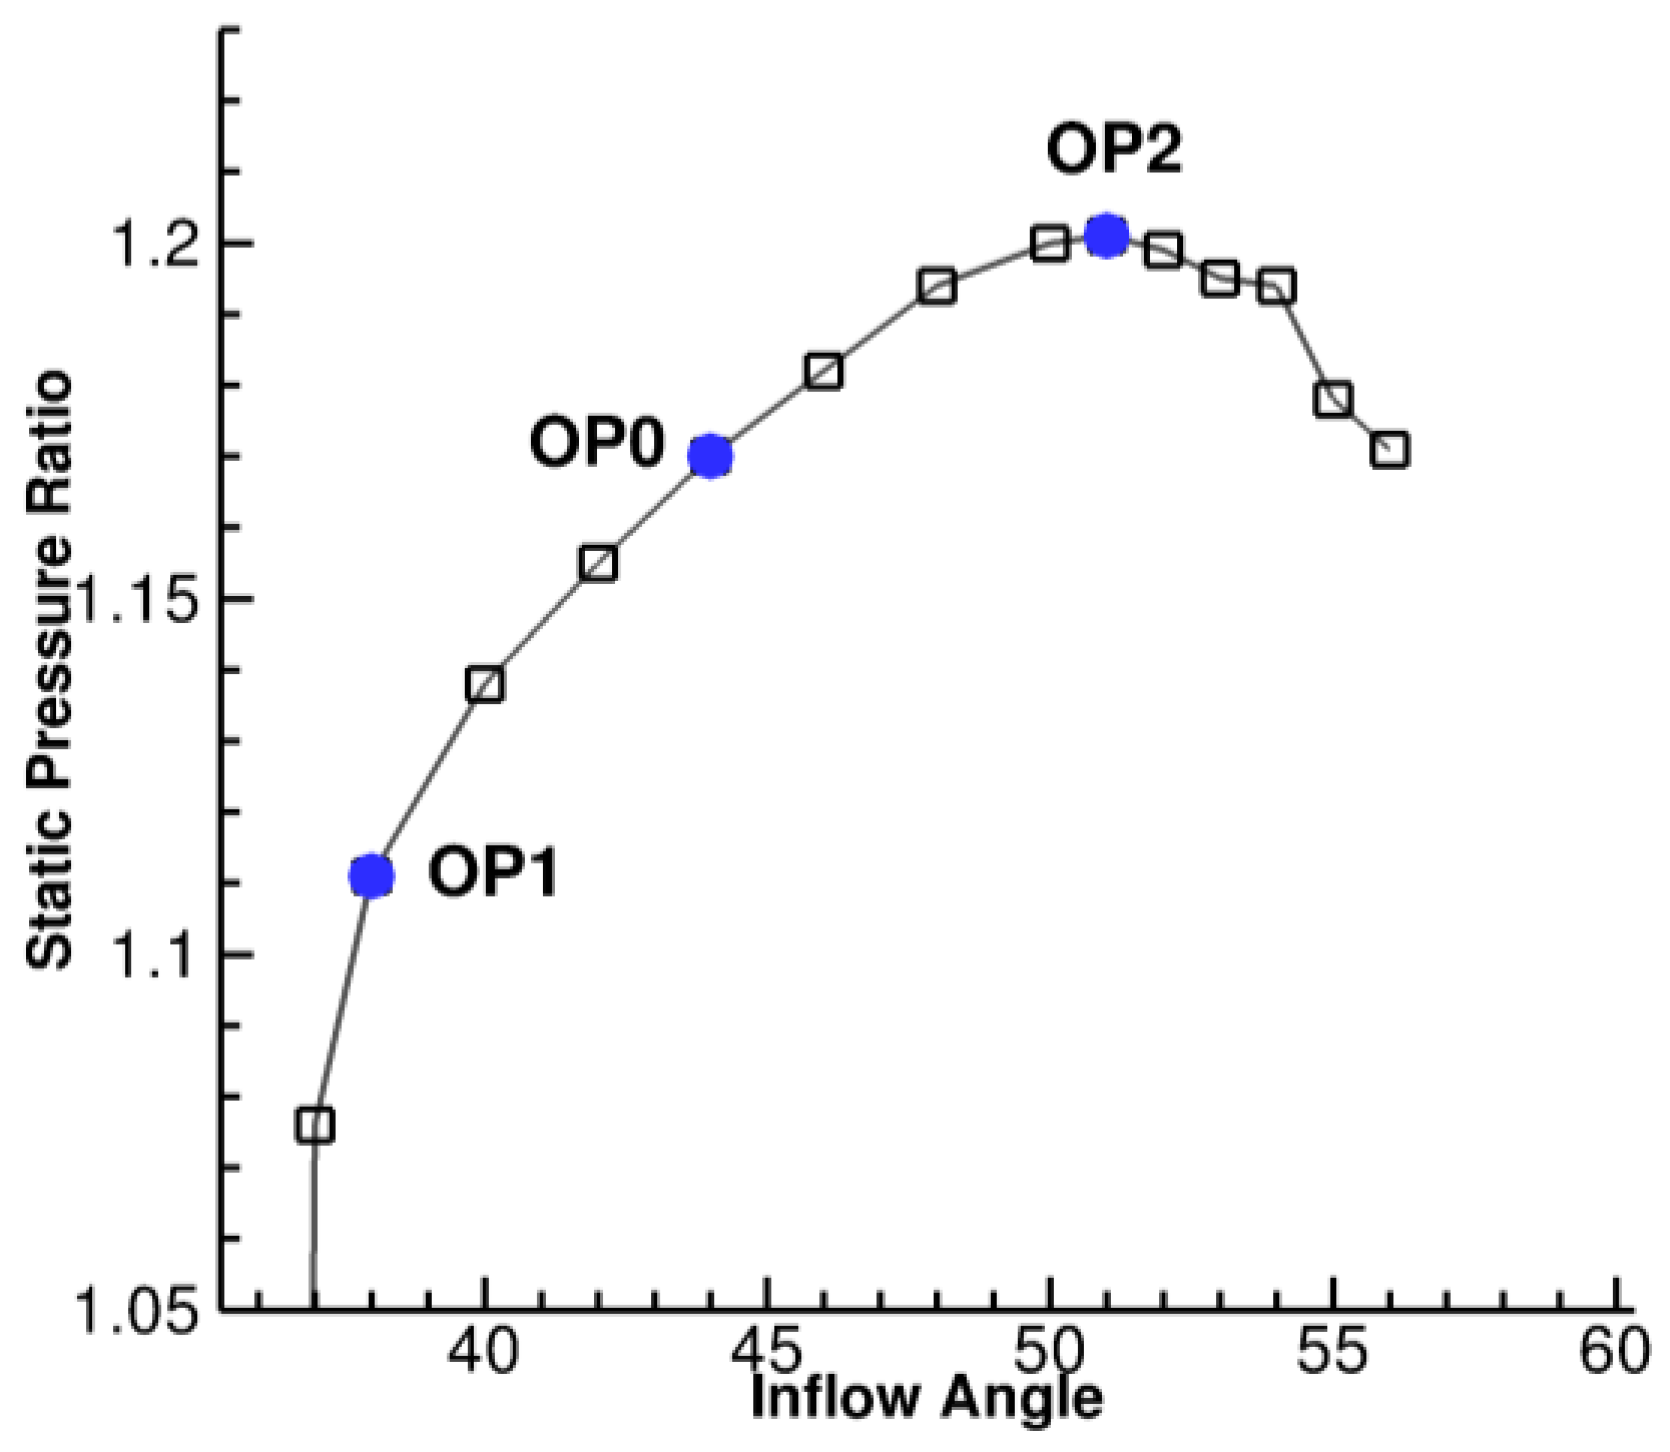
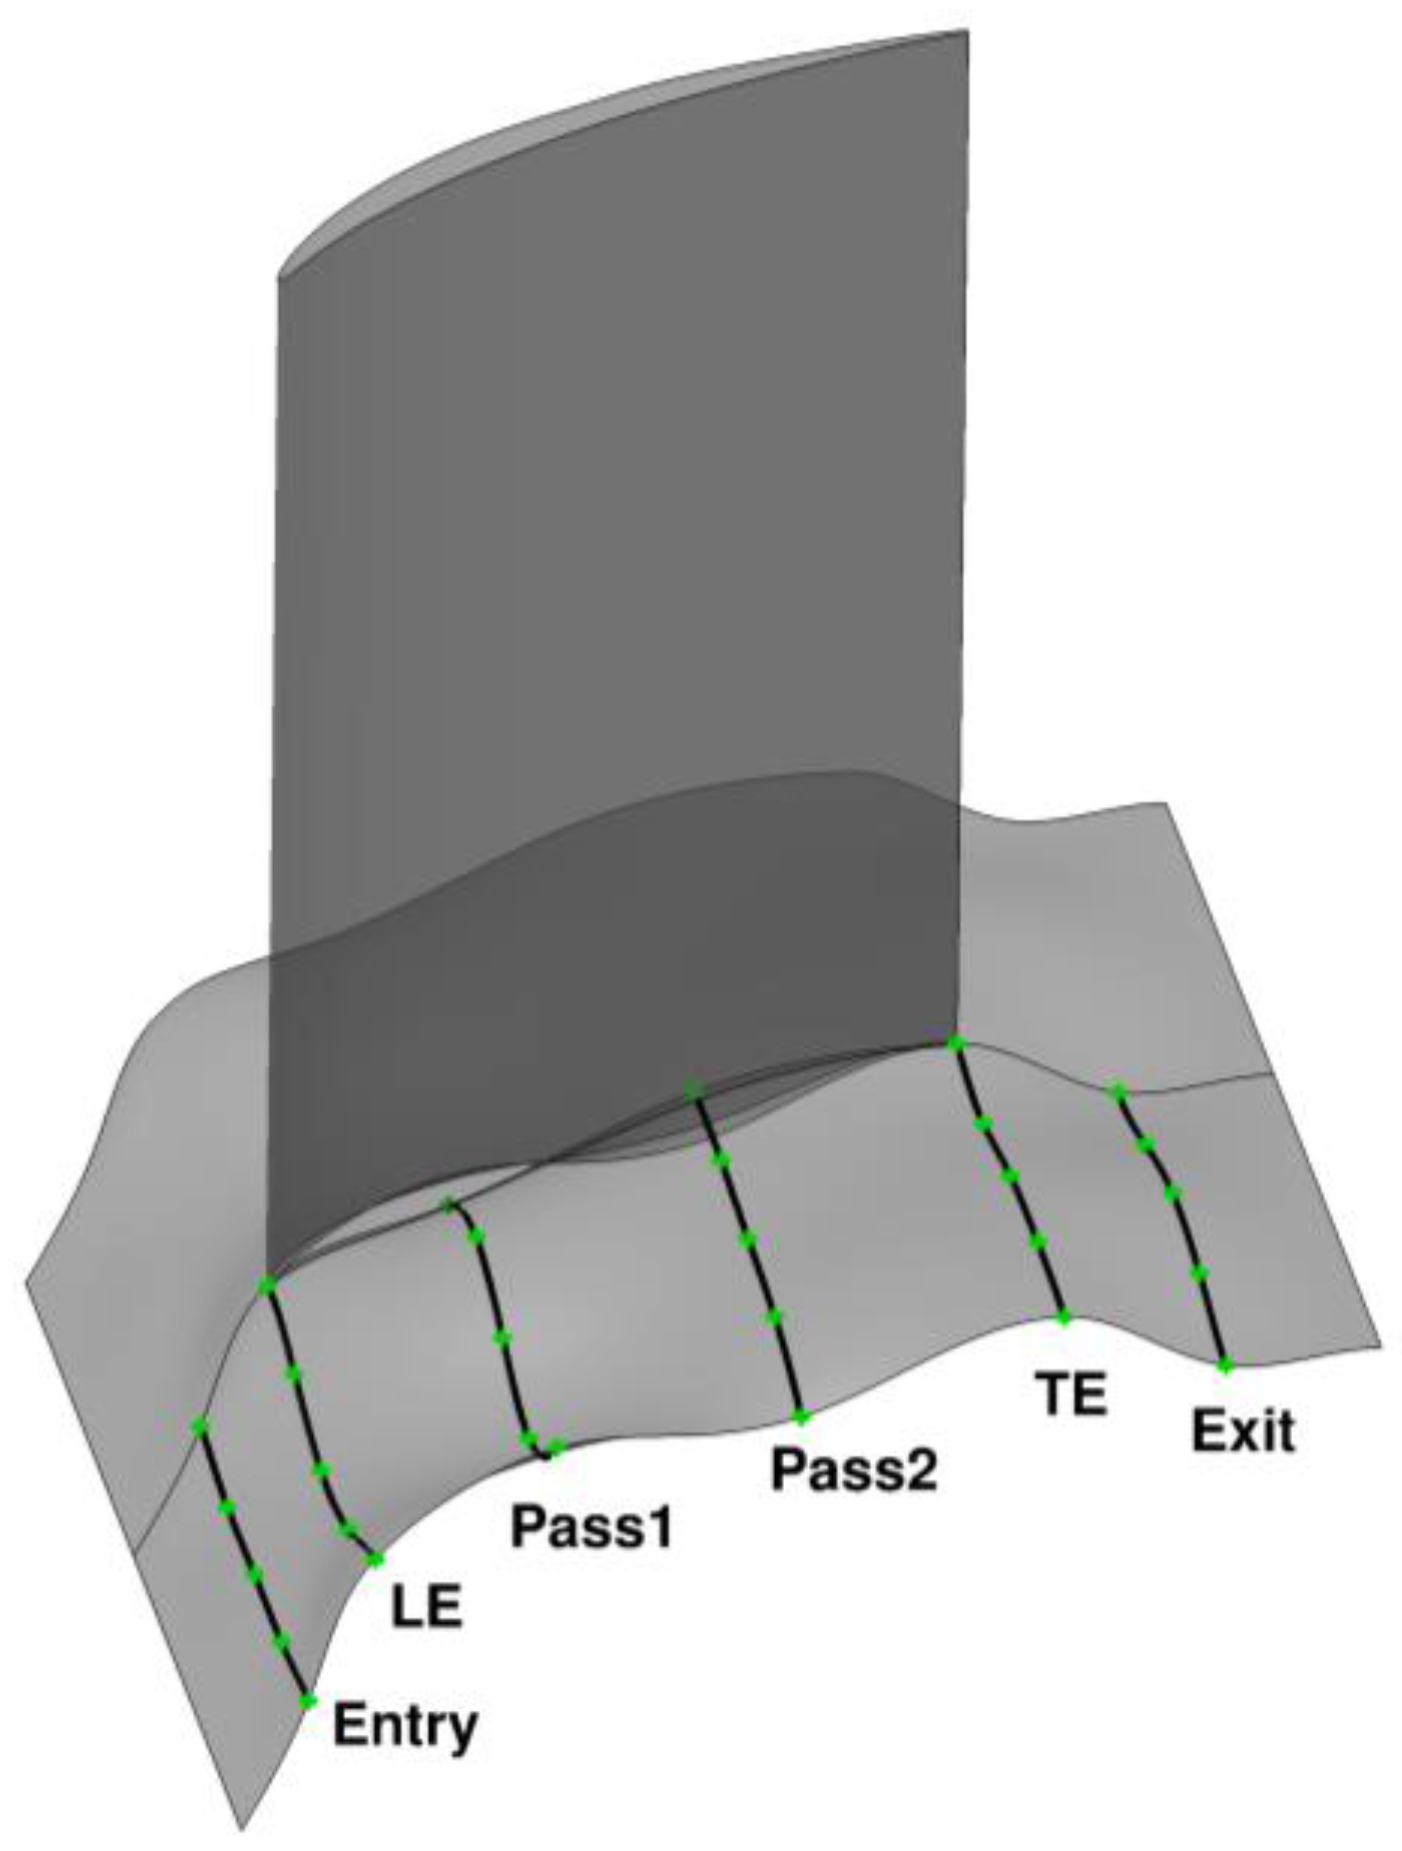
2.3. Endwall Optimization
3. Results
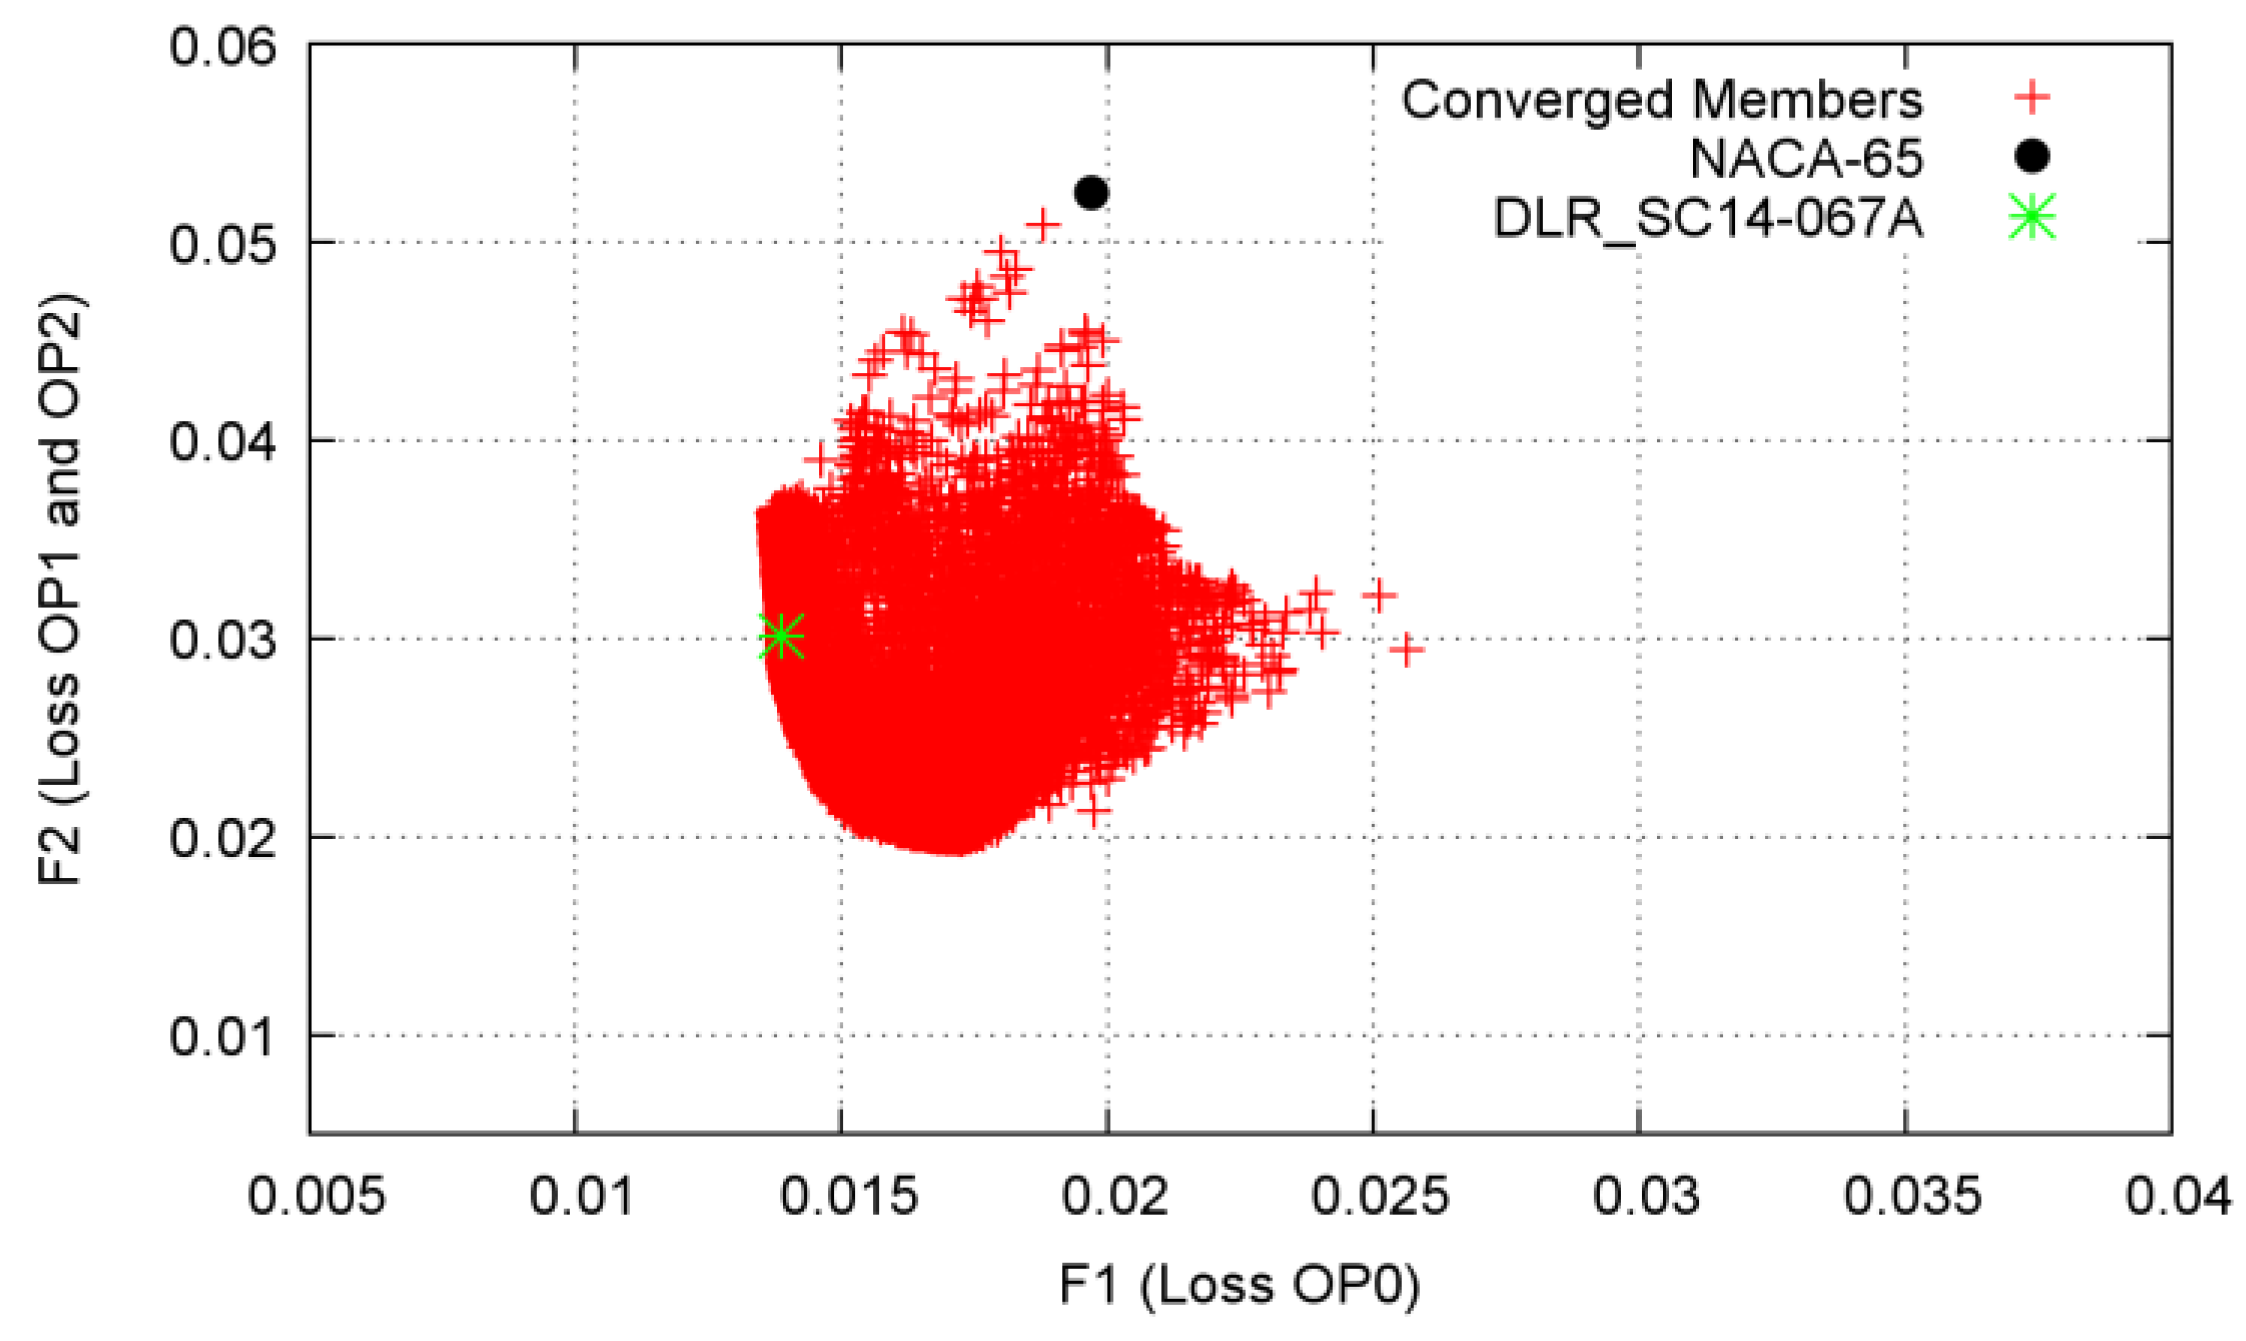
3.1. Airfoil Optimization
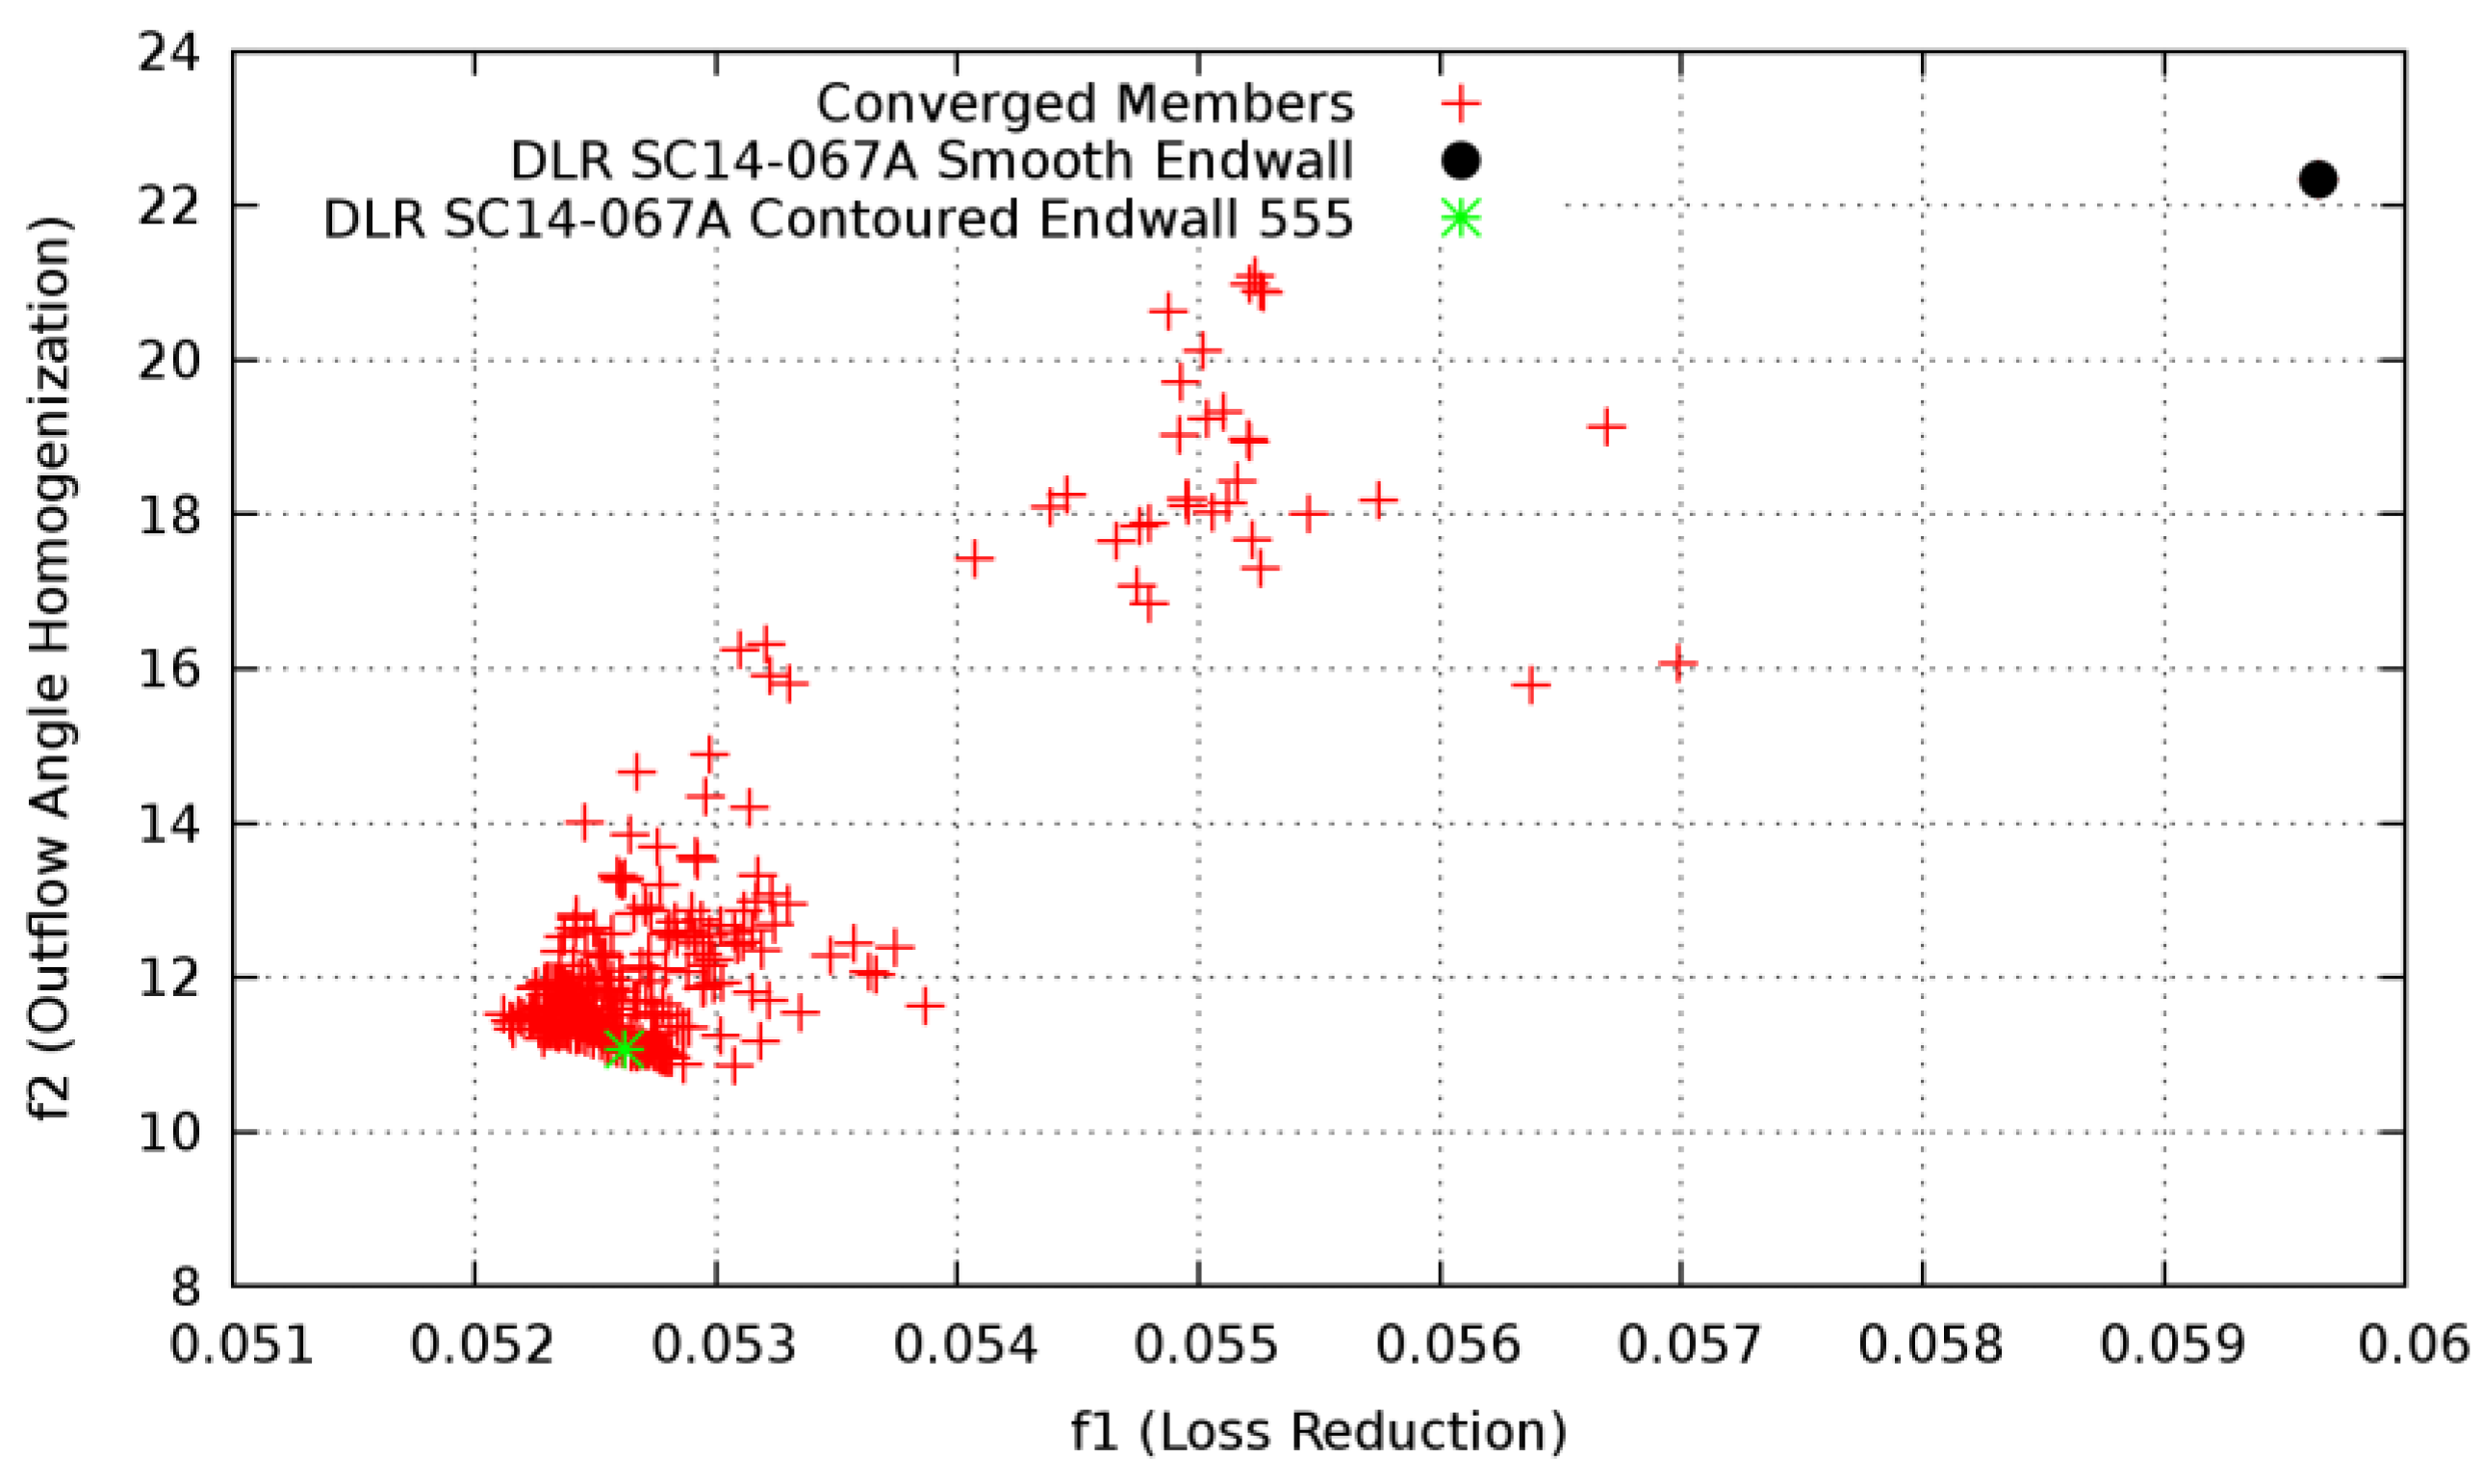
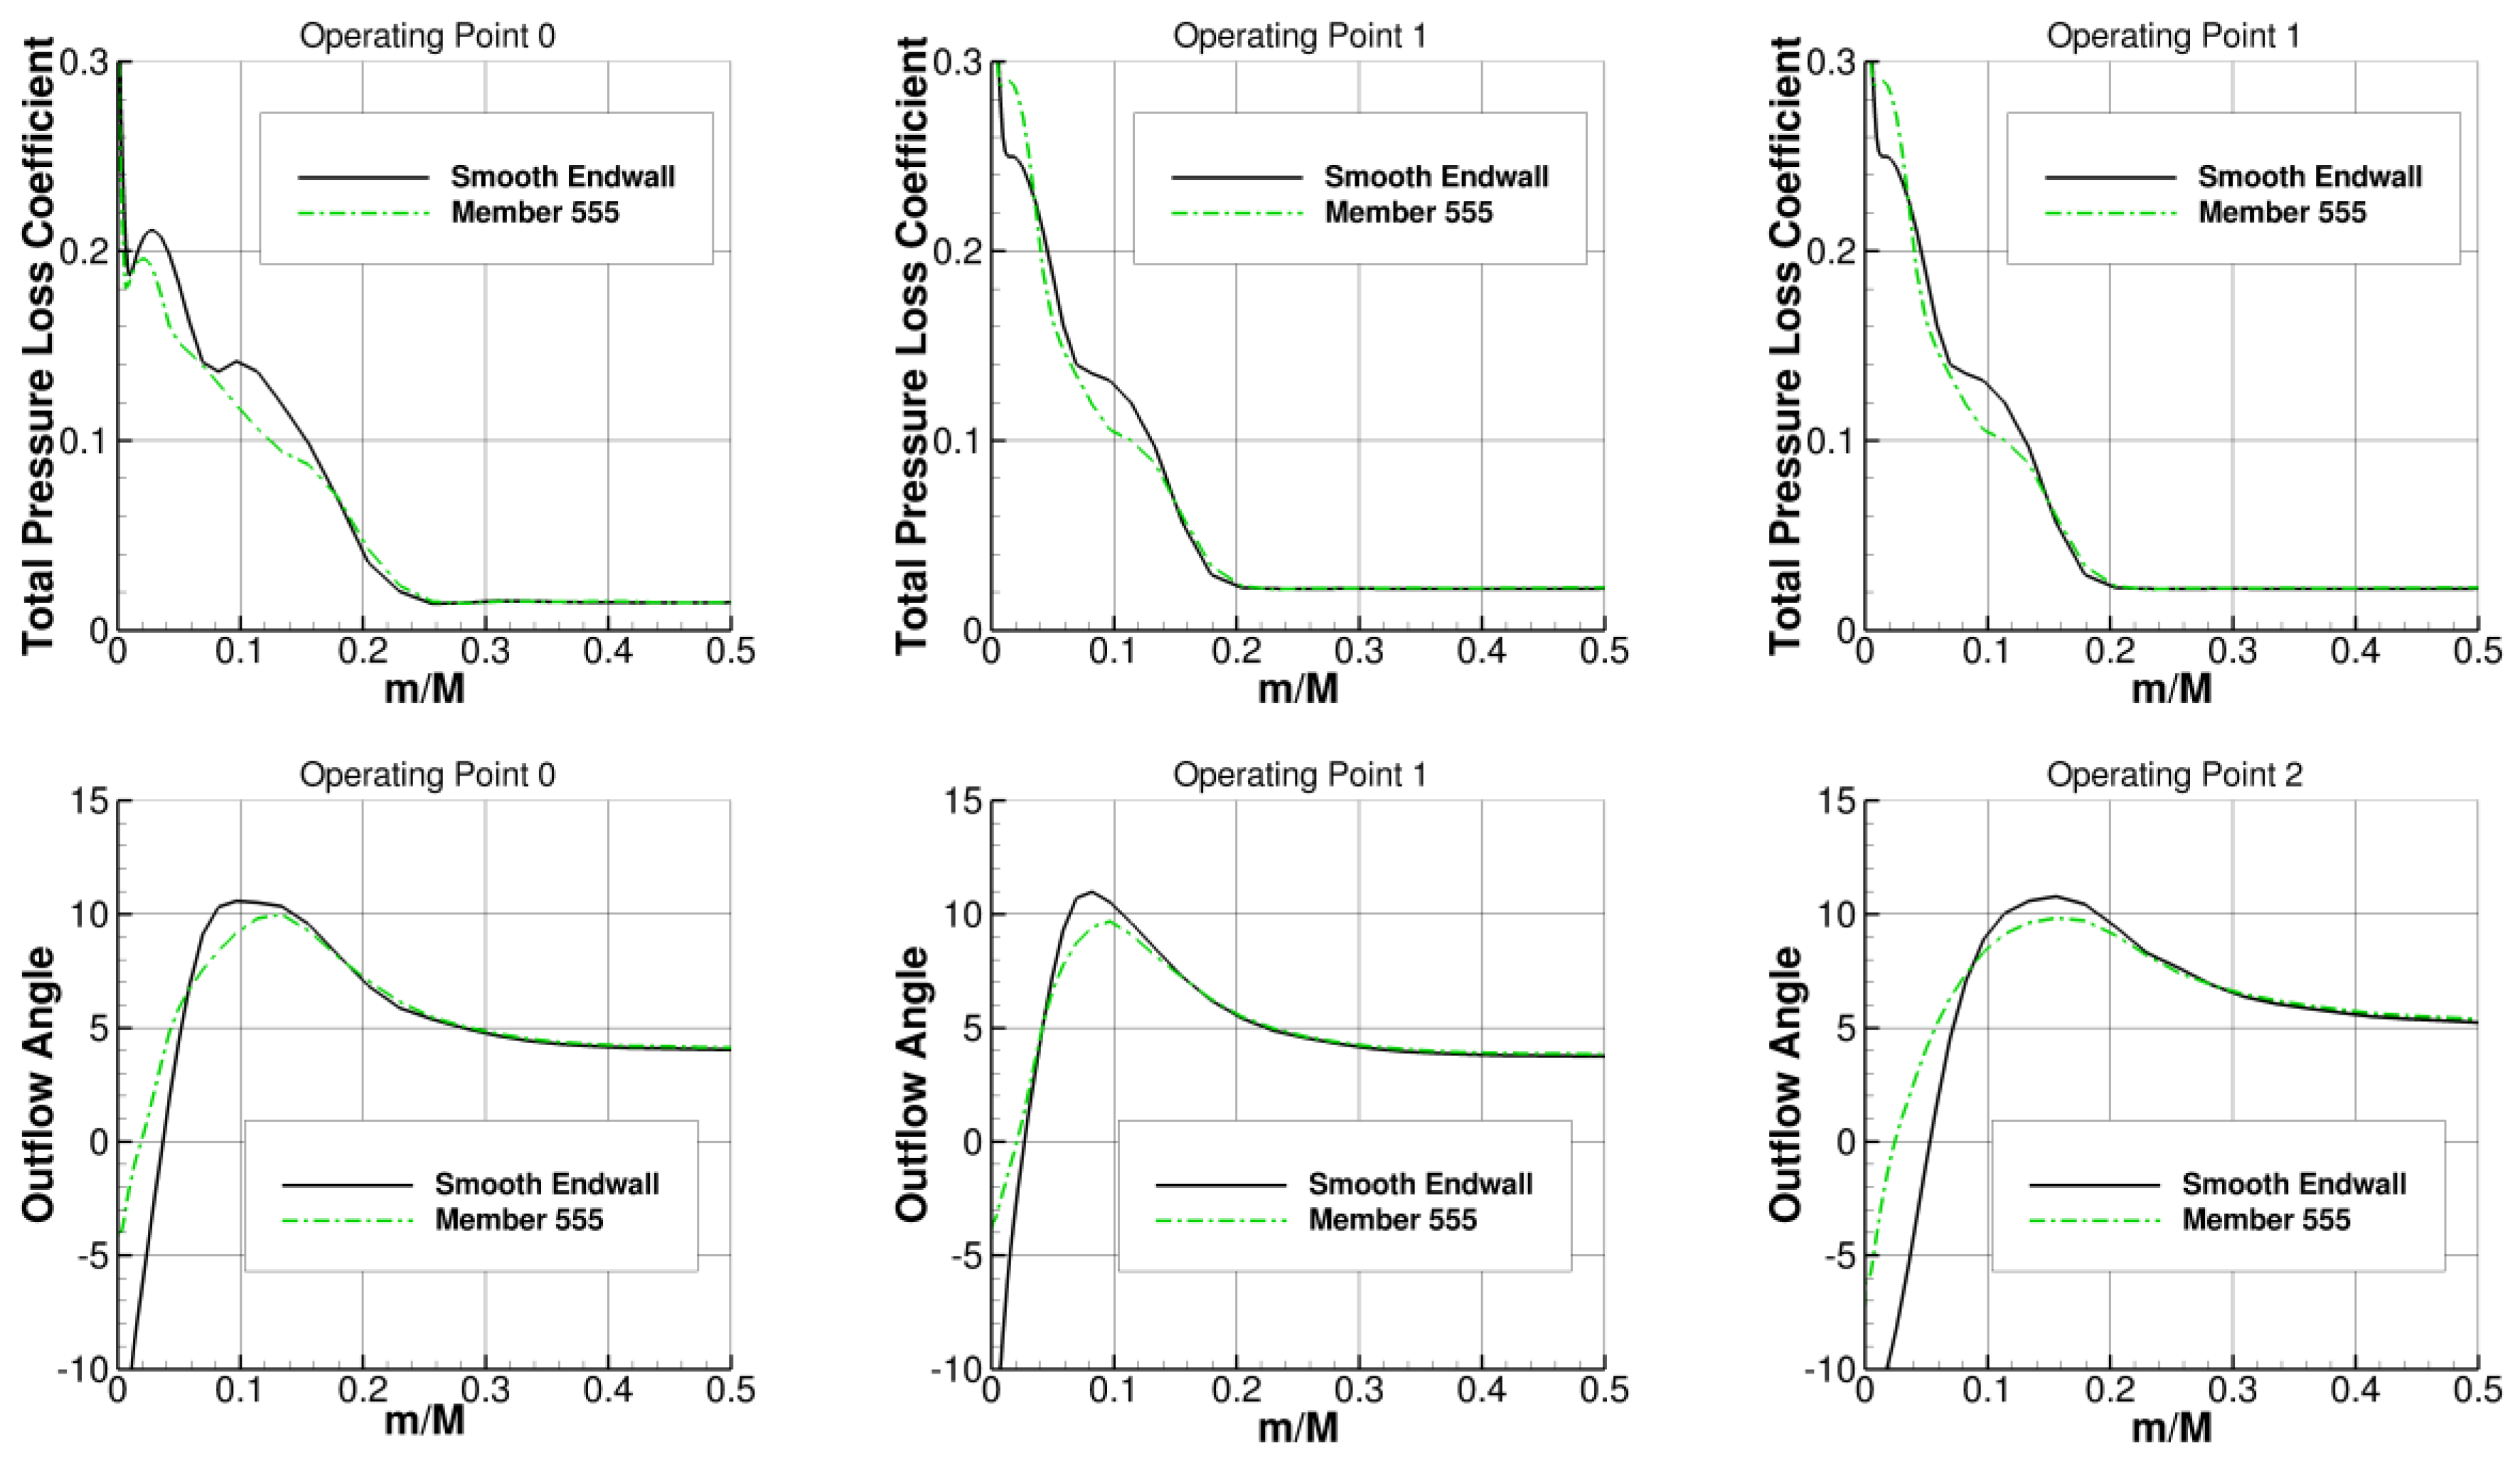
3.2. Endwall Optimization
4. Conclusions
Acknowledgments
Author Contributions
Conflicts of Interest
Nomenclature
| ADP | Aerodynamic design point |
| BC | Boundary condition |
| Cf | Wall shear stress coefficient |
| DLR SC14-067A | DLR Subsonic Cascade designed in 2014 with Mi = 0.67 |
| EWC | Endwall contouring |
| f1,f2 | Fitness functions for the endwall optimization |
| F1,F2 | Fitness functions for the airfoil optimization |
| H | Blade height (m) |
| L | Chord length (m) |
| LE | Leading edge |
| m/M | Relative mass flow (−) |
| m | Coordinate along a streamline (m) |
| m′ | Weighted length along the streamline m′ = ∫dm/r (−) |
| Mi | Mach number at inflow (−) |
| OP | Operating point |
| r | Coordinate in blade height direction, radius (m) |
| t | Pitch (m) |
| TE | Trailing edge |
| TGK | Transonic Cascade Test Facility at DLR Cologne |
| x,y,z | Cartesian coordinates (m) |
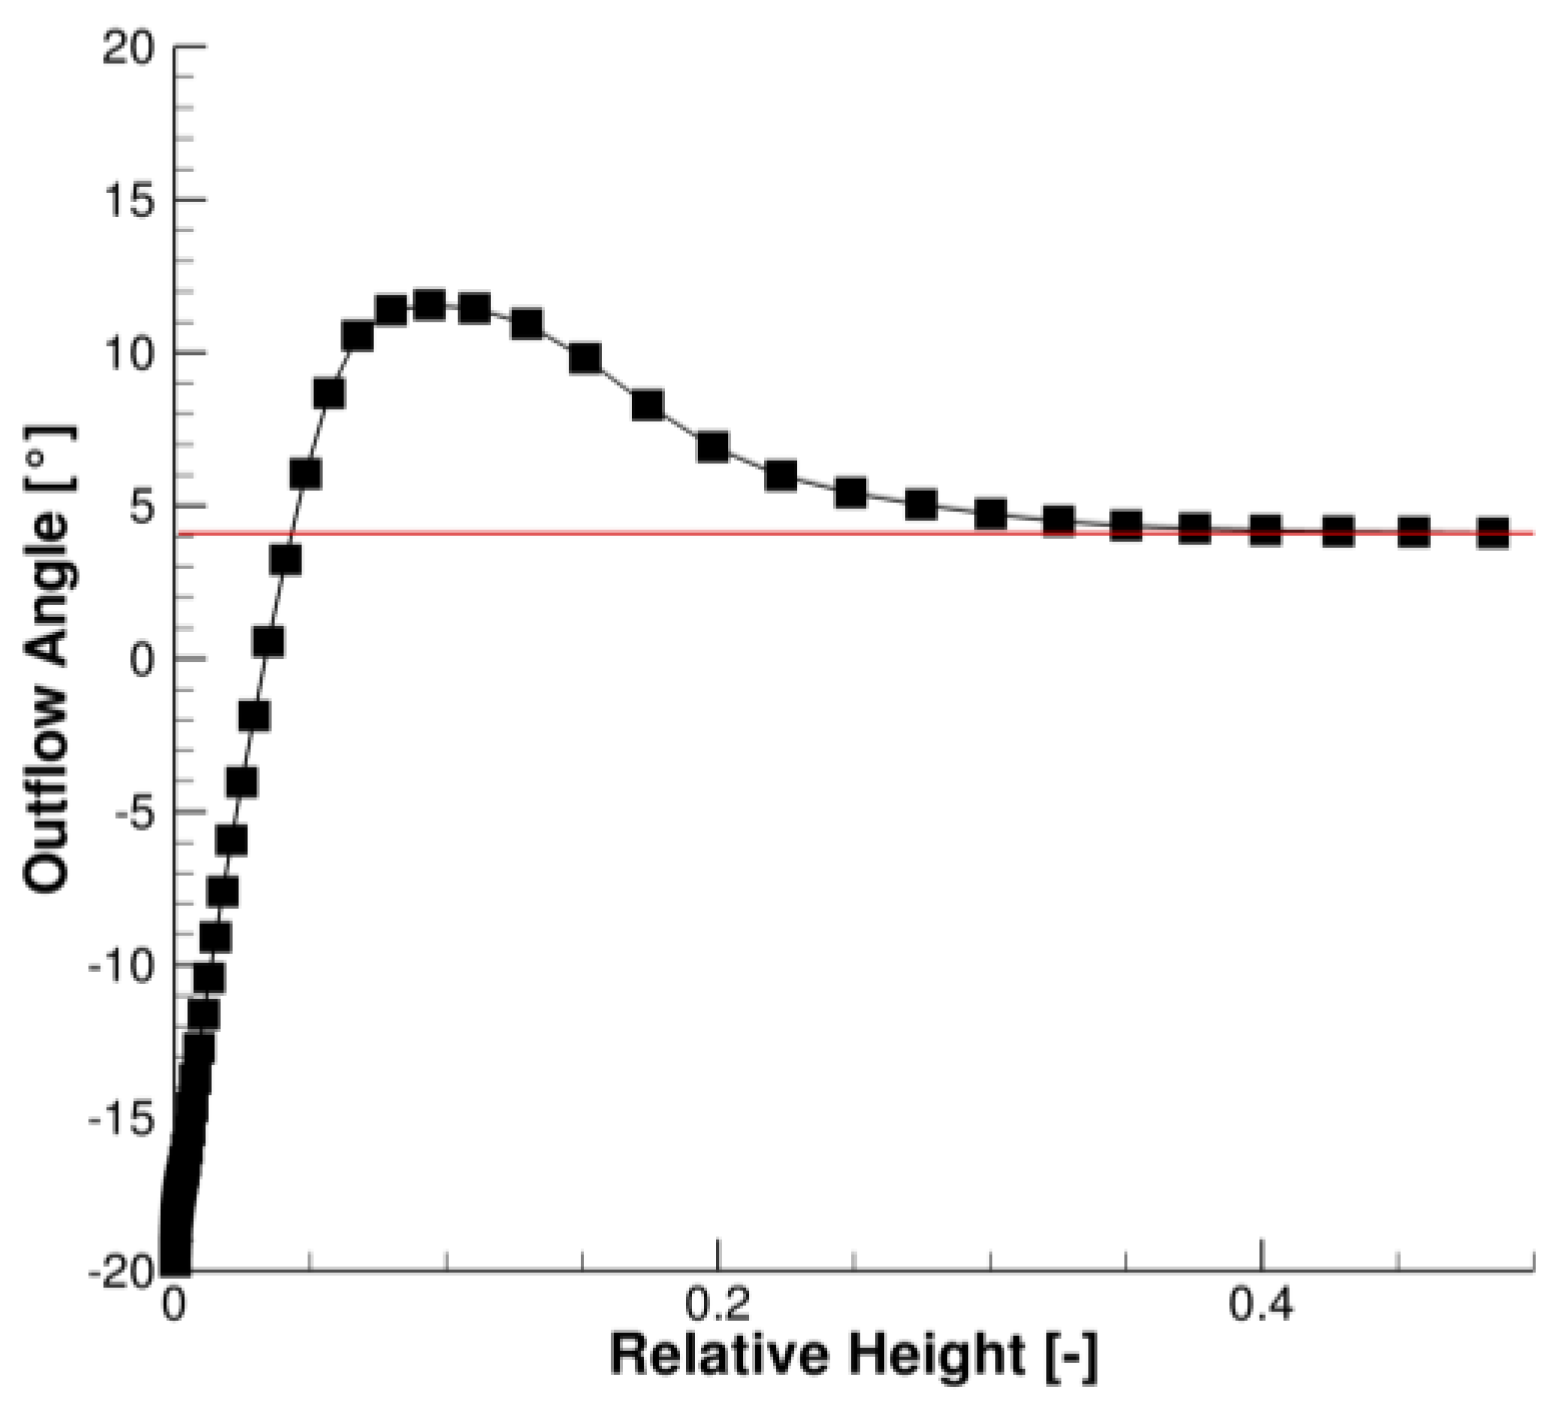
| α | Outflow angle (°) |
| αref | Outflow angle of the reference (°) |
| α1 | Inflow angle (°) |
| αS | Stagger angle (°) |
| Θ | Circumferential angle coordinate (rad) |
| ω | Total pressure loss coefficient (−) |
References
- Scholz, N. Ueber den Einfluss der Schaufelhoehe auf die Randverluste in Schaufelgittern. Forsch. Geb. Ingenieurwes. A 1954, 20, 155–157. [Google Scholar] [CrossRef]
- Spear, D.A.; Biederman, B.P. Flow Directing Assembly for the Compression Section of a Rotary Machine. U.S. Patent 5,397,215, 14 March 1995. [Google Scholar]
- Hoeger, M.; Schmidt-Eisenlohr, U. Rotary Turbomachine Having a Transonic Compressor Stage. U.S. Patent 6,017,186, 25 January 2000. [Google Scholar]
- Harvey, N.W. Some effects of non-axisymmetric end wall profiling on axial flow compressor aerodynamics: Part I—Linear cascade investigation. In Proceedings of the ASME Turbo Expo 2008: Power for Land, Sea, and Air, Berlin, Germany, 9–13 June 2008; pp. 543–555.
- Harvey, N.W.; Offord, T.P. Some effects of non-axisymmetric end wall profiling on axial flow compressor aerodynamics: Part II—Multi-stage HPC CFD study. In Proceedings of the ASME Turbo Expo 2008: Power for Land, Sea, and Air, Berlin, Germany, 9–13 June 2008; pp. 557–569.
- Iliopoulou, V.; Lepot, I.; Geuzaine, P. Design optimization of a HP compressor rotor blade and its hub endwall. In Proceedings of the ASME Turbo Expo 2008: Power for Land, Sea, and Air, Berlin, Germany, 9–13 June 2008; pp. 2197–2208.
- Reising, S.; Schiffer, H.P. Non-axisymmetric end wall profiling in transonic compressors part I: Improving the static pressure recovery at off-design conditions by sequential hub and shroud end wall profiling. In Proceedings of the ASME Turbo Expo 2009: Power for Land, Sea, and Air, Orlando, FL, USA, 8–12 June 2009.
- Reising, S.; Schiffer, H.P. Non-axisymmetric end wall profiling in transonic compressors part II: Design study of a transonic compressor rotor using nonaxisymmetric end walls-optimization strategies and performance. In Proceedings of the ASME Turbo Expo 2009: Power for Land, Sea, and Air, Orlando, FL, USA, 8–12 June 2009.
- Dorfner, C. Entwicklung eines Verfahrens zur Konstruktion Nicht-Rotationssym-Metrischer Seitenwand-Konturen in Axialen Verdichtern. Ph.D. Thesis, University Bochum, Bochum, Germany, 2009. [Google Scholar]
- Dorfner, C.; Hergt, A.; Nicke, E.; Moenig, R. Advanced non-axisymmetric endwall contouring for axial compressors by generating an aerodynamic separator—Part I: Principal cascade design and compressor application. J. Turbomach. 2011, 133, 021026. [Google Scholar] [CrossRef]
- Heinichen, F.; Guemmer, V.; Plas, A.; Schiffer, H.-P. Numerical investigation of the influence of non-axisymmetric hub contouring on the performance of a shrouded axial compressor stator. CEAS Aeronaut. J. 2011, 2, 89–98. [Google Scholar] [CrossRef]
- Gier, J.; Ardey, S.; Eymann, S.; Reinmoeller, U.; Niehuis, R. Improving 3D flow characteristics in a multistage LP turbine by means of endwall contouring and airfoil design modification—Part 2: Numerical simulation and analysis. In Proceedings of the ASME Turbo Expo 2002: Power for Land, Sea, and Air, Amsterdam, The Netherlands, 3–6 June 2002.
- Reutter, O.; Hemmert-Pottman, S.; Hergt, A.; Nicke, E. Endwall Contouring and Fillet Design for Reducing Losses and Homogenizing the Outflow of a Compressor Cascade. In Proceedings of the ASME Turbo Expo 2014: Turbine Technical Conference and Exposition, Düsseldorf, Germany, 16–20 June 2014.
- Voss, C.; Aulich, M.; Kaplan, B.; Nicke, E. Automated multiobjective optimisation in axial compressor blade design. In Proceedings of the ASME Turbo Expo 2006: Power for Land, Sea, and Air, Barcelona, Spain, 8–11 May 2006.
- Siller, U.; Voss, C.; Nicke, E. Automated multidisciplinary optimization of a transonic axial compressor. In Proceedings of the 47th AIAA Aerospace Sciences Meeting including The New Horizons Forum and Aerospace Exposition, Orlando, FL, USA, 5–8 January 2009.
- Aulich, M.; Siller, U. High-dimensional constrained multiobjective optimization of a fan stage. In Proceedings of the ASME 2011 Turbo Expo: Turbine Technical Conference and Exposition, Vancouver, BC, Canada, 6–10 June 2011; pp. 1185–1196.
- Voss, C.; Aulich, M.; Raitor, T. Metamodel Assisted Aeromechanical Optimization of a Transonic Centrifugal Compressor. In Proceedings of the ISROMAC 2014, Honolulu, HI, USA, 24–28 February 2014.
- Youngren, H.; Drela, M. Viscous/Inviscid method for preliminary design of transonic cascades. In Proceedings of the 27th Joint Propulsion Conference, Sacramento, CA, USA, 24–26 June 1991.
- Becker, K.; Heitkamp, K.; Kuegeler, E. Recent progress in a hybrid-grid CFD solver for turbomachinery flows. In Proceedings of the 5th European Conference on Computational Fluid Dynamics, ECOMAS CFD 2010, Lisbon, Portugal, 14–17 June 2010.
- Franke, M.; Roeber, T.; Kuegeler, E.; Ashcroft, G. Turbulence treatment in steady and unsteady turbomachinery flows. In Proceedings of the 5th European Conference on CFD, Lisbon, Portugal, 14–17 June 2010.
- Hergt, A.; Dorfner, C.; Steinert, W.; Nicke, E.; Schreiber, H.-A. Advanced nonaxisymmetric endwall contouring for axial compressors by generating an aerodynamic separator—Part II: Experimental and numerical cascade investigation. J. Turbomach. 2011, 133, 021027. [Google Scholar] [CrossRef]
- Marciniak, V.; Weber, A.; Kügeler, E. Modelling transition for the design of modern axial turbomachines. In Proceedings of the 6th European Conference on Computational Fluid Dynamics, Barcelona, Spain, 20–25 July 2014.
- Hergt, A. Ueber grenzschichtbeeinflussende Maßnahmen in den Randzonen von Verdichtergittern. Ph.D. Thesis, Technical University Berlin, Berlin, Germany, 2011. [Google Scholar]
- Lengyel, T.; Schmidt, T.; Voß, C.; Nicke, E. Design of a counter rotating fan—An aircraft engine technology to reduce noise and CO2-emissions. In Proceedings of the 19th ISABE Conference Montral/Canada 2009, Montreal, QC, Canada, 8–12 September 2009.
- Köller, U.; Mönig, R.; Küsters, B.; Schreiber, H.-A. Development of advanced compressor airfoils for heavy-duty gas turbines—part I: Design and optimization. ASME J. Turbomach. 2000, 122, 397–405. [Google Scholar]
- Küsters, B.; Schreiber, H.-A.; Köller, U.; Mönig, R. Development of advanced compressor airfoils for heavy-duty gas turbines—part II: Experimental and theoretical analysis. ASME J. Turbomach. 2000, 122, 406–414. [Google Scholar]


| Variable | NACA-65 K48 Airfoil |
|---|---|
| L | 70 mm |
| t/L | 0.55 |
| H/L | 2.4 |
| α1,ADP | 42° |
| αS | 22.5° |
| Mi | 0.67 |
© 2017 by the authors. Licensee MDPI, Basel, Switzerland. This article is an open access article distributed under the terms and conditions of the Creative Commons Attribution (CC BY) license ( http://creativecommons.org/licenses/by/4.0/).
Share and Cite
Reutter, O.; Rozanski, M.; Hergt, A.; Nicke, E. Advanced Endwall Contouring for Loss Reduction and Outflow Homogenization for an Optimized Compressor Cascade. Int. J. Turbomach. Propuls. Power 2017, 2, 1. https://doi.org/10.3390/ijtpp2010001
Reutter O, Rozanski M, Hergt A, Nicke E. Advanced Endwall Contouring for Loss Reduction and Outflow Homogenization for an Optimized Compressor Cascade. International Journal of Turbomachinery, Propulsion and Power. 2017; 2(1):1. https://doi.org/10.3390/ijtpp2010001
Chicago/Turabian StyleReutter, Oliver, Magdalena Rozanski, Alexander Hergt, and Eberhard Nicke. 2017. "Advanced Endwall Contouring for Loss Reduction and Outflow Homogenization for an Optimized Compressor Cascade" International Journal of Turbomachinery, Propulsion and Power 2, no. 1: 1. https://doi.org/10.3390/ijtpp2010001