Methods for Controlling Gas Turbine Casing Flows During Engine Shutdown


1
Osney Thermo-Fluids Laboratory, University of Oxford, Oxford OX2 0ES, UK
2
Research & Innovation Center, Mitsubishi Heavy Industries, Ltd., 2-1-1 Shinhama, Arai-Cho, Takasago 676-8686, Japan
*
Author to whom correspondence should be addressed.
Int. J. Turbomach. Propuls. Power 2018, 3(2), 17; https://doi.org/10.3390/ijtpp3020017
Submission received: 19 February 2018
/
Revised: 31 May 2018
/
Accepted: 6 June 2018
/
Published: 12 June 2018
Abstract
:During the shutdown of a gas turbine, natural convection flows occur inside of the engine casing. These natural convection flows cause the top of the engine casing to cool more slowly than the bottom of the casing. This non-uniform cooling can cause the casing to distort, known as “cat-back” distortion. This distortion leads to reduced tip and seal clearances, which can cause rubbing and binding. In this study, two different methods for reducing the non-uniform casing heat transfer in an industrial gas turbine during shutdown were investigated. A baseline case with no active method for reducing the casing heat transfer was compared with purge and flow extraction methods. It was found that the new proposed extraction method improved the uniformity of the casing heat transfer during the initial shutdown period.
1. Introduction
Natural convection flows occur inside of gas turbine casings during shutdown. These flows cause non-uniform cooling of the casing and cause the casing to distort, known as “cat-back” distortion. This distortion of the casing is undesirable, as it can cause the rubbing and binding of seals and rotor blades, reducing the operational flexibility of the engine. In order to reduce the casing distortion during shutdown, methods to make the casing heat transfer more uniform have been analysed. If the shutdown heat transfer can be made more uniform and the casing distortion reduced, rotor tip and seal clearances could potentially be reduced. This could lead to improved engine efficiency and increased compressor stability.
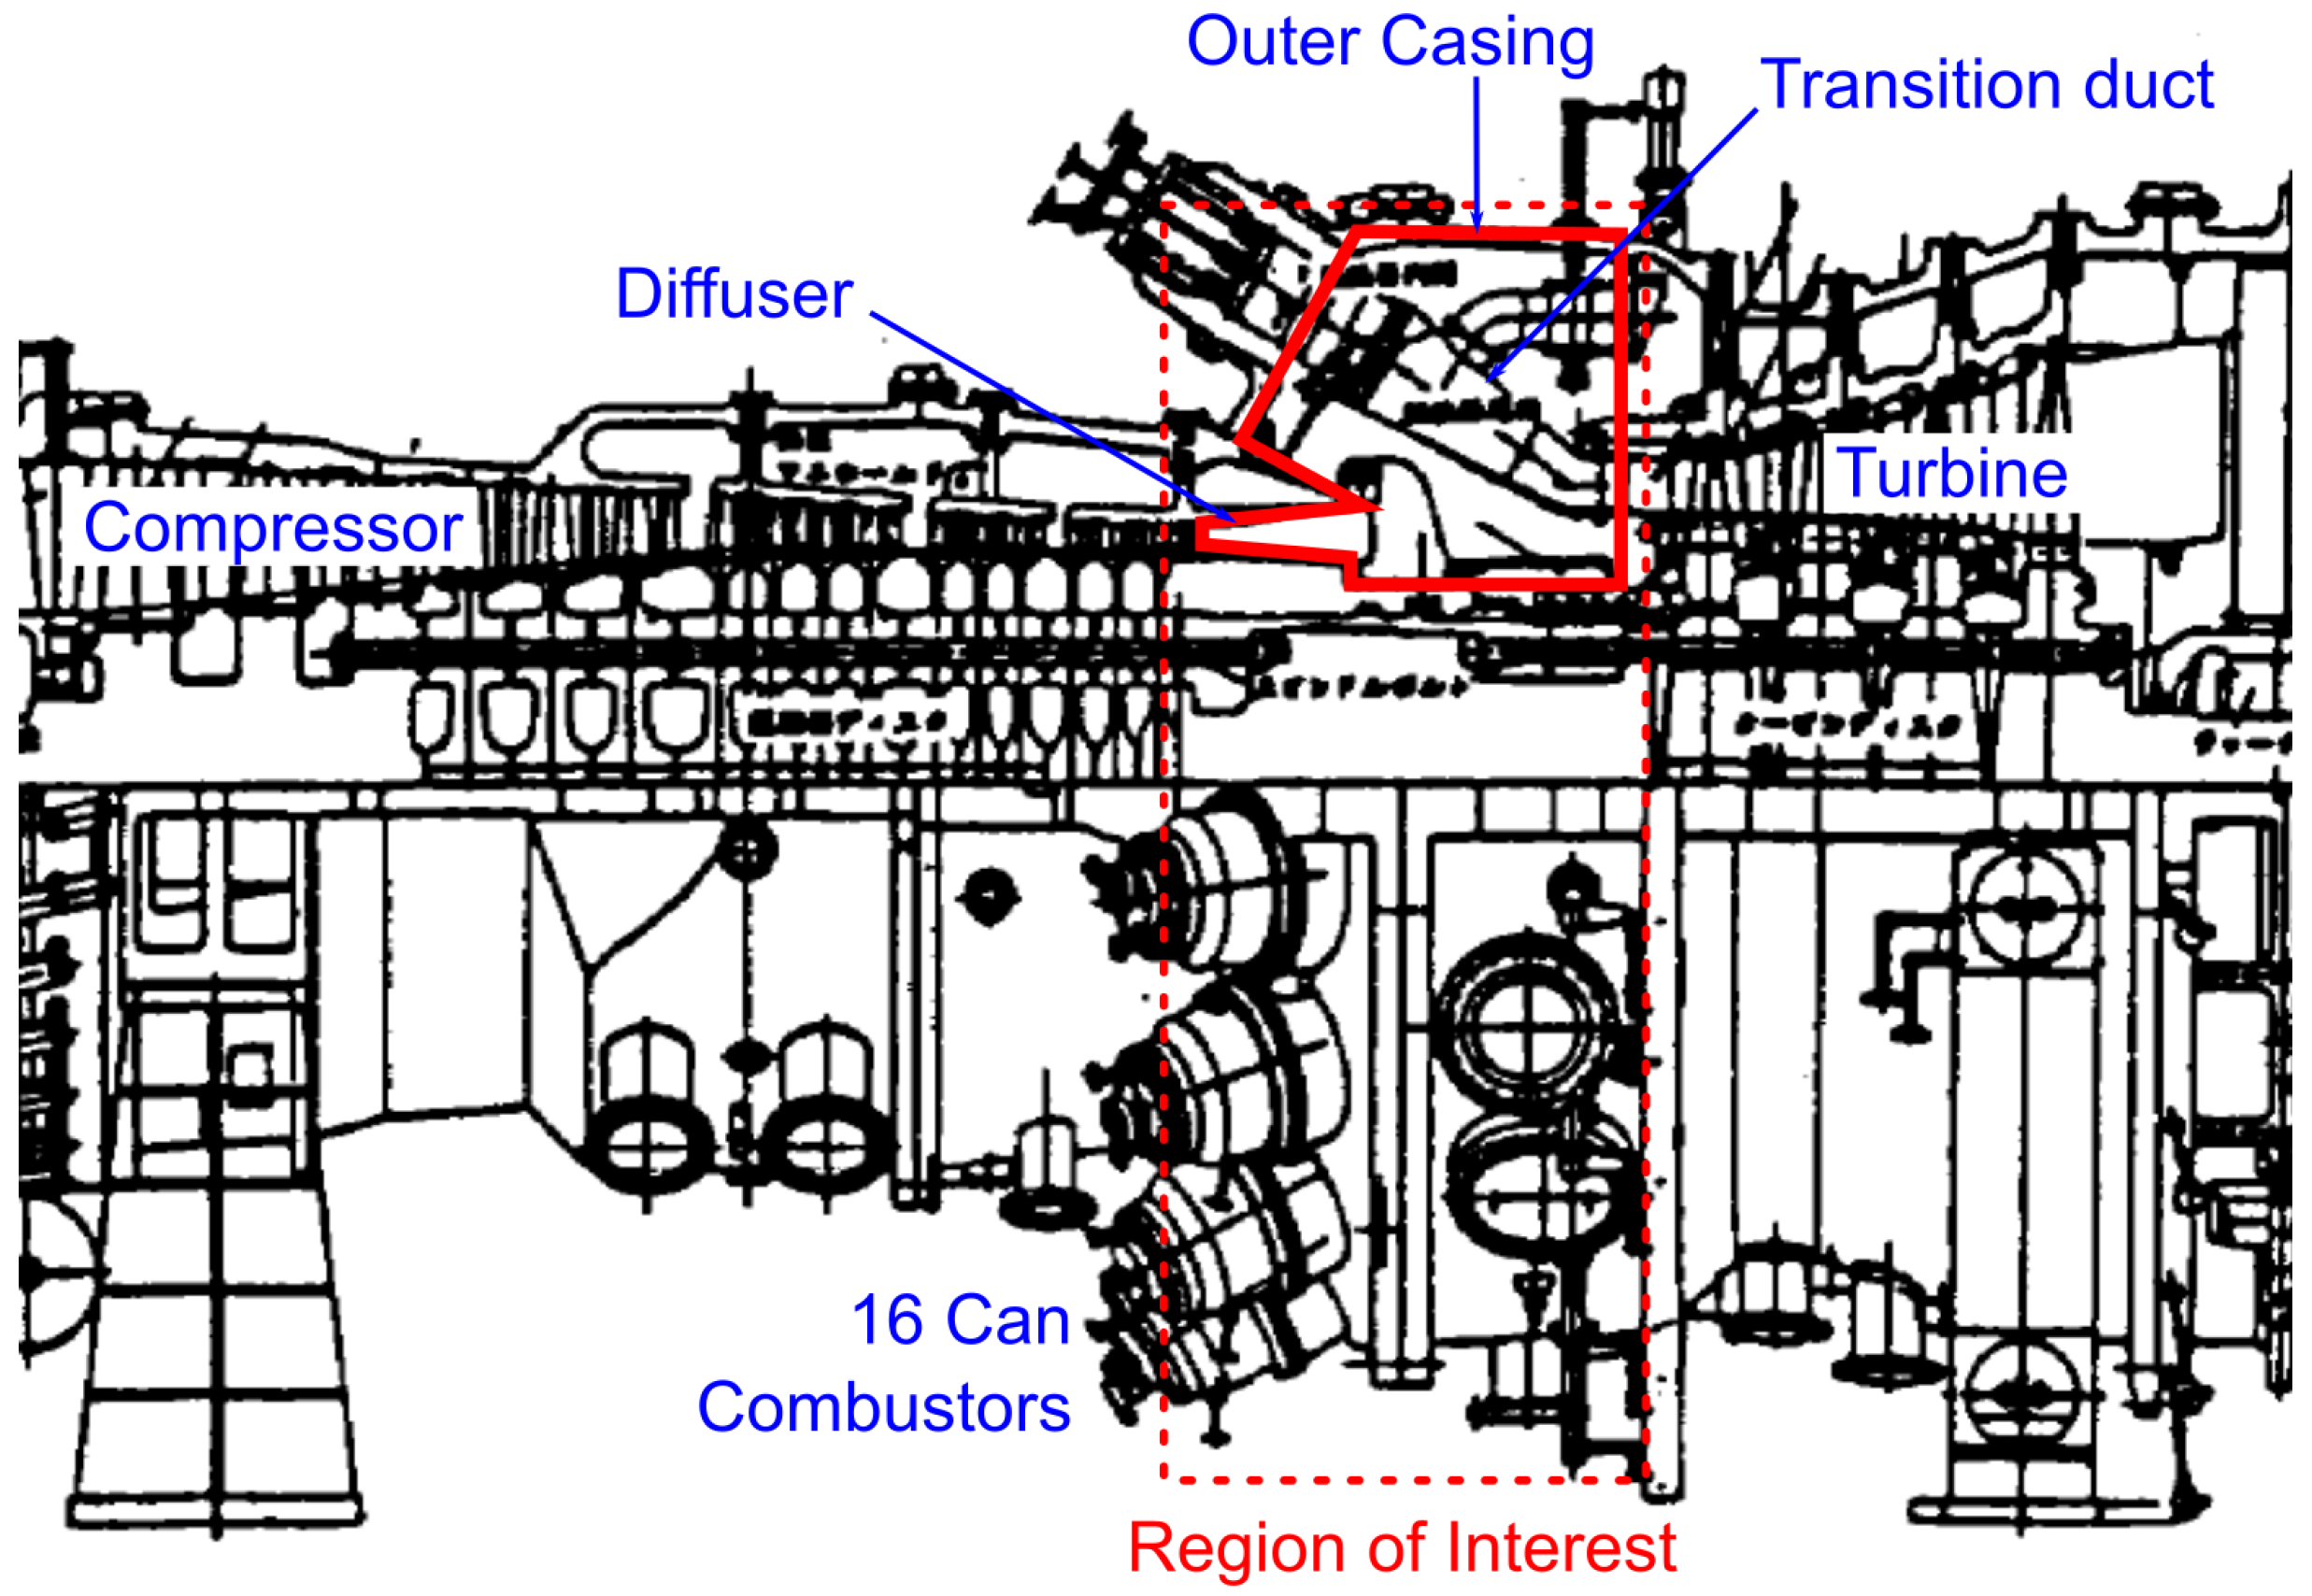
A cross section of a large industrial gas turbine is shown in Figure 1. The region of interest is the outer casing which surrounds the combustor cans. Immediately after a gas turbine is shut down, the outer casing is at a temperature of around 350 °C. The outer casing is a relatively thick cast component which takes days to cool down [1]. This is compared to the combustor cans, which are made of much thinner metal and cool more quickly, giving temperature differences of over 100 °C between these components. The different temperatures inside of the engine casing then cause buoyancy-driven flows to occur. There is also a flow of air though the engine driven by the draught from the chimney downstream of the engine. These flows then determine the convective heat transfer inside the engine casing.
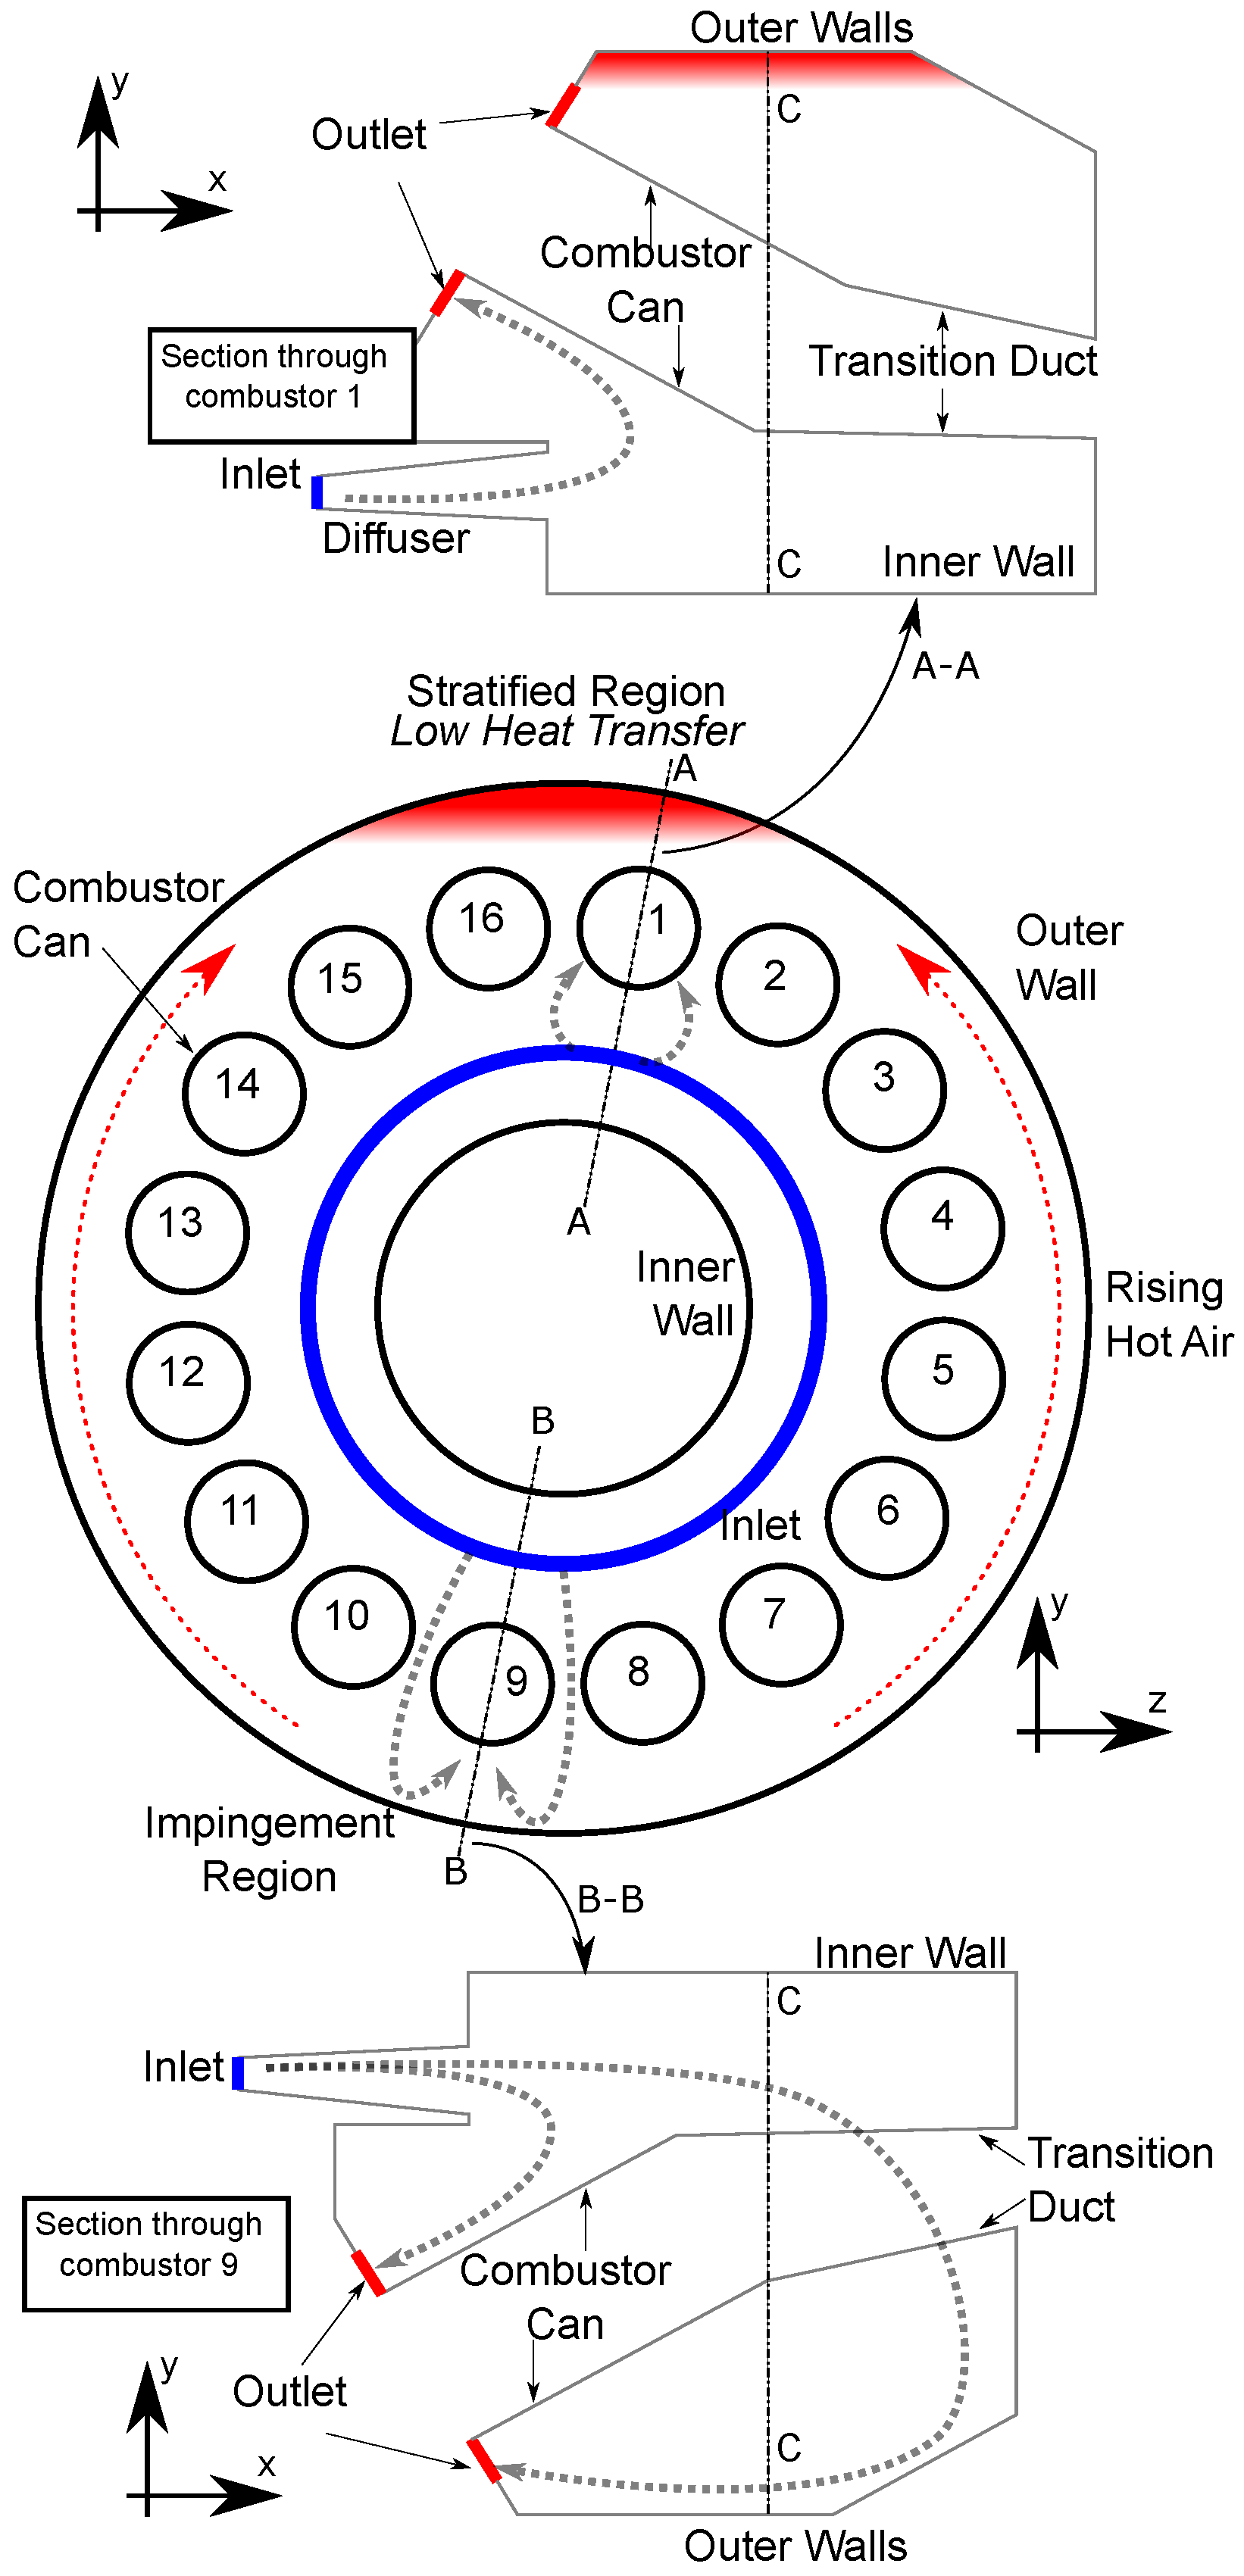
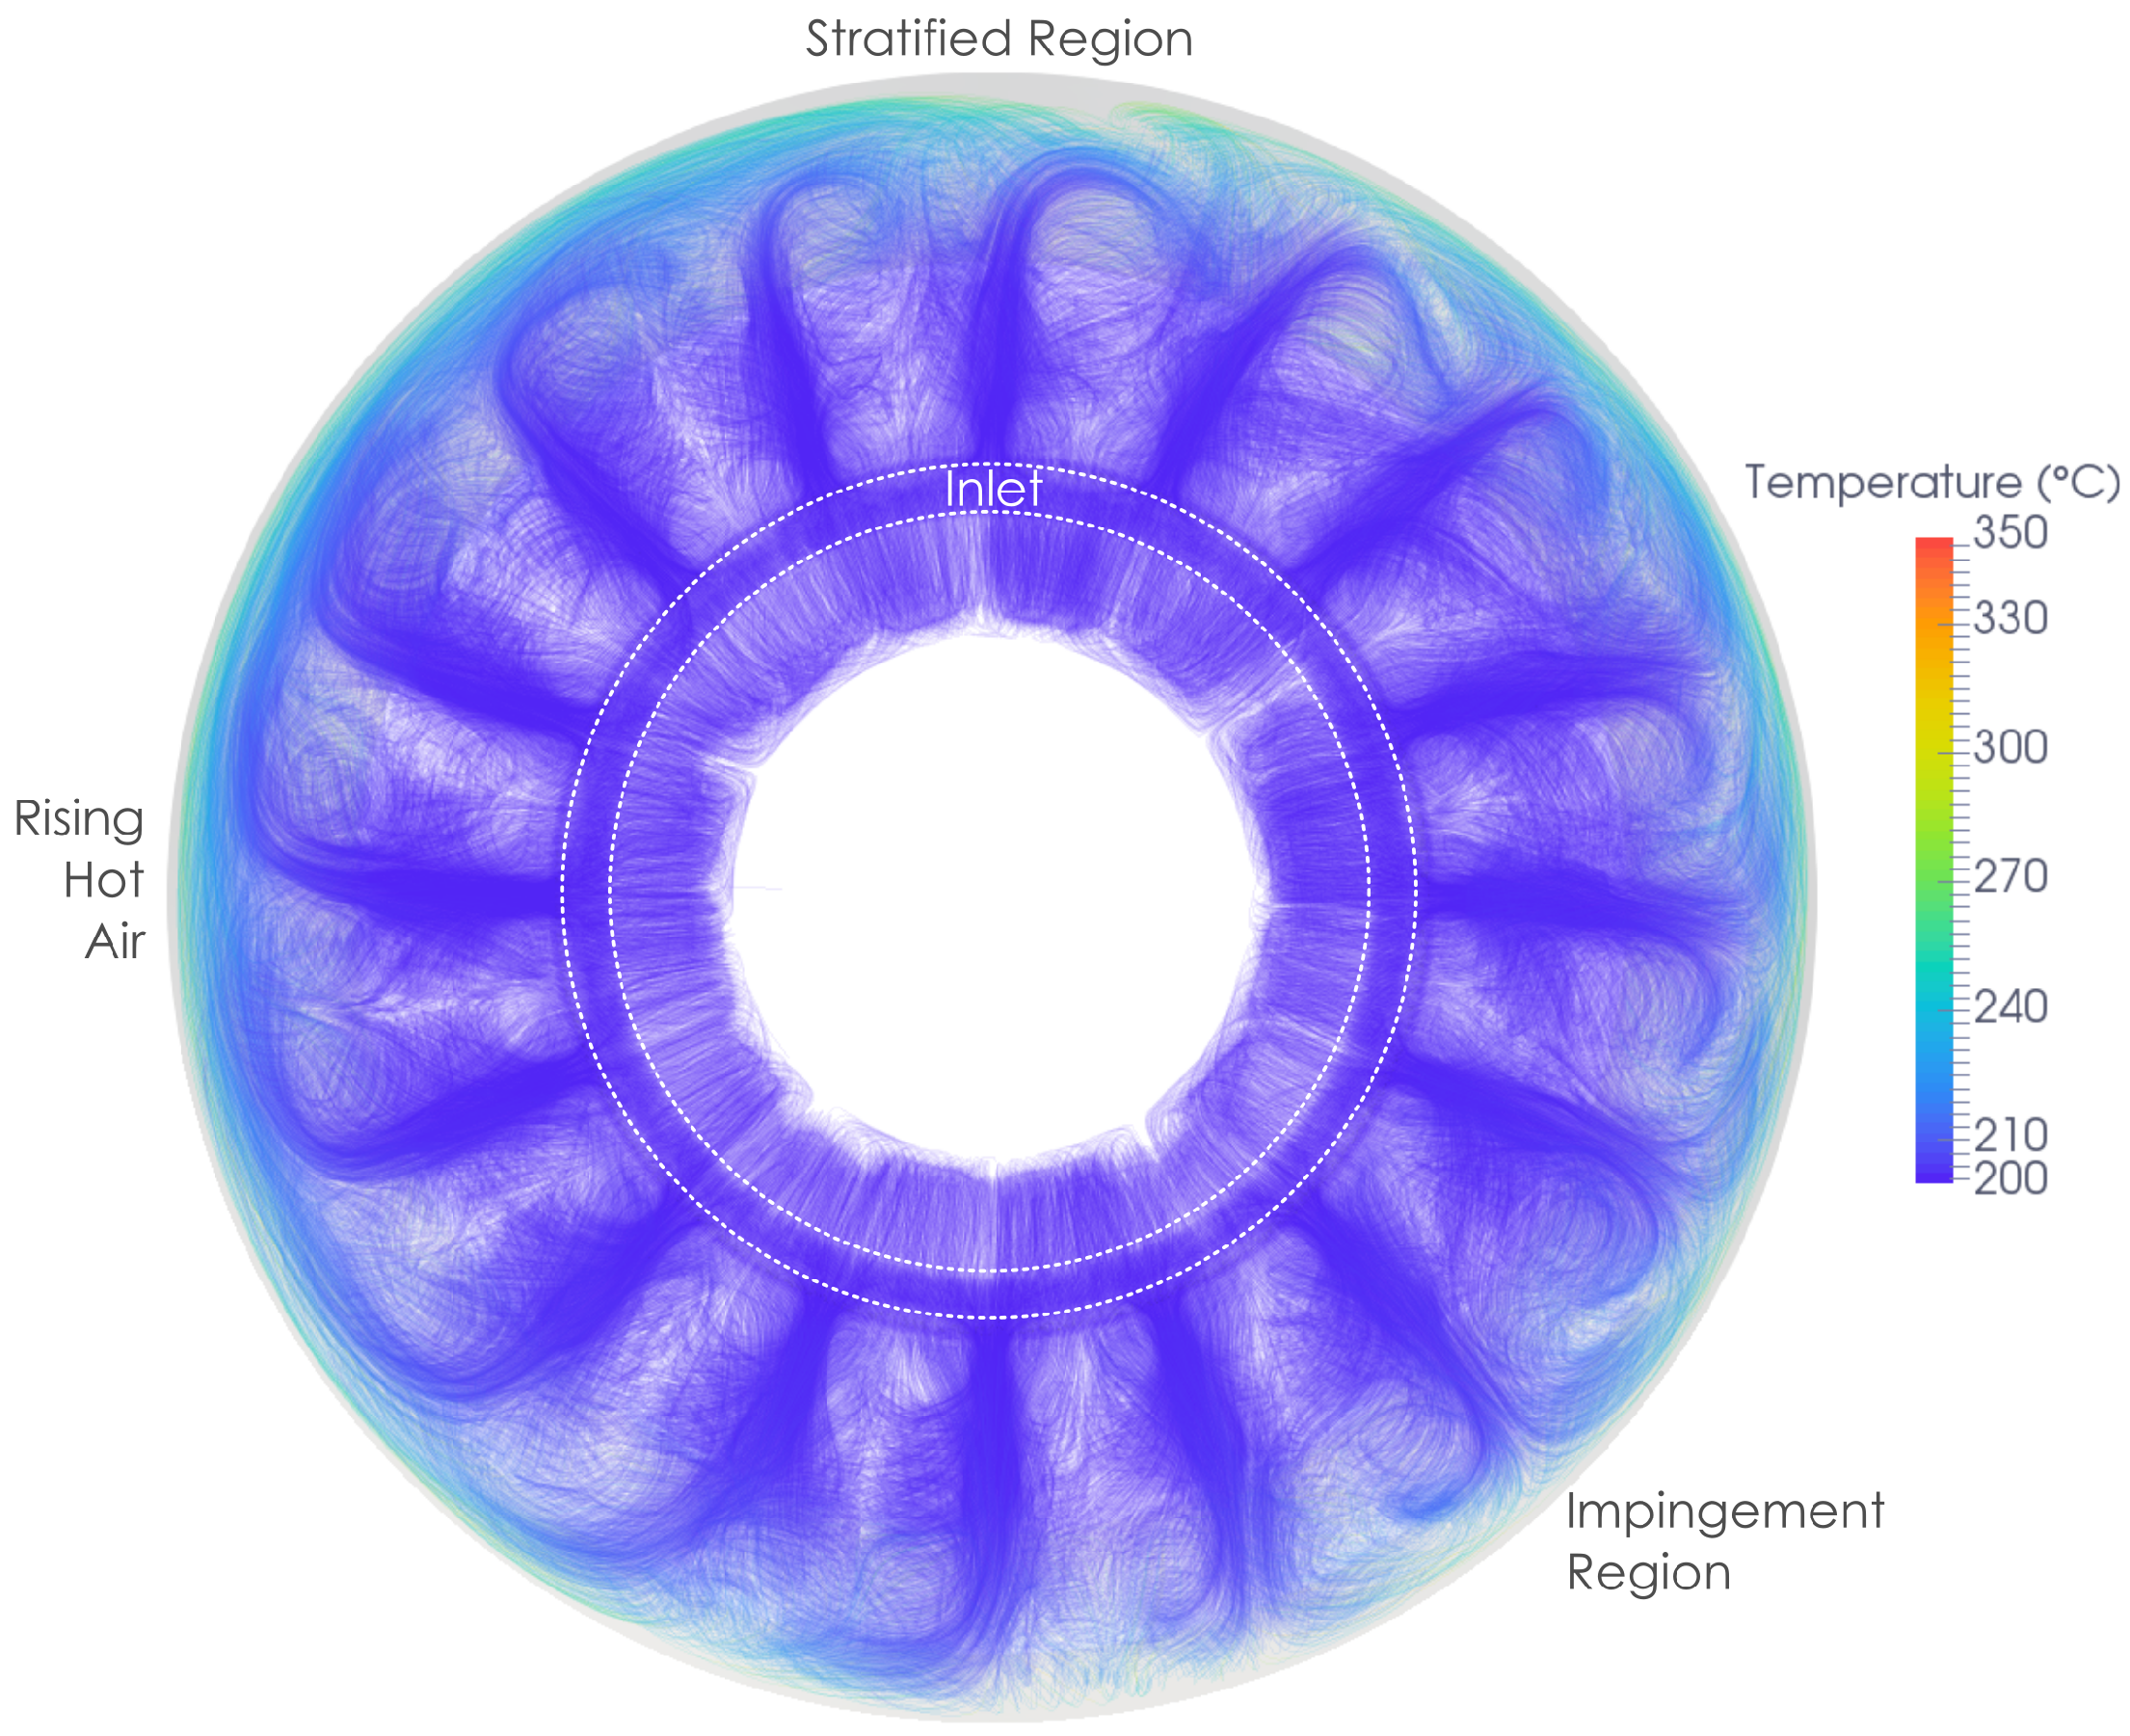
The flowfield inside of the engine is shown schematically in Figure 2. In areas where the flow inside of the engine casing impinges on the outer wall, the heat transfer from the hot outer casing is increased. At the top of the engine, a region of thermally stratified flow occurs below the outer casing. In this stratified flow region, the heat transfer from the casing is reduced. The low heat transfer in the stratified region and higher heat transfer in the impingement regions causes the outer casing to cool non-uniformly. This non-uniform cooling then leads to the cat-back distortion of the casing.
This study involved the simulation of a 3D geometry representative of a large industrial gas turbine. Simulations were conducted looking at the effectiveness of different methods for reducing the casing distortion during engine shutdown. The simulations were used to predict the flow and heat transfer inside of the gas turbine casing. The different methods for reducing distortion were evaluated based on the uniformity of the heat transfer around the casing, as a larger non-uniformity would give rise to greater casing distortion. Full 3D simulations of natural convection shutdown flows are not common in the literature or industry. Instead, correlations are often used to obtain the casing heat transfer [3].
The baseline case for this study had no active method of controlling the natural convection flows occurring inside of the gas turbine casing. Without any active controlling method, it would be expected that a region of thermally stratified flow would occur at the top of the casing. This stratified layer would give low heat transfer from the outer casing.
A purge system can be employed to reduce the non-uniform cooling during shutdown. The purge system injects cool air into the top of the engine through a hole in the outer casing. The aim of this system is to break up the stratified layer of air at the top of the casing, hence increasing the heat transfer in this region. Experience from engines has found that the purge system does not completely eliminate the casing distortion, and it is desirable to reduce this further. A purge case simulation was conducted in order to observe the heat transfer distribution using this system.
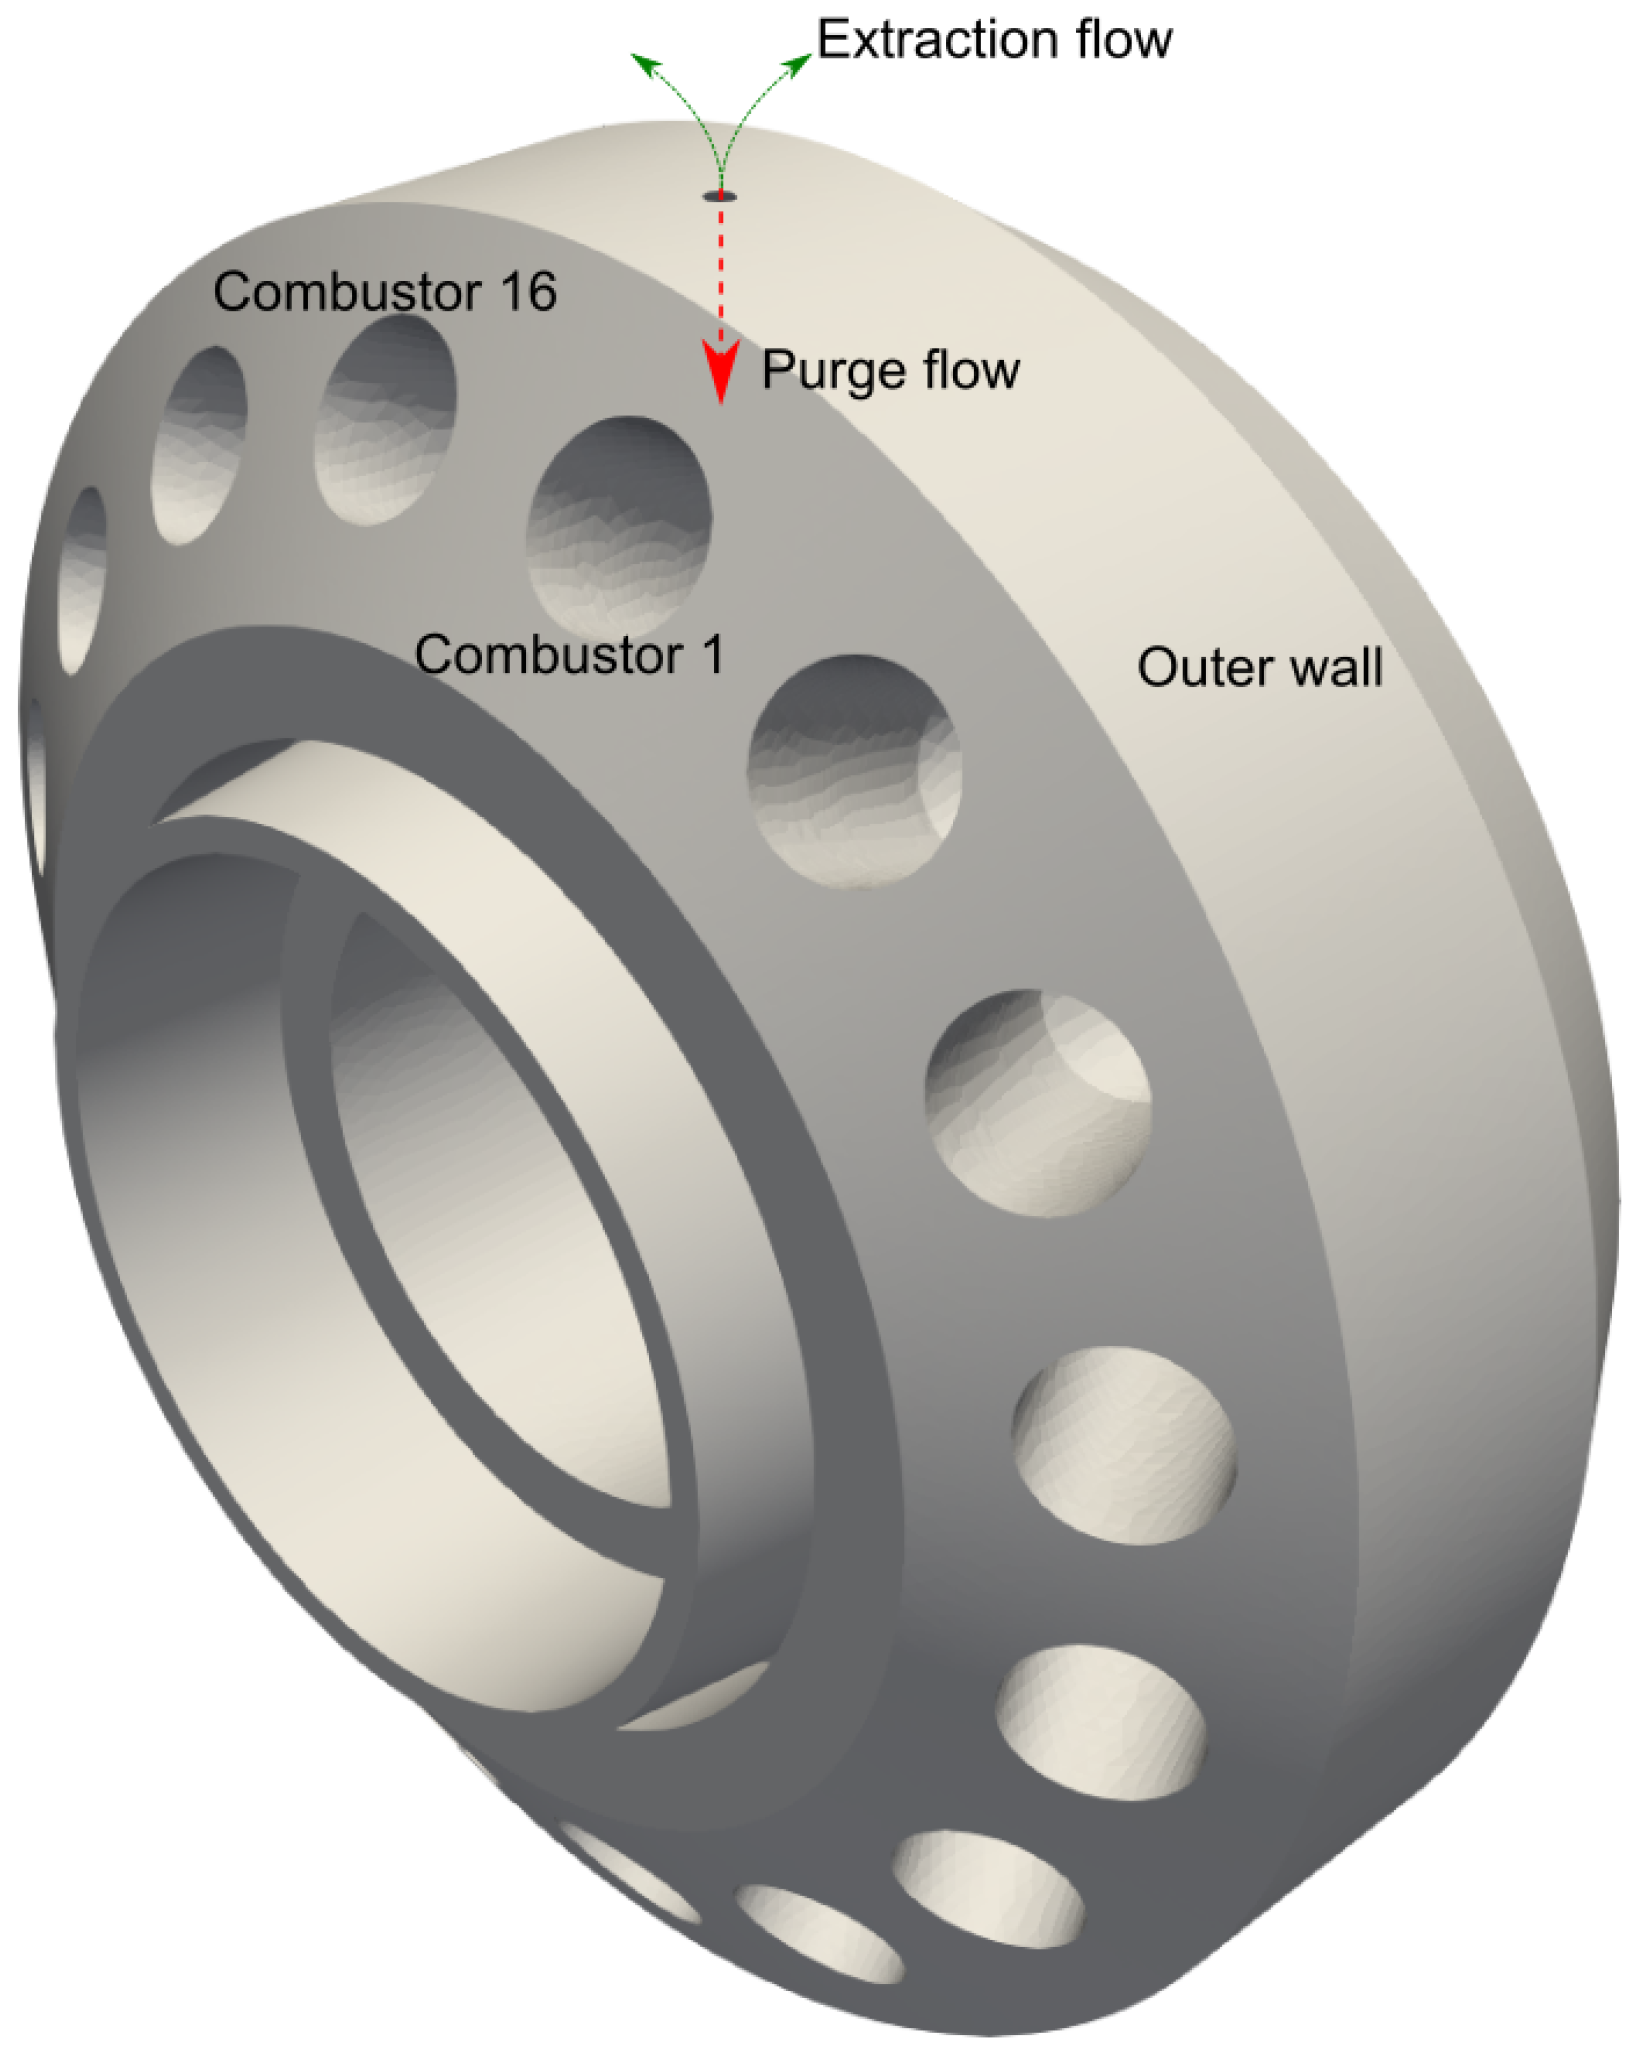
The proposed method for controlling the outer casing heat transfer is extraction-based. Instead of injecting air into the casing, flow is extracted from the casing, with the aim of removing the thermally stratified layer of air. One feature of the extraction method is that it can potentially be retrofitted to existing engines if they are using the purge system. The flow would be extracted through the hole in the casing used for the purge flow, with modifications limited to the external pipework.
2. Test Case
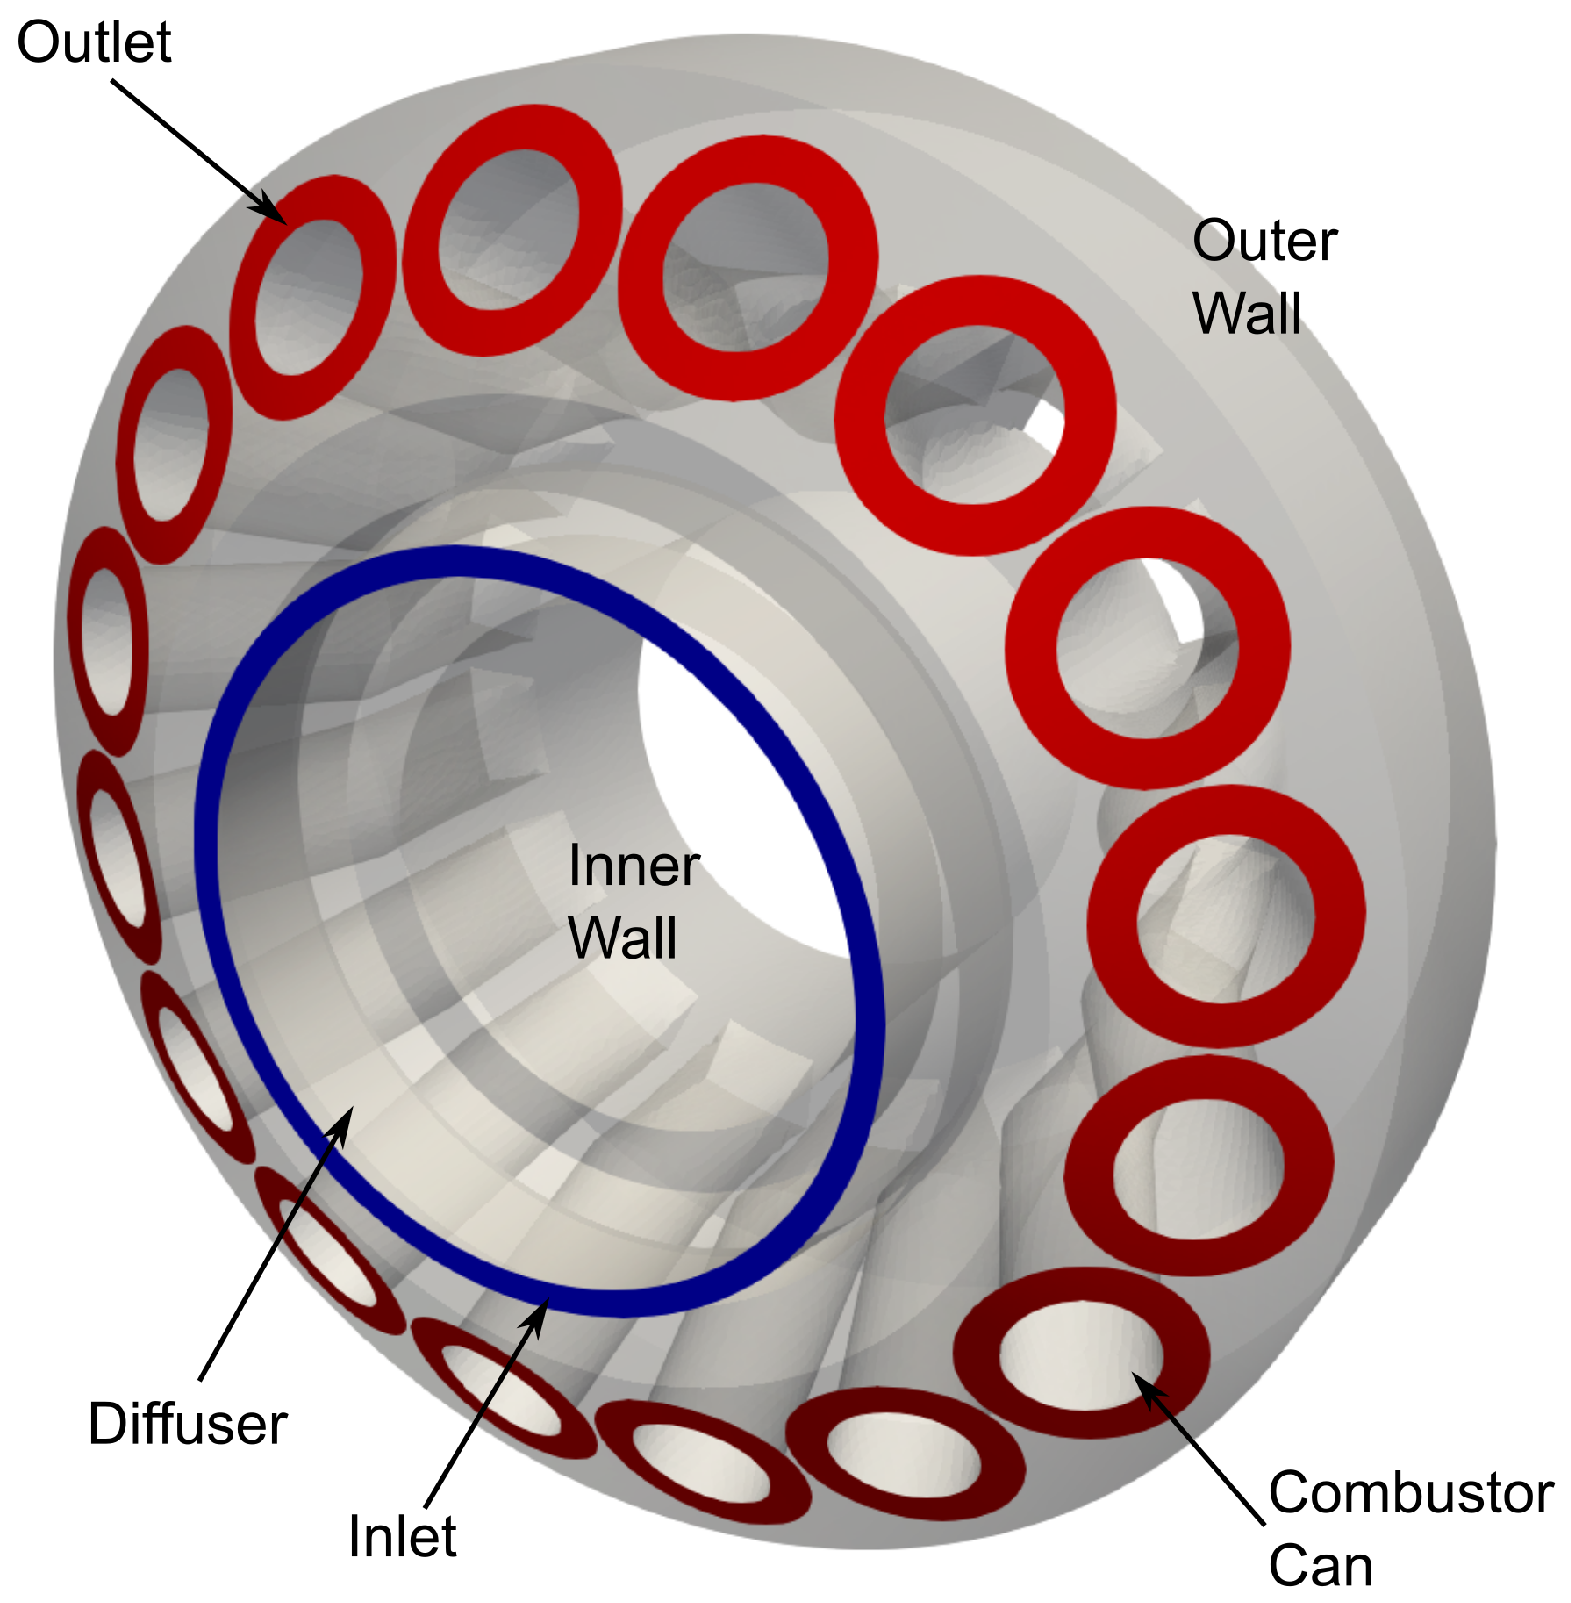
The geometry used for this study is representative of an industrial gas turbine, shown in Figure 3. Previous studies of natural convection flows tend to use very simple geometries, such as a heated concentric cylinder [4], a heated cavity [5], or a heated wall [6,7]. The inclusion of effects such as the blockage from the combustor cans makes a significant difference in the flowfield over the simple test cases.
Other studies using representative gas turbine geometries during shutdown include those of Smith and Neely [8], and Tisarev et al. [9]. These studies were on gas turbines that were much smaller than the large industrial gas turbines, and were operated at lower Rayleigh numbers. A 2D axi-symmetric thermal analysis of a gas turbine was also investigated by Reddy et al. [10] and Selvam et al. [11].
The geometry used in this study consists of a casing outer wall of 3.7 m diameter and an inner wall of 1.32 m diameter, and between these is the main flow cavity. Combustor cans and transition ducts are present in the main cavity and act as a blockage to the flow. The flow enters the cavity though an inlet representing the flow from the compressor exit, followed by a diffuser into the main cavity. From the main cavity, the flow would then go into the 16 combustor cans, which are represented by the 16 circular exits in the front wall of the casing. The combustors are numbered in this paper for identification (Figure 2).
The boundary conditions used in the transient simulations are representative of those from an industrial gas turbine just after shutdown. Over the simulation time period of 50 s, the wall and inlet temperatures are assumed to be constant, as this is much shorter than the shutdown period of several days. The heat fluxes calculated during this period can be used to determine if distortion is likely to occur, by observing the uniformity of the heat flux profile around the casing. As the gas turbine slowly cools, the temperatures are likely to become circumferentially non-uniform. It is believed that the inlet temperature coming from the compressor exit would develop a temperature profile, with hotter fluid towards the top of the inlet. This temperature profile could exacerbate any thermal stratification inside of the outer casing.
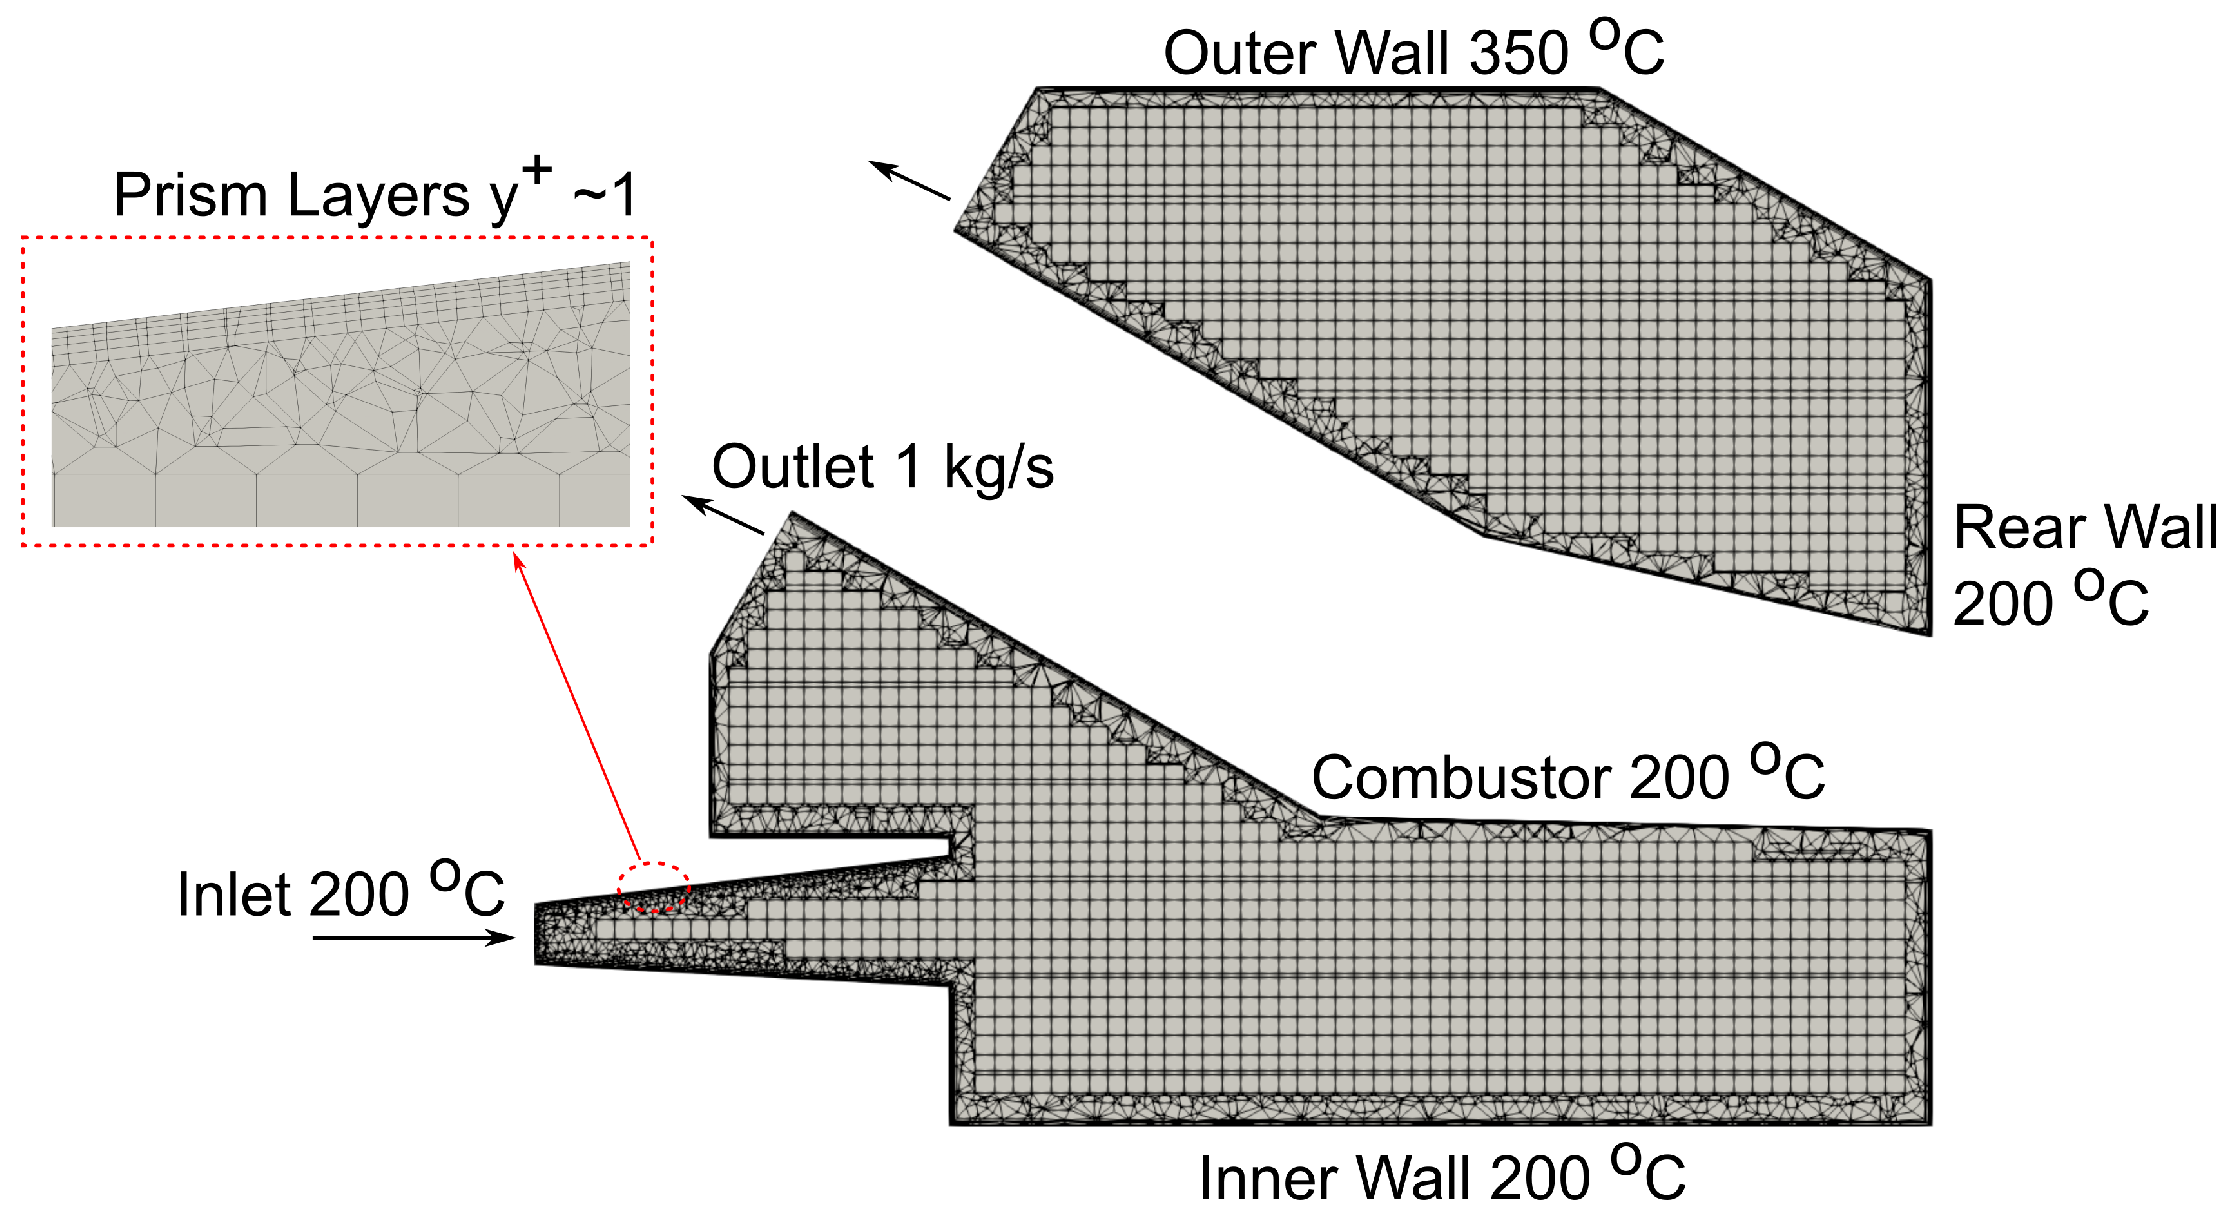
The walls all had constant temperature boundary conditions applied. The outer walls used 350 °C, and all of the other walls used 200 °C. The inlet flow from the compressor was also at a constant 200 °C, with the inlet being modelled as a constant pressure inlet. The draught through the engine from the chimney also needed to be included in the simulations. This flow was modelled by a l kg/s target mass flow rate applied at the combustor outlet. For the cases with a purge flow, this was modelled using a mass flow inlet boundary condition with an inlet temperature of 20 °C. For cases using flow extraction, this was modelled using a pressure outlet boundary condition with a target mass flow rate.
The Rayleigh number based on the outer wall diameter D and a reference temperature of 275 °C for this case is . Where is is difference between the outer wall and inlet temperatures, g is the gravitational acceleration, is the thermal expansion coefficient, is the kinematic viscosity and is the thermal diffusivity.
3. Numerical Method
The simulations were performed using ANSYS Fluent v15, using the pressure-based solver with Menter’s k- shear stress transport (SST) turbulence model [12]. A second-order upwind scheme was used for spatial discretization, and a second-order implicit time stepping scheme was used. The simulations were initially run in a steady manner, the results of which were used as the initial conditions for an unsteady simulation. A time-step of 50 ms was used for the simulations, which were run for 1000 time-steps to allow for calculation transients to decay, before averages were calculated over a further 1000 time-steps. The meshes used in the study consisted of 4.6 million cells, and were an unstructured tetrahedral type with prism layers in the boundary layer and a hexahedral core (Figure 4). The prism layers kept the wall around 1 or lower. Simulations were also performed using an 8.8 million cell mesh, and the results were found to agree well with the baseline 4.6 million cell-mesh (Table 1).
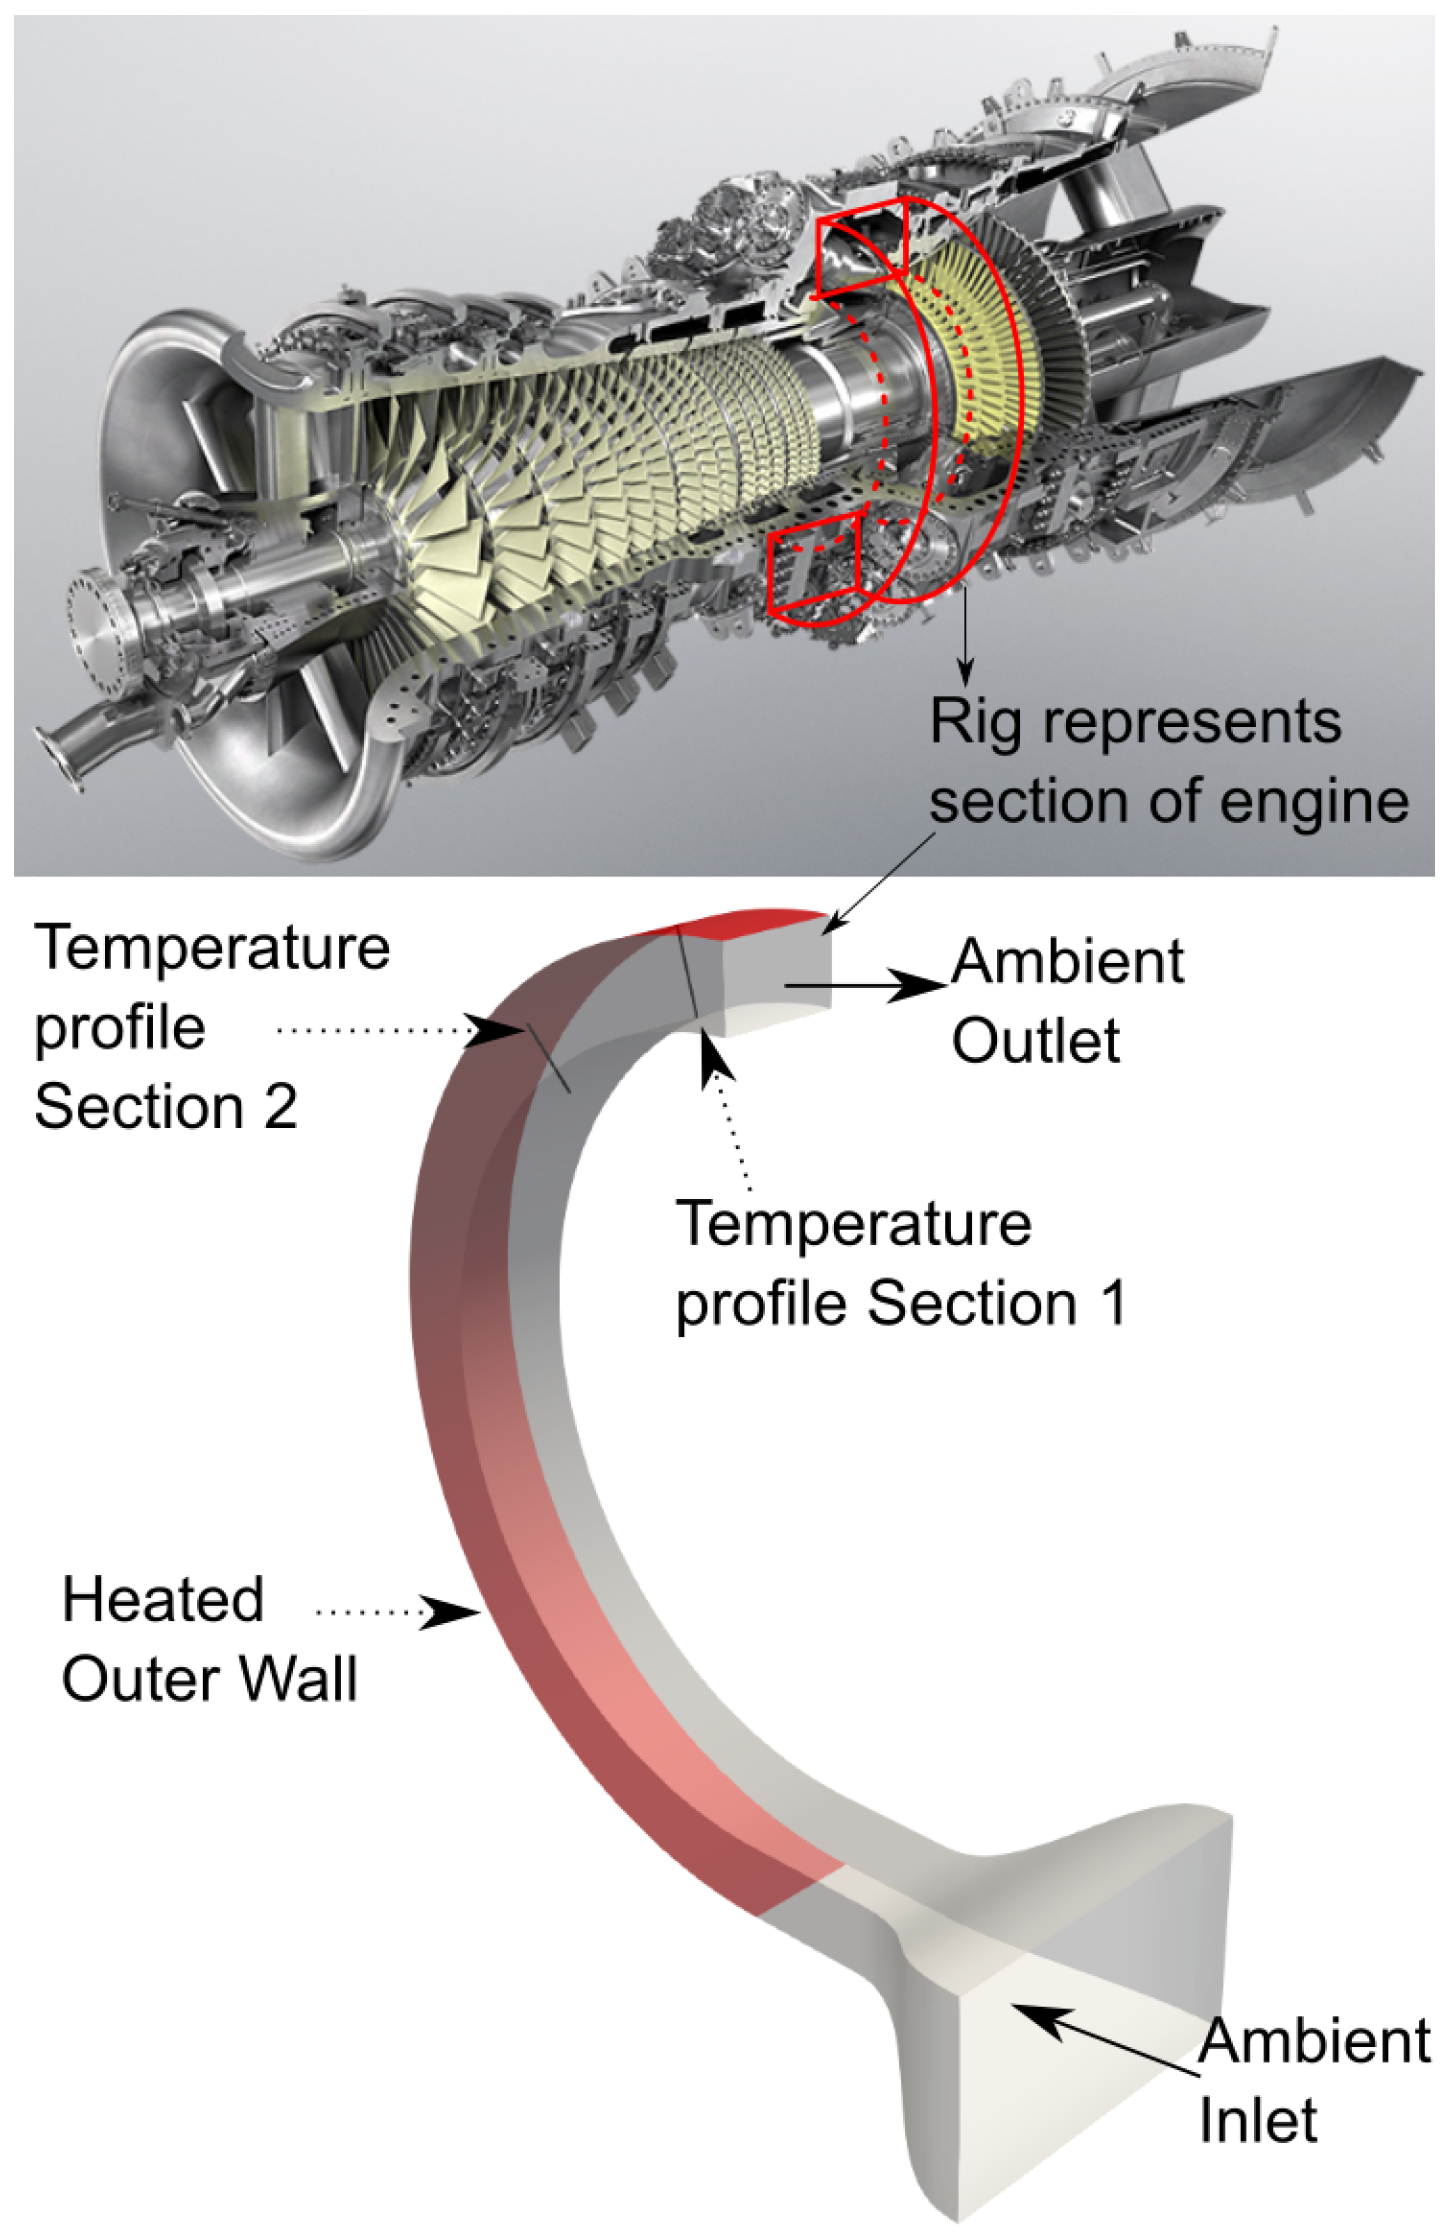
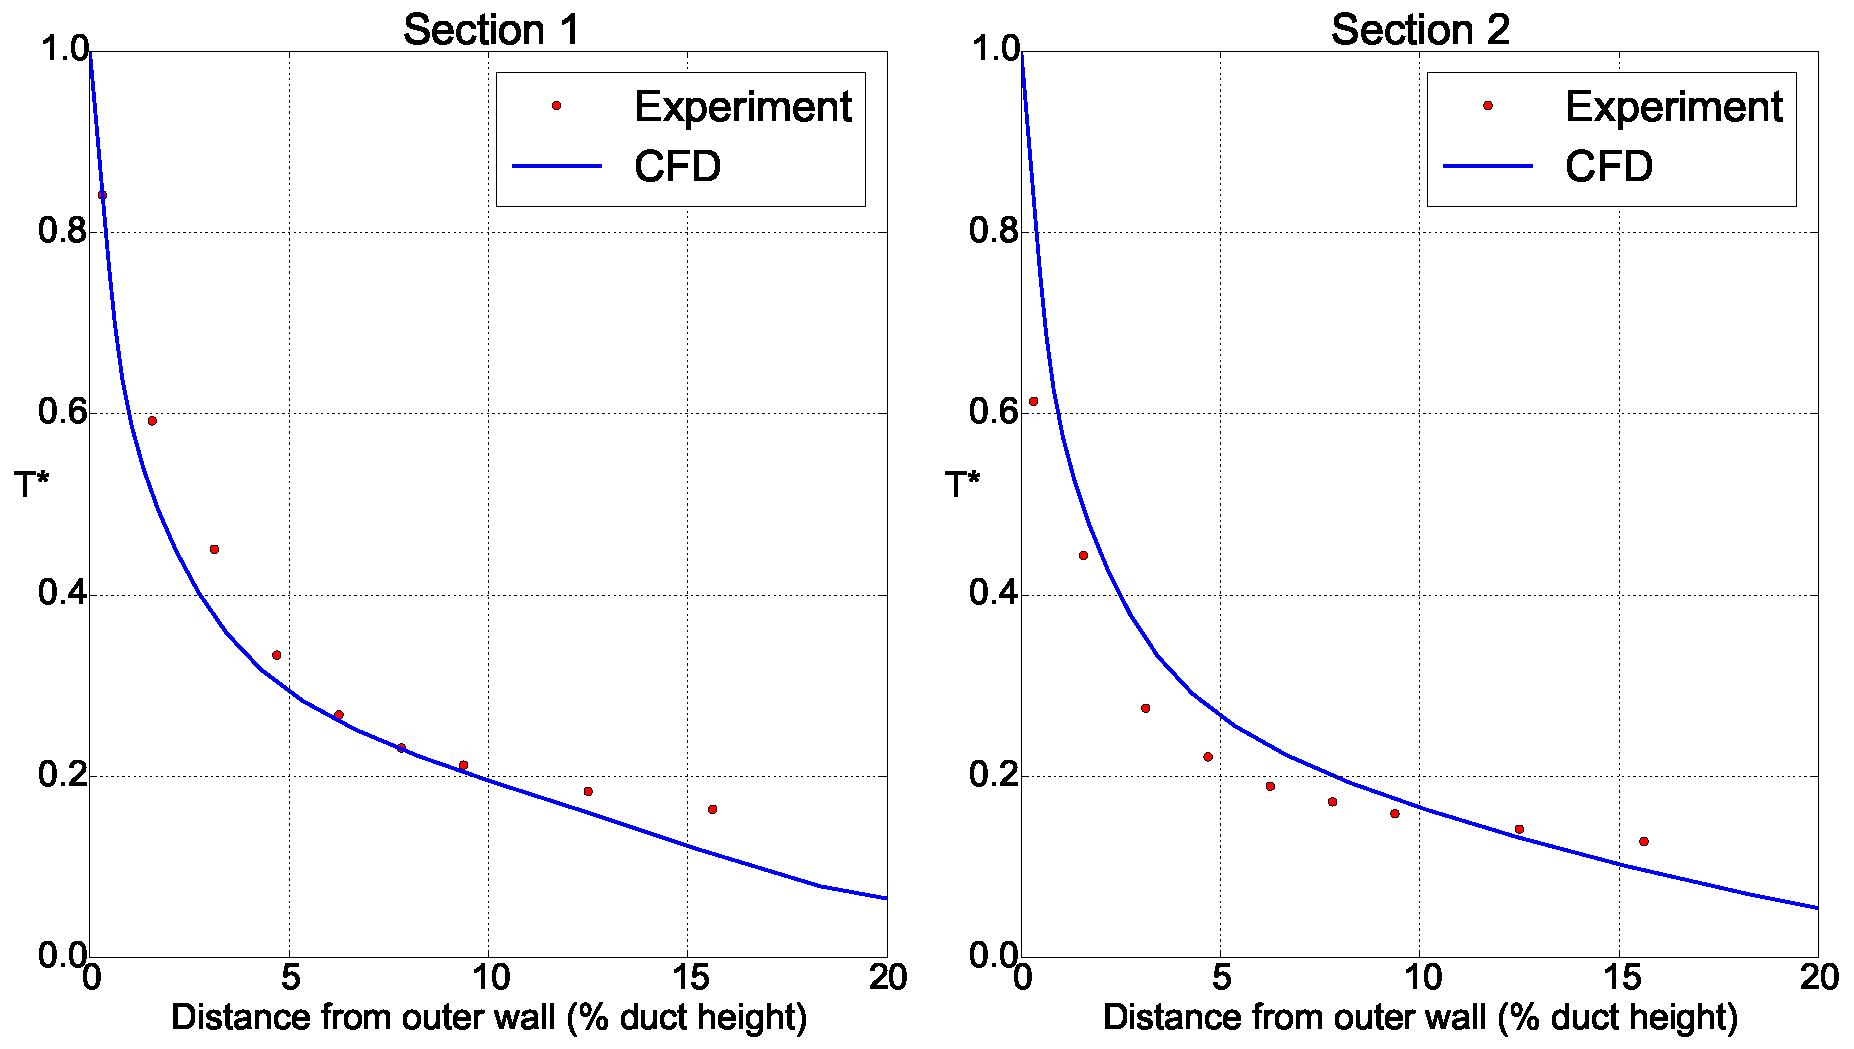
The measurement of air temperatures inside of an industrial gas turbine casing during shutdown is very difficult, and hence real engine data for validation is very sparse. However, data is available for a gas turbine casing rig. The test rig shown in Figure 5 is full engine diameter representing a section of gas turbine casing, and operates at real engine Rayleigh numbers. To the authors’ knowledge, this makes the casing rig unique and provides a validation dataset that is not available elsewhere. The numerical method used for this study has previously been applied to the casing rig. Looking at temperature profiles from the rig (Figure 6) shows good agreement between the rig experiment and computational fluid dynamics (CFD). The profile was taken at the top of the rig 15° and 45° from the vertical, where the boundary layer was turbulent.
The combination of previous validated simulations from the test rig as well as performing good CFD practice, checking mesh sensitivity and , gives confidence that the results from this study can be used for a comparison of different shutdown techniques.
4. Baseline Investigation
The baseline case for the study used the gas turbine geometry with no active method for controlling the shutdown casing heat transfer. The only inlet into the domain was from the compressor exit, and the only outlet from the domain was the combustor outlet.
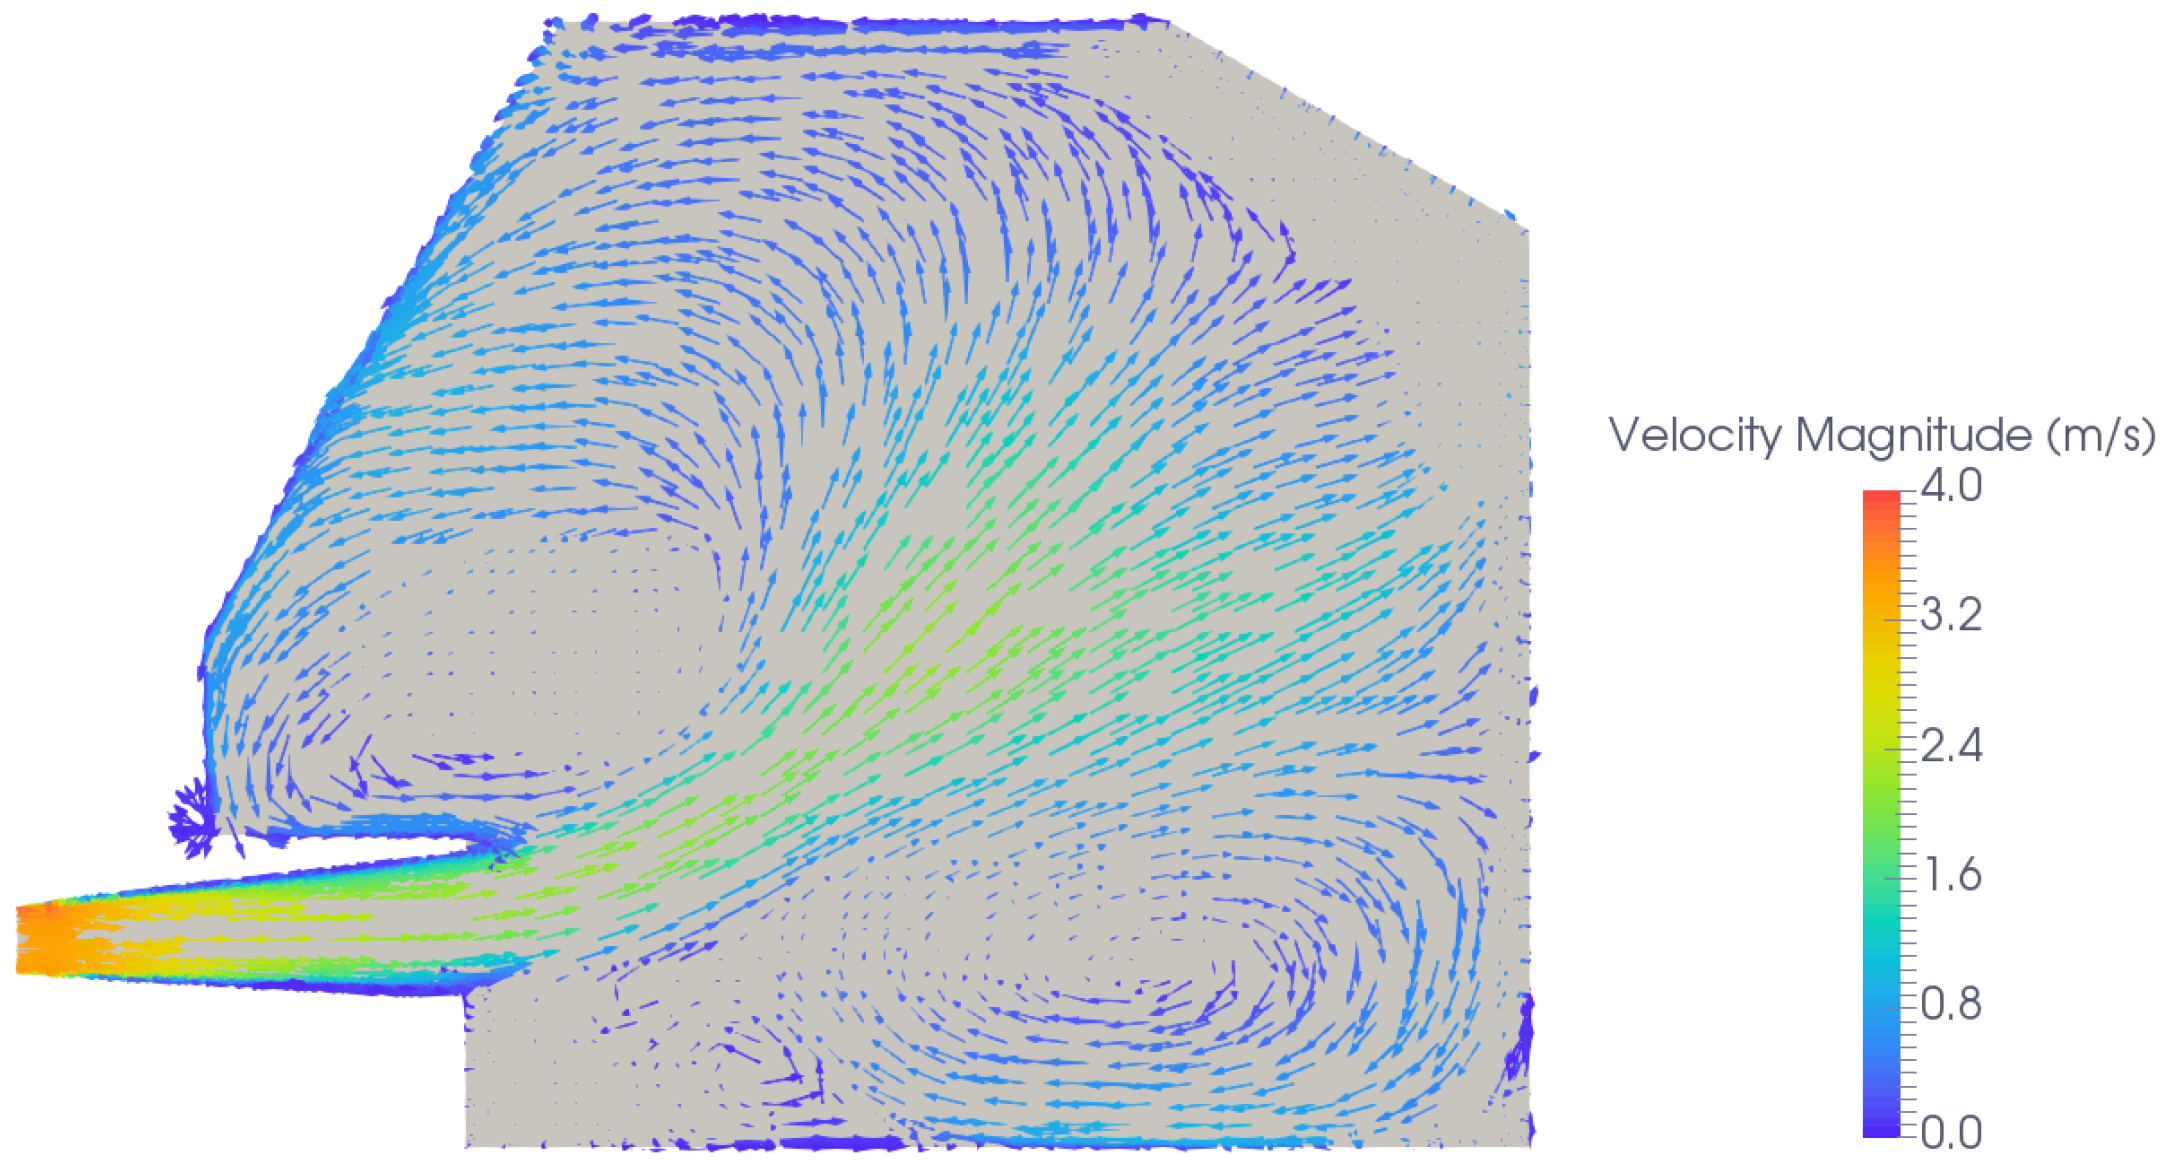
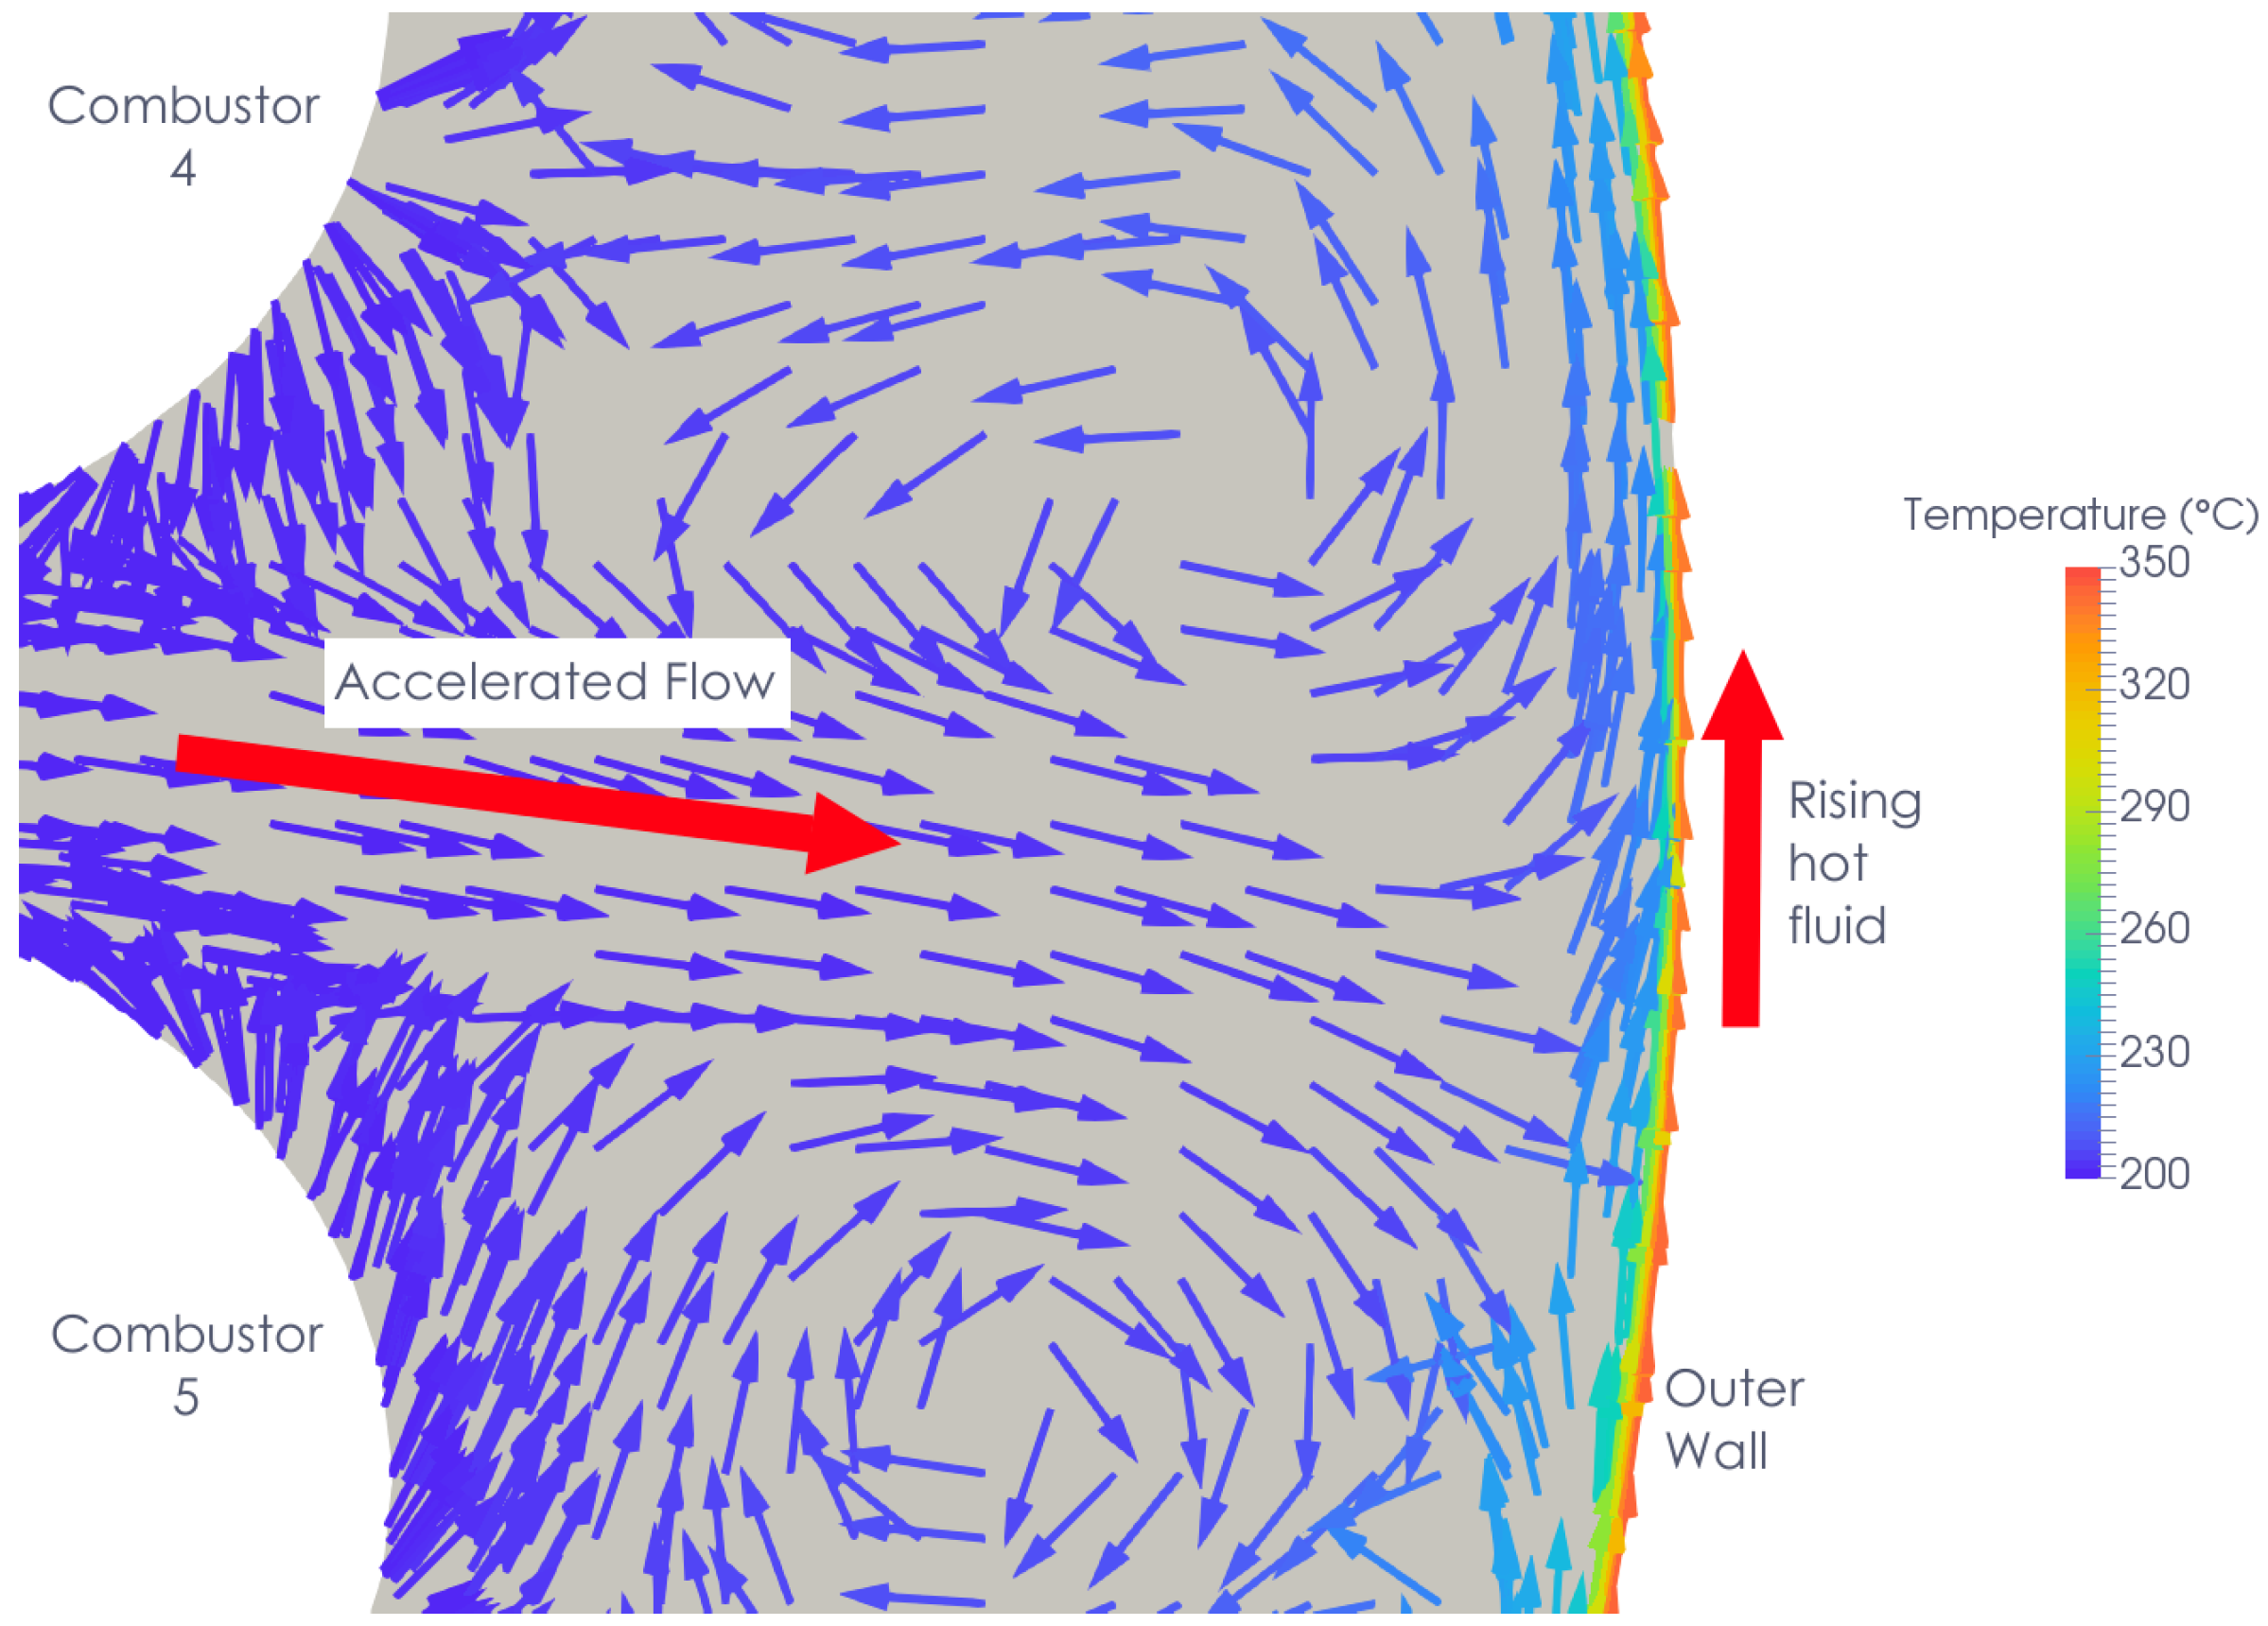
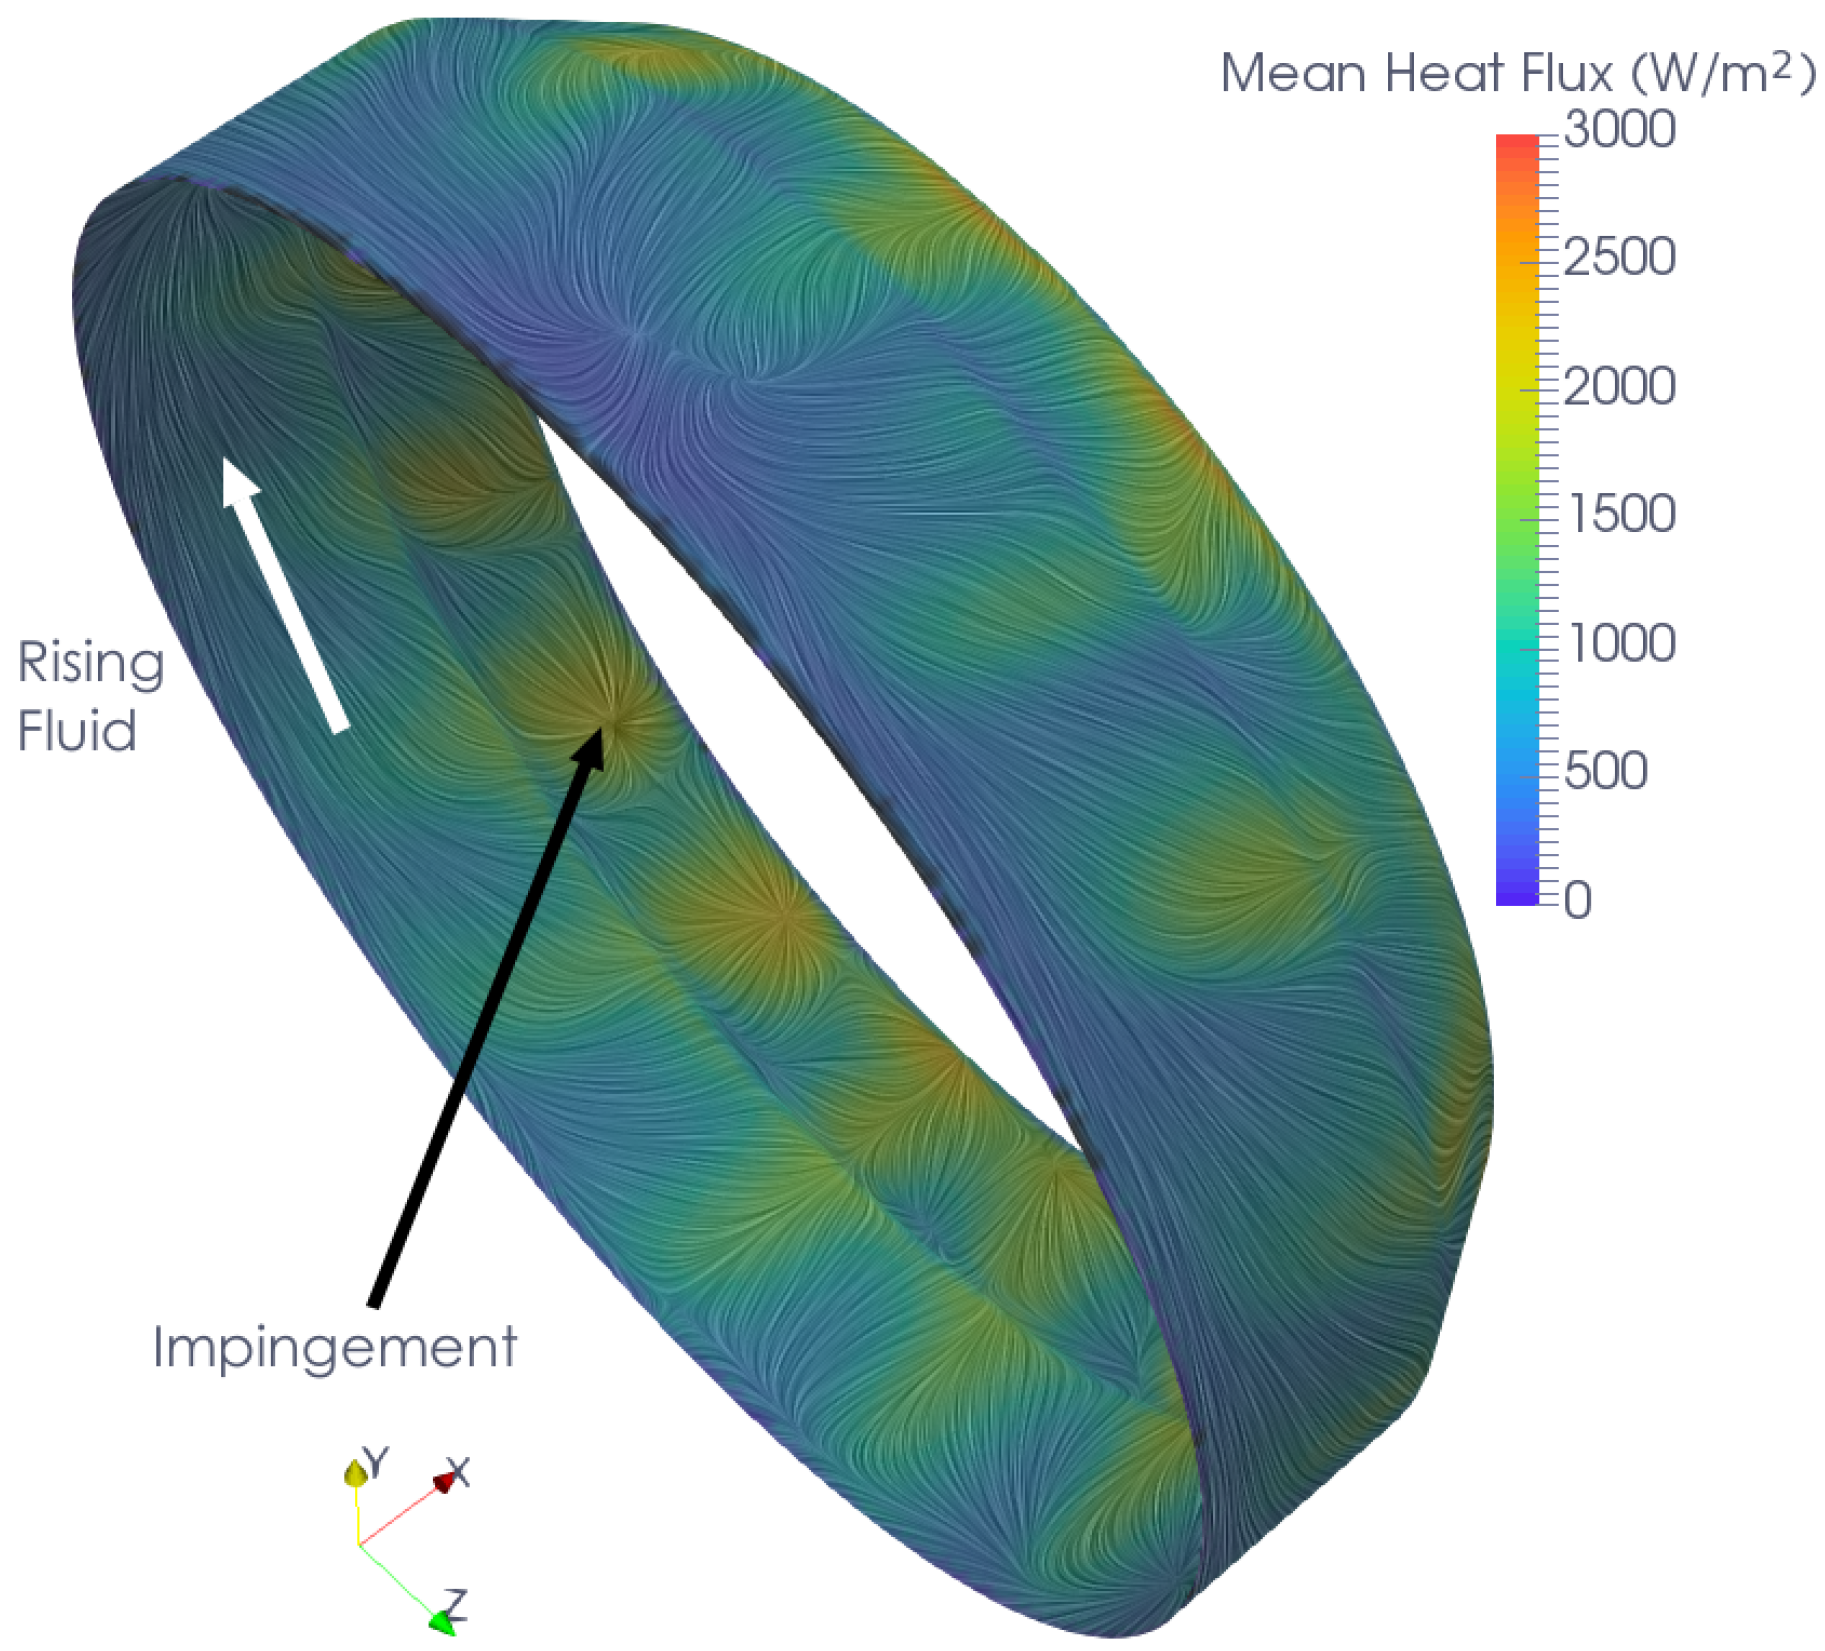
The flowfield in the baseline case is three-dimensional, and is driven by a combination of buoyancy forces and the draught through the engine. The flow can be visualised by looking at time-averaged stream-traces originating from the inlet and coloured by temperature (Figure 7). The flow enters the domain through the inlet and diffuser, into the main cavity. The flow travels radially outward from the diffuser exit, and is drawn towards the combustor outlets. The flow reverses direction axially as it moves towards the outlet. This flow reversal in the axial direction can be visualised by velocity vectors in Figure 8, in a section showing the top of the cavity. As the flow moves radially outwards, some of the flow is accelerated through the small gaps between combustor cans. This can be seen in Figure 9, showing the velocity vectors in the plane of axial section C-C. These accelerated jets impinge on the outer wall, causing locally enhanced heat transfer, as can be seen in Figure 10.
Figure 7 also demonstrates that the flow is not symmetric about the vertical axis, but has a preferred direction around the combustors. As the fluid takes one direction around the combustor, this influences the fluid in the adjacent combustors to also flow in this direction. This non-symmetry in the natural convection flowfield for flows with symmetrical geometry and boundary conditions has also been observed by Holtzman et al. [14] and Yuan et al. [15]. It was noted by Holtzman et al. that the symmetrical flowfield is not stable above a critical Grashof number. There is only a small difference in heat transfer distribution between the left and right hand sides of the casing due to the flow asymmetry. This can be seen in Figure 11, with the difference in the total heat transfer between the left and right sides being under 0.6%. In both sides of the casing, the trend of low heat transfer at the top of the casing compared to the bottom of the casing is clear.
As well as the draught through the casing the flow is also driven by buoyancy forces, in particular near the hot outer casing. The rising fluid driven by buoyancy forces can be seen in Figure 9. It can be seen looking at the surface streamlines in Figure 10 that the fluid tends to rise close to the cylindrical part of the outer wall, and it is diverted away from the conical part of the outer wall by the impinging jet flow. At the top of the casing, a thermally stratified region occurs, where the buoyancy forces are reducing the flow velocity. This can be seen by the low-velocity region with few stream-traces in Figure 7. This stratified region reduces the heat transfer at the top of the casing by reducing the wall temperature gradient.
The effect of the 3D flowfield on the outer wall heat transfer can be seen in Figure 10. The effect of the combustors causing local flow acceleration and impingement on the outer wall can be seen in the local peaks of heat transfer. The lower heat transfer at the top of the casing due to the stratified region is also evident.
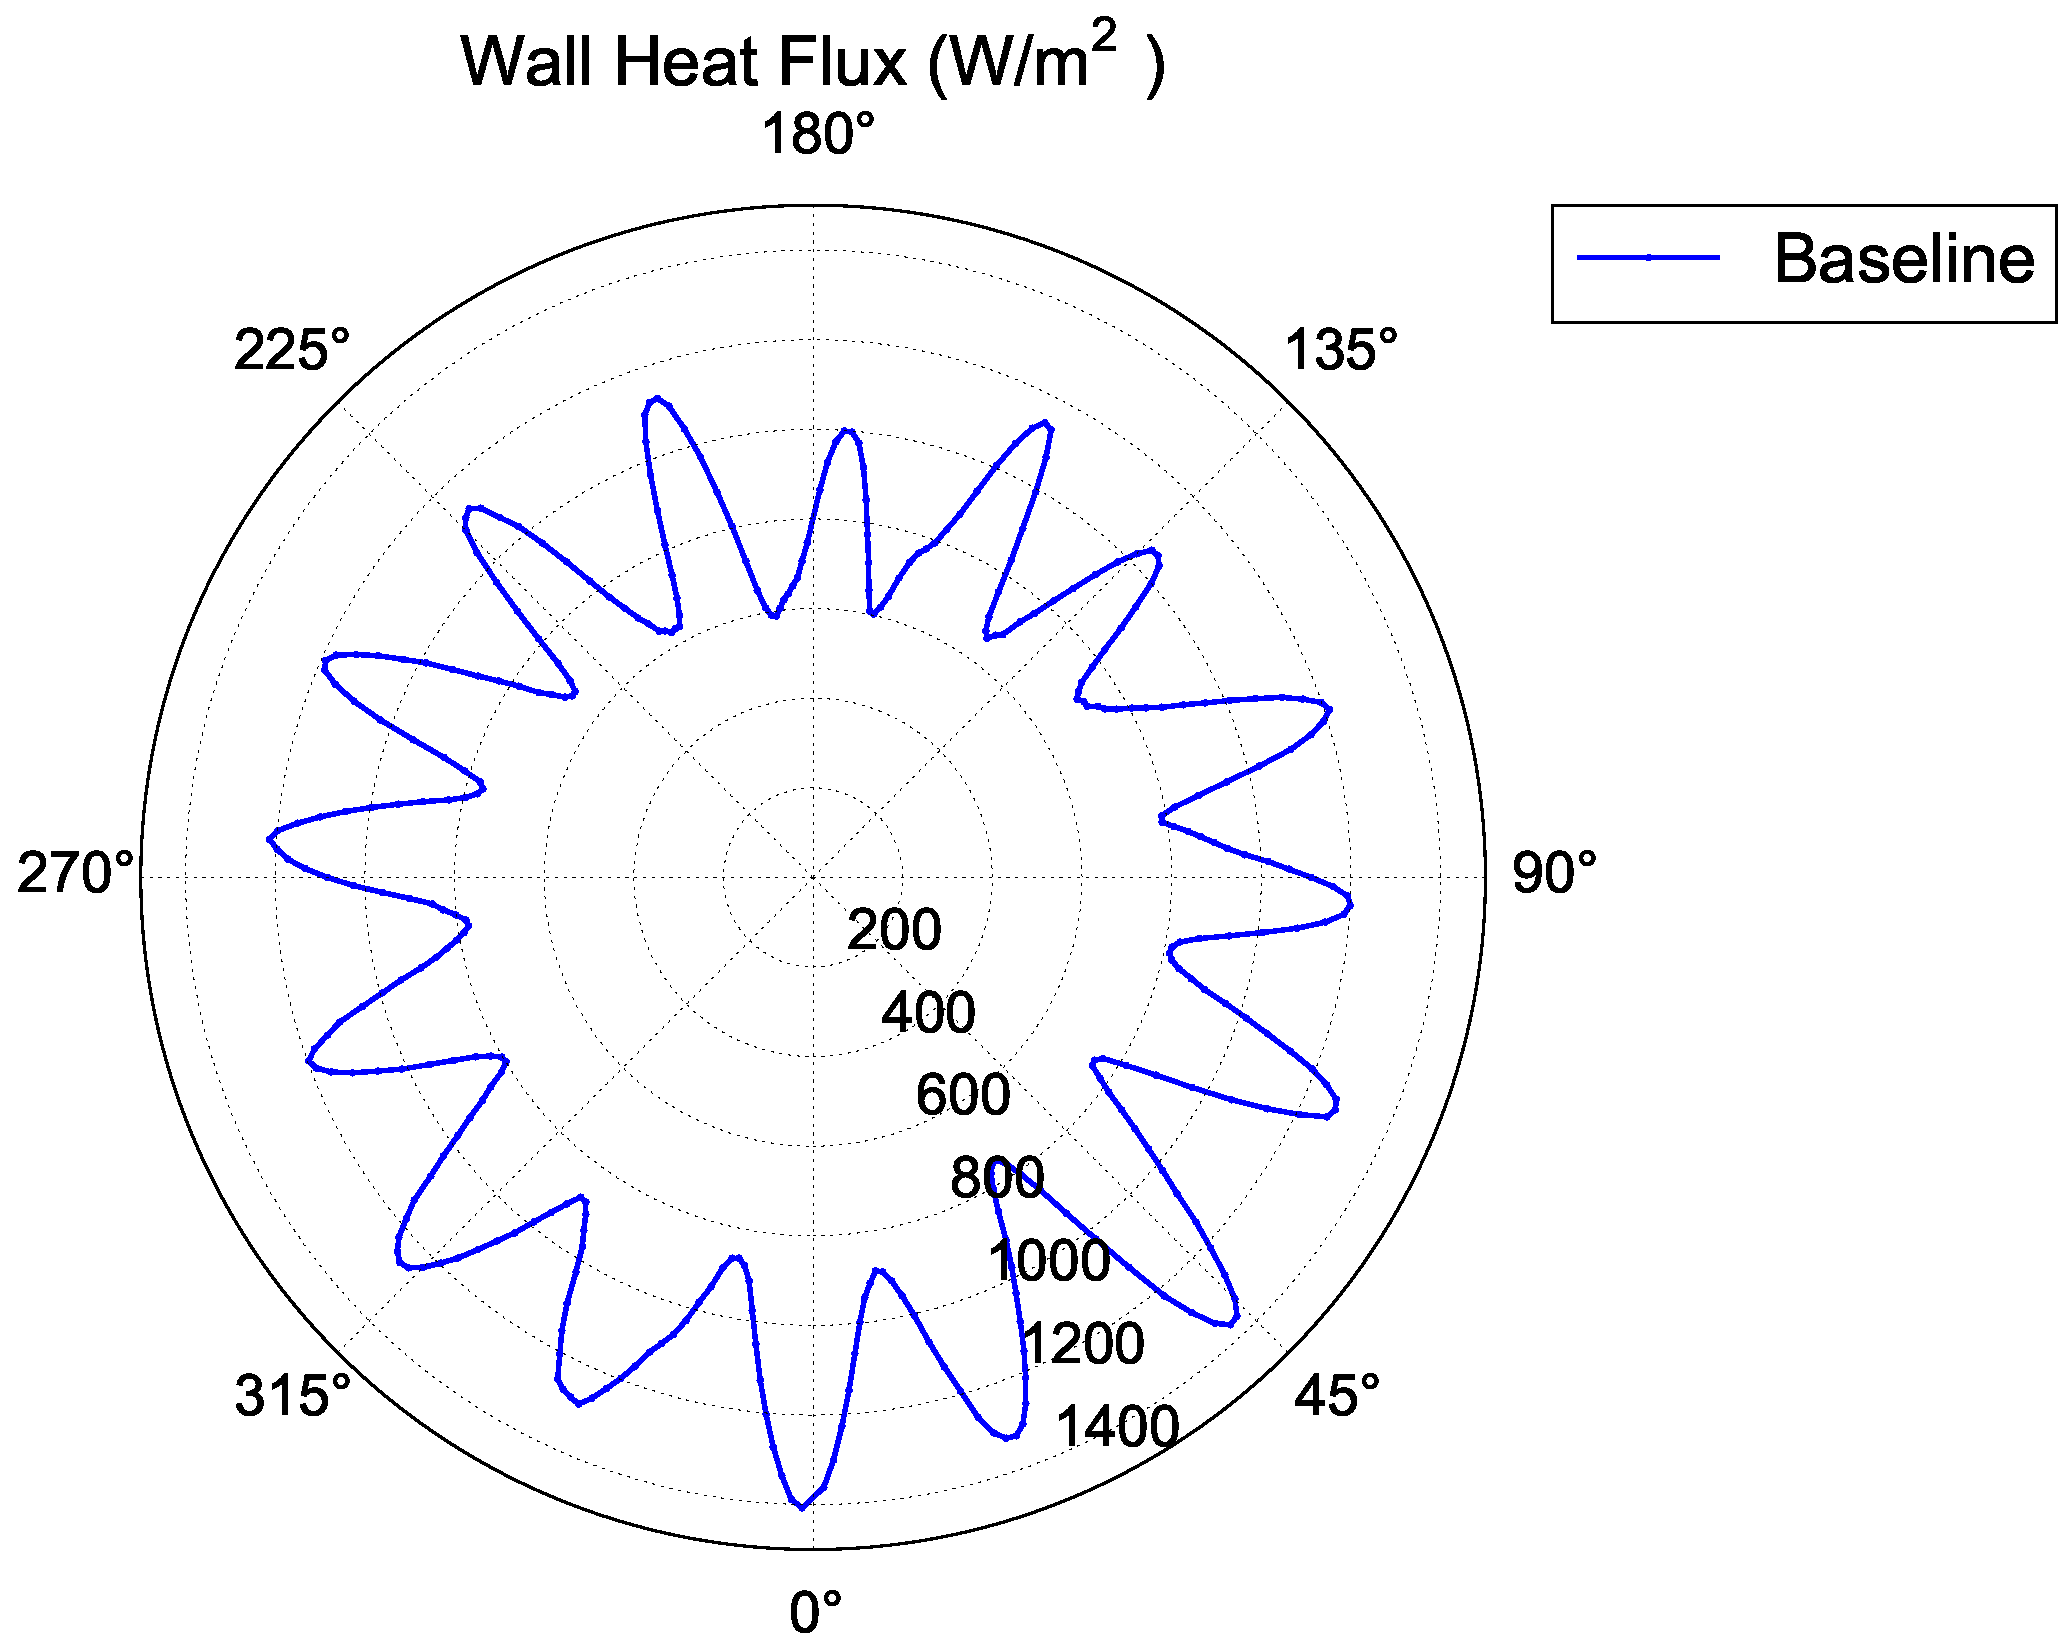
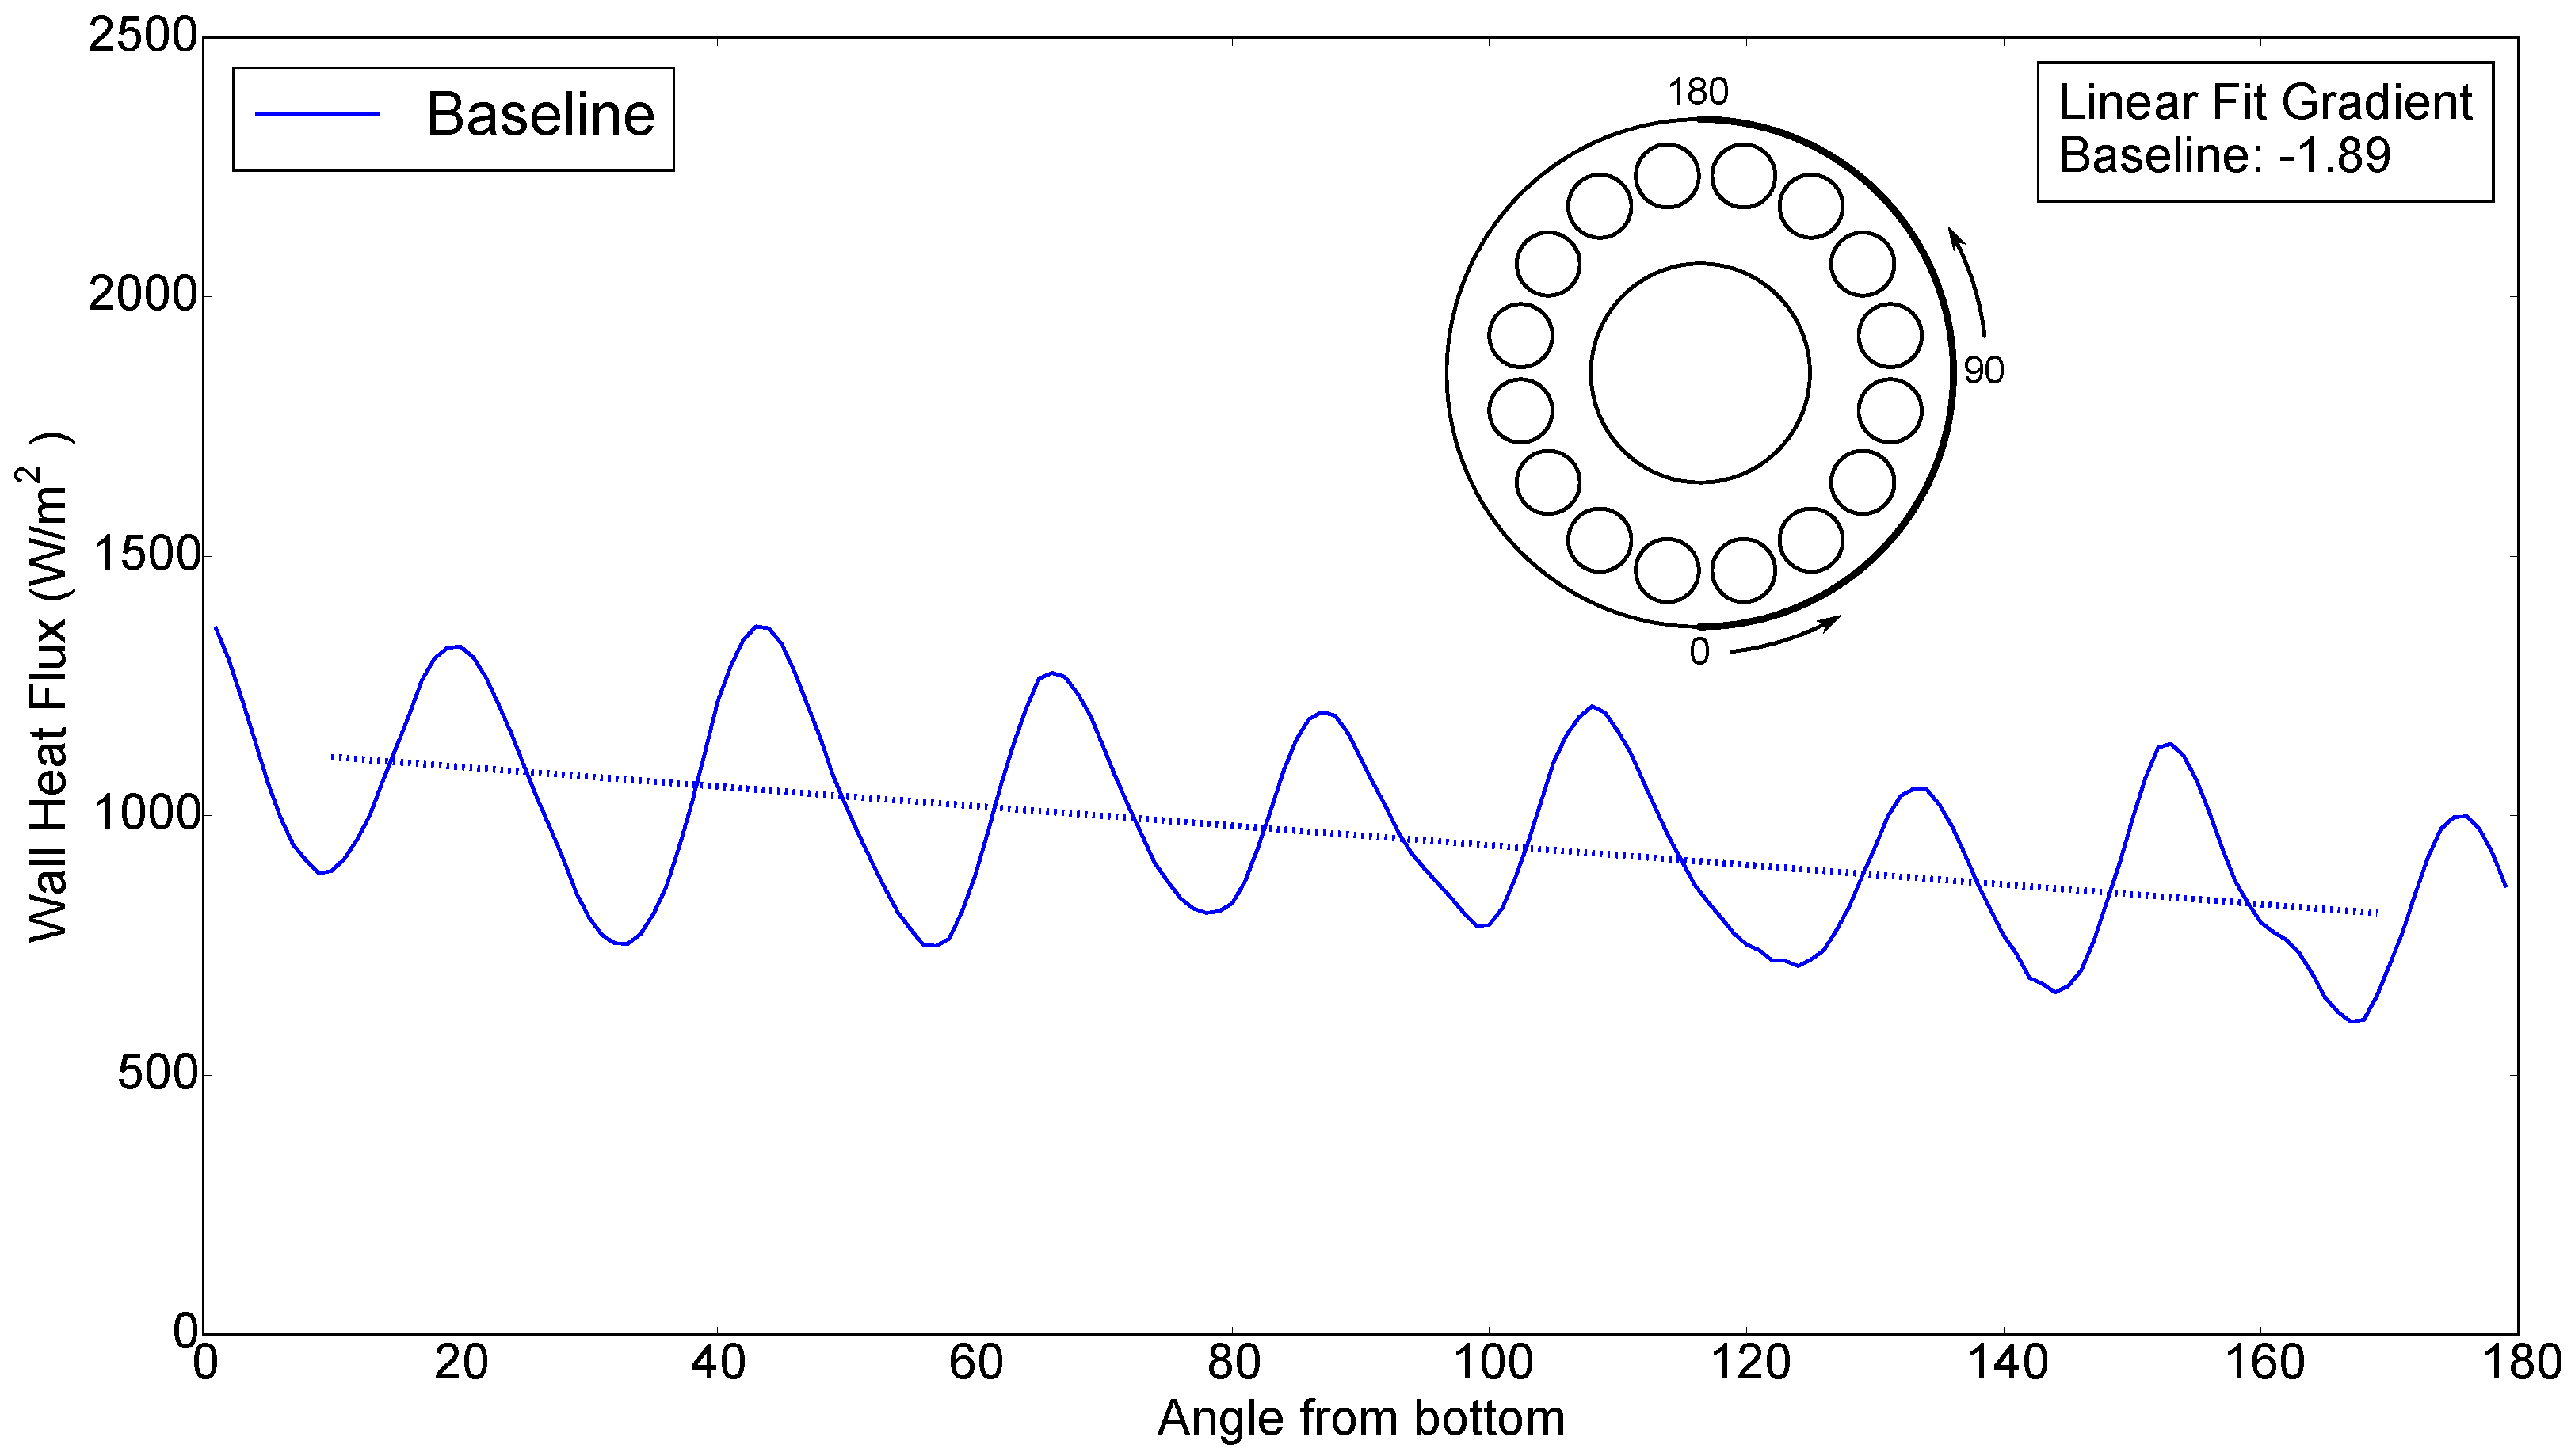
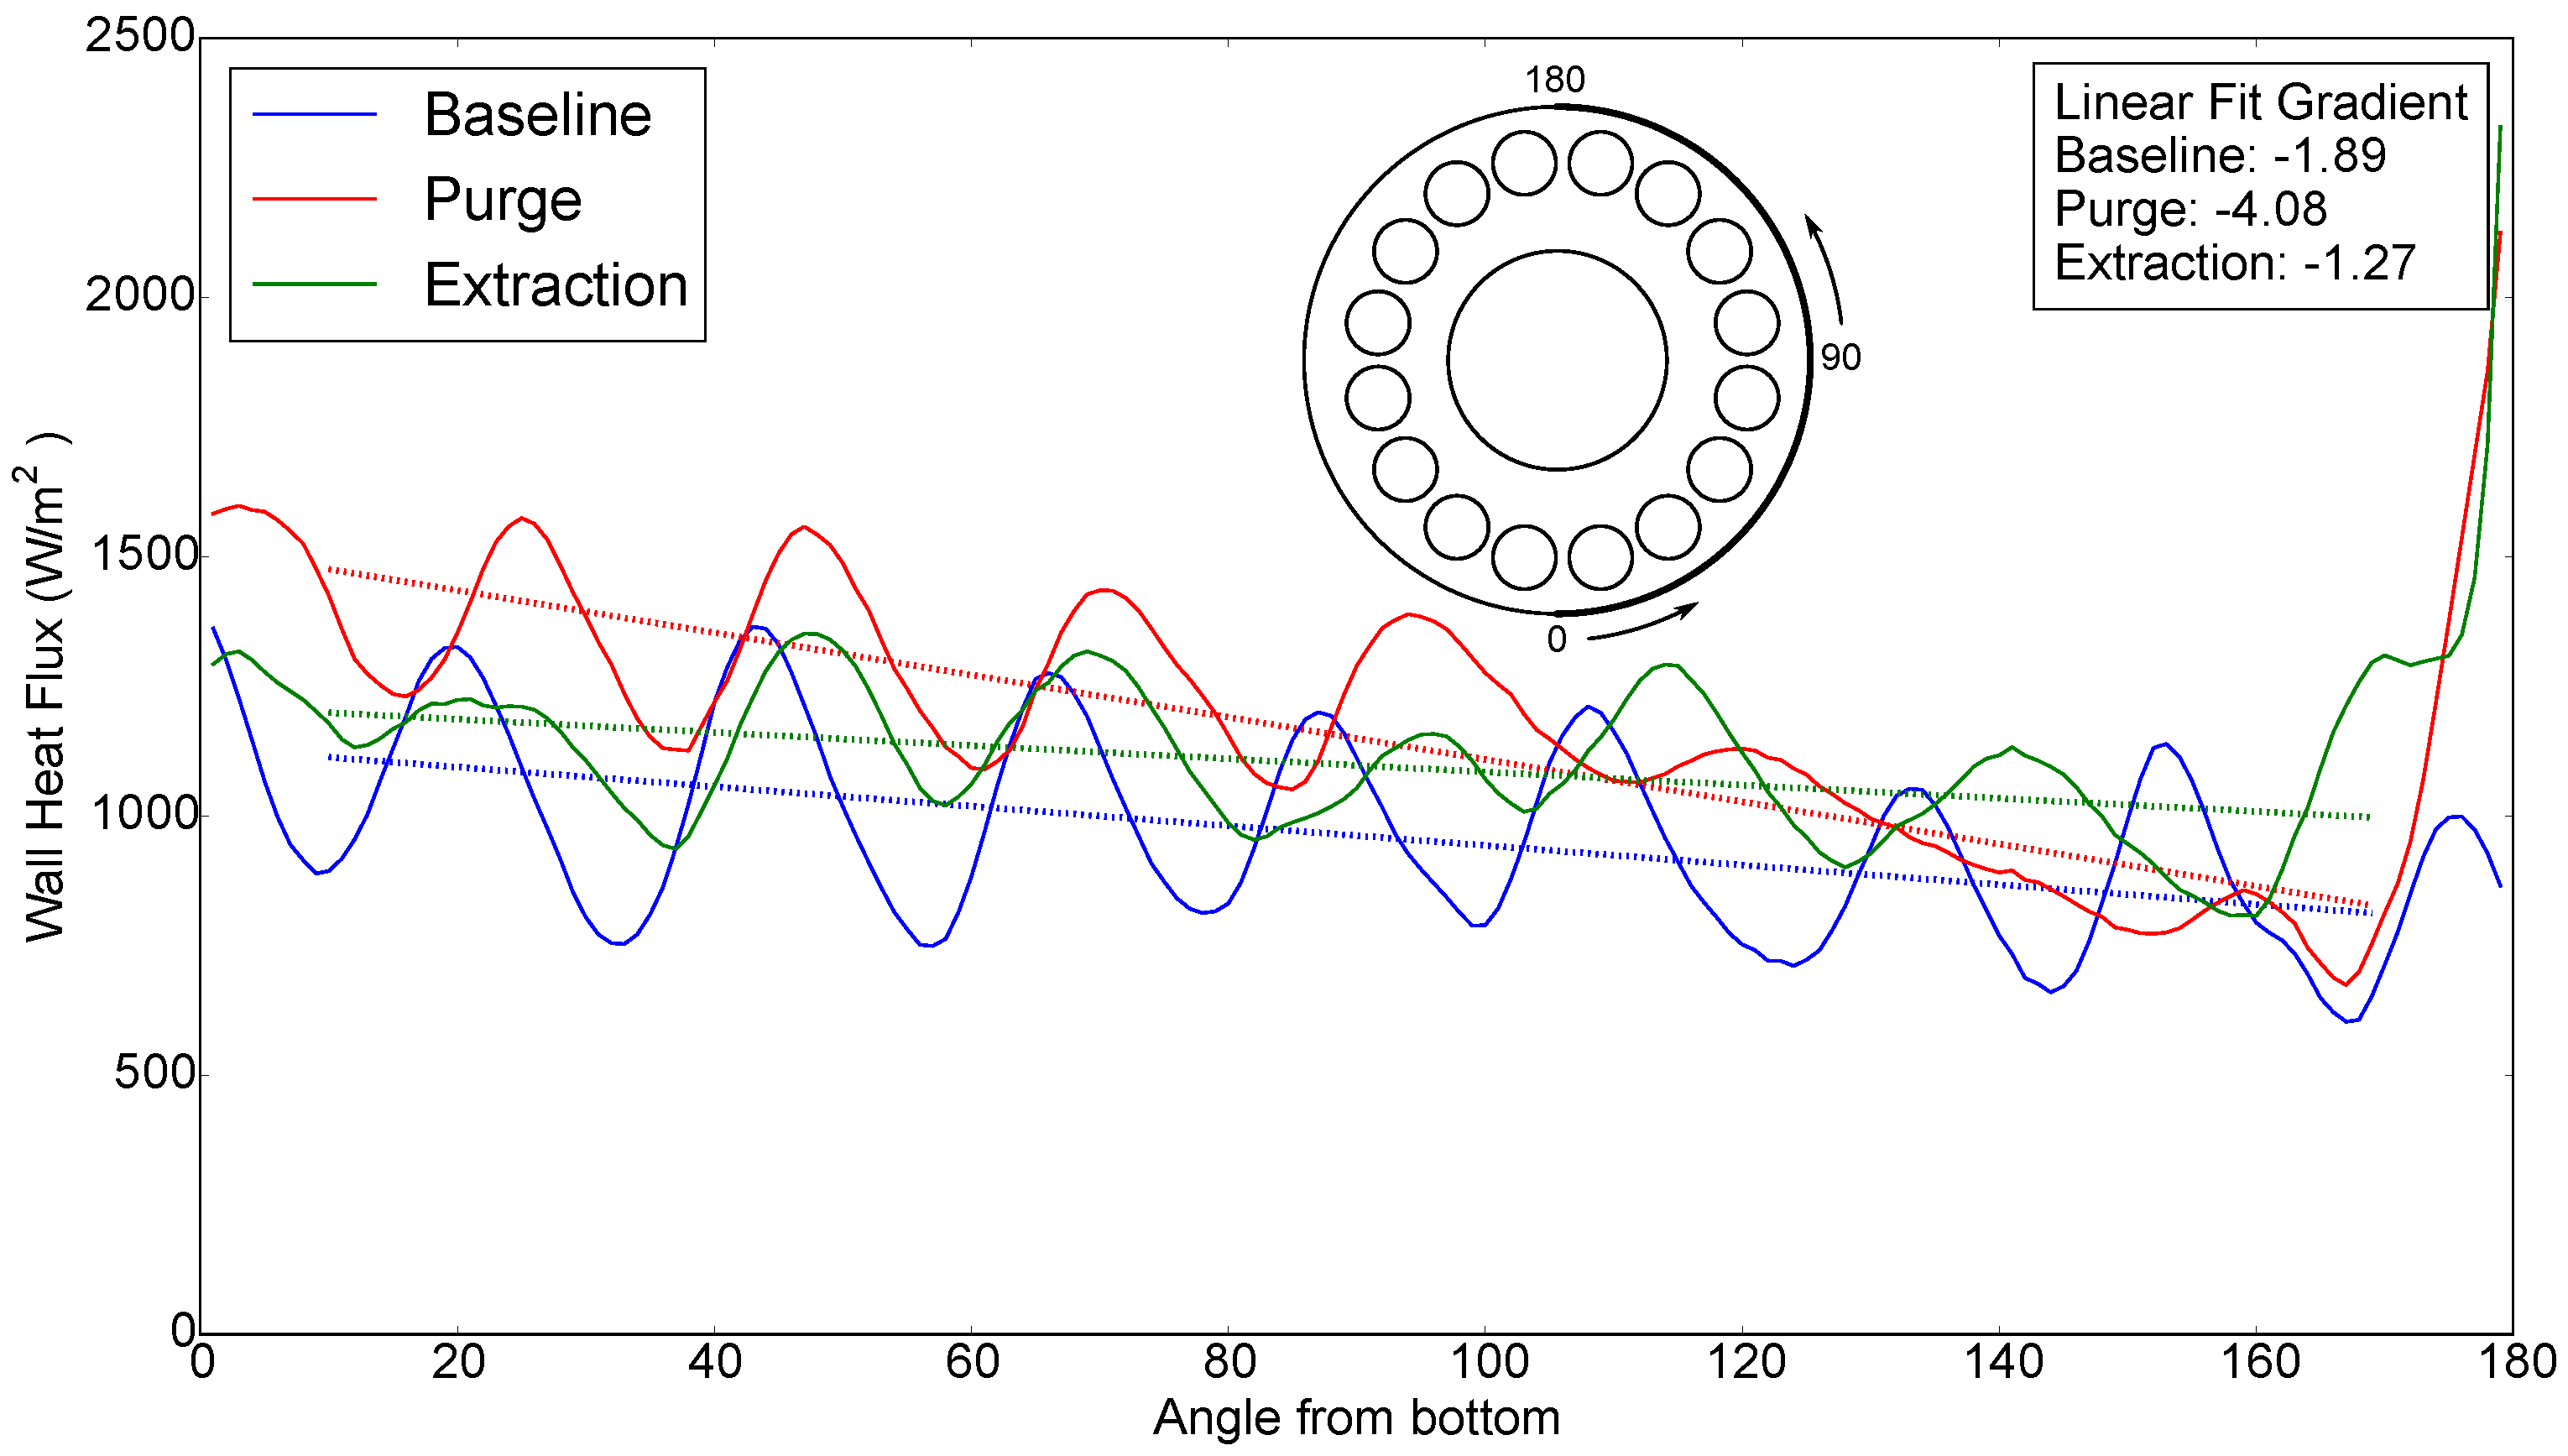
The time-averaged heat transfer on the cylindrical and conical sections of the casing outer wall was area-averaged axially at circumferential locations from the bottom to the top of the casing. This axially averaged outer wall heat flux is plotted around the casing in Figure 12, with 0° being the bottom of the casing and 180° at the top of the casing. It can be seen that the general trend of the data has a lower heat flux at the top of the casing. This trend is also evident from the linear best fit through the data.
This non-uniform heat transfer on the outer casing is responsible for the non-uniform cooling and casing distortion that occurs in industrial gas turbines.
5. Heat Transfer Control Investigation
It has been found that the baseline case with no methods for controlling the casing heat transfer during shutdown gave a non uniform casing heat flux, which would lead to casing distortion. Two methods were investigated in order to control the casing heat transfer during shutdown and reduce the casing heat flux non-uniformity. The two methods were a purge method where cold air is injected into the casing and an extraction method where air is extracted from the casing. The two methods are shown schematically in Figure 13. The main aim of both of these methods is to reduce the stratified region and increase the heat transfer at the top of the casing.
5.1. Purge Case
The first method studied to control the casing heat transfer was the purge flow case. In this case, cold fluid is injected into the top of the casing in order to increase the heat transfer at the top of the casing. This technique of using a purge flow is used by large industrial gas turbines currently in service.
The mesh for the purge case was modified from the baseline by adding a circular inlet of 60 mm diameter to the top of casing, with mesh refinement around the inlet. The purge flow boundary condition was 0.13 kg/s flow at 20 °C.
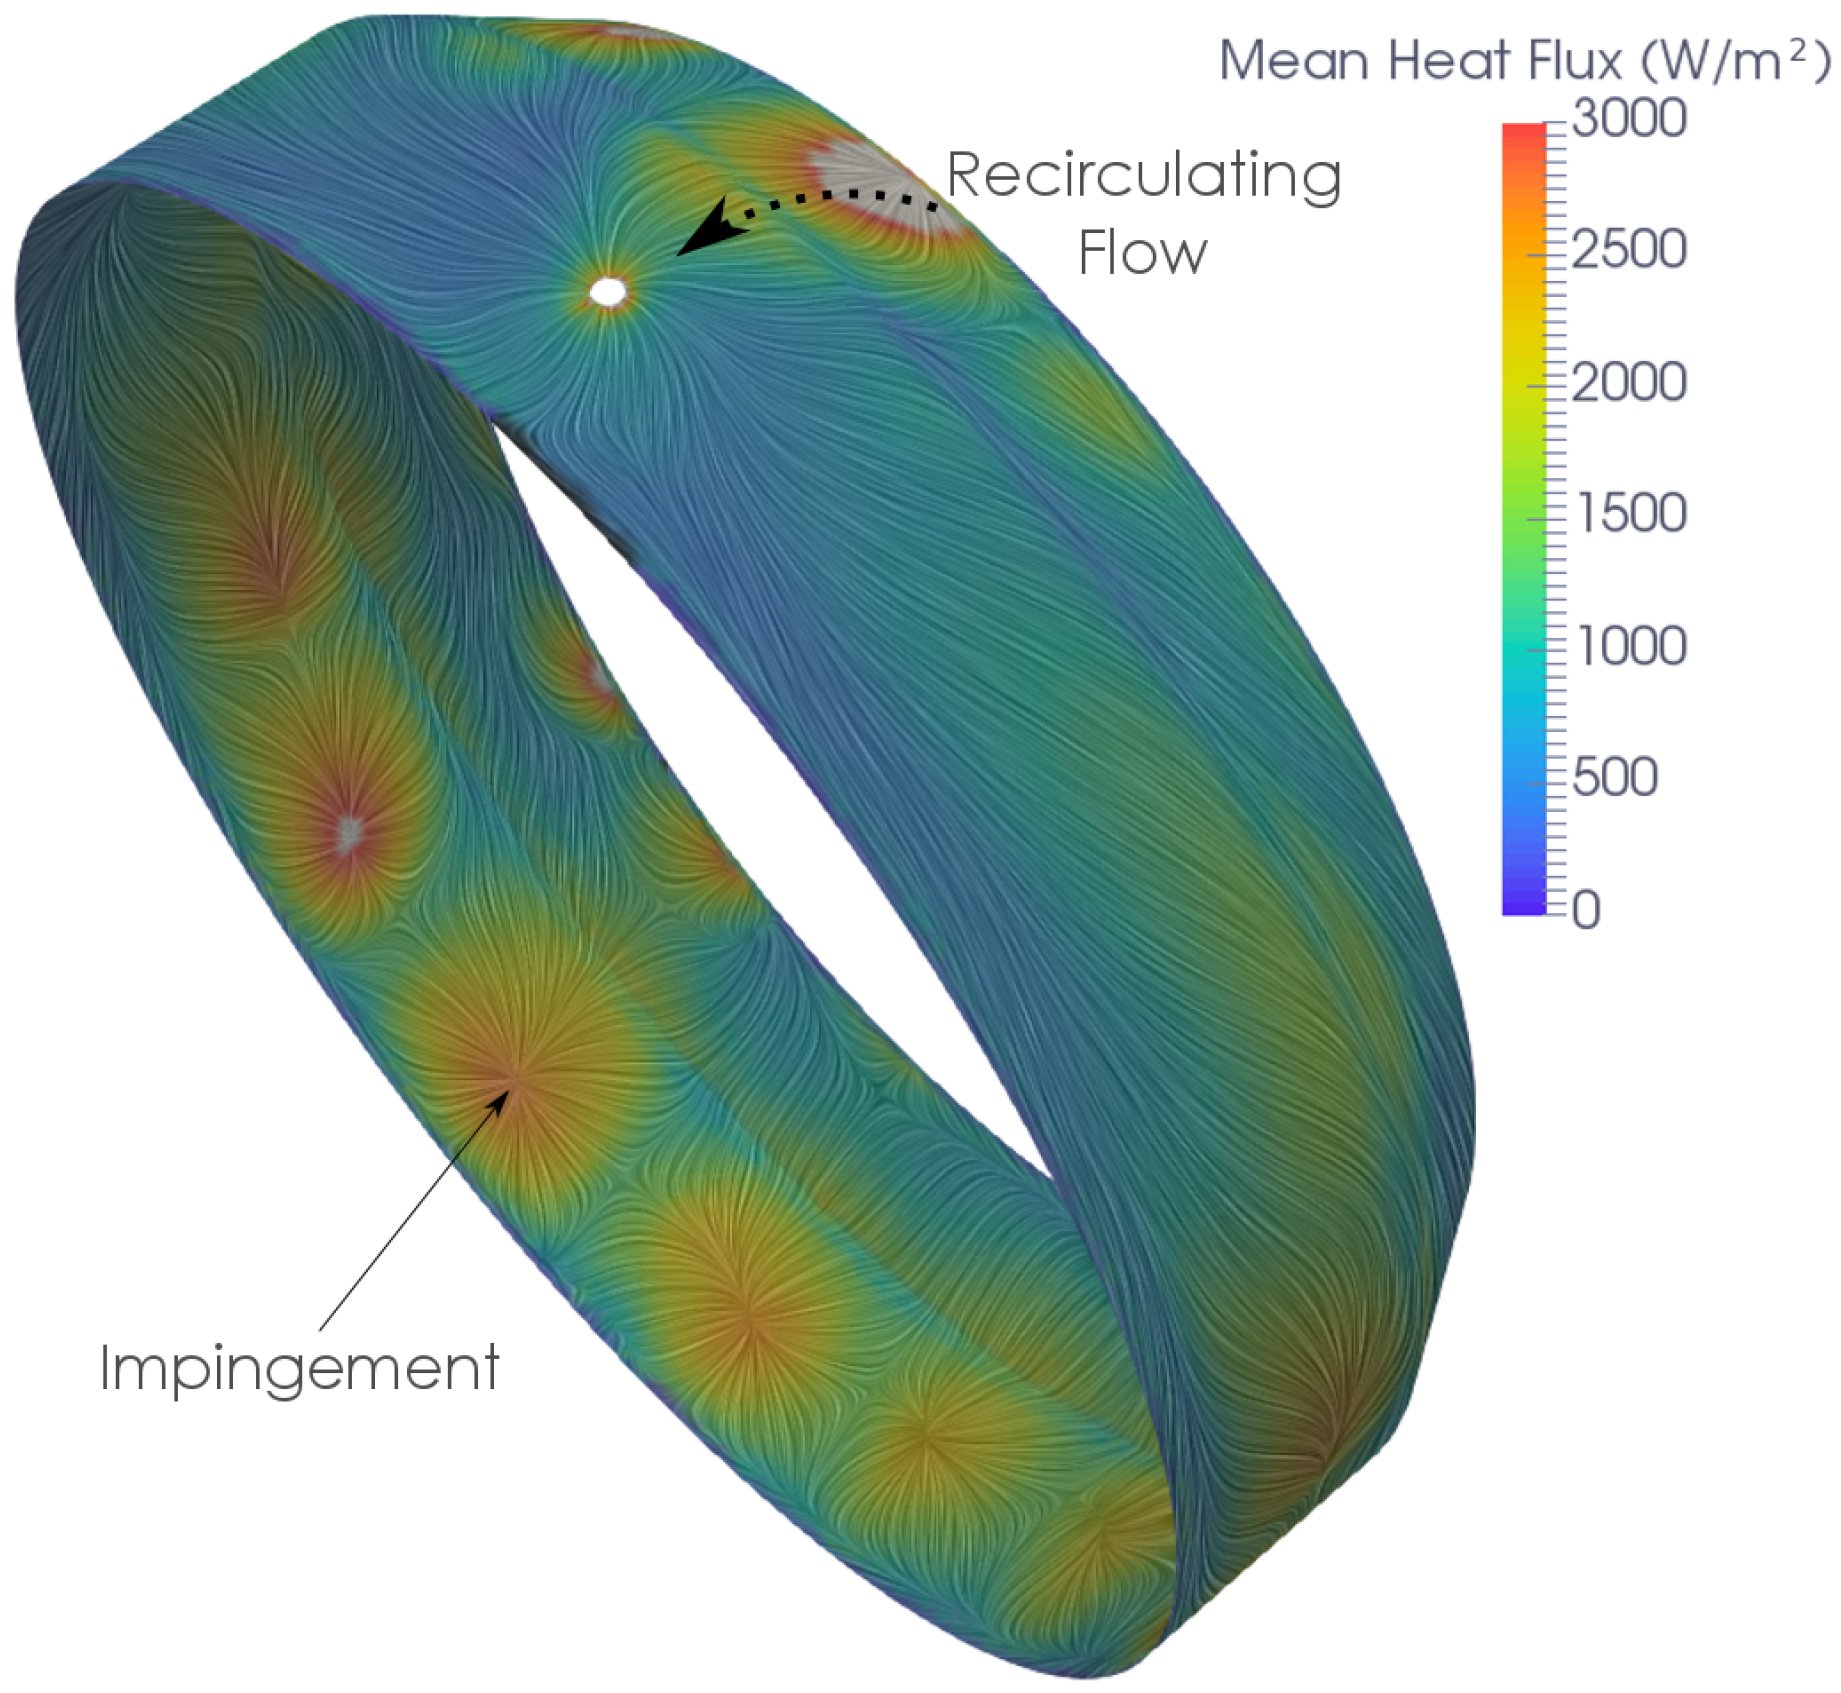
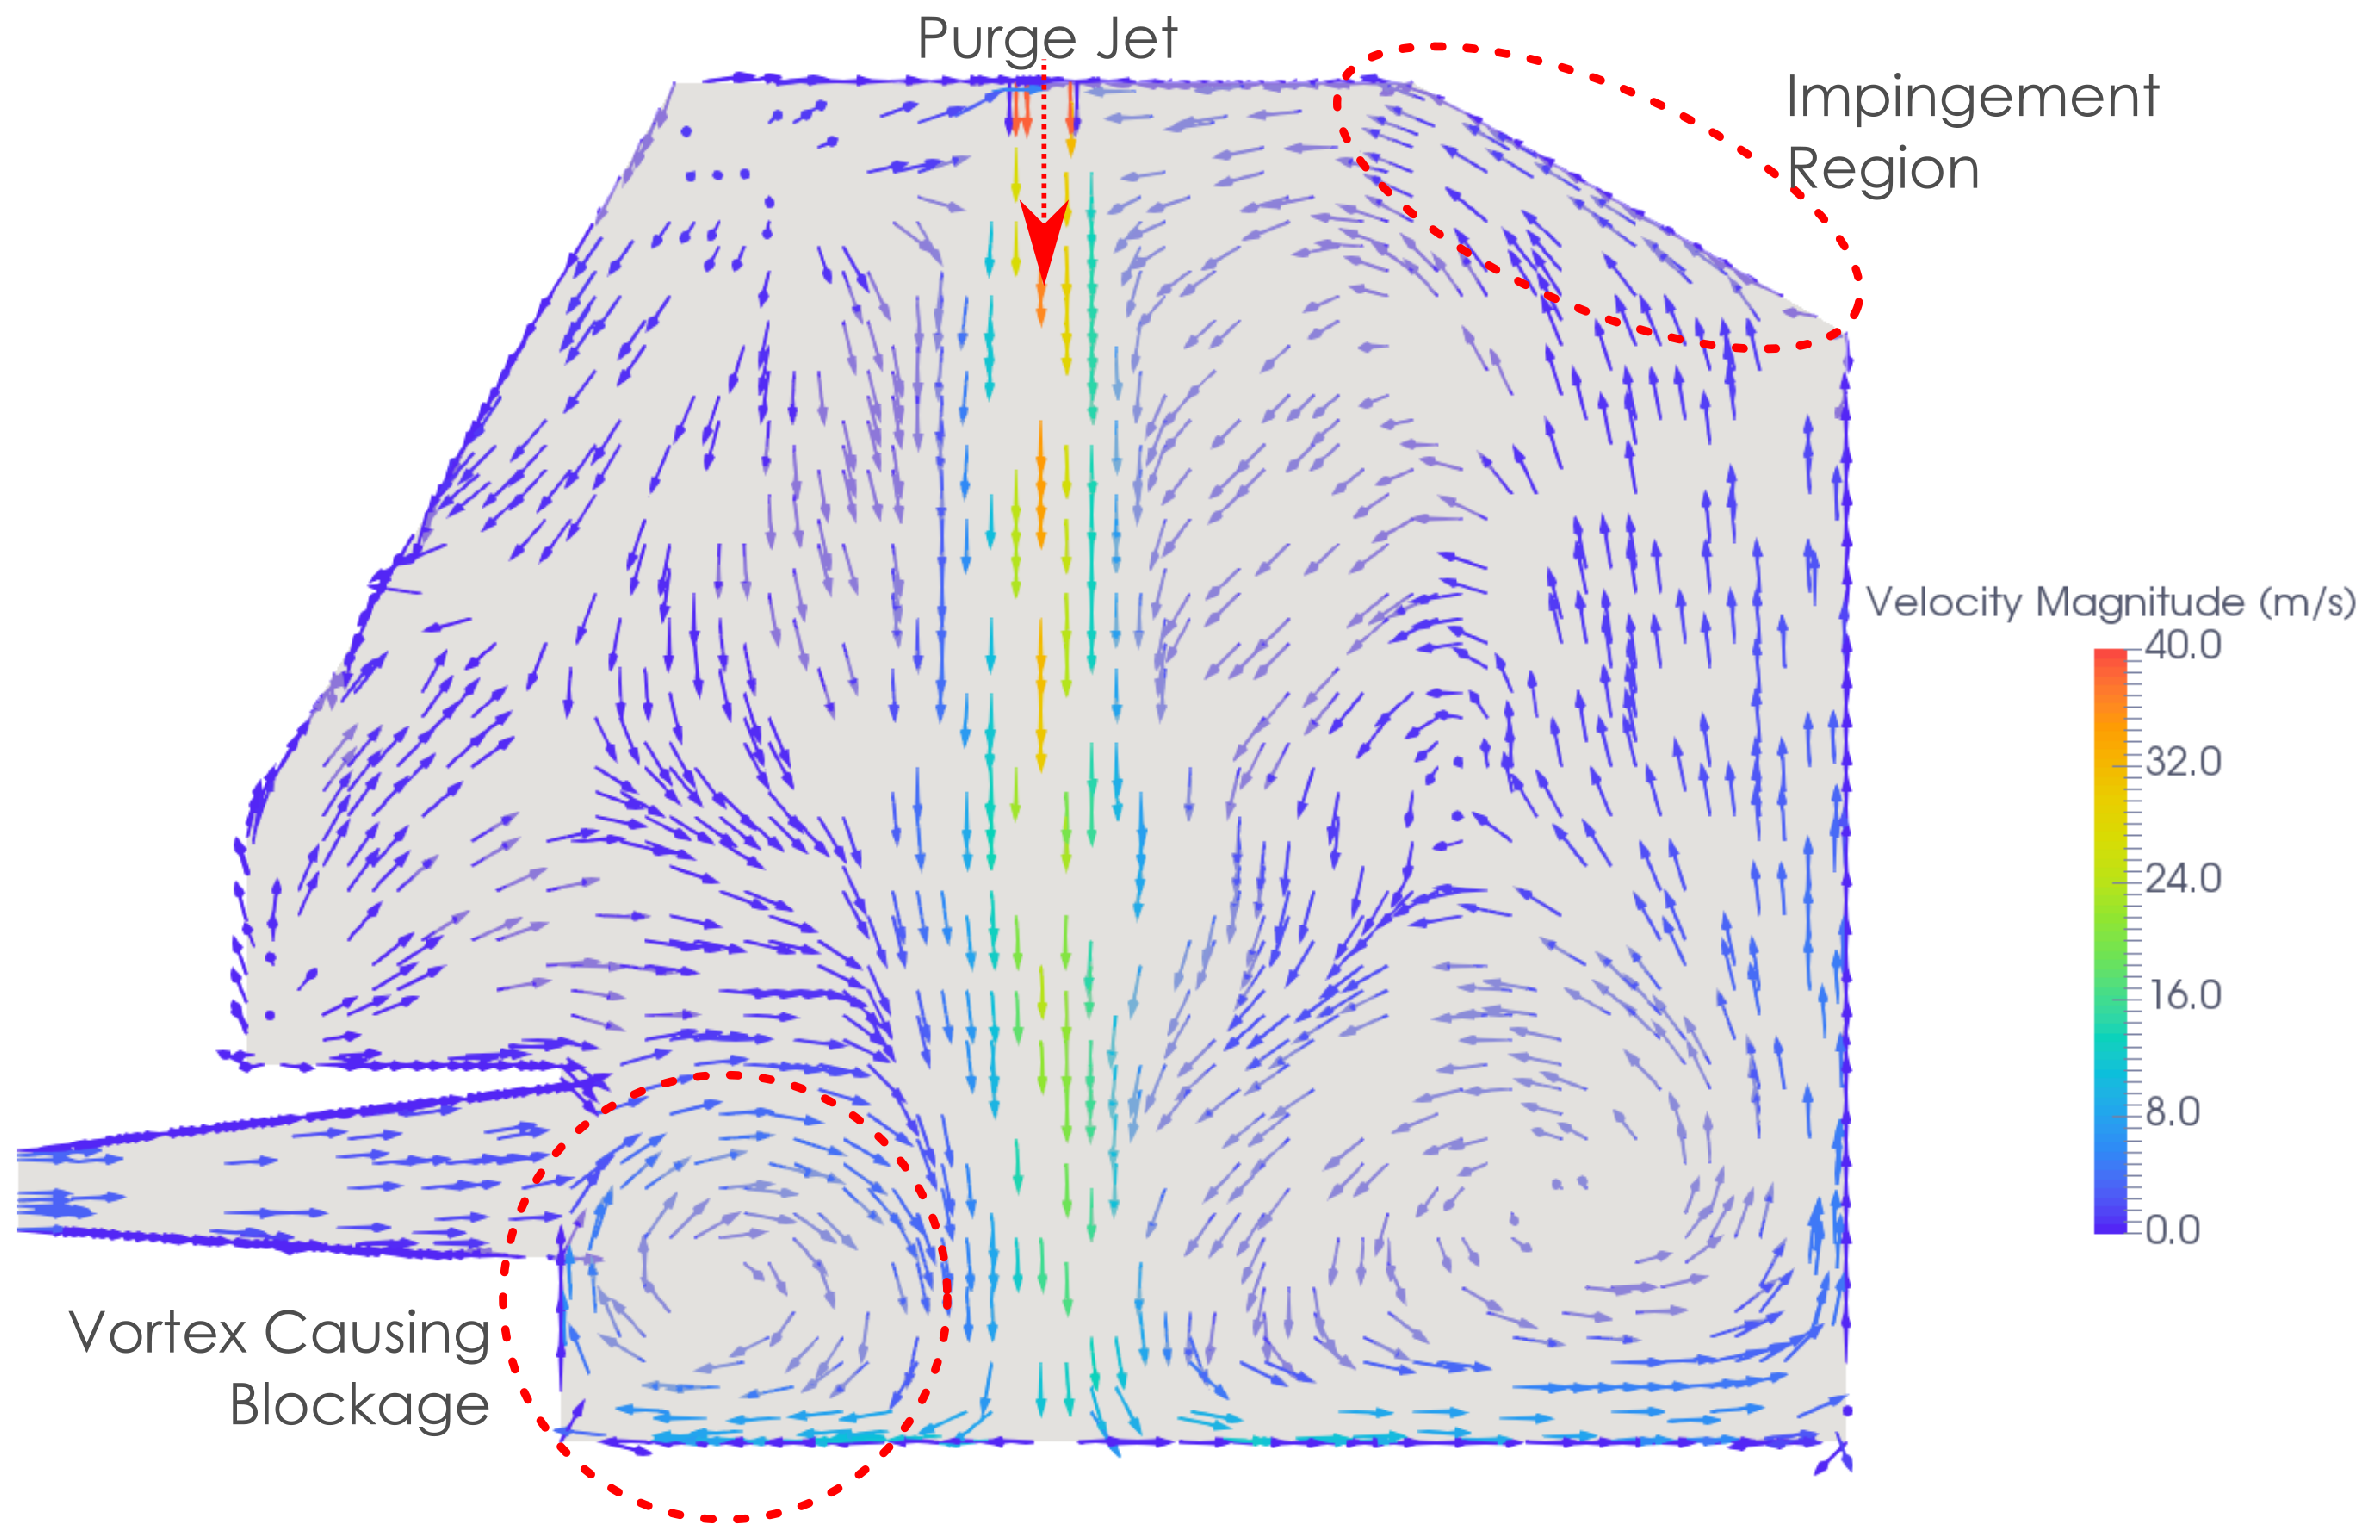
The aim of the purge flow was to increase the heat transfer at the top of the gas turbine casing. The purge flow increased the heat transfer in small regions very close to the top of the casing. These small regions are visible in Figure 14, one region directly around the purge hole and the other further rearward. The high-heat transfer directly around the purge hole is caused by the high-heat transfer coefficient (HTC) from the high-velocity jet of the purge air. The high HTC region further rearward is due to a recirculating flow impinging on the sloping rear casing. This can be seen by looking at the velocity vectors on a cross section through the casing (Figure 15).
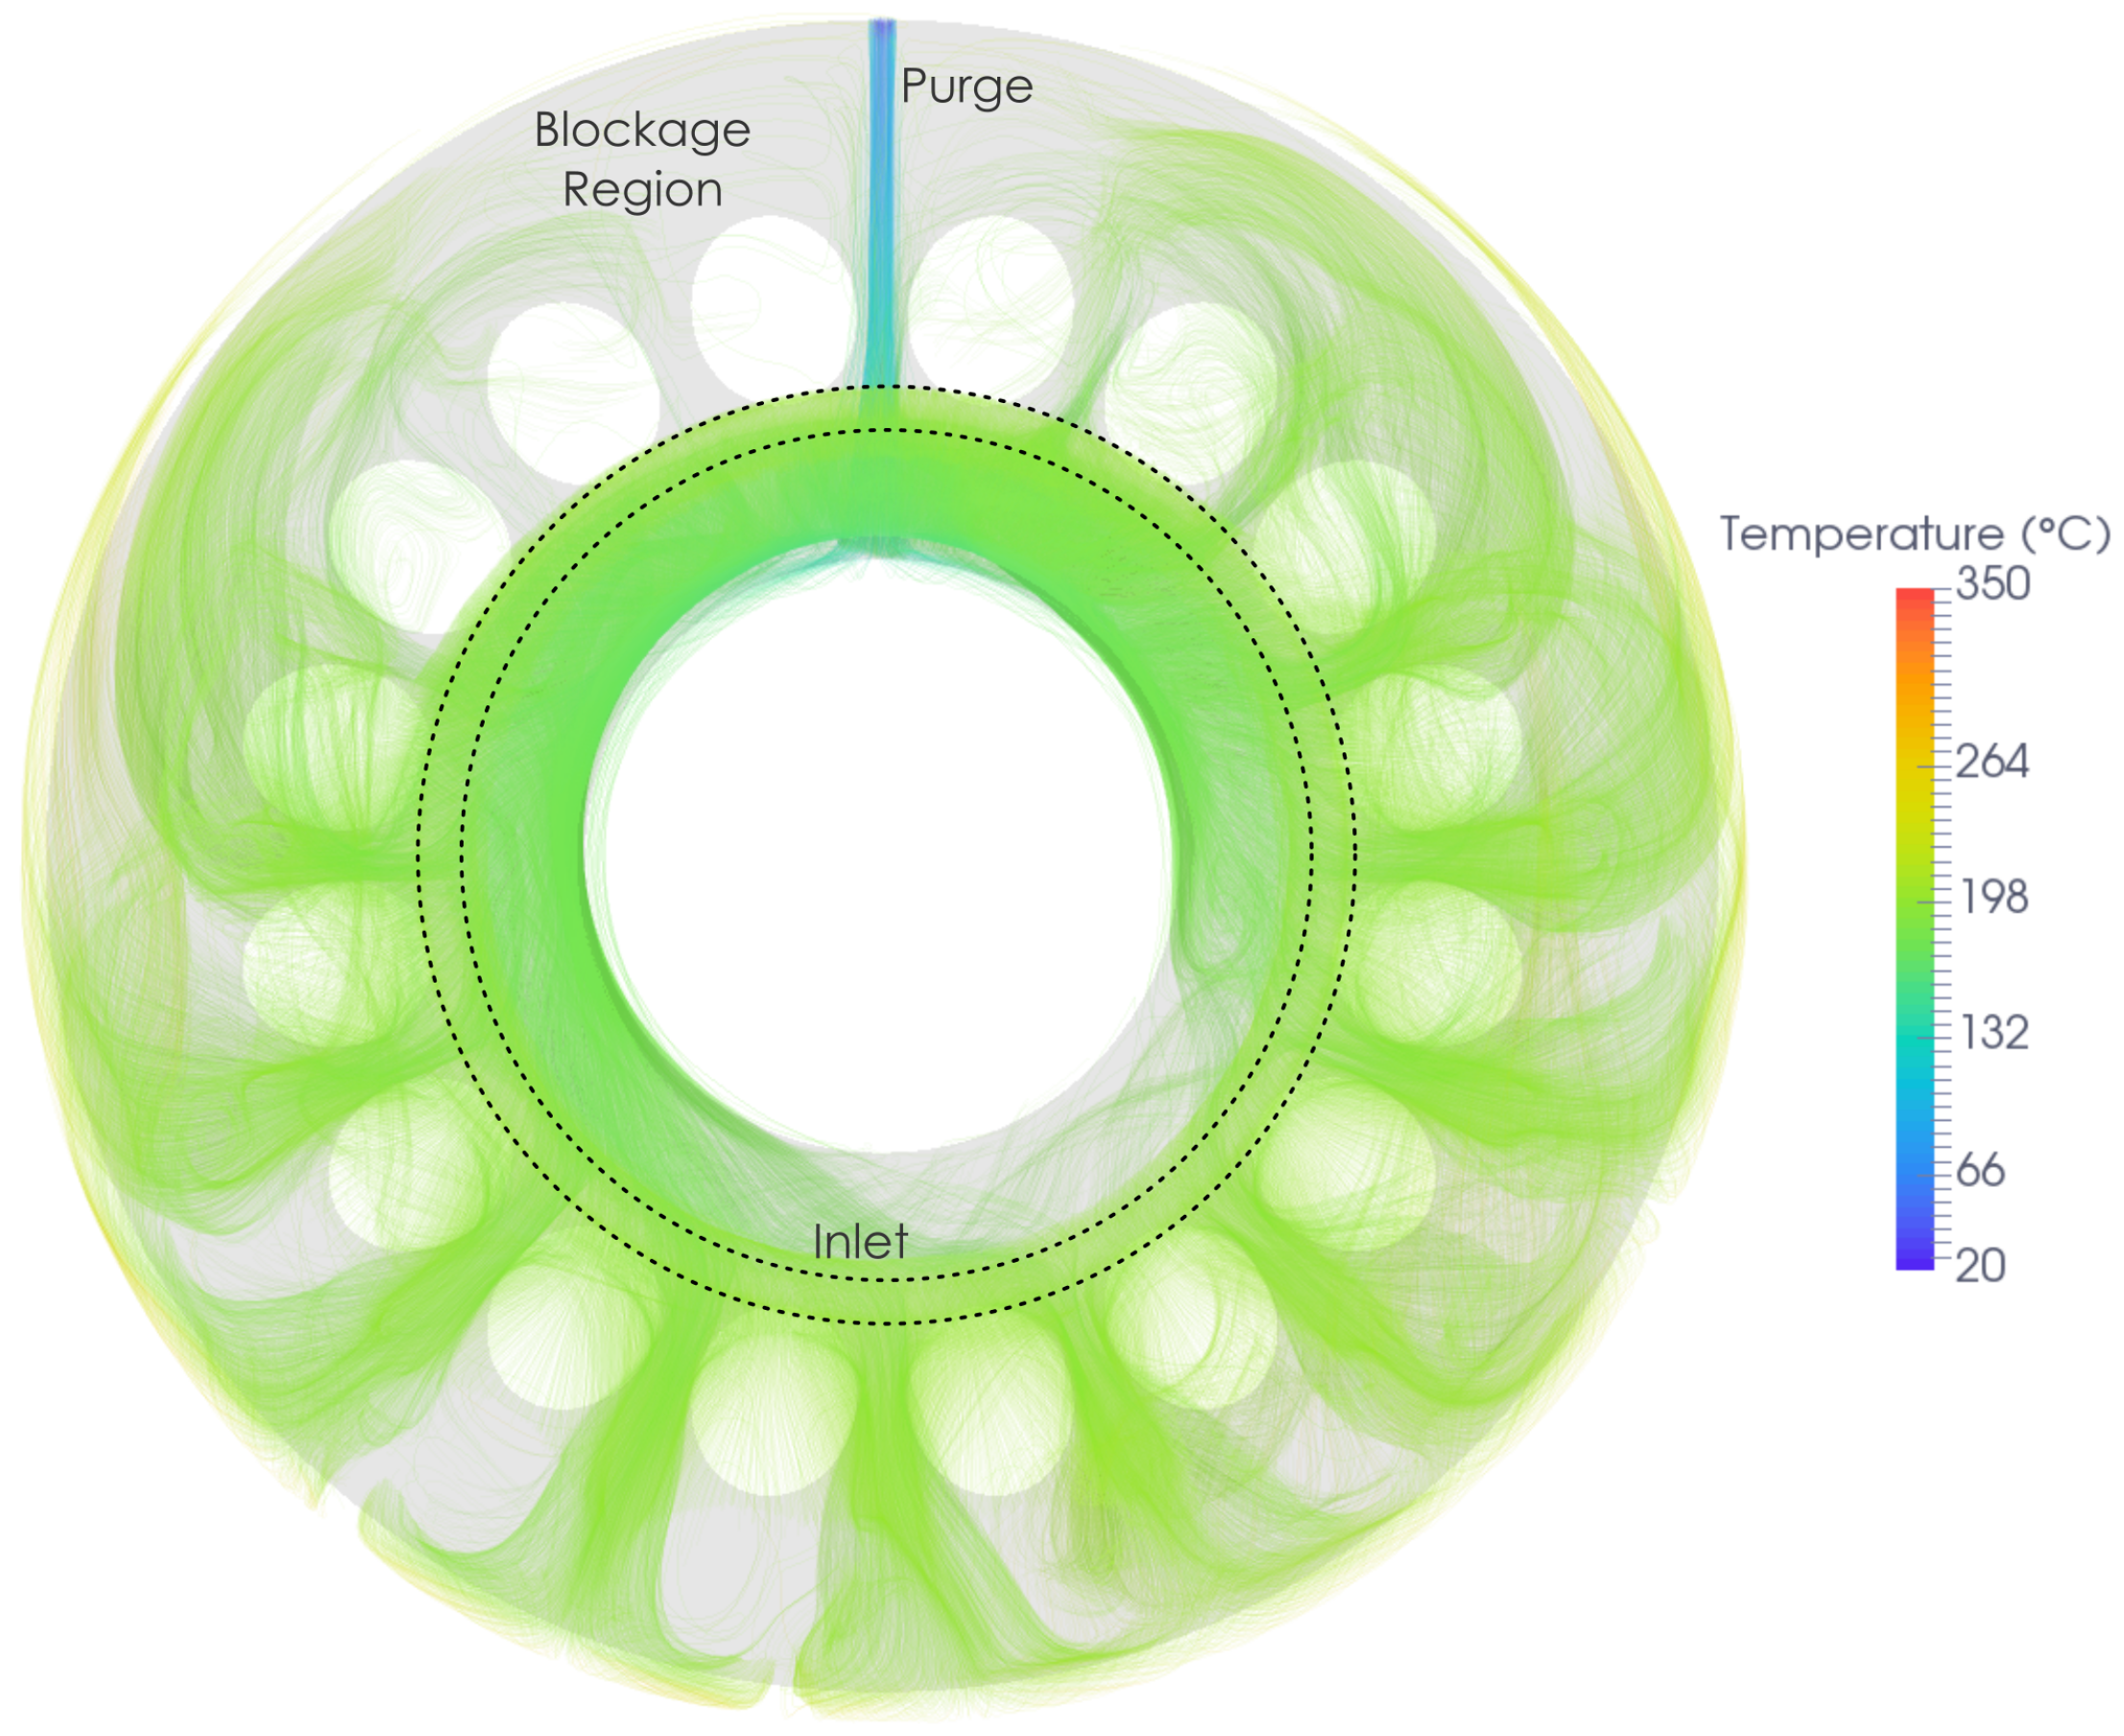
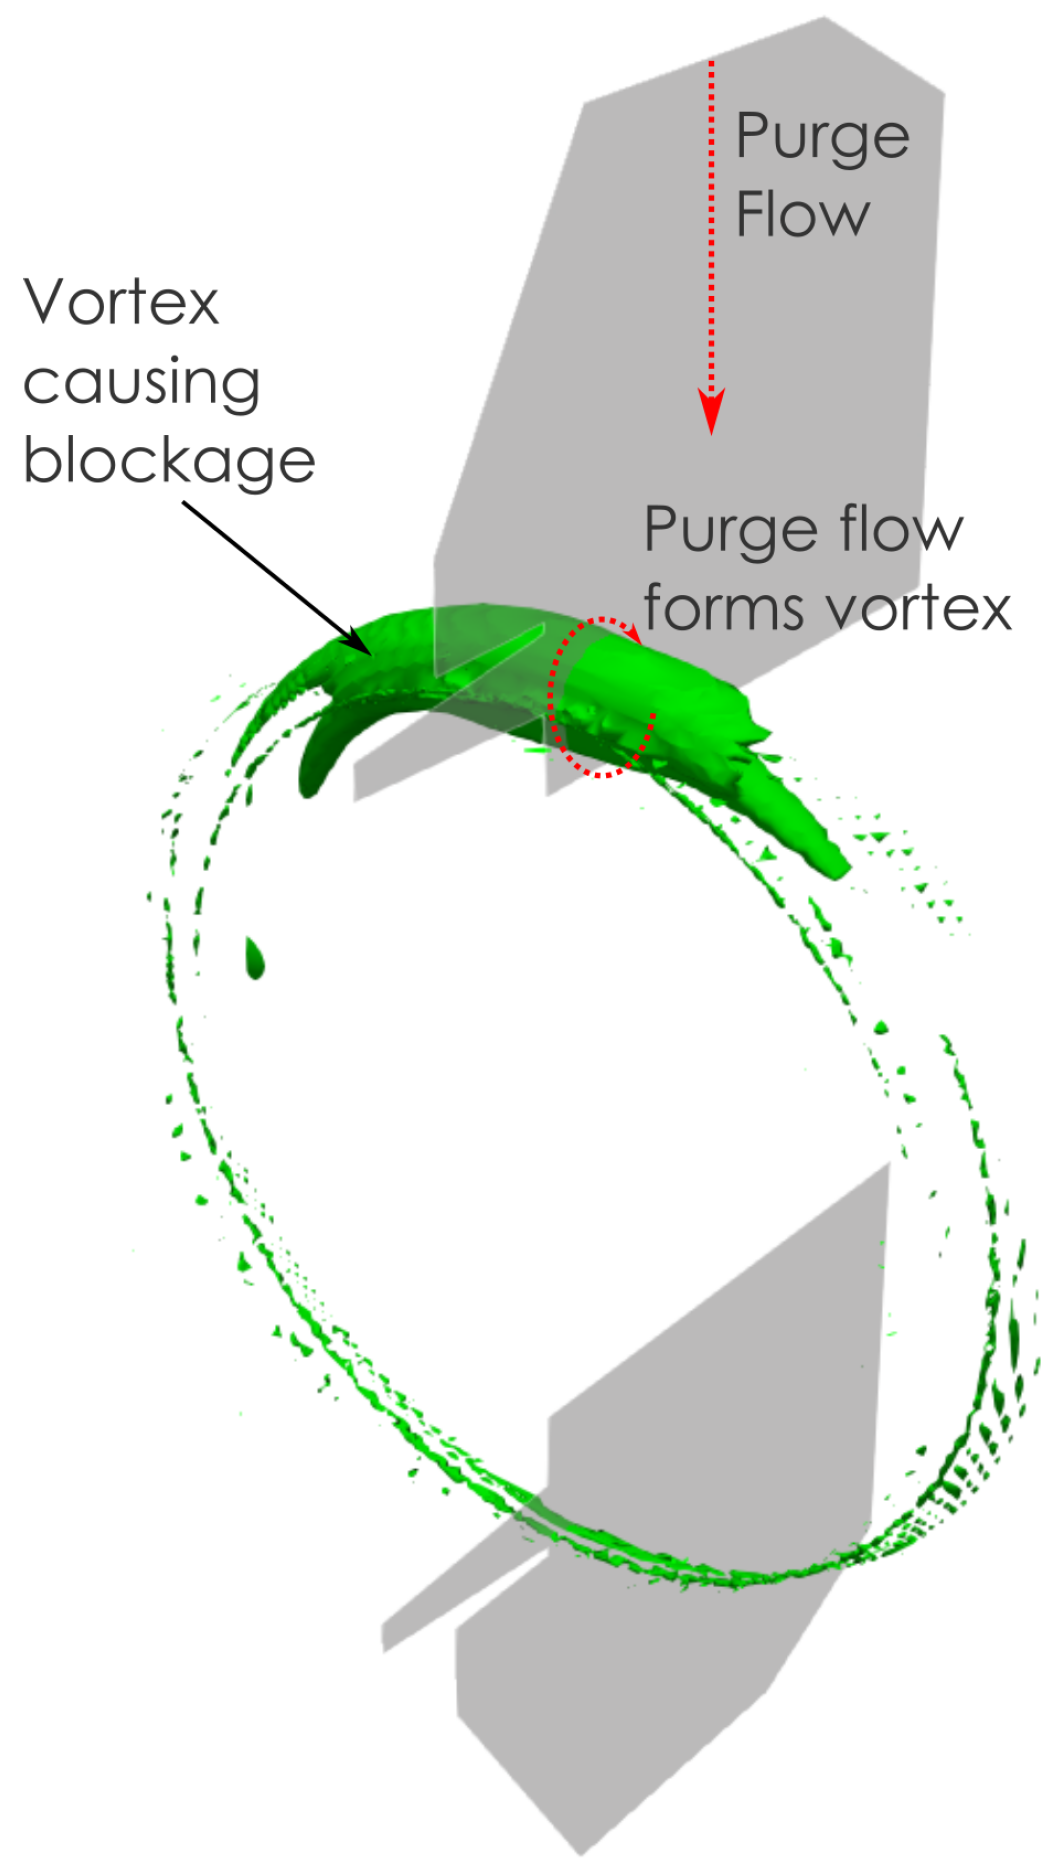
There is a region of relatively low heat transfer from 110° to close to the top of the casing, in which the effect of local increases in heat transfer caused by the flow acceleration around the combustors is not visible in the heat transfer distribution. This can also be seen by looking at stream-traces in the cavity (Figure 16). There are fewer stream-traces in the top half of the cavity, indicating a low-flow region. This effect is due to the purge flow interacting with the inlet flow. In the baseline case, the flow into the cavity from the compressor is circumferentially uniform, but in the purge case the distribution is skewed with less flow going into the top half of the cavity. This can be seen by looking at the circumferential velocity distribution at the compressor inlet (Figure 17). The low velocity into the top half of the cavity gives a large region of stagnant flow at the top of the casing, causing the low-heat transfer region. The root cause of the low velocity into the top half of the cavity is a vortex which forms at the top half of the diffuser exit. This can be seen by looking at the velocity vectors in Figure 15 and an iso-surface of Q-criterion at the diffuser exit in Figure 18. In summary, the purge flow is causing a blockage to the flow in the top half of the cavity, giving the low outer wall heat transfer.
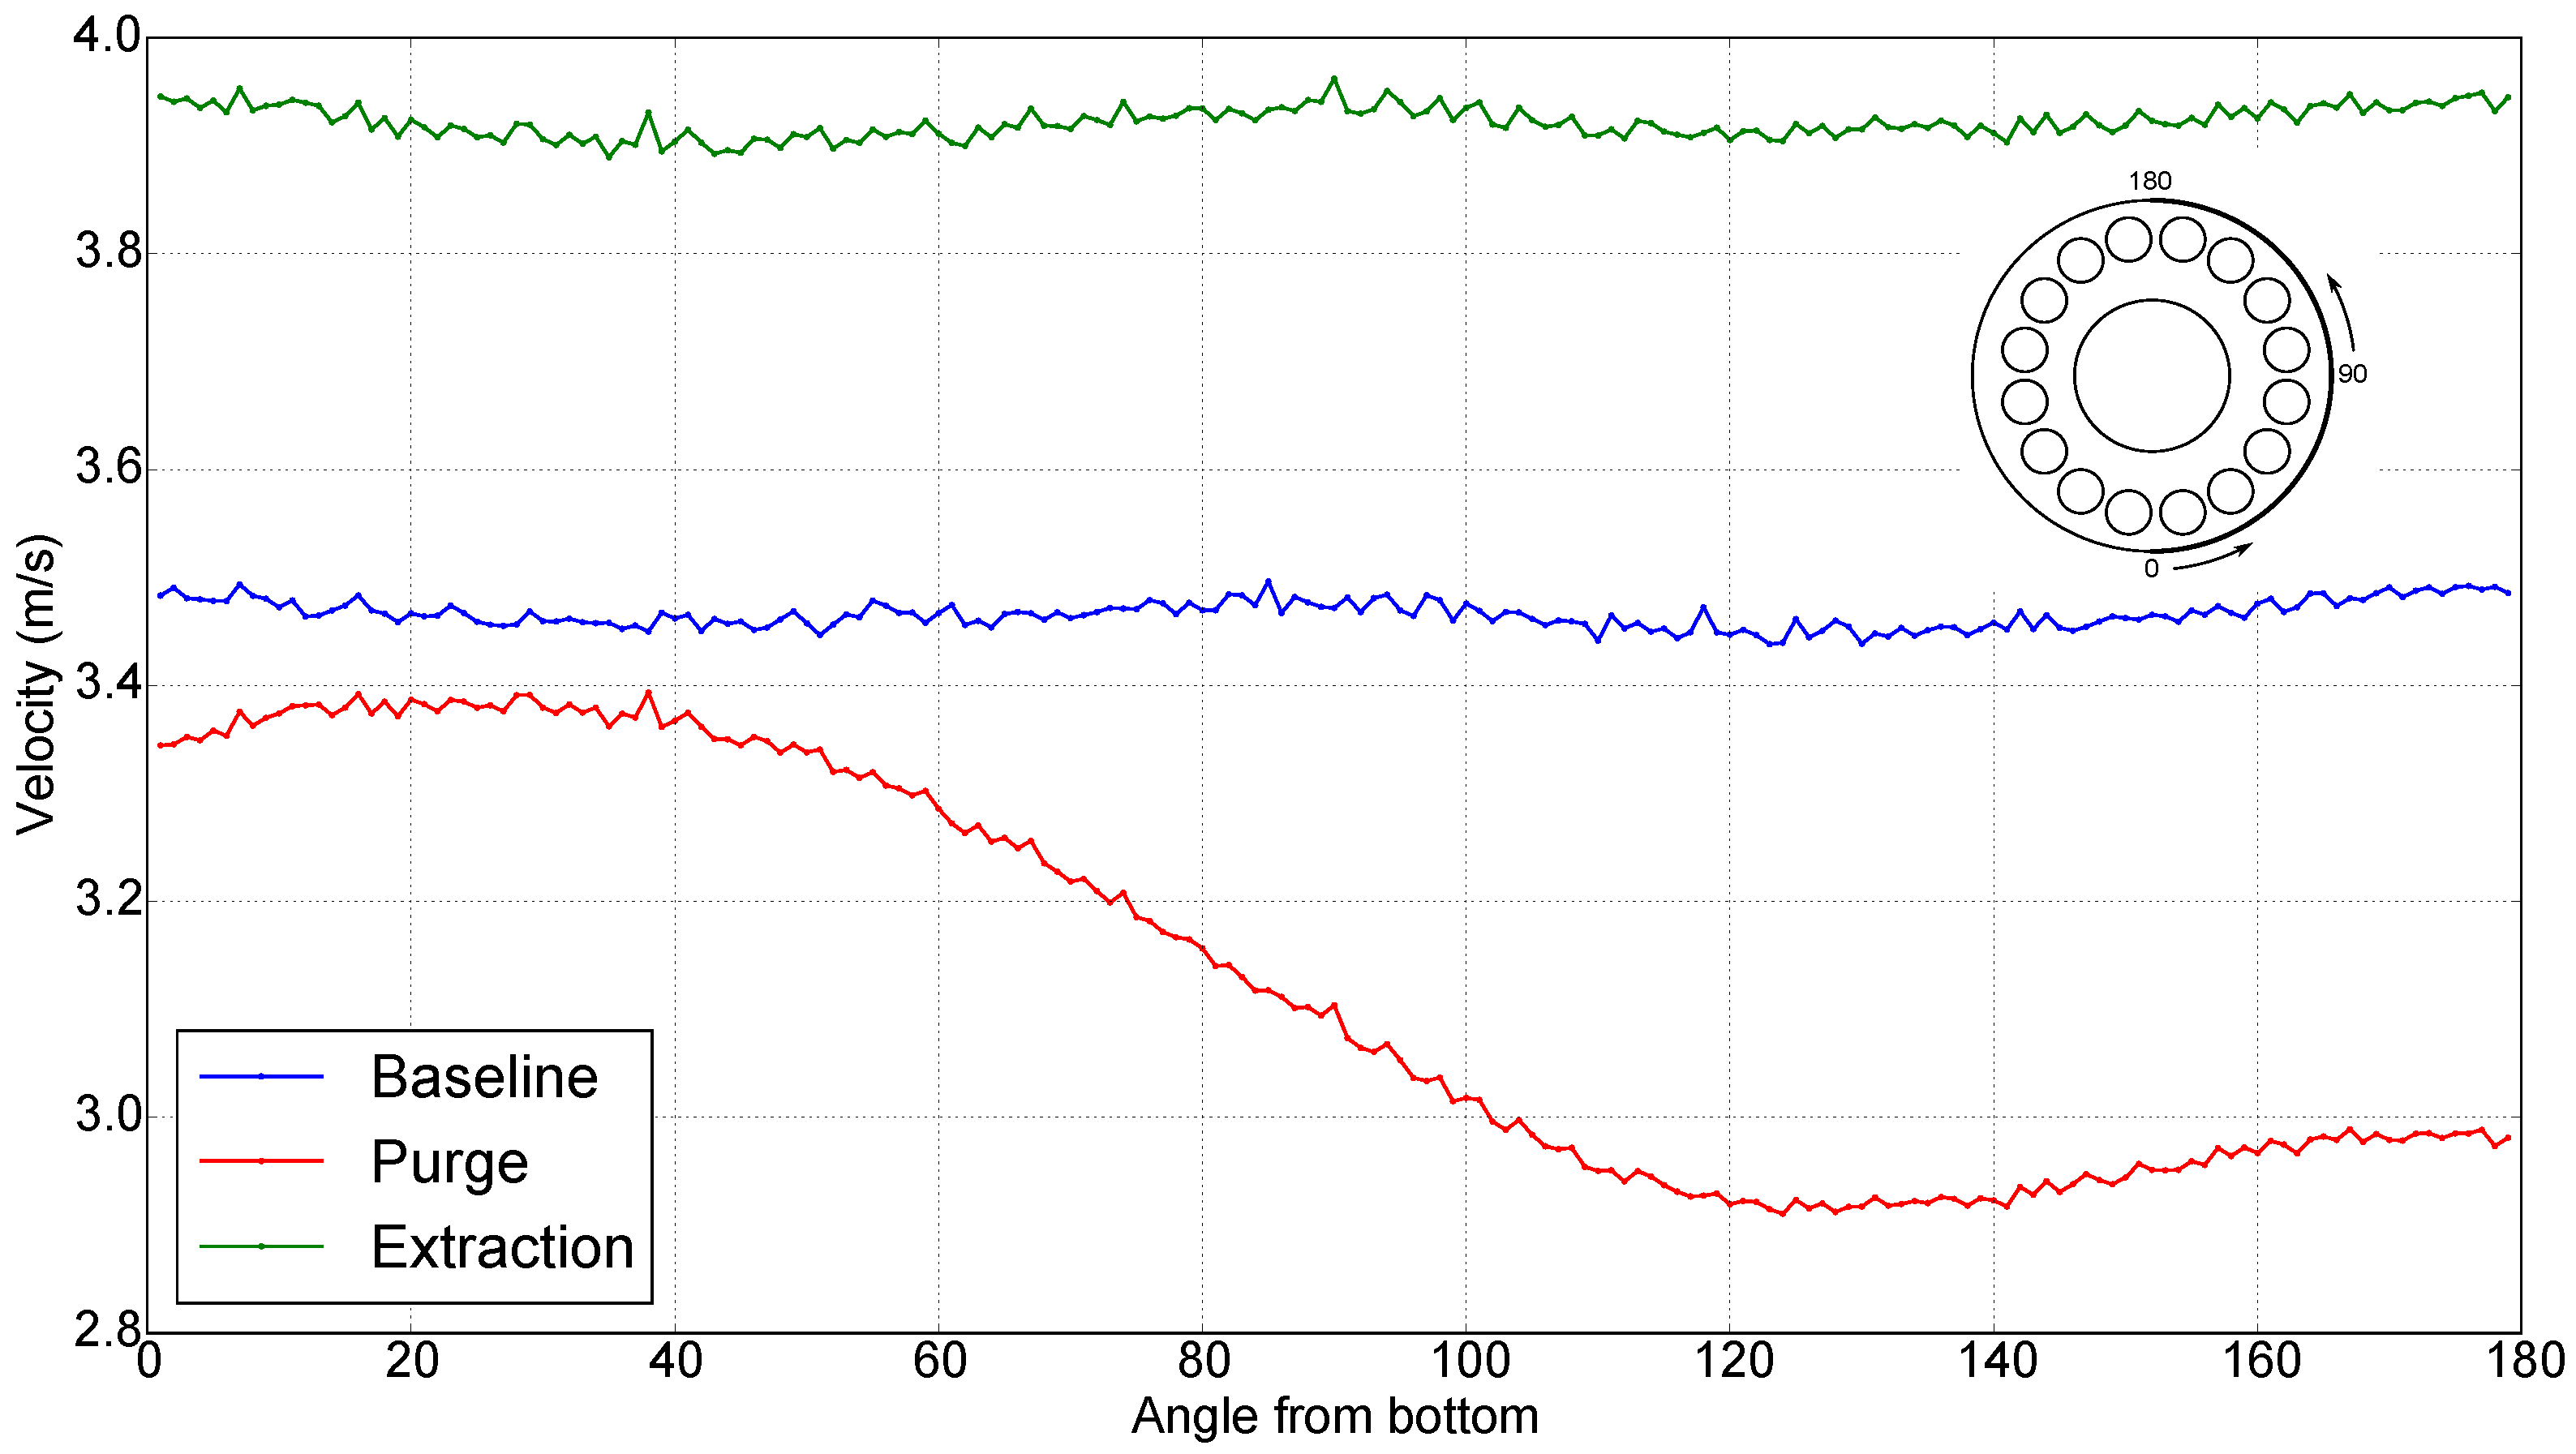
Looking at the circumferential distribution of axially averaged heat flux around the casing (Figure 19), the results from the purge flow analysis show that this method also produces a gradient in heat transfer from the bottom to the top of the casing.
In order to reduce the blockage effect caused by the purge, a case with a lower purge mass flow rate of 0.05 kg/s was investigated. The blockage effects however are still present in the lower mass flow rate case. This means the casing heat transfer profile cannot easily be modified by changing the purge mass flow rate.
Due to the blockage effect, the purge method of controlling the casing heat transfer does not provide a uniform distribution of casing heat flux. This non-uniform cooling could then lead to casing distortion during shutdown.
5.2. Extraction Case
Another method for reducing the non-uniformity of casing heat transfer is flow extraction from the gas turbine casing. Instead of injecting air into the casing as in the purge case, flow is extracted in order to reduce the stratified flow at the top of the casing.
The first extraction method tested was a system using the same 60 mm diameter hole used in the purge case, now used for extracting flow. This was to allow for the extraction system to potentially be retrofitted into existing engines. This test case used the same mesh as the purge case, but the inlet at the top of the casing was changed to an outlet with a target mass flow rate boundary condition. An initial mass flow rate of 0.13 kg/s was used in order to be consistent with the purge case.
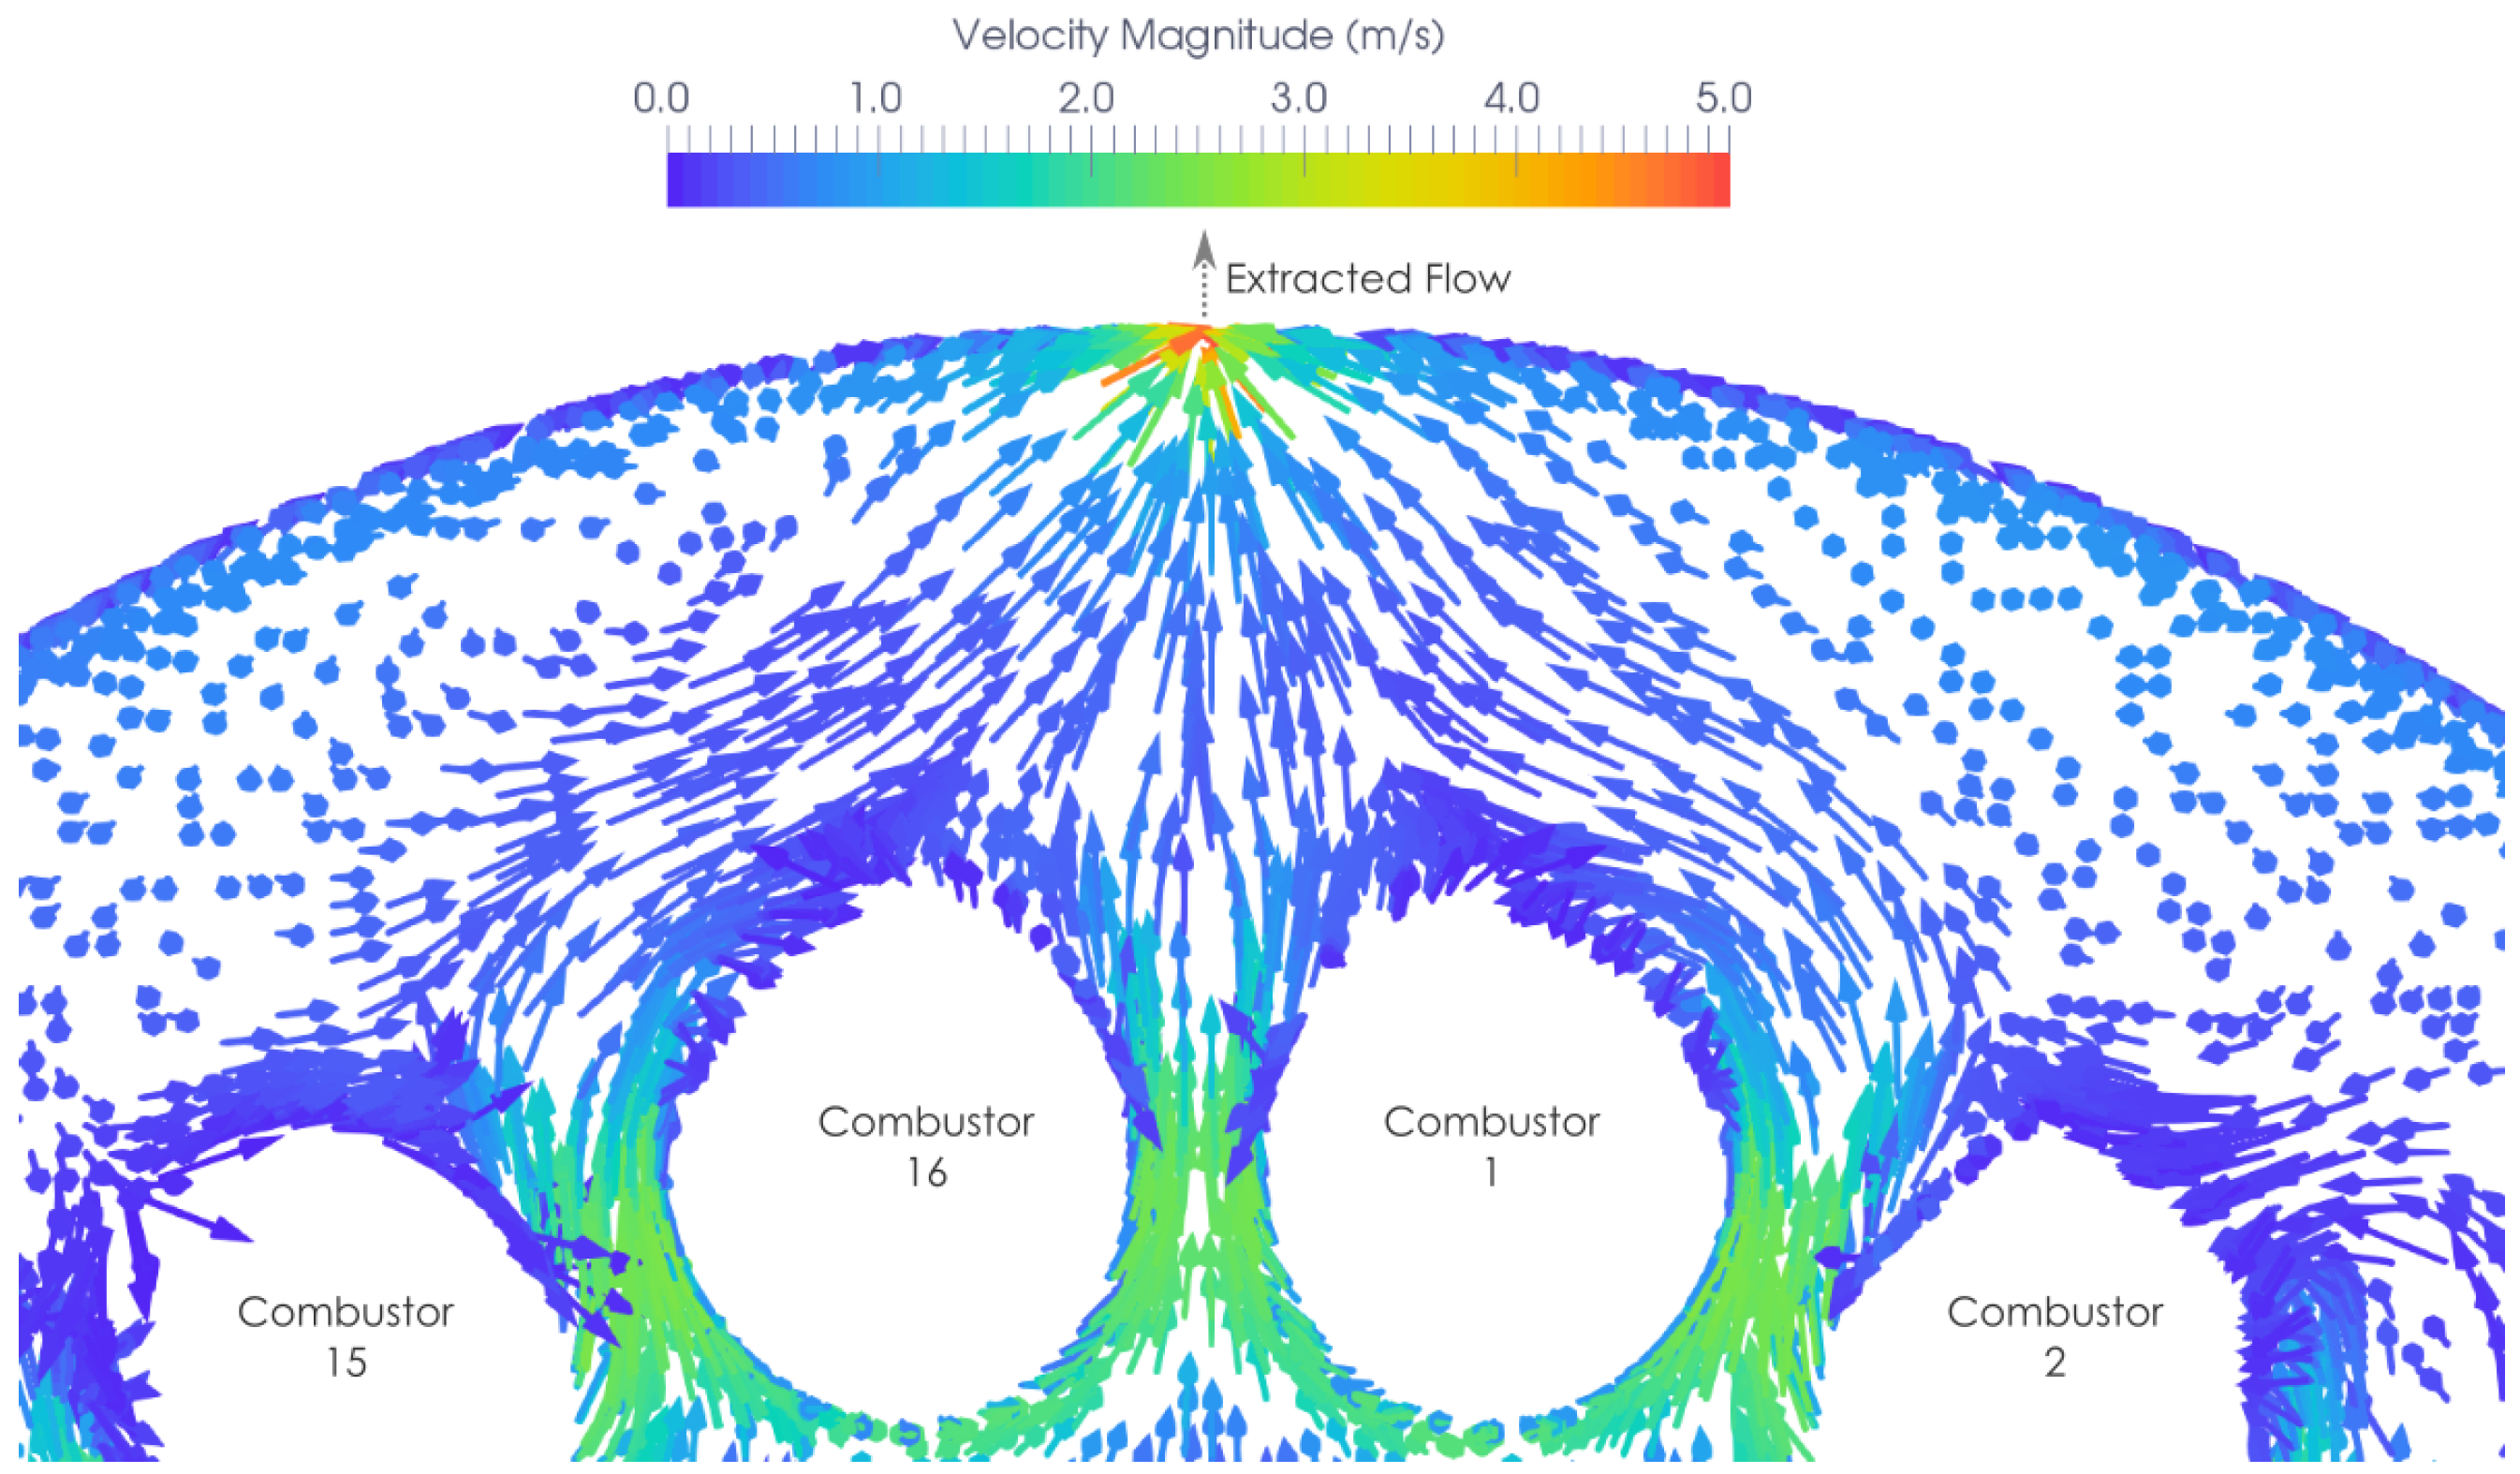
The flowfield in the extraction case can be visualised by stream-traces, shown in Figure 20. The flow is more uniform than in the purge case, with no large blockage region in the top half of the cavity. The low-velocity stratified region was also reduced by the extraction flow. This can be seen in the velocity vectors at the top of the casing (Figure 21).
The time-averaged outer wall heat flux is shown in Figure 22. It can be seen that the profile is now more uniform, with the heat transfer being enhanced at the top of the casing.
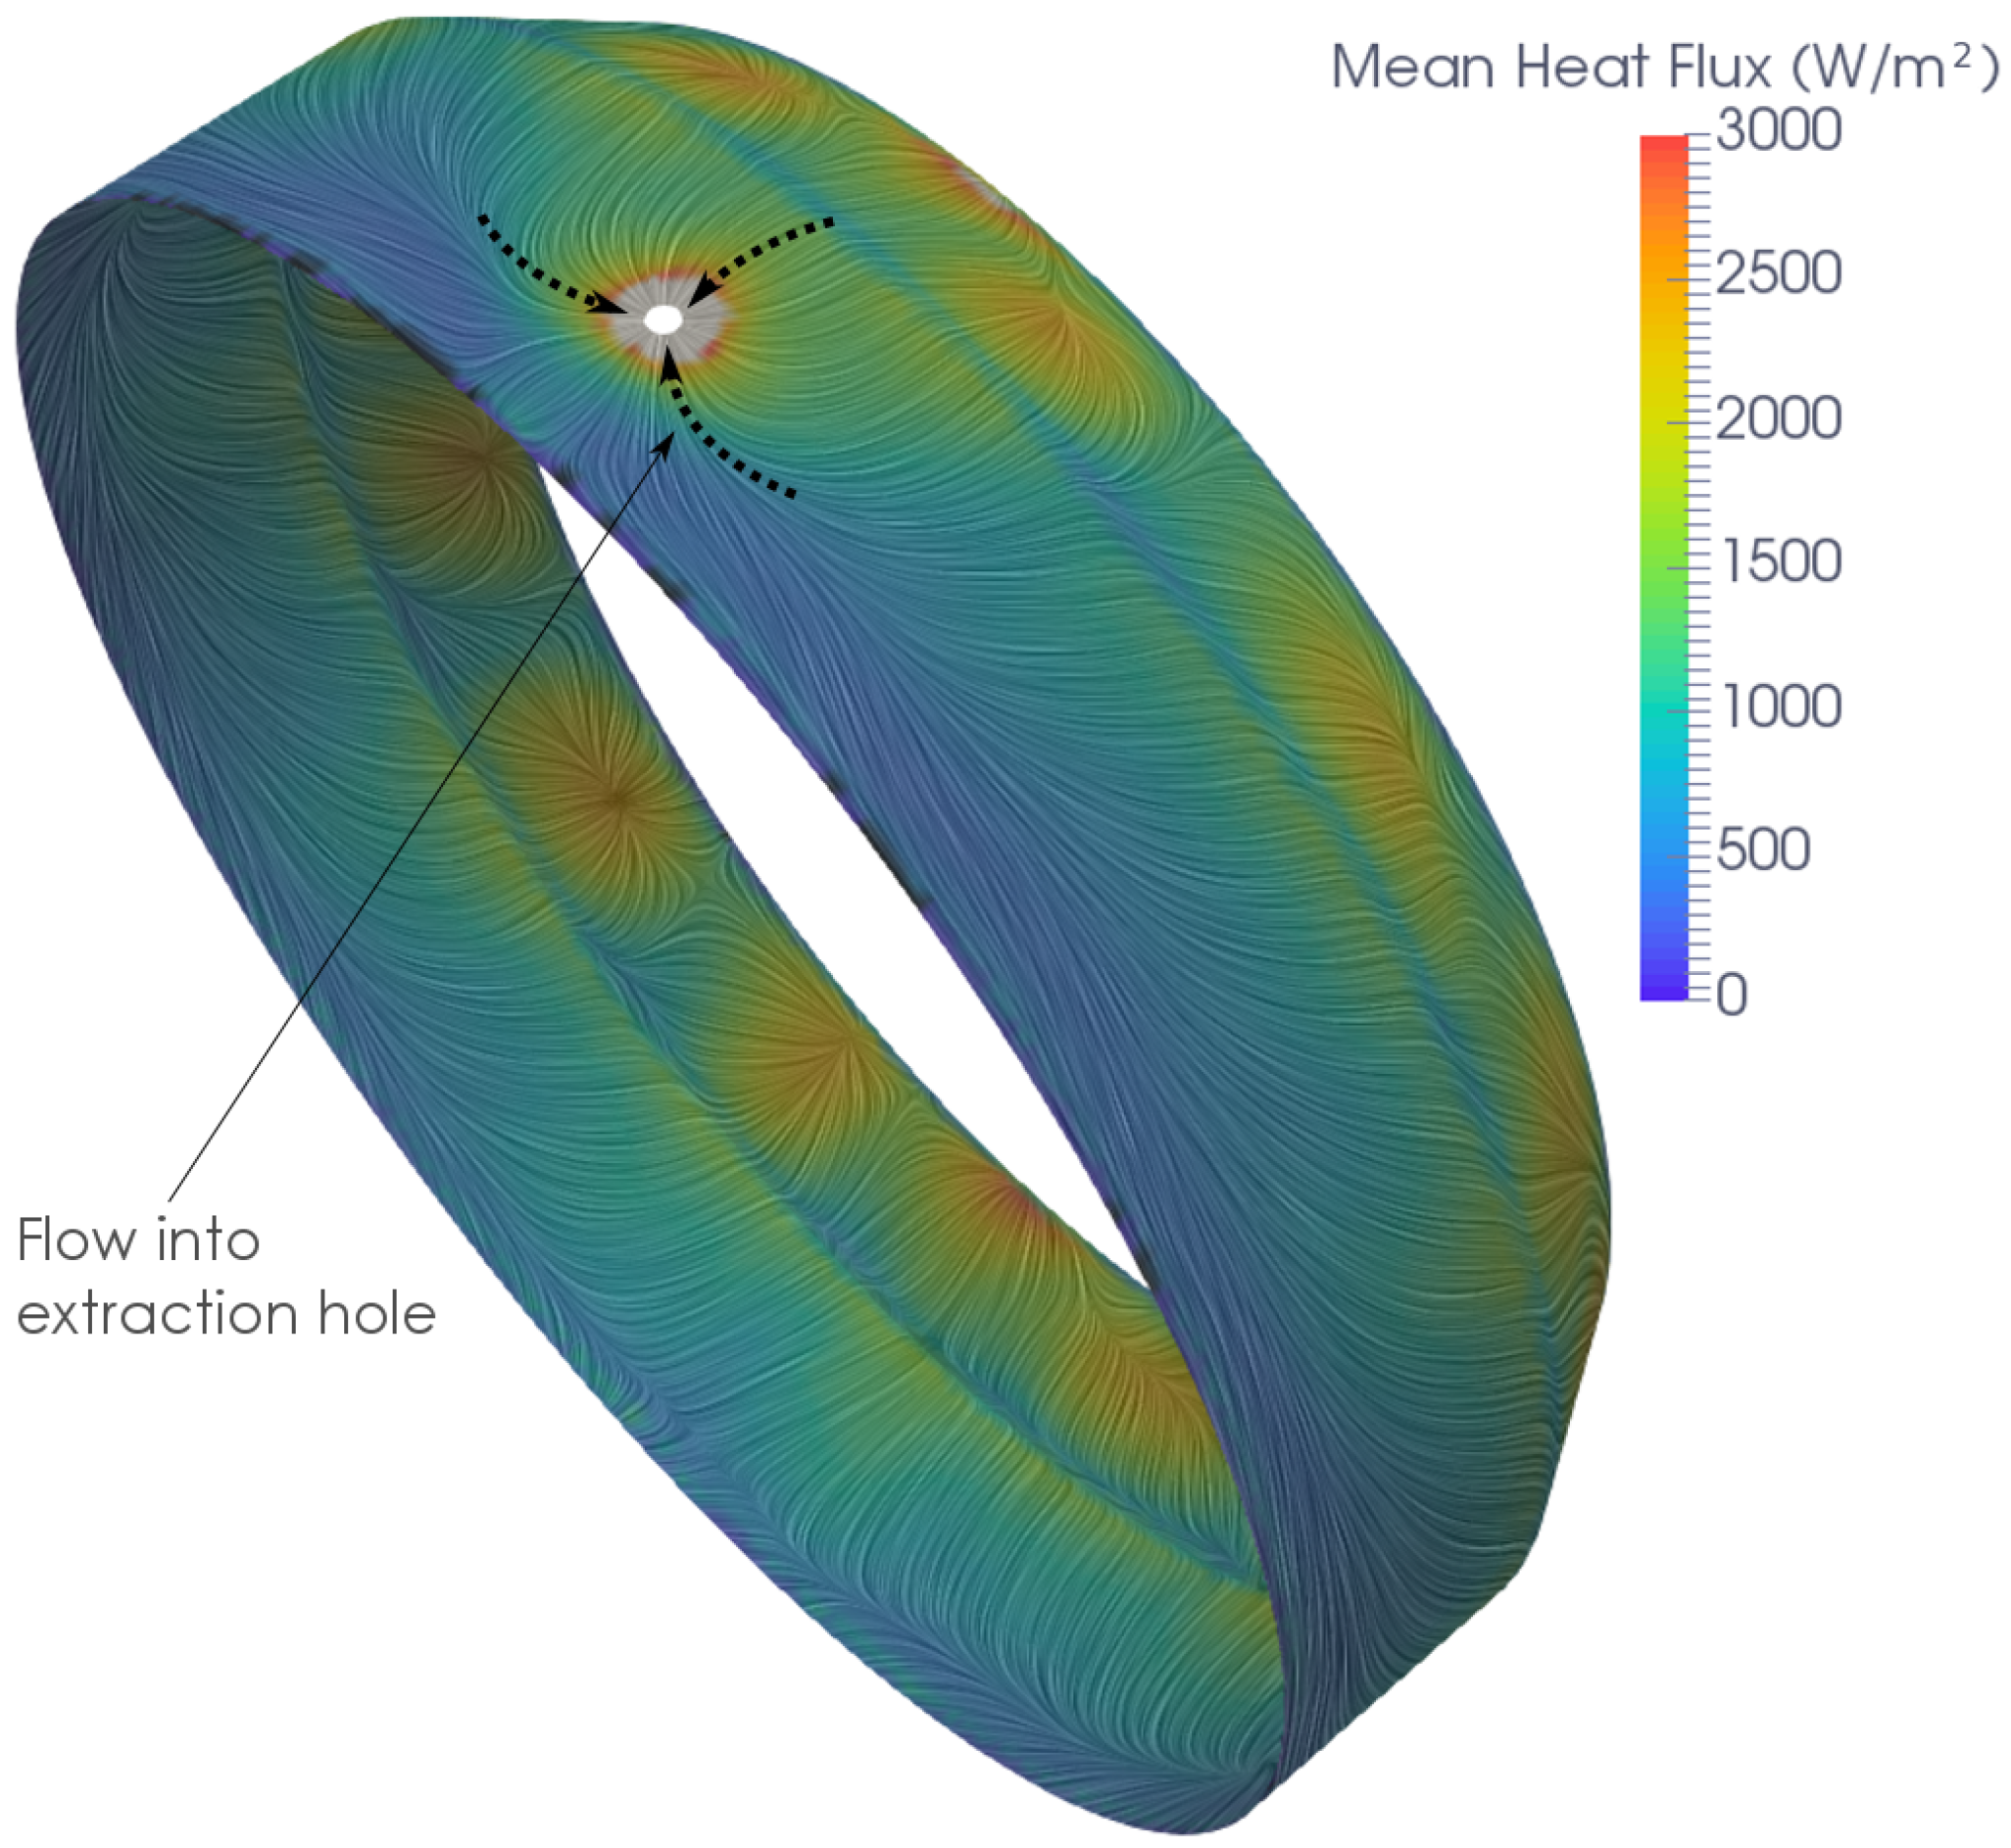
Results of the axially averaged heat flux around the casing outer wall are plotted around the circumference for the three cases in Figure 19. The heat flux profile around the casing is more uniform in the extraction case compared to both the baseline and purge methods. This is true for both a reduction in the local heat transfer peaks from the combustors and the general trend around the circumference. There is a peak in the heat transfer near to the top of the casing for the extraction case. This heat transfer enhancement is due to flow acceleration close to the extraction hole.
In order to obtain a quantitative comparison of the three cases, the gradient of a linear fit though the data in Figure 19 was calculated. The gradient shows the trend of heat transfer from the bottom to the top of the casing. Ideally, the gradient of the linear fit would be zero, giving no change in the circumferential distribution of heat flux. The linear fit for the extraction case shows a 33% reduction in the gradient compared to the baseline case, showing the more uniform heat transfer distribution with the extraction case. The linear fit was calculated using data from 10° to 170°, avoiding the large peak in heat transfer around the hole, which can skew the gradient calculation.
The extracted mass flow in this case was 0.13 kg/s to be consistent with the purge flow case. However, lower mass flow rates could potentially be used. A lower mass flow rate would have a lower velocity through the extraction hole and less heat transfer enhancement around the hole, which could give a heat flux profile that is more circumferentially uniform. A lower extraction mass flow of 0.05 kg/s was therefore tested, and it was found that the lower mass flow case gives a heat flux profile similar to the 0.13 kg/s case, but the region of enhanced heat flux near to the extraction hole is now smaller. However, this lower mass flow rate may not be optimal, as the general trend of heat flux is still lower at the top of the casing compared to the bottom.
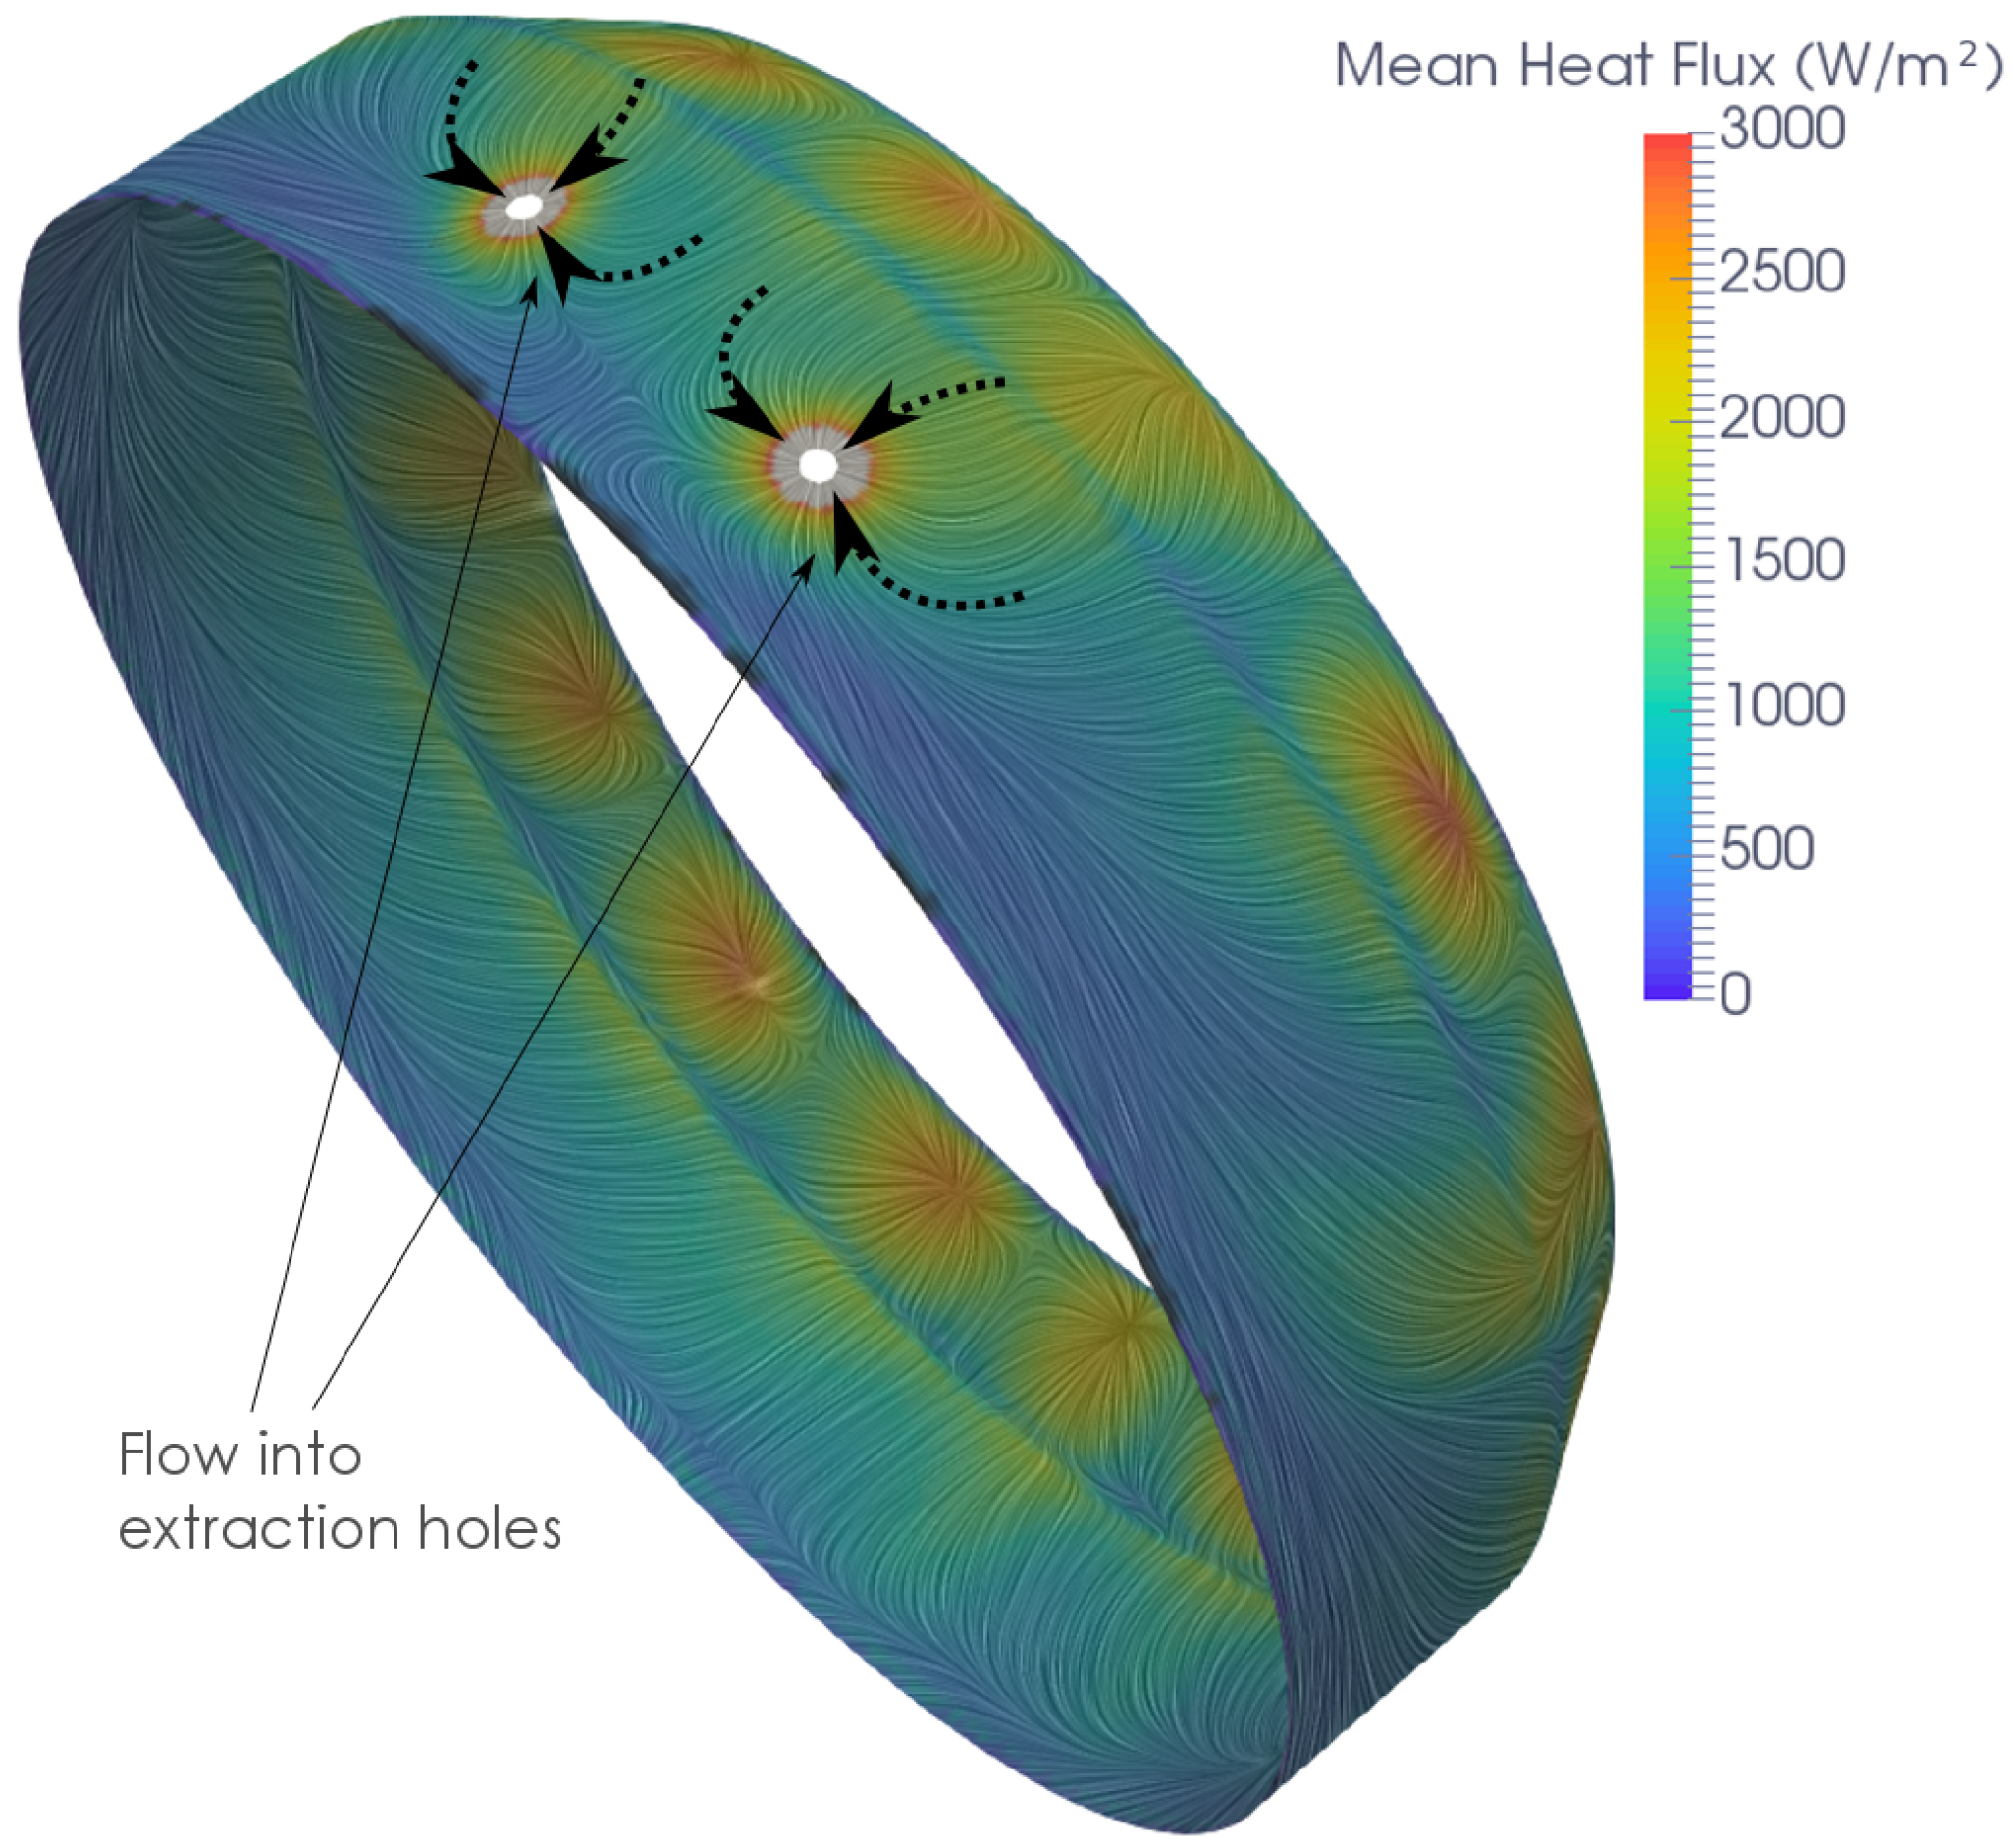
The first extraction method tested used the same 60 mm diameter hole for extraction, as was used in the purge configuration. This was to allow potential retrofitting of the extraction system to existing engines fitted with the purge system. For new engine designs, a better system may be possible if the constraint of using the single 60 mm hole is removed. An alternate method would therefore be extraction from two ports. It can be seen in Figure 12 that the lowest heat transfer does not occur right at the top of the casing, but at around 170°, measured from the bottom of the casing. These locations of lowest heat transfer line up with the point of the combustor being closest to the casing. A modification was tested that added two holes, of 60 mm diameter, at the locations of lowest heat transfer. The total mass flow rate extracted through both holes was initially kept at 0.13 kg/s to allow for a comparison with the other methods.
The results of the two-hole extraction are shown in Figure 23. Comparing the heat flux profiles of the one- and two-hole extraction methods, it can be seen that the profiles are similar for the bottom half of the casing. However, the local region of high heat transfer around the two extraction holes is still significant.
In order to reduce the local high-heat transfer around the two extraction holes, a case with a 0.05 kg/s extraction mass flow was tested. The lower mass flow rate reduces the region of high heat transfer at the top of the casing, but the general trend of heat flux is now lower at the top of the casing than the bottom.
6. Comparison
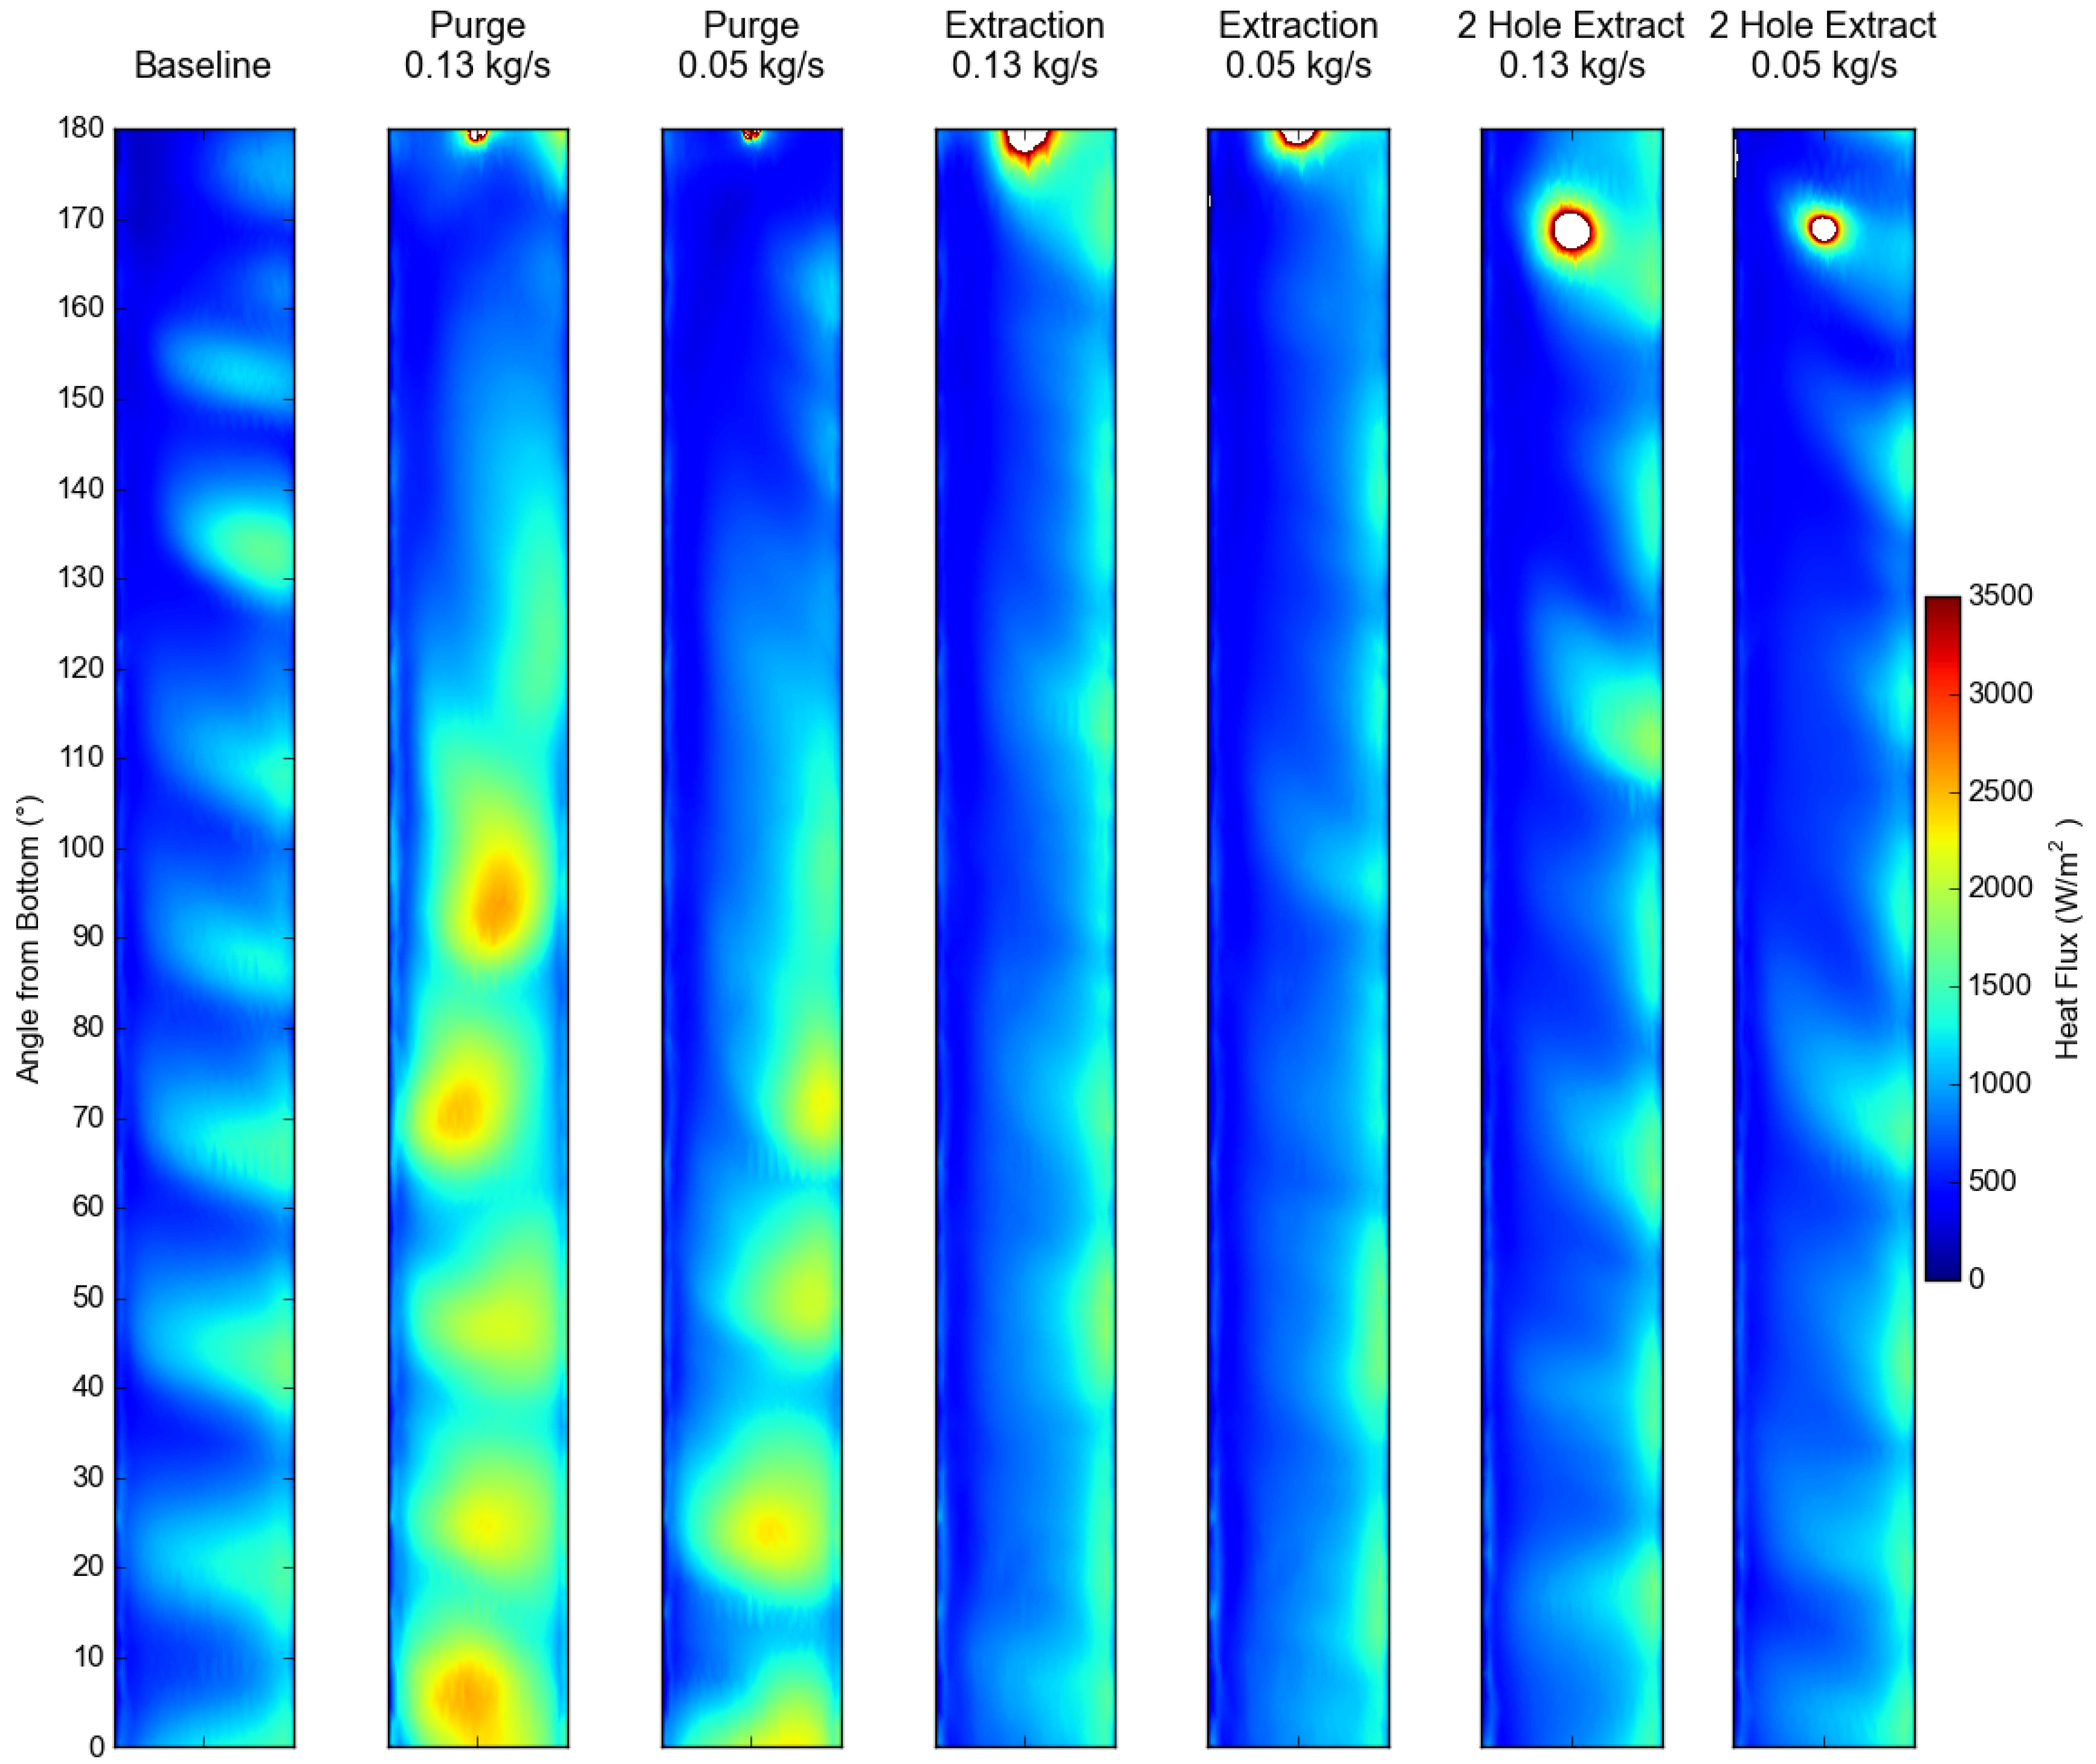
A comparison of the contours of heat flux on the cylindrical section of the outer casing for the different methods is shown in Figure 24. It can be seen that the extraction methods give a more uniform heat flux profile than the baseline and purge cases. The differences between the one- and two-hole extractions are fairly small, so the benefits of the two-hole system may not be worth the increased complexity. The extracted mass flow rate can be varied to tune the heat flux profile depending on the results found in service.
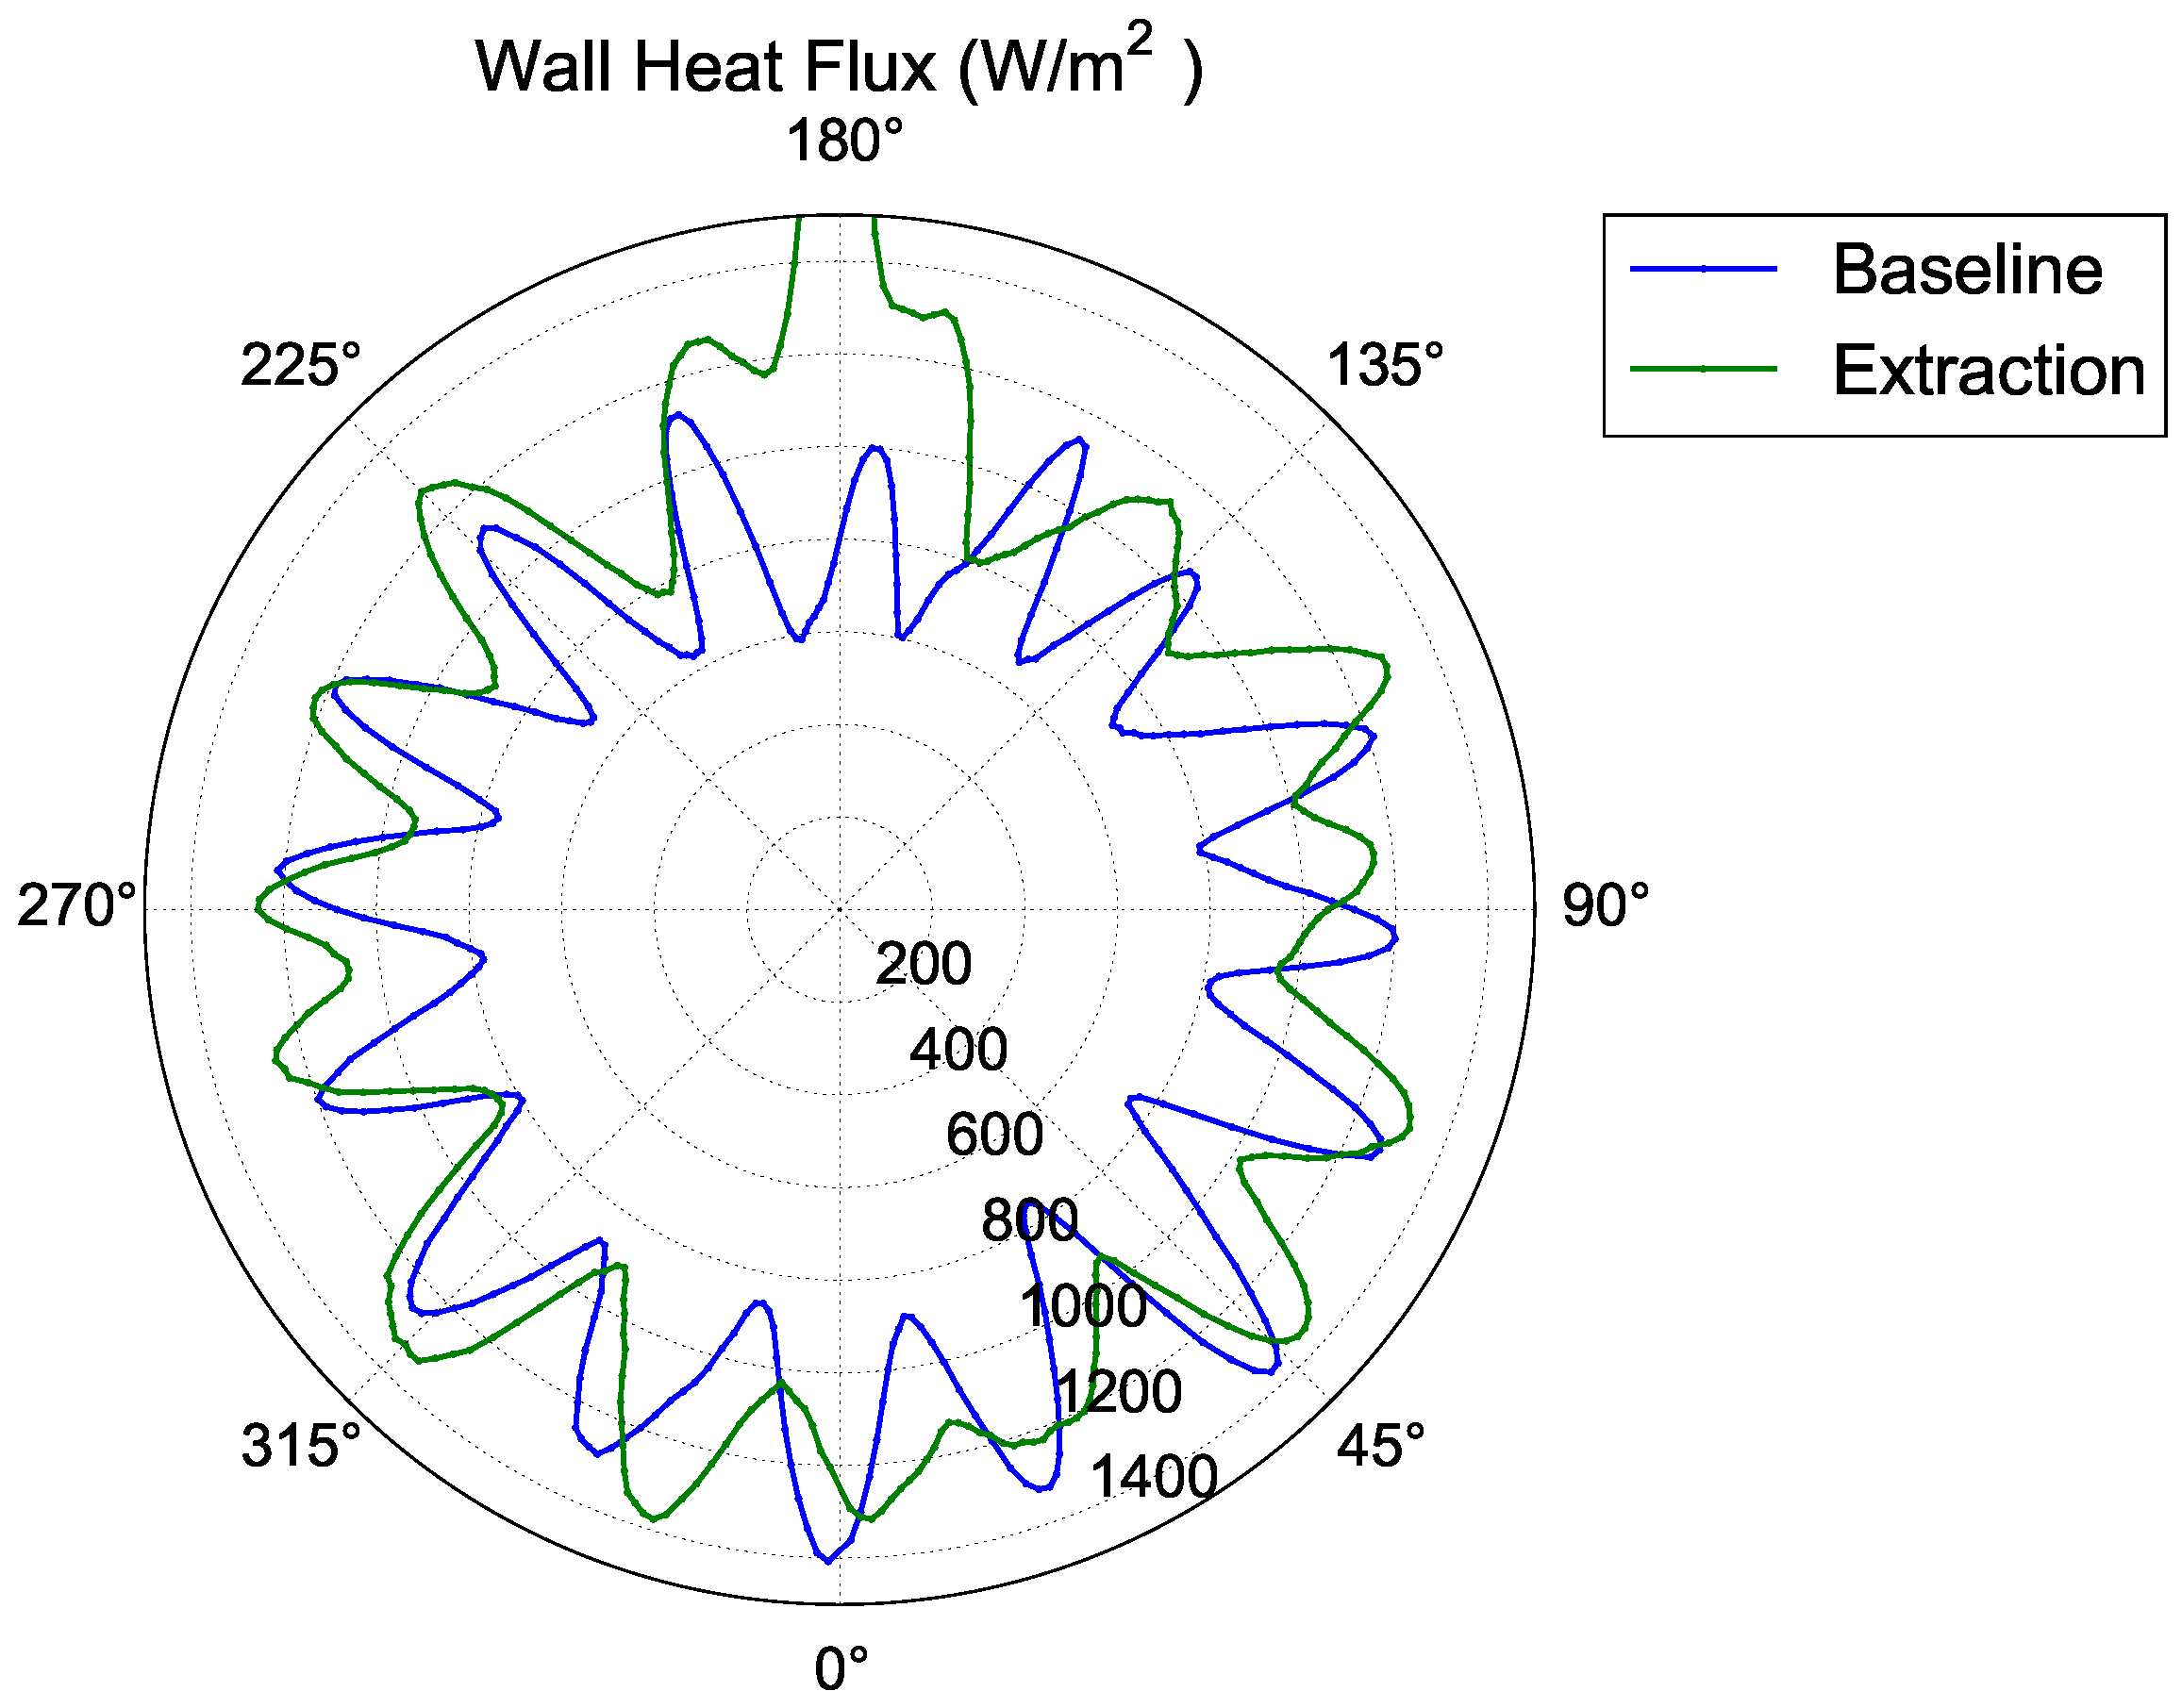
The circumferential distribution of wall heat transfer from the baseline case is compared to the 0.13 kg/s extraction case in Figure 25. It can be seen that the profile of outer wall heat transfer is more uniform using the extraction, with a reduction in the difference in heat transfer from the top to the bottom of the casing.
7. Conclusions
An investigation was conducted into methods for reducing the non-uniformity of heat flux on industrial gas turbine casings during shutdown. Numerical simulations were performed on a geometry that is representative of a section of a large industrial gas turbine. The simulations were run in an unsteady manner, and the results were taken from the time average of the simulations.
A baseline case with no active method for controlling the casing heat flux distribution was found to have lower heat transfer at the top of the casing. This region of low heat transfer would be responsible for casing distortion.
A case with a purge system which injected cool air into the top of the engine casing was then investigated. It was found that the casing heat transfer in the purge case was also non-uniform, with low heat transfer at the top of the casing, which could lead to casing distortion.
A new extraction method for reducing the casing heat flux non-uniformity was then investigated. The casing heat flux distribution in this case was found to be more uniform than both the baseline and purge cases. The initial extraction mass flow rate was 0.13 kg/s, in order to be consistent with the purge case, but other mass flow rates were investigated. This allows some scope for the heat flux profile in the engine to be tuned by adjusting the extracted mass flow rate.
A two-hole extraction method was then tested with the aim of further improving the uniformity of heat flux. It was found that the two-hole method gave results similar to the one-hole extraction.
The extraction method was found to give an improved heat flux distribution over the baseline and purge cases for the initial shutdown period, and could give reduced casing distortion compared to the baseline and purge methods. The extraction method therefore has potential to improve the shutdown performance for both new engine designs and current engines if retrofitted.
Author Contributions
A.P. performed the simulations and analysed the results; S.H. contributed the data used in Figure 6; A.P. wrote the paper and was supervised by B.R.
Funding
This research and APC was funded by Mitsubishi Heavy Industries Ltd.
Acknowledgments
Thanks go to Mitsubishi Heavy Industries Ltd. for sponsoring this work.
Conflicts of Interest
Mitsubishi Heavy Industries as the funding sponsor provided the data used in Figure 6 and the decision to publish the results. They had no direct role in the collection, analyses, or interpretation of the data.
Abbreviations
The following abbreviations are used in this manuscript:
| CFD | Computational Fluid Dynamics |
| HTC | Heat Transfer Coefficient |
References
- Marinescu, G.; Mohr, W.F.; Ehrsam, A.; Ruffino, P.; Sell, M. Experimental Investigation Into Thermal Behavior of Steam Turbine Components—Temperature Measurements with Optical Probes and Natural Cooling Analysis. J. Eng. Gas Turbines Power 2013, 136, 021602. [Google Scholar] [CrossRef]
- Mori, N.; Matsuda, H.; Ishii, Y.; Midori, M. Design and Operation Experience of Combined Cycle Plant Using Gas Turbine Inlet Temperature of 1350 °C—No. 5 Unit of Himeji No. 1 Power Station of the Kansai Electric Power Co., Inc.; Technical Report No. 3; Mitsubishi Heavy Industries, Ltd.: Tokyo, Japan, 1996; Volume 33. [Google Scholar]
- Guo, Y.; Xie, D. Thermal stress and deformation analysis of HP casing during shutdown of CPR1000 nuclear steam turbine. In Proceedings of the ASME Turbo Expo 2017: Turbomachinery Technical Conference and Exposition, Charlotte, NC, USA, 26–30 June 2017; pp. 1–8. [Google Scholar]
- Kuehn, T.H.; Goldstein, R.J. An experimental and theoretical study of natural convection in the annulus between horizontal concentric cylinders. J. Fluid Mech. 1976, 74, 695–719. [Google Scholar] [CrossRef]
- Betts, P.; Bokhari, I. Experiments on turbulent natural convection in an enclosed tall cavity. Int. J. Heat Fluid Flow 2000, 21, 675–683. [Google Scholar] [CrossRef]
- Siebers, D.; Moffatt, R.; Schwind, R. Experimental, variable properties natural convection from a large, vertical, flat surface. J. Heat Transf. 1985, 107, 124–132. [Google Scholar] [CrossRef]
- Tsuji, T.; Nagano, Y. Characteristics of a turbulent natural convection boundary layer along a vertical flat plate. Int. J. Heat Mass Transf. 1988, 31, 1723–1734. [Google Scholar] [CrossRef]
- Smith, E.O.; Neely, A.J. The effect of aircraft integration design on gas turbine shaft thermal bow and the Newkirk effect. In Proceedings of the ASME Turbo Expo 2014: Turbine Technical Conference and Exposition, Düsseldorf, Germany, 16–20 June 2014; pp. 1–12. [Google Scholar]
- Tisarev, A.; Falaleev, S.; Koch, C.; Nagorski, M.; Staudacher, S. Natural Cooling Affecting the Restart of Micro Gas Turbine. In Proceedings of the ASME Turbo Expo 2016: Turbomachinery Technical Conference and Exposition, Seoul, Korea, 13–17 June 2016; pp. 1–10. [Google Scholar]
- Reddy, V.; Selvam, K.; De Prosperis, R. Gas Turbine Shutdown Thermal Analysis and Results Compared With Experimental Data. In Proceedings of the ASME Turbo Expo 2016: Turbomachinery Technical Conference and Exposition, Seoul, Korea, 13–17 June 2016; pp. 1–9. [Google Scholar]
- Selvam, K.; De Prosperis, R.; Vanga, N.R. Transient thermal analysis of gas turbine shut down physics: Normal and forced cooling. In Proceedings of the ASME 2014 International Mechanical Engineering Congress and Exposition, Montreal, QC, Canada, 14–20 November 2014; pp. 1–9. [Google Scholar]
- ANSYS, Inc. ANSYS Fluent User’s Guide, 15th ed.; ANSYS, Inc.: Canonsburg, PA, USA, 2013. [Google Scholar]
- MHPS Industrial Gas Turbine. 2018. Available online: https://www.mhps.com/products/gasturbines/img/index_im02.jpg (accessed on 25 January 2018).
- Holtzman, G.; Hill, R.; Ball, K. Laminar natural convection in isosceles triangular enclosures heated from below and symmetrically cooled from above. J. Heat Transf. 2000, 122, 485–491. [Google Scholar] [CrossRef]
- Yuan, X.; Tavakkoli, F.; Vafai, K. Analysis of natural convection in horizontal concentric annuli of varying inner shape. Numer. Heat Transf. A-Appl. 2015, 68, 1155–1174. [Google Scholar] [CrossRef]
Figure 1.
Cross section of gas turbine casing, modified from [2].
Figure 1.
Cross section of gas turbine casing, modified from [2].

Figure 2.
Schematic showing axial and radial sections of a gas turbine casing.

Figure 3.
Computational domain.

Figure 4.
Cross section of mesh.

Figure 5.
Gas turbine casing rig, modified from [13].
Figure 5.
Gas turbine casing rig, modified from [13].

Figure 6.
Non-dimensionalised temperature profile at sections 1 and 2 in the casing rig . CFD: computational fluid dynamics.
Figure 6.
Non-dimensionalised temperature profile at sections 1 and 2 in the casing rig . CFD: computational fluid dynamics.

Figure 7.
Baseline case, time averaged stream-traces, looking rearward into cavity.

Figure 8.
Baseline case, velocity vectors in section through combustors 16 and 1.

Figure 9.
Baseline case, velocity vectors in axial section C-C.

Figure 10.
Baseline case, outer wall heat flux with surface streamlines.

Figure 11.
Circumferential distribution of axially averaged outer wall heat transfer.

Figure 12.
Baseline case, circumferential distribution of axially averaged outer wall heat flux.

Figure 13.
Schematic of purge and extraction cases.

Figure 14.
Purge case, outer wall heat flux with surface streamlines.

Figure 15.
Velocity vectors in purge case, section between combustors 1 and 16.

Figure 16.
Purge case, time-averaged stream-traces, looking rearward into cavity.

Figure 17.
Circumferential distribution of velocity at the inlet.

Figure 18.
Purge case, iso-surface of Q-criterion at diffuser exit.

Figure 19.
Circumferential distribution of axially averaged outer wall heat flux.

Figure 20.
Extraction case, time-averaged stream-traces, looking rearward into cavity.

Figure 21.
Extraction case, velocity vectors in axial section C-C.

Figure 22.
Extraction case, outer wall heat flux with surface streamlines.

Figure 23.
Two-hole extraction, outer wall heat flux.

Figure 24.
Comparison of heat flux on the cylindrical section of the outer casing.

Figure 25.
Circumferential distribution of axially averaged outer wall heat transfer for baseline and extraction cases.
Figure 25.
Circumferential distribution of axially averaged outer wall heat transfer for baseline and extraction cases.


Table 1.
Mesh independence study.
| Case | Mesh Cell Count | Total Outer Wall Heat Transfer (W) |
|---|---|---|
| Baseline | 4.6 M | 12,045 |
| Refined | 8.8 M | 12,161 |
| Difference | −0.95% |
© 2018 by the authors. Licensee MDPI, Basel, Switzerland. This article is an open access article distributed under the terms and conditions of the Creative Commons Attribution (CC BY-NC-ND) license (https://creativecommons.org/licenses/by-nc-nd/4.0/).
Share and Cite
MDPI and ACS Style
Pilkington, A.; Rosic, B.; Horie, S. Methods for Controlling Gas Turbine Casing Flows During Engine Shutdown. Int. J. Turbomach. Propuls. Power 2018, 3, 17. https://doi.org/10.3390/ijtpp3020017
AMA Style
Pilkington A, Rosic B, Horie S. Methods for Controlling Gas Turbine Casing Flows During Engine Shutdown. International Journal of Turbomachinery, Propulsion and Power. 2018; 3(2):17. https://doi.org/10.3390/ijtpp3020017
Chicago/Turabian StylePilkington, Andrew, Budimir Rosic, and Shigenari Horie. 2018. "Methods for Controlling Gas Turbine Casing Flows During Engine Shutdown" International Journal of Turbomachinery, Propulsion and Power 3, no. 2: 17. https://doi.org/10.3390/ijtpp3020017