Real-Time Information Derivation from Big Sensor Data via Edge Computing

Department of Computer Science, State University of New York at Binghamton, Binghamton, NY 13902, USA
*
Author to whom correspondence should be addressed.
Big Data Cogn. Comput. 2017, 1(1), 5; https://doi.org/10.3390/bdcc1010005
Submission received: 29 September 2017
/
Revised: 9 October 2017
/
Accepted: 12 October 2017
/
Published: 17 October 2017
(This article belongs to the Special Issue Cognitive Services Integrating with Big Data, Clouds and IoT)
Abstract
:In data-intensive real-time applications, e.g., cognitive assistance and mobile health (mHealth), the amount of sensor data is exploding. In these applications, it is desirable to extract value-added information, e.g., mental or physical health conditions, from sensor data streams in real-time rather than overloading users with massive raw data. However, achieving the objective is challenging due to the data volume and complex data analysis tasks with stringent timing constraints. Most existing big data management systems, e.g., Hadoop, are not directly applicable to real-time sensor data analytics, since they are timing agnostic and focus on batch processing of previously stored data that are potentially outdated and subject to I/O overheads. Moreover, embedded sensors and IoT devices lack enough resources to perform sophisticated data analytics. To address the problem, we design a new real-time big data management framework to support periodic in-memory real-time sensor data analytics at the network edge by extending the map-reduce model originated in functional programming, while providing adaptive sensor data transfer to the edge server based on data importance. In this paper, a prototype system is designed and implemented as a proof of concept. In the performance evaluation, it is empirically shown that important sensor data are delivered in a preferred manner and they are analyzed in a timely fashion.
1. Introduction
The Internet of Things (IoT) is emerging fast. The number of IoT devices is expected to exceed 8 billion and 20 billion in 2017 and 2020, respectively [1]. This rapid deployment is due to a number of IoT applications of utmost socio-economic importance, such as cognitive assistance, mobile health (mHealth), and smart transportation. Ideally, it is desirable to extract value-added information from big sensor data in a timely fashion to support real-time IoT applications, such as navigation help for vision-impaired pedestrians wearing IoT devices and real-time detection of an abnormal health conditions of patients with wearable or implanted sensors.
However, achieving this goal faces several challenges: (1) the volume of sensor data is big and increasing rapidly; (2) extracting valuable information from big sensor data requires complex data analysis tasks that are often computationally intensive; and (3) a number of important IoT applications, e.g., cognitive assistance, mHealth, and traffic control, are associated with stringent timing constraints. Typical IoT devices are low-end embedded devices, e.g., sensors and micro-controllers, which lack enough computational resources for real-time sensor data analytics. Although hardware technology is advancing fast, IoT devices are not expected to be provisioned with significantly more resources for cost reasons critical in embedded IoT devices. Although cloud can provide virtually infinite resources, uploading all sensor data to the cloud suffers from the limited upload bandwidth of the Internet, incurring substantial latency. Edge or fog computing is an emerging paradigm to bridge the gap between IoT devices and cloud [2,3]. By supporting compute-intensive tasks at the network edge, edge computing could significantly decrease the latency and mitigate the upload bandwidth bottleneck.
In this paper, we propose an overarching framework for soft real-time sensor data analytics at the network edge that consists of (1) adaptive sensor data transfer from IoT devices to the edge server based on their data importance and (2) periodic in-memory real-time analytics of sensor data in the edge server via real-time scheduling and map-reduce, which is originated in functional programming [4] but not tied to a specific implementation, e.g., Hadoop. MapReduce [5] and Hadoop [6] greatly simplify the development of parallel big data analysis applications. (Even though there is no single definition of big data on which everybody agrees, the notion of five Vs of big data [7]—volume, velocity, variety, veracity, and value—is broadly accepted; that is, the volume, variety, and velocity of data generation are increasing fast. Also, from big data that may involve uncertainties, valuable information needs to be extracted.) A user only has to write serial map() and reduce() functions. The underlying runtime system divides massive data into smaller chunks and schedules map/reduce tasks to process the data chunks in parallel on the user’s behalf. However, they are not readily applicable to real-time sensor data analytics for several reasons. First, they are timing agnostic. As a result, they may miss many deadlines, diminishing the value of the derived information. They only support one-time batch processing of the data at rest stored in the distributed file system. Thus, the data could be outdated. Any information derived late or derived using stale sensor data has little value in real-time sensor data analytics applications, e.g., cognitive assistance, mHealth, traffic control, or location-based services.
Despite the increasing demand for real-time sensor data analytics, related work is relatively scarce. Advanced data stream management systems, e.g., Storm [8], S4 [9], and Spark Streaming [10], support near real-time stream data processing; however, they do not consider explicit deadlines or real-time scheduling to ensure the timeliness of data processing. Even though the problem of meeting deadlines in Hadoop has been investigated [11,12,13,14,15,16,17], they inherit the shortcomings of Hadoop optimized for batch processing of the data in the secondary storage. Further, these systems mainly focus on data analytics in the back-end cloud without considering how to efficiently transfer sensor data to the data analytics system, which is critical in key real-time IoT applications, e.g., cognitive assistance and mHealth. Although packet scheduling and medium access control has been investigated for real-time wireless sensor-actuator networks [18,19], most existing work does not consider data importance for efficient sensor data transfer. To address the problem, we design a new real-time map-reduce framework, called RTMR (Real-Time Map-Reduce), that provide several unique features not readily provided by advanced big data management systems including [5,6,8,9,10,11,12,13,14,15,16,17,20]:
- We support dynamic rate adaptation for the periodic sensor data transfer from IoT devices to the edge server based on the relative data importance provided by different sensors/IoT devices to optimize the total utility, i.e., the sum of the importance values of the sensor data transferred from sensors to the edge server, subject to the total rate upper bound. The proposed transfer rate adaptation scheme is generic in that it can support a different data importance metric depending on a specific real-time sensor data analytics application.
- Using the API (Application Programming Interface) of RTMR, an application developer can write serial map() and reduce() functions for a specific real-time data analysis application, and specify the data analysis task parameters, e.g., the deadlines and periods.
- A non-preemptive periodic real-time task model is supported for periodic real-time analysis of sensor data. Moreover, a schedulability test for the EDF (Earliest Deadline First) scheduling algorithm is provided to support timing constraints considering both the computation and data access delay.
- Several mechanisms for efficient in-memory sensor data analysis are supported. First, sensor data are directly streamed into main memory to let RTMR derive information from them on the fly. Second, intermediate data generated in a map/reduce phase is pipelined straight to the next phase, if any, without being staged in the local disk or distributed file system unlike Hadoop and its variants. Further, memory reservation is supported to ensure enough space is allocated to store the input, intermediate, and output data for each real-time sensor data analysis task.
In addition, we have implemented adaptive wireless transfer of sensor data based on their importance and built an RTMR prototype by extending Phoenix [20], a state-of-the-art open source multicore/multiprocessor map-reduce framework, to support the key RTMR features for real-time data analytics rather than retrofitting Hadoop.
For performance evaluation, we take a stepwise approach. In the first step, we perform a case study modeled after face detection that is a core technology to support, for example, tracking, crowd counting, and face recognition for social interaction assistance. In the case study, a few smartphones are set up to capture different numbers of faces and our adaptive transfer rate allocation scheme is tuned to assign higher importance to the smartphone that captures more faces. We observe that our approach effectively assigns the sensor data transfer rate to the smartphones according to the ground truth (the actual number of faces) to optimize the utility, while meeting the data transfer and analytics deadline. Also, our approach based on data importance enhances the utility by 38% compared to the baseline unaware of data importance.
In the second step, we assume that big sensor data streams are periodically delivered into RTMR in a timely fashion. Given sensor data streams, we evaluate whether RTMR can meet data analytics deadlines by leveraging real-time task scheduling and in-memory map-reduce computing for significantly bigger sensor data than the case study considers. To this end, we generate synthetic periodic workloads using four micro-benchmarks to model real-time data analysis tasks: k-means clustering, linear regression, histogram, and matrix multiplication that can be applied to support, for example, cognitive assistance, mobile user-clustering for location-based services, sensor data value or financial market prediction, and traffic control. Using the benchmarks, we design several real-time data analysis task sets and analyze their schedulability. For the task set with the tightest deadlines, the performance evaluation results empirically verify the schedulability test by showing that all deadlines are actually met. On the other hand, Phoenix used as the baseline fails to do it. Further, for the task set, RTMR processes over 0.72 TB of sensor data in each 1000 s experimental run, which translates to more than 2.59 TB/h and 62 TB/day.
An initial result of this work was published in a conference [21]. This paper significantly extends [21] as follows. We support adaptive sensor data transfer from IoT devices to the edge server, which performs real-time analysis of the sensor data, based on data importance. (In the conference paper [21], data transfer issues were not considered.) We have extended the system architecture to support efficient sensor data transfer as discussed in Section 2. In Section 3, we discuss the notion of data importance and formulate the problem of efficient sensor data transfer as an optimization problem. Further, we propose a lightweight algorithm for efficient sensor data transfer from IoT devices to the real-time edge server and analyze the algorithm in terms of time complexity and optimality. The effectiveness of the adaptive transfer methodology described in Section 3 is empirically verified, via a case study, in Section 5.1. We discuss more related work in Section 1, Section 5, and Section 6. Overall, the paper is substantially reorganized and rewritten to enhance the clarity of the presentation too.
The remainder of this paper is organized as follows. In Section 2, an overview of the RTMR architecture and problem formulation is given. In Section 3, the adaptive transfer rate allocation algorithm based on sensor data importance is discussed. In Section 4, the real-time task model and scheduling for real-time data analytics are described. In Section 5, the performance of our approach is evaluated step by step. Related work is discussed in Section 6. Finally, Section 7 concludes the paper and discusses future work.
2. System Overview
In this section, background for this work and the overall system design are discussed.
2.1. Map-Reduce Basics
In the map-reduce model illustrated in Figure 1, a user only has to write a serial map() and reduce() function, while the underlying runtime executes map() and reduce() functions in parallel on the user’s behalf [4]. In the map phase, the mappers execute the user-specified map() function on different data chunks in parallel. When all mappers complete the processing, the intermediate (key, value) pairs produced by the mappers are processed by one or more reducers in the reduce phase.
In the rest of this section, we describe the overall system structure to support cost-effective data transfer from sensors to the edge server and real-time data analytics in the server that compose the front-end and back-end of RTMR, respectively.
2.2. Overall System Structure
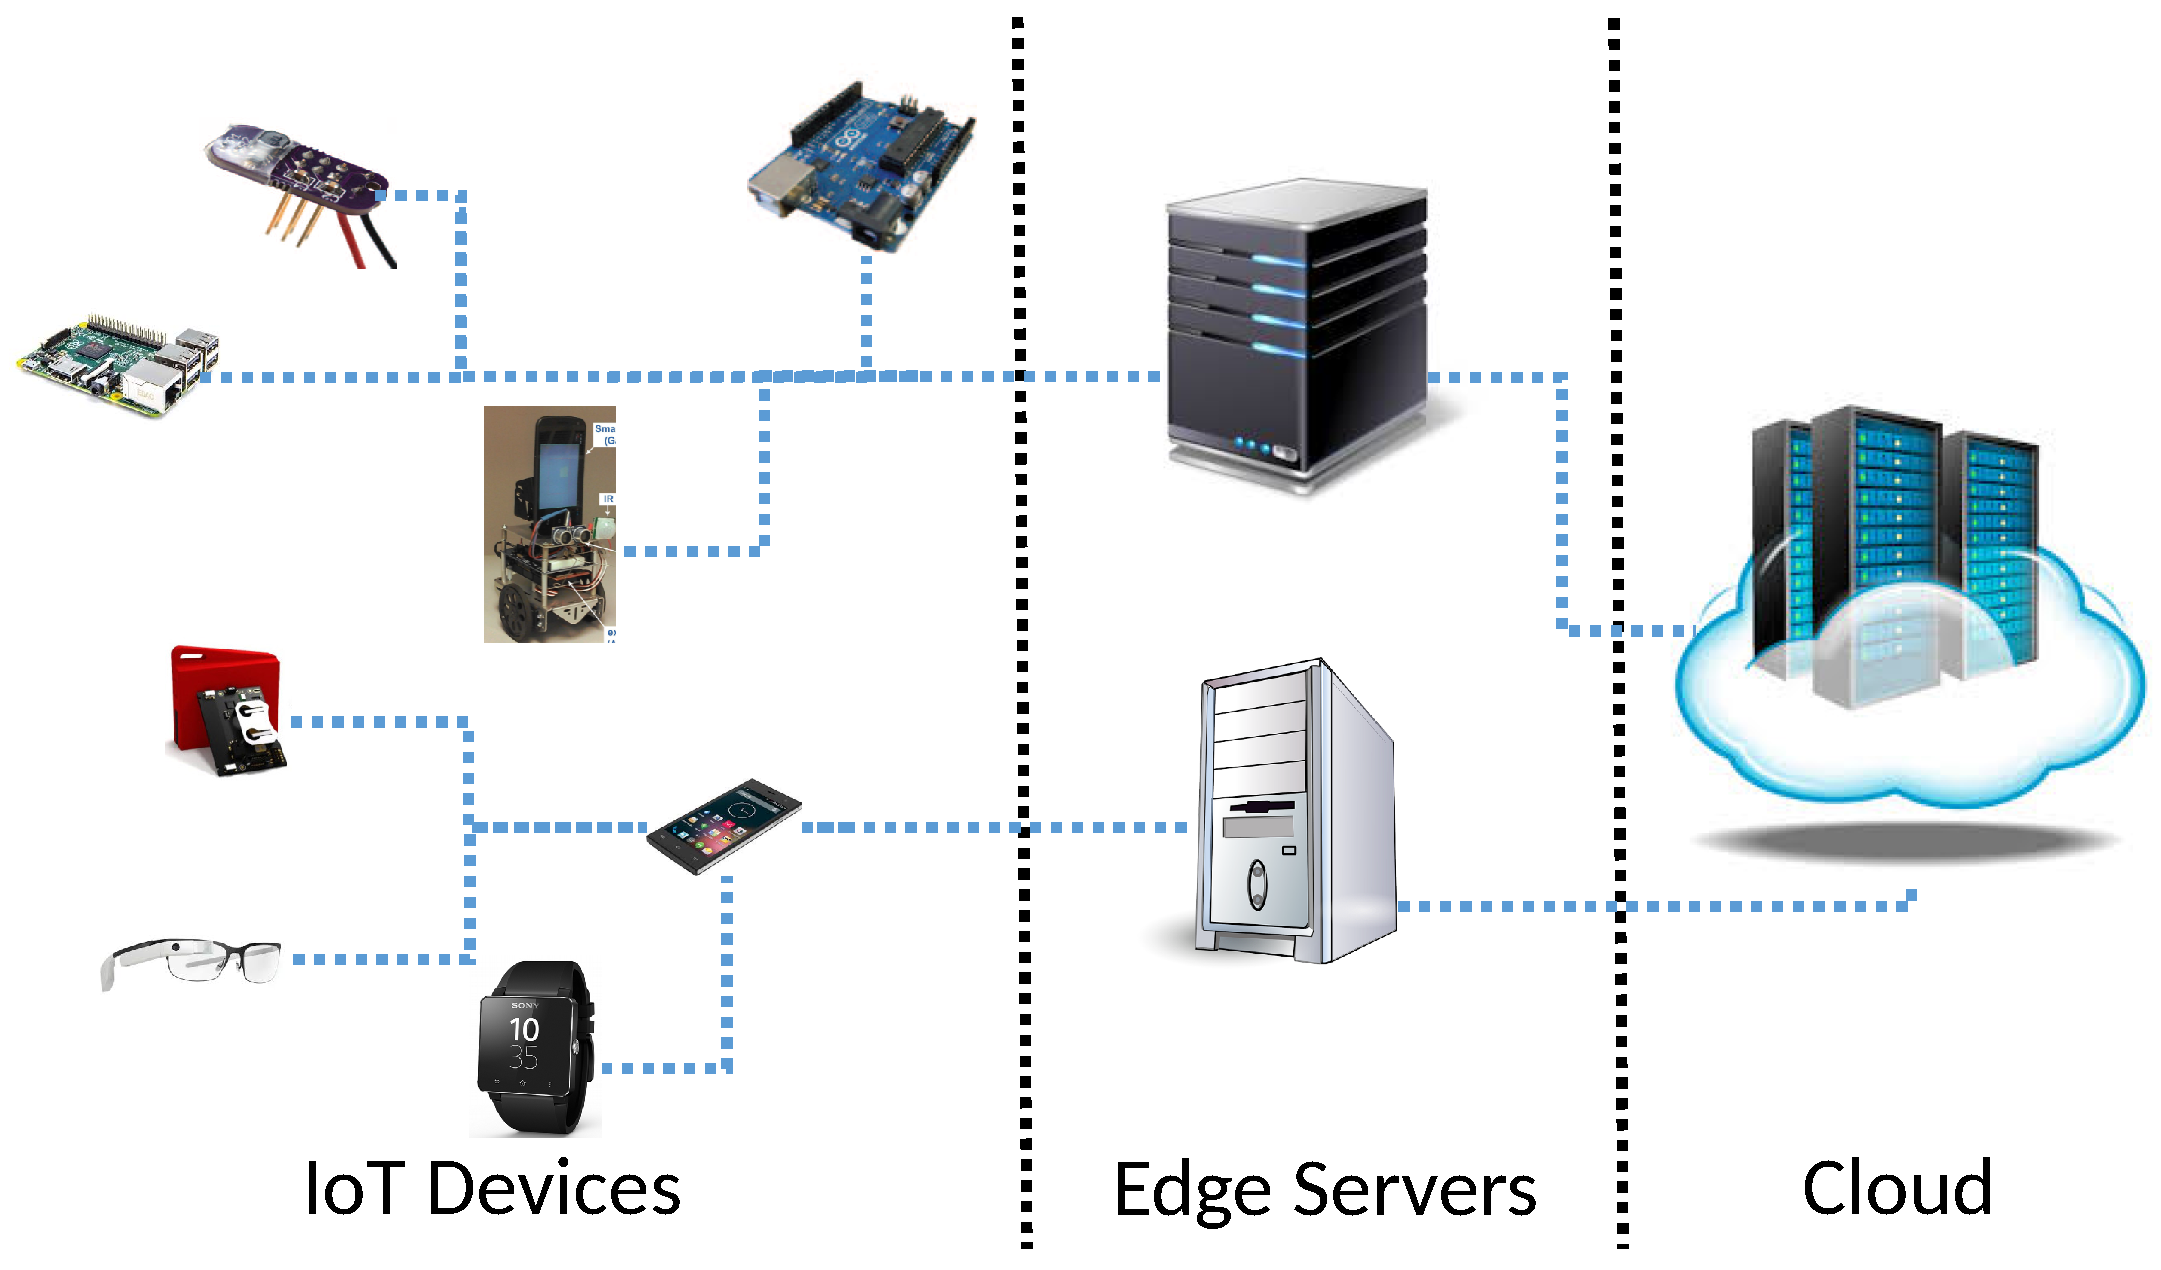
Figure 2 shows the general architecture. In edge/fog computing, an edge server is connected to a wireless access point (AP), such as a WiFi AP or a 5 G femtocell base station, to support time-sensitive tasks at the network edge, while providing less time-critical data service, e.g., long-term data storage and analytics, in the cloud [3,22,23]. In this paper, we focus on cost-effective sensor data transfer from IoT devices to the edge server and real-time data analytics in the server. We assume that each IoT device transfers sensor data periodically to the edge server on which RTMR runs to analyze the sensor data in real-time and assigns appropriate data transfer rates to the IoT devices based on the importance of their sensor data.
2.3. Adaptive Data Transfer Rate Allocation to IoT Devices based on Data Importance
Figure 3 shows the overall structure of the RTMR front-end that supports data transfer rate adaptation from IoT devices to the edge server based on sensor data importance. The Transfer Rate Allocation Manager runs on the RTMR and allocates the transfer rates to the connected IoT devices relying on three components: Device Manager, Data Importance Analyzer, and Rate Selection Engine. The Device Manager manages the embedded IoT devices connected to the RTMR, while controlling devices that join or leave the network. The Data Importance Analyzer analyzes the importance of the data collected from the embedded devices based on data analytics results. The rate selection algorithm running in the Rate Selection Engine dynamically adapts the sensor data transfer rates of the embedded devices based on the data importance information derived by the Data Importance Analyzer and the device information provided by the Device Manager. In each IoT device, the Device Controller consists of the Rate Controller, Application Manager, and Data Pre-processor to transfer sensor data according to the assigned transfer rate, interacts with the application to generate the sensing data based on the given rate, and to pre-process data, e.g., compress data, to reduce the bandwidth usage.
2.4. Real-Time Sensor Data Analytics
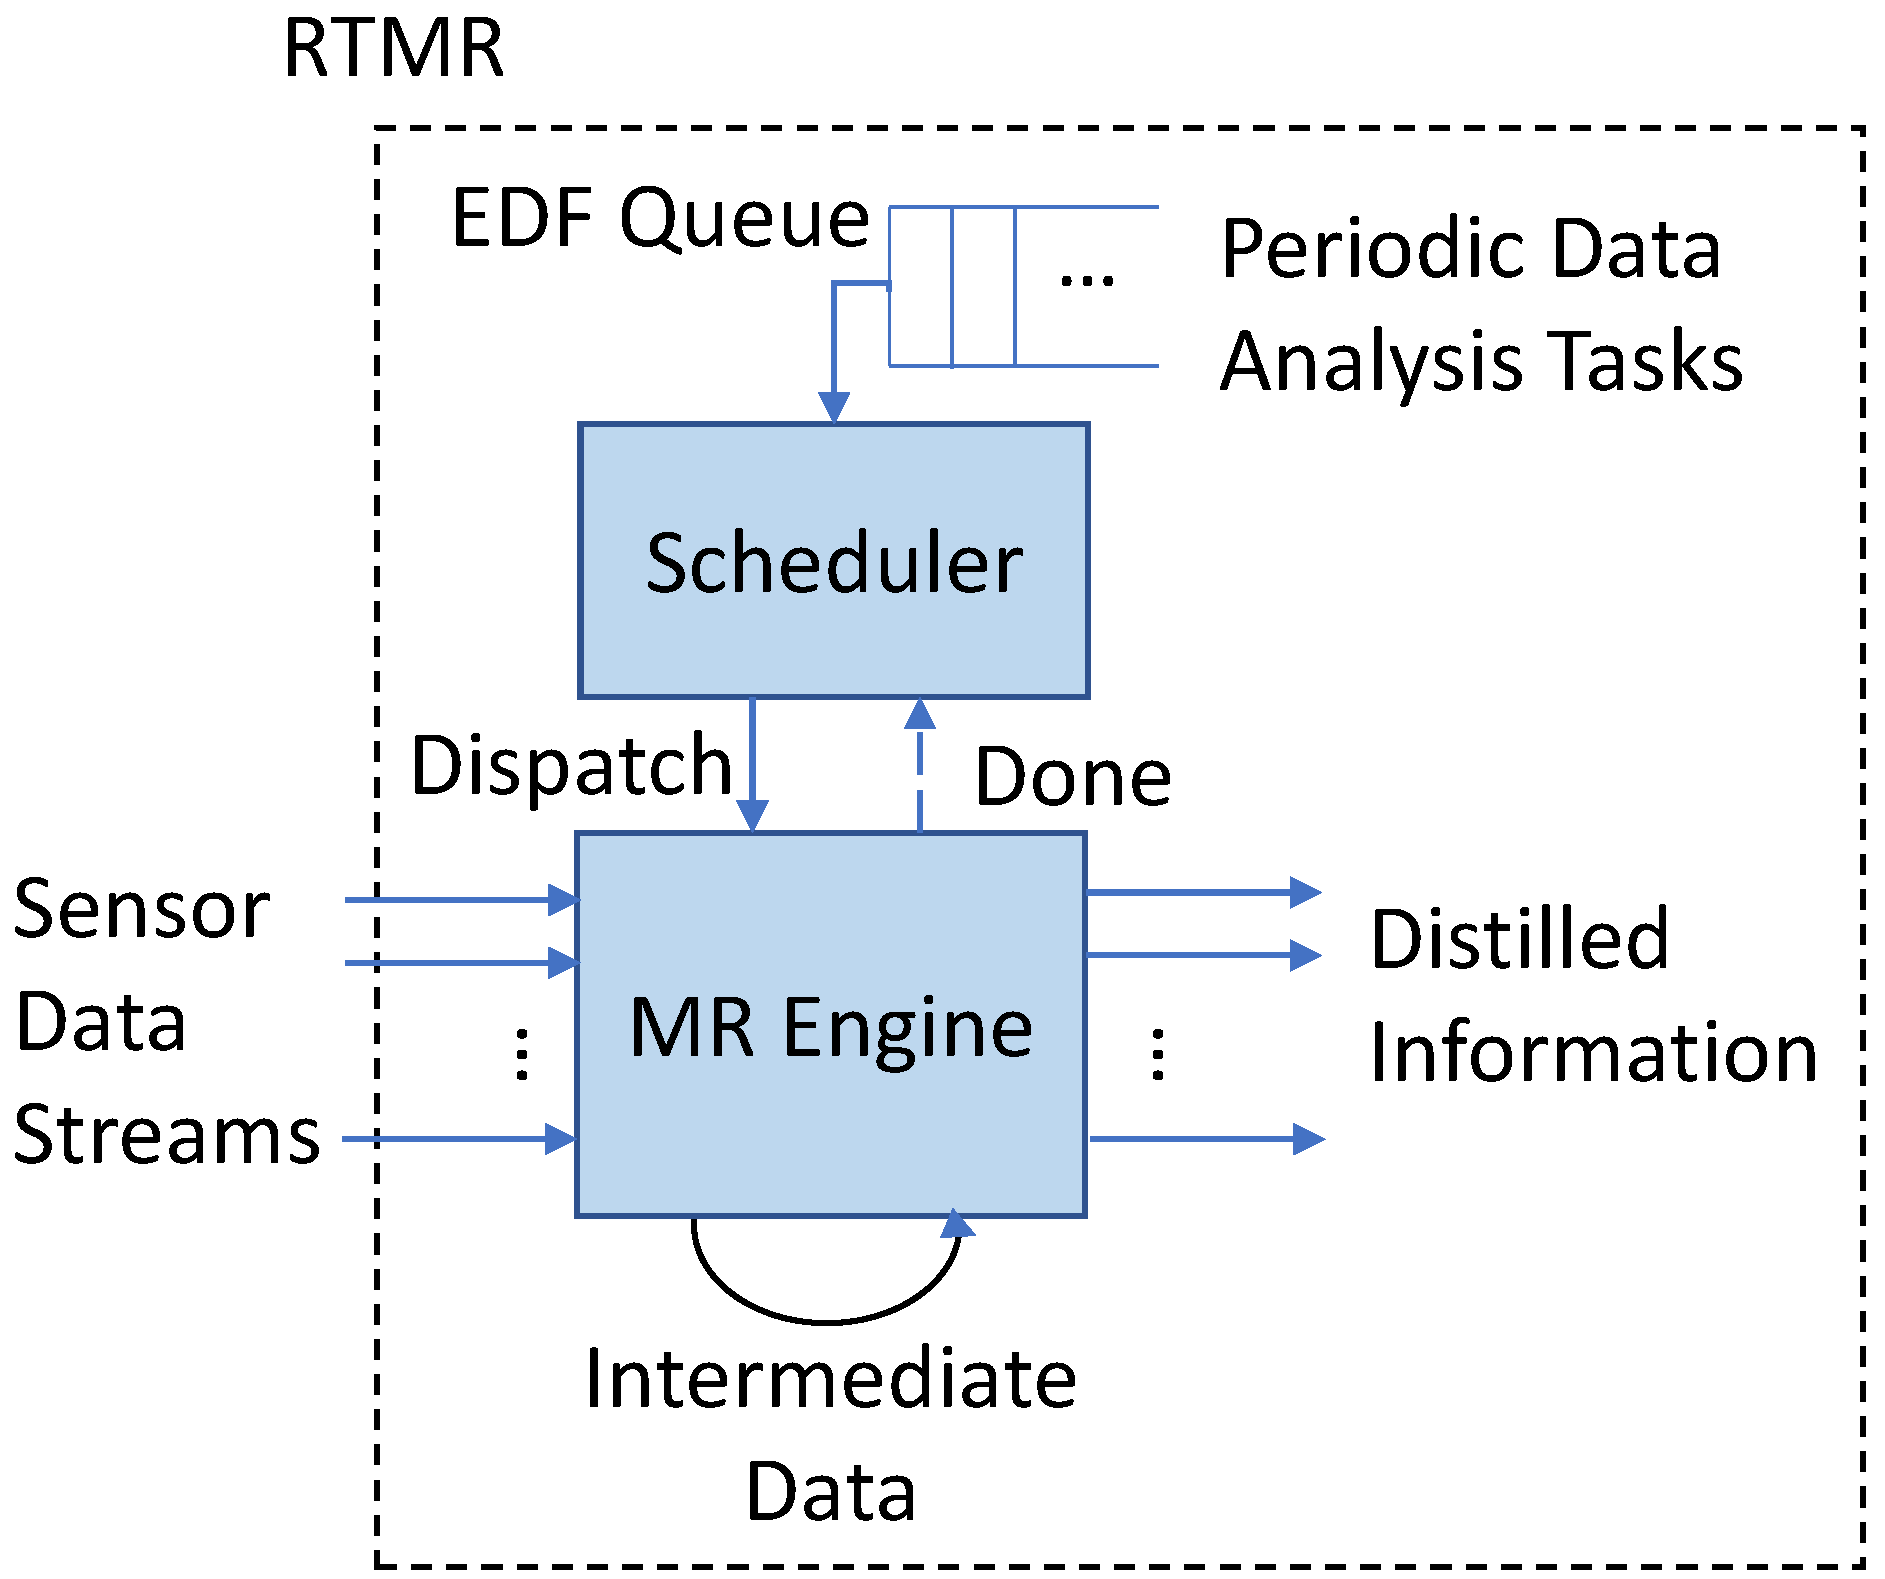
Given real-time sensor data streams from the front-end, the RTMR back-end schedules and executes periodic real-time data analytics tasks to extract information from sensor data as depicted in Figure 4. The periodic instances of the data analysis tasks, called jobs in real-time literature [24], are scheduled via the EDF scheduler. The job dispatched by the scheduler is processed by the map-reduce (MR) engine until the completion without being preempted to avoid large overheads for preemption and context switching in real-time data analytics. Although it is often assumed that the context switch overhead is ignorable in real-time scheduling, this may not be the case for real-time data analytics dealing with big sensor data. As illustrated in Figure 4, sensor data are directly streamed into main memory and intermediate data are pipelined to the next map/reduce phase, if any, until the job is completed. Finally, the derived information is provided to the user(s).
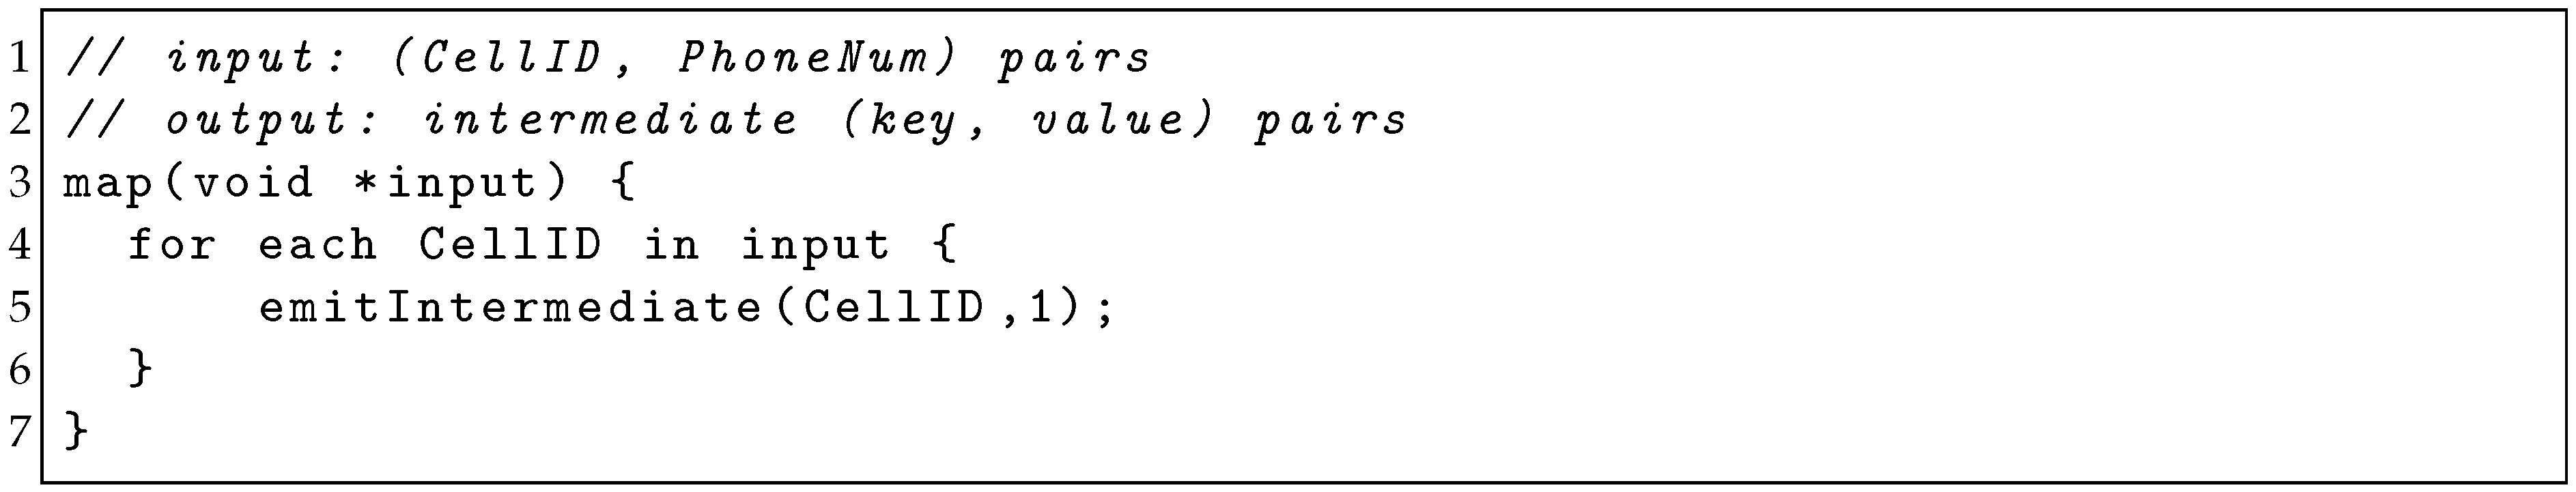
In RTMR, a user has to write two serial functions, map() and reduce(), and specify the period and deadline for each real-time data analysis task. For example, the map and reduce functions in Figure 5 and Figure 6 can be used to periodically monitor the number of the active mobile phones in each cell in a local cellular network as a basis to analyze customers’ mobility and network usage patterns.
Given the user-specified map() and reduce() functions with deadlines and periods, the MR engine of RTMR in Figure 4 that processes real-time sensor data analysis tasks based on the map-reduce model [4] (illustrated in Figure 1). More specifically, the the MR engine processes the earliest deadline job dispatched by the scheduler as follows.
- In RTMR, each input sensor datum is expressed as a (key, value) pair, e.g., (cell ID, phone number) for location-based services, and streamed into memory. The input (key, value) pairs are evenly divided into chunks by the MR engine and assigned to mappers, i.e., worker threads.
- The mappers independently execute the user-specified map() function on different data chunks in parallel. For example, each mapper executes the map() function for cellphone count in Figure 5, producing intermediate (key, value) pairs as a result.
- The map phase is completed when all the mappers finish processing the assigned data chunks. If there is no reduce phase, which is optional, the (key, value) pairs produced by the mappers are returned as the final result and the job is terminated.
- If there is a reduce phase, the intermediate (key, value) pairs produced by the mappers are directly pipelined to one or more reducers and sorted based on their keys. Specifically, the pointers to the intermediate results in memory are passed to the reducers with no expensive data copies.
- The reducers execute the user-defined reduce() function in parallel to produce the final (key, value) pairs by processing the assigned non-overlapping intermediate (key, value) pairs. When all the reducers complete, the final (key, value) pairs are returned and the job is terminated. In an iterative application that consists of multiple pairs of map and reduce phases, the output of the reduce phase is directly pipelined to the map phase of the next iteration by passing the pointers to the data.
In RTMR, all input, intermediate, or final (key, value) pairs are stored in memory unlike MapReduce [5], Hadoop [6], or their variants. Phoenix [20] effectively utilizes the memory hierarchy to process map-reduce tasks in memory using multiple CPU cores. However, it does not support a periodic task model, real-time scheduling, direct streaming of sensor data into memory, or memory reservation. Instead, it only supports FIFO scheduling. Further, it reads input data from and writes output to the disk. RTMR extends Phoenix by supporting: (1) input sensor data streaming; (2) intermediate data pipelining; (3) a non-preemptive periodic task model; (4) memory reservation; and (5) an EDF-based schedulability test and scheduling required for real-time data analytics.
3. Adaptive Rate Allocation
In this section, the notion of data importance is discussed. Based on that, a problem formulation is given. Also, our dynamic rate allocation method is described.
3.1. Data Importance
Due to the variety of real-time wireless sensing and sensor data analytics applications, the data importance concept can be defined in different ways. In this paper, we do not argue any of them is the most appropriate or applicable to all big sensor data analytics in IoT. Instead, we aim to design a generic framework that can dynamically assign wireless bandwidth (data transfer rates) to IoT devices based on a specific data importance metric chosen by an application designer aware of the semantics of a particular IoT application, e.g., cognitive assistance or traffic control.
In this paper, we classify data importance into two categories: (1) application-specific and (2) application-agnostic metrics.
- Application-specific data importance: The relative importance levels of the sensor data sources can be determined using predefined criteria to describe events of interest in a specific application. For example, in visual surveillance, the number of detected human faces or objects of interest (e.g., weapons) can be used as the data importance metric to support crowd counting or tracking. In [25], data related to abnormal events are considered important in an underwater wireless sensor network. Zhag et al. [26] apply the data importance concept to eliminate redundant observations made by multiple surveillance cameras. In [27], visual data in a squash game is analyzed. The frequency of future events, where an event is defined to be the squash ball hitting a specific segment of the walls, is predicted to allocate more bandwidth to the cameras expected to observe more events. Also, in [28], data generating more profits are considered more important and further replicated in a cloud data storage system. Although these approaches leverage the data importance concept, none of them leverages edge computing to mitigate the challenges for real-time sensor data analytics critical in the emerging IoT era. To bridge the gap, RTMR running on the edge server dynamically allocates data transfer rates to IoT devices based on data importance, while scheduling real-time data analytics tasks to meet their timing constraints at the edge.
- Application-agnostic data importance: The data similarity concept [25,29] is not tied to a specific application. In general, consecutive sensor data, e.g., temperature/pressure readings or surveillance images, might be similar. Usually, a data similarity check is inexpensive in terms of computation; therefore, an IoT device can perform it for itself and transfers the data only if the difference between the current and previous data is more than a specified threshold, e.g., 5%. In addition, Hu et al. [30] propose a novel method, called offload shaping, to allow an IoT device to drop blurry images, i.e., low quality data, via some additional cheap computation. Other metrics, e.g., image resolution or sensor calibration, could be used to estimate the sensor data quality and importance accordingly.
Notably, these data importance metrics are generic and can be utilized to enhance the effectiveness of sensor data transfer in several ways: (1) higher transfer rates can be assigned to the sensor data sources providing important data, e.g., sensor data indicating abnormal health conditions or images with many human faces. In this way, important events, e.g., abnormal health conditions of sensor wearers, can be tracked more closely subject to the total available bandwidth bound; (2) less important data, e.g., blurry images or sensor data similar to the previous readings, can be simply dropped to reduce the bandwidth consumption; or (3) a hybrid approach can drop unimportant sensor data and reassign unused fraction of the total available rate to the other sensor data sources providing more important data. In Section 5.1, we consider the first approach for the clarity of the presentation. A thorough investigation of the second and third approaches is reserved for future work.
3.2. Problem Formulation
In this paper, the total utility is defined to be the inner product between the sensor data transfer rates and data importance levels provided to the edge server by the IoT devices. Suppose that n embedded IoT devices periodically transfer sensor data to the edge server. When the transfer rate of embedded device is (the number of data objects transferred per unit time) and the importance of the data provided by is , the total system-wide utility for sensor data transfer and analytics is:
where , , and · is the inner product between the two vectors.
As the importance of data transferred from to the edge server may vary in time, the edge server computes the smoothed importance of data provided by by taking the exponentially weighted moving average (EWMA) as follows. (Alternatively, itself can compute the importance depending on the computational complexity as discussed before. In that case, it can piggyback the importance information to the data transferred to the edge server.)
where is the smoothed importance value, is the importance of the data object of , and is the exponential forgetting factor such that .
In this paper, we use the EWMA because the future importance of sensor data can be affected by the importance of the current data. For example, suppose that sensors worn by a person indicate an abnormal health condition at a point in time. This condition may continue in time although it may gradually disappear due to a treatment or natural self-recovery. In such applications, an EWMA can gracefully represent the data importance varying in time. A system administrator aware of application semantics can easily set the value, i.e., the forgetting factor, in (2) to specify the impact of the previous data values provided by sensor i on the sensor’s importance. For example, she can set to ensure that the impact of is less than 3% after three sensing periods by recursively solving (2). However, if the importance of only the current data is relevant in a certain application, a system administrator can simply set in (2).
Given (1), our objective is to maximize u subject to:
where is the current sensor data transfer rate of ; that is, transfers sensor data objects per second to the edge server, and is the maximum transfer rate that can be supported by . is the minimum transfer rate of sensor data, e.g., ECG data or camera images. R in (4) is the upper bound of the total data transfer rate from all IoT devices to the edge server. For example, R can be determined by the cellular data plan or the minimum of the available wireless bandwidth and the total data transfer rate reserved for real-time data analytics at the network edge. in (5) represents the E2E latency in the network edge, i.e., the sum of the latency for the sensor data transfer from to the edge server and that for the data analytics in the server. Further, D is the E2E deadline for the data transfer and analytics.
In fact, our utility optimization problem can be solved via integer linear programming (ILP). However, we do not take the approach, since solving the ILP problem may take exponential time in the worst case. Instead, we propose a cost-effective algorithm with linear time complicity in terms of the number of IoT devices in the next subsection.
3.3. Dynamic Transfer Rate Allocation
In our algorithm for adaptive transfer rate allocation summarized in Algorithm 1, for () is adjusted at each control period in proportion to the relative importance of the sensor data stream provided by , if necessary, to optimize the total utility of the system. At the control period, the Rate Selection Engine in Figure 3 initially computes the new rate for based on ’s relative data importance:
| Algorithm 1: Dynamic Transfer Rate Allocation at the Control Period |
 |
It then adjusts , if necessary, to ensure that :
After this step, it evenly divides any unused fraction of R to every node subject to the constraint that . Therefore, our dynamic rate allocation method (1) adjusts the transfer rate of each embedded device in proportion to the importance of the sensor data stream provided by the device and (2) utilizes R as fully as possible subject to the constraints specified in (3)–(5).
The time complexity of Algorithm 1 is O(n) for n IoT devices. Note that our algorithm is lightweight in that the lower bound of rate allocation to n devices is . Also, it takes the edge server less than 20 s to run our rate adaptation algorithm in the commodity desktop PC used as a relatively low-end edge server in our case study. (The system configuration is described in Section 5). Further, Algorithm 1 is optimal in terms of the total utility defined in (1).
Theorem 1.
Theorem 1. The utility defined in (1) is maximized when the rate of is assigned in proportion to where .
Proof.
According to Cauchy-Schwarz inequality [31], the absolute value of the utility . and , since in this paper. Cauchy-Schwarz inequality also states that is maximized; that is, only when where c is a constant, which is achieved in Algorithm 1 by assigning the transfer rate of in proportion to . Therefore, Algorithm 1 can optimize the total utility on the condition that data importance prediction based on history via (2) is accurate. ☐
4. Real-Time Task Model and Scheduling
In this section, the task model, memory reservation, and scheduling supported by RTMR are discussed.
4.1. Task Model and Memory Reservation
In this paper, we assume that a real-time sensor data analysis system needs to execute a set of n independent periodic map-reduce tasks that are not self-suspending. In the system, there are cores available for real-time data analytics. In this paper, an arbitrary real-time map-reduce task is associated with the period and relative deadline (implicit deadline). If a job of , i.e., a periodic instance of , is released at time t, its absolute deadline by which the job should complete is .
is a real-time data analysis task that consists of () parallel execution segments, i.e., map/reduce phases, defined as follows:
where = 1, if only consists of a map phase. = 2, if it has both map and reduce phases. if it consists of multiple pairs of parallel map and reduce phases iteratively executed in sequence. In addition, and are the estimated maximum execution time of segment j and the number of cores used in the segment, respectively. The (estimated) maximum execution time of is: .
Using the API of RTMR, a user needs to specify the map() and reduce() functions as well as and in Section 4.1 for considering the application semantics. For the clarity of presentation, we assume that the data partitioning and shuffle steps in Figure 1 are included in the map and reduce phases, respectively. Also, their latencies are added to the execution times of the map and reduce phases.
In RTMR, is estimated offline considering not only the CPU time but also the memory access delay, because the data access delay may not be ignorable in real-time data analytics. In this paper, is run multiple times offline. For each run of , the latency from reading the first input (key, value) pair to producing the last output (key, value) pair is used as the estimated execution time to consider both the computation and data access latency. The maximum observed execution time acquired from the prespecified number of runs is used as . In general, the analysis of worst-case execution times in a multicore processor is an open problem. Analyzing the execution times of real-time data analysis tasks is even more challenging due to the increasing size and volatility of sensor data. A thorough investigation of more advanced approaches to analyze the execution times of real-time data analysis tasks is reserved for future work.
In RTMR, input sensor data are streamed into memory as discussed before. Further, we assume that the size of input sensor data is predetermined. At the end of a segment, produces intermediate data that is input for the next segment executed consecutively. If there is no following segment, they are the final output of a job of . Given that, RTMR analyzes the maximum intermediate/output data sizes and reserves enough memory for , which typically consists of a few common operations, such as filtering, aggregation, or prediction of physical phenomena (e.g., the traffic speed in a road segment). If unimportant input data are filtered out or sensor data are aggregated in a phase, the size of the output or intermediate data produced at the end of the phase is not bigger than the input. Prediction via, for example, linear (or nonlinear) regression usually produces a small predefined number of model parameters considerably smaller than the input. Even when a join, one of the most expensive operator for data processing, is performed between a pair of input sensor data of sizes N and M, the maximum output size is limited to in the worst-case. Also, N and M are relatively small compared to data sizes considered in batch data analysis systems, e.g., Hadoop, because only the current sensor data are processed per period for real-time data analytics in RTMR.
4.2. Schedulability Test
In the segment of , where , threads are used to run the user-specified map() or reduce() function of in a parallel segment depending on whether is currently in the map or reduce phase. In this paper, each core runs a single map or reduce thread at a time. However, threads run in parallel in the segment, following the data-parallel, single-instruction-multiple-data (SIMD) model. In parallel real-time data analytics, there is a trade-off between data and task parallelism. If more cores are used by an individual task to process more data simultaneously in a SIMD manner, fewer tasks can run in parallel or vice versa. As scheduling in multiprocessor real-time systems is NP-hard in the strong sense [32], we devise a heuristic to schedule real-time data analysis tasks in this paper. More specifically, we intend to maximize the data parallelism subject to the available hardware parallelism by setting for , where m is the total number of the cores available for real-time data analytics in the system. In this way, we finish a job of a real-time data analysis task as early as possible, while avoiding context switches due to preemptions.
In this paper, we apply non-preemptive uniprocessor EDF scheduling to meet timing constraints of real-time data analysis tasks using the schedulability test for non-preemptive periodic tasks with no idle time insertion [33], because m cores are used as if they are a faster uniprocessor for data and compute intensive real-time data analytics. Specifically, the task set is schedulable, if the two following necessary and sufficient conditions are met:
Condition 1.
Condition 2.
, ; , :
Condition 1 requires the processor is not overloaded. In Condition 2, the tasks in are sorted in non-descending order of periods. The right hand side of the inequality in Condition 2 is a least upper bound on the processor demand realizable in an interval of length L that starts when ’s job is scheduled and ends sometime before the deadline of the job. The two conditions are unrelated in that conceiving of both schedulable task sets with the total utilization of 1 and unschedulable task sets having arbitrarily small utilization are possible [33].
If is schedulable subject to (8) and (9), and the memory constraint, RTMR schedules the periodic data analysis tasks. Otherwise, it provides feedback to the user so that the user can adjust the task parameters, such as the task periods, or provide faster map() and reduce() functions that may produce approximate results. After an adjustment, the schedulability test is repeated for the modified task set.
We acknowledge that alternative scheduling methods could be applicable. For example, the average execution times rather than the maximum ones can be used, if occasional deadline misses are acceptable to a certain degree. can use fewer than m cores such that more than one tasks can run together, similar to [34,35], if the maximum memory access delay and contention for shared resources, e.g., the system bus and memory controller, between concurrent data analysis tasks can be quantified in terms of timing. In a many-core system, the real-time data analysis tasks can be partitioned into multiple sets of the cores using a bin-packing heuristic [32]. In each partition, the tasks statically assigned to the partition can be scheduled using the method described in this paper. However, partitioned scheduling of real-time data analysis tasks is challenging, since bin-packing is NP-complete. A thorough investigation of these issues is beyond the scope of this paper and reserved for future work.
5. Performance Evaluation
In this section, we implement a prototype RTMR system and evaluate the performance in a stepwise manner. We evaluate the performance of (1) the dynamic transfer rate allocation algorithm based on sensor data importance and (2) the timeliness of real-time data analytics tasks.
5.1. Cost-Effective Rate Allocation to IoT Devices
In this subsection, we implement and evaluate our dynamic service rate allocation algorithm (Algorithm 1) using several smartphones and a desktop PC equipped with a quad core Intel processor i7-4790 (3.6 GHz) and 16 GB main memory to emulate a low-end edge server specialized for image processing [36] to demonstrate the real-world applicability of our system. To evaluate the E2E timeliness on different devices, we use 5 different smartphones: Huawei Honor 6, Galaxy S6, LG G3, Google Nexus 6, and Google Nexus 3 that transfer images to the edge server across busecure [37], which is the public WiFi network on our campus with the nominal bandwidth of 144 Mbps. We have no privilege to reserve any channel or bandwidth, since busecure is the public WiFi network on our campus. Thus, providing any hard or soft real-time guarantee is impossible. Instead, we focus on optimizing the utility for sensor data transfer and analytics.
In this experiment, we set fps (frames per second), fps, and fps. None of the smartphone we used can support more than 5 fps to take pictures and compress and transmit them. The control period for transfer rate adaptation is set to 10 s. All the smartphones transfer images to the edge server for 2 min. The image resolution is 720 × 486. (The image resolution instead of the transfer rate could be adjusted to enhance the total utility subject to our constraints specified in (3)–(5). This is reserved for future work.) The size of each image ranges between 4.9−10.2 KB after JPEG compression. The average face detection accuracy is 97.3%. Although our approach is not limited to a specific sensing and analytics application, we consider face detection as a case study. In that context, is defined to be the number of human faces detected in the sensor data stream provided by embedded IoT device . In this subsection, the E2E deadline for sensor data (i.e., image) transfer and analytics (i.e., face detection in this case study) is set to 100 ms.
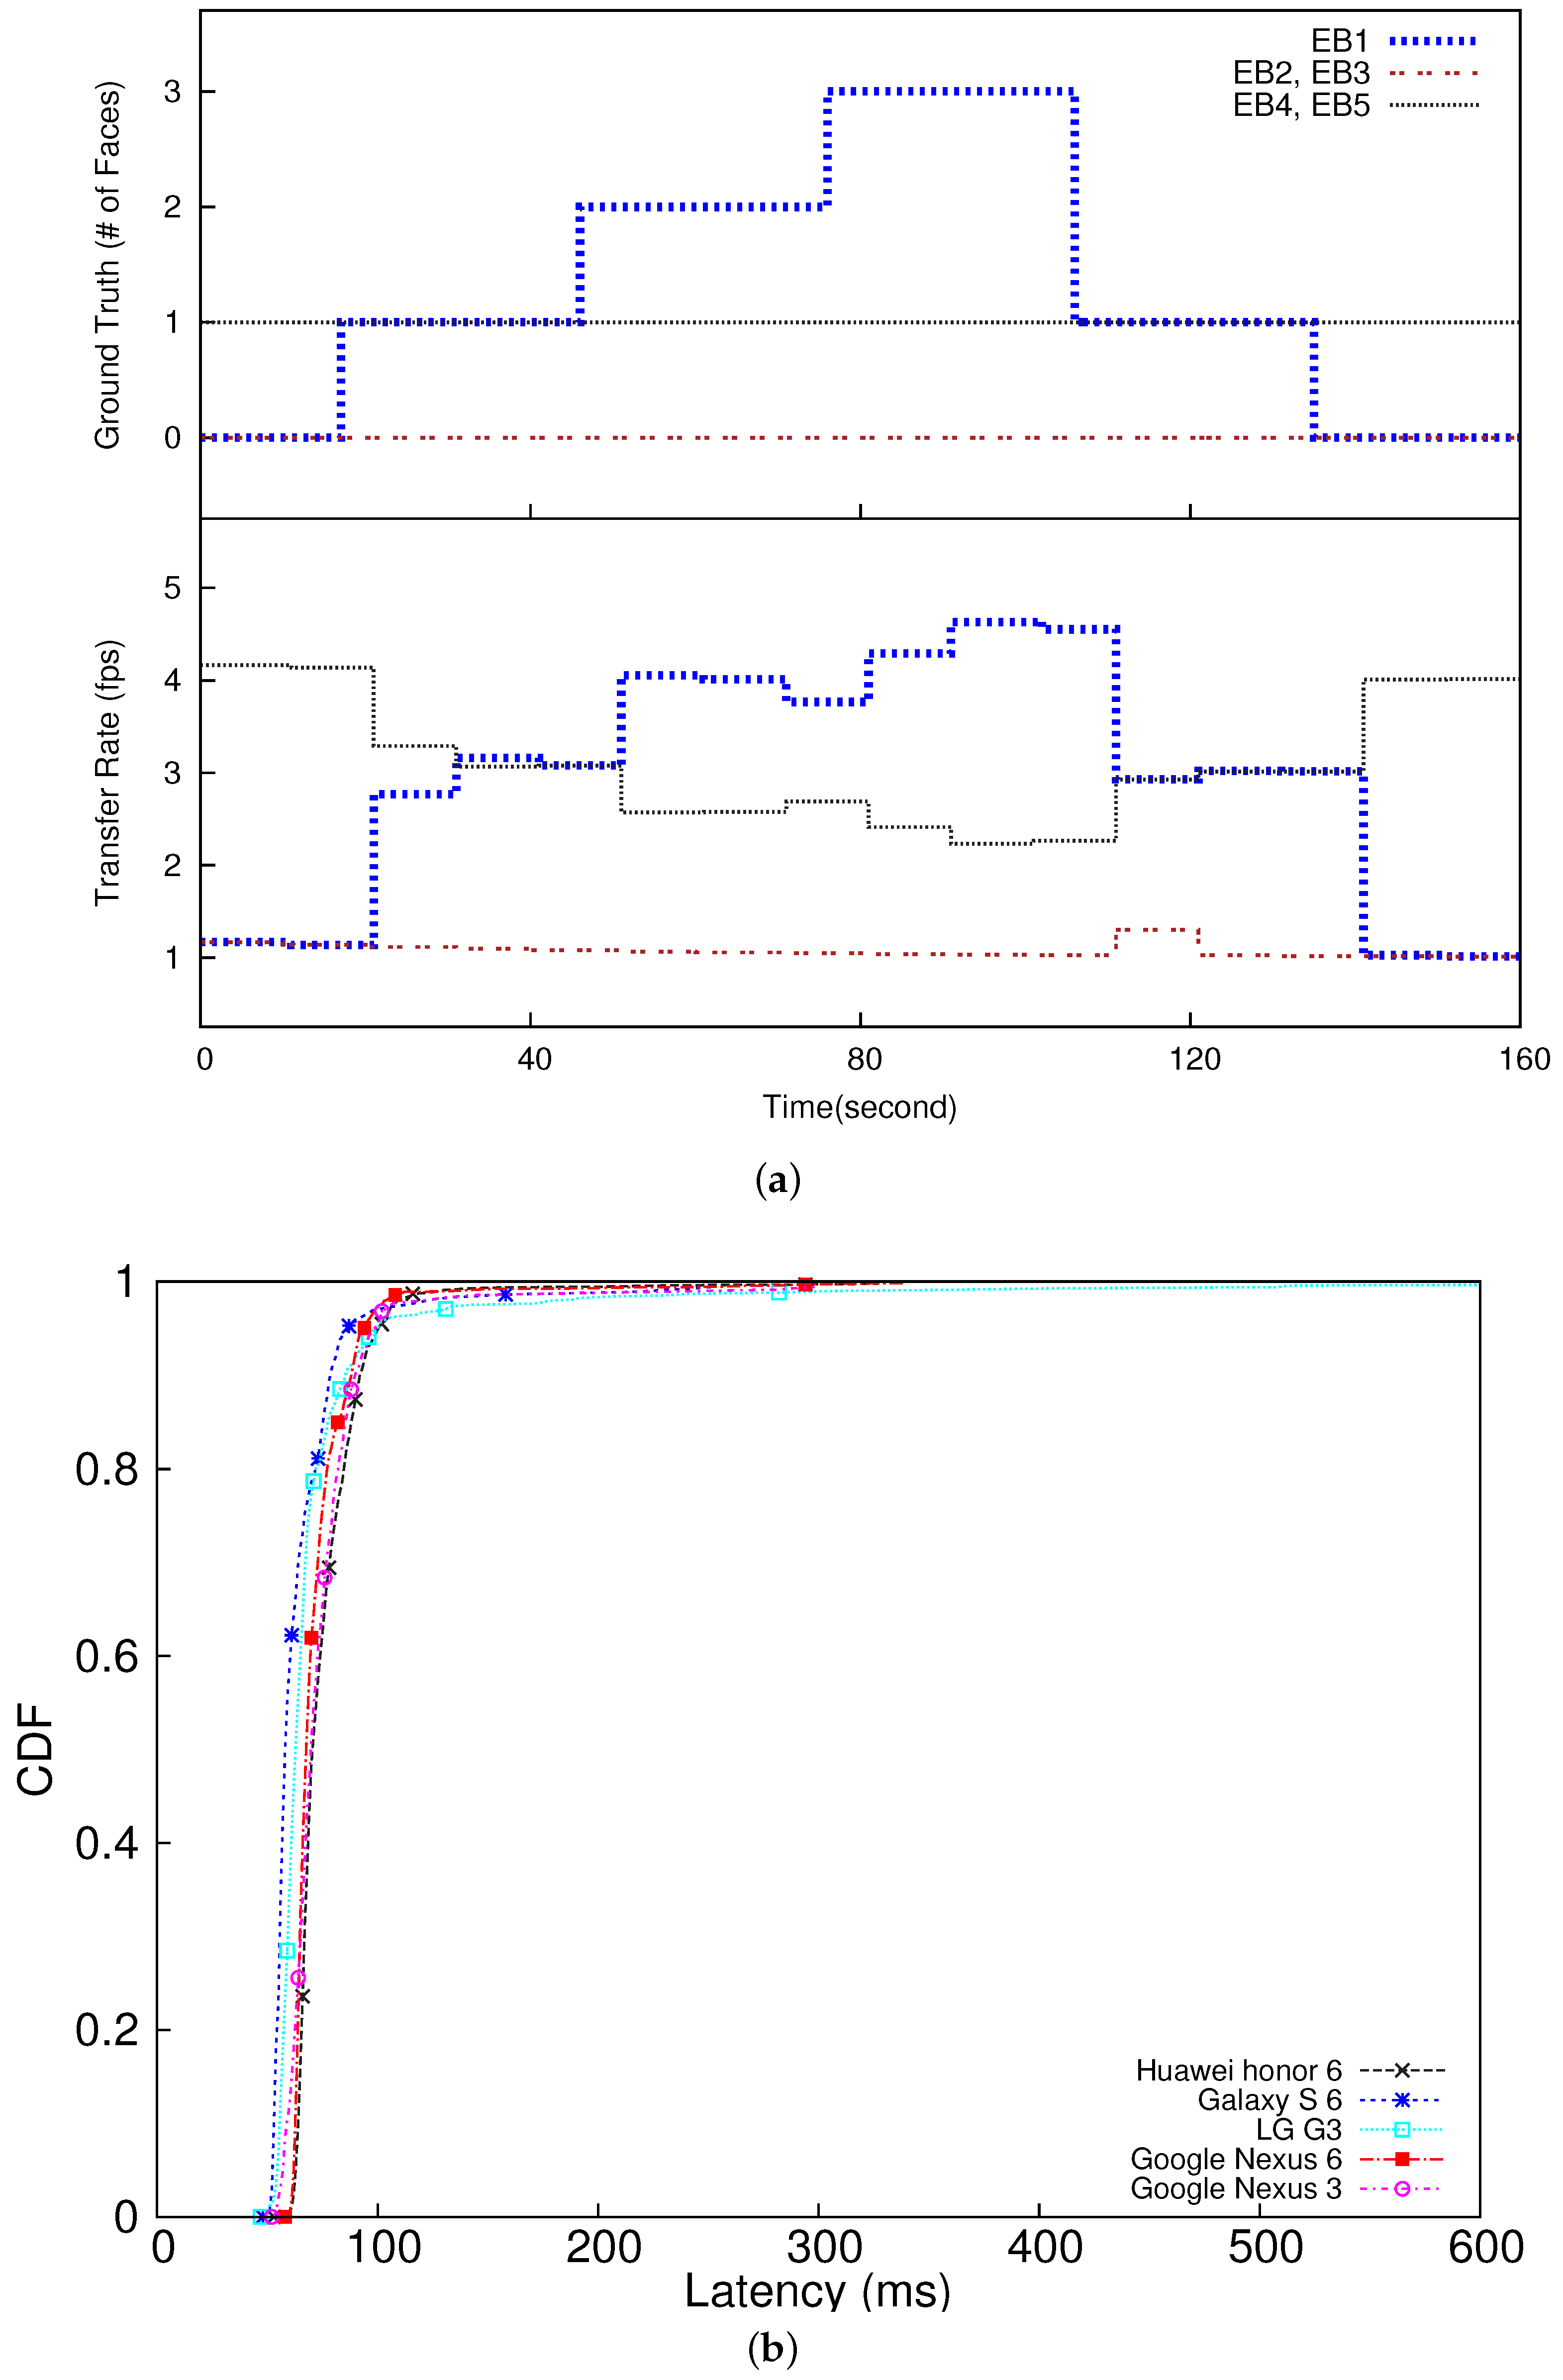
To verify the feasibility of dynamic rate adaptation based on data importance, we have created an experimental scenario such that each camera captures a certain number of faces in certain time intervals as depicted in the upper half of Figure 7a. As shown in the lower half of Figure 7a, the transfer rates of the embedded devices (smartphones) are dynamically adapted in proportion to their data importance values (the numbers of detected faces) effectively tracking the changes in the ground truth. Initially, embedded devices 4 and 5 (EB4 and EB5 in the figure) are assigned the highest transfer rate, because each of them is configured to continuously take one face throughout the 2 min experiment. On the other hand, the other devices detect no face at the beginning. However, the rate of EB4 and EB5 is reduced as the edge server detects an increasing number of faces in the image stream provided by EB1, and accordingly increases EB1’s rate. The rate of EB4 and EB5 is increased again as EB1 detects fewer faces later in the experiment. Therefore, from Figure 7, we observe that our rate allocation effectively reflects the data importance changes by dynamically adapting the transfer rates assigned to the embedded IoT devices in proportion to their relative data importance to optimize the utility. In this case study, our approach enhances the utility, i.e., the total number of faces delivered to the edge server, by 38% compared to the baseline approach unaware of data importance and assigns the same transfer rate to all the smartphones, which is the de facto standard in visual surveillance [38,39].
In this case study, the 95 percentile E2E latency of the slowest smartphone is 100 ms (equal to the E2E deadline) as plotted in Figure 7 and summarized in Table 1. The network latency ranges between 14 –36 ms. The rest of the latency is caused by real-time data analytics. Separate from the performance results in Figure 7 and Table 1, we have also executed the face detection task 100 times on the fastest smartphone that we have (Galaxy S6) without offloading the task to the edge server, in which we have found the 95 percentile latency is 309 ms. Based on this result and Table 1, we observe that our approach leveraging the edge server decreases the 95 percentile E2E latency by 3.09x−3.59x compared to another baseline, in which each smartphone performs data analytics on its own with no offloading. In fact, a majority of IoT devices could be much less powerful than smartphones. Also, real-time data analytics may need to deal with bigger sensor data and more complex data analysis; therefore, embedded IoT devices may suffer from considerably longer latency, if compute-intensive tasks are executed on them. These observations further motivate real-time data analytics in the edge server.
5.2. Scheduling Real-Time Data Analysis Tasks
In this subsection, we assume that sensor data are efficiently delivered to RTMR at the network edge. (For example, our approach based on data importance can be integrated with the emerging 5 G or Gbps WiFi technology that significantly decreases the latency, enhancing the throughput.) In fact, it is possible to configure a real-time data analytics system such that a relatively low-end edge server handles specific tasks, e.g., face detection, within short deadlines, while a more powerful edge server performs more comprehensive, in-depth data analytics. (Efficient partitioning of real-time data analytics tasks among IoT devices and edge servers is beyond the scope of this paper. An in-depth research is reserved for future work.) Therefore, we evaluate the real-time performance of RTMR by running benchmarks associated with timing constraints for much bigger input sensor data than those used in Section 5.1.
For performance evaluation, the following popular data analytics benchmarks [20] are adapted to model periodic real-time data analysis tasks.
- Histogram (HG): A histogram is a fundamental method for a graphical representation of any data distribution. In this paper, we consider image histograms that plot the number of pixels for each tonal value to support fundamental analysis in data-intensive real-time applications, e.g., cognitive assistance, traffic control, or visual surveillance. (HG is not limited to image data but generally applicable to the other types of data, e.g., sensor readings.) The input of this periodic task is a large image with pixels per task period. The input data size processed per period is approximately 1.4 GB.
- Linear Regression (LR): Linear regression is useful for real-time data analytics. For example, it can be applied to predict sensor data values via time series analysis. In LR, points in two dimensional space, totaling 518 MB, are used as the input per task period to model the approximately linear relation between x and y via LR.
- Matrix Multiplication (MM): MM is heavily used in various big data and IoT applications, such as cognitive assistance, autonomous driving, and scientific applications. In this paper, MM multiplies two matrices together per task period. Each input matrix is 16 MB. The output matrix is 16 MB too.
- K-means clustering (KM): This is an important data mining algorithm for clustering. For example, it can be used to cluster mobile users based on their locations for real-time location-based services. It partitions ℓ observations into k clusters (usually ) such that each observation belongs to the cluster with the nearest mean. The input of the k-means task is points in two dimensional space, totaling 77 MB, per task period.
In this paper, we generate new data per period to maximize the workload to stress-test RTMR under a worst-case setting. In fact, some histograms and sub-matrices may not change between two consecutive periods when, for example, only part of images used for cognitive assistance or autonomous driving changes. Also, linear regression and k-means clustering can be performed incrementally between consecutive periods. We take this approach, since it is required to design a real-time scheduling framework considering a worst-case scenario to support the predictability [24]. In the future, we could use, for example, average execution times for a probabilistic assurance of timeliness. However, this is a complex issue and beyond the scope of this paper. It is reserved as a future work.
All the benchmarks are reductive; that is, the size of the intermediate/output data of all the benchmarks is not bigger than that of the input data. Among the tested benchmarks, only KM consists of more than one pair of map-reduce phases. Specifically, it is implemented as a series of seven pairs of iterative map and reduce phases. However, it generates no additional intermediate/output data; it only finds new k means and updates the cluster membership of each point according to the new means in each pair of the map and reduce phases. For the tested benchmarks, enough memory is reserved as discussed in Section 4.
Our system used for performance evaluation of RTMR is a Linux machine with two AMD Opteron 6272 processors, each of which has 16 cores running at 2.1 GHz. There is a 48 KB L1 cache and 1 MB L2 cache per core. In addition, there is a 16 MB L3 cache shared among the cores. Out of the 32 cores, one core is dedicated to the real-time scheduler and another core is exclusively used to generate periodic jobs of the real-time data analysis tasks. The remaining 30 cores are used to process the generated real-time data analysis jobs. The system has 32 GB memory.
Using the micro-benchmarks, we profile the maximum (observed) execution times of the tested benchmarks including the computation and data access latency, perform the schedulability analysis of real-time data management tasks offline based on the maximum execution times, and empirically verify whether the deadlines can be met for several sets of real-time data analysis tasks generated using the micro-benchmarks. Specifically, one benchmark is run 20 times offline using randomly generated data. The maximum latency among the 20 runs is used for the schedulability test.
Table 2 shows the maximum execution times of the benchmarks derived offline. As the number of cores to process real-time data analysis tasks, m, is increased from 1 to 30, the maximum execution times of the HG, LR, MM, and KM are decreased by over 12, 4.1, 17.7, and 4.3 times, respectively. In HG and MM, load balancing among the cores is straightforward. As a result, the maximum execution time is decreased significantly for the increasing number of the cores used for real-time data analytics. Notably, LR’s maximum execution time in Table 2 decreases substantially only after . For , the hardware parallelism provided by the employed CPU cores is not enough to considerably speed up LR. On the other hand, the decrease of KM’s maximum execution time in Table 2 becomes marginal when . In KM, individual points are often re-clustered and moved among different clusters until clustering is optimized in terms of the distance of each point to the closest mean. Thus, the cluster sizes may vary dynamically depending on the distribution of input points between the consecutive map/reduce phases. As a result, threads may suffer from load imbalance. Thus, using more cores does not necessarily decrease the maximum execution time of KM significantly.
For performance evaluation, we intend to design a task set with as short deadlines as possible. We have considered the six task sets in Table 3 where the relative deadlines become shorter from to . We consider these task sets to analyze their schedulability for different numbers of cores subject to the two conditions specified in (8) and (9). In each task set, a longer deadline is assigned to a task with the larger maximum execution time. Also, in each task set, we have picked task periods (i.e., relative deadlines) such that the longest period in each task set is no more than twice longer than the shortest period in the task set to model real-time data analysis tasks that need to be executed relatively close to each other. In , the tightest possible relative deadlines are picked subject to these constraints in addition to (8) and (9). The maximum execution times and relative deadlines of for 30 cores are shown in the last column and row in Table 2 and Table 3, respectively. The maximum total utilization of for 30 cores is set to 1 in (8). Assigning shorter deadlines or bigger data to the tasks in incurs deadline misses.
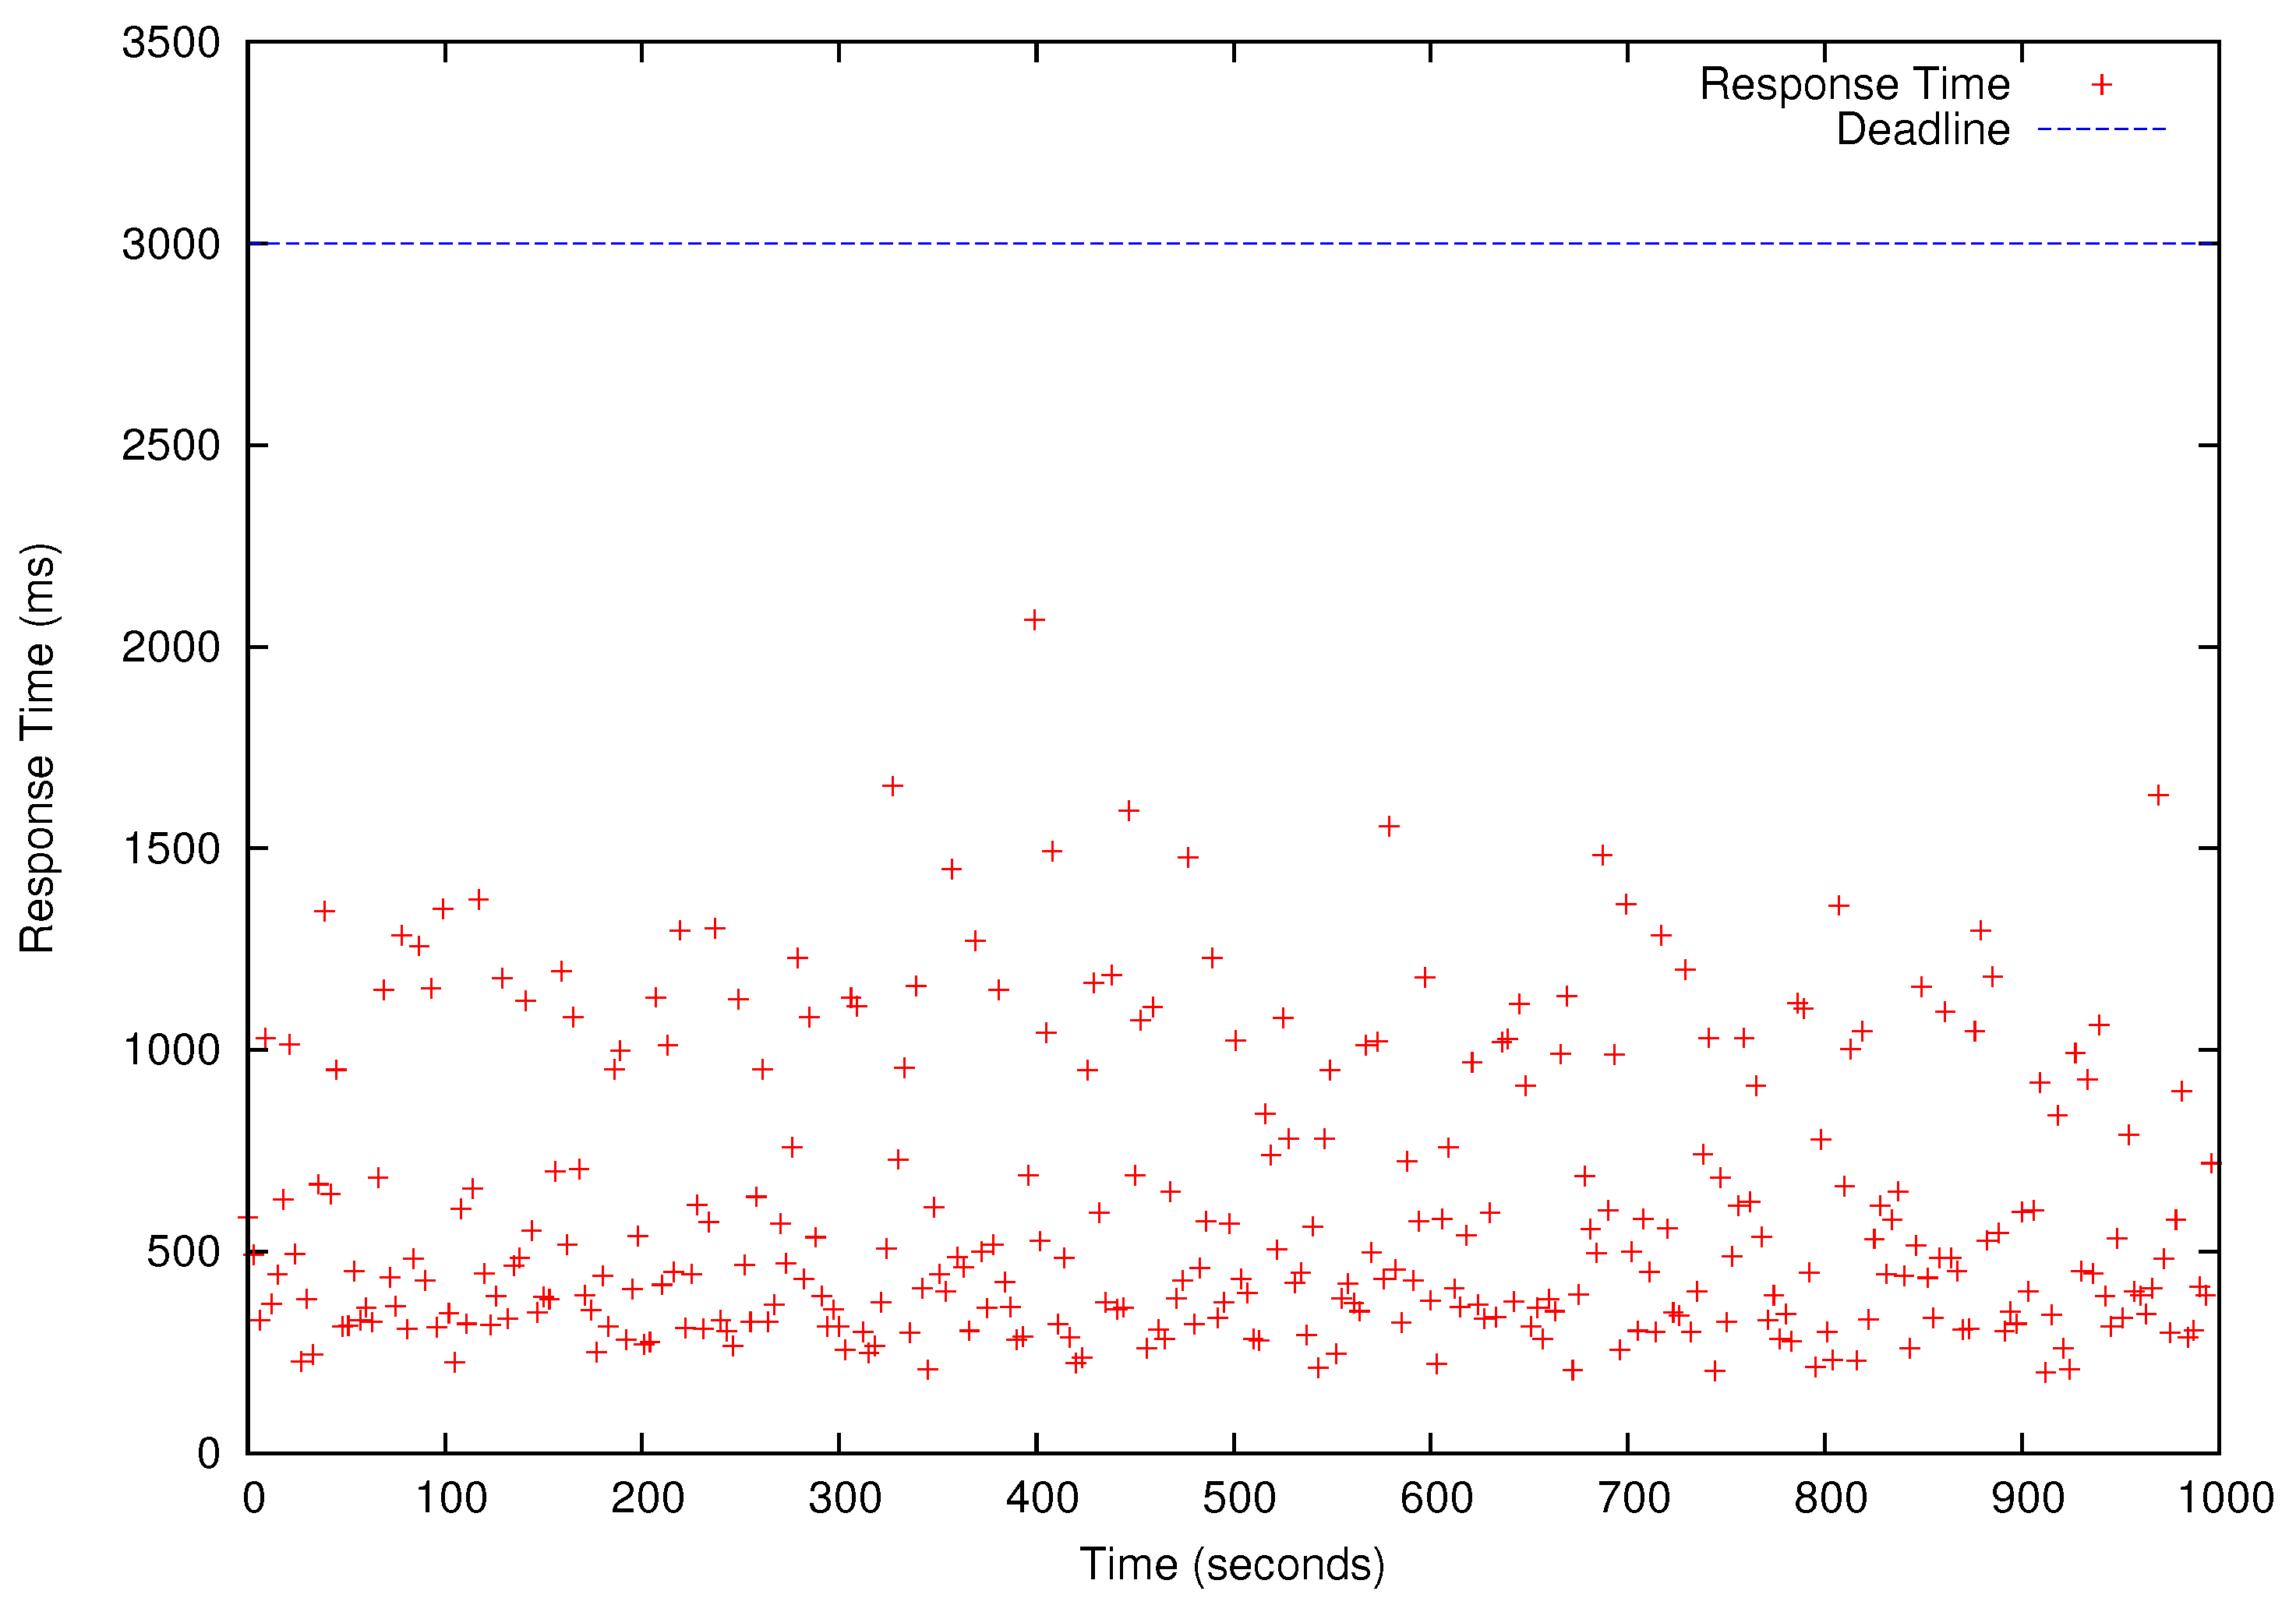
Table 4 shows the results of the schedulability tests for –). In Table 4, ‘yes’ means a task set is schedulable (i.e., all deadlines will be met) for a specific number of cores used to run HG, LR, MM, and KM. We present the performance results for that has the shortest deadlines and, therefore, it is only schedulable when as shown in Table 4. All four periodic benchmark tasks, i.e., HG, LR, KM, and MM tasks in , simultaneously release their first jobs at time 0 and continue to generate jobs according to their periods specified in the last row of Table 3 for 1000 s. As shown in Figure 8, Figure 9, Figure 10 and Figure 11, all deadlines of the periodic real-time data analysis tasks in are met. In total, more than 0.72 TB of data are processed in a 1000 s experimental run, which is projected to be over 62 TB/day.
In this paper, Phoenix [20] is used as the baseline. It is closest to RTMR in that it is a state-of-the-art in-memory, multi-core map-reduce system unlike the other approaches mainly based on Hadoop (discussed in Section 6). However, it has missed most deadlines of for several reasons (although it meets the deadlines for light workloads, such as using 30 cores). First, it is timing agnostic and only supports FIFO scheduling as discussed before. Further, it reads input data from and writes output to secondary storage without supporting input sensor data streaming into memory. Neither does it support in-memory pipelining of intermediate data for iterative tasks. As a result, a single operation to read input data from disk (write output to disk) takes 38 ms–1.35 s (71 ms–1.14 s) for the tested benchmarks.
In Figure 8, Figure 9, Figure 10 and Figure 11, we also observe that the periodic real-time data analysis jobs finish earlier than the deadlines due to the pessimistic real-time scheduling needed to meet the timing constraints. Notably, simply using advanced real-time scheduling techniques that support intra-task parallelism, e.g., [34,35], does not necessarily enhance the utilization. For example, the best known capacity augmentation bound of any global scheduler for tasks modeled as parallel directed acyclic graphs is 2.618 [35]. Hence, the total utilization of the task set should be no more than and the worst-case critical-path length of an arbitrary task (i.e., the maximum execution time of for an infinite number of cores) in the task set cannot exceed of to meet the deadlines.
Overall, our system design and experimental results serve as proof of concept for real-time big sensor data analytics. Our work presented in this paper opens up many research issues, e.g., more advanced scheduling, load balancing, execution time analysis, and real-time data analysis techniques, to efficiently extract value-added information from big sensor data in a timely manner.
6. Related Work
A comprehensive review of earlier work on real-time communication in wireless networks is given in [19]. Recently, a good survey of real-time wireless scheduling for industrial cyber-physical systems is given in [18]. Also, novel approaches for medium access control and scheduling, e.g., [18,40,41,42,43,44], have been investigated to support real-time wireless sensing and control. However, none of these projects considered optimizing the total utility for sensor data transfer from IoT devices to the edge server based on data importance.
Although notion of data importance has been considered in various contexts [2,25,26,27,28,30], our work is different from them in that we (1) enhance the total utility via adaptive sensor data transfer from IoT devices to the edge server based on data importance and (2) provide a real-time sensor data analytics framework at the network edge, while supporting generic data importance metrics.
Hadoop [6] is extensively used for big data analytics. A lot of work has been done to enhance Hadoop too [45]. Unfortunately, these approaches based on batch processing of the data stored in the distributed file system neither consider timing constraints nor support periodic in-memory processing of sensor data streams in real-time. HaLoop [46] supports iterative applications in Hadoop; however, Hadoop and most of its variants are unaware of timing constraints for real-time data analytics.
The problem of meeting real-time deadlines in Hadoop is investigated in [11,12,13,14,15,16]. Also, in [17], admission control is applied to deadline-driven batch data analysis tasks. However, these approaches focus on batch processing of archived data, providing little support for sensor data streaming or intermediate data pipelining. Thus, they are subject to significant I/O overheads and substantially longer latency and deadlines (e.g., tens of minutes). In [47], a fixed priority real-time scheduling framework based on the rate monotonic algorithm [24] and several real-time data analytics patterns are supported. It is complementary to our work in that EDF adopted in this paper is a dynamic priority scheduling method. Moreover, we support cost-effective transfer and streaming of sensor data from IoT devices to the edge server on which RTMR runs as well as memory reservation and pipelining of intermediate data between map-reduce phases different from [11,12,13,14,15,16,17,47]. Phoenix [20] supports efficient in-memory execution of map/reduce tasks in a multicore system. There are other in-memory MapReduce systems such as [48,49]; however, they are neither aware of timing constraints for real-time data analytics nor support sensor data streaming or pipelining. In this paper, we extend the notion of in-memory map-reduce via real-time scheduling, memory reservation, and data streaming and pipelining to support real-time data analytics, while supporting adaptive sensor data transfer based on data importance. Because there is no standard real-time big data framework and different approaches (e.g., [11,12,13,14,15,16,17,47]) use different frameworks, deadlines, and scheduling algorithms, it is very hard (if at all possible) for us to implement and empirically compare all related approaches to RTMR on our own. Instead, we compare the performance of RTMR to that of Phoenix [20] that is most closely related to our work as a proof of concept, while qualitatively comparing our approach to advanced related methodologies [11,12,13,14,15,16,17,47] as discussed above.
Real-time databases (RTDBs) have been studied extensively to process user transactions using fresh temporal data representing the current real world status. However, sophisticated data analysis based on, for example, machine learning or data mining has rarely been considered in RTDBs. Neither do they provide an easy-to-use parallel programming model, e.g., the map-reduce model [4]. Leading-edge data stream management systems, e.g., Storm [8], Spark Streaming [10], and C-MR [50], support near real-time stream data processing. RAMCloud [51] always stores entire data in distributed memory and provides high speed networking to support reads/writes 1000 times faster than disk-based storage. However, they do not consider timing constraints for real-time data analytics. In the future, our approach could be combined with it to handle bigger sensor data in real-time.
In multiprocessor real-time scheduling, it is a common practice to schedule serial tasks concurrently using multiple processors or cores [52]. Novel scheduling algorithms, e.g., [34,35], are developed to support intra-task parallelism such that a single real-time task can use multiple cores (or processors) at a time. In this way, compute-intensive tasks can meet stringent deadlines that cannot be met otherwise. However, these studies do not consider real-time data analytics issues, e.g., the real-time map-reduce model, data streaming/pipelining, and memory reservation for timely analysis of sensor data.
7. Conclusions and Future Work
Supporting real-time sensor data analytics is desirable yet challenging. Most existing big data management systems, e.g., Hadoop, are timing agnostic and only focus on batch processing of previously stored data in the cloud rather than dealing with real-time sensor data transfer from IoT devices to the edge server and real-time analytics at the network edge on the fly. To address the problem, we design a new framework for cost-effective sensor data transfer and real-time analytics. We have also implemented a prototype system and evaluated the performance. In the performance evaluation, our approach for adaptive transfer rate allocation effectively tracks the ground truth, while considerably enhancing the utility. Also, we support schedulability analysis of real-time data analytics tasks and empirically verify timing constrains are met in the prototype real-time map-reduce framework (RTMR). In the future, we will explore more efficient scheduling and resource management techniques such as load balancing among edge servers, while providing more advanced data importance estimation and real-time data analytics.
Acknowledgments
This work was supported, in part, by NSF grants CNS-1526932 and CNS-1657275.
Author Contributions
Kyoung-Don Kang designed the overall framework and algorithms, advised Liehuo Chen, Hyungdae Yi, and Bin Wang, conceived the performance evaluation, and wrote the paper. Liehuo Chen, Hyungdae Yi, and Bin Wang finalized the algorithms, implemented the prototype, and did the experiments for performance evaluation. Mo Sha conceived the case study using smartphones, wrote part of Section 2.2, Section 5.1, and Section 6, supervised Bin Wang and Hyungdae Yi, and provided feedback to enhance the presentation.
Conflicts of Interest
The authors declare no conflict of interest. The founding sponsor had no role in the design of the study; in the collection, analyses, or interpretation of data; in the writing of the manuscript, and in the decision to publish the results.
Abbreviations
The following abbreviations are used in this manuscript:
| ECG | Electrocardiogram |
| EDF | Earliest Deadline First |
| E2E | End-to-End |
| FIFO | First-In First-Out |
| fps | frames per second |
| ILP | Integer Linear Programming |
| IoT | Internet of Things |
| JPEG | Joint Photographic Experts Group |
| mHealth | mobile Health |
| RTMR | Real-Time Map-Reduce |
| SIMD | Single Instruction Multiple Data |
| HG | Histogram |
| KM | k-means |
| LR | Linear Regression |
| MM | Matrix Multiplication |
References
- Gartner, Internet of Things. Available online: http://www.zdnet.com/article/iot-devices-will-outnumber-the-worlds-population-this-year-for-the-first-time/ (accessed on 16 October 2017).
- Ahmeda, E.; Rehmani, M.H. Mobile Edge Computing: Opportunities, solutions, and challenges. Future Gener. Comput. Syst. 2016, 70, 59–63. [Google Scholar] [CrossRef]
- Satyanarayanan, M. The Emergence of Edge Computing. IEEE Comput. 2017, 50, 30–39. [Google Scholar] [CrossRef]
- Bird, R.; Wadler, P. Introduction to Functional Programming, 2nd ed.; Prentice Hall: Upper Saddle River, NJ, USA, 1998. [Google Scholar]
- Dean, J.; Ghemawat, J. MapReduce: Simplified Data Processing on Large Clusters. In Proceedings of the Symposium on Operating Systems Design and Implementation, Seattle, WA, USA, 4 October 2004. [Google Scholar]
- Hadoop Project. Available online: http://hadoop.apache.org (accessed on 16 October 2017).
- Beluke, D. Big Data Impacts Data Management: The 5 Vs of Big Data. Available online: http://davebeulke.com/big-data-impacts-data-management-the-five-vs-of-big-data/ (accessed on 16 October 2017).
- Apache Storm. Available online: https://storm.apache.org/ (accessed on 16 October 2017).
- S4: Distributed Stream Computing Platform. Available online: http://incubator.apache.org/s4/ (accessed on 16 October 2017).
- Spark Streaming. Available online: https://spark.apache.org/streaming/ (accessed on 16 October 2017).
- Basu, A. Q Learning Based Workflow Scheduling in Hadoop. Int. J. Appl. Eng. Res. 2017, 12, 3311–3317. [Google Scholar]
- Phan, L.T.X.; Zhang, Z.; Zheng, Q.; Loo, B.T.; Lee, I. An Empirical Analysis of Scheduling Techniques for Real-time Cloud-based Data Processing. In Proceedings of the International Workshop on Service-Oriented Computing and Applications, Irvine, CA, USA, 12–14 December 2011. [Google Scholar]
- Kc, K.; Anyanwu, K. Scheduling Hadoop Jobs to Meet Deadlines. In Proceedings of the International Conference on Cloud Computing Technology and Science, Washington, DC, USA, 30 November–3 December 2010. [Google Scholar]
- Teng, F.; Yang, H.; Li, T.; Yang, Y.; Li, Z. Scheduling real-time workflow on MapReduce-based cloud. In Proceedings of the International Conference on Innovative Computing Technology, State College, Pennsylvania, PA, USA, 8–10 May 2013. [Google Scholar]
- Li, S.; Hu, S.; Wang, S.; Su, L.; Abdelzaher, T.; Gupta, I.; Pace, R. WOHA: Deadline-Aware Map-Reduce Workflow Scheduling Framework over Hadoop Cluster. In Proceedings of the 2014 IEEE 34th International Conference on Distributed Computing Systems (ICDCS), Madrid, Spain, 30 June–3 July 2014. [Google Scholar]
- Rashmi, S.; Basu, A. Deadline constrained Cost Effective Workflow scheduler for Hadoop clusters in cloud datacenter. In Proceedings of the International Conference on Computation System and Information Technology for Sustainable Solutions, Bangalore, India, 6–8 October 2016. [Google Scholar]
- Tamrakar, K.; Yazidi, A.; Haugerud, H. Cost Efficient Batch Processing in Amazon Cloud with Deadline Awareness. In Proceedings of the IEEE International Conference on Advanced Information Networking and Applications (AINA), Taipei, Taiwan, 27–29 March 2017. [Google Scholar]
- Lu, C.; Saifullah, A.; Li, B.; Sha, M.; Gonzalez, H.; Gunatilaka, D.; Wu, C.; Nie, L.; Chen, Y. Real-Time Wireless Sensor-Actuator Networks for Industrial Cyber-Physical Systems. Proc. IEEE 2016, 104. [Google Scholar] [CrossRef]
- Stankovic, J.A.; Abdelzaher, T.F.; Lu, C.; Sha, L.; Hou, J.C. Real-time Communication and Coordination in Embedded Sensor Networks. Proc. IEEE 2003, 91. [Google Scholar] [CrossRef]
- Phoenix. Available online: https://github.com/kozyraki/phoenix (accessed on 17 October 2017).
- Chen, L.; Kang, K.D. A Framework for Real-Time Information Derivation from Big Sensor Data. In Proceedings of the IEEE International Conference on Embedded Software and System (ICESS), New York, NY, USA, 24–26 August 2015. [Google Scholar]
- Fog Computing and the Internet of Things: Extend the Cloud to Where the Things Are. Available online: https://www.cisco.com/c/dam/en_us/solutions/trends/iot/docs/computing-overview.pdf (accessed on 16 October 2017).
- Edge Computing. Available online: https://www.rtinsights.com/category/edge-computing/ (accessed on 16 October 2017).
- Liu, J.W.S. Real-Time Systems; Prentice Hall: Upper Saddle River, NJ, USA, 2000. [Google Scholar]
- Cheng, C.F.; Lia, L.H. Data gathering problem with the data importance consideration in Underwater Wireless Sensor Networks. J. Netw. Comput. Appl. 2016. [Google Scholar] [CrossRef]
- Zhang, T.; Chowdhery, A.; Bahl, P.; Jamieson, K.; Banerjee, S. The Design and Implementation of a Wireless Video Surveillance System. In Proceedings of the Annual International Conference on Mobile Computing and Networking (MobiCom), Paris, France, 7–11 September 2015. [Google Scholar]
- Toka, L.; Lajtha, A.; Hosszu, E.; Formanek, B.; Gehberger, D.; Tapolcai, J. A Resource-Aware and Time-Critical IoT Framework. In Proceedings of the IEEE International Conference on Computer Communications (INFOCOM), Atlanta, GA, USA, 1–4 May 2017. [Google Scholar]
- Andronikou, V.; Mamouras, K.; Tserpes, K.; Kyriazis, D.; Varvarigou, T. Dynamic QoS-aware data replication in grid environments based on data importance. Future Gener. Comput. Syst. 2012, 28. [Google Scholar] [CrossRef]
- Ho, S.J.; Kuo, T.W.; Mok, A.K. Similarity-based Load Adjustment for Real-Time Data-Intensive Applications. In Proceedings of the IEEE Real-Time Systems Symposium (RTSS), San Francisco, CA, USA, 2–5 December 1997. [Google Scholar]
- Hu, W.; Amos, B.; Chen, Z.; Ha, K.; Richter, W.; Pillai, P.; Gilbert, B.; Harkes, J.; Satyanarayanan, M. The Case for Offload Shaping. In Proceedings of the International Workshop on Mobile Computing Systems and Applications (HotMobile), Santa Fe, NM, USA, 12–13 February 2015. [Google Scholar]
- Steele, J. The Cauchy Schwarz Master Class; Cambridge University Press: Cambridge, UK, 2004. [Google Scholar]
- Carpenter, J.; Funk, S.; Holman, P.; Srinivasan, A.; Anderson, J.; Baruah, S. A Categorization of Real-time Multiprocessor Scheduling Problems and Algorithms. In Handbook of Scheduling: Algorithms, Models, and Performance Analysis; Leung, J.Y.T., Ed.; Chapman Hall: Eugene, OR, USA; CRC Press: Boca Raton, FL, USA, 2003. [Google Scholar]
- Jeffay, K.; Stanat, D.; Martel, C.U. On Non-Preemptive Scheduling of Periodic and Sporadic Tasks. In Proceedings of the Real-Time Systems Symposium, San Antonio, TX, USA, 4–6 December 1991. [Google Scholar]
- Saifullah, A.; Ferry, D.; Li, J.; Agrawal, K.; Lu, C.; Gill, C.D. Parallel Real-Time Scheduling of DAGs. IEEE Trans. Parallel Distrib. Syst. 2014, 25, 3242–3252. [Google Scholar] [CrossRef]
- Li, J.; Chen, J.J.; Agrawal, K.; Lu, C.; Gill, C.D.; Saifullah, A. Analysis of Federated and Global Scheduling for Parallel Real-Time Tasks. In Proceedings of the Euromicro Conference on Real-Time Systems, Madrid, Spain, 8–11 July 2014. [Google Scholar]
- OpenCV. Available online: http://opencv.org/ (accessed on 16 October 2017).
- BUSECURE. Available online: http://www.binghamton.edu/its/organization/ops/wireless.html (accessed on 16 October 2017).
- Gao, W.; Tian, Y.; Huang, T.; Ma, S.; Zhang, X. The IEEE 1857 Standard: Empowering Smart Video Surveillance Systems. IEEE Intell. Syst. 2014, 29. [Google Scholar] [CrossRef]
- Liu, H.; Chen, S.; Kubota, N. Intelligent Video Systems and Analytics: A Survey. IEEE Trans. Ind. Inf. 2013, 9, 1222–1233. [Google Scholar]
- Wei, Y.H.; Leng, Q.; Han, S.; Mok, A.K.; Zhang, W.; Tomizuka, M. RT-WiFi: Real-Time High-Speed Communication Protocol for Wireless Cyber-Physical Control Applications. In Proceedings of the IEEE Real-Time Systems Symposium (RTSS), Vancouver, BC, Canada, 3–6 December 2013. [Google Scholar]
- Leng, Q.; Wei, Y.H.; Han, S.; Mok, A.K.; Zhang, W.; Tomizuka, M. Improving Control Performance by Minimizing Jitter in RT-WiFi Networks. In Proceedings of the IEEE Real-Time Systems Symposium (RTSS), Rome, Italy, 2–5 December 2014. [Google Scholar]
- Jacob, R.; Zimmerling, M.; Huang, P.; Beutel, J.; Thiele, L. End-to-end Real-time Guarantees in Wireless Cyber-physical Systems. In Proceedings of the IEEE Real-Time Systems Symposium (RTSS), Porto, Portugal, 29 November–2 December 2016. [Google Scholar]
- Duquennoy, S.; Nahas, B.A.; Landsiedel, O.; Watteyne, T. Orchestra: Robust Mesh Networks Through Autonomously Scheduled TSCH. In Proceedings of the ACM Conference on Embedded Networked Sensor Systems (SenSys), Seoul, Korea, 1–4 November 2015. [Google Scholar]
- Watteyne, T.; Handziski, V.; Vilajosana, X.; Duquennoy, S.; Hahm, O.; Baccelli, E.; Wolisz, A. Industrial Wireless IP-Based Cyber Physical Systems. Proc. IEEE 2016, 104. [Google Scholar] [CrossRef]
- Lee, K.H.; Lee, Y.J.; Choi, H.; Chung, Y.D.; Moon, B. Parallel Data Processing with MapReduce: A Survey. SIGMOD Rec. 2011, 40, 11–20. [Google Scholar] [CrossRef]
- Bu, Y.; Howe, B.; Balazinska, M.; Ernst, M.D. HaLoop: Efficient Iterative Data Processing on Large Clusters. Proc. VLDB Endow. 2010, 3, 285–296. [Google Scholar] [CrossRef]
- Basanta-Val, P.; Fernandez-Garcia, N.; Sanchez-Fernandez, L.; Fisteus, J.A. Patterns for Distributed Real-Time Stream Processing. IEEE Trans. Parallel Distrib. Syst. 2017, 28. [Google Scholar] [CrossRef]
- In-Memory MapReduce - Apache Ignite. Available online: https://ignite.apache.org/features/mapreduce.html (accessed on 16 October 2017).
- Hazelcast. Available online: https://github.com/hazelcast/hazelcast/tree/master/hazelcast/src/main/java/com/hazelcast/mapreduce (accessed on 16 October 2017).
- Backman, N.; Pattabiraman, K.; Fonseca, R.; Cetintemel, U. C-MR: Continuously Executing MapReduce Workflows on Multi-core Processors. In Proceedings of the International Workshop on MapReduce and Its Applications, Delft, The The Netherlands, 18–19 June 2012. [Google Scholar]
- RAMCloud. Available online: https://ramcloud.atlassian.net/wiki/display/RAM/RAMCloud (accessed on 16 October 2017).
- Davis, R.I.; Burns, A. A Survey of Hard Real-time Scheduling for Multiprocessor Systems. ACM Comput. Surv. 2011, 43. [Google Scholar] [CrossRef]
Figure 1.
Map-Reduce Model.
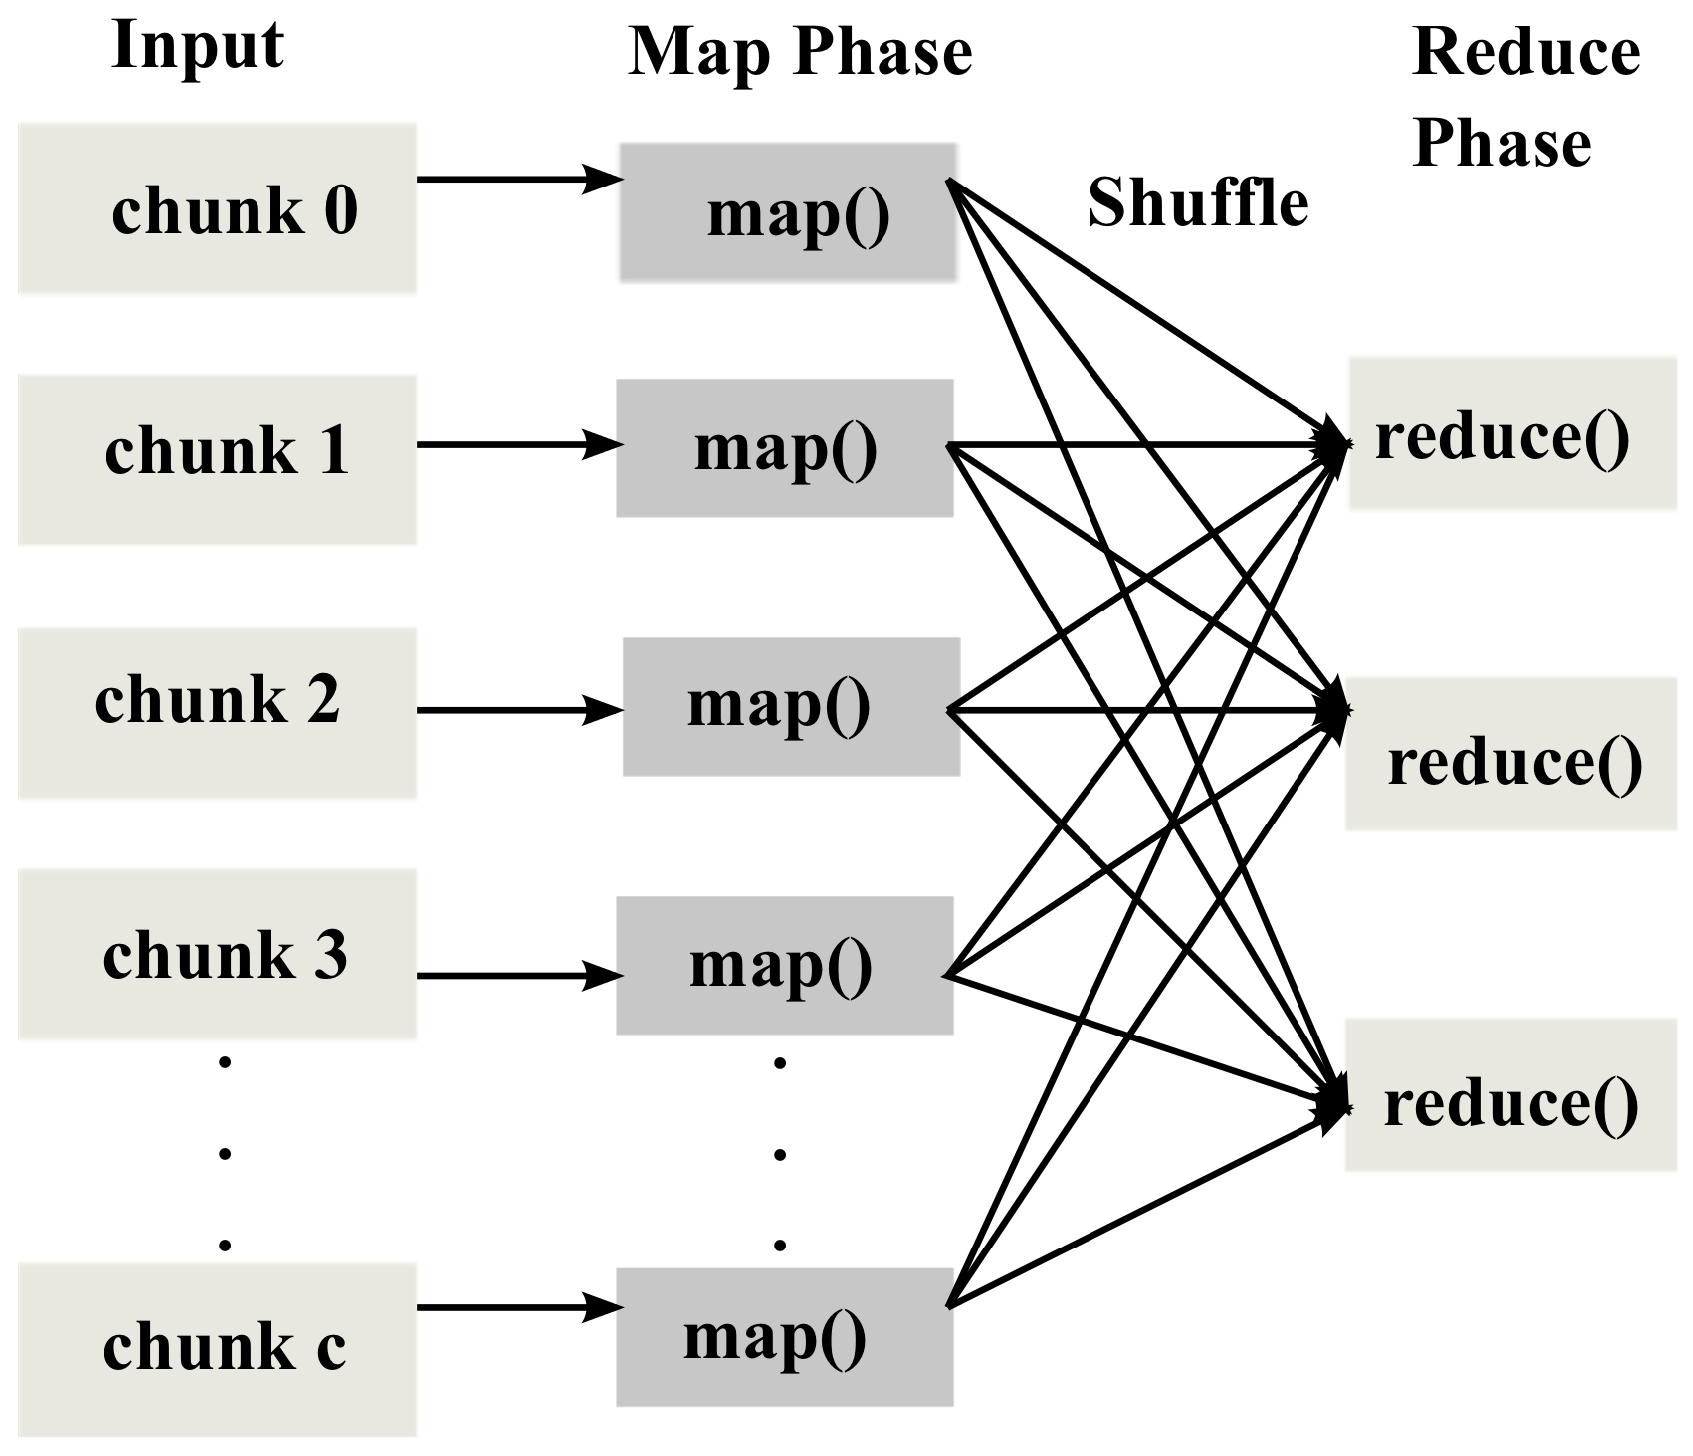
Figure 2.
Overall System Architecture.

Figure 3.
RTMR Front-End: Data and Rate Control Message Flows for Transfer Rate Adaptation Based on Data Importance.
Figure 3.
RTMR Front-End: Data and Rate Control Message Flows for Transfer Rate Adaptation Based on Data Importance.
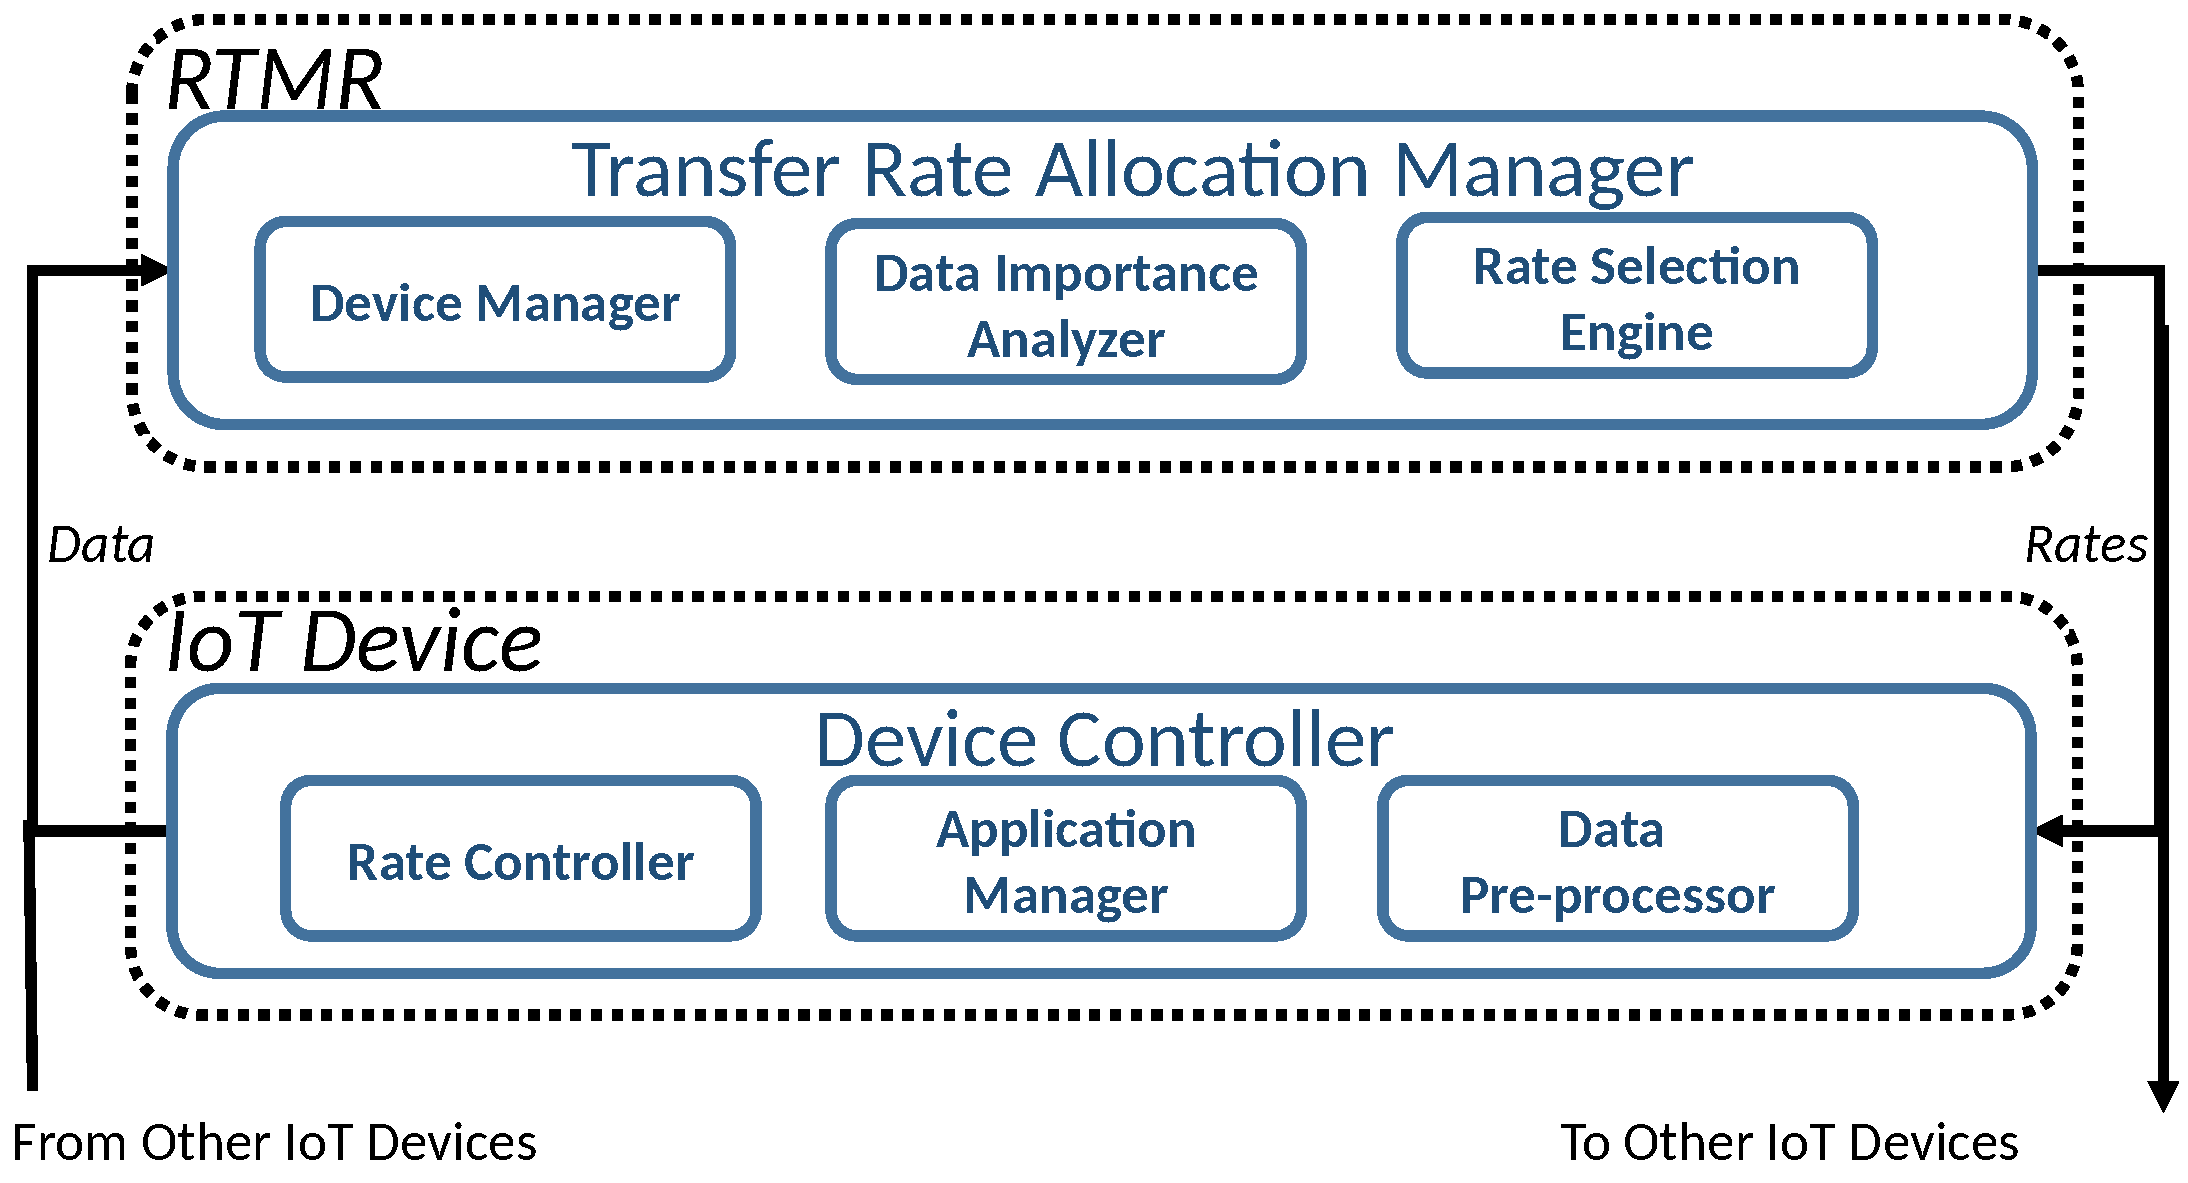
Figure 4.
RTMR Back-End: Scheduling and Sensor Data Analytics in Real-Time In-Memory Map-Reduce.

Figure 5.
Map Function for Cell Phone Count.

Figure 6.
Reduce Function for Cell Phone Count.
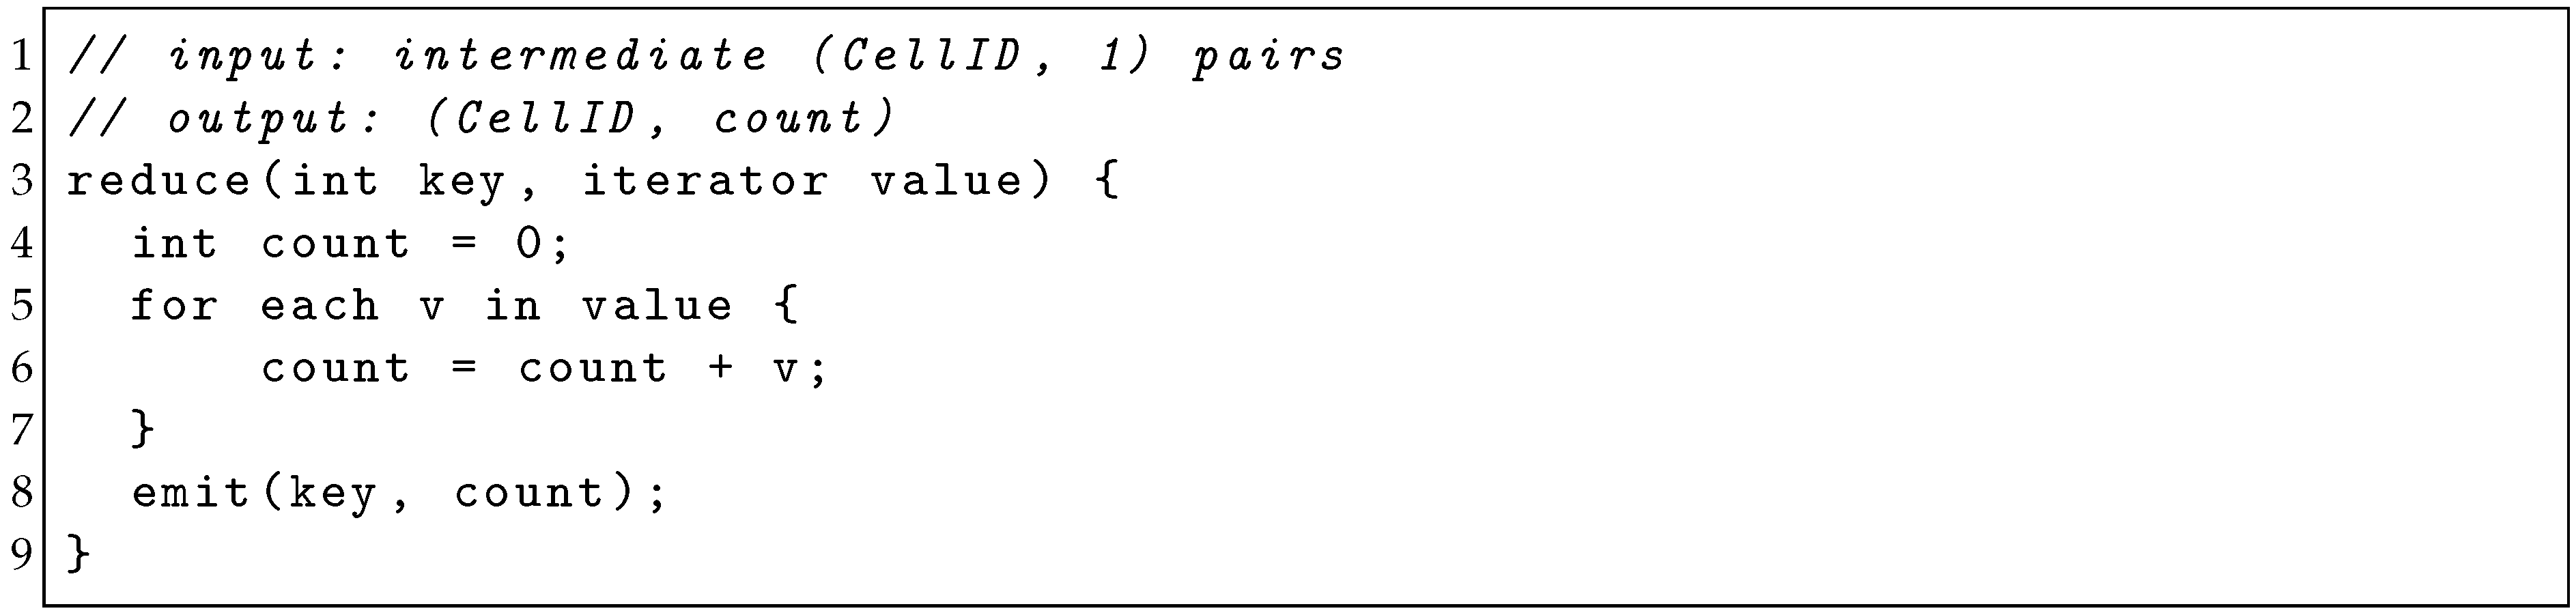
Figure 7.
Case Study (R = 12 fps, = 1 fps, = 5 fps). (a) Frame rate changes according to the ground truth (the actual number of faces); (b) CDF of End-to-End Latency.
Figure 7.
Case Study (R = 12 fps, = 1 fps, = 5 fps). (a) Frame rate changes according to the ground truth (the actual number of faces); (b) CDF of End-to-End Latency.

Figure 8.
Response Times of Histogram (HG) Jobs. The blue horizontal bar is the deadline (2.6 s). Each red dot represents the response time of one periodic HG job.
Figure 8.
Response Times of Histogram (HG) Jobs. The blue horizontal bar is the deadline (2.6 s). Each red dot represents the response time of one periodic HG job.
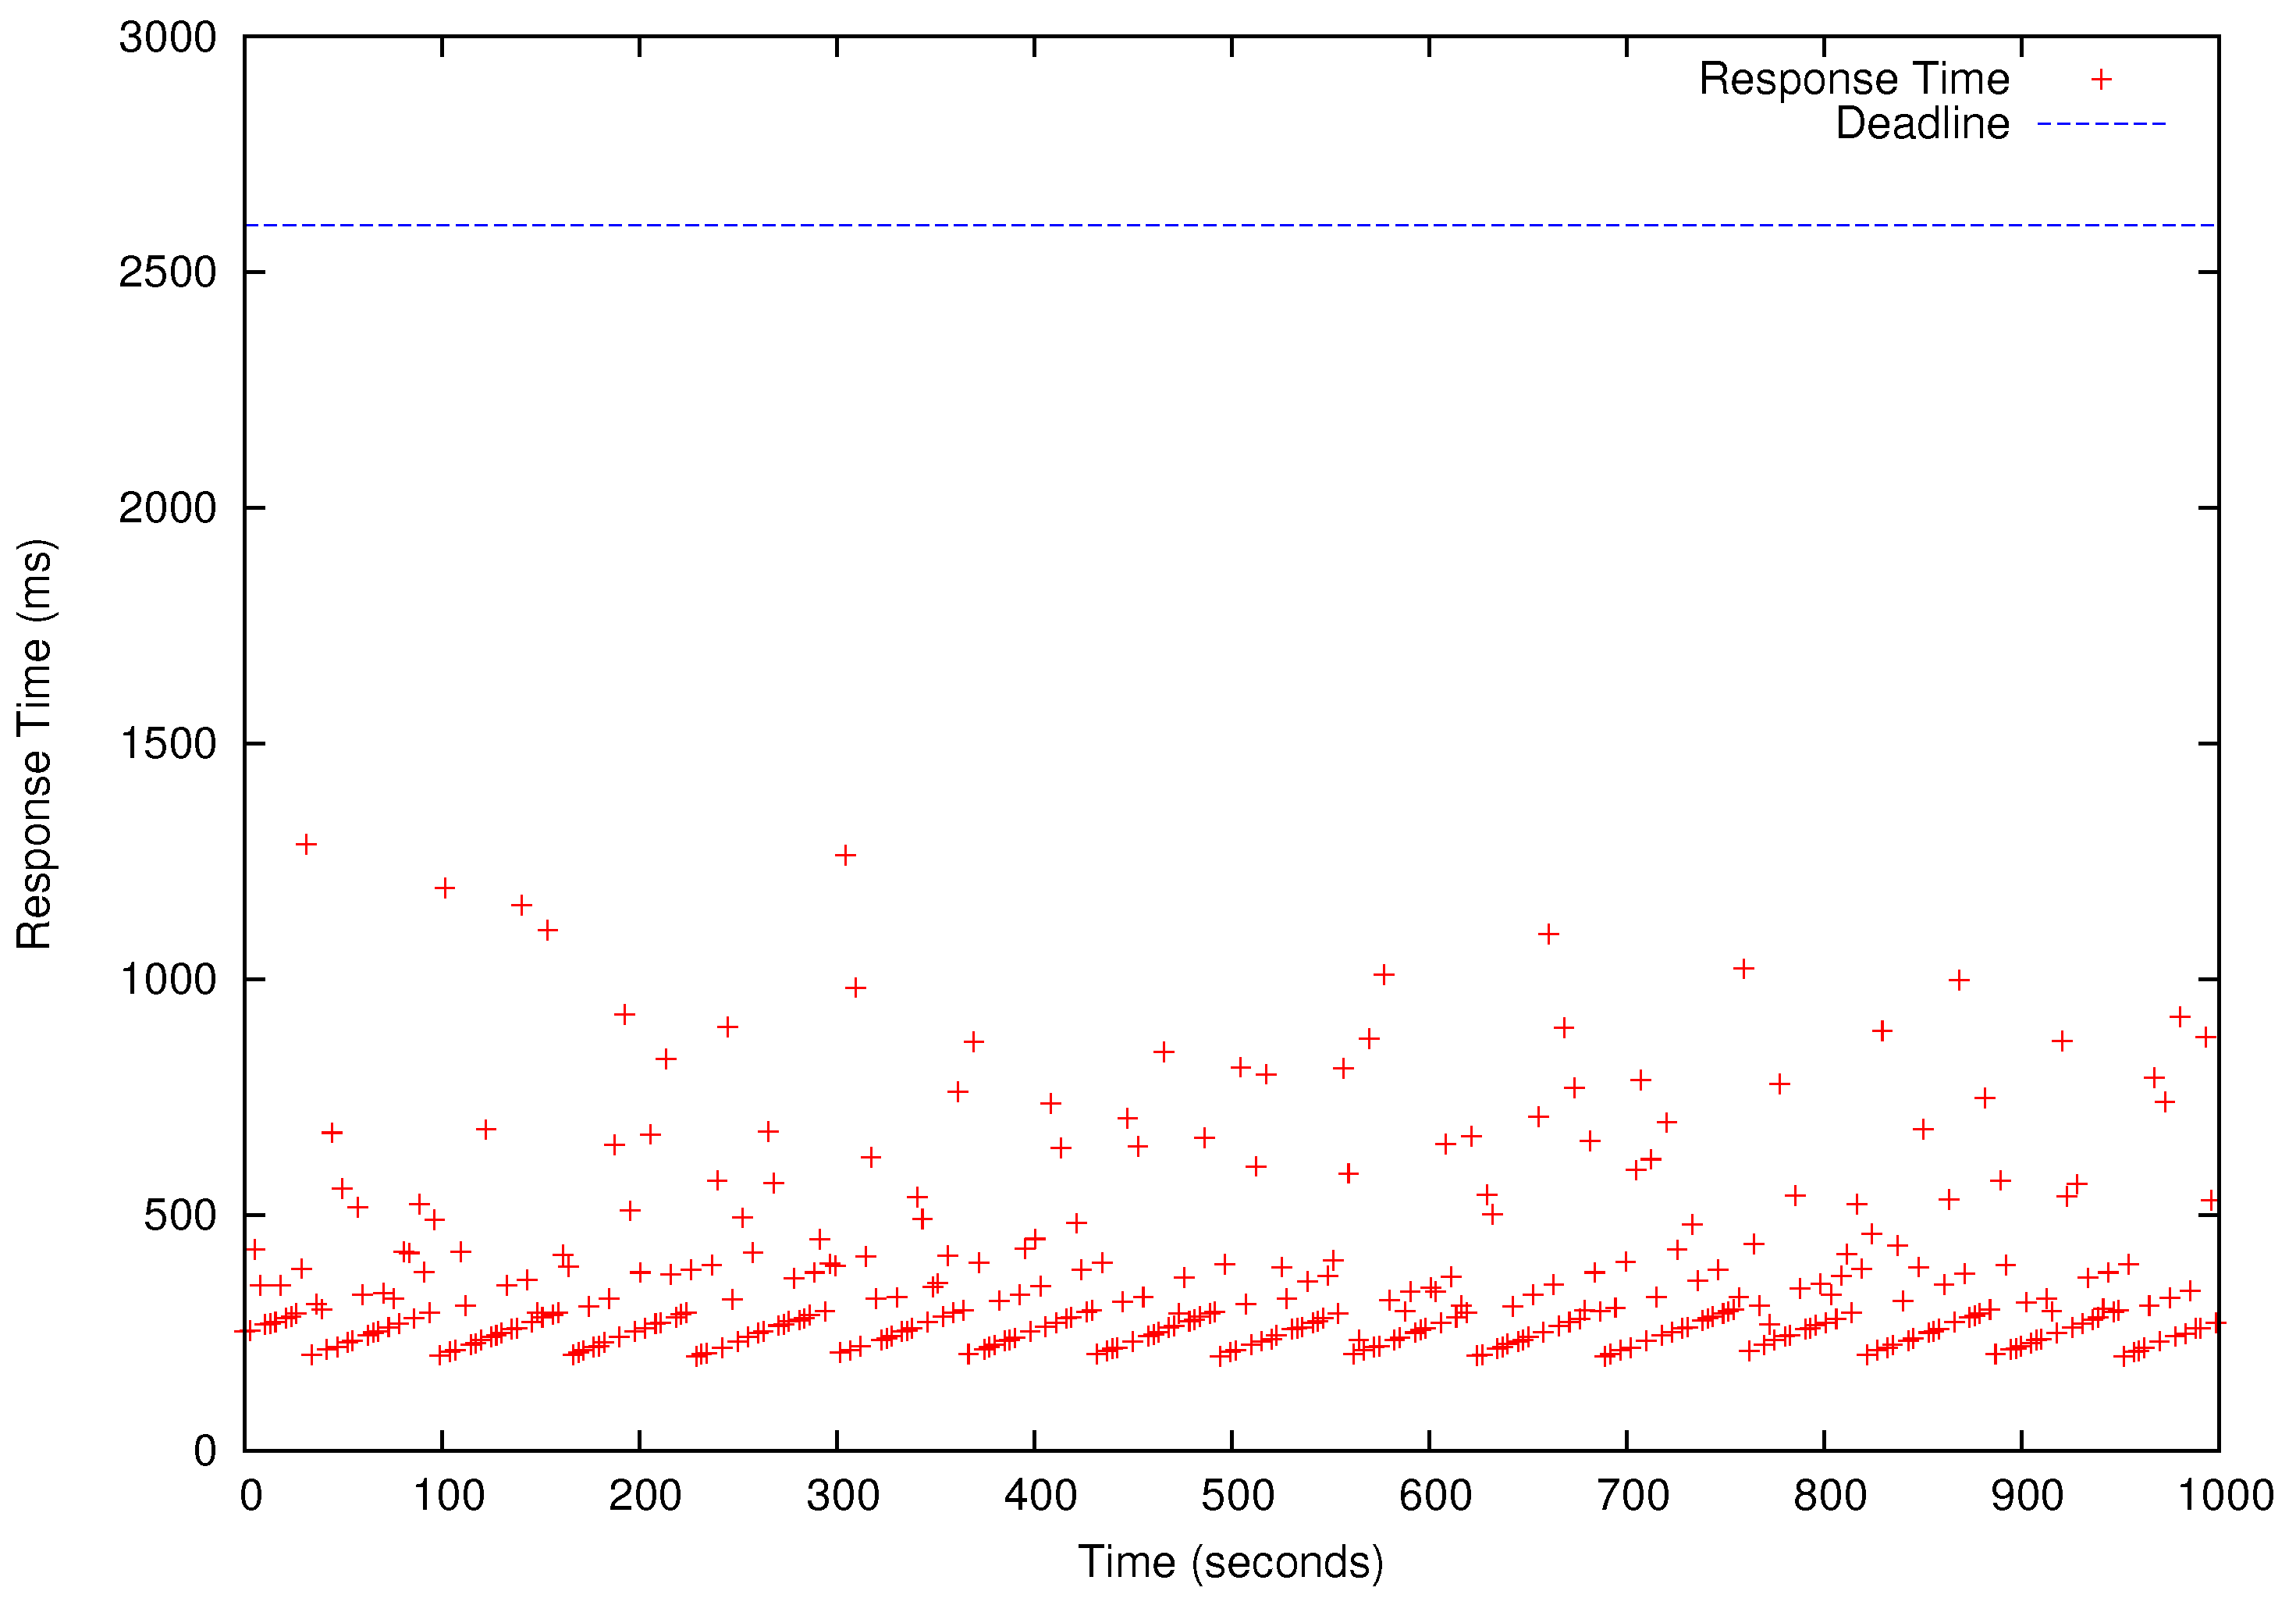
Figure 9.
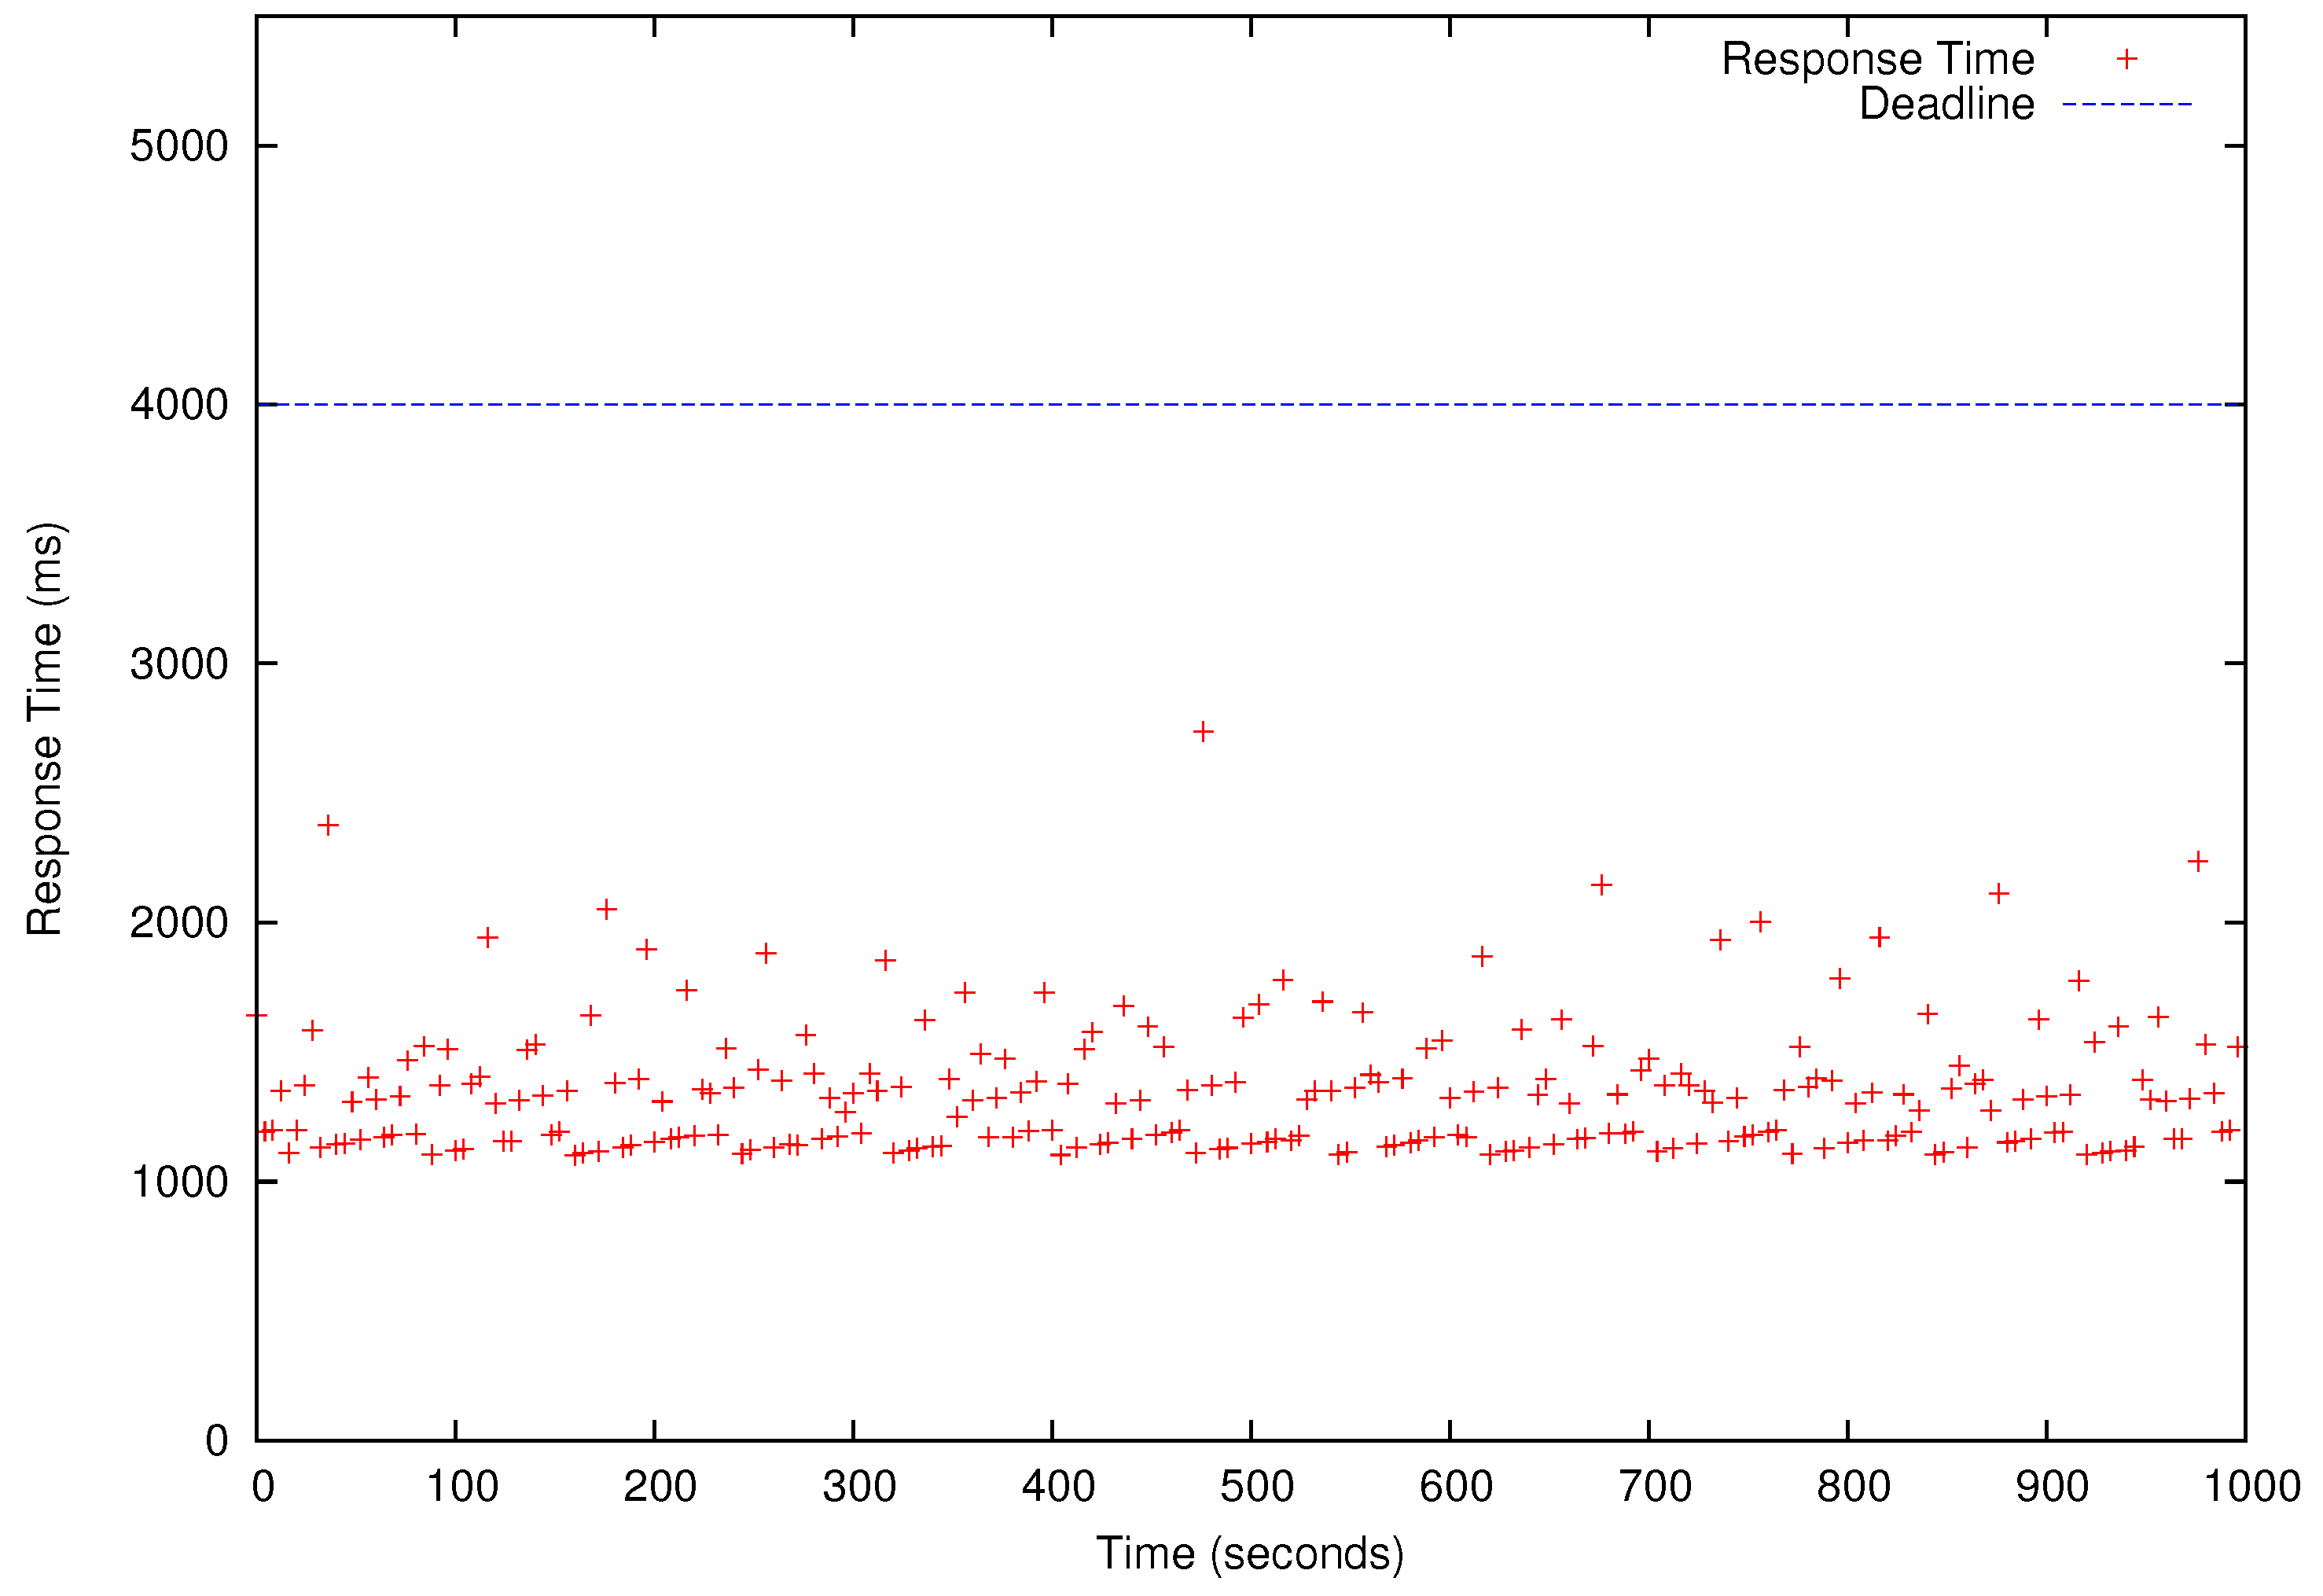
Response Times of Linear Regression (LR) Jobs. The blue horizontal bar is the deadline (3 s). Each red dot represents the response time of one periodic LR job.
Figure 9.
Response Times of Linear Regression (LR) Jobs. The blue horizontal bar is the deadline (3 s). Each red dot represents the response time of one periodic LR job.

Figure 10.
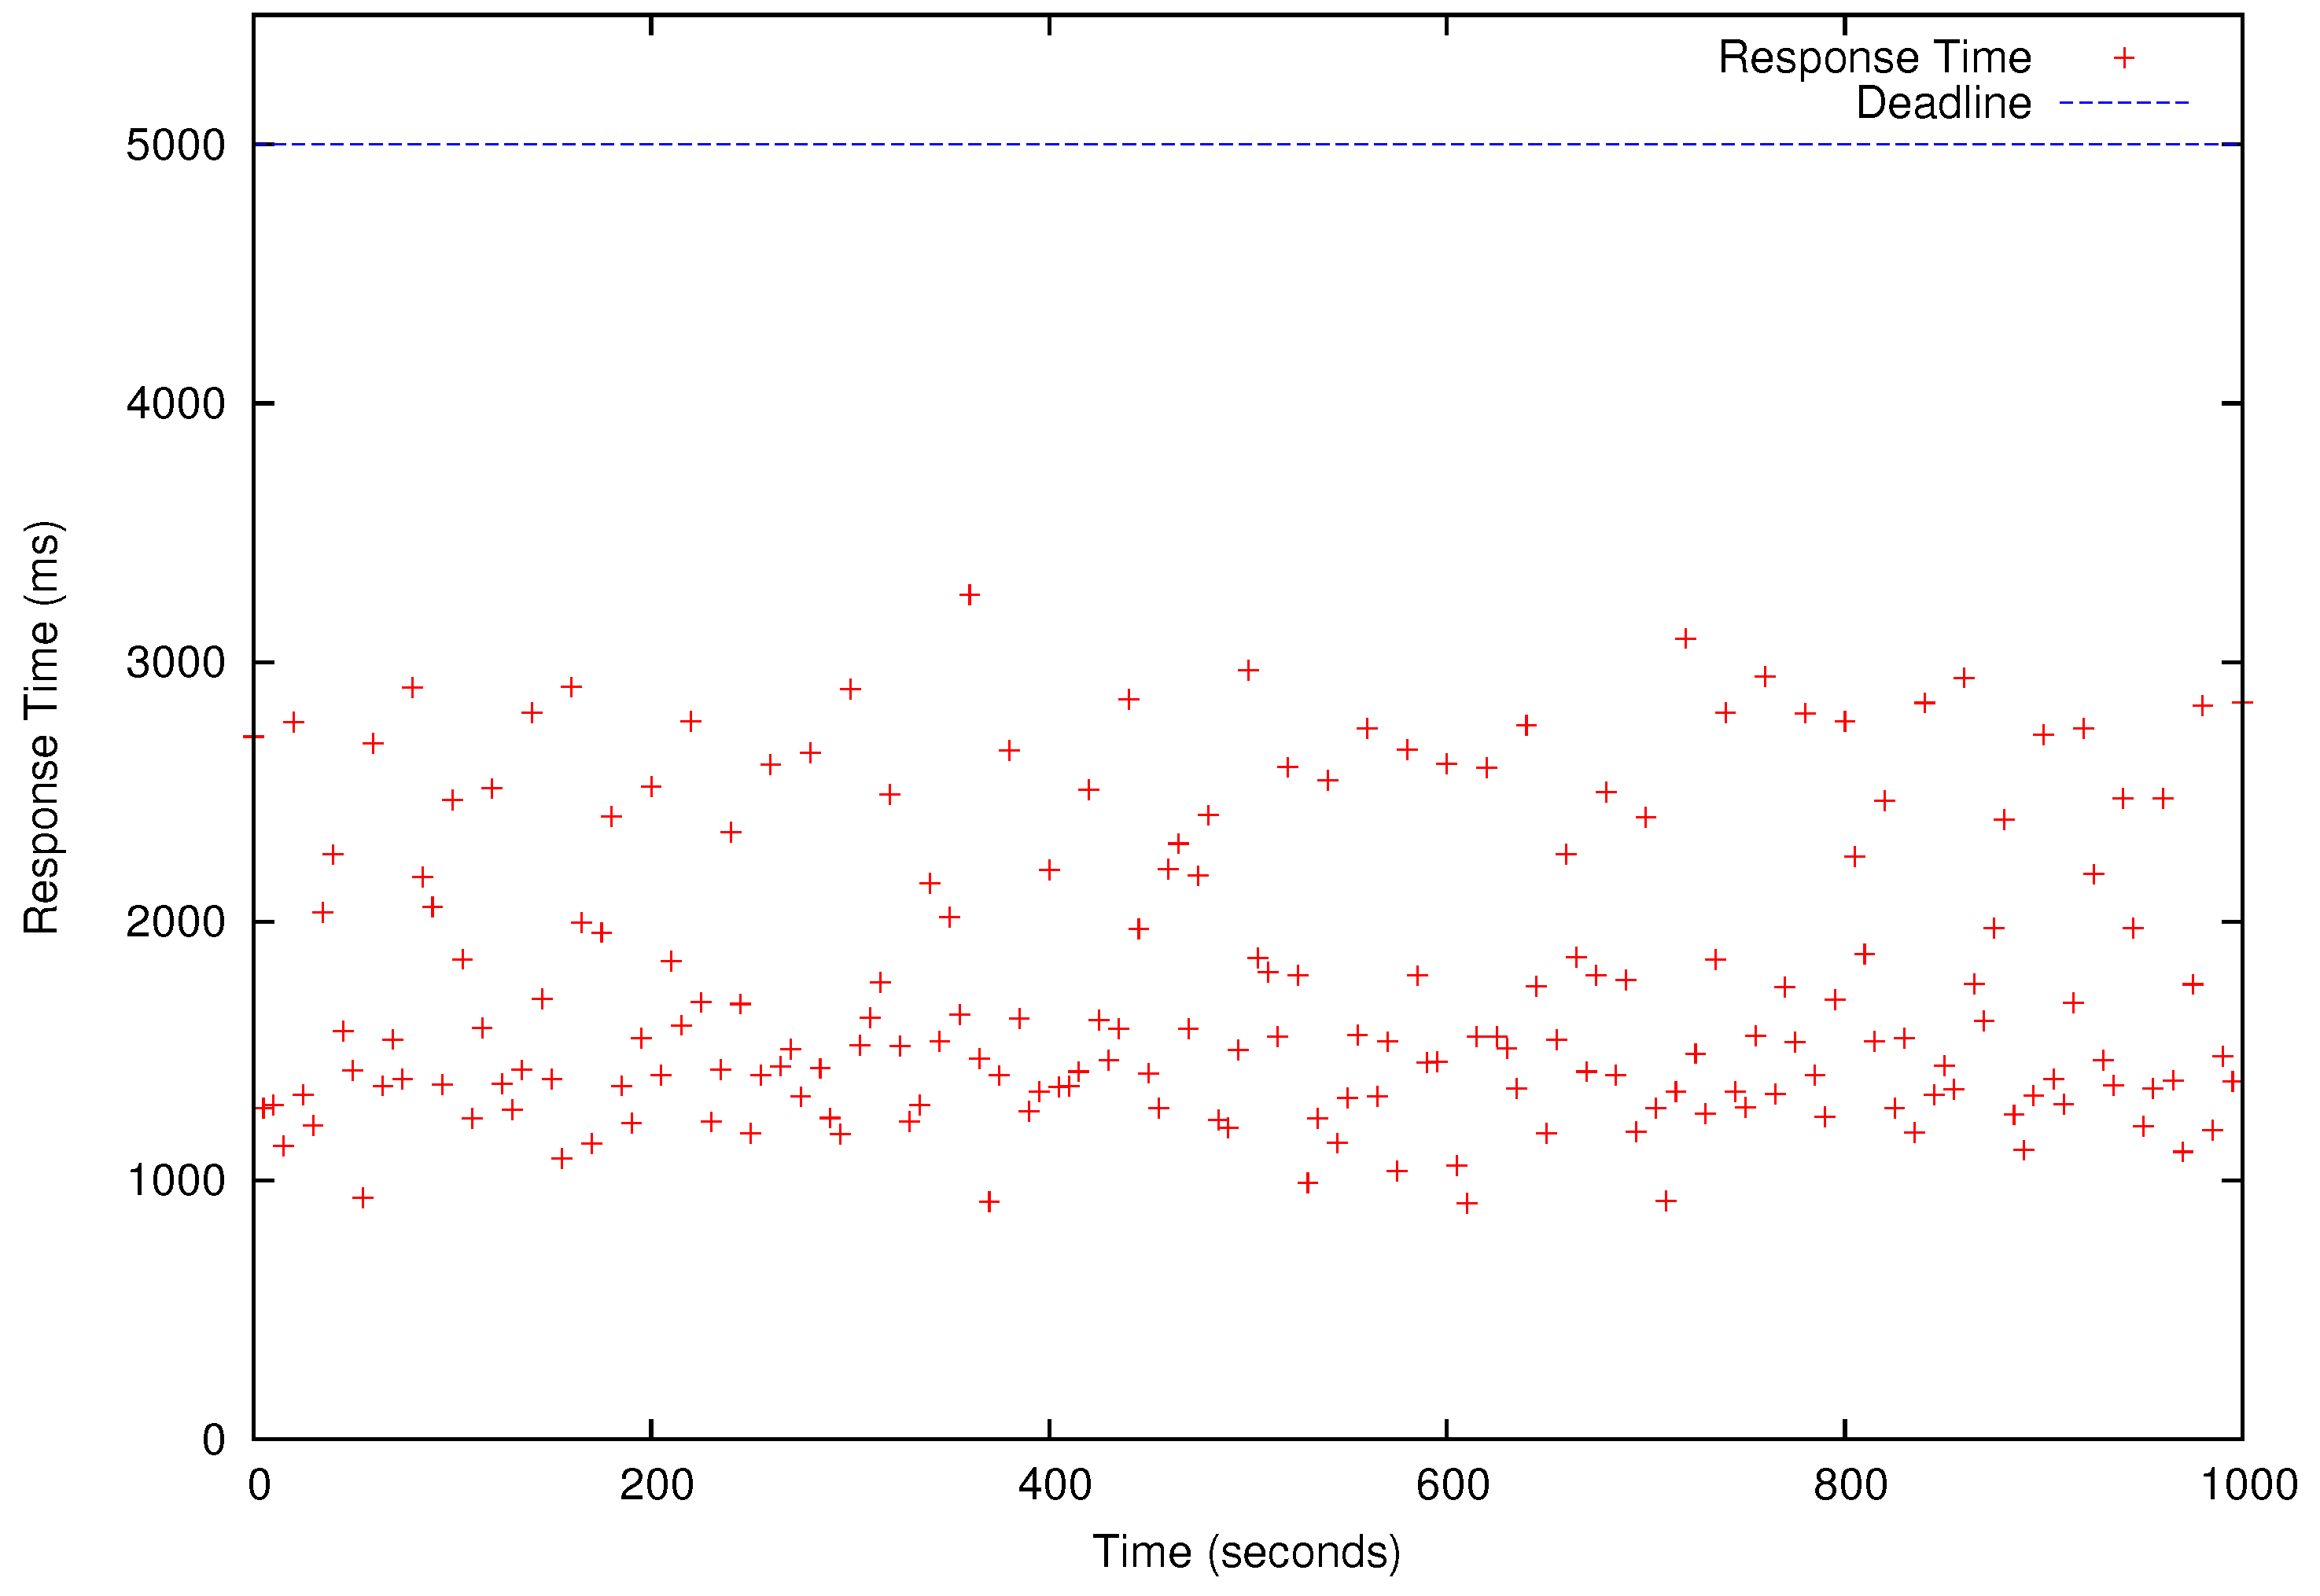
Response Times of Matrix Multiplication (MM) Jobs. The blue horizontal bar is the deadline (4 s). Each red dot represents the response time of one periodic MM job.
Figure 10.
Response Times of Matrix Multiplication (MM) Jobs. The blue horizontal bar is the deadline (4 s). Each red dot represents the response time of one periodic MM job.

Figure 11.
Response Times of K-Means (KM) Jobs. The blue horizontal bar is the deadline (5 s). Each red dot shows the response time of one periodic KM job.
Figure 11.
Response Times of K-Means (KM) Jobs. The blue horizontal bar is the deadline (5 s). Each red dot shows the response time of one periodic KM job.


Table 1.
95 percentile of E2E Latency for different Smartphones.
| Smart Phone Model | E2E Latency (ms) |
|---|---|
| Huawei Honor 6 | 100 |
| Galaxy S6 | 86 |
| LG G3 | 98 |
| Google Nexus 6 | 93 |
| Google Nexus 3 | 98 |
Table 2.
Maximum Execution Times in seconds.
| m = 1 | m = 2 | m = 4 | m = 8 | m = 16 | m = 30 | |
|---|---|---|---|---|---|---|
| HG | 2.41 s | 1.67 s | 0.88 s | 0.56 s | 0.33 s | 0.2 s |
| LR | 1.49 s | 1.3 s | 1.18 s | 0.95 s | 0.62 s | 0.37 s |
| MM | 19.7 s | 11.2 s | 5.9 s | 3.73 s | 2.02 s | 1.11 s |
| KM | 10.2 s | 7.5 s | 3.72 s | 3.09 s | 2.54 s | 2.36 s |
Table 3.
Relative Deadlines (seconds) of the Task Sets (–).
| HG | LR | MM | KM | |
|---|---|---|---|---|
| 23 s | 22 s | 30 s | 25 s | |
| 13 s | 15 s | 22 s | 18 s | |
| 7 s | 8 s | 12 s | 10 s | |
| 4.5 s | 5 s | 7 s | 6 s | |
| 3 s | 4 s | 5 s | 6 s | |
| 2.6 s | 3 s | 4 s | 5 s |
Table 4.
Schedulability of the Task Sets.
| m = 1 | m = 2 | m = 4 | m = 8 | m = 16 | m = 30 | |
|---|---|---|---|---|---|---|
| yes | yes | yes | yes | yes | yes | |
| no | yes | yes | yes | yes | yes | |
| no | no | yes | yes | yes | yes | |
| no | no | no | yes | yes | yes | |
| no | no | no | no | yes | yes | |
| no | no | no | no | no | yes |
© 2017 by the authors. Licensee MDPI, Basel, Switzerland. This article is an open access article distributed under the terms and conditions of the Creative Commons Attribution (CC BY) license (http://creativecommons.org/licenses/by/4.0/).
Share and Cite
MDPI and ACS Style
Kang, K.-D.; Chen, L.; Yi, H.; Wang, B.; Sha, M. Real-Time Information Derivation from Big Sensor Data via Edge Computing. Big Data Cogn. Comput. 2017, 1, 5. https://doi.org/10.3390/bdcc1010005
AMA Style
Kang K-D, Chen L, Yi H, Wang B, Sha M. Real-Time Information Derivation from Big Sensor Data via Edge Computing. Big Data and Cognitive Computing. 2017; 1(1):5. https://doi.org/10.3390/bdcc1010005
Chicago/Turabian StyleKang, Kyoung-Don, Liehuo Chen, Hyungdae Yi, Bin Wang, and Mo Sha. 2017. "Real-Time Information Derivation from Big Sensor Data via Edge Computing" Big Data and Cognitive Computing 1, no. 1: 5. https://doi.org/10.3390/bdcc1010005