Large Scale Product Recommendation of Supermarket Ware Based on Customer Behaviour Analysis
by
Andreas Kanavos
1,2,3,*, 
Stavros Anastasios Iakovou
1,4, 
Spyros Sioutas
2 and
Vassilis Tampakas
3 1
Computer Engineering and Informatics Department, University of Patras, Patras 26504, Greece
2
Department of Informatics, Ionian University, Corfu 49132, Greece
3
Computer & Informatics Engineering Department, Technological Educational Institute of Western Greece, Antirrion 12210, Greece
4
Department of Electronics and Computer Science, University of Southampton, Southampton SO17 1BJ, UK
*
Author to whom correspondence should be addressed.
Big Data Cogn. Comput. 2018, 2(2), 11; https://doi.org/10.3390/bdcc2020011
Submission received: 13 January 2018
/
Revised: 3 May 2018
/
Accepted: 3 May 2018
/
Published: 9 May 2018
Abstract
:In this manuscript, we present a prediction model based on the behaviour of each customer using data mining techniques. The proposed model utilizes a supermarket database and an additional database from Amazon, both containing information about customers’ purchases. Subsequently, our model analyzes these data in order to classify customers as well as products, being trained and validated with real data. This model is targeted towards classifying customers according to their consuming behaviour and consequently proposes new products more likely to be purchased by them. The corresponding prediction model is intended to be utilized as a tool for marketers so as to provide an analytically targeted and specified consumer behavior. Our algorithmic framework and the subsequent implementation employ the cloud infrastructure and use the MapReduce Programming Environment, a model for processing large data-sets in a parallel manner with a distributed algorithm on computer clusters, as well as Apache Spark, which is a newer framework built on the same principles as Hadoop. Through a MapReduce model application on each step of the proposed method, text processing speed and scalability are enhanced in reference to other traditional methods. Our results show that the proposed method predicts with high accuracy the purchases of a supermarket.
1. Introduction
During the last several years, the vast explosion of Internet data has fueled the development of Big Data management systems and technologies by companies, such as Google and Yahoo. The rapid evolution of technology and Internet has created huge volume of data at very high rate [1], deriving from commercial transactions, social networks, scientific research, etc. The mining and analysis of this volume of data may be beneficial for the humans in crucial areas such as health, economy, national security and justice [2], leading to more qualitative results. At the same time, the computational and management costs are quite high due to the ever-increasing volume of data.
Because customer analysis is the cornerstone of all organizations, it is essential for more and more companies to store their data into large data-centers aiming to initially analyze them and to further understand how their consumers behave. Concretely, a large amount of information is accessed and then processed by companies so as to get a deeper knowledge about their products’ sales as well as consumers’ purchases. Owners, from those who have small shops to large organizations, try to record information that probably contains useful data about consumers.
In addition to the abundance of Internet data, the rapid development of technology provides even higher quality regarding network services. More to this point, the Internet is utilized by a large number of users for information in each field, such as health, economy, etc. As a result, the companies are concentrated on users’ desired information and personal transactions in order to give their customers personalized promotions. Moreover, businesses provide their customers with cards so that they can record every buying detail and, thus, this procedure has led to a huge amount of data and search methods for data processing.
Historically, in the collection and processing of data, several analysts have been involved. Nowadays, the data volume requires the use of specific methods so as to enable analysts to export correct conclusions due to its heavy size. In addition, the increased volume drives these methods to use complex tools in order to perform automatic data analysis. Thus, the purpose of data collection can be now regarded a simple process.
The analysis of a dataset can be considered as a key aspect in understanding the way that customers think and behave during a specific period of the year. There are many classification and clustering methods that can provide great help to analysts in order to aid them broaching the consumers’ minds. More specifically, supervised machine learning techniques are utilized in the present manuscript in the process of mass marketing, and more in detail in the specific field of supermarket ware.
On the other hand, despite all this investment and technology, organizations still continue to struggle with personalizing customer and employee interactions. It is simply impractical as well as unsustainable for many analytic applications to be driven because it takes a long time to produce usable results in the majority of use cases. In particular, applications cannot generate and then automatically test a large number of hypotheses that are necessary to fully interpret the volume of data being captured. For addressing these issues, new and innovative approaches, which use Artificial Intelligence and Machine Learning methodologies, now enable accelerated personalization with fewer resources. The result is more practical and actionable with the use of customer insights, as will be shown in the present manuscript.
According to viral marketing [3], clients influence each other by commenting on specific fields of e-shops. In other words, one can state that e-shops work like virtual sensors producing a huge amount of data, i.e., Big Data. Practically, this method appears in our days when people communicate in real time and affect each other on the products they buy. The aim of our proposed model is the analysis of every purchase and the proposal of new products for each customer.
This article introduces an extended version of [4], whereas some techniques were as well utilized in [5]. Concretely, a work on modeling and predicting customer behavior using information concerning supermarket ware is discussed. More specifically, a new method for product recommendation by analyzing the purchases of each customer is presented; with use of specific dataset’s categories, we were able to classify the aforementioned data and subsequently create clusters.
More to the point, the following steps are performed: initially, the analysis of the sales rate as Big Data analytics with the use of MapReduce and Spark implementation is utilized. Then, the distances of each customer from the corresponding supermarket are clustered and accordingly the prediction of new products that are more likely to be purchased from each customer separately is implemented. Furthermore, with the use of three well-known techniques, e.g., Vector Space Model, Term Frequency-Inverse Document Frequency (Tf-Idf) and Cosine Similarity, a novel framework is introduced. Concretely, opinions, reviews, and advertisements, as well as different texts that consider customer’s connection towards supermarkets, are taken into account in order to measure customer’s behavior. The proposed framework is based on the measurement of text similarity by applying cloud computing infrastructure.
In our approach, we handle the scalability bottleneck of the existing body of research by employing cloud programming techniques. Existing works that deal with customers’ buying habits as well as purchases analysis do not address the scalability problem at hand, so we follow a slightly different approach. In our previous work [4], we followed similar algorithmic approaches, but, in main memory, while here we extend and adapt our approach in the cloud environment addressing the need for Big Data processing.
Furthermore, the proposed work can be successfully applied to other scenarios as well. Data mining undoubtedly plays a significant role in the process of mass marketing where a product is promoted indiscriminately to all potential customers. This can be implemented by allowing the construction of models that predict a customer’s response given their past buying behavior as well as any available demographic information [6]. In addition, one key aspect in our proposed work is that it treats each customer in an independent way; that is, a customer can make a buying decision without knowing what all the other customers usually buy. In this case, we do not consider the influence that is usually taken into account when dealing with such situations as friends, business partners and celebrities often affect customers’ buying habit patterns [7].
The remainder of the paper is structured as follows: Section 2 discusses the related work. Section 3 presents in detail the techniques that have been chosen, while, in Section 4, our proposed method is described. Additionally, in Section 5, the distributed architecture along with the algorithm paradigms in pseudocode and further analysis of each step are presented. We utilize our experiments in Section 6, where Section 7 presents the evaluation experiments conducted and the results gathered. Ultimately, Section 8 describes conclusions and draws directions for future work.
2. Related Work
Driven by real-world applications, managing and mining Big Data have shown to be a challenging yet very compelling task. While the term “Big Data” literally concerns data volumes, on the other hand, the HACE (heterogeneous, autonomous, complex and evolving) theorem [8] suggests that Big Data consist of the following three principal characteristics: huge with diverse and heterogeneous data sources, autonomous with decentralized and distributed control, and finally complex and evolving regarding data and knowledge associations. Another definition for Big Data is given in [9], mainly concerning people and their interactions; more specifically, authors regard the Big Data nature of digital social networks as the key characteristic. The abundance of information on users’ message interchanges among peers is not taken lightly; this will aid us to extract users’ personality information for inferring network social influence behaviour.
The creation as well as the accumulation of Big Data is a fact for a plethora of scenarios nowadays. Sources like the increasing diversity sensors along with the content created by humans have contributed to the enormous size and unique characteristics of Big Data. Making sense of this information and these data has primarily rested upon Big Data analysis algorithms. Moreover, the capability of creating and storing information nowadays has become unparalleled. Thus, in [10], the gargantuan plethora of sources that leads to information of varying type, quality, consistency, large volume, as well as the creation rate per time unit has been identified. The management and analysis of such data (i.e., Big Data) are unsurprisingly a prominent research direction as pointed out in [11].
In recent years, regarding sales transaction systems, a large percentage of companies maintain such electronic systems, thus aiming at creating a convenient and reliable environment for their customers. In this way retailers are enabled to gather significant information for their customers. As stated below, since the number of data is significantly increasing, more and more researchers have developed efficient methods and rule algorithms for smart market basket analysis [12]. The “Profset model” is an application that researchers have developed for optimal product selection on supermarket data. By using cross-selling potential, this model has the ability to select the most interesting products from a variety of ware. Additionally, in [13], the authors have analyzed and in following designed an e-supermarket shopping recommender. Researchers have also invented a new recommendation system where supermarket customers were able to get new products [14]; in this system, matching products and clustering methods are used in order to provide less frequent customers with new products.
Moreover, new advertising methods based on alternative strategies have been utilized from companies in order to achieve increasing purchases. Such a model was introduced in [3] having an analysis of a person-to-person recommendation network with 4 million people along with 16 million recommendations. The effectiveness of the recommendation network was illustrated by its increasing purchases. A model regarding a grocery shop for analyzing how customers respond to price and other point-of-purchase information was created in [15]. Another interesting model is presented in [16], where authors analyzed the product range effect in purchase data. Specifically, since market society is affected by two factors, e.g., diversity and rationality in the price system, consumers try to minimize their spending and in parallel maximize the number of products they purchase. Thus, researchers invented an analytic framework based on customers’ transaction data where they found out that customers did not always choose the closest supermarket.
Some supermarkets are too big for consumers to search and to find the desirable product. Hence, in [17], a recommendation system targeted towards these supermarkets has been created; using RFID technology with mobile agents, authors constructed a mobile-purchasing system. Furthermore, in [18], the authors presented another recommendation system based on the past actions of individuals, where they provided their system to an Internet shopping mall in Korea. In point of fact, in [19], a new method on personalized recommendation in order to get further effectiveness and quality since collaborative methods presented limitations such as sparsity, is considered. Regarding Amazon.com, they used for each customer many attributes, including item views and subject interests, since they wanted to create an effective recommendation system. This view is echoed throughout [20], where authors analyzed and compared traditional collaborative filtering, cluster models and search-based methods. In addition, Weng and Liu [21] analyzed customers’ purchases according to product features and as a result managed to recommend products that are more likely to fit with customers’ preferences.
Besides the development of web technologies, the colourfulness of social networks has created a huge number of reviews on products and services, as well as opinions on events and individuals. This has led to consumers been used to being informed by other users’ reviews in order to carry out a purchase of a product, service, etc. One other major benefit is that businesses are really interested in the awareness of the opinions and reviews concerning all of their products or services and thus appropriately modify their promotion along with their further development. As a previous work on opinion clustering emerging in reviews, one can consider the setup presented in [22]. Furthermore, the emotional attachment of customers to a brand name is a topic of interest in recent years in the marketing literature; it is defined as the degree of passion that a customer feels for the brand [23]. One of the main reasons for examining emotional brand attachment is that an emotionally attached person is highly probable to be loyal and pay for a product or service [24]. In [25], authors infer details on the love bond between users and a brand name through their tweets and this bond is considered as a dynamic ever evolving relationship. Thus, the aim is to find those users that are engaged and rank their emotional terms accordingly.
Efficient analysis methods in the era of Big Data is a research direction receiving great attention [26]. The perpetual interest to efficient knowledge discovery methods is mainly supported by the nature of Big Data and the fact that, in each instance, Big Data cannot be handled and processed to extract knowledge by most current information systems. Current experience with Cloud Computing applied to Big Data usually revolves around the following sequence as in [27]: preparation for a processing job, submission of the job, usually anticipating for an unknown amount of time for results, receive feedback for the internal processing events and finally receive results.
Large scale data such as graph datasets from social or biological networks are commonplace in applications and need a different handling in case of storing, indexing and mining. One well known method to facilitate large-scale distributed applications is MapReduce [28] proposed by Dean and Ghemawat.
For measuring similarity among texts in the cloud infrastructure, many research works have been proposed in the last several years. Initially, in [29], a method that focuses on a MapReduce algorithm for computing pairwise document similarity in large document collections is introduced. Also in [30], a method using the MapReduce model, in order to improve the efficiency of traditional Tf-Idf algorithm is created. Along the same line of reasoning, the authors in [31] propose the use of the Jaccard similarity coefficient between users of Wikipedia based on co-occurrence of page edits with the use of the MapReduce framework. Another piece of supplementary research in reference to large-scale data-sets is utilized in [32], where a parallel K-Means algorithm based on MapReduce framework is proposed.
3. Preliminaries
In this current work, three techniques described in detail below, have been chosen in order to better emphasize the output of the methodology: Vector Space Model, Tf-Idf and Cosine Similarity. These techniques were also utilized in the previous work [5].
3.1. Vector Space Model
Vector Space Model [33] is an algebraic model for the representation of text documents as vectors. Each term of a document and each number of occurrences in the document could be represented [34] with the use of current model. For instance, based on a vocabulary , the document “This is a vector, this is algebra” could be represented as follows:
where is the document and is the term frequency of the t-term in the document.
We consider .
3.2. Tf-Idf
Tf-Idf (Term Frequency-Inverse Document Frequency) [35] is a numerical statistic that reflects the significance of a term in a document given a certain corpus. The importance increases proportionally to the number of times that a word appears in the document but is offset by the frequency of the word in the corpus. Tf-Idf algorithm is usually used in search engines, text similarity computation, web data mining, as well as other applications [2,36] that are often faced with massive data processing. According to Li [30], the Tf-Idf measure of a term is calculated by the use of the following Equation (1):
3.3. Cosine Similarity
Cosine Similarity [37] is a measure of similarity between two vectors of an inner product space that measures the cosine of the angle between them. Regarding document clustering, different similarity measures are available, whereas the Cosine Similarity is the one being most commonly used. Specifically, for two documents A and B, the similarity between them is calculated by the use of the following Equation (2):
when this measure takes bigger values (close to 1), then the two documents are identical, and, when it takes values close to 0, this indicates that there is nothing in common between them (i.e., their document vectors are orthogonal to each other). Please notice that usually the attribute vectors A and B are the term frequency vectors of the documents.
3.4. MapReduce Model
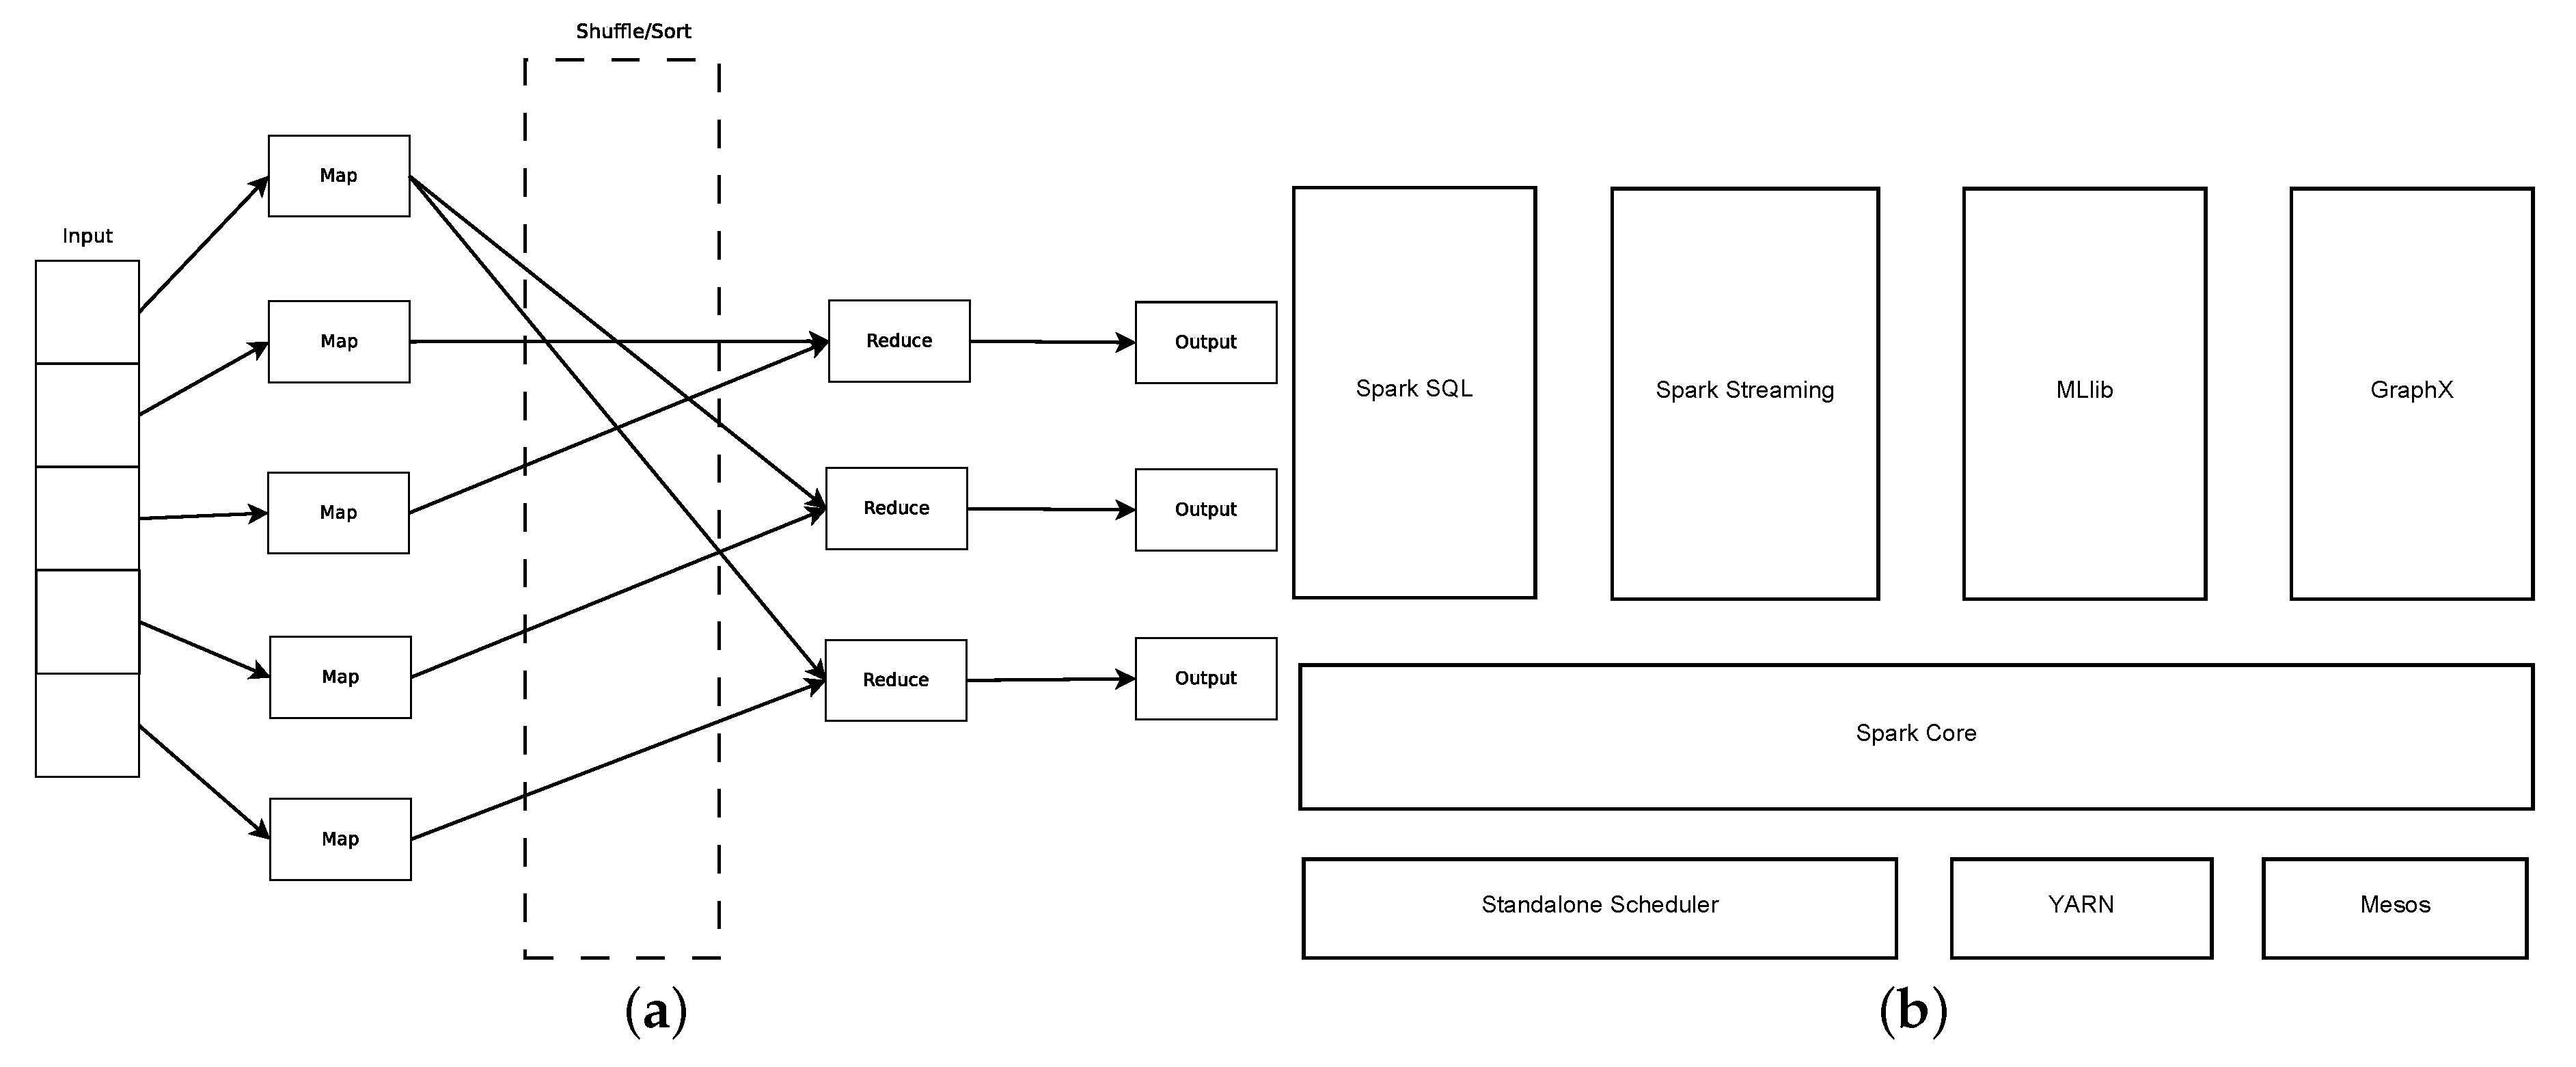
MapReduce is a programming model that enables the process of large datasets on a cluster using a distributed and parallel algorithm [28]. The MapReduce paradigm is derived from the Map and Reduce functions of the Functional Programming model [38]. The data processing in MapReduce is based on input data partitioning; the partitioned data is executed by a number of tasks in many distributed nodes. A MapReduce program consists of two main procedures, Map() and Reduce(), respectively, and is executed in three steps: Map, Shuffle and Reduce. In the Map Phase, input data are partitioned and each partition is given as an input to a worker that executes the map function. Each worker processes the data and outputs key-value pairs. In the Shuffle Phase, key-value pairs are grouped by key and each group is sent to the corresponding Reducer.
A user can define their own Map and Reduce functions depending on the purpose of their application. The input and output formats of these functions are simplified as key-value pairs. Using this generic interface, the user can solely focus on their own problem. They do not have to care how the program is executed over the distributed nodes, about fault tolerant issues, memory management, and so forth. The architecture of MapReduce model is depicted in Figure 1a. Apache Hadoop [39] is a popular open source implementation of the Map Reduce model. It allows storage and large-scale data processing across clusters of commodity servers [40]. The innovative aspect of Hadoop is that there is no absolute necessity of expensive, high-end hardware. Instead, it enables distributed parallel processing of massive amounts of data [41] on industry-standard servers with high scalability for both data storing and processing.
3.5. Spark Framework
Apache Spark Framework [42,43] is a newer framework built on the same principles as Hadoop. While Hadoop is ideal for large batch processes, it drops in performance in certain scenarios, as in iterative or graph based algorithms. Another problem of Hadoop is that it does not cache intermediate data for faster performance, but, instead, it flushes the data to the disk between each step. In contrast, Spark maintains the data in the workers’ memory and, as a result, it outperforms Hadoop in algorithms that require many operations. It is a unified stack of multiple closely integrated components and overcomes the issues of Hadoop. In addition, it has a Directed Acyclic Graph (DAG) execution engine that supports cyclic data flow and in-memory computing. As a result, it can run programs up to faster than Hadoop in memory, or faster on disk. Spark offers API in Scala, Java, Python and R and can operate on Hadoop or standalone while using HDFS (Hadoop Distributed File System), Cassandra or HBase. The architecture of Apache Spark Framework is depicted in Figure 1b.
3.6. MLlib
Spark’s ability to perform well on iterative algorithms makes it ideal for implementing Machine Learning Techniques as, in their vast majority, Machine Learning algorithms are based on iterative jobs. MLlib [44] is Apache Spark’s scalable machine learning library and is developed as part of the Apache Spark Project. MLlib contains implementations of many algorithms and utilities for common Machine Learning techniques such as Clustering, Classification, and Regression.
4. Proposed Method
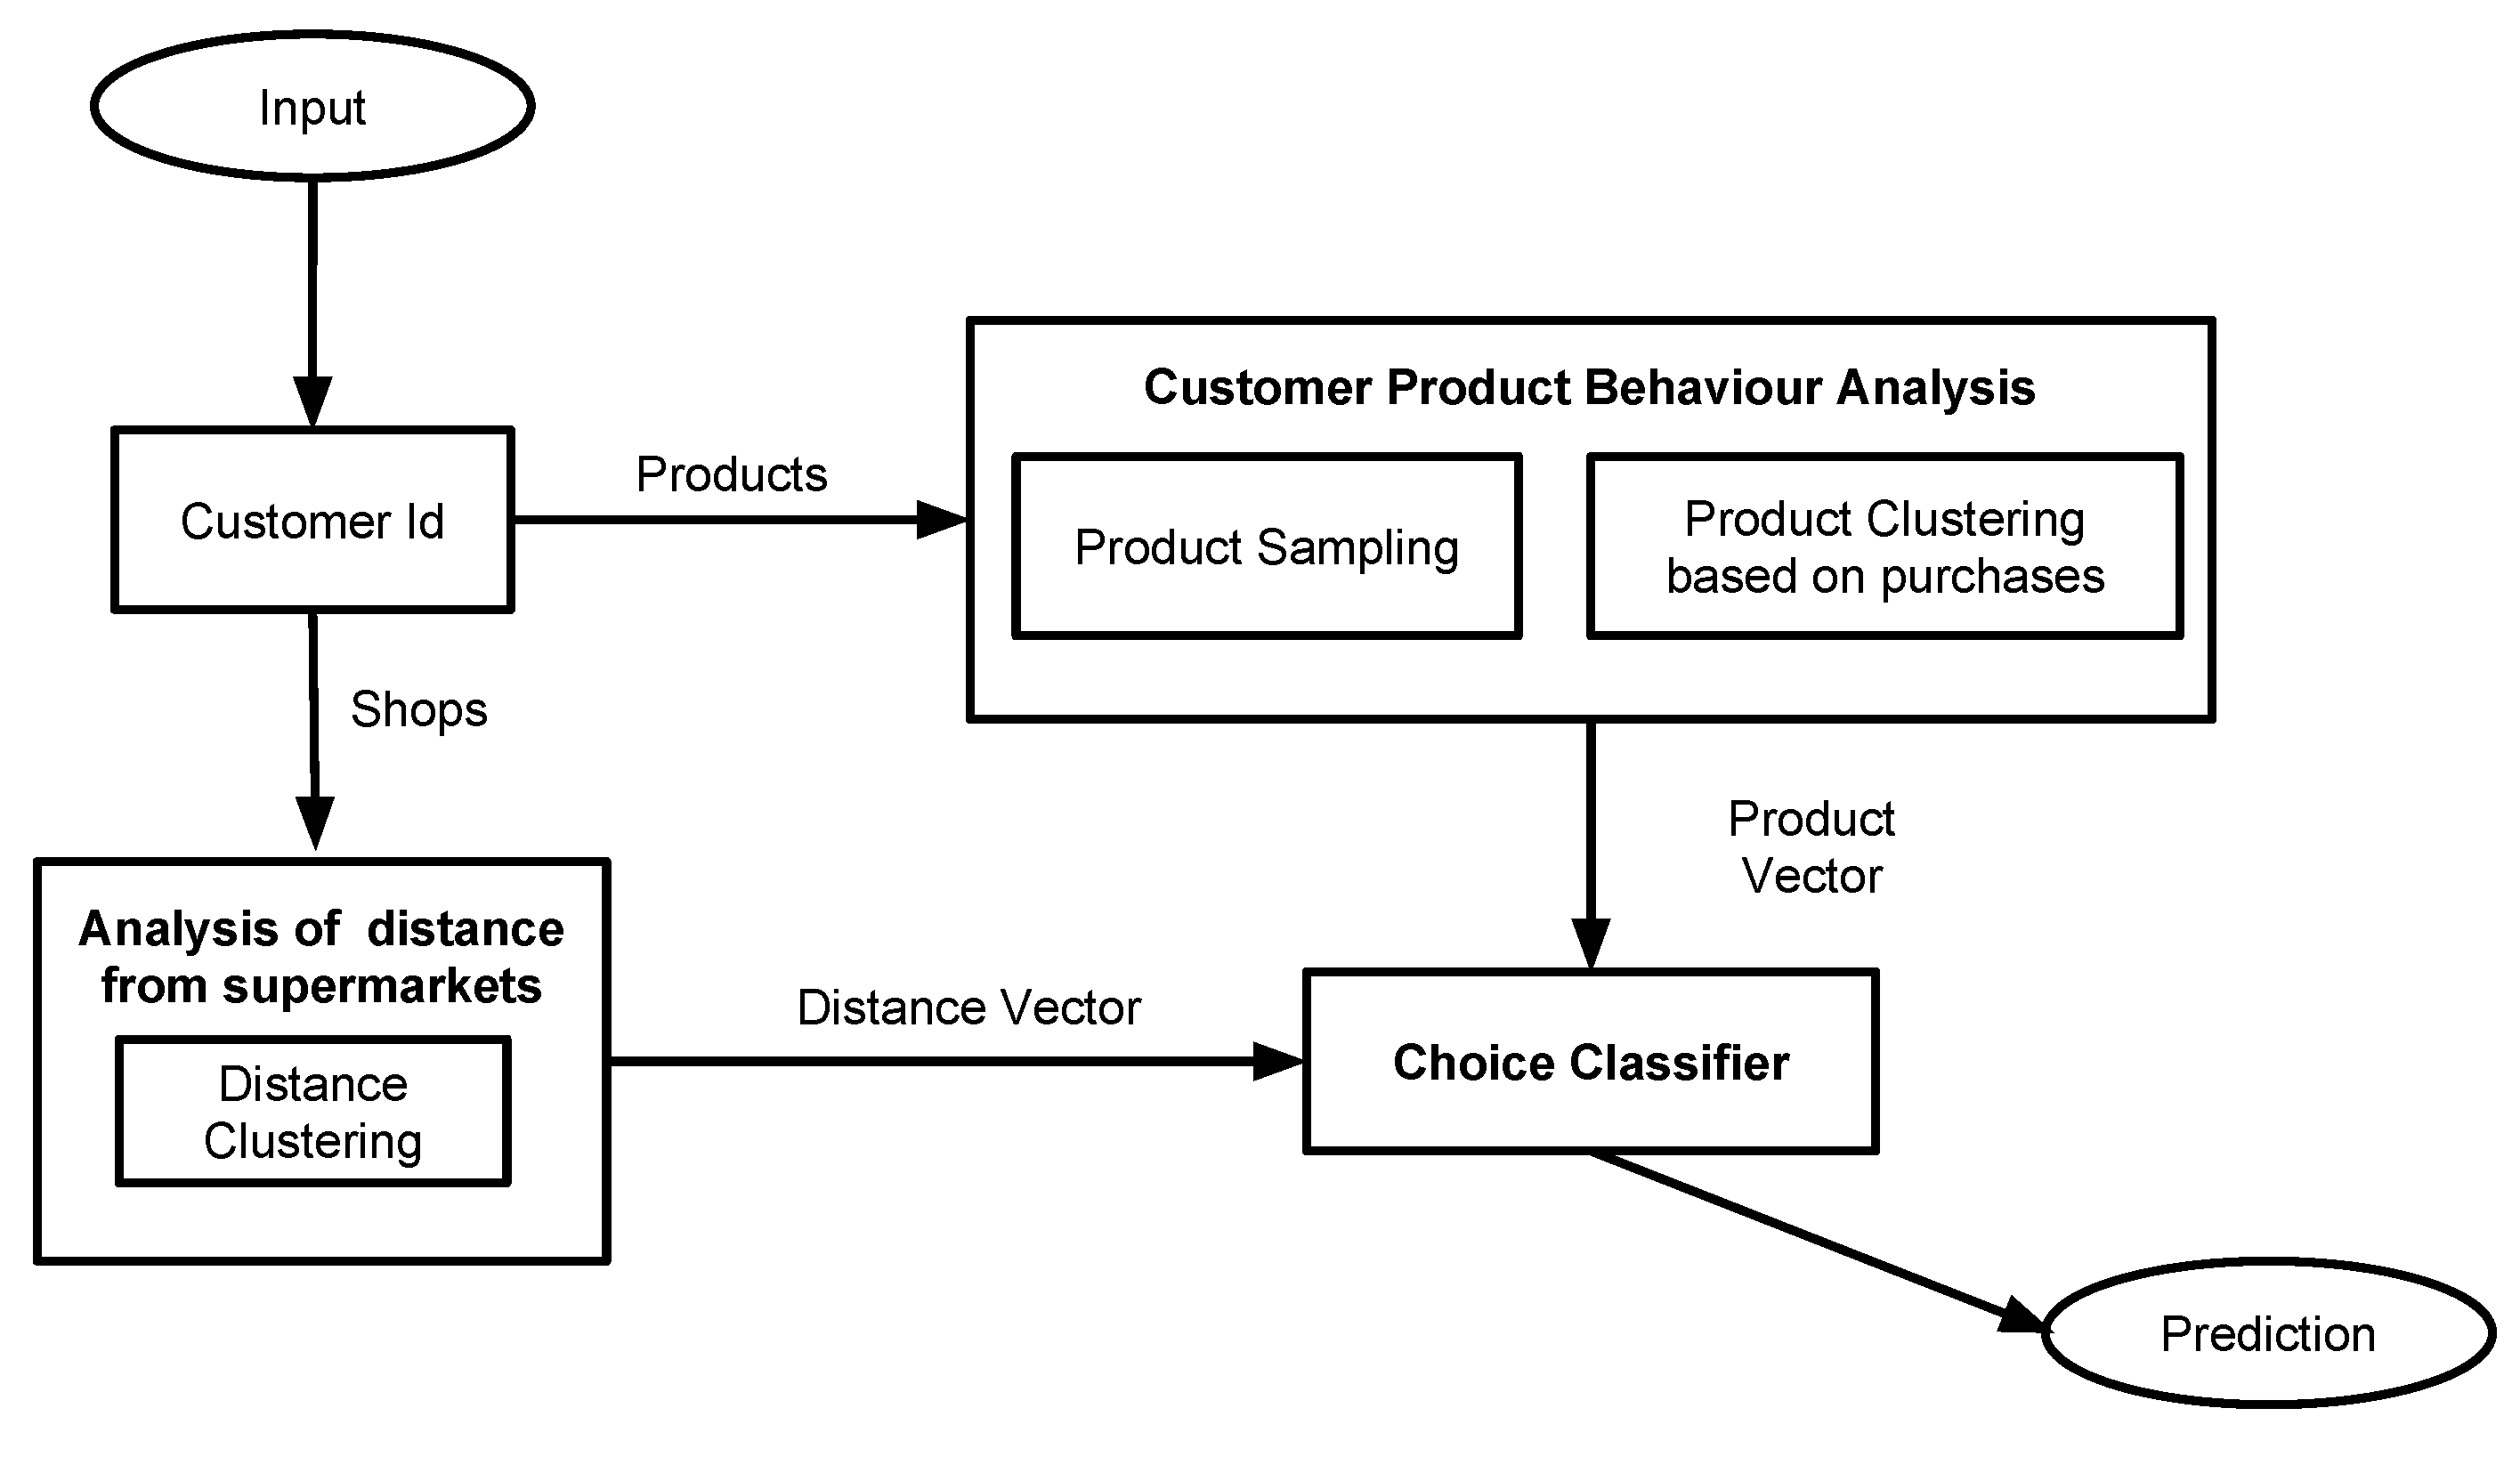
In our model, given a supermarket ware dataset, our utmost goal is the prediction whether a customer will purchase or not a product using data analytics and machine learning algorithms. This problem can be considered as a classification one since the opinion class consists of specific options. Furthermore, we have gathered the reviews of Amazon (Seattle, Washington, USA) and in particular the reviews of each customer, in order to analyze the effect of person-to-person influence in each product’s market.
The overall architecture of the proposed system is depicted in Figure 2 while the proposed modules and sub-modules of our model are modulated in the following steps.
As a next step, we have developed two systems; the first in the MapReduce and the second in the Apache Spark framework for programming with Big Data. Precisely, an innovative method for measuring text similarity with the use of common techniques and metrics is proposed. In particular, a prospective of applying Tf-Idf [35] and Cosine Similarity [45] measurements on distributed text processing is further analyzed where the component of document pairwise similarity calculation is included. In particular, this method performs pairwise text similarity with the use of a parallel and distributed algorithm that scales up, regardless of the massive input size.
The proposed method consists of two main components: Tf-Idf and Cosine Similarity, where these components are designed by following the concept of the MapReduce programming model. Initially, the terms of each document are counted and the texts are then normalized with the use of Tf-Idf. Finally, Cosine Similarity of each document pair is calculated and the results are obtained. One major characteristic of the proposed method is that it is faster and more efficient compared to the traditional methods; this is due to the MapReduce model implementation in each algorithmic step that tends to enhance the efficiency of the method as well as the aforementioned innovative blend of techniques.
4.1. Customer Metrics Calculation
From the supermarket dataset, four datasets with varying number of records (e.g., , , and ) regarding customers’ purchases, containing information about sales over a vast period of four years, have been randomly sampled. More specifically, the implementation of our method can be divided into the following steps: initially, the customers along with the products are sampled while, subsequently, the clustering of the products based on the sales rate takes place. Then, the customers related on the distance of their houses from the supermarket are clustered and a recommendation model, with new products separately proposed to each customer based on their consumer behavior, is utilized. Finally, we sampled the customers of Amazon and then, using the ratings of the reviews, we came up with the fraction of the satisfied customers.
The training set of the supermarket data consists of eight features, as presented in the following Table 1 (where we have added a brief description), including customer ID, category of the product, product ID, shop, number of purchased items, distance from each supermarket, price of the product as well as the choice.
4.2. Decision Analysis
Here, we describe the choice analysis based on classification and clustering tools. This method gathers eight basic features from the given supermarket database as well as eleven different classification methods in order to further analyze our dataset. In [14], researchers have considered clustering with the aim of identifying customers with similar spending history. Furthermore, as authors in [46] indicate, the loyalty of customers to a certain supermarket is measured in different ways; that is, a person is considered to be loyal towards a specific supermarket if they purchase specific products and also visit the store on a regular basis. Despite the fact that the percentage of loyal customers seems to be less than , they purchase more than of the total amount of products.
Since the supermarket dataset included only numerical values for each category, we have created our own clusters in terms of customers as well as products. More concretely, we have measured the sales of each product and the distances, and we have then created three clusters for products as well as two classes for distances.
More to the point, an organization, in order to measure the impact of various marketing channels, such as social media, outbound campaigns as well as digital advertising response, might have the following inputs:
- Customer demographics, like gender, age, wealth, education and geolocation,
- Customer satisfaction scores,
- Recommendation likeliness,
- Performance measures, such as email click-through, website visits including sales transaction metrics across categories.
5. Distributed Architecture
The proposed method for measuring text similarity applying cloud computing infrastructure consists of four stages. Initially, occurrences of each condition in terms of given documents are counted (Word Count) and the frequency of every term in each document is measured (Term Frequency). Thereafter, the Tf-Idf metric of each term is measured (Tf-Idf) and finally the cosine similarities of the pairs are calculated in order to estimate the similarity among them (Cosine Similarity). The MapReduce model has been used for designing each one of the above-mentioned steps. The algorithm paradigm in pseudocode and further analysis of each step is presented in the following subsections in detail.
MapReduce Stages
In the first implementation stage, the occurrences of each word in every document are counted. The algorithm applied is presented in Algorithm 1.
| Algorithm 1 Word Count. |
| 1: function 2: Method 3: for each do 4: write 5: end for 6: end function 7: 8: function 9: Method 10: 11: for each do 12: 13: end for 14: return ▹ number of occurences 15: end function |
Initially, each document is divided into key-value pairs, whereas the term is considered as the key and the number (equals to 1) is considered as the value. This is denoted as where the key corresponds to the term and the value to the number one, respectively. This phase is known as the Map Phase. In the Reduce Phase, each pair is taken and the sum of the list of ones for the term is computed. Finally, the key is set as the tuple and the value as the number of occurrences, respectively.
Furthermore, regarding the second implementation phase, the overall number of terms of each document is computed as described in Algorithm 2.
Regarding the Map Phase of this algorithm implementation, the input is divided into key-value pairs, whereas the is considered as the key and the tuple is considered as the value. In the Reduce Phase of the algorithm, the total number of terms in each document is counted and the key-value pairs are returned; that is, the as the key and the tuples as the value, where N is the total number of terms in the document.
| Algorithm 2 Term Frequency. |
| 1: function 2: Method 3: for each do 4: write 5: end for 6: end function 7: 8: function 9: Method 10: 11: for each do 12: 13: end for 14: return 15: end function |
In the third implementation stage, the Tf-Idf metric of each term in a document is computed with the use of the following Equation (3) as presented in Algorithm 3:
where |D| is the number of the documents in corpus and is the number of documents where t-term appears.
| Algorithm 3 Tf-Idf. |
| 1: function 2: Method 3: for each do 4: write 5: end for 6: end function 7: 8: function 9: Method 10: 11: for each do 12: 13: 14: ▹ number of documents in corpus 15: end for 16: return 17: end function |
By applying the Algorithm 3 during the Map Phase, the term is set as the key and the tuple as the value. In that case, the number of documents is calculated during the Reduce Phase, where the term appears and the result to the n variable is set. The term frequency is subsequently calculated plus the inverse document frequency of each term as well. Finally, key-value pairs with the as the key and the tuple as the value are taken as a result.
In the fourth and final implementation phase, all of the possible combinations of two document pairs are provided and then the cosine similarity for each of these pairs is computed as presented in Algorithm 4. Assuming that there are n documents in the corpus, a similarity matrix is generated as in the following Equation (4):
| Algorithm 4 Cosine Similarity. |
| 1: function 2: Method 3: 4: for to do 5: for to do 6: write 7: end for 8: end for 9: end function 10: 11: function 12: Method 13: 14: 15: 16: return 17: end function |
In the Map Phase of Algorithm 4, every potential combination of the input documents is generated and the document for the key as well as the vectors for the value is set. Within the Reduce Phase, the Cosine Similarity for each document pair is calculated and the similarity matrix is also provided. This algorithm is visualized as follows in Figure 3.
6. Implementation
The first stage of the implementation process was the data cleaning. In the dataset utilized, there was a small number of missing values. In general, there are several methods for data imputation depending on the features of the dataset. In our case, the missing values were imputed by the mean value of each feature. The main reason that the corresponding method was implemented is that the number of missing values was too small (less than ) and other methods like linear regression would be time-consuming for the whole process.
After finishing with the data cleaning process, consumers were categorized according to the amount of money they spend at the supermarket. More specifically, we created three consumer categories, A, B and C, which correspond to the average money they pay on a regular basis. In addition, the same process with three categories was implemented for the distance of each consumer’s house from the supermarket. The overall implementation is presented in terms of Map-Reduce model as follows in Algorithm 5.
| Algorithm 5 Distributed Implementation. |
| 1: function 2: Method 3: for each do 4: cluster consumers into three categories based on budget spent 5: end for 6: for each do 7: consumer’s details are processed by the same reducer 8: end for 9: end function 10: 11: function 12: Method ▹ Recommend products with highest similarity score for every consumer that haven’t been purchased 13: 14: for each do 15: 16: 17: 18: 19: end for 20: find 21: for each do 22: compute cosine_similarity(consumer, consumers_list) 23: end for 24: for each do 25: recommend consumer’s products with the highest similarity 26: end for 27:end function |
6.1. Datasets
The present manuscript utilizes two datasets, e.g., a supermarket database [16] as well as a database from Amazon [3], which contains information about the purchases of customers.
Initially, we started our experiments with the supermarket database [16] and we extracted the data using C# language in order to calculate customer metrics. We have implemented an application where we measured all the purchases of the customers and then several samples of the customers, so as to further analyze the corresponding dataset, were collected. The five final datasets consist of , , , and randomly selected purchases with all the information from the supermarket dataset as previously mentioned.
The prediction of any new purchase is based on the assumption that every customer can be affected by any other one due to the fact that consumers communicate every day and exchange reviews for products. On the other hand, being budget conscious, they are constricted to select products that correspond better to their needs. Therefore, a model that recommends new products to every customer from the most preferred supermarket, is proposed.
By analyzing the prediction model, information about consumers’ behavior can be extracted. We measured the total amount of products that customers purchased and then categorized them accordingly. Several classifiers are trained using the dataset of vectors. We separated the dataset and we used 10-Fold Cross-Validation to evaluate training and test sets. The classifiers that were chosen are evaluated using TP (True Positive) rate, FP (False Positive) rate, Precision, Recall, as well as F-Measure metrics. We chose classifiers from five major categories of the Weka library [47] including “bayes”, “functions”, “lazy”, “rules” and “trees”.
Additionally, we evaluated a model using the results of our experiments on Amazon [3] since we wanted to measure the number of customers in terms of five product categories, namely book, dvd, music, toy and video. In Table 2, we present the number of delighted and, on the other hand, the number of unsatisfied customers.
Figure 4 illustrates the amount of customers who are satisfied with products of every category out of the aforementioned ones. We can observe that the number of satisfied customers is much bigger than the unsatisfied in four out of five categories (regarding category entitled toy, the number is equal to 1 for both category of customers). With these results, one can easily figure out that Amazon customers are loyal to the corresponding company and prefer purchasing products from the abovementioned categories.
6.2. Cloud Computing Infrastructure
A series of experiments for evaluating the performance of our proposed method under many different perspectives is conducted. More precisely, we have implemented the algorithmic framework by employing the cloud infrastructure. We used the MapReduce Programming Environment as well as Apache Spark, which is a newer framework built on the same principles as Hadoop.
Our cluster includes four computing nodes (VMs), each one of which has four GHz CPU processors, GB of memory, 45 GB hard disk and the nodes are connected by 1 gigabit Ethernet. On each node, Ubuntu as operating system, Java with a 64-bit Server VM, as well as Hadoop and Spark were installed.
One of the VMs serves as the master node and the other three VMs as the slave nodes. Furthermore, the following changes to the default Hadoop and Spark configurations are applied; 12 total executor cores (four for each slave machine) are used, the executor memory is set equal to 8 GB and the driver memory is set equal to 4 GB.
7. Evaluation
7.1. Classification Performance
The reported values in the charts for the classification models are recorded as AdaBoost, J48, JRip, Multilayer Perceptron, PART, REPTree, RotationForest and Sequential Minimal Optimization (SMO) as presented in Table 3, Table 4, Table 5 and Table 6 and Figure 5. The results for each classifier for their several values are illustrated in Table 3. Depicted in bold are the selected best classifiers for each value. Furthermore, Figure 5 depicts the values of F-Measure for each classifier for the five selected different number of randomly selected purchases.
Regarding the dataset size of randomly selected purchases, we can observe that J48 achieves the highest score in every category except the FP rate. Subsequently, REPTree follows with almost TP rate and F-Measure, whereas JRip has a value of F-Measure equal to . In addition, concerning F-Measure metric, the other algorithms range from of Multilayer Perceptron to of Rotation Forest. Moreover, we see that almost all classifiers achieve a TP rate value of above , while the percentages for FP rate are relatively smaller. Precision and Recall metrics have almost the same values for each classifier, ranging between and .
In Table 4, Table 5 and Table 6, the TP rate, FP rate, Precision, Recall, as well as F-Measure metrics for the classification of three concrete algorithms (i.e., AdaBoost, J48 as well as Multilayer Perceptron) for different dataset sizes is presented. It is obvious that the dataset size plays a rather significant role for three of these classifiers. Specifically, regarding AdaBoost, the F-Measure value rises from almost for a dataset of purchases to almost for the dataset of purchases; this is actually a rise of about to . Following the aforementioned classifier, the performance of J48 and Multilayer Perceptron is not heavily affected by the amount of the purchases in the dataset as the corresponding increases are and , respectively.
7.2. Running Time
In this subsection, the results for the running time regarding multi-class and binary classification while measuring the scalability of our proposed model are presented in Table 7. The running time of our implementation using MapReduce as well as Spark against an implementation on a regular machine is compared. In addition, on the classification process, we experiment not only with binary features, but also with class and binary features. Furthermore, by using class and binary features, we extend the execution time since more calculations are necessary in order to create the classes.
It is expected that MapReduce implementation slightly boost the execution time performance and Spark manages to boost even more the execution time performance. Regarding MapReduce, the level of time reduction for the binary case reaches 70%, while for the class and binary case, the percentage touches a 50%. On the other hand, regarding Spark against MapReduce, the level of time reduction for the binary case reaches 55%, while, for the class and binary case, the percentage is 60%. Despite needing more preprocessing time to send input to appropriate reducers, in the end, it pays off since the computational cost in every node is smaller.
7.3. Speedup
In this subsection, the effect of the number of computing nodes for both MapReduce and Spark implementation is estimated. Three different cluster configurations are tested where the cluster consists of slave nodes each time. Table 8 and Table 9 present the running time-speedup per slave nodes. Moreover, as stated in the previous subsection, we experiment not only with binary features, but also with class and binary features.
We observe that the total running time of our solution tends to decrease as we add more nodes to the cluster for both implementations. Due to the increment of number of computing nodes, the intermediate data are decomposed to more partitions that are processed in parallel. As a result, the amount of computations that each node undertakes decreases, respectively.
8. Conclusions
In the proposed work, we have presented a methodology for modelling and predicting the purchases of a supermarket using machine learning techniques. More specifically, two datasets are utilized: a supermarket database as well as a database from Amazon that contains information about the purchases of customers. Given the analysis of the dataset from Amazon, a model that predicts new products for every customer based on the category and the supermarket customers prefer is created. We have also examined the influence of person-to-person communication, where we found that customers are greatly influenced by other customer reviews.
More to the point, we handle the scalability bottleneck of existing works by employing cloud programming techniques. Concretely, the analysis of the sales rate as Big Data analytics with the use of MapReduce and Spark implementation is utilized. Furthermore, with use of three well-known techniques, e.g., Vector Space Model, Tf-Idf and Cosine Similarity, a novel framework is introduced. Concretely, opinions, reviews, and advertisements as well as different texts that consider customer’s connection towards supermarkets, are taken into account in order to measure customer’s behavior. The proposed framework is based on the measurement of text similarity by applying cloud computing infrastructure.
As future work, we plan to create a platform using the recommendation network. Customers will have the opportunity to choose among many options on new products with lower prices. In the future, we plan to extend and improve our framework by taking into consideration more features of the supermarket datasets that may be added in the feature vector and will improve the classification accuracy. One other future consideration is the experimentation with different clusters so as to better evaluate Hadoop’s and Spark’s performance in terms of time and scalability. In conclusion, we could use a survey to have further insights and get an alternative verification of user’s engagement.
Author Contributions
A.K., S.A.I., S.S. and V.T. conceived of the idea, designed and performed the experiments, analyzed the results, drafted the initial manuscript and revised the final manuscript.
Conflicts of Interest
The authors declare no conflict of interest.
References
- The World’s Technological Capacity to Store, Communicate, and Compute Information. Available online: http://www.martinhilbert.net/worldinfocapacity-html/ (accessed on 3 May 2018).
- Han, J.; Pei, J.; Kamber, M. Data Mining: Concepts and Techniques; Elsevier: New York, NY, USA, 2011. [Google Scholar]
- Leskovec, J.; Adamic, L.A.; Huberman, B.A. The Dynamics of Viral Marketing. ACM Trans. Web 2007, 1. [Google Scholar] [CrossRef]
- Iakovou, S.A.; Kanavos, A.; Tsakalidis, A.K. Customer Behaviour Analysis for Recommendation of Supermarket Ware. In Proceedings of the 12th IFIP International Conference and Workshops (AIAI), Thessaloniki, Greece, 16–18 September 2016; pp. 471–480. [Google Scholar]
- Victor, G.S.; Antonia, P.; Spyros, S. CSMR: A Scalable Algorithm for Text Clustering with Cosine Similarity and MapReduce. In Proceedings of the Artificial Intelligence Applications and Innovations (AIAI), Rhodes, Greece, 19–21 September 2014; pp. 211–220. [Google Scholar]
- Ling, C.X.; Li, C. Data Mining for Direct Marketing: Problems and Solutions. In Proceedings of the 4th International Conference on Knowledge Discovery and Data Mining (KDD), New York, NY, USA, 27–31 August 1998; pp. 73–79. [Google Scholar]
- Domingos, P.M.; Richardson, M. Mining the network value of customers. In Proceedings of the 7th ACM SIGKDD International Conference on Knowledge Discovery and Data Mining (KDD), San Francisco, CA, USA, 26–29 August 2001; pp. 57–66. [Google Scholar]
- Wu, X.; Zhu, X.; Wu, G.; Ding, W. Data Mining with Big Data. IEEE Trans. Knowl. Data Eng. 2014, 26, 97–107. [Google Scholar]
- Boyd, D. Privacy and Publicity in the Context of Big Data. In Proceedings of the 19th International Conference on World Wide Web (WWW), Raleigh, CA, USA, 26–30 April 2010. [Google Scholar]
- Laney, D. 3D Data Management: Controlling Data Volume, Velocity, and Variety. META Group Res. Note 2001, 6, 70. [Google Scholar]
- Hashem, I.A.T.; Yaqoob, I.; Anuar, N.B.; Mokhtar, S.; Gani, A.; Khan, S.U. The Rise of “Big Data” on Cloud Computing: Review and Open Research Issues. Inf. Syst. 2015, 47, 98–115. [Google Scholar] [CrossRef]
- Brijs, T.; Goethals, B.; Swinnen, G.; Vanhoof, K.; Wets, G. A Data Mining Framework for Optimal Product Selection in Retail Supermarket Data: The Generalized PROFSET Model. In Proceedings of the Sixth ACM SIGKDD International Conference on Knowledge Discovery and Data Mining, Boston, MA, USA, 20–23 August 2000; pp. 300–304. [Google Scholar]
- Li, Y.; Zuo, M.; Yang, B. Analysis and design of e-supermarket shopping recommender system. In Proceedings of the 7th International Conference on Electronic Commerce (ICEC), Xi’an, China, 15–17 August 2005; pp. 777–779. [Google Scholar]
- Lawrence, R.D.; Almasi, G.S.; Kotlyar, V.; Viveros, M.S.; Duri, S. Personalization of Supermarket Product Recommendations. Data Min. Knowl. Discov. 2001, 5, 11–32. [Google Scholar] [CrossRef]
- Dickson, P.R.; Sawyer, A.G. The price Knowledge and Search of Supermarket Shoppers. J. Mark. 1990, 54, 42–53. [Google Scholar] [CrossRef]
- Pennacchioli, D.; Coscia, M.; Rinzivillo, S.; Pedreschi, D.; Giannotti, F. Explaining the Product Range Effect in Purchase Data. In Proceedings of the 2013 IEEE International Conference on Big Data, Silicon Valley, CA, USA, 6–9 October 2013; pp. 648–656. [Google Scholar]
- Yao, C.B.; Tsui, H.D.; Lee, C.Y. Intelligent Product Recommendation Mechanism based on Mobile Agents. In Proceedings of the 4th International Conference on New Trends in Information Science and Service Science, Gyeongju, Korea, 11–13 May 2010; pp. 323–328. [Google Scholar]
- Kim, J.K.; Cho, Y.H.; Kim, W.; Kim, J.R.; Suh, J.H. A personalized recommendation procedure for Internet shopping support. Electron. Commer. Res. Appl. 2002, 1, 301–313. [Google Scholar] [CrossRef]
- Cho, Y.H.; Kim, J.K.; Kim, S.H. A personalized recommender system based on web usage mining and decision tree induction. Expert Syst. Appl. 2002, 23, 329–342. [Google Scholar] [CrossRef]
- Linden, G.; Smith, B.; York, J. Amazon.com Recommendations: Item-to-Item Collaborative Filtering. IEEE Internet Comput. 2003, 7, 76–80. [Google Scholar] [CrossRef]
- Weng, S.; Liu, M. Feature-based Recommendations for one-to-one Marketing. Expert Syst. Appl. 2004, 26, 493–508. [Google Scholar] [CrossRef]
- Gourgaris, P.; Kanavos, A.; Makris, C.; Perrakis, G. Review-based Entity-Ranking Refinement. In Proceedings of the 11th International Conference on Web Information Systems and Technologies (WEBIST), Lisbon, Portugal, 20–22 May 2015; pp. 402–410. [Google Scholar]
- Malär, L.; Krohmer, H.; Hoyer, W.D.; Nyffenegger, B. Emotional Brand Attachment and Brand Personality: The Relative Importance of the Actual and the Ideal Self. J. Mark. 2011, 75, 35–52. [Google Scholar] [CrossRef]
- Thomson, M.; MacInnis, D.J.; Park, C.W. The Ties That Bind: Measuring the Strength of Consumers’ Emotional Attachments to Brands. J. Consum. Psychol. 2005, 15, 77–91. [Google Scholar] [CrossRef]
- Kanavos, A.; Kafeza, E.; Makris, C. Can we Rank Emotions? A Brand Love Ranking System for Emotional Terms. In Proceedings of the 2015 IEEE International Congress on Big Data, New York, NY, USA, 27 June–2 July 2015; pp. 71–78. [Google Scholar]
- Tsai, C.W.; Lai, C.F.; Chao, H.C.; Vasilakos, A.V. Big Data Analytics: A Survey. J. Big Data 2015, 2, 1–32. [Google Scholar] [CrossRef]
- Fisher, D.; DeLine, R.; Czerwinski, M.; Drucker, S.M. Interactions with Big Data Analytics. Interactions 2012, 19, 50–59. [Google Scholar] [CrossRef]
- Dean, J.; Ghemawat, S. MapReduce: Simplified Data Processing on Large Clusters. Commun. ACM 2008, 51, 107–113. [Google Scholar] [CrossRef]
- Elsayed, T.; Lin, J.J.; Oard, D.W. Pairwise Document Similarity in Large Collections with MapReduce. In Proceedings of the 46th Annual Meeting of the Association for Computational Linguistics (ACL), Columbus, OH, USA, 16–17 June 2008; pp. 265–268. [Google Scholar]
- Li, B.; Guoyong, Y. Improvement of TF-IDF Algorithm based on Hadoop Framework. In Proceedings of the 2nd International Conference on Computer Application and System Modeling, Taiyuan, China, 27–29 July 2012; pp. 391–393. [Google Scholar]
- Bank, J.; Cole, B. Calculating the Jaccard Similarity Coefficient with Map Reduce for Entity Pairs in Wikipedia. Available online: http://citeseerx.ist.psu.edu/viewdoc/download?doi=10.1.1.168.5695&rep=rep1&type= pdf (accessed on 3 May 2018).
- Zhou, P.; Lei, J.; Ye, W. Large-Scale Data Sets Clustering based on MapReduce and Hadoop. J. Comput. Inf. Syst. 2011, 7, 5956–5963. [Google Scholar]
- Turney, P.D.; Pantel, P. From Frequency to Meaning: Vector Space Models of Semantics. J. Artif. Intell. Res. 2010, 37, 141–188. [Google Scholar]
- Raghavan, V.V.; Wong, S.K.M. A Critical Analysis of Vector Space Model for Information Retrieval. J. Assoc. Inf. Sci. Technol. 1986, 37, 279–287. [Google Scholar] [CrossRef]
- Ramos, J. Using TF-IDF to Determine Word Relevance in Document Queries. In Proceedings of the First Instructional Conference on Machine Learning, Piscataway, NJ, USA, 2–8 December 2003. [Google Scholar]
- Turney, P.D. Coherent Keyphrase Extraction via Web Mining. In Proceedings of the 18th International Joint Conference on Artificial Intelligence (IJCAI), Acapulco, Mexico, 9–15 Ausust 2003; pp. 434–442. [Google Scholar]
- Kalaivendhan, K.; Sumathi, P. An Efficient Clustering Method To Find Similarity Between The Documents. Int. J. Innov. Res. Comput. Commun. Eng. 2014, 1. [Google Scholar]
- Lämmel, R. Google’s MapReduce Programming Model-Revisited. Sci. Comput. Program. 2008, 70, 1–30. [Google Scholar] [CrossRef]
- Shvachko, K.; Kuang, H.; Radia, S.; Chansler, R. The Hadoop Distributed File System. In Proceedings of the IEEE 26th Symposium on Mass Storage Systems and Technologies (MSST), Incline Village, NV, USA, 3–7 May 2010; pp. 1–10. [Google Scholar]
- Lin, X.; Meng, Z.; Xu, C.; Wang, M. A Practical Performance Model for Hadoop MapReduce. In Proceedings of the IEEE International Conference on Cluster Computing Workshops (CLUSTER) Workshops, Beijing, China, 24–28 Spetember 2012; pp. 231–239. [Google Scholar]
- Ekanayake, J.; Pallickara, S.; Fox, G.C. MapReduce for Data Intensive Scientific Analyses. In Proceedings of the 4th International Conference on e-Science, Indianapolis, IN, USA, 7–12 December 2008; pp. 277–284. [Google Scholar]
- Apache Spark. Available online: https://spark.apache.org/ (accessed on 3 May 2018).
- Karau, H.; Konwinski, A.; Wendell, P.; Zaharia, M. Learning Spark: Lightning-Fast Big Data Analysis; O’Reilly Media: Sebastopol, CA, USA, 2015. [Google Scholar]
- Apache Spark MLlib. Available online: http://spark.apache.org/mllib/ (accessed on 3 May 2018).
- Tata, S.; Patel, J.M. Estimating the Selectivity of Tf-Idf based Cosine Similarity Predicates. SIGMOD Rec. 2007, 36, 7–12. [Google Scholar] [CrossRef]
- West, C.; MacDonald, S.; Lingras, P.; Adams, G. Relationship between Product Based Loyalty and Clustering based on Supermarket Visit and Spending Patterns. Int. J. Comput. Sci. Appl. 2005, 2, 85–100. [Google Scholar]
- Weka toolkit. Available online: https://www.cs.waikato.ac.nz/ml/weka/ (accessed on 3 May 2018).
Figure 1.
Distributed frameworks. (a) Architecture of MapReduce model; (b) The Spark stack.

Figure 2.
Supermarket model.

Figure 3.
Cosine similarity algorithm visualization.

Figure 4.
Customer reviews.

Figure 5.
F-Measure of each classifier for predicting new purchases regarding the four selected datasets.
Figure 5.
F-Measure of each classifier for predicting new purchases regarding the four selected datasets.


Table 1.
Training set features.
| Features | Description |
|---|---|
| Customer ID | The ID of the customer |
| Product Category | The category of the product |
| Product ID | The ID of the product |
| Shop | The shop where the customer makes the purchase |
| Number of items | How many products he purchased |
| Distance Cluster | The cluster of the distance |
| Product Price | The price of the product |
| Choice | Whether the customer purchases the product or not |
Table 2.
Measurement of satisfaction of customers.
Product Category | Satisfied Customers | Not Satisfied Customers |
|---|---|---|
| Book | 235,680 | 68,152 |
| DVD | 41,597 | 16,264 |
| Music | 80,149 | 15,377 |
| Toy | 1 | 1 |
| Video | 38,903 | 13,718 |
Table 3.
Classification for predicting new purchases for different number of randomly selected purchases.
Table 3.
Classification for predicting new purchases for different number of randomly selected purchases.
| Classifiers | TP Rate | FP Rate | Precision | Recall | F-Measure |
|---|---|---|---|---|---|
| Purchases = 10,000 | |||||
| AdaBoost | 0.605 | 0.484 | 0.598 | 0.605 | 0.564 |
| J48 | 0.922 | 0.095 | 0.924 | 0.922 | 0.921 |
| JRip | 0.847 | 0.187 | 0.854 | 0.847 | 0.843 |
| Multilayer Perceptron | 0.596 | 0.539 | 0.66 | 0.596 | 0.482 |
| PART | 0.748 | 0.325 | 0.783 | 0.748 | 0.728 |
| REPTree | 0.892 | 0.119 | 0.892 | 0.892 | 0.891 |
| RotationForest | 0.785 | 0.285 | 0.83 | 0.785 | 0.768 |
| SMO | 0.574 | 0.574 | 0.33 | 0.574 | 0.419 |
| Purchases = 100,000 | |||||
| AdaBoost | 0.615 | 0.48 | 0.601 | 0.615 | 0.559 |
| J48 | 0.927 | 0.092 | 0.929 | 0.927 | 0.924 |
| JRip | 0.852 | 0.183 | 0.856 | 0.852 | 0.849 |
| Multilayer Perceptron | 0.598 | 0.536 | 0.671 | 0.598 | 0.487 |
| PART | 0.756 | 0.322 | 0.788 | 0.756 | 0.732 |
| REPTree | 0.896 | 0.116 | 0.895 | 0.896 | 0.893 |
| RotationForest | 0.79 | 0.282 | 0.863 | 0.79 | 0.778 |
| SMO | 0.577 | 0.577 | 0.36 | 0.577 | 0.424 |
| Purchases = 500,000 | |||||
| AdaBoost | 0.635 | 0.474 | 0.621 | 0.635 | 0.586 |
| J48 | 0.947 | 0.084 | 0.934 | 0.947 | 0.943 |
| JRip | 0.866 | 0.172 | 0.873 | 0.866 | 0.851 |
| Multilayer Perceptron | 0.622 | 0.516 | 0.682 | 0.622 | 0.503 |
| PART | 0.766 | 0.314 | 0.797 | 0.766 | 0.738 |
| REPTree | 0.912 | 0.111 | 0.915 | 0.912 | 0.896 |
| RotationForest | 0.811 | 0.226 | 0.889 | 0.811 | 0.783 |
| SMO | 0.617 | 0.567 | 0.388 | 0.617 | 0.439 |
| Purchases = 1,000,000 | |||||
| AdaBoost | 0.65 | 0.462 | 0.637 | 0.65 | 0.602 |
| J48 | 0.962 | 0.076 | 0.959 | 0.962 | 0.96 |
| JRip | 0.875 | 0.161 | 0.891 | 0.875 | 0.864 |
| Multilayer Perceptron | 0.65 | 0.498 | 0.683 | 0.65 | 0.517 |
| PART | 0.784 | 0.302 | 0.811 | 0.784 | 0.742 |
| REPTree | 0.921 | 0.101 | 0.921 | 0.921 | 0.903 |
| RotationForest | 0.851 | 0.214 | 0.896 | 0.851 | 0.79 |
| SMO | 0.627 | 0.573 | 0.401 | 0.627 | 0.444 |
| Purchases = 3,000,000 | |||||
| AdaBoost | 0.713 | 0.433 | 0.711 | 0.713 | 0.648 |
| J48 | 0.977 | 0.067 | 0.964 | 0.977 | 0.972 |
| JRip | 0.898 | 0.146 | 0.912 | 0.898 | 0.876 |
| Multilayer Perceptron | 0.691 | 0.411 | 0.712 | 0.691 | 0.548 |
| PART | 0.81 | 0.297 | 0.824 | 0.81 | 0.746 |
| REPTree | 0.933 | 0.087 | 0.929 | 0.933 | 0.912 |
| RotationForest | 0.876 | 0.206 | 0.912 | 0.876 | 0.797 |
| SMO | 0.647 | 0.598 | 0.417 | 0.647 | 0.453 |
Table 4.
Classification of AdaBoost for different dataset sizes.
| Dataset Size | TP Rate | FP Rate | Precision | Recall | F-Measure |
|---|---|---|---|---|---|
| 10,000 | 0.605 | 0.484 | 0.598 | 0.605 | 0.564 |
| 100,000 | 0.615 | 0.48 | 0.601 | 0.615 | 0.572 |
| 250,000 | 0.622 | 0.476 | 0.617 | 0.622 | 0.578 |
| 500,000 | 0.635 | 0.474 | 0.621 | 0.635 | 0.586 |
| 750,000 | 0.641 | 0.469 | 0.629 | 0.641 | 0.593 |
| 1,000,000 | 0.65 | 0.462 | 0.637 | 0.65 | 0.602 |
| 2,000,000 | 0.703 | 0.451 | 0.688 | 0.703 | 0.63 |
| 3,000,000 | 0.713 | 0.433 | 0.711 | 0.713 | 0.648 |
Table 5.
Classification of J48 for different dataset sizes.
| Dataset Size | TP Rate | FP Rate | Precision | Recall | F-Measure |
|---|---|---|---|---|---|
| 10,000 | 0.922 | 0.095 | 0.924 | 0.922 | 0.921 |
| 100,000 | 0.927 | 0.092 | 0.929 | 0.927 | 0.924 |
| 250,000 | 0.93 | 0.089 | 0.932 | 0.93 | 0.933 |
| 500,000 | 0.947 | 0.084 | 0.934 | 0.947 | 0.943 |
| 750,000 | 0.958 | 0.079 | 0.946 | 0.958 | 0.952 |
| 1,000,000 | 0.962 | 0.076 | 0.959 | 0.962 | 0.96 |
| 2,000,000 | 0.97 | 0.072 | 0.969 | 0.97 | 0.967 |
| 3,000,000 | 0.977 | 0.067 | 0.964 | 0.977 | 0.972 |
Table 6.
Classification of Multilayer Perceptron for different dataset sizes.
| Dataset Size | TP Rate | FP Rate | Precision | Recall | F-Measure |
|---|---|---|---|---|---|
| 10,000 | 0.596 | 0.539 | 0.66 | 0.596 | 0.482 |
| 100,000 | 0.598 | 0.536 | 0.671 | 0.598 | 0.487 |
| 250,000 | 0.611 | 0.525 | 0.679 | 0.611 | 0.492 |
| 500,000 | 0.622 | 0.516 | 0.682 | 0.622 | 0.503 |
| 750,000 | 0.639 | 0.507 | 0.687 | 0.639 | 0.511 |
| 1,000,000 | 0.65 | 0.498 | 0.683 | 0.65 | 0.517 |
| 2.000.000 | 0.682 | 0.463 | 0.69 | 0.682 | 0.531 |
| 3,000,000 | 0.691 | 0.411 | 0.712 | 0.691 | 0.548 |
Table 7.
Running time per implementation (in seconds).
| Implementation | Stable Implementation | MapReduce | Spark |
|---|---|---|---|
| Binary Features | 1425 | 421 | 187 |
| Class and Binary Features | 1902 | 962 | 397 |
Table 8.
Running time per slave nodes (in seconds) for MapReduce implementation.
| Number of Slave Nodes | 1 | 2 | 3 |
|---|---|---|---|
| Binary Features | 945 | 523 | 421 |
| Class and Binary Features | 1707 | 1095 | 962 |
Table 9.
Running time per slave nodes (in seconds) for Spark implementation.
| Number of Slave Nodes | 1 | 2 | 3 |
|---|---|---|---|
| Binary Features | 767 | 345 | 187 |
| Class and Binary Features | 1234 | 613 | 397 |
© 2018 by the authors. Licensee MDPI, Basel, Switzerland. This article is an open access article distributed under the terms and conditions of the Creative Commons Attribution (CC BY) license (http://creativecommons.org/licenses/by/4.0/).
Share and Cite
MDPI and ACS Style
Kanavos, A.; Iakovou, S.A.; Sioutas, S.; Tampakas, V. Large Scale Product Recommendation of Supermarket Ware Based on Customer Behaviour Analysis. Big Data Cogn. Comput. 2018, 2, 11. https://doi.org/10.3390/bdcc2020011
AMA Style
Kanavos A, Iakovou SA, Sioutas S, Tampakas V. Large Scale Product Recommendation of Supermarket Ware Based on Customer Behaviour Analysis. Big Data and Cognitive Computing. 2018; 2(2):11. https://doi.org/10.3390/bdcc2020011
Chicago/Turabian StyleKanavos, Andreas, Stavros Anastasios Iakovou, Spyros Sioutas, and Vassilis Tampakas. 2018. "Large Scale Product Recommendation of Supermarket Ware Based on Customer Behaviour Analysis" Big Data and Cognitive Computing 2, no. 2: 11. https://doi.org/10.3390/bdcc2020011