Pollution Reduction in Throughflow from Vegetated and Non-Vegetated, Foam-Based Surfaces and Green Roofs

1
Department of Environmental Science, American University, Washington, DC 20016, USA
2
Amber Real Estate, LLC, Washington, DC 20016, USA
*
Author to whom correspondence should be addressed.
Nitrogen 2020, 1(1), 21-33; https://doi.org/10.3390/nitrogen1010004
Submission received: 26 April 2018
/
Revised: 12 July 2018
/
Accepted: 24 July 2018
/
Published: 5 August 2018
(This article belongs to the Special Issue Urbanization and Environmental Contaminants)
Abstract
:The ability of foam-based unplanted and green surfaces (Aqualok™) to remove pollutants (total suspended solids (TSS), NO3, NH4, total organic carbon (TOC) and total phosphorus (TP)) from direct precipitation and roof runoff passing through the surfaces was assessed. The assessments were conducted using unplanted Aqualok™ and planted Aqualok™ roof panels and a bioswale Aqualok™ installed on two Fire and Emergency Medical Service Stations (FEMSs) in Washington, D.C., USA. During a three-year period, impacts on water chemistry were evaluated by examining overall averages as well as performance over time. Upon installation, all Aqualok™ surfaces released a “pulse” of TSS and NO3, which decreased over time. TP concentrations from the planted panels were elevated relative to conventional roof runoff throughout the study. TOC was generally higher for planted Aqualok™ compared to unplanted Aqualok™, and did not decrease over time. Excluding the three months post-installation, TSS in throughflow from planted and unplanted Aqualok™ surfaces was 88% and 90% lower, respectively, than in runoff from a conventional tar and gravel roof. No significant differences between green surface throughflow and conventional roof runoff for NO3 or NH4 were observed.
1. Introduction
For the past 30 years, it has been recognized that urban planners have an interest in developing more green infrastructure. Washington, D.C., USA, where this study took place, started its initiatives in 2011 with the creation of their Climate and Sustainability Plans [1]. These reports mandate that all government offices or government-owned buildings, such as public schools, incorporate green infrastructure into their new and existing buildings.
Starting in 2016, many of these mandates reached their deadlines, spurring many Washington, D.C. developers or real estate managers to install green roofs. Green roofs are able to provide natural habitat for wildlife and provide green spaces for community residents and visitors [2,3,4], reduce cooling and heating loads by providing insulation and reducing the urban heat island effect by 13–72% [2,5], retain stormwater [4,6,7,8] and filter atmospheric and water-borne pollutants [8,9,10]).
Another potential benefit of green roofs and surfaces has been their ability to retain nutrients or total suspended solids (TSS). Green roofs in Europe, where most long-term studies have been conducted, generally show improved nutrient retention with time [8,11,12,13]. A recent review of literature related to runoff water quality from green roofs suggests that a moderately growing roof with carefully managed plantings achieves the best nutrient retention [14] (a “moderate growth” would use less fertilizers than the “vigorous growth” general maintenance standard. See [14] for details). However, in some cases green roofs can contribute to nitrogen and phosphorus in throughflow [6,8,15,16,17]. A green roof/surface may capture TSS relative to runoff but release nutrients [18], or release a nutrient/solids “pulse” or first-flush associated with the roof being installed and fertilized [11].
All of the green roofs and surface studies mentioned above have been conducted using engineered substrate/soil base for plant growth. The purpose of this project was to determine how effective a foam roof material (Aqualok™) was at reducing nutrient concentrations in roof runoff when applied, independently and in conjunction with a green roof and a bioswale. The project is an extension and expansion of an earlier study which took place at one of the sites examined in this paper [18]. The earlier study examined 20 months of TSS and NO3 data from one roof [18]. This manuscript includes two sites, an additional 16 months of data, and includes total phosphorus and total organic carbon, in addition to TSS and NO3. In general, comparisons were made between: (1) precipitation, (2) Aqualok™ throughflow (water moving through the Aqualok™ surfaces), (3) runoff from regular (conventional) roofs and (4) water flowing into bioswale Aqualok™ from regular (non-green) roofs versus the water exiting the bioswales.
The specific objectives were to: (1) measure effectiveness of planted and unplanted Aqualok™ foam panels for reducing nitrogen (NH4 and NO3), total phosphorus (TP), total organic carbon (TOC) and total suspended solids (TSS) from direct precipitation, (2) measure effectiveness of bioswale Aqualok™ foam panels in reducing those same analytes from runoff discharged by an untreated roof, and (3) determine change in effectiveness of the Aqualok™ systems over a 3.25-year period.
2. Materials and Methods
2.1. Study Sites (D.C. Fire and Emergency Medical Services)
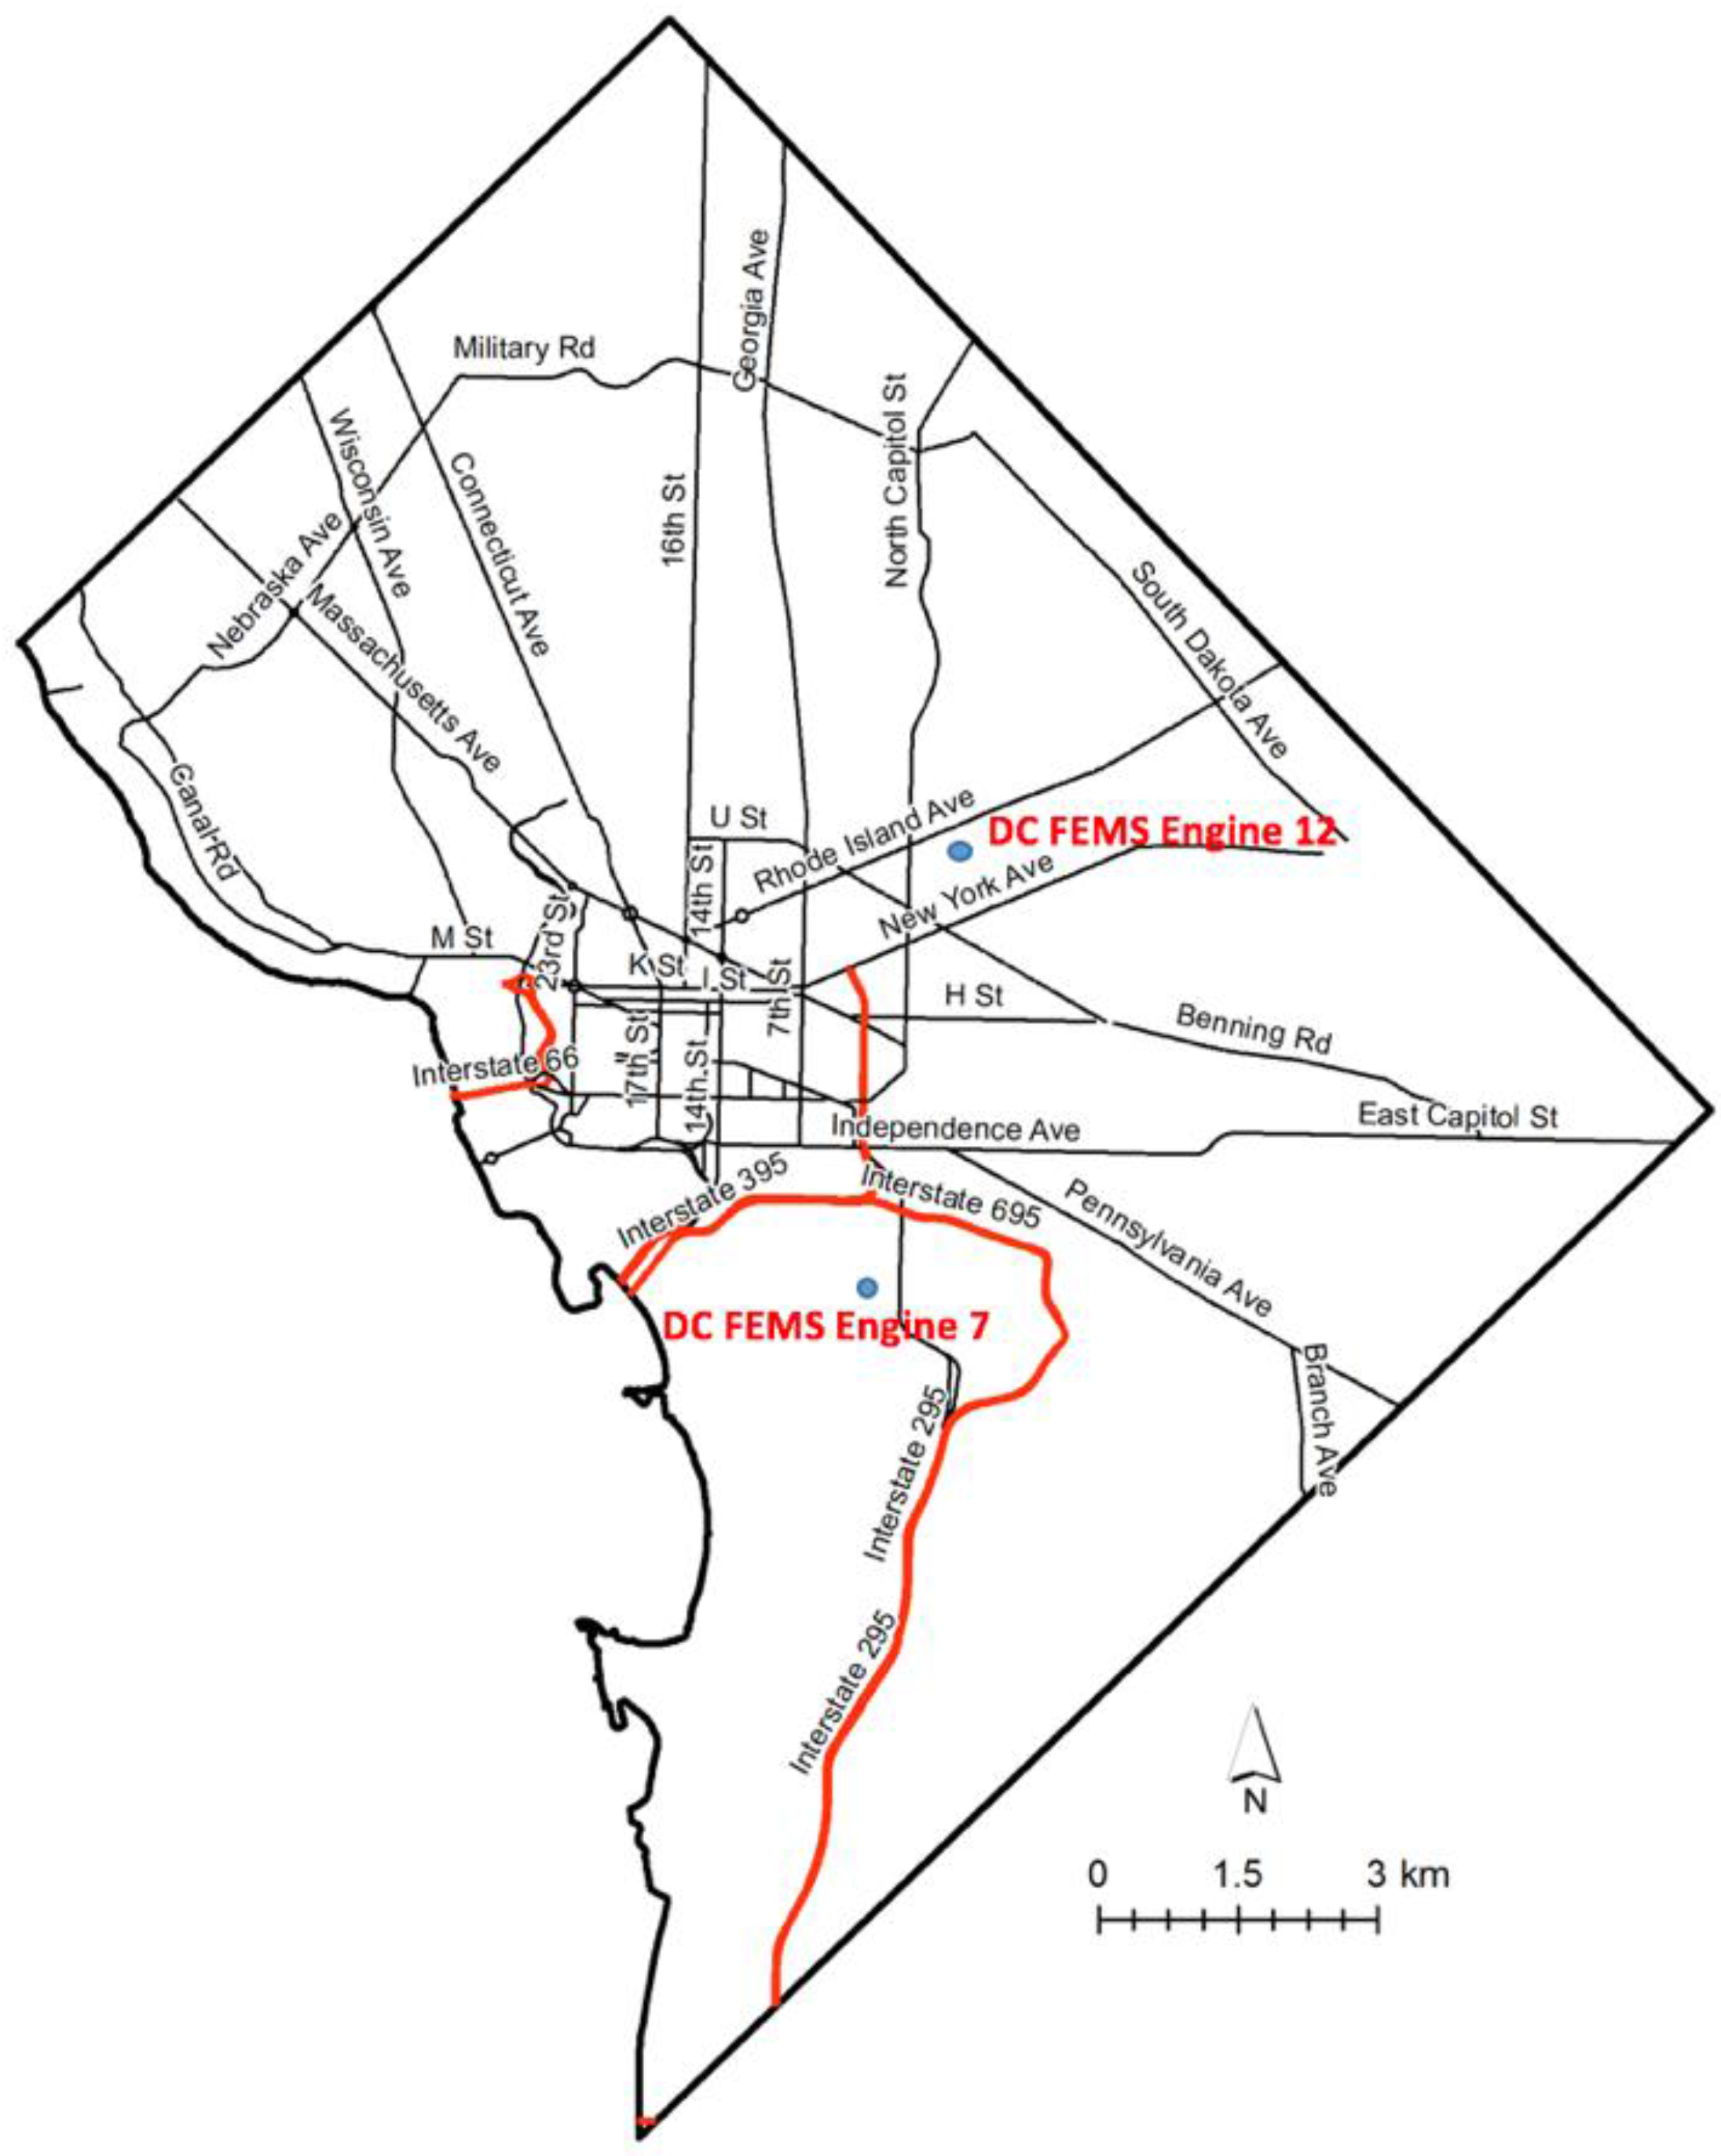
For this project there were two study sites that received Aqualok™ roofs/surfaces. Both were D.C. Fire and Emergency Medical Services (DC FEMS) locations (Figure 1). Engine 12 (DC FEMS) is located at 2225 5th Street NE, Washington, D.C. in the Petworth neighborhood. This site was sampled between 2012 and 2015. This site contained approximately 631 m2 of roof over two stories and a 139 m2 garage roof. On the main portion of the building, 325 m2 of Aqualok™ panels were installed. Of that portion, 111 m2 were planted and 214 m2 were unplanted Aqualok™ panels. This system also used a bioswale Aqualok™ panel to treat the conventional roof runoff at one drainpipe anchored to the exterior of Engine 12. Twenty-three m2 of tar and gravel conventional roof drained into 0.37 m2 of bioswale panel. Engine 12 had water collected from 5 points (planted, unplanted, bioswale, runoff from conventional roof (“downspout”), and direct precipitation) (Figure 2).
Engine 7 (DC FEMS) is located at 1101 Half Street SW, Washington, D.C. near Nationals Stadium. Monitoring spanned two years, 2013–2015. This site contains approximately 3251 m2 of roof over a two-story building. Of this, approximately 1923 m2 contained Aqualok™ roof material, in which 576 m2 was planted and 1347 m2 was unplanted. Engine 7 had water collected from 4 points (planted Aqualok™, unplanted Aqualok™, conventional runoff, and precipitation). Conventional roof runoff at Engine 7 was collected from a tar and gravel roof similar to that at Engine 12, but was larger (>300 m2). Engine 7 did not have a bioswale (Figure 2).
2.2. Aqualok™ Foam Panels/Bioswale and Conventional Roof Runoff
Each 0.37 m2 planted and unplanted panel was constructed from a patented 7.6 cm nontoxic polyethylene foam (i.e., Aqualok™) covered by a 1 mm white polyethylene sheet. The R-value of the Aqualok™ foam system is approximately 10.45 (Architest, 2014, ASTM C518-10). These panels rested in 8.9 cm deep, nondraining, polyethylene trays, which only function to hold the panels in place. The water capture capacity of Aqualok™ panels on a 2-degree inclined roof is approximately 7.24 cm (Architest, 2013, ASTM E-2398). The Aqualok™ foam had a dry mass of <4.88 kg/m2, a saturated mass of approximately 73 kg/m2 and can hold 6.35 cm of rain for every 7.6 cm foam (ASTM E-2398). The planted panel and bioswale panel had six 3.7-L (referring to the pot volume) plants added to each. The species planted were: switch grasses (Panicum virgatum), black-eyed Susan’s (Rudbeckia hirta), sedge (Carex sp.) and ferns (Matteuccia struthiopteris). The bioswale Aqualok™ was a single panel which rested in a 10.2 cm tray on the top of a 0.37 m3 reservoir. The rooftop planted and unplanted Aqualok™ received precipitation directly, and the throughflow accumulated in their 10.2 cm holding trays (the collection panels were located directly beneath the Aqualok™ foam panels (see below)). The 7.6 cm foam holds 6.35 cm of rain, and their holding trays were never observed overflowing. The bioswale Aqualok™ panels (identical to the roof panels except not covered by the 1 mm polyethylene sheet) received direct untreated roof runoff via downspout drain.
2.3. Sample Collection and Preparation
All samples were collected within 36 h after the rainfall event. Water samples from Engine 7 were collected from 4 different surfaces: precipitation, conventional roof runoff via a downspout, planted Aqualok™ throughflow and unplanted Aqualok™ throughflow. For Engine 12, the same surfaces were also collected as well as throughflow from the bioswale (Table 1).
High-density polyethylene (HDPE) collection pans with a 1 mm fiberglass screen were placed under the panels (including bioswale) and downspouts. This allowed large particles to be excluded as protocol for total suspended solids requires. The precipitation was also run through a 1 mm fiberglass filter at the time of the collection.
Precipitation was collected by attaching a 1 cm interior diameter funnel to a 3 L amber glass bottle; three were used at each collection site in order to obtain enough precipitation.
All water samples, once filtered through the 1 mm fiberglass filter, were collected in 50 mL acid-washed HDPE bottles. Three bottles were used for each collection surface if enough rain had fallen, but many times only one to two bottles were collected from at least one site. All water samples were then immediately sent out for analysis or acidified with concentrated hydrochloric acid and stored at approximately 3 °C to be sent out at a later date.
2.4. Sample Monitoring
Since exact measurements for rainfall and conditions could not be monitored at each site, sample collection sites were extrapolated using the NOAA website (http://w2.weather.gov/climate/index.php?wfo=lwx). The conditions and rainfall amounts for each site were estimated to be approximately the same as Ronald Reagan National Airport (Table 2).
Not all rain events led to collection and analysis. In order to collect a sample, the event had to be large enough to fill at least two 50 mL Nalgene bottles in order to have an adequate amount to send out for analysis and retain water to run TSS. This meant most rainfall amounts were >1.3 cm if they were preceded by many dry days/weeks, or as little as 0.4 cm if another rainfall event had recently occurred. Table 2 shows the parameters mentioned above for each collection date. All sites were checked for collection if rainfall was reported to be >0.25 cm (at Ronald Reagan National Airport).
2.5. Analysis and Statistics
The overall performances at Engine 12 and 7 were examined separately. The Engine 12 Aqualok™ was installed July 2012 and Engine 7 Aqualok™ was installed October 2013. Since Engine 12 was sampled for the longest time period (3 years, 3 months), it was examined alone for trends with time.
For examinations of long-term averages among the treatments, nonparametric Wilcoxon Ranked Pairs were used. All statistics and regression modeling was done using JMP 13 (Version 13, SPSS, Cary, NC, USA).
3. Results
One way to quantify the nutrient/pollution mitigation performance of a green surface is through average over some period of time, be it a year, 10 years or a single event. Another way is to conduct time-series analysis. Both evaluations are appropriate and will be examined here.
3.1. Precipitation versus Runoff
The concentrations of most constituents in direct precipitation falling on Engines 12 and 7 were fairly low (Table 3 and Table 4). Once the precipitation ran over the untreated tar and gravel roofs, concentrations of most constituents of interest increased. At Engine 12, conventional roof runoff had significantly higher TSS and NO3 than precipitation (Table 3), and at Engine 7 it was significantly higher in TSS and TOC.
3.2. Engine 12 and 7: Averages
To compare overall average nutrient retention, 17 events at Engine 12 (July 2012 to October 2015) and 12 at Engine 7 (October 2013 to October 2015) were examined independently. Some events resulted in water collections for some treatments but not others, which is why there are different “N”s for the analytes in Table 3 and Table 4.
Wilcoxon Ranked Pairs tests were used for all comparisons. The surfaces/collection points (hereafter called “treatments”) were: precipitation, conventional roof runoff (hereafter called “runoff”), planted Aqualok™, unplanted Aqualok™, and bioswale Aqualok™ surfaces (See Table 1, bioswale for Engine 12 only).
Runoff and bioswale Aqualok™ total suspended solids (TSS) at Engine 12 were significantly higher than the planted Aqualok™, the unplanted Aqualok™ and precipitation (Table 3). There was no difference between the planted Aqualok™ or unplanted Aqualok™ TSS. Bioswale Aqualok™ TSS was highly variable over the study but was significantly higher than precipitation and the unplanted Aqualok™ (Table 3). At Engine 7, TSS in throughflow from the unplanted Aqualok™ was lower than that of runoff and the planted Aqualok™ (Table 4).
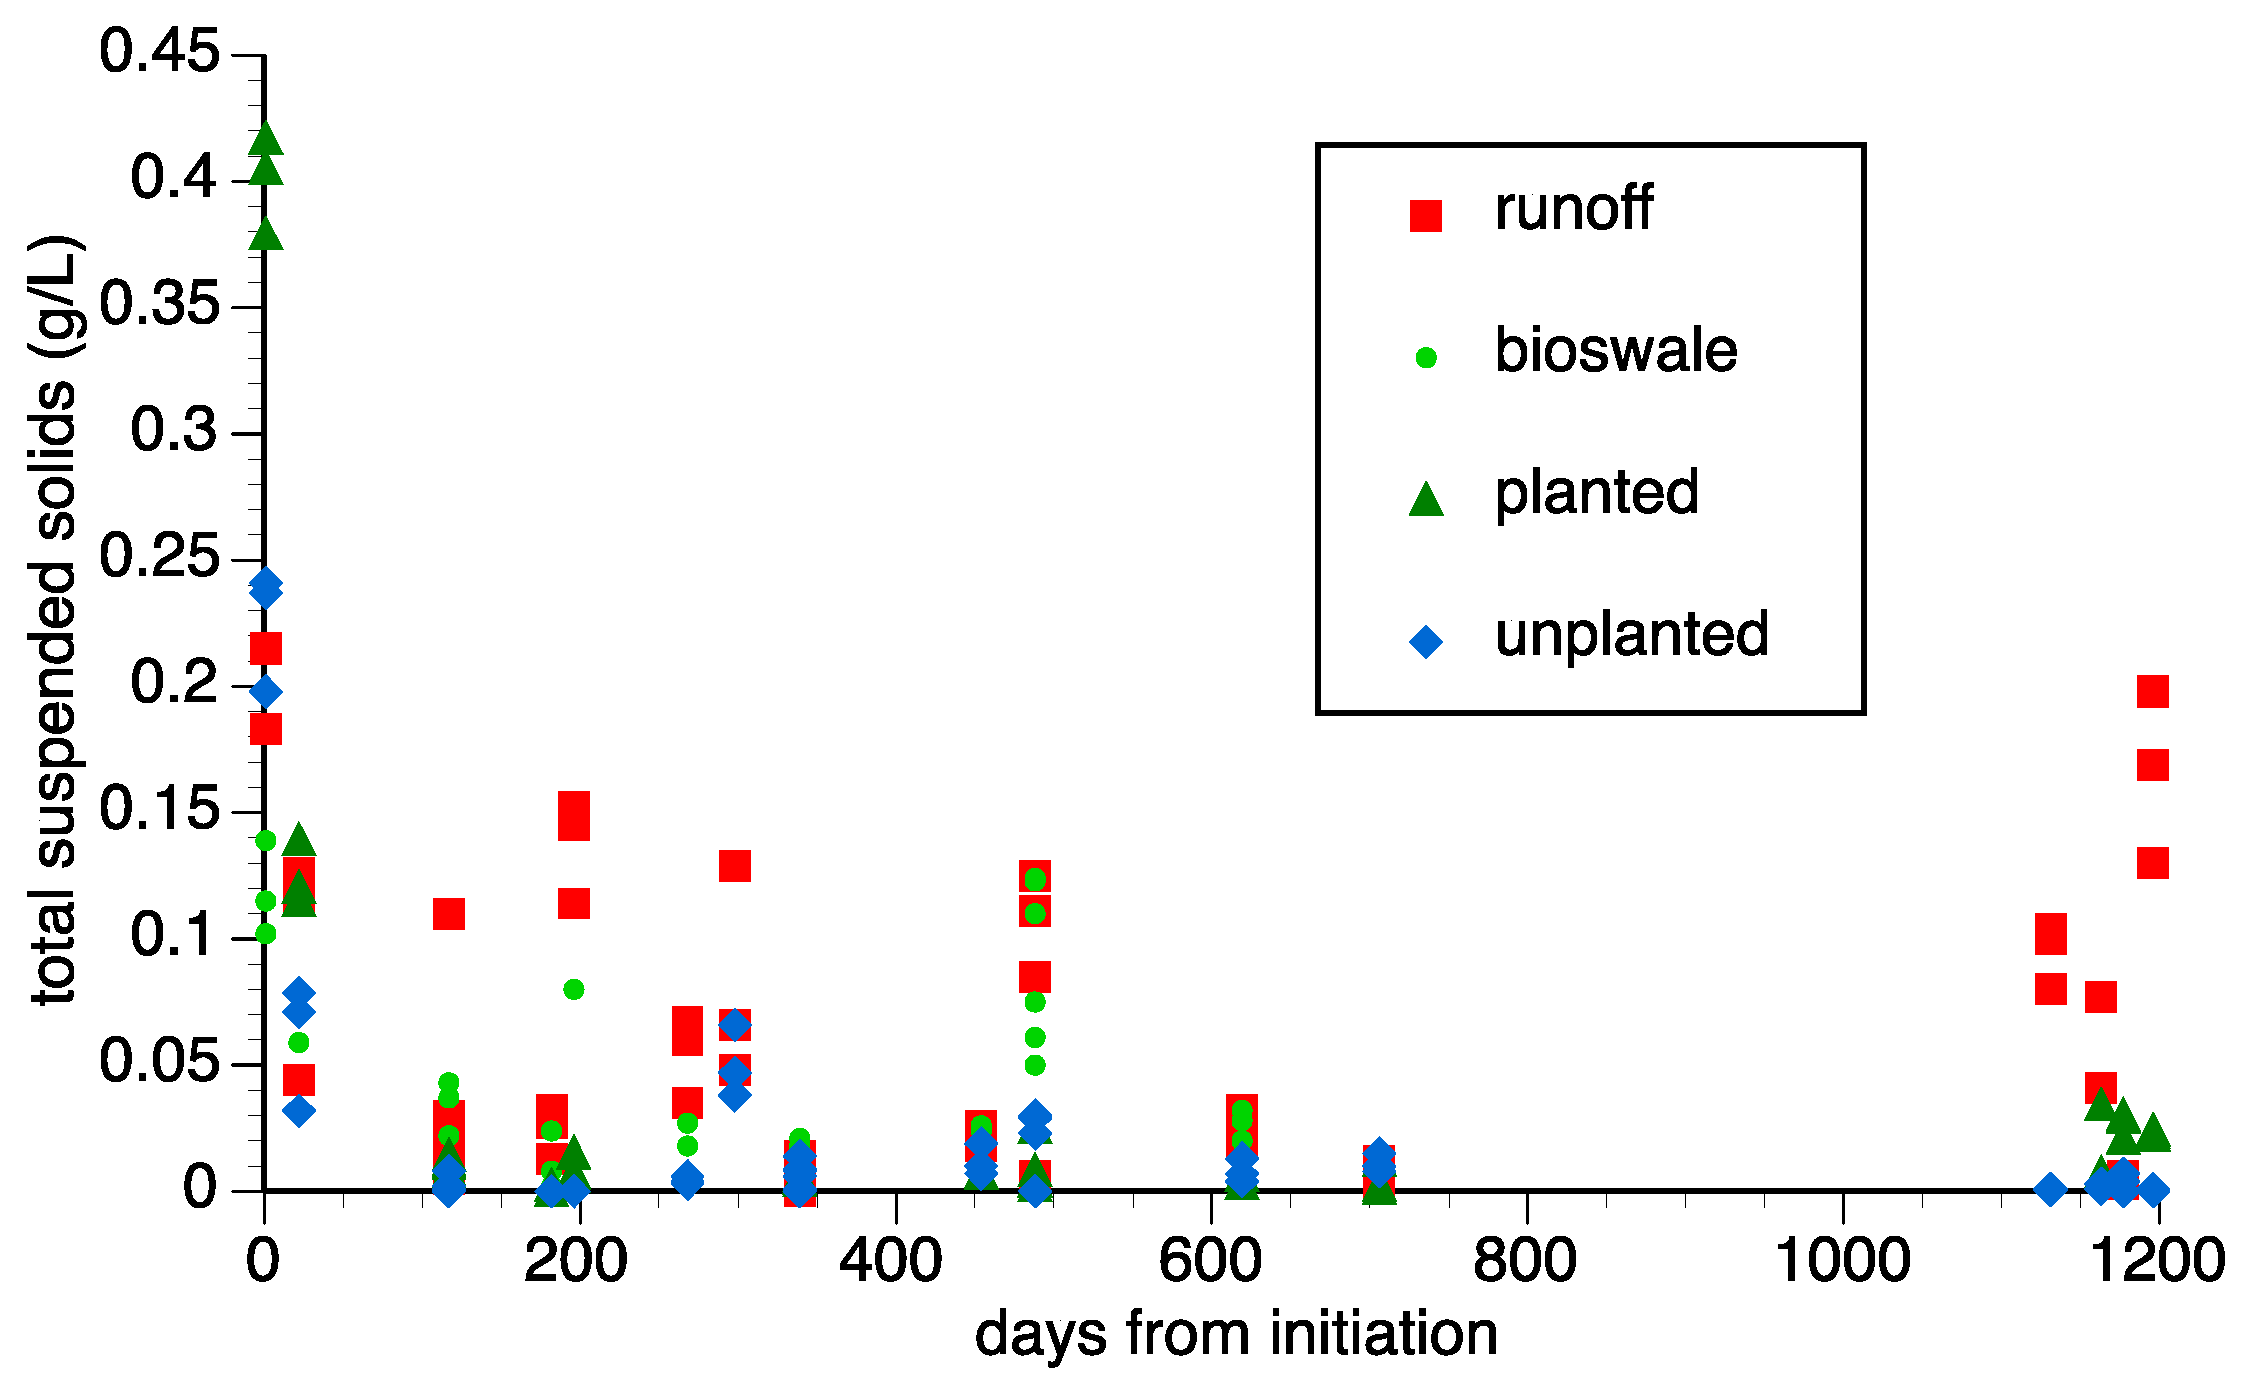
Contrasting the various Aqualok™ treatments to runoff at Engine 12 (which had the longest continuous record) suggests that the various Aqualok™ treatments may have been consistently lower in TSS than runoff (Figure 3). Detecting statistically significant differences among the treatments was difficult, even if means were greatly different, because of the variance over the study. The TSS for the unplanted Aqualok™ were as low as the direct precipitation for both Engines (Table 3 and Table 4).
Both the planted and unplanted Aqualok™ showed significantly higher nitrate than precipitation, and had higher concentrations than runoff at Engine 7 (Table 3 and Table 4). The bioswale Aqualok™ was not statistically different than runoff. However, mean concentrations were 2× higher for the planted and unplanted Aqualok™ than the bioswale Aqualok™ or runoff at Engine 12 (Table 3). The unplanted Aqualok™ at Engine 7 was also significantly higher than runoff (Table 4).
All treatments showed very low ammonium (NH4) and were indistinguishable from each other statistically (Table 3 and Table 4).
The planted Aqualok™ and bioswale Aqualok™ had higher total organic carbon (TOC) than the other treatments, but were not different from each other. Runoff, unplanted Aqualok™, and precipitation showed low TOC at Engine 12, however, runoff and unplanted Aqualok™ at Engine 7 were significantly higher than precipitation (Table 4).
The planted Aqualok™ was significantly higher in TP than the other treatments at Engine 12 (Table 3). TP was considerably lower for planted Aqualok™ at Engine 7 and was no different from runoff or unplanted Aqualok™. Precipitation was not statistically different from other treatments except for the planted Aqualok™ (at both Engines) (Table 3 and Table 4).
3.3. Engine 12 Only: Averages. Excluding First Three Months Post-Installation (July–September 2012)
Installation of the Aqualok™ surfaces resulted in several months of elevated concentrations of all compounds/materials of interest. The installation had the same effect as “disturbing” a field site and then monitoring the effluent from it. In such cases it is common to see a “pulse” effect in response to the installation [6,12]. Once the site settles, there is less release from loose or dislodged materials. If the data set is adjusted to exclude the first three months (July/August collections), the analysis shows the results outlined below. This may present a better assessment of how effective the Aqualok™ surfaces will be over time.
Conventional roof runoff total suspended solids (TSS) were significantly higher than that observed for most Aqualok™ treatments and precipitation (but not the bioswale Aqualok™). The unplanted Aqualok™ had a significantly lower concentration of TSS relative to any treatment or precipitation (Table 5). Expressed as a percent relative to runoff based on grab samples, the planted and unplanted Aqualok™ were 88% and 90% lower, respectively.
Precipitation NO3 was lower than throughflow from any of the Aqualok™ treatments. None of the Aqualok™ treatments were statistically different than nitrate from runoff (Table 5).
The planted Aqualok™ and bioswale Aqualok™ had significantly higher TOC than the other treatments (Table 5). Precipitation had the lowest mean TOC but was not statistically different than runoff or unplanted Aqualok™.
The planted Aqualok™ was significantly higher in TP than the other treatments. Precipitation TP was lower than the Aqualok™ treatments, but was not different than runoff (Table 5).
3.4. Engine 12 over Time
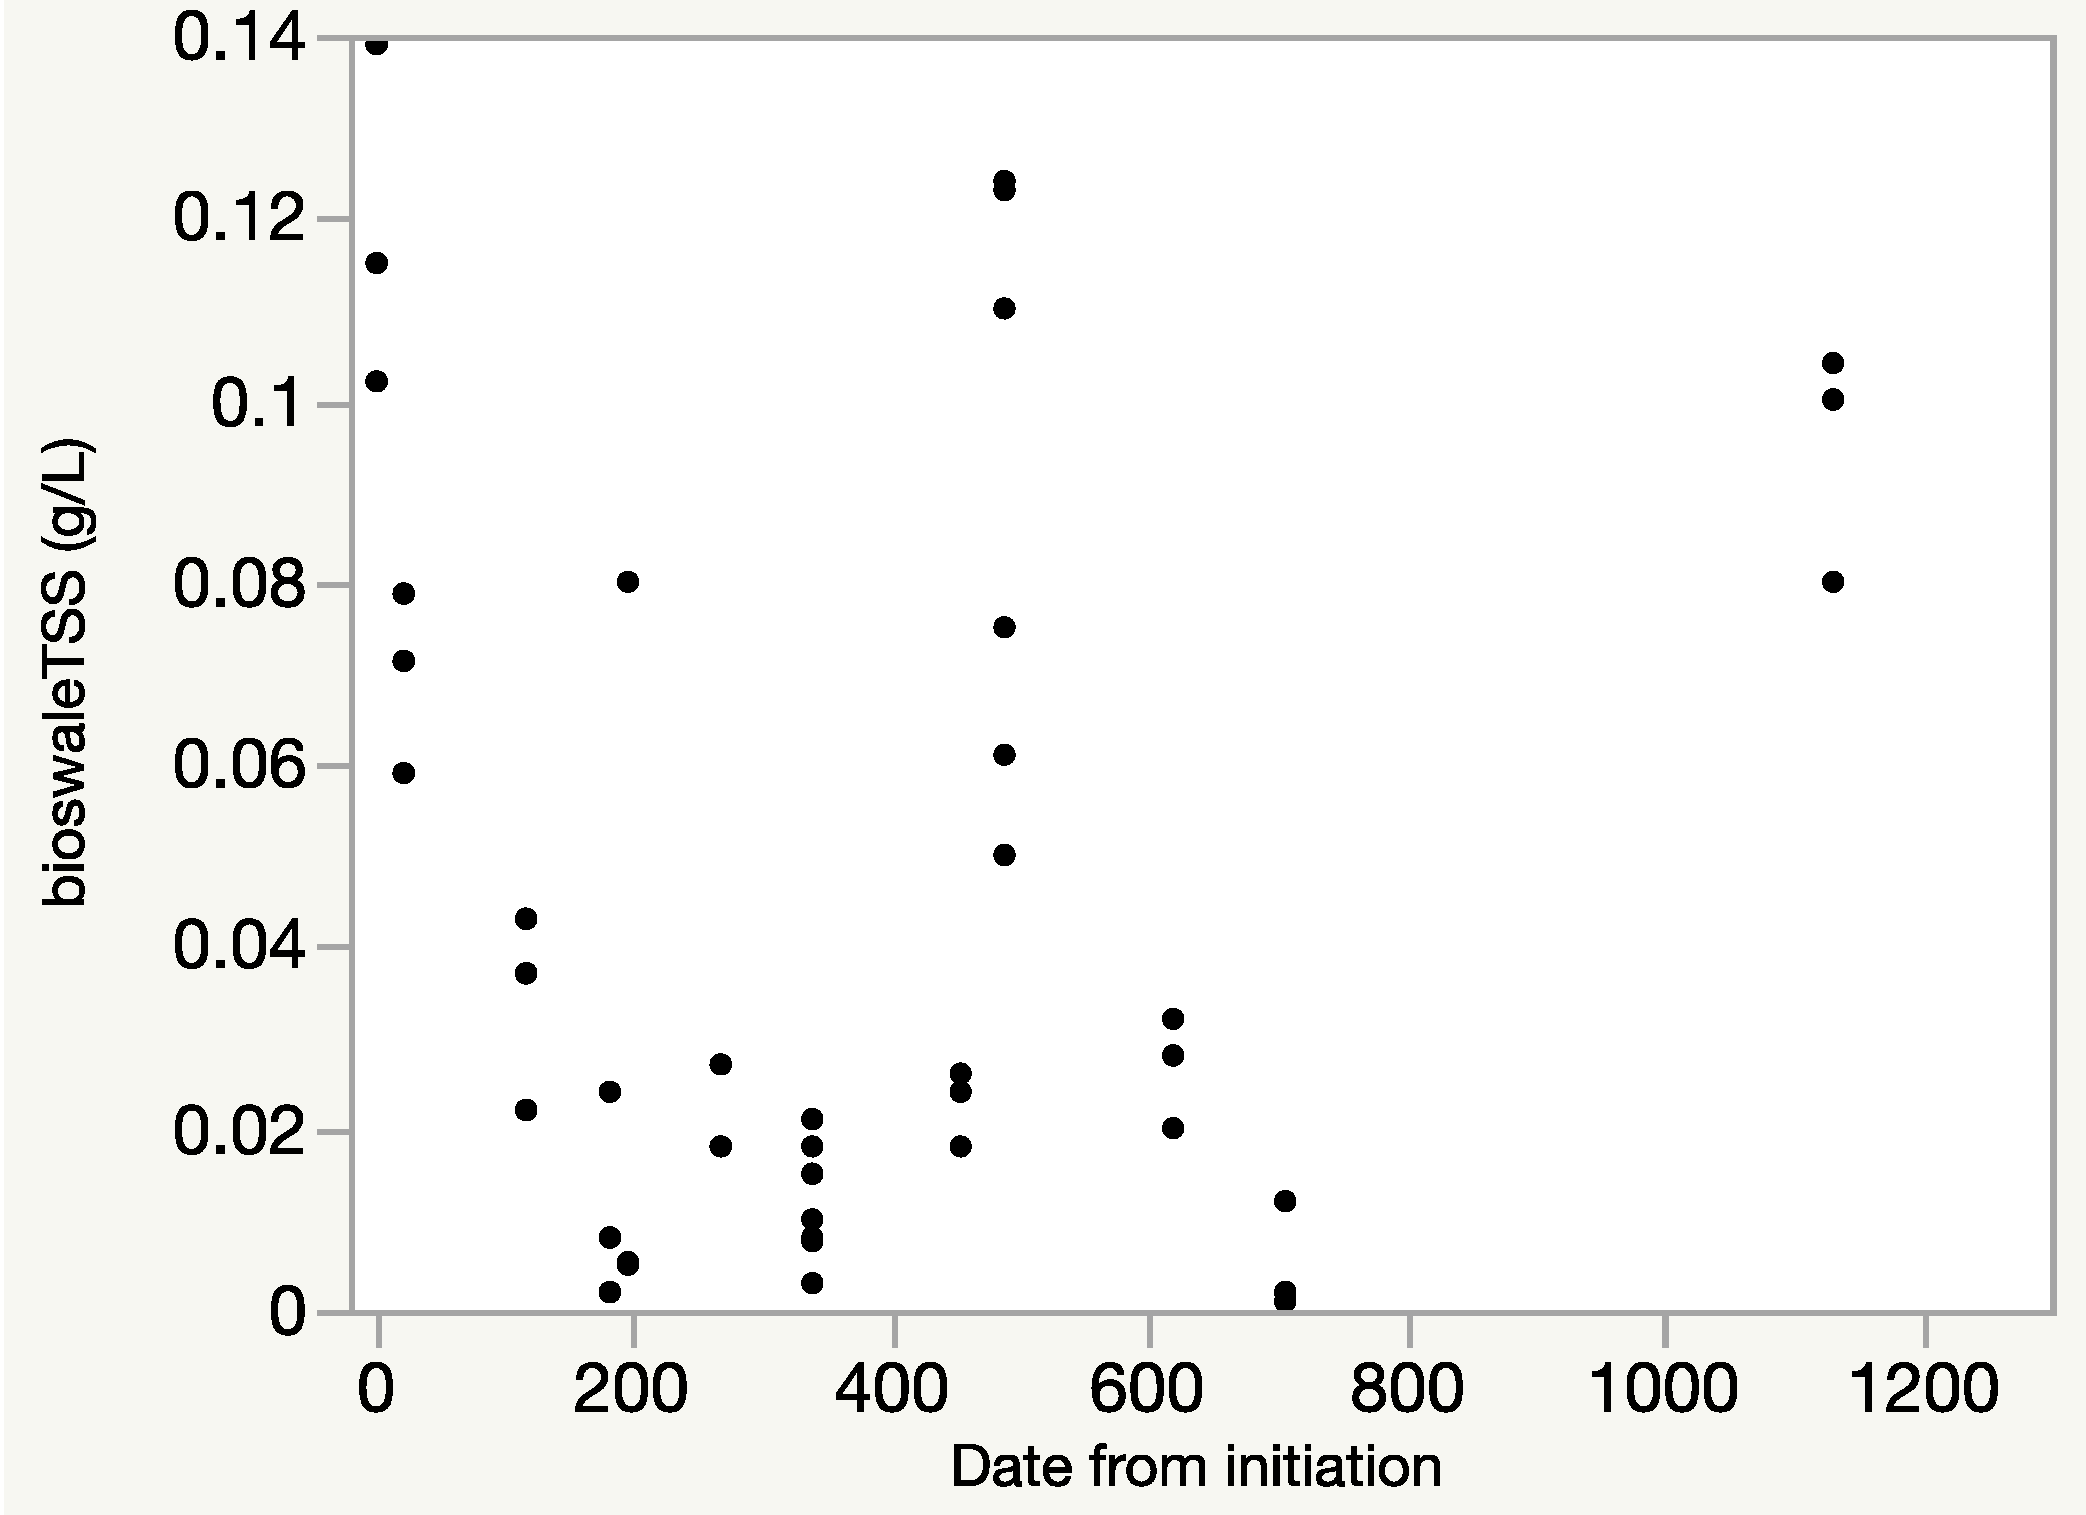
Engine 12 had the longest continuous period of monitoring (3 years, 3 months). During that time, concentrations of TSS and NO3 in throughflow changed significantly. Between summer 2012 (July and August) and spring 2014 (April), the NO3 and TSS concentrations in throughflow from the planted Aqualok™ decreased by 94% and 80%, respectively. Subsequently, however, nitrate concentrations increased during the summer months in 2014 and again in 2015. TSS also was slightly higher at the end of the study than it was in spring 2014 (Figure 4). For the unplanted Aqualok™, the decrease in TSS between 2012 (summer) and 2014 (spring) was approximately 95% (Figure 5). Nitrate, ammonium and phosphate did not show a significant decreasing trend in the unplanted Aqualok™ (Figure 6). The bioswale Aqualok™ at Engine 12 improved the TSS retention by approximately 50% over the first 18 months of the study, however, values rose again during the second year. The last three measurements on day 1131, which are high, occurred after more than a year without data (due to funding delays) and were directly after a maintenance visit (Figure 7). If those values are excluded from the analysis, then a second-order logarithmic equation shows significant decreases in TSS over time. NO3 in bioswale Aqualok™ throughflow decreased approximately 40% over the initial 18 months as well, however, concentrations increased later in the study. There were no clear trends with time for ammonium, TP or TOC for the bioswale Aqualok™ treatment.
4. Discussion
Aqualok™ Surfaces’ Performance over Time
An important measure of green surface effectiveness includes performance over relatively long periods of time [16]. In this study, the longest period of observation was approximately 3.25 years. While a longer period of observation would have been ideal, insights can be gained from observing trends over even these limited time periods. As has been observed in other studies, the total suspended solids and nutrient retention characteristics improved over time but nutrient concentrations in throughflow were higher than that in runoff for some individual events [12,17,19,20].
Although Washington, D.C. certainly experiences air pollution, especially during the summer months [21], precipitation showed lower average concentrations than any of the Aqualok™ treatments examined. Another trend that was observed at all locations was high initial concentrations of NO3 and TSS, which reflects a settling period following Aqualok™ surface installation. When the plants were inserted into the Aqualok™ foam, fertilizers and particulates were included in the root-ball, therefore initial throughflow was high in NO3, TP and TSS. This has also been seen in traditional vegetated roofs (reviewed in [12]). There are two likely reasons for the summer spikes in TSS and NO3. The first is increased decay of organics during the summer, resulting in NO3 release [16,22]. The second is that maintenance of the Aqualok™ surfaces, including trimming, planting and removing leaves and so on, occurred during the summer. This acted as a disturbance to the roofs and there was some particulate release as a consequence.
The trend of decreasing TSS post-installation continued for the unplanted Aqualok™ for the entire study. This was expected since they were less disturbed than the planted panels. The unplanted Aqualok™ probably acts as a filter for any water that flows through them. It is reasonable to expect that the effectiveness of the unplanted Aqualok™ will decrease over time, however, that did not happen over the 3.25 years of this study. The unplanted Aqualok™ showed a dramatic decrease in TSS, as was observed in the planted Aqualok™ (Figure 4 and Figure 5). However, the TSS measurements around 1200 days are lower than those from the planted Aqualok™.
NO3, NH4 and TP did not show a significant decreasing trend in the unplanted Aqualok™. However, this is largely because the concentration of these pollutants was initially low in the unplanted Aqualok™ (relative to the planted Aqualok™), and a decreasing trend would not be expected necessarily. There were, however, periods of high nitrate in unplanted Aqualok™ throughflow, even two years after installation (July and August 2015, for example, between 1100 and 1200 days from initiation). The source of the elevated nitrate is unknown.
The increase in NO3 observed in the bioswale of Aqualok™ after day 620 may have been a result of mulching after a decorative cobble surface was removed. The volume of rainwater that filtered through the bioswale Aqualok™ was far larger than the intercepted rain on the roof panels (23 m2 of conventional roof runoff drained into 0.37 m2 of bioswale panel). The lower performance of the bioswale Aqualok™ relative to the roof Aqualok™ could be related to volume of untreated roof runoff that entered it.
The accumulation of pollutants on surfaces through dry deposition (aerosols, dust and hydrocarbons drifting out of the atmosphere) between rain events is a universal feature of any landscape (from forests to cities) influenced by industrial emissions, including green roofs [23,24,25]. The amount of nutrients and solids in precipitation and runoff depends on a variety of environmental factors including the amount of rainfall, antecedent conditions and season. The inorganic nitrogen (NO3, NH4) from direct precipitation was fairly low, but there was some nitrate due to expected urban influences. The fact that the runoff can become substantially enriched in pollutants while flowing over such limited distances reflects what others have observed regarding the rapid transport of pollutants over urban impervious surfaces [11]. Once the precipitation ran over the untreated tar and gravel roof, concentrations of most solids or compounds increased in almost all collections. There was very little phosphorus in either rainwater or roof runoff because phosphorus does not have an atmospherically transported form, nor is it an urban pollutant. Any deposition would probably occur from atmospheric dust, and so would be limited by roof height.
When considering the effectiveness of green roofs for removing pollutants, comparisons should be made between runoff-draining regular roofs versus the water filtering through the green roof treatments. Although the Aqualok™ treatments in this paper do not intercept the runoff from conventional roofs (although the bioswale Aqualok™ does), they do intercept the rain that would otherwise be “dirty” conventional roof runoff.
The TSS in the unplanted Aqualok™ was as low as rainwater and far lower than conventional roof runoff. The planted Aqualok™ and bioswale Aqualok™ had higher TSS than precipitation but was lower than that in conventional roof runoff (Table 2). The plants are placed in the Aqualok™ foam with the root ball intact (fertilized root ball no less) and it would be expected that suspended solids would wash out of these surfaces. The fact that the TSS is lower for the planted treatments than for the runoff washing over the gravel and tar roof surface is compelling evidence that the roofs do retain solids as dry deposition even if the plants produce some themselves.
NO3 concentration from all collections over the 3.25-year study was highly variable. NO3 concentrations change depending on season (mobilization in warmer weather), trajectory of the storm delivering the precipitation (depending on nitrate sources in the airmass’s path) and day (variable vehicle exhaust amounts), just to name a few sources of variation [26]. All of these sources of variability are likely to have contributed to concentration standard deviations that were as large as the means (Table 2). With variability that high, detecting differences among treatments is difficult unless there is a very large difference in concentrations.
For the reason discussed above, the initial NO3 for Engine 12 was high post-installation. If those first three months are excluded from the Engine 12 data, there are no significant differences among precipitation, runoff, or Aqualok™ treatments except for the unplanted Aqualok™ (which showed higher concentrations). Concentrations for the unplanted Aqualok™ are higher than expected given that fertilizers were not applied. The source of the large spike in the fall of 2015 is unknown.
NO3 from the Engine 12 bioswale Aqualok™ consistently approached 50% that of the unplanted Aqualok™. Although it had a concentration peak post-installation in July 2012, followed by a decrease through January 2013, concentration increased following that period. The elevated concentrations observed towards the end of the study mirror those seen in the unplanted Aqualok™. Fertilizers were not added to the area, and only routine maintenance was conducted. It is possible that the maintenance, which included trimming and mulching, disturbed the installation and contributed to the increased NO3. This hypothesis is supported by the increase in TSS that is observed in those same samples. If the last three measurements of TSS (day 1131) are removed from the data set, a second-order log regression approximates TSS retention over time.
NH4, TP and TOC showed no significant trends over time for any of the Aqualok™ surfaces. There are generally very low amounts of ammonium and phosphorus arriving from atmospheric deposition, so most of these nutrients originate from fertilizers or from the decay of organic matter. While there was an initial pulse of these nutrients following the roof installation, concentrations did not taper off as abruptly as TSS. For the most part, the concentrations of nutrients were low in the unplanted Aqualok™ and remained so for the entire study (however, there were periods of high variability as evidenced by the large standard deviations in Table 3 and Table 5). Total organic carbon (TOC) was high for the planted and bioswale Aqualok™ as would normally be expected, since the plants generate organic carbon. An increase or decrease over time would not be expected.
5. Conclusions
While there may be an initial increase in the concentration of TSS and NO3 following installation of an Aqualok™ surface, the pulse will likely “wash-out” after a few rain events (in our study it was three events). Over 3.25 years, TSS concentration in the Aqualok™ treatment throughflow was lower than observed in conventional, tar and gravel roof runoff. The Aqualok™ surfaces did not reduce inorganic nitrogen relative to conventional roof runoff, although they did not add to it either. Longer-term studies implementing a moderate growth maintenance standard [14] would aid in assessing the long-term nutrient retention benefits of Aqualok™ surfaces.
Author Contributions
G.W. and S.E.M. conceived and designed the experiments. G.W. designed the test areas and facilitated collections. S.M. and S.E.M. collected and analyzed the data. S.M. and S.E.M. wrote the manuscript.
Funding
This research was funded by the US Fish and Wildlife Foundation under grant #28136.
Acknowledgments
The authors would like to thank Michelle Clifford, Rianna Eckel, Smriti Kumble, Mira Meirambayeva, Sabah Mirza and Katie Plank for their fieldwork and laboratory assistance. We are grateful to Michael Alonzo for providing help with GIS.
Conflicts of Interest
The founding sponsors had no role in the design of the study; in the collection, analyses, or interpretation of data; in the writing of the manuscript, and in the decision to publish the results. The authors have no conflicts of interest in presenting this research.
References
- Sustainability DC 2011. Available online: http://www.sustainabledc.org/wp-content/uploads/2017/03/SDC_Plan_2016_compressed2.pdf (accessed on 8 February 2018).
- Spolek, G. Performance monitoring of three ecoroofs in Portland, Oregon. Urban Ecol. 2008, 11, 349–359. [Google Scholar] [CrossRef]
- Getter, K.L.; Rowe, D.B. The role of extensive green roofs in sustainable development. HortScience 2006, 41, 1276–1285. [Google Scholar]
- Teemusk, A.; Mander, Ü. The use of green roofs for the mitigation of environmental problems in urban area. WIT Trans. Ecol. Environ. 2006, 93, 3–17. [Google Scholar]
- Dunnett, N.; Kingsbury, N. Planting Green Roofs and Living Walls; Timber Press: Portland, OR, USA, 2004. [Google Scholar]
- Gregoire, B.G.; Clausen, J.C. Effect of a modular extensive green roof on stormwater runoff and water quality. Ecol. Eng. 2011, 37, 963–969. [Google Scholar] [CrossRef]
- Teemusk, A.; Mander, Ü. Rainwater runoff quantity and quality performance form a green roof: The effects of short term effects. Ecol. Eng. 2007, 30, 271–277. [Google Scholar] [CrossRef]
- Teemusk, A.; Mander, Ü. The influence of green roofs on runoff water quality: A case study from Estonia. Water Resour. Manag. 2011, 25, 3699–3713. [Google Scholar] [CrossRef]
- Speak, A.F.; Rothwell, J.J.; Lindley, S.J.; Smith, C.L. Metal and nutrient dynamics on an aged intensive green roof. Environ. Pollut. 2014, 184, 33–43. [Google Scholar] [PubMed]
- U.S. Green Building Council. Leadership in Energy and Design (LEED): Reference Guide for Building Design and Construction; U.S. GBC Printing Offices: Washington, DC, USA, 2013. [Google Scholar]
- Czemiel Berndtsson, J.; Emilsson, T.; Bengtsson, L. The influence of extensive vegetated roofs on water quality. Sci. Total Environ. 2006, 355, 48–63. [Google Scholar] [CrossRef] [PubMed]
- Czemiel Berndtsson, J. Green roof performance towards management of runoff water quantity and quality. Ecol. Eng. 2010, 36, 351–360. [Google Scholar] [CrossRef]
- Van Seters, T.; Rocha, L.; Smith, D.; MacMillan, G. Evaluation of green roofs for runoff retention, runoff quality, and leachability. Water Qual. Res. J. Can. 2009, 44, 33–47. [Google Scholar] [CrossRef]
- Wang, H.; Qin, L.; Hu, Y. Are green roofs a source or sink of runoff pollutants? Ecol. Eng. 2017, 107, 65–70. [Google Scholar] [CrossRef]
- Li, Y.; Babcock, R.W. Green roofs against pollution and climate change. A review. Agron. Sustain. Dev. 2014, 34, 695–705. [Google Scholar] [CrossRef]
- Buffam, I.; Mitchell, M.E.; Durtsche, R.D. Environmental divers of seasonal variation in green roof runoff water quality. Ecol. Eng. 2017, 91, 506–514. [Google Scholar] [CrossRef]
- Mitchell, M.E.; Matter, S.F.; Durtsche, R.D.; Buffam, I. Elevated phosphorus: Dynamics during four years of green roof development. Urban Ecosyst. 2017, 20, 1121–1133. [Google Scholar] [CrossRef]
- MacAvoy, S.E.; Plank, K.; Mucha, S.; Williamson, G. Effectiveness of foam-based green surfaces in reducing nitrogen and suspended solids in an urban installation. Ecol. Eng. 2016, 91, 257–264. [Google Scholar] [CrossRef]
- Hathaway, A.M.; Hunt, W.F.; Jennings, G.D. A field study of green roof hydrological and water quality performance. Am. Soc. Agric. Biol. Eng. 2008, 51, 37–44. [Google Scholar]
- Kohler, M.; Schmidt, M.; Grimme, F.W.; Laar, M.; de Assuncao Paiva, V.L.; Tavares, S. Green roofs in temperate climates and in the hot-humid tropics—far beyond the aesthetics. Environ. Manag. Health 2002, 13, 382–391. [Google Scholar] [CrossRef]
- Niu, H.; Clark, C.; Zhou, J.; Adriaens, P. Scaling of economic benefits from green roof implementation in Washington DC. Environ. Sci. Technol. 2010, 44, 4302–4308. [Google Scholar] [CrossRef] [PubMed]
- Todorov, D.; Driscoll, C.T.; Todorova, S.; Montesdeoca, M. Water quality function of an extensive vegetated roof. Sci. Total Environ. 2018, 625, 928–939. [Google Scholar] [CrossRef] [PubMed]
- Currie, B.A.; Bass, B. Estimates of air pollution mitigation with green plants and green roofs using the UFORE model. Urban Ecosyst. 2008, 11, 409–422. [Google Scholar] [CrossRef]
- Speak, A.F.; Rothwell, J.J.; Lindley, S.J.; Smith, C.L. Urban particulate pollution reduction by four species of green roof vegetation in a UK city. Atmos. Environ. 2012, 61, 283–293. [Google Scholar] [CrossRef]
- Yang, J.; Gong, P. Quantifying air pollution removal by green roofs in Chicago. Atmos. Environ. 2008, 42, 7266–7273. [Google Scholar] [CrossRef]
- Russell, K.M.; Galloway, J.N.; Macko, S.A.; Moody, J.J.; Scudlark, J.R. Sources of nitrogen in wet deposition to the Chesapeake Bay region. Atmos. Environ. 1998, 32, 2453–2465. [Google Scholar] [CrossRef]
Figure 1.
Washington, D.C., USA. Locations of D.C. Fire and Emergency Medical Services (DC FEMS) Engines 12 and 7 are shown by the blue dots. These stations were the locations for the green surfaces examined in this study. The red roads are interstate highways.
Figure 1.
Washington, D.C., USA. Locations of D.C. Fire and Emergency Medical Services (DC FEMS) Engines 12 and 7 are shown by the blue dots. These stations were the locations for the green surfaces examined in this study. The red roads are interstate highways.

Figure 2.
Schematic of green surface plus points of collection from D.C. Fire and Emergency Medical Services (DC FEMS) Engines 12 (A) and 7 (B). The planted and unplanted collectors are under the Aqualok™ foam panels in the respective areas outlined as rectangles in the figure. The figure is not to scale and only represents the positions of the various green surfaces and collection points.
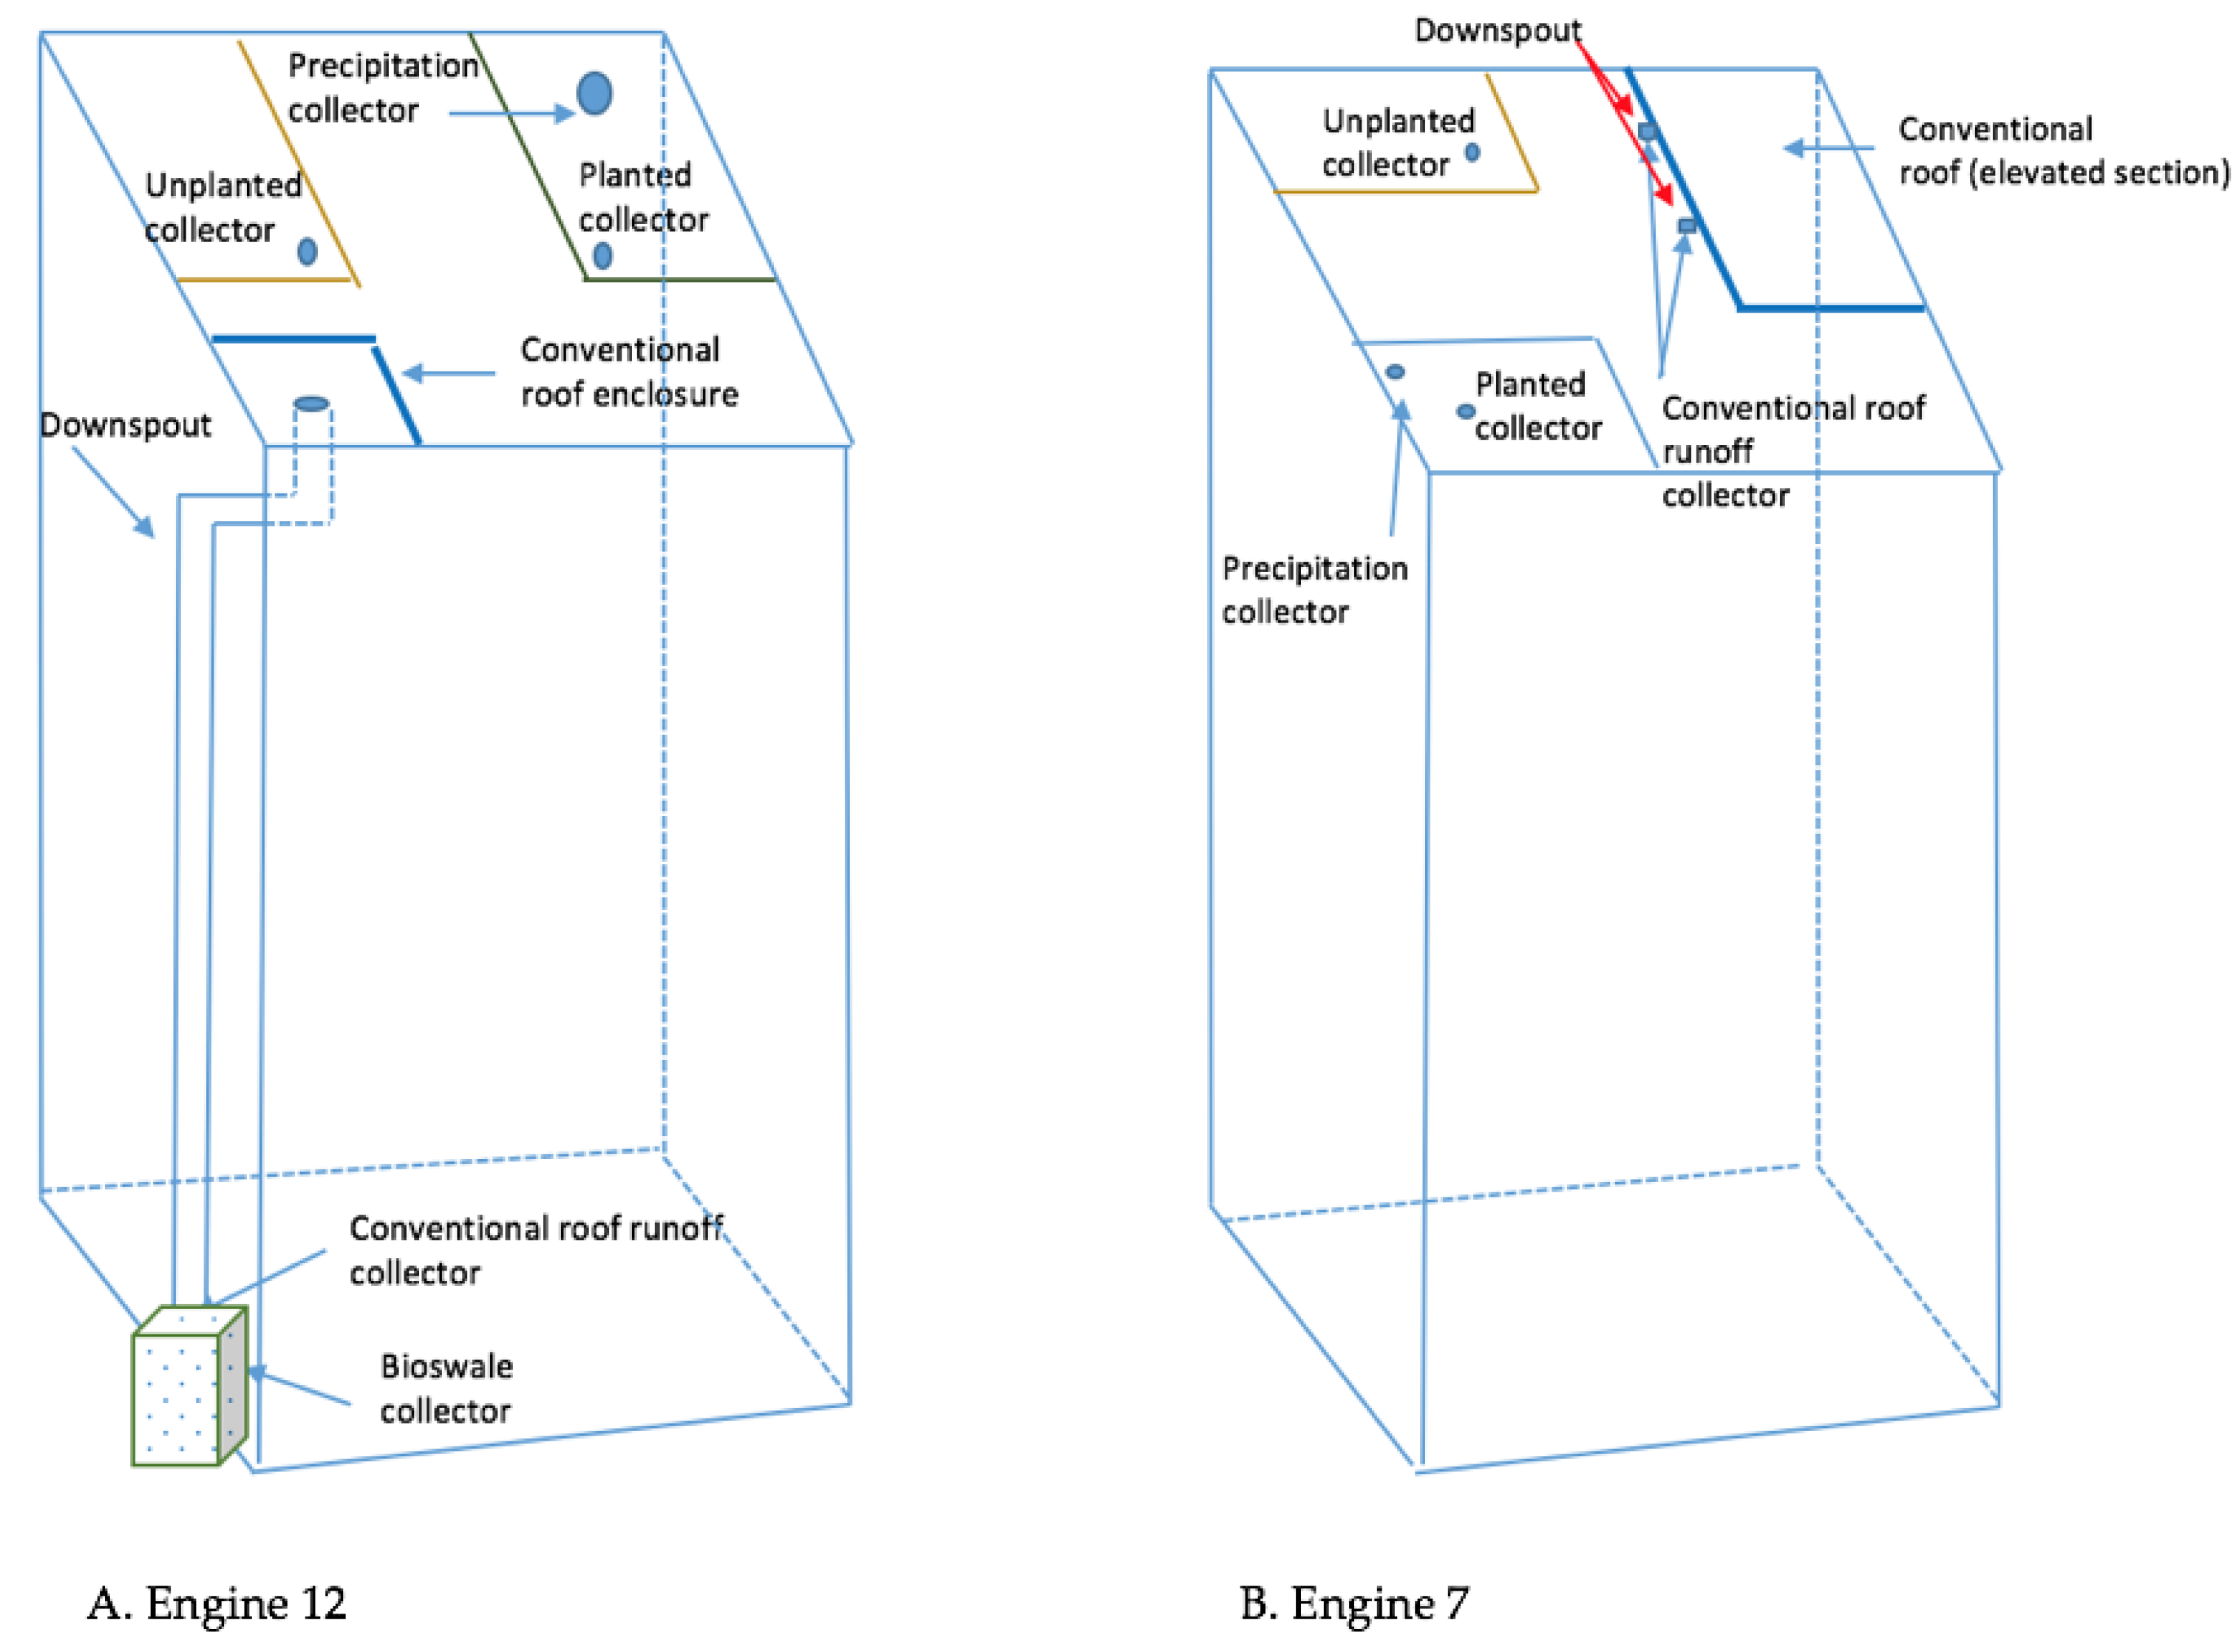
Figure 3.
Engine 12 total suspended solids (TSS) from three Aqualok™ treatments vs runoff from the conventional roof. High-throughflow TSS after installation of the Aqualok™ treatments diminished by the 117th day while runoff remained high. Even after >1000 days, the Aqualok™ treatments reduced TSS substantially relative to untreated runoff.

Figure 4.
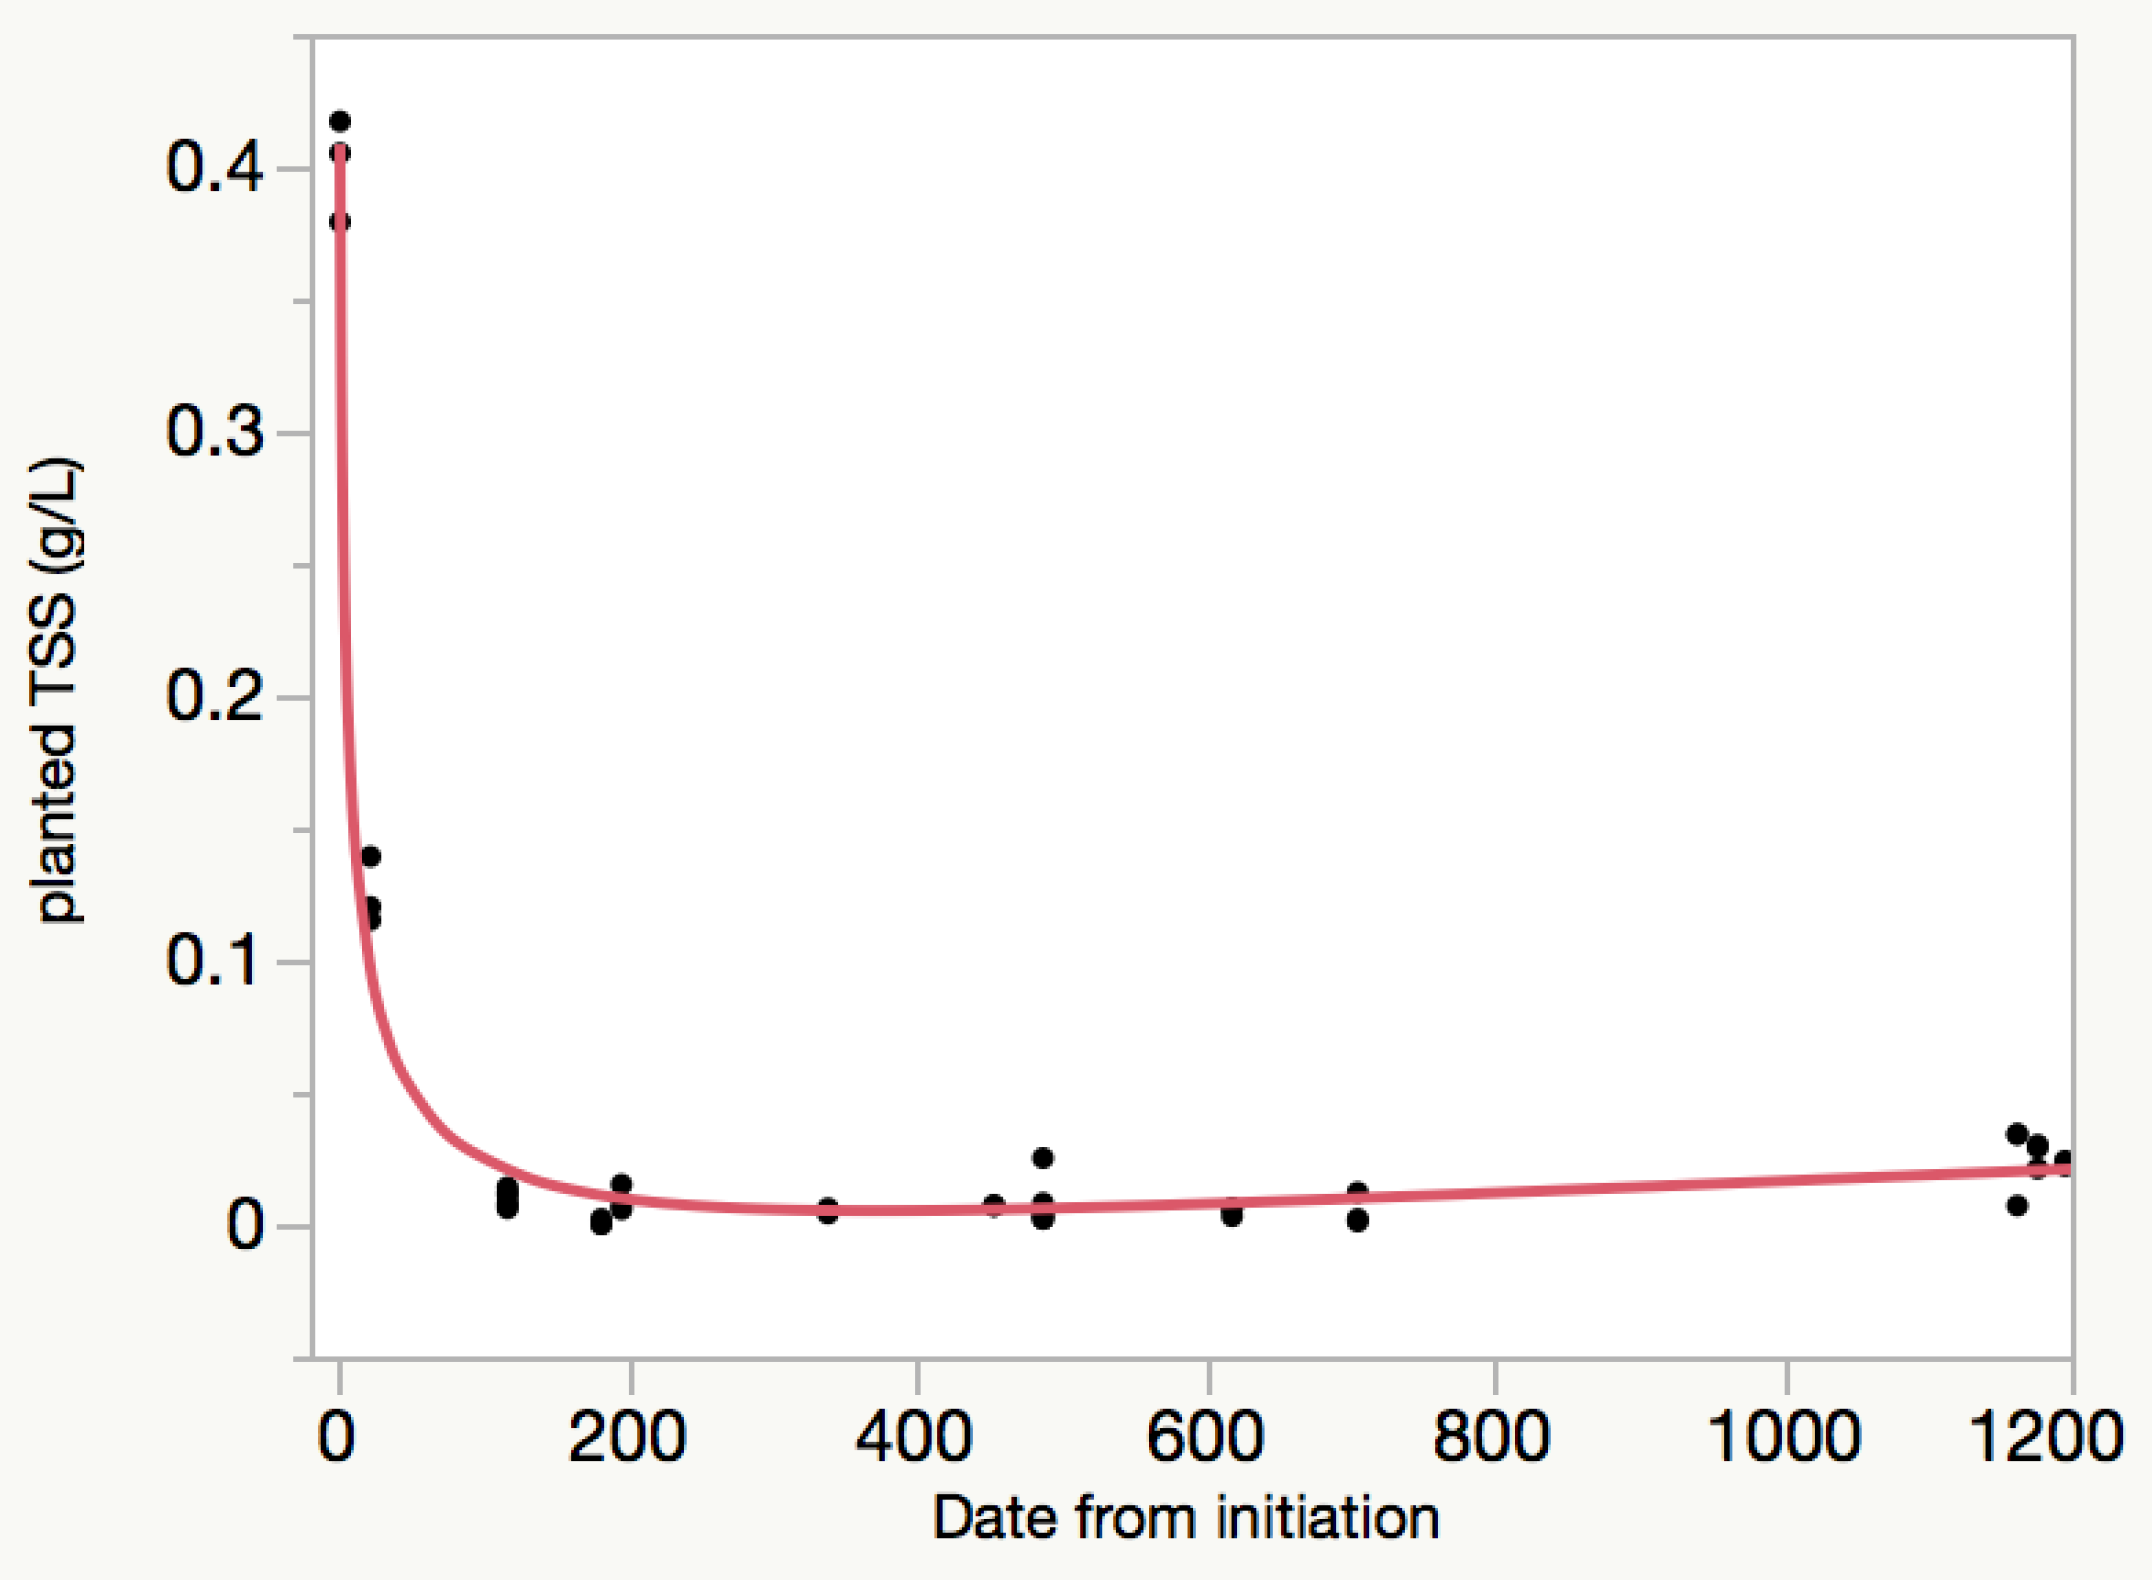
DC FRMS Engine 12 planted Aqualok™, total suspended solids (TSS) versus time. Total suspended solids (TSS) show high concentrations post-roof installation, but taper off and remain low for the duration of the study. Equation of best fit is a second-order logarithmic. Planted TSS (g/L) = 0.4062088 − 0.1355718 × Log(Date from initiation) + 0.0114551 × Log(Date from initiation)2. R = 0.99.
Figure 4.
DC FRMS Engine 12 planted Aqualok™, total suspended solids (TSS) versus time. Total suspended solids (TSS) show high concentrations post-roof installation, but taper off and remain low for the duration of the study. Equation of best fit is a second-order logarithmic. Planted TSS (g/L) = 0.4062088 − 0.1355718 × Log(Date from initiation) + 0.0114551 × Log(Date from initiation)2. R = 0.99.

Figure 5.
DC FRMS Engine 12 unplanted Aqualok™ total suspended solids (TSS). Total suspended solids (TSS) show high concentrations post-roof installation, but taper off and remain low for the duration of the study. Unplanted TSS (g/L) = 0.2232581 − 0.0706367 × Log(Date from initiation) + 0.005712 × Log(Date from initiation)2. R = 0.95.
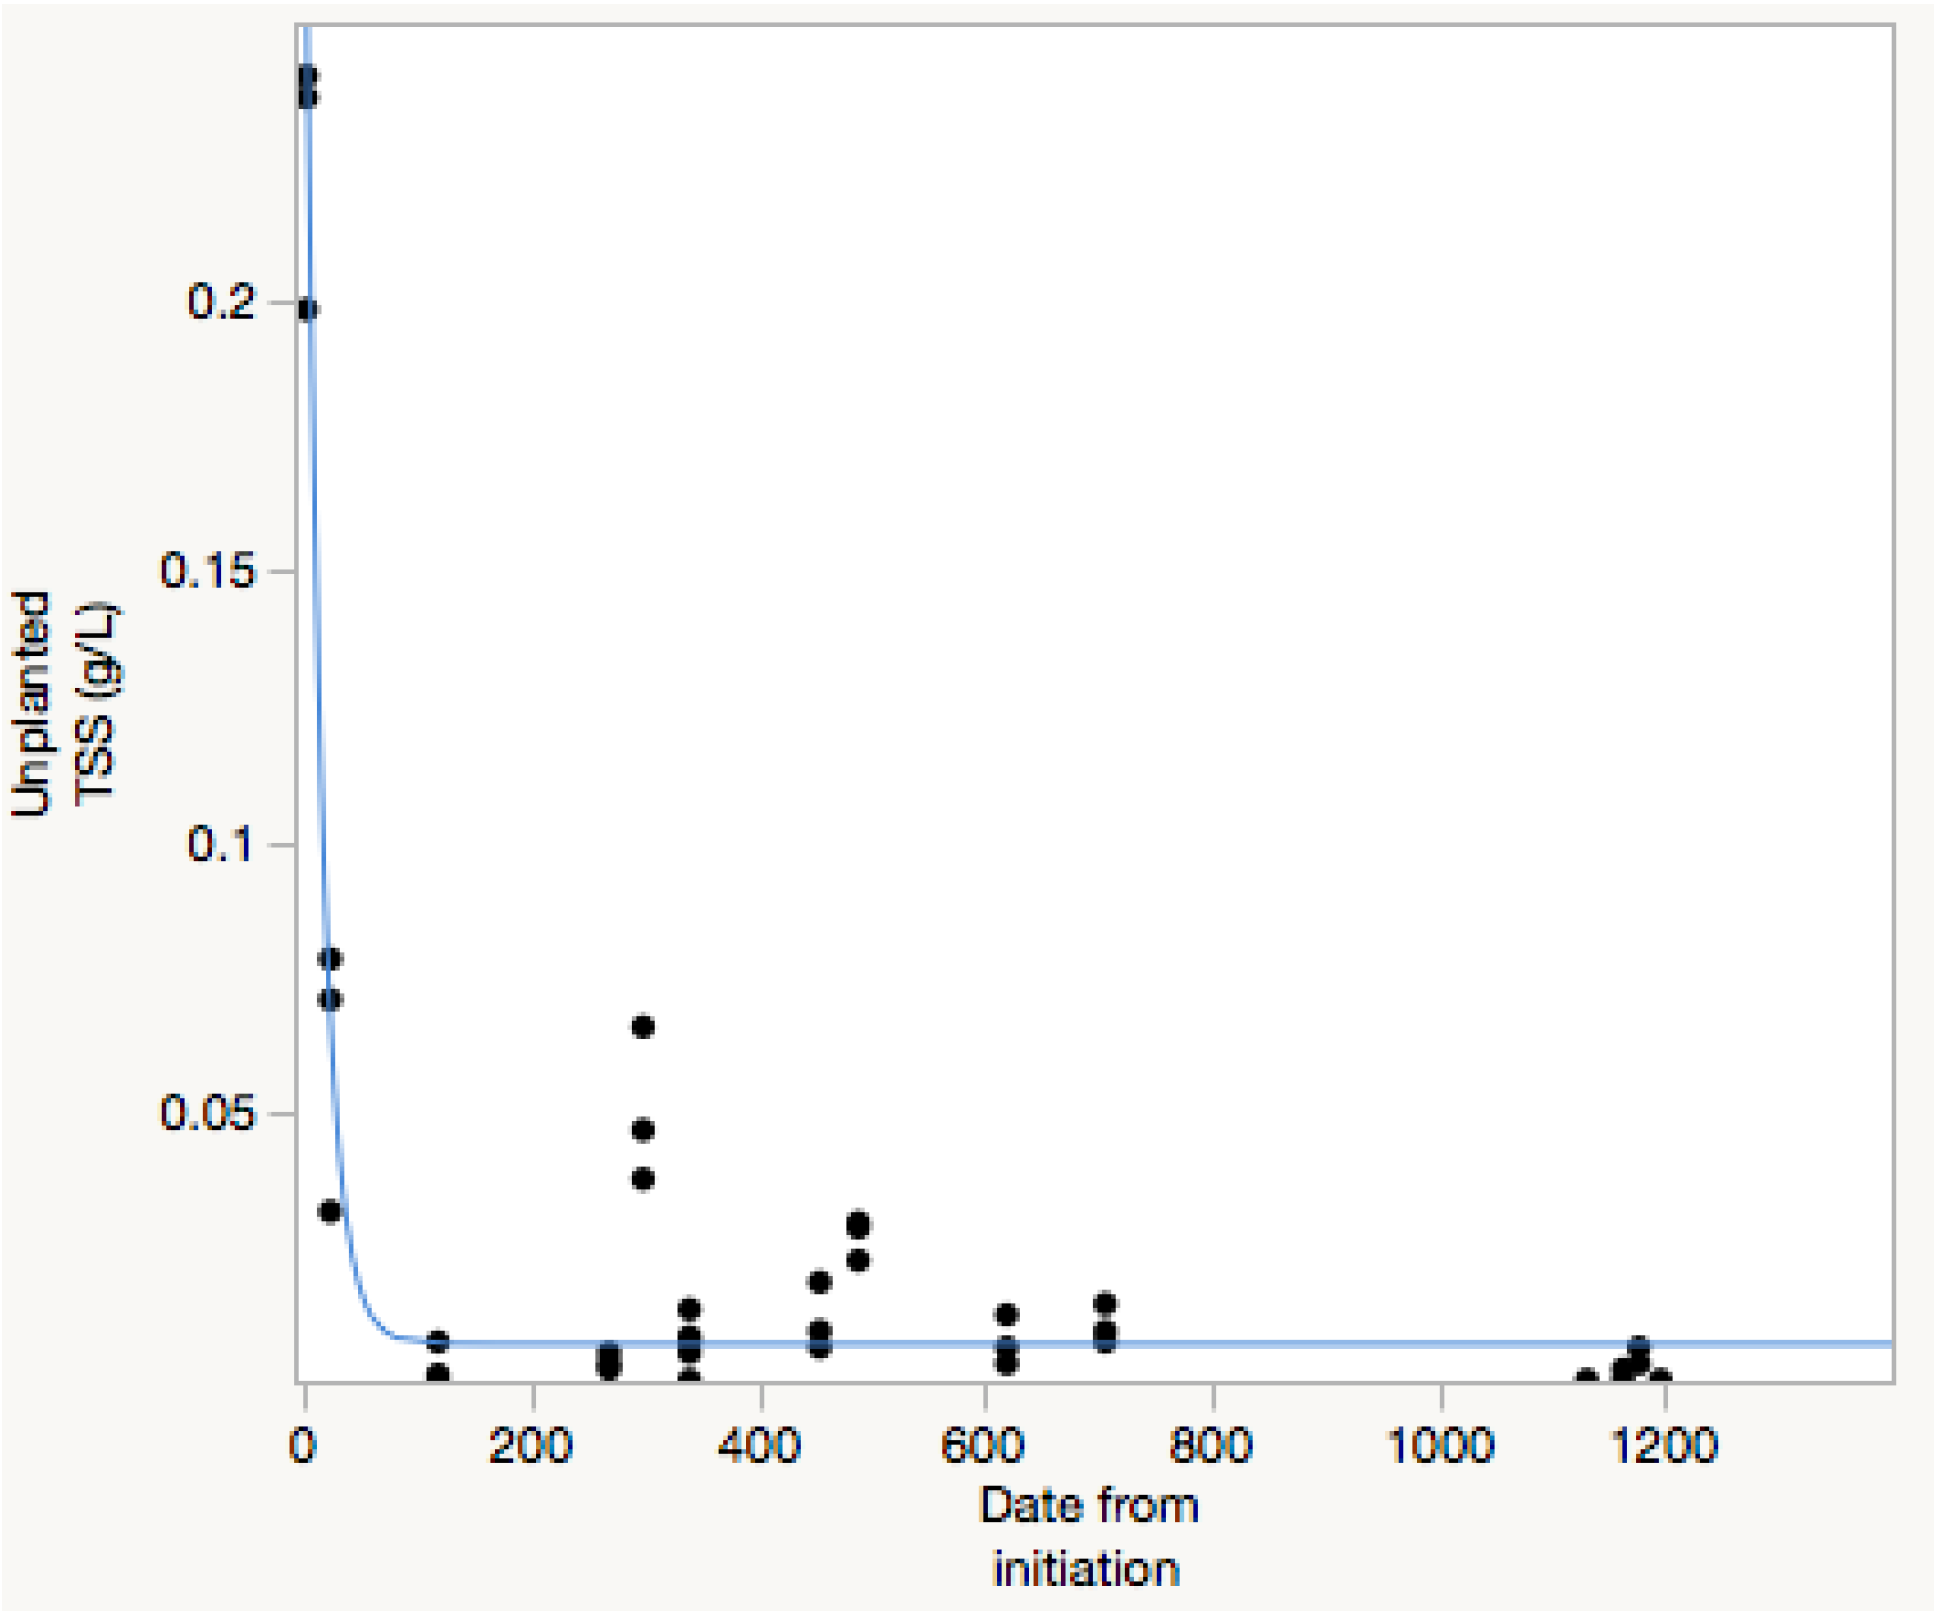
Figure 6.
DC FRMS Engine 12 unplanted Aqualok™ NO3 (mg/L) over time. July 2012 to October 2015.
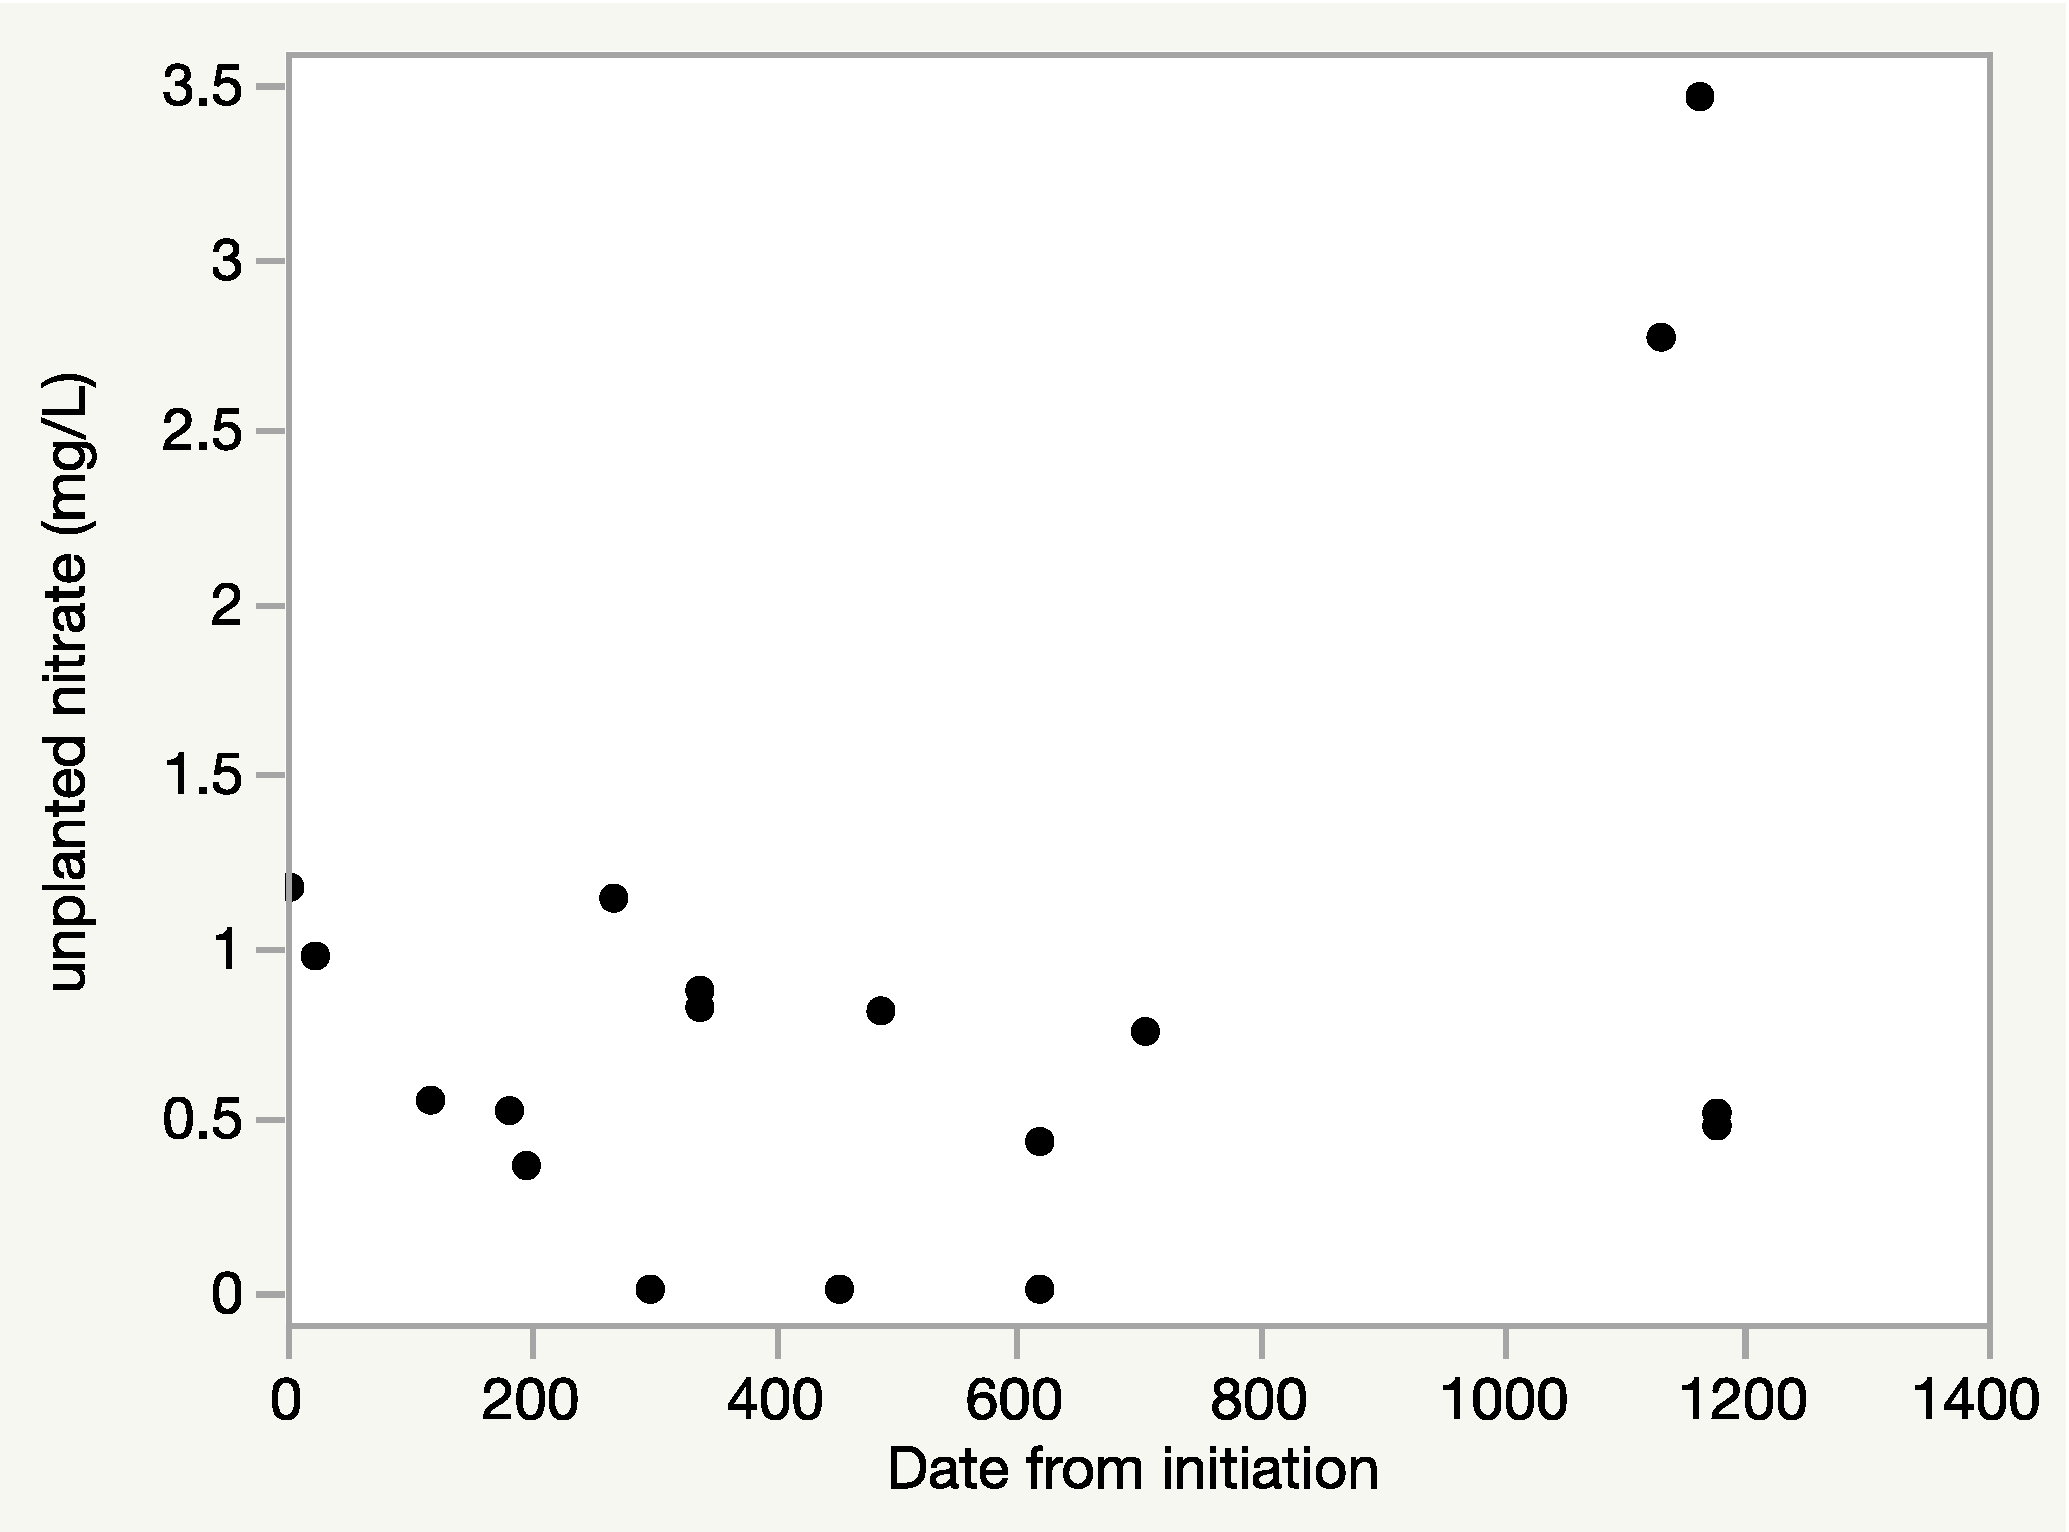
Figure 7.
DC FRMS Engine 12 bioswale Aqualok™ total suspended solids (TSS) over time. July 2012 to October 2015.
Figure 7.
DC FRMS Engine 12 bioswale Aqualok™ total suspended solids (TSS) over time. July 2012 to October 2015.


Table 1.
Collections points from surface sites at the two locations. “Untreated” is runoff from a conventional roof.
Table 1.
Collections points from surface sites at the two locations. “Untreated” is runoff from a conventional roof.
| Collection Point | Engine 12 | Engine 7 |
|---|---|---|
| unplanted Aqualok™ | X | X |
| planted Aqualok™ | X | X |
| bioswale Aqualok™ | X | |
| “untreated” runoff | X | X |
| precipitation | X | X |
Table 2.
Precipitation amounts for the events sampled. Dates are dates of collection, which were within 36 hours of the event. * 3 day event (Jan. 28–30), ** 3 day event (Oct. 10–12), *** 2 day event (March 29, 30), **** 3 day event (Oct. 11–13).
Table 2.
Precipitation amounts for the events sampled. Dates are dates of collection, which were within 36 hours of the event. * 3 day event (Jan. 28–30), ** 3 day event (Oct. 10–12), *** 2 day event (March 29, 30), **** 3 day event (Oct. 11–13).
| Event Collection Dates | Locations Sampled | Precipitation Amount (cm) | Days from Study Initiation |
|---|---|---|---|
| 19-Jul-12 | Engine 12 | 0.45 | 1 |
| 10-Aug-12 | Engine 12 | 1.5 | 22 |
| 13-Nov-12 | Engine 12 | 2.67 | 117 |
| 17-Jan-13 | Engine 12 | 2.74 | 182 |
| 31-Jan-13 | Engine 12 | 2.51 * | 196 |
| 12-Apr-13 | Engine 12 | 2.03 | 268 |
| 12-May-13 | Engine 12 | 1.4 | 298 |
| 23-Jun-13 | Engine 12 | 1.17 | 339 |
| 16-Oct-13 | Engine 12 and 7 | 12.27 ** | 454 |
| 19-Nov-13 | Engine 12 and 7 | 1.24 | 488 |
| 30-Mar-14 | Engine 12 and 7 | 5.26 *** | 619 |
| 25-Jun-14 | Engine 12 and 7 | 1.43 | 706 |
| 11-July-14 | Engine 12 | 1.93 | 722 |
| 9-Oct-14 | Engine 7 | 0.38 | 824 |
| 14-Oct-14 | Engine 7 | 1.27 **** | 829 |
| 16-Oct-14 | Engine 7 | 3.66 | 831 |
| 24-Aug-15 | Engine 12 and 7 | 1.04 | 1131 |
| 12-Sept-15 (runoff only) | Engine 12 and 7 | 4.06 | 1146 |
| 29-Sept-15 | Engine 12 and 7 | 4.19 | 1163 |
| 9-Oct-15 | Engine 12 and 7 | 1.02 | 1190 |
| 28-Oct-15 | Engine 12 and 7 | 1.65 | 1203 |
Table 3.
Average ±SD (N) for constituent concentrations from the various surfaces on Engine 12 from July 2012 to October 28, 2015. Values are from 17 storms. Note that collections for all 5 categories were not necessarily possible during each event. Values with different letters are significantly different (Wilcoxon Ranked Pairs). Total suspended solids (TSS), total phosphorus (Total P) and total organic carbon (TOC).
| Collection Point | TSS (g/L) | TOC (mg/L) | Total P (mg/L) | NH4 (mg/L) | NO3 (mg/L) |
|---|---|---|---|---|---|
| Precipitation | 0.026 ± 0.047 (N = 45) A | 3.6 ± 1.8 (N = 16) A | 0.02 ± 0.04 (N = 17) A | 0.11 ± 0.14 (N = 17) A | 0.13 ± 0.16 (N = 17) A |
| Roof runoff | 0.091 ± 0.104 (N = 46) B | 5.4 ± 3.5 (N = 16) A,B | 0.03 ± 0.06 (N = 17) A,C | 0.22 ± 0.35 (N = 17) A,B | 0.44 ± 0.32 (N = 17) B |
| Bioswale Aqualok | 0.048 ± 0.040 (N = 33) B | 14.7 ± 10.6 (N = 12) C | 0.12 ± 0.20 (N = 12) A,C | 0.32 ± 0.73 (N = 12) A,B | 0.41 ± 0.46 (N = 12) A,B |
| Unplanted Aqualok | 0.026 ± 0.057 (N = 45) A | 6.5 ± 3.0 (N = 15) B | 0.11 ± 0.28 (N = 16) A,C | 0.15 ± 0.14 (N = 16) A,B | 0.95 ± 0.95 (N = 16) B |
| Planted Aqualok | 0.051 ± 0.111 (N = 36) A | 16.6 ± 7.3 (N = 13) C,D | 0.69 ± 0.55 (N = 14) B | 0.28 ± 0.38 (N = 14) B | 0.81 ± 1.13 (N = 14) B |
Table 4.
Average ±SD (N) for constituent concentrations from the various surfaces on Engine 7 from October 16, 2013 to October 28, 2015. Values are from 12 events at Engine 7. Note that collections for all 4 categories were not necessarily possible during each event. Values with different letters are significantly different (Wilcoxon Ranked Pairs). Total suspended solids (TSS), total phosphorus (Total P) and total organic carbon (TOC).
| Collection Point | TSS (g/L) | TOC (mg/L) | Total P (mg/L) | NH4 (mg/L) | NO3 (mg/L) |
|---|---|---|---|---|---|
| Precipitation | 0.017 ± 0.025 (N = 36) A | 3.2 ± 2.1 (N = 12) A | 0.02 ± 0.03 (N = 13) A | 0.13 ± 0.15 (N = 13) A | 0.21 ± 0.33 (N = 13) A |
| Conventional roof runoff | 0.096 ± 0.163 (N = 33) B | 13.8 ± 9.4 (N = 11) B | 0.04 ± 0.05 (N = 12) A,B | 0.45 ± 0.79 (N = 12) A | 0.51 ± 1.24 (N = 12) C,A |
| Unplanted Aqualok | 0.017 ± 0.020 (N = 33) C,A | 10.7 ± 4.6 (N = 11) B | 0.04 ± 0.05 (N = 11) A,B | 0.14 ± 0.24 (N = 11) A | 1.12 ± 0.93 (N = 11) B |
| Planted Aqualok | 0.051 ± 0.065 (N = 28) D,B | 18.0 ± 24.7 (N = 10) B | 0.06 ± 0.05 (N = 10) B | 0.14 ± 0.23 (N = 10) A | 0.64 ± 0.36 (N = 10) B |
Table 5.
Average ±SD (N) for constituent concentrations collected in water from Engine 12 (only) surfaces excluding July through September 2012. Those months showed effects associated with the installation of the Aqualok, which elevated concentrations as the surfaces settled. Total suspended solids (TSS), total phosphorus (Total P) and total organic carbon (TOC). Values with different letters are significantly different (Wilcoxon Ranked Pairs).
| Collection Point | TSS (g/L) | TOC (mg/L) | Total P (mg/L) | NH4 (mg/L) | NO3 (mg/L) |
|---|---|---|---|---|---|
| Precipitation | 0.020 ± 0.042 (N = 42) A | 3.46 ± 1.89 (N = 14) A | 0.025 ± 0.037 (N = 15) C | 0.114 ± 0.151 (N = 15) A | 0.125 ± 0.168 (N = 15) A |
| Conventional roof runoff | 0.083 ± 0.106 (N = 40) B,C | 5.02 ± 3.13 (N = 14) A,B | 0.033 ± 0.061 (N = 15) C,D | 0.221 ± 0.360 (N = 15) A,B | 0.478 ± 0.339 (N = 15) B |
| Bioswale Aqualok | 0.037 ± 0.035 (N = 27) C | 13.7 ± 10.16 (N = 10) C | 0.143 ± 0.207 (N = 10) A,E | 0.374 ± 0.796 (N = 10) A,B | 0.363 ± 0.401 (N = 10) A,B |
| Unplanted Aqualok | 0.008 ± 0.013 (N = 39) D | 6.12 ± 2.94 (N = 13) B | 0.127 ± 0.291 (N = 14) C,E | 0.169 ± 0.138 (N = 14) A,B | 0.932 ± 1.018 (N = 15) B |
| Planted Aqualok | 0.010 ± 0.009 (N = 30) E,A | 15.26 ± 7.07 (N = 11) C | 0.636 ± 0.567 (N = 12) B | 0.241 ± 0.327 (N = 12) B | 0.413 ± 0.524 (N = 12) B |
© 2018 by the authors. Licensee MDPI, Basel, Switzerland. This article is an open access article distributed under the terms and conditions of the Creative Commons Attribution (CC BY) license (http://creativecommons.org/licenses/by/4.0/).
Share and Cite
MDPI and ACS Style
Mucha, S.; Williamson, G.; MacAvoy, S.E. Pollution Reduction in Throughflow from Vegetated and Non-Vegetated, Foam-Based Surfaces and Green Roofs. Nitrogen 2020, 1, 21-33. https://doi.org/10.3390/nitrogen1010004
AMA Style
Mucha S, Williamson G, MacAvoy SE. Pollution Reduction in Throughflow from Vegetated and Non-Vegetated, Foam-Based Surfaces and Green Roofs. Nitrogen. 2020; 1(1):21-33. https://doi.org/10.3390/nitrogen1010004
Chicago/Turabian StyleMucha, Sydney, Glenn Williamson, and Stephen E. MacAvoy. 2020. "Pollution Reduction in Throughflow from Vegetated and Non-Vegetated, Foam-Based Surfaces and Green Roofs" Nitrogen 1, no. 1: 21-33. https://doi.org/10.3390/nitrogen1010004