Long Term Energy Transition Scenario Analysis for the City of Donostia †


1
Tecnalia Resarch & Innovation, 48160 Derio, Bizkaia, Spain
2
Thermal Engineering Department, University of the Basque Country (UPV/EHU), 48013 Bilbao, Bizkaia, Spain
*
Author to whom correspondence should be addressed.
†
Presented at Sustainable Places 2017 (SP2017) Conference, Middlesbrough, UK, 28–30 June 2017.
Proceedings 2017, 1(7), 644; https://doi.org/10.3390/proceedings1070644
Published: 18 January 2018
(This article belongs to the Proceedings of the Sustainable Places 2017 (SP2017) Conference)
Abstract
:The direction adopted for the energy transitions towards a low carbon future will have long lasting implications in other aspects beyond the Climate Change. However, cities are becoming increasingly complex and a detailed knowledge is required for a long-term energy planning, which is frequently not available in city decision making processes. This paper describes a multi-criteria ex-ante impact assessment methodology developed for the building sector energy planning, which combines energy modelling and life cycle analysis with the regional macroeconomic analysis through the supply chain evaluation. The methodology is applied to the city of Donostia, demonstrating the importance of simultaneously considering various potentially conflicting criteria for the prioritization of scenarios.
1. Introduction
Exploring plausible pathways for the decarbonisation of the energy system of countries is becoming increasingly urgent to achieve GHG emission reduction targets. Building and energy sectors have the greatest potential for cutting emissions [1]. The migration tendency occurred during the last decades from rural areas to cities is expected to continue and some forecasts show that more than the 70% of the world population will be living in cities by 2050 [2]. Therefore, energy planning of cities is becoming increasingly complex. Although some recent studies identify the necessity of quantitative assessment methods based on the notion of multiple impact pathways, these frameworks are still in their infancy for cities. There are mainly applied nowadays in studies to conduct climate and energy policy analyses on a large scale [3,4].
Currently city energy planners need to combine various complex methodologies and tools with different time steps and scales, for which clear linkages are still unavailable. Studies such as the one carried out by Mirakyan and De Guio [5] identify the necessity of evaluating city energy planning in an integrated way, combined with territorial planning. Another study carried out by Mattoni et al. [6], also proposes an approach to cities and territories combining the district scale, the city scale, and the regional scale. It can be said that city energy planning process is still complex due to the lack of consensus on the way to assess and prioritise different alternatives under a common framework.
This paper provides an example of application of a methodology developed for the ex-ante impact assessment of alternative energy transition scenarios for cities, linking energy modelling with holistic impact assessment methodologies. The case study is focused on the analysis of an energy transition scenario for Donostia from 2017 to 2067. The scenario described in this paper is part of a wider study in which the methodology is developed in detail and where 68 alternative energy transition scenarios for Donostia are compared [7].
2. Materials and Methods
2.1. Case Study
The area of study comprises five districts covering more than the 40% of the city’s building stock. This study considers the districts of Amara (11,639 dwellings), Cortazar/Centro (8988 dwellings), Antiguo-Ondarreta (3856 dwellings), Gros (9581 dwellings) and Aldezaharra (3332 dwellings). The sum of these districts encompasses the most relevant areas of the city in terms of building stock and population. Each district is evaluated in detail following a bottom-up approach for the data gathering and energy characterisation buildings as it is showed in Table 1.
Definition of the Energy Transition Scenario
An energy transition scenario focused on reducing environmental emissions, decreasing the dependence on fossil fuels, and increasing the socioeconomic development of the city and the region is presented in this section. The scenario proposes the simultaneous implementation of several interventions and their staggered deployment across the transition period of 50 years. The interventions included in this study are listed as follows; central heating biomass boilers (CHBB), heat pumps (HP) and passive interventions for buildings (PIFB).
The dimensioning of the scenario has been done according to the existing barriers associated to their implementation such as, the options to replace existing gas oil-fired and natural gas-fired central heating systems with biomass central heating systems and heritage conservation grade of buildings for refurbishment measures. A total of 4.4 millions square meters of heated floor area of residential buildings is refurbished progressively with the following initial distribution: 15% of the existing buildings have an energy certification level of D, 58% level E, 24% level F and 4% level G. It is assumed that all the buildings are refurbished to a level of C according to the energy demands defined for each category. Further detail about the energy demand per building category can be found in the Appendix B.
Besides, it is considered that a total of 23,795 existing heating systems are replaced progressively during this period. Table 2 shows the main characteristics for the deployment of these interventions.
Other key parameters considered for defining the scenario such as the annual implementation rate of the interventions, the energy price escalators, the discount rate and the energy technology cost trends are also detailed in the Appendix B.
3. Impact Assessment Results
The impact assessment covers the city scale and the regional scale for both the socioeconomic and the environmental dimensions. The life cycle socioeconomic and environmental assessment at the city scale has been carried out through the evaluation of the following impact indicators: Cumulative Net Present Value (CNPV), Cumulative Net Present Cost-Social (CNPC-S), Dynamic Payback Period (DPP), Cumulative Global Warming Potential Reduction (CGWPR), and Cumulative Non Renewable Primary Energy Reduction (CN-RPER). Table 3 shows the economic and environmental impact results of the scenario.
Negative CNPV results shows that although some measures such as the investments in new heating and DHW systems would be cost effective, when they are combined with building refurbishment interventions, the energy transition scenario shows a negative cash flow at the end of the period. On the other hand, the total costs for citizens associated to the energy transition scenario, which considers not only the initial investment but also the costs of energy and the O&M and system replacement costs during the transition period is 338.4 M€.
Results for the environmental dimension show that with the implementation of the transition scenario, CO2 equivalent emission savings of 1.4 × 10⁶ TnCO2eq are achieved. Emission savings of 64% with respect to the values of 2007 would be achieved in the city by 2067. At the beginning of the transition period, there is actually an increase on emissions savings and use of non-renewable primary energy, due to emissions and embodied energy related to the products used on the different measures. Those effects occur throughout the transition period due to the new implementation of interventions, but they are rapidly compensated by the energy savings gained in the use stage.
For the macroeconomic assessment the next two indicators are evaluated: Induced Regional Gross Domestic Product (RGDP), and Regional Production (RP). With regard to the direct, indirect and induced effects created in the economy of the Basque Country, results show that the implementation of the scenario would induce an impact equivalent to an increase in the GDP of the Basque Country of 0.12% and close to 1.26% of the GDP of Donostia.
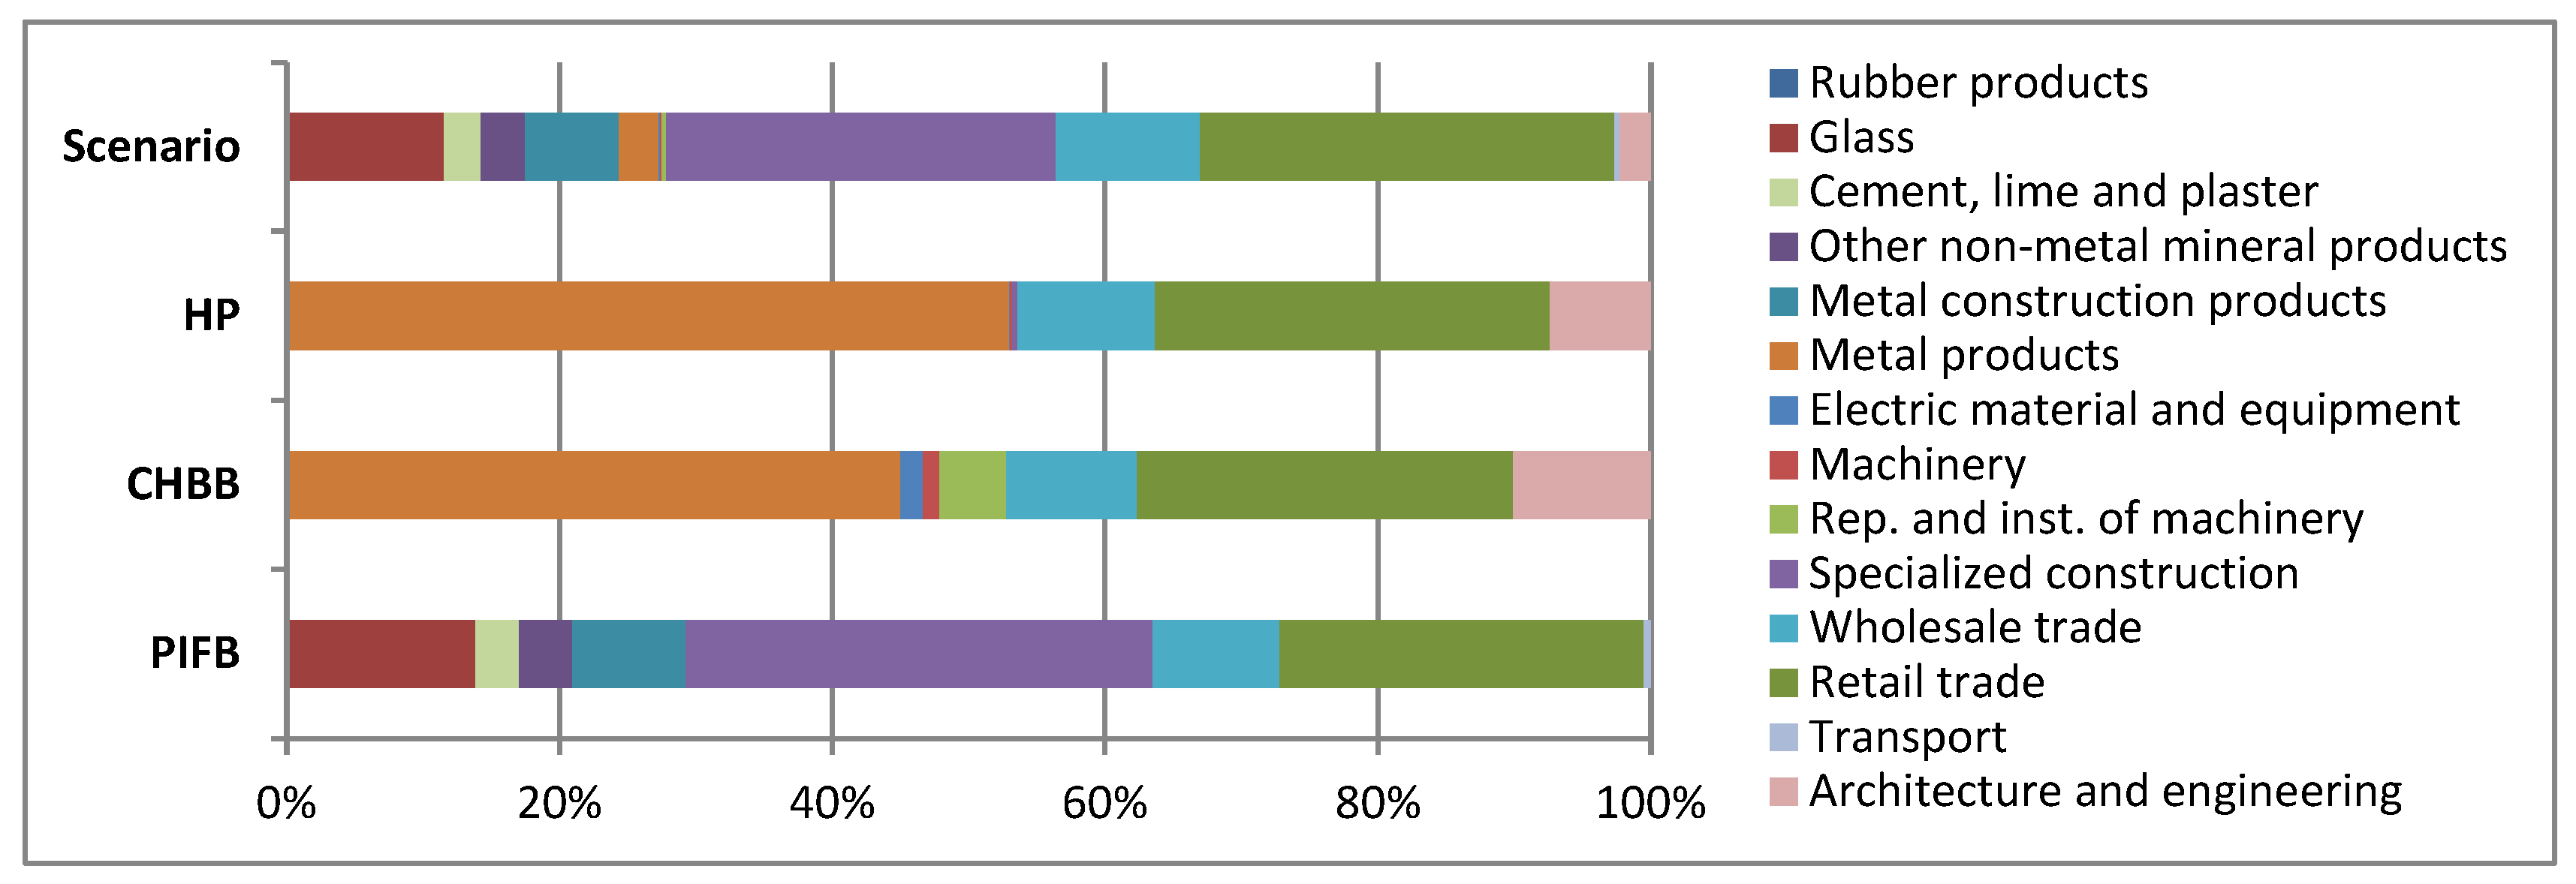
Figure 1 shows both the disaggregated shock of each intervention and the shock corresponding to the total city energy transition scenario (in cumulative discounted domestic costs in basic prices and in thousands of euros). This reflects the proportion in which the production of commodities would be increased in the Basque Country. This is precisely the exogenous shock used as input for the macroeconomic model.
Moreover, as it is shown in Table 4 a multiplier of 0.82 for GDP and a multiplier of 1.65 for Production are achieved by the energy transition scenario. These values are reasonable considering that there are for a regional economy and not for a national economy. The relevance of considering not only the indirect effects but also the induced effects is also observed in the study. The results show an increase of between 9% and 22% in the impacts created when the induced impacts are also considered.
4. Discussion
The impact assessment results achieved for the different indicators evaluated provide a variety of criteria that can be used in order to evaluate the effects of different scenarios. Following this process for comparing different potential scenarios can help designing the optimum energy transition scenario for each city depending on their particular interests.
Results show that the substitution of existing heating and DHW systems by a combination of biomass-fired central heating boilers and heat pumps with building refurbishment is very positive in terms of CO2 emission and non-renewable PE savings. However, current and expected future prices of these interventions do not ensure cost savings for citizens in the defined period. In this regard, policy mechanism designed to accelerate investment on building refurbishment as well as the incorporation of other interventions to the transition scenario, such as natural gas boilers, solar photovoltaic systems, and solar thermal systems can help to balance the global economic cash flow of scenarios across the transition period. These policy mechanisms should aim to make viable refurbishment project taking into consideration additional benefits of building refurbishment, including increased comfort and health of the occupants, on increasing property values, which are not taken into account in this study.
The relatively low macroeconomic impact assessment results on the other hand, show that this type of regional indicators are interesting mainly for a strategic vision and to understand replication potential of interventions in other areas of the city or in other cities of the region.
Supplementary Materials
The detailed description of the impact assessment methodology as well as all the data gathering process that has been necessary for this research are available in the study by Arrizabalaga [7].
Acknowledgments
Part of this work has been possible due to the participation in CITyfiED project that has received funding from the European Union’s Seventh Programme for research, technological development and demonstration under grant agreement No. 609129. This research has also been supported financially by the Foundation Centros Tecnológicos Iñaki Goenaga.
Appendix A
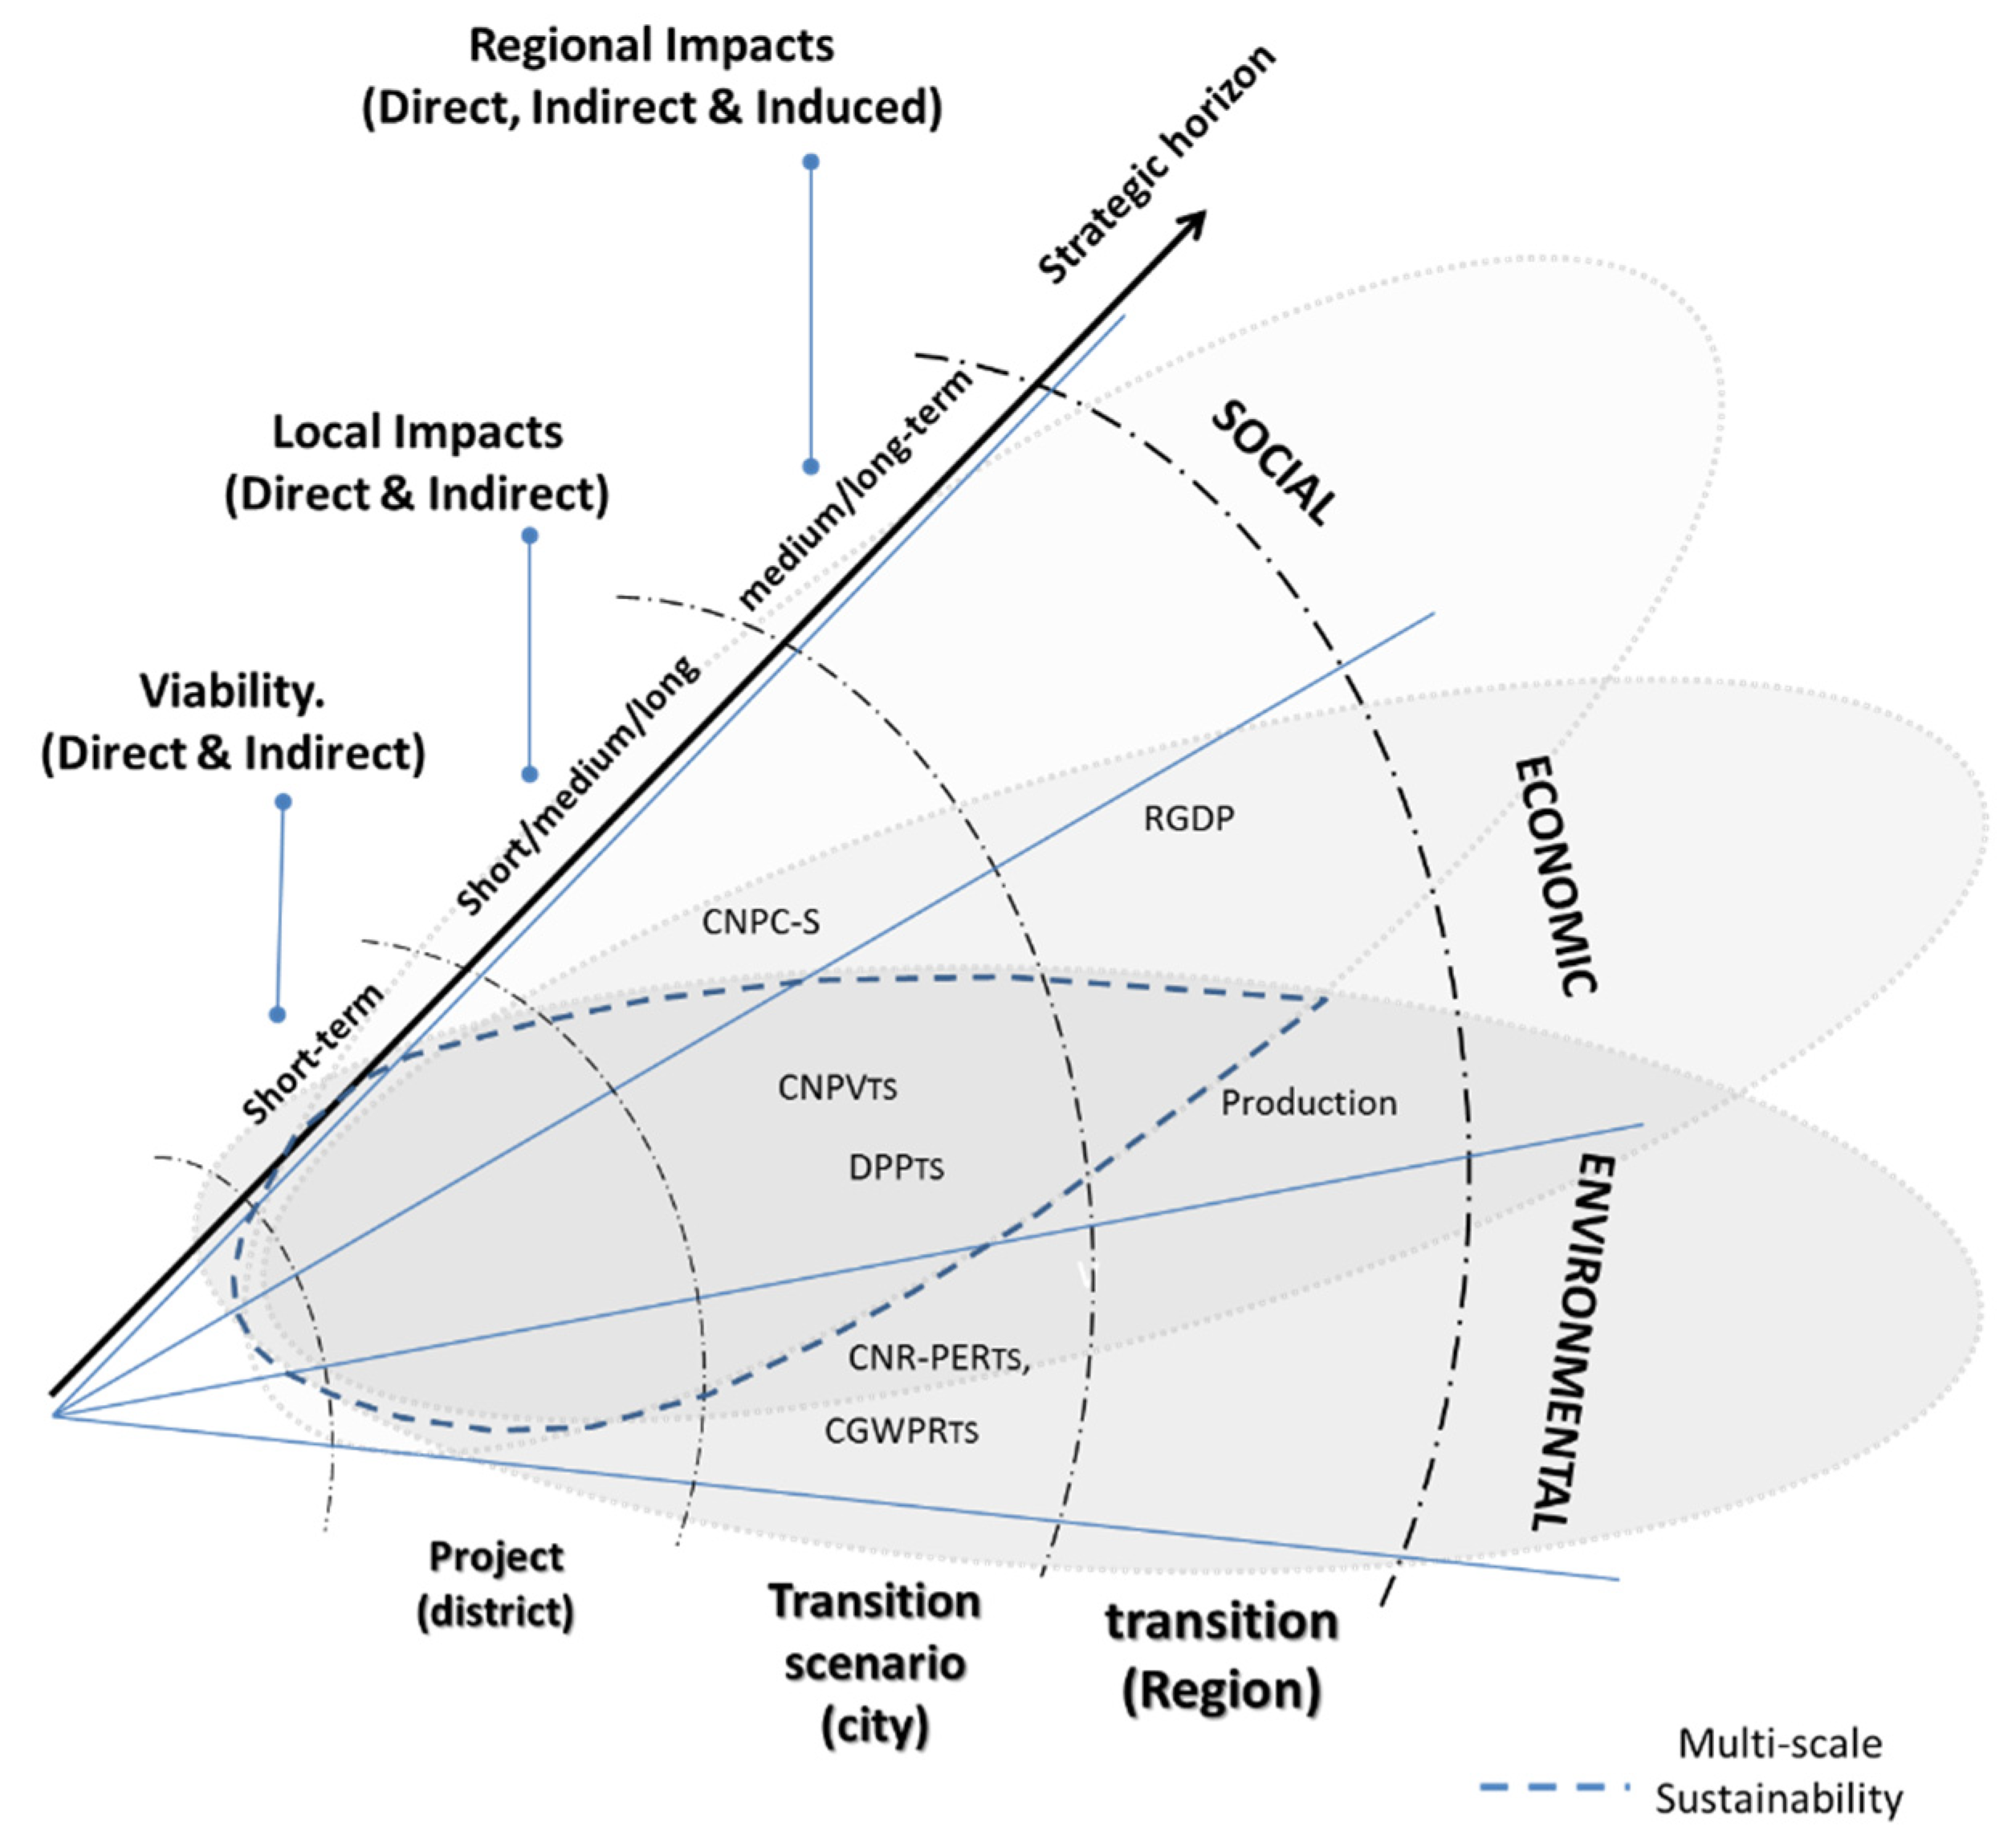
This study has been carried out following a methodology that is based on the ex-ante impact assessment of energy transition scenarios with a life cycle perspective. Figure A1 illustrates the framework of the methodology, which distinguishes the project, the city and the regional scales for the three dimensions of the sustainability, as well as the impact indicators evaluated in the study.
The analysis at the project scale (the most extended type of analysis) responds to a viability point of view and is not included in this paper. For the city scale assessment, the adaptation of existing life cycle analysis methodologies to the scale, the temporal range and the purpose of the study has been necessary. Finally, impact assessment at the regional scale responds to a more strategic point of view, which is in general far from the analysis at the project scale. In this scale the direct, indirect and induced impacts are evaluated with the use of macroeconomic models. The relation between the interventions to be implemented in the city with their macroeconomic regional effects has been stablished through the intervention supply chain approach. This approach is useful for connecting the life cycle cost impact assessment at the city scale, with the macroeconomic modelling at the regional scale through the creation of an exogenous shock that represents the energy transition scenario.
Figure A1.
Framework of the developed methodology for the multi-scale and multi-criteria impact assessment of alternative energy transition scenarios of cities.
Figure A1.
Framework of the developed methodology for the multi-scale and multi-criteria impact assessment of alternative energy transition scenarios of cities.

Regarding methods and values for life cycle environmental and socioeconomic assessment, Table A1 shows the phases considered in the impact assessment for each scale and dimension. A life time of 20 years is considered for heat pumps and boilers and 50 years for refurbishment interventions. Environmental impacts of the processes included in the life cycle of the interventions have been extracted from Ecoinvent database. The Global Warming Potential conversion factors (kgCO2/kWh) considered for energy carriers are; 0.357 for electricity, 0.311 for gas oil, 0.252 for natural gas and 0.02 for biomass. And the Non-Renewable Primary Energy conversion factors (MJ/kWh) are; 7.22 for electricity, 4.24 for gas oil, 4.28 for natural gas and 0.30 for biomass [8].

Table A1.
Phases of the life cycle considered for each scale and dimension of the analysis.
| A0 | A1–A3 | A4–A5 | B2 | B4 | B6 | |
|---|---|---|---|---|---|---|
| Environmental | ||||||
| City scale | X | X | X | |||
| Socioeconomic | ||||||
| City scale | X | X | X | X | X | X |
| Regional scale | X | X | X | X |
Note: Phases of the life cycle; A0: design, A1–A3: manufacturing, A4–A5: installation and construction, B2: maintenance, B4: replacement and B6: Operation.
Regarding the economic data, an investment cost of 500 €/kW is set for the biomass boilers with an operation and maintenance cost of 1.6% with regard to the initial investment cost. For the heat pump 500 €/kWe is considered [9], with an operation and maintenance cost of 4% [10]. The distribution of the CAPEX for all the generation system has been taken according to the database CYPE [11]. Finally, for the refurbishment interventions, a combination of measures is proposed (depending on their initial energy performance) in such a way that an energy demand equivalent to the reference building defined as ‘C’ is achieved after being refurbished. Different combinations of the following measures are used: Internal energy refurbishment (Basic/Efficient/Advanced) and window replacement (Advanced) with an initial investment cost of 0.4 €/(m2·a), 0.45 €/(m2·a), 0.62 €/(m2·a) and 0.9 €/(m2·a) respectively. The installation costs and the maintenance costs of each measure are 0.13 €/(m2·a) and 0.1 €/(m2·a) for envelope refurbishment measures and 0.25 €/(m2·a) and 0.47 €/(m2·a) for window replacement measures respectively [12].
In the case of the macroeconomic regional analysis, an existing and flexible Extended Input-Output model has been used, the MIOCIM model [13]. The impact assessment has been carried out with the last year of data available of the input-output tables for the Basque Country, 2014 [14]. These tables are the main inputs for the MIOCIM model and are provided in a classification of 88 sectors and 105 commodities expressed in basic prices and in thousands of euro. This is precisely the classification of commodities used for the definition of the shock of the scenario.
Appendix B
This appendix includes information which complements the definition of the energy transition scenario of the Section 2.1. Table A2 includes the energy demands considered for each of the building categories that have been used for the definition of the existing building stock of the residential and office sectors in the city of Donostia. The energy demands have been obtained through energy modelling and following the energy certification rules in the Spanish regulation [15]. No cooling demand is considered necessary for residential buildings in Donostia-San Sebastián.
Table A2.
Energy demand for each building category evaluated in Donostia according to IDAE [15].
Table A2.
Energy demand for each building category evaluated in Donostia according to IDAE [15].
| C | D | E | F | G | |
|---|---|---|---|---|---|
| Residential heating (kWh/m2 year) | 31.1 | 56.5 | 100.0 | 120.1 | 130.6 |
| Office heating (kWh/m2 year) | 14.9 | 20.7 | 26.1 | 32.4 | 40.2 |
| Office cooling (kWh/m2 year) | 22.3 | 31.1 | 39.2 | 48.6 | 60.3 |
Other key parameters considered for defining the scenario, as well as their evolution during the transition period, are described here:
- Annual implementation rate of the interventions: An annual implementation rate of 2% has been set for building refurbishment interventions [16]. The hypothesis that boiler replacement follows the same rate is used in the study. The initial investment is considered to take place on the same year as each individual implementation.
- Energy Price escalators: The projections of energy price are adopted from the EU Energy, Transport and GHG Emissions Trends to 2050 [17].
- Discount rate: Based on EU energy trends to 2030 [18], for long-term planning, a discount rate of 3% has been considered.
- Energy technology cost trends: It is assumed that technology costs (in real terms) will decrease in the future. CAPEX projections for heat pumps for the time frame 2013 to 2050 have been considered according to [19,20]. In the case of central heating biomass boilers and building refurbishment related interventions, no relevant cost reduction has been considered due to the current maturity level of the technology and the lack of reliable projections.
References
- European Commission. Communication from the Commission to the European Parliament, the Council, the European Economic and Social Committee and the Committee of the Regions; A Roadmap for Moving to a Competitive Low Carbon Economy in 2050; COM (2011) 112; European Union: Brussels, Belgium, 2011. [Google Scholar]
- United Nations. World Urbanization Prospects: The 2014 Revision; Department of Economic and Social Affairs/Population Division: New York, NY, USA, 2014. [Google Scholar]
- Ürge-Vorsatz, D.; Kelemen, A.; Tirado-Herrero, S.; Thomas, S.; Thema, J.; Mzavanadze, N.; Hauptstock, D.; Suerkemper, F.; Teubler, J.; Gupta, M.; et al. Measuring multiple impacts of low-carbon energy options in a green economy context. Appl. Energy 2016, 179, 1409–1426. [Google Scholar] [CrossRef]
- Igos, E.; Rugani, B.; Rege, S.; Benetto, E.; Drouet, L.; Zachary, D.S. Combination of equilibrium models and hybrid life cycle-input-output analysis to predict the environmental impacts of energy policy scenarios. Appl. Energy 2015, 145, 234–245. [Google Scholar] [CrossRef]
- Mirakyan, A.; De Guio, R. Integrated energy planning in cities and territories: A review of methods and tools. Renew. Sustain. Energy Rev. 2013, 22, 289–297. [Google Scholar] [CrossRef]
- Mattoni, B.; Gugliermetti, F.; Bisegna, F. A multilevel method to assess and design the renovation and integration of Smart Cities. Sustain. Cities Soc. 2015, 15, 105–119. [Google Scholar] [CrossRef]
- Arrizabalaga, E. Multi-criteria methodology for the prioritisation of alternative energy transition scenarios of cities. Ph.D. Thesis, University of the Basque Country, Bilbao, Spain, 2017. [Google Scholar]
- Ministerios de Industria, Energía y Turismo. Factores de Emisión de CO2 y Coeficientes de Paso a Energía Primaria de Diferentes Fuentes de Energía Final Consumidas en el Sector de Edificios en España; Ministerios de Industria, Energía y Turismo: Madrid, España, 2016. [Google Scholar]
- Danish Energy Agency; Energinet.dk. Generation of Electricity and District Heating, Energy Storage and Energy Carrier Generation and Conversion. In Technology Data for Energy Plants; Energinet.dk: Erritsø, Denmark, 2012. [Google Scholar]
- Ministry of Development of Spain. Report on Cost Optimal Calculations and Comparison with the Current and Future Energy Performance Requirements of Buildings in Spain; Version 1.0/Date 7 June 2013. Annex 2; Ministry of Development of Spain: Madrid, Spain, 2013. [Google Scholar]
- CYPE, Generador de Precios, España. CYPE Ingenieros. Available online: http://www.generadordeprecios.info/ (accessed on 20 April 2015).
- Oregi, X. Techno-economic evaluation of building energy refurbishment processes from a life cycle perspective. Ph.D. Thesis, University of the Basque Country, Donostia, Spain, 2015. [Google Scholar]
- Kratena, K. Un Modelo Input-Output para la Cuantificación del Impacto Macroeconómico (MIOCIM); Centre of Economic Scenario Analysis and Research (CESAR): Sevilla, Spain, 2015. [Google Scholar]
- Eustat. Input-Output Framework of the Basque Country. 2017. Available online: http://www.eustat.eus/estadisticas/tema_44/opt_0/ti_Marco_Input-Output/temas.html (accessed on 1 June 2016).
- IDAE. Calificación de la Eficiencia Energética de los Edificios; IDAE: Madrid, Spain, 2015. [Google Scholar]
- Saheb, Y. Energy Transition of the EU Building Stock; OpenEXP: Paris, France, 2016. [Google Scholar]
- European Commission Directorate-General for Energy; Directorate-General forClimate Action; Directorate-General for Mobility and Transport. Eu Energy, Transport and Ghg Emissions Trends to 2050 Reference Scenario 2013; European Union: City of Brussels, Belgium, 2013. [Google Scholar]
- European Commission Directorate-General for Energy in collaboration; Climate Action DG; Mobility and Transport DG. EU Energy Trends to 2030, UPDATE 2009; European Union: City of Brussels, Belgium, 2009. [Google Scholar]
- ETRI. Energy Technology Reference Indicator Projections for 2010–2050; Science and Policy Report by the Joint Research Centre of the European Commission; Joint Research Centre, 2014. [Google Scholar]
- DEAc. Danish Energy Agency Technology Data (Online). 2017. Available online: https://ens.dk/en (accessed on 13 May 2015).
Figure 1.
Shock of the energy transition scenario of Donostia 2017–2067.

Table 1.
Energy demand of the five districts by building typology, energy end use and fuel type.
| Energy Demand (GWh/Year) | |||||
| Heating | DHW | Cooling | Other Elec. | ||
| Residential use | 185.8 | 25.6 | - | 88.6 | |
| Office use | 5.1 | - | 6.4 | 13.5 | |
| Type of Energy (GWh/Year) | |||||
| NG | Electricity | Gas Oil | Biomass | Other LF | |
| Residential and office use | 215.2 | 148.5 | 33.3 | 2 | 2.1 |
Table 2.
Distribution of new heating systems that replace the existing systems of the districts evaluated (Percentages of energy demand).
Table 2.
Distribution of new heating systems that replace the existing systems of the districts evaluated (Percentages of energy demand).
| New Technology | Replaced NG Fired Boilers | Replaced Gas Oil Fired Boilers | Replaced Electric Systems | Replaced Other Fuels Systems | ||
|---|---|---|---|---|---|---|
| Individual | Central | Individual | Central | |||
| CHBB | 10% | 100% | - | 100% | - | - |
| HP | 90% | - | 100% | - | 100% | 100% |
Table 3.
Cumulative life cycle impact assessment results of the scenario for the city of Donostia-San Sebastián, during the 50 years of the transition period.
Table 3.
Cumulative life cycle impact assessment results of the scenario for the city of Donostia-San Sebastián, during the 50 years of the transition period.
| CNPV | CNPC | DPP | CGWPR | CNRPER | |
|---|---|---|---|---|---|
| (M€) | (M€) | (Years) | (TnCO2eq) | (MWh) | |
| Scenario | −12.2 | 338.4 | More than 50 | 1.4 × 10⁶ | 7.1 × 10⁶ |
Table 4.
Macroeconomic impact assessment results of the scenario for the city of Donostia.
| Regional GDP | Regional Production | |||
|---|---|---|---|---|
| (M€) | (Multiplier) | (M€) | (Multiplier) | |
| Scenario | 72.2 | 0.82 | 146.2 | 1.65 |
Publisher’s Note: MDPI stays neutral with regard to jurisdictional claims in published maps and institutional affiliations. |
© 2018 by the authors. Licensee MDPI, Basel, Switzerland. This article is an open access article distributed under the terms and conditions of the Creative Commons Attribution (CC BY) license (https://creativecommons.org/licenses/by/4.0/).
Share and Cite
MDPI and ACS Style
Arrizabalaga, E.; Hernandez, P.; Portillo-Valdés, L.d. Long Term Energy Transition Scenario Analysis for the City of Donostia. Proceedings 2017, 1, 644. https://doi.org/10.3390/proceedings1070644
AMA Style
Arrizabalaga E, Hernandez P, Portillo-Valdés Ld. Long Term Energy Transition Scenario Analysis for the City of Donostia. Proceedings. 2017; 1(7):644. https://doi.org/10.3390/proceedings1070644
Chicago/Turabian StyleArrizabalaga, Eneko, Patxi Hernandez, and Luis del Portillo-Valdés. 2017. "Long Term Energy Transition Scenario Analysis for the City of Donostia" Proceedings 1, no. 7: 644. https://doi.org/10.3390/proceedings1070644