Close Range Photogrammetry and Thermal Imagery in Monitoring of Soil Moisture in Dam Structures of Historical Fishponds †


Department of Landscape Water Conservation, CTU in Prague, Faculty of Civil Engineering, Thákurova 7, 166 29, Prague, Czech Republic
*
Author to whom correspondence should be addressed.
†
Presented at the 3rd EWaS International Conference on “Insights on the Water-Energy-Food Nexus”, Lefkada Island, Greece, 27–30 June 2018.
Proceedings 2018, 2(11), 623; https://doi.org/10.3390/proceedings2110623
Published: 9 August 2018
(This article belongs to the Proceedings of EWaS3 2018)
Abstract
:Degradation of reservoir dams can lead to water percolation through dam structure. Here, close-range photogrammetry and UAV (Unmanned Aerial Vehicle) thermal imagery can be used to monitor differences in dam moisture. The article presents a study of the dam of Podvinak Fishpond (Czech Republic). The TDR (Time Domain Reflectometry) data (soil moisture), the Theta probe data (soil moisture), and the temperature data of the dam top profile and the grassed area below the dam were compared. Analysis focused on the comparison between sampled data, and UAV data obtained by Optris TIM 450 (Portsmouth, USA) and Flir Tau2 336 (Wilsonville, USA) IR cameras. Based on the study, the spectral resolution, the accuracy of the results, and the reliability of both UAV monitoring systems is similar.
1. Introduction
Close range photogrammetry in different spectral resolutions can be used for complex monitoring of soil surface and related degradation processes [1]. At CTU in Prague soil erosion and soil conditions in different surfaces have been monitored for model verification purposes [2,3]. Photogrammetry was initially used to monitor erosion rills and ephemeral gullies, but only to compute their spatial extent [4]. Then, the method for monitoring surface roughness was developed [5]. Nowadays, in agricultural fields, we can successfully acquire digital surface models (DSM) with sub-millimeter resolution for detailed studies (up to 100 m2 of monitored areas) and with sub-centimeter resolution for a field study, in the case we want to compute the rill volumes [6]. Non-contact methods, such as photogrammetry and laser scanning, are currently the best methods for obtaining precise detailed digital surface models.
The Python, tool developed by the team of CTU, takes advantage of DSMs created using these methods for calculating the volume of erosion rills and other erosion objects. The calculations within the tool are fully automatic, apart from the creation of one of the inputs—the rill edge polygon. This step is closely linked to the accuracy of rill edge detection.
An important question for future research is to find how to detect rill edge polygons automatically. One option is to use edge detecting filters over orthophoto that is a side product of the DSM production, another is to use a hillshade tool for DSM processing, and then the edge detection. Still, by using these methods we can—relatively accurately—automatically detect terrain edges. Assigning these to rills is a second step, since in complex systems the rill networks are crossing each other, and the edges do not always match to a particular rill. We get a linear structure of rill boundaries, but the areas inside and outside the rills must be addressed as well. Here, thermal imagery is a promising technology, since in the majority of cases during the daytime when the temperature of the field is rising, we can assume that the shaded and more water-saturated rill bottom stays a longer time colder than its surroundings.
The methods we are testing in agricultural fields and on arable land can also be applied to the fishpond dams. Project No. DG16P02M036 focuses on “Conservation, reparations and monitoring of historical pond dams as our cultural heritage”. One of the related risks is water percolation through dam structure [7] which can cause even the dam breach [8]. Here, UAV thermal imagery can be used to monitor differences in dam moisture over toe drain. The aim of the study consists in the verification of the methodology for non-invasive diagnostics of dams of historical ponds. Another part of the fishponds’ rehabilitation is the sediment volume assessment, where UAV photogrammetry can also assist. UAV is also very helpful in the definition of actual dam shapes for historical structures, where no project documentation exists. The methodology includes recommendation for its practical application and for the evaluation and interpretation of the measured data.
2. Materials and Methods
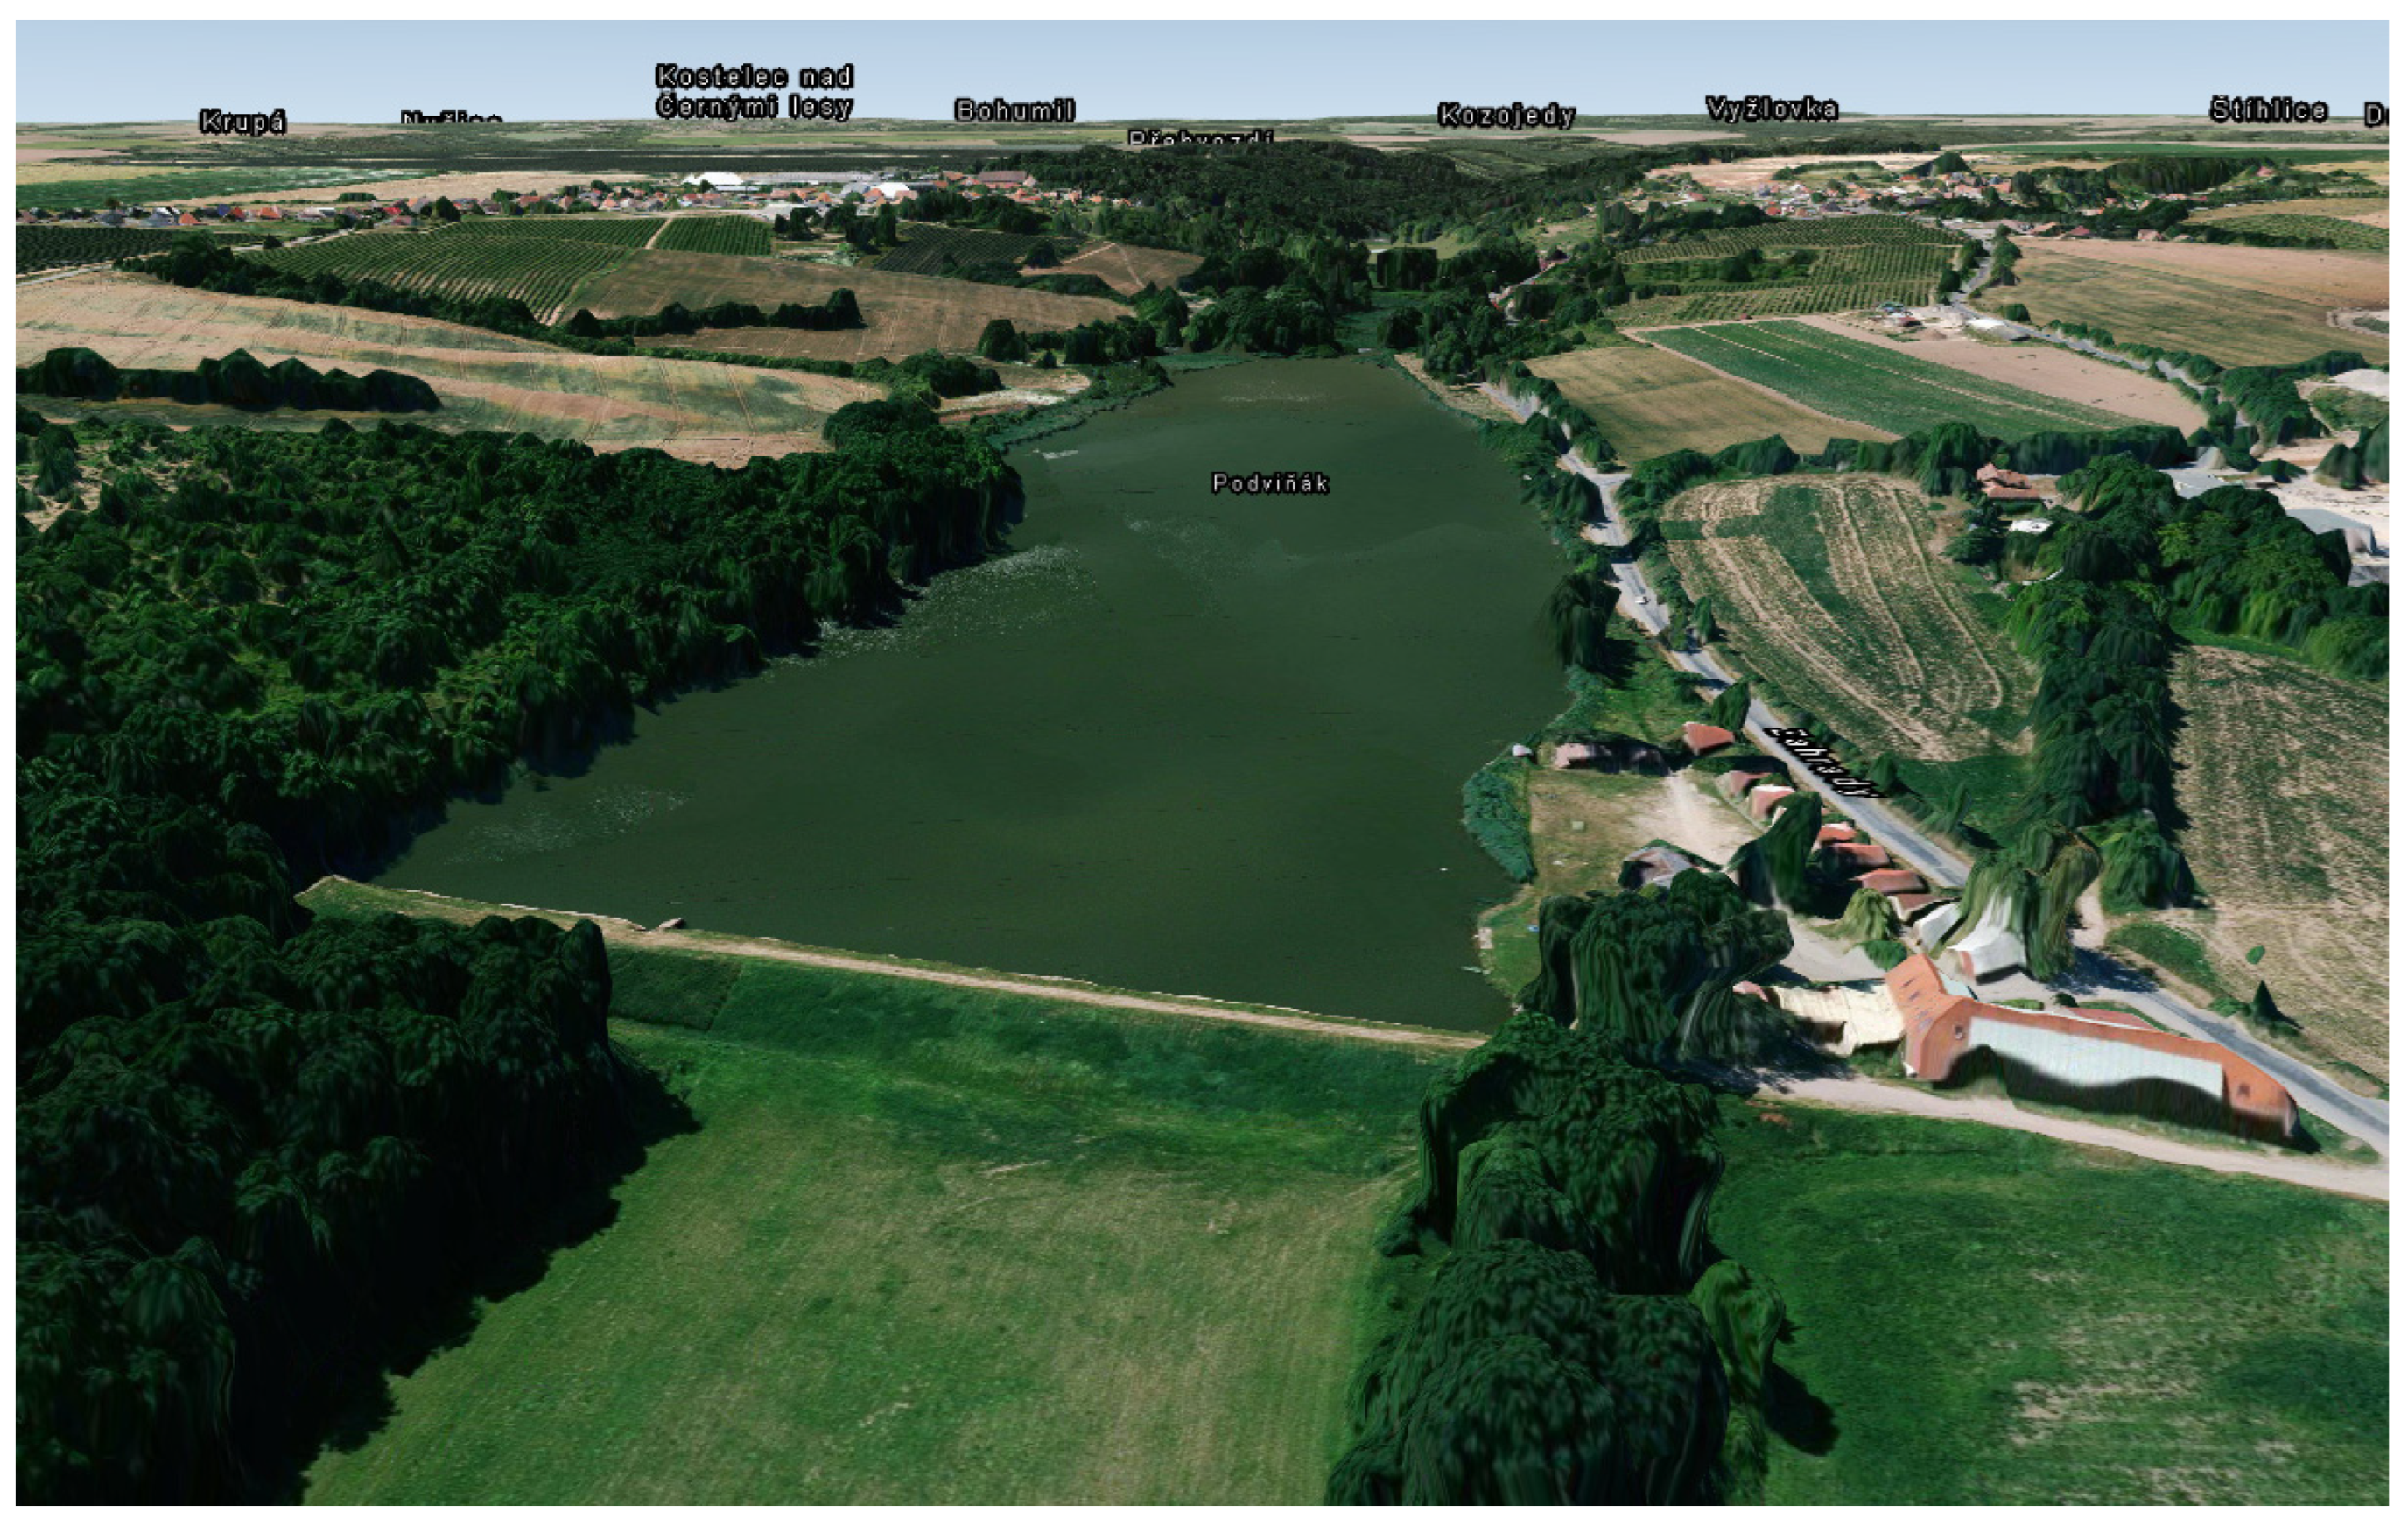
In this study, the dam of the Podvinak fishpond was selected to demonstrate the data acquisition and evaluation. The Podvinak Fishpond is located in central Bohemia, 30 km east from the capital city of Prague (Figure 1), GPS location: 50.06° N, 14.85° E.
The photogrammetric data are obtained by two UAV systems and other equipment. The visible RGB data are photographed by DJI Phantom 4 (camera model FC330, 12MPix resolution). The infrared (thermal) data are obtained by Flir Tau2 336 13 mm radiometric at Phantom 4. Second tested thermal set is a Tarot X hex-copter equipped with Optris Micro-Epsilon TIM 450, that is having better spatial resolution, and with wider lens angle it can be operated from lower elevations. Both UAV were used in the same time together with moisture probe monitoring and using the same ground positioning (GSP) for data georeferencing, to be able to compare all datasets.
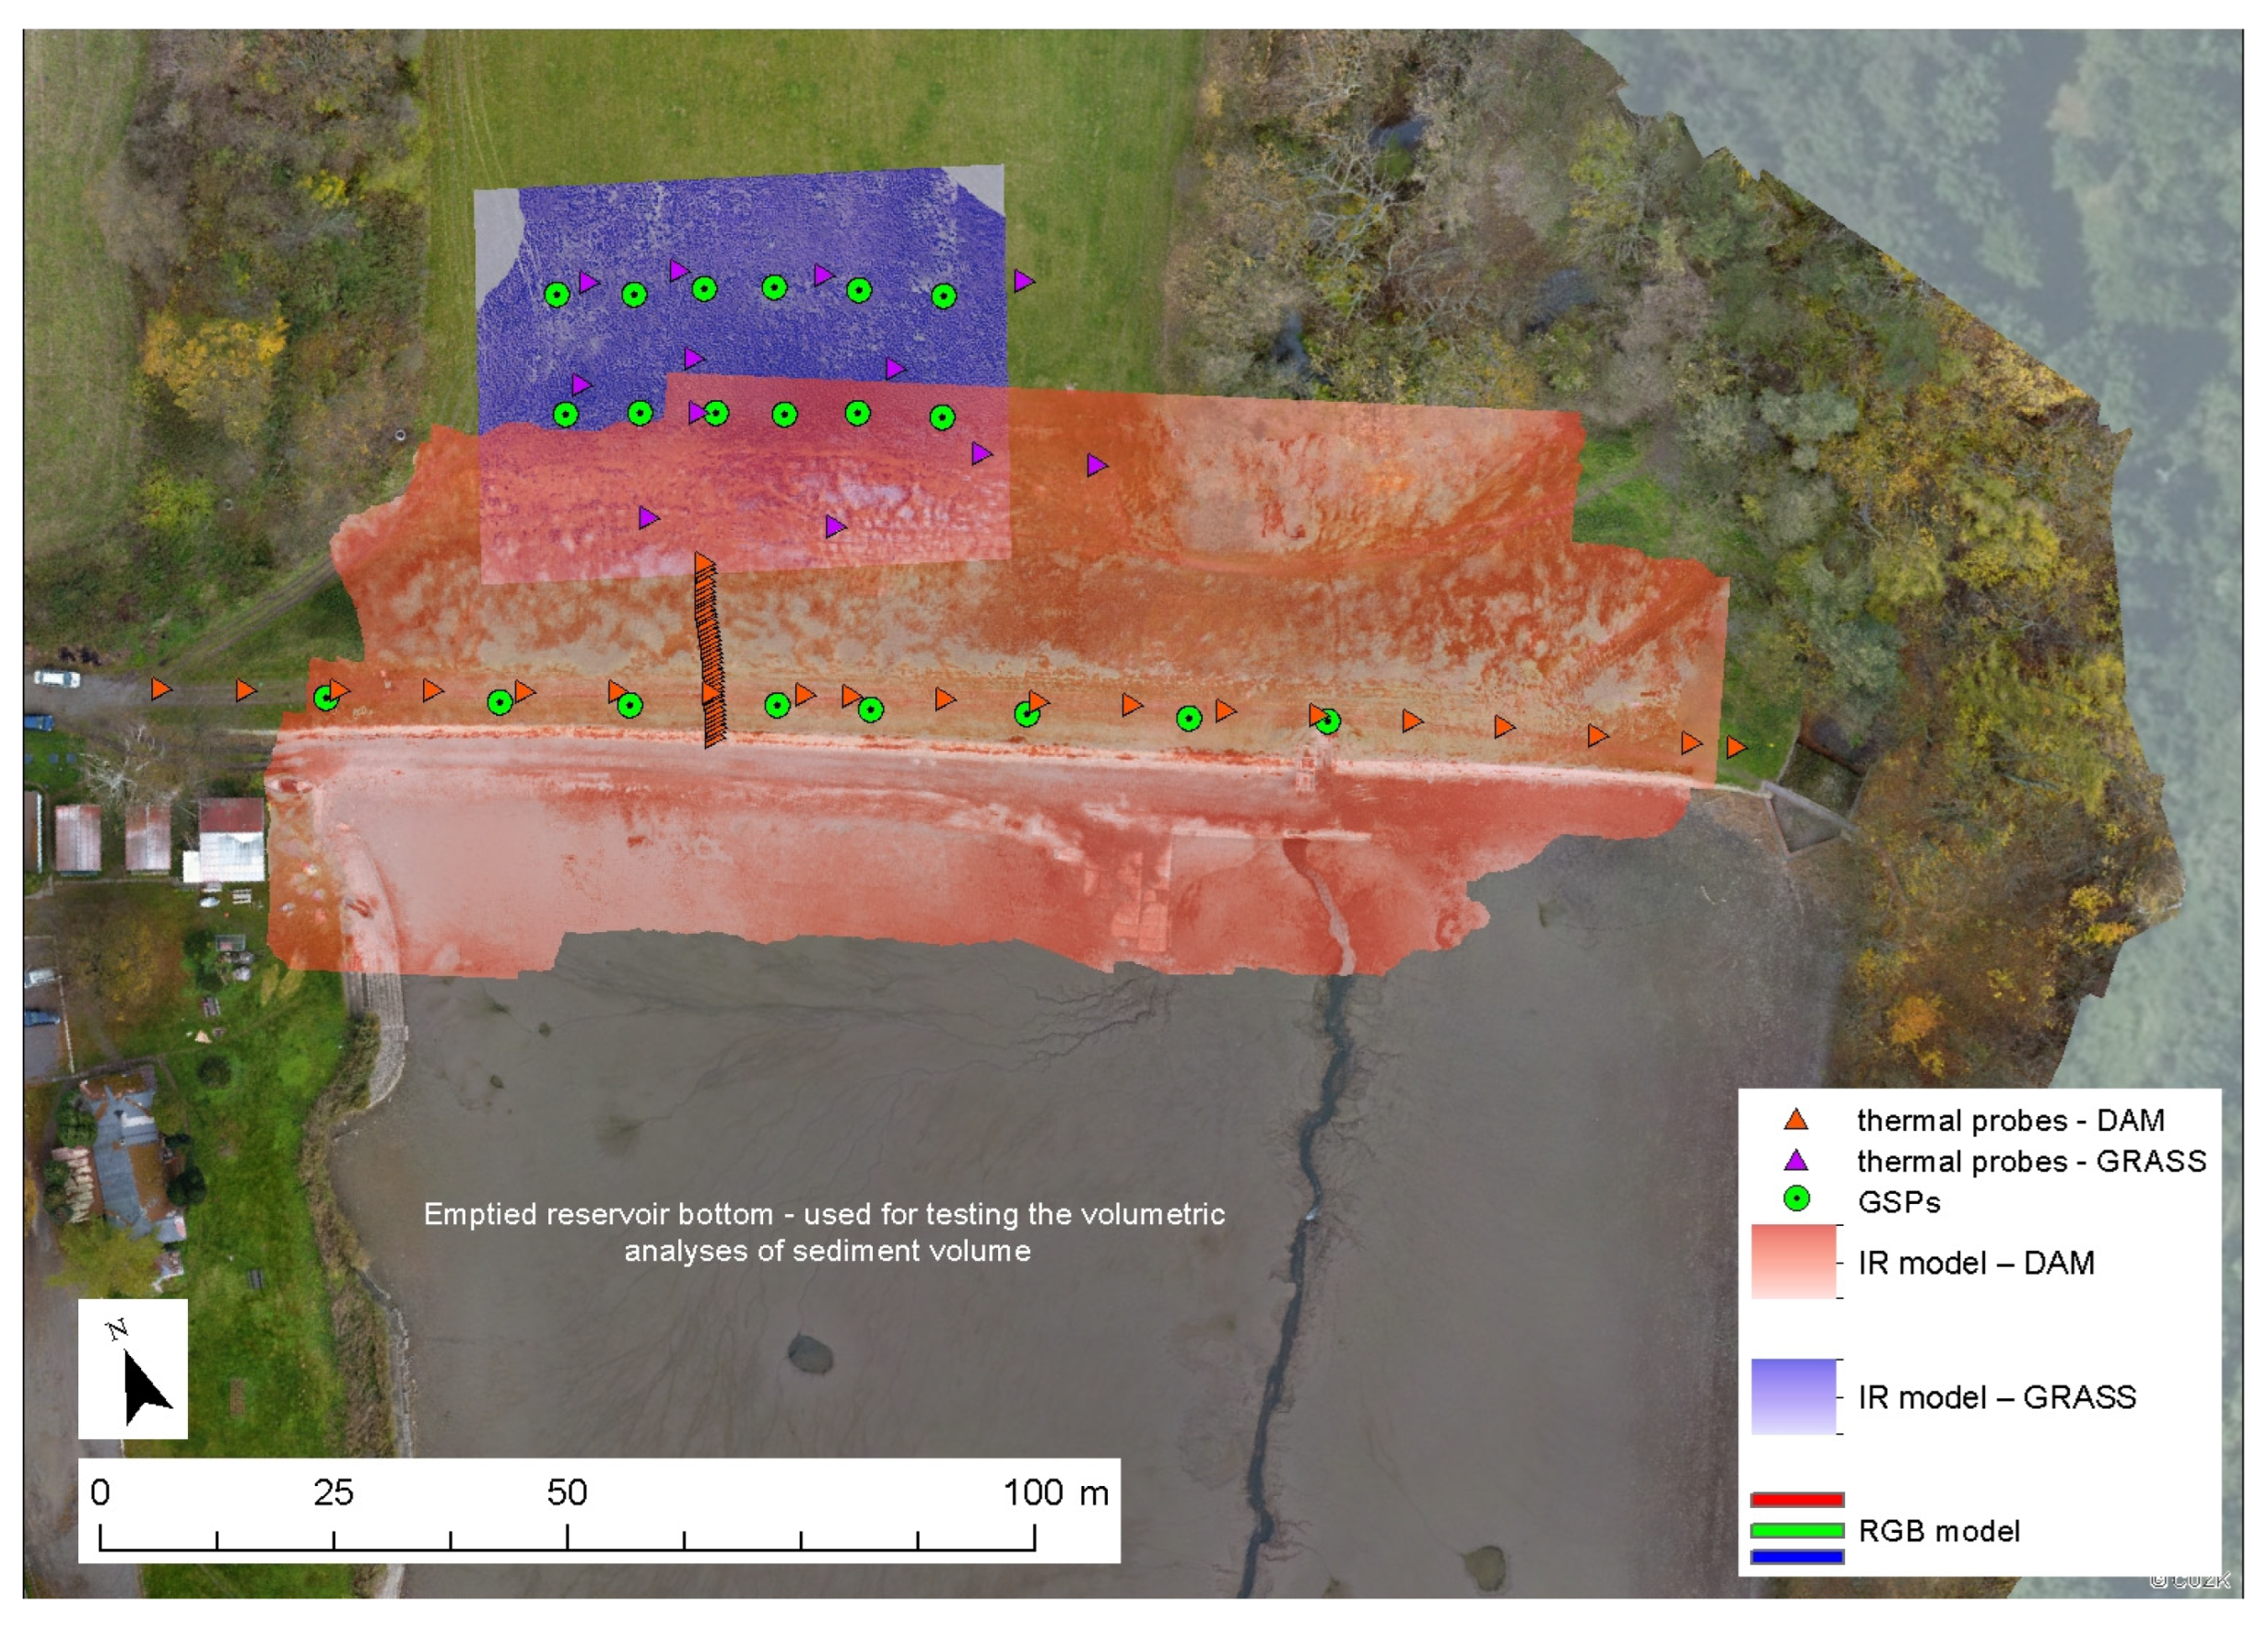
As mentioned in the introduction, the first part of the method has already been successfully tested in assessing the surface volumes (dam volume, sediment volume, actual shapes of surface structure, rills, potential damages and irregularities, etc.). For the 3D photogrammetric projects, Photomodeller Scanner and Agisoft Photoscan have been used [9]. In landscape studies, where monitored surfaces are composed of hundreds of images, with partial overlap, the Surface from Motion (SfM) method as implemented by Agisoft Photoscan is more convenient. Also, as proved by the diploma study of Streda [10], Agisoft can more easily handle data from several sources with rather high differences in spectral and spatial resolution and merge them into a seamless product (either by putting all data into one chunk, or by merging the chunks based on GSP targets). The tested area was referenced by 12 targets below the dam (cut-grass tests) and by 8 targets at the dam top. All GSPs were positioned via RTK GNSS with 1.5 cm standard deviation positioning error. Generally, fitting the RGB data to GSPs was simple task but for thermal imagery the low spatial resolution of the data (ca 10 cm/pix) lowered the accuracy of the projection.
General description of the data and Agisoft processing outputs are provided in Table 1.
Concerning spatial resolution, the aim of the study was not to focus on high detail of monitored surfaces, but rather to search for potential evidences of moisture irregularities in the two monitored areas. Initial testing showed, that from IR monitoring it is possible to obtain the data with 1 cm resolution, but it is a time-consuming task to monitor the whole structure of the dam with such a precision and process all the data. Therefore, 10 cm resolution was selected as a reasonable compromise between data availability and output detail. The entire experiment setup and dam parameters are presented in Figure 2.
Another measured data was the actual temperature and moisture of the monitored surface via Theta probes and TDR probes. Three locations were monitored—two perpendicular profiles at the DAM (15 × 39 measured points) and the GRASS area (12 measured points). The probe measurement was done with 5 replications in 0.5 m by 0.5 m squares for each variable. All the data were imported into ArcGIS to perform interpolations, spatial analyses, and data comparisons.
3. Results
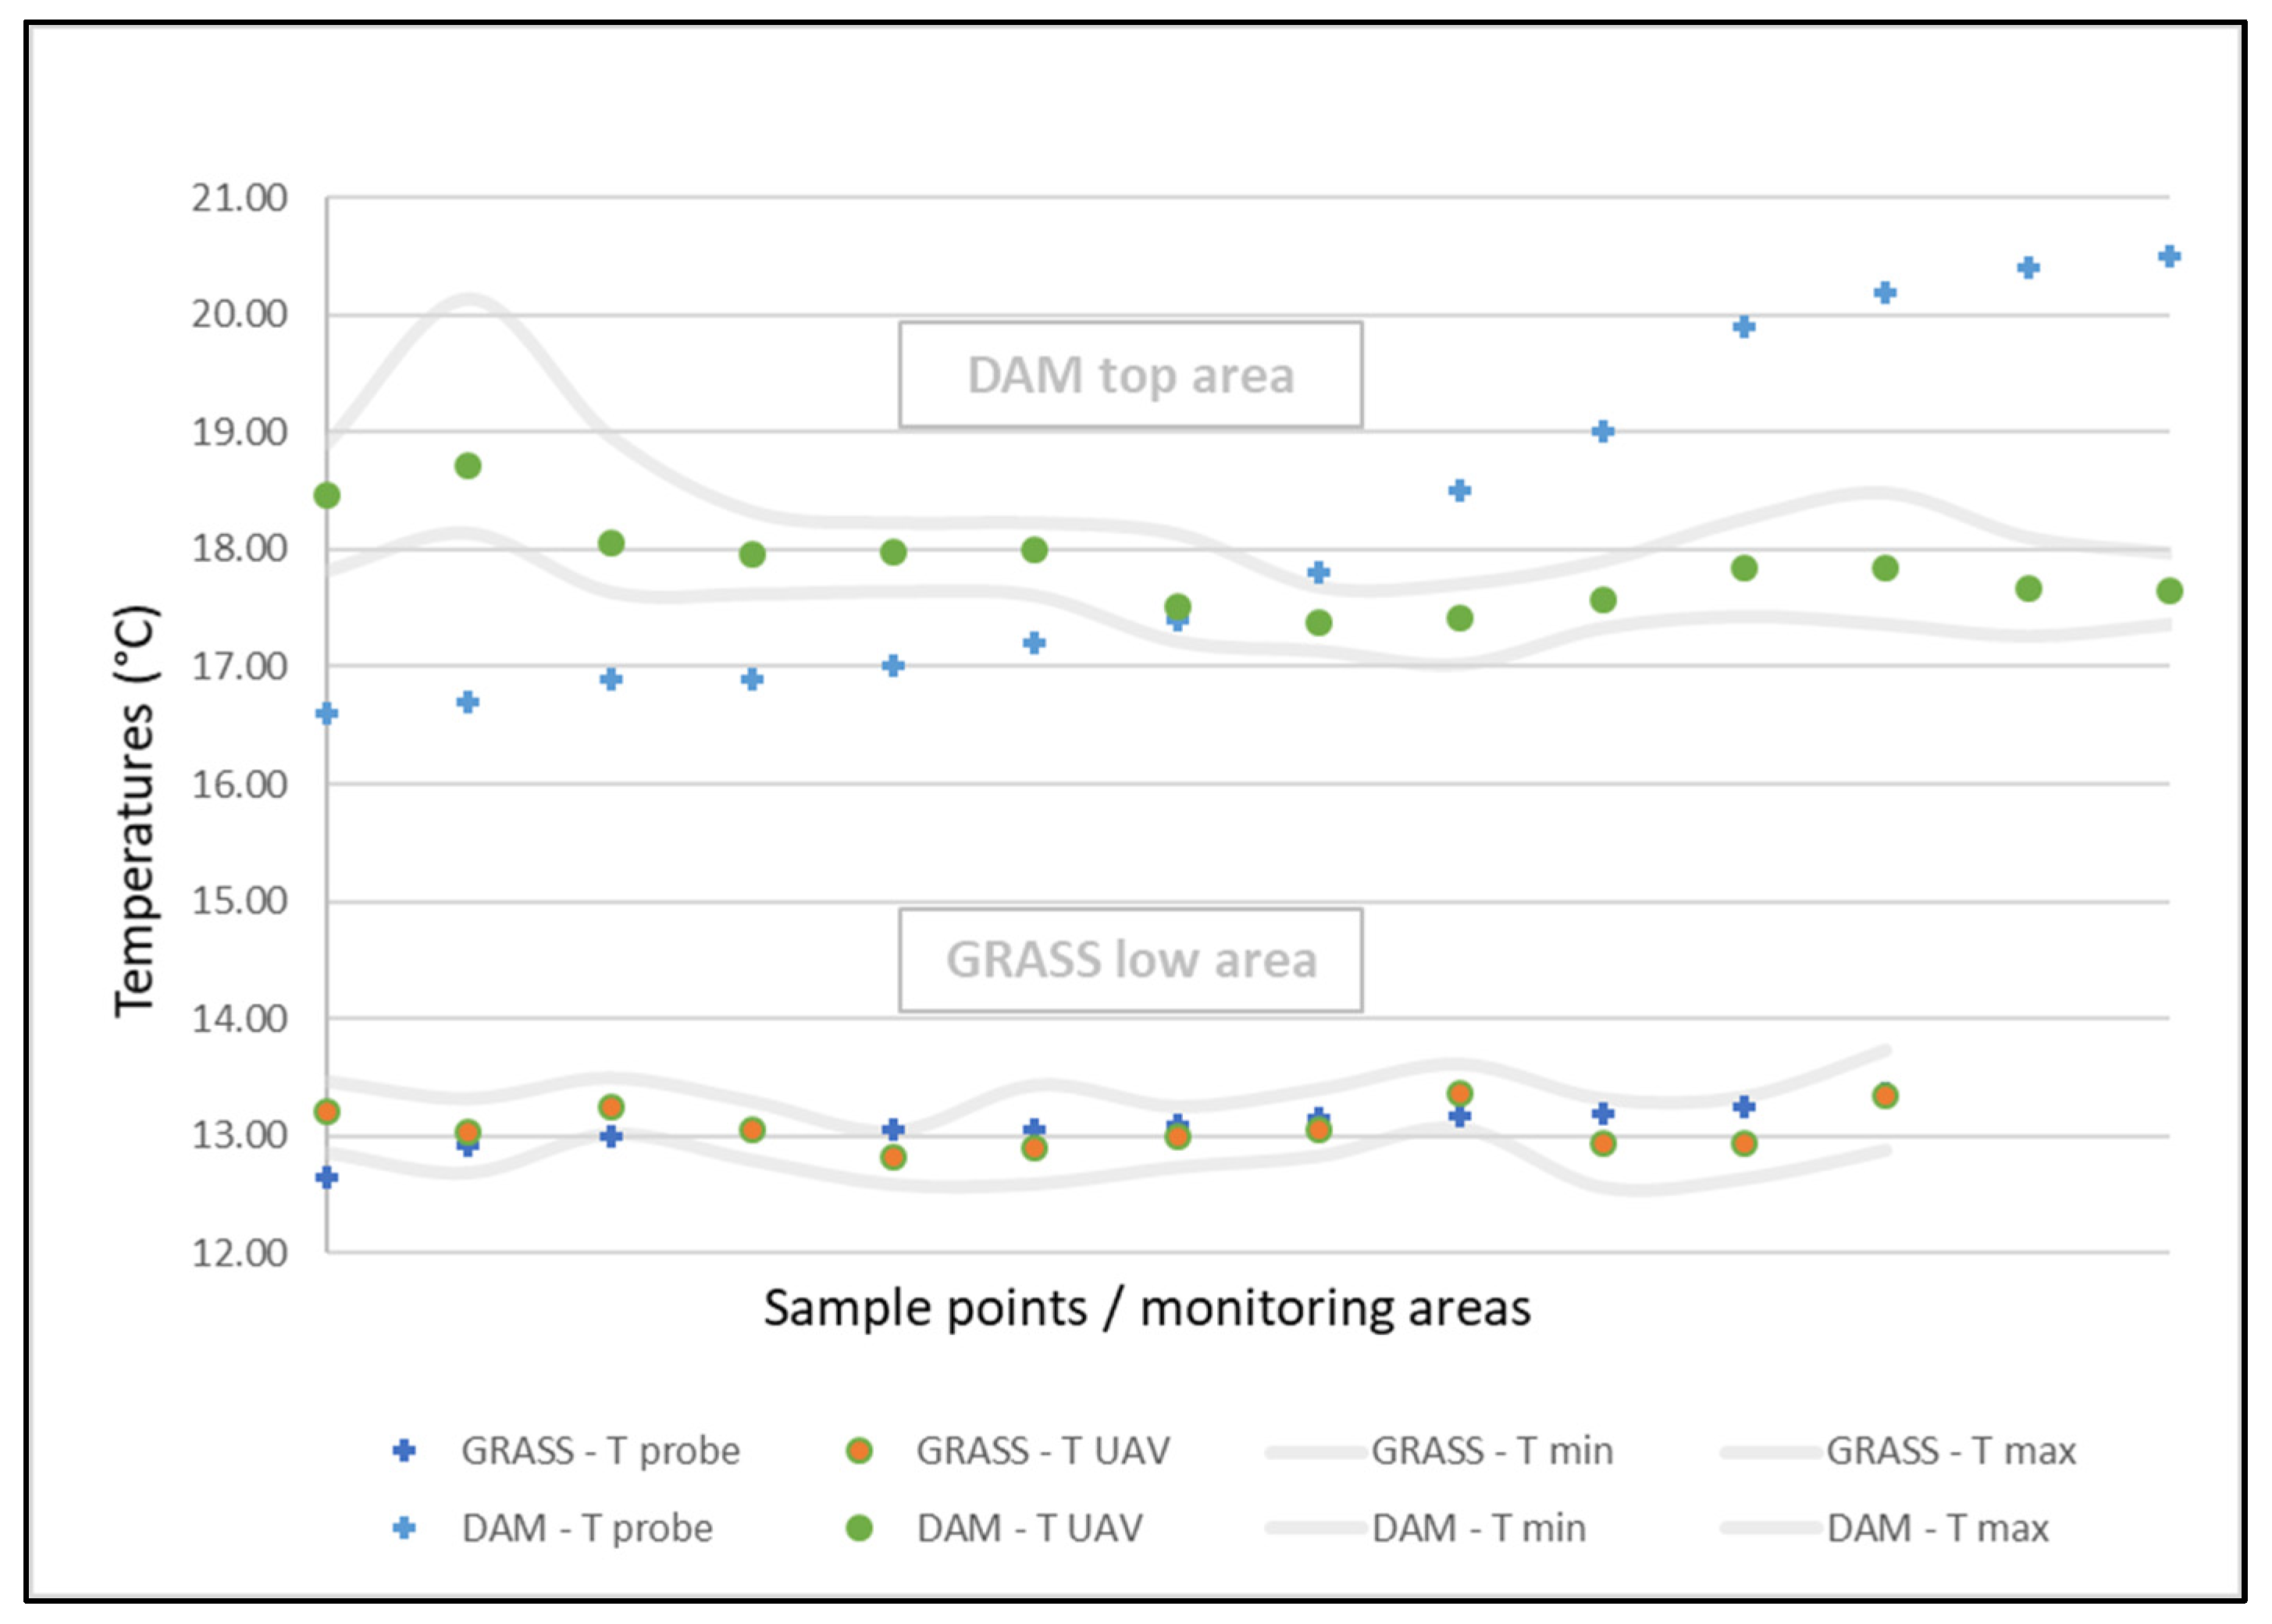
The TDR data (soil moisture), the Theta data (soil moisture), and the temperature data of the DAM profile 1, along with the GRASS data were plotted together. To compare with UAV measured temperatures, instead of local values—that have high spatial variability and not exact spatial positioning as mentioned above—the average temperatures in 1 m buffer zones corresponding to probe positions were used (Figure 3). For thermal imagery one always must avoid sun-lit surfaces. Despite focusing on UAV monitoring during a dusk time, and with no direct sun light over the area, the original non-calibrated UAV IR signal differed to probe-measured temperatures on average by more than 3 °C in the GRASS area (Optris TIM 450 data), and even for more than 6 °C in the DAM area (Flir Tau2 336 data). The problem of the DAM area was that temperature dropped down during the probe measurement, while the UAV survey was performed quickly when the temperature was already consolidated during a sunset time. For comparing the relative differences, the UAV average temperatures in the zones were first corrected (normalized) as per the average temperature of the probe data from GRASS and DAM, respectively. Final temperature comparison of all datasets is presented in Figure 4.
The measured and monitored temperatures of the GRASS area relate relatively well. The grass in the area was low cut, with minimal color differences influencing the UAV monitoring, but also with low temperature variability (only 0.8 °C for probe data). The pixel-based analysis of UAV data showed range of temperatures in 1 m perimeter zones (grey lines in Figure 4). There we can see higher variability of pixel data, pointing to outliers in the images and warmer local grass sods. Much lower is the correspondence of the Probe data and UAV data for the DAM top. The problem here is with temperature dropping down significantly during sample taking just around the dusk time. The 5 sample replications in each area were time consuming and as the DAM top was dry and non-vegetated, the top-soil temperature was dropping down during profile measurement (total temperature change being about 4 °C shows the necessity to carefully control experiment conditions in every campaign of similar purpose). The UAV survey was made much faster. Therefore the DAM top temperature as monitored by UAV varies only in the range of 1.3 °C. Looking at variability on a pixel-basis we can see maximal difference of 3 °C in the monitored 1 m perimeter zones (grey lines in Figure 4).
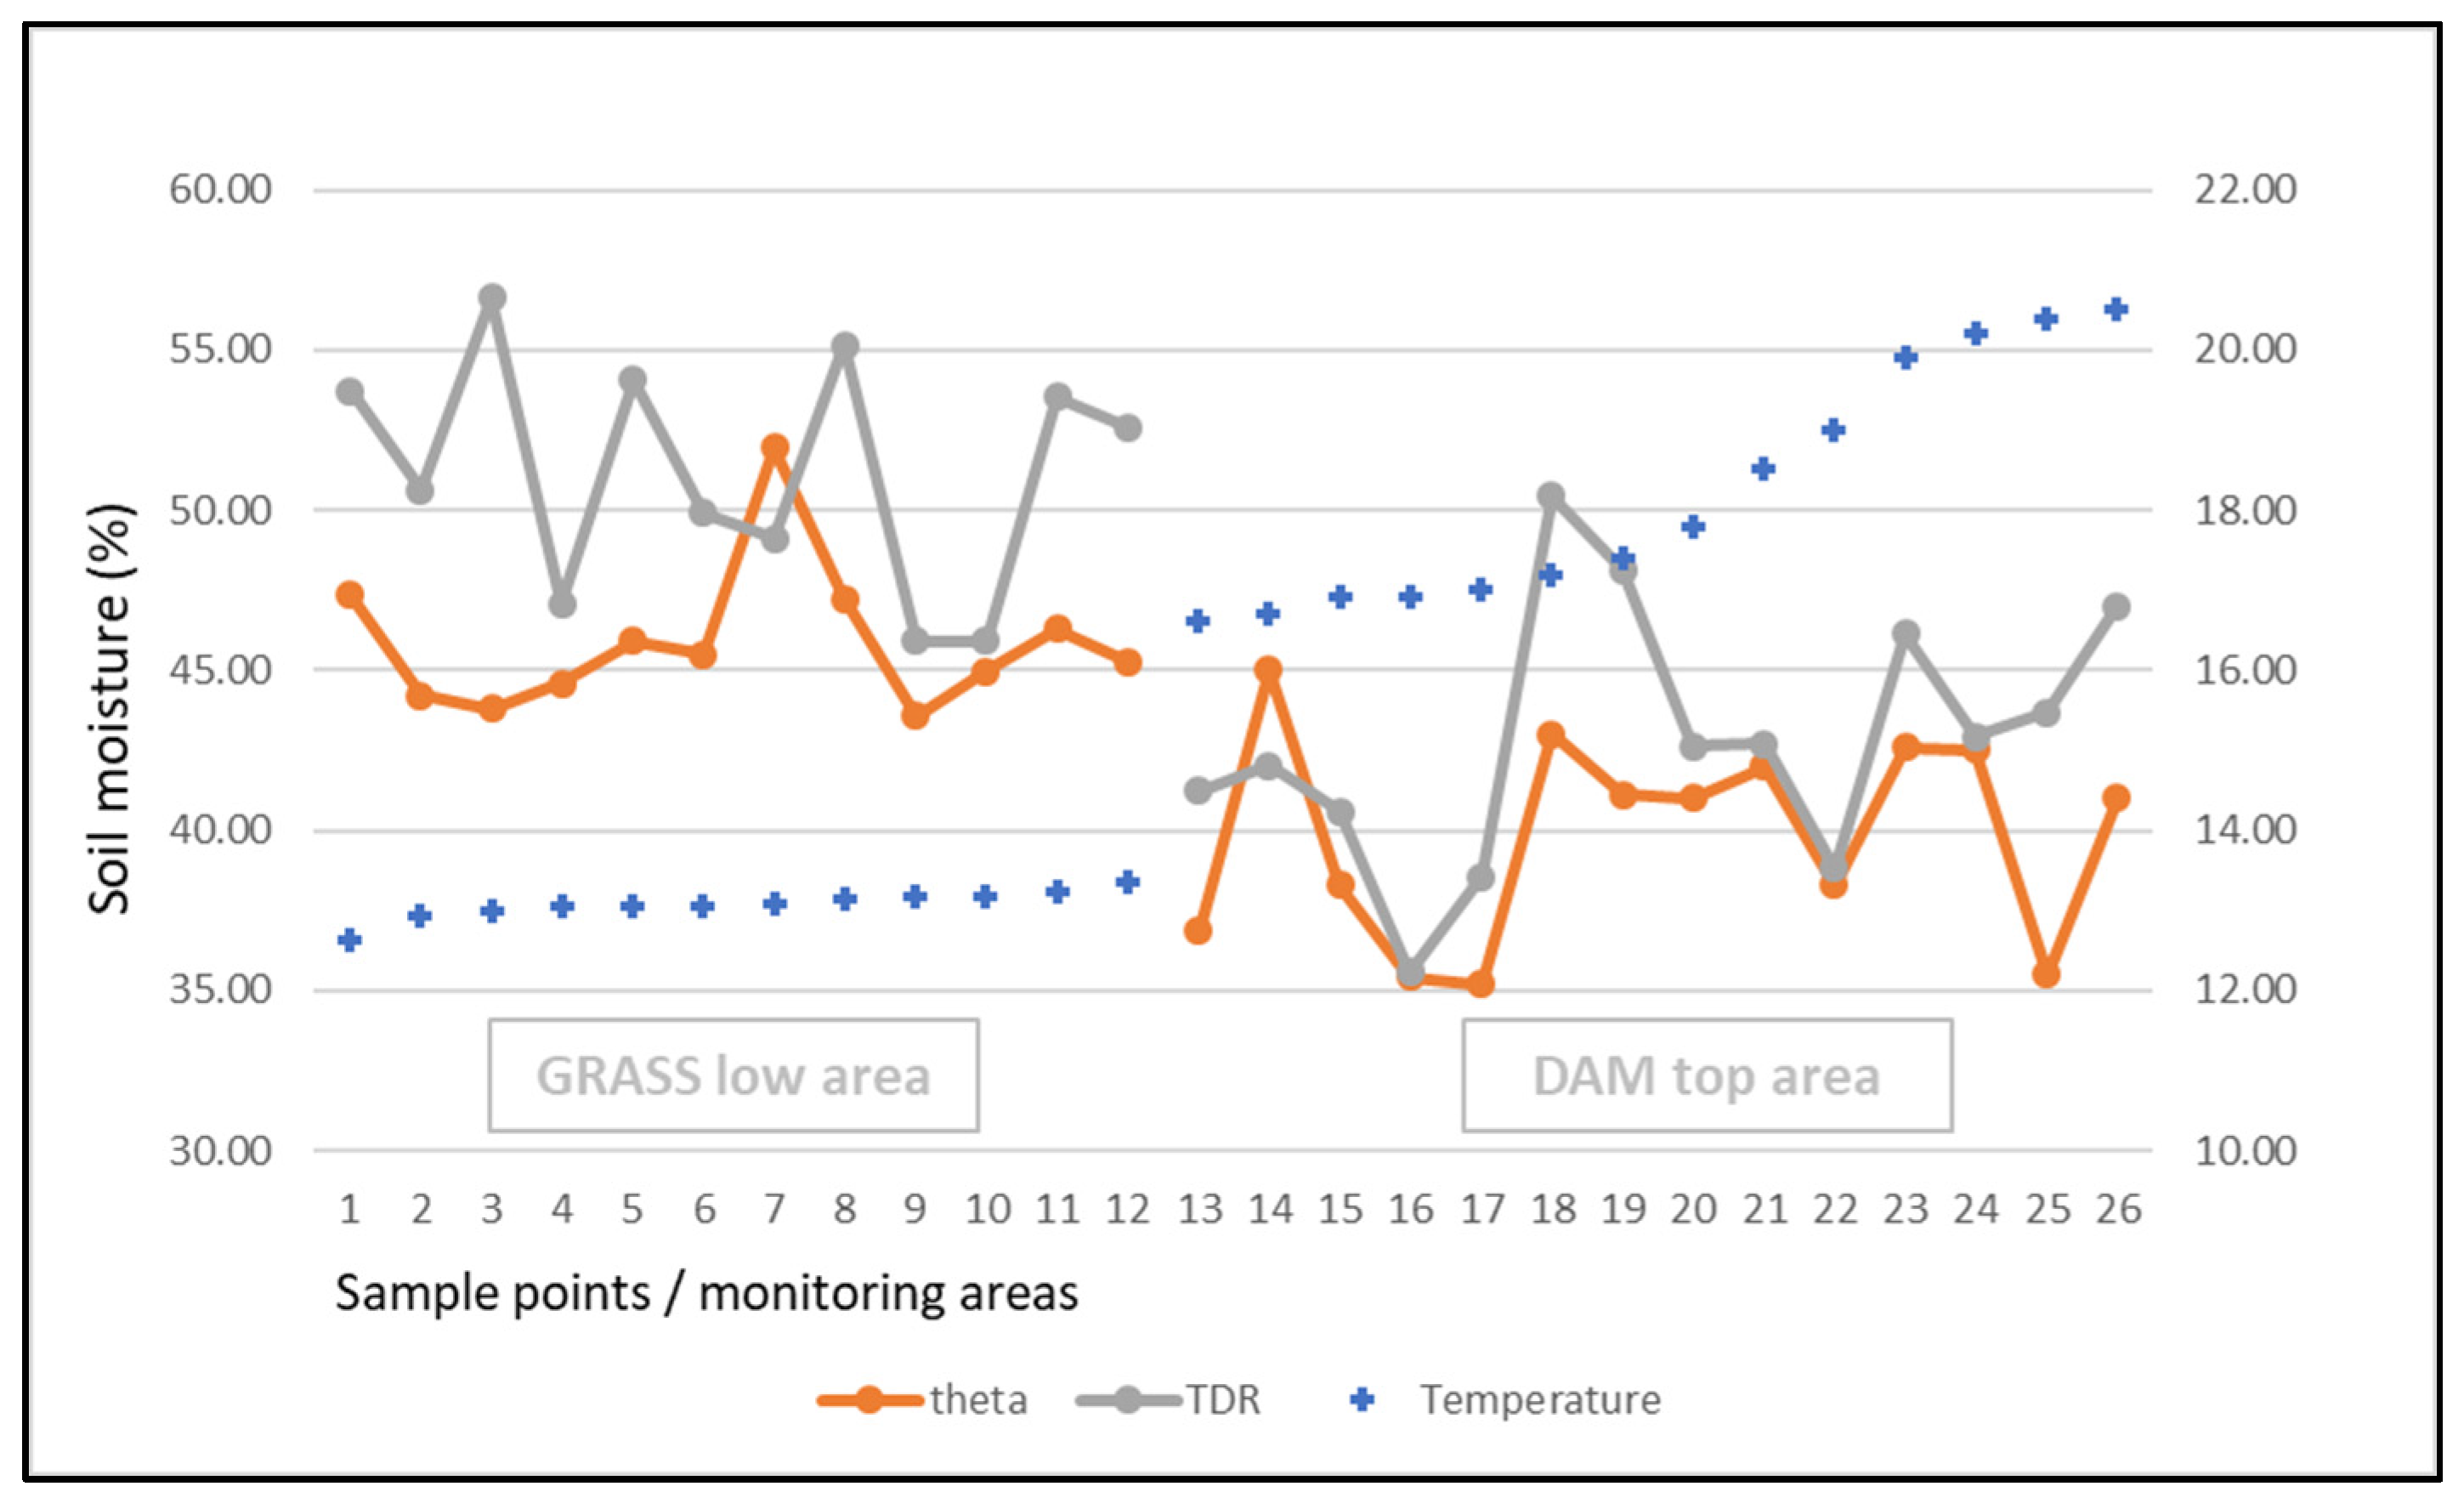
The TDR data (soil moisture), the Theta data (soil moisture), and the temperature data are presented as averages of 5 replications in each monitored sample area (0.5 m × 0.5 m).
The results show rather high differences between the two moisture monitoring systems, but the general trend is followed by both devices. The moisture is also related to surface temperature as supposed, we can see the variability difference between the average temperature of the DAM top and the GRASS area. The trend is opposite to the water content; the dryer surface is generally warmer (Figure 5).
4. Discussion and Conclusions
The TDR data (soil moisture), the Theta data (soil moisture), and the temperature data of the DAM top profile and the GRASS area below the dam were compared. Analysis focused on comparison between sampled data, and UAV data obtained by Optris TIM 450 and Flir Tau2 336 IR cameras. The spectral resolution, the accuracy of the results, and the reliability of both UAV monitoring systems is similar. The advantages of the Flir camera, over the heavier and less easy to handle Tarot X UAV, are the easier operability of the Phantom 4 UAV, and longer flight duration. Using the 13 mm focal lens means much lower angle of view (FOV) of the Flir system (25°) compare to the wide angle (ca 90°) of the Optris camera. That can be both advantage and disadvantage of the Flir system. The advantage of the narrow FOV is lower signal dropdown to the corners of the IR image (lens vignetting). That allowed easier orthophoto composition with less signal variability within the monitored scene. On the other hand, to cover a reasonable area with corresponding GSD (ca 10 cm) the flight altitude has to be almost 4 times higher (Table 1) and for larger areas it would easily rise over 100 m or more. This can cause the problems with atmospheric corrections, and it also leads to higher UAV accident risk. Additionally, wind effect rises, and narrow FOV needs much faster shutter speed to obtain sharp imagery. All these effects count for using wide-angle systems for terrain surveys (compare to typical technical surveys of structures). To conclude, our study showed full comparability of the systems for fishpond dam monitoring in temperatures above 0 °C.
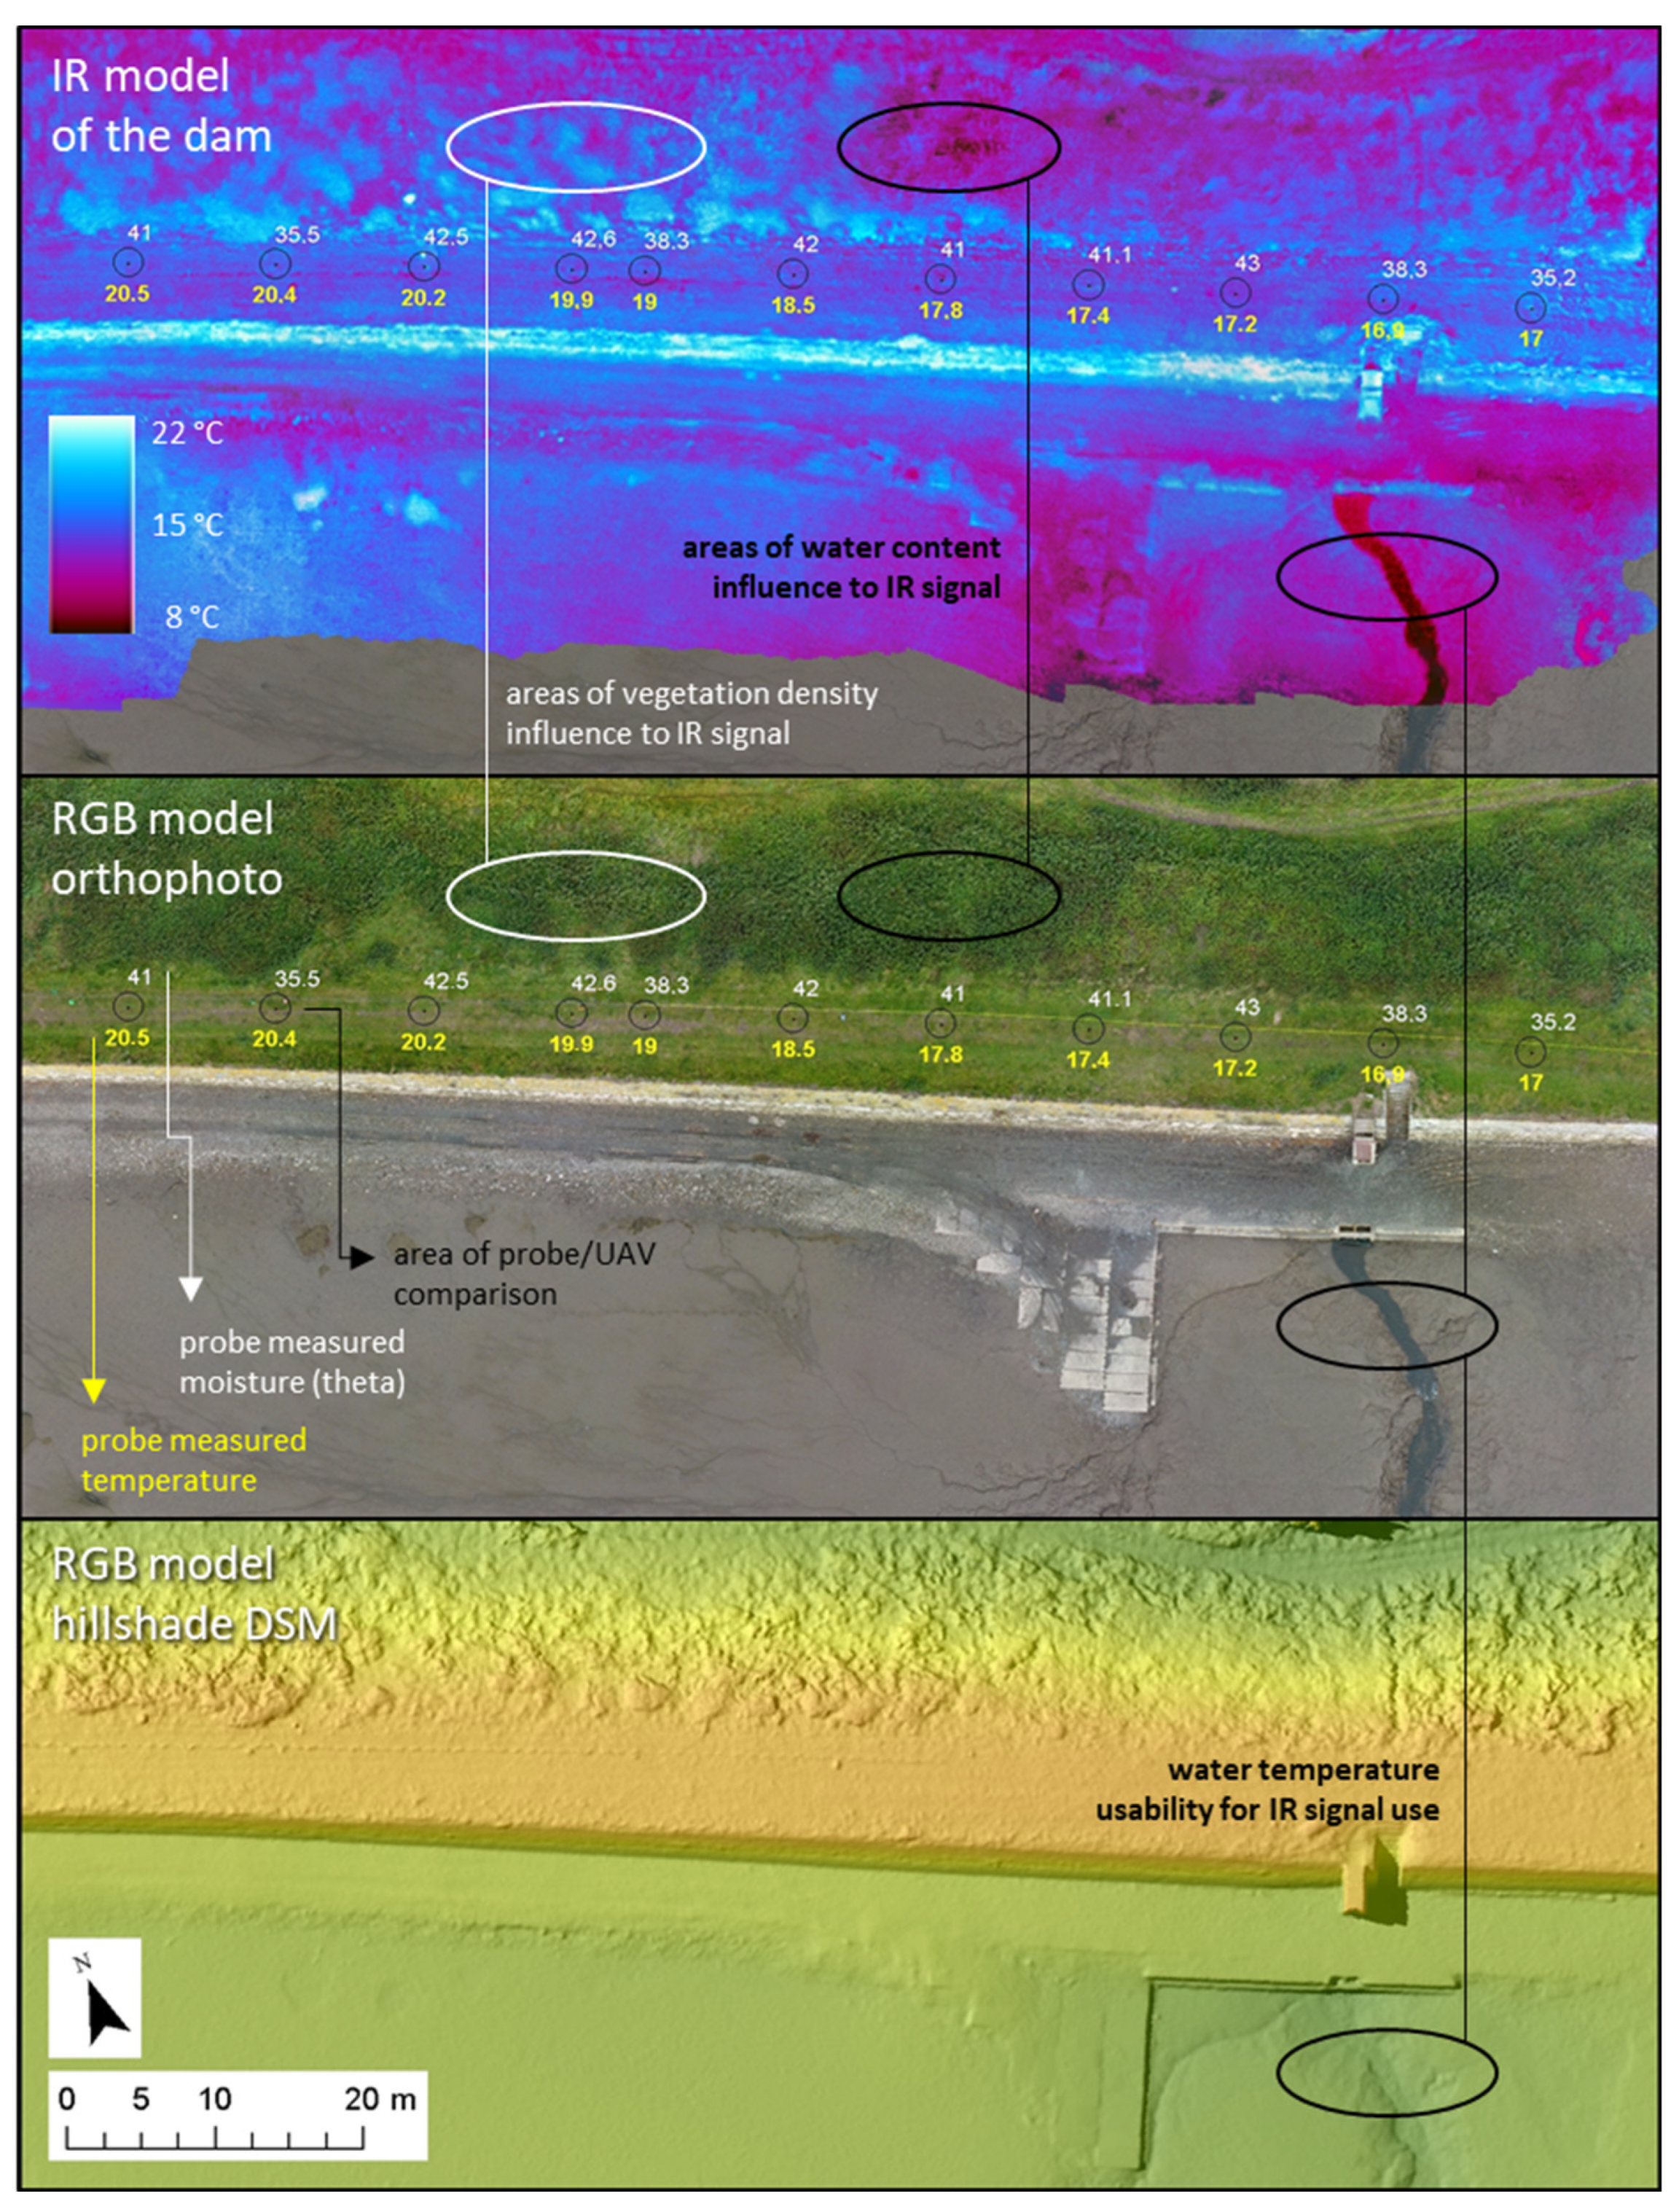
The presented method used for comparing monitored and measured temperatures showed, that UAV monitoring can provide reliable data, for comparing temperatures and soil water content, but the researcher must take care for the vegetation influences. Since the fishpond dams are rarely bare-soil or low vegetation surfaces, the climate conditions have to be carefully chosen (no sun activity) and low vegetation status (ideally non-vegetative season) should be preferred. Figure 3 shows drawbacks and potentials of Unmanned Aerial Systems and infrared imagery in soil moisture monitoring on fishponds. The highly saturated surfaces such as original streamline, are easily detectable, and could be even automatically classified. The higher green and dense vegetation on the dam surface can hide many effects of water percolation, especially when temperature is changing after a relatively warm day. Usually, a set of RGB, DSM and IR data can help to identify individual effects of different factors and enhance a chance to reliably define water saturated areas of the dam structures.
Acknowledgments
The research is supported by project No. DG16P02M036 (Conservation and preservation of dams of historical ponds which are an important part of our cultural-technical heritage).
Conflicts of Interest
The authors declare no conflict of interest.
References
- Heng, P.C.B.; Chandler, J.H.; Armstrong, A. Applying close range digital photogrammetry in soil erosion studies. Photogramm. Rec. 2010, 25, 240–265. [Google Scholar] [CrossRef]
- Krasa, J.; Dostal, T.; Vrana, K.; Plocek, J. Predicting spatial patterns of sediment delivery and impacts of land -use scenarios on sediment transport in Czech catchments. Land Degrad. Dev. 2009, 21, 367–375. [Google Scholar] [CrossRef]
- Jeřábek, J.; Zumr, T.; Dostál, T. Identifying the plough pan position on cultivated soils by measurements of electrical resistivity and penetration resistance. Soil Tillage Res. 2017, 174, 231–240. [Google Scholar] [CrossRef]
- Báčová, M.; Krása, J. Application of historical and recent aerial imagery in monitoring water erosion occurrences in Czech highlands. Soil Water Res. 2016, 11, 267–276. [Google Scholar] [CrossRef]
- Bauer, T.; Strauss, P.; Grims, M.; Kamptner, E.; Mansberger, R.; Spiegel, H. Long-term agricultural management effects on surface roughness and consolidation of soils. Soil Tillage Res. 2015, 151, 28–38. [Google Scholar] [CrossRef]
- Báčová, M.; Krása, J.; Devátý, J.; Kavka, P. A GIS method for volumetric assessments of erosion rills from digital surface models A GIS algorithm for volumetric assessments of erosion rills from digital surface models. Eur. J. Remote Sens. 2018. in review. [Google Scholar]
- Zumr, D.; Císlerová, M. Soil moisture dynamics in levees during flood events—Variably saturated approach. J. Hydrol. Hydromech. 2010, 58, 64–72. [Google Scholar] [CrossRef]
- Evans, J.E.; Mackey, S.D.; Gottgens, J.F.; Gill, W.M. Lessons from a dam failure. Ohio J. Sci. 2010, 100, 121–131. [Google Scholar]
- David, V.; Krása, J.; Koudelka, P.; Davidová, T. Elevation data for morphometric analysis of historical ponds dams. In Proceedings of the 17th International Multidisciplinary Scientific GeoConference, Albena, Bulgaria, 27 June–6 July 2017; Volume 17, pp. 481–488, ISBN 978-619-7408-03-4. ISSN 1314-2704. [Google Scholar] [CrossRef]
- Středa, L. Využití dat RPAS pro Hodnocení Stavu Zemědělských Pozemků. Master’s Thesis, CTU in Prague, Faculty of Civil Engineering, Prague, Czech Republic, 2017. [Google Scholar]
Figure 1.
Overview of the Podvinak Fishpond (www.mapy.cz).
Figure 1.
Overview of the Podvinak Fishpond (www.mapy.cz).

Figure 2.
Podvinak dam situation and overview of the experiment setup and measuring points.

Figure 3.
Overview of the results of the dam analysis.

Figure 4.
Comparison of measured/monitored temperatures.

Figure 5.
Comparison of soil moisture and temperature.


Table 1.
Parameters of UAV survey for RGB and IR data.
| RGB Model | IR Model—DAM | IR Model—GRASS | |
|---|---|---|---|
| UAV | Phantom 4 | Tarot X | Phantom 4 |
| Camera | FC330 | Optris TIM 450 | Flir Tau2 336 |
| Image resolution | 4000 × 3000 pix | 382 × 288 pix | 336 × 256 pix |
| Spectral band | 0.38–0.78 μm | 7.5–13 μm | 7.5–13.5 μm |
| Number of images | 456 | 142 | 42 |
| Flying altitude | 42 m | 23 m | 88 m |
| Ground resolution | 0.016 m/pix | 0.09 m/pix | 0.11 m/pix |
Publisher’s Note: MDPI stays neutral with regard to jurisdictional claims in published maps and institutional affiliations. |
© 2018 by the authors. Licensee MDPI, Basel, Switzerland. This article is an open access article distributed under the terms and conditions of the Creative Commons Attribution (CC BY) license (https://creativecommons.org/licenses/by/4.0/).
Share and Cite
MDPI and ACS Style
Krása, J.; David, V. Close Range Photogrammetry and Thermal Imagery in Monitoring of Soil Moisture in Dam Structures of Historical Fishponds. Proceedings 2018, 2, 623. https://doi.org/10.3390/proceedings2110623
AMA Style
Krása J, David V. Close Range Photogrammetry and Thermal Imagery in Monitoring of Soil Moisture in Dam Structures of Historical Fishponds. Proceedings. 2018; 2(11):623. https://doi.org/10.3390/proceedings2110623
Chicago/Turabian StyleKrása, Josef, and Václav David. 2018. "Close Range Photogrammetry and Thermal Imagery in Monitoring of Soil Moisture in Dam Structures of Historical Fishponds" Proceedings 2, no. 11: 623. https://doi.org/10.3390/proceedings2110623