Analysis of Flood Hydrographs in Order to Predict the Shape of Their Falling Limbs †


Department of Irrigation, Drainage, and Landscape Engineering, Faculty of Civil Engineering, Czech Technical University in Prague, Thakurova 7, 166 29 Prague 6, Czech Republic
*
Author to whom correspondence should be addressed.
†
Presented at the 3rd EWaS International Conference on “Insights on the Water-Energy-Food Nexus”, Lefkada Island, Greece, 27–30 June 2018.
Proceedings 2018, 2(11), 639; https://doi.org/10.3390/proceedings2110639
Published: 8 August 2018
(This article belongs to the Proceedings of EWaS3 2018)
Abstract
:This paper presents preliminary analyses carried out in order to assess the possibility to treat a small simple catchment as linear reservoir when modeling the runoff from a precipitation event. This analysis was carried out for the catchment of Černá Desná stream to the profile Jezdecká. The applicability of linear reservoir concept was tested by calculating the recession constant values for hydrographs falling limbs which were then evaluated in a statistical way. Specifically, five events were selected for the detail analysis. The results indicate that the linear reservoir concept can be applied in this case to predict relatively well the discharges in next 48 h. However, the results also show that there are limitations in the application of linear concept and that the introduction of non-linear reservoir could improve the prediction results.
1. Introduction
The management of water in the landscape has become more discussed in the Czech Republic after droughts that occurred in recent years [1,2,3,4]. One of the main objectives of such debates is the mitigation of droughts impacts on water resources. As one of possible solutions, building of multipurpose water reservoirs is considered [5]. Besides big dams, small water reservoirs spread in the landscape are intended to be a part of complex approach to increase water retention in the landscape. The reason is, among other things, the loss of these water bodies in the past [6,7]. The proper function of these structures which are listed as an important landscape element in the Act on the conservation of nature and landscape [8] is highly dependent on the hydrological regime. The small water reservoirs are usually built on small streams which have of course small catchments. Hence, it is very important to investigate the hydrologic regime of small catchments to be able to assess the effect of planned reservoirs on the hydrologic regime downstream of them and to define the operation manuals for such reservoirs with respect to drought mitigation and optimal management of water. The prediction of discharges after the flood can be considered as one specific task within such research. This can help for example to manage better water storage in the reservoir downstream of the gauging profile. There are different ways to investigate the hydrologic. These vary from very simple concepts to complex distributed physically based models such as MIKE SHE [9] or GSSHA [10]. In the first attempt, the possibility of the application of linear reservoir concept for small mountainous catchment with homogeneous land use was tested.
In this paper, the mathematical description of flood hydrographs falling limbs by the exponential function is described. The linear reservoir concept was tested in this case as the one which is widely used for hydrologic analyses for different purposes [11,12,13,14,15] since the beginning of 20th century [14]. The type of analysis applied here belongs to the group of recession analysis methods [15]. In the first step, the analysis was carried out for one catchment and several rainfall-runoff events to assess whether the rainfall runoff process can be treated as a linear system. Its further intended application is then the use of model parameter for the comparison of a number of small catchments. The purpose of such comparison is, besides others, the assessment of the influence of the forest cover on the runoff conditions.
2. Material and Methods
In this section, the study area and available data are described followed by the description of the method used for given purpose.
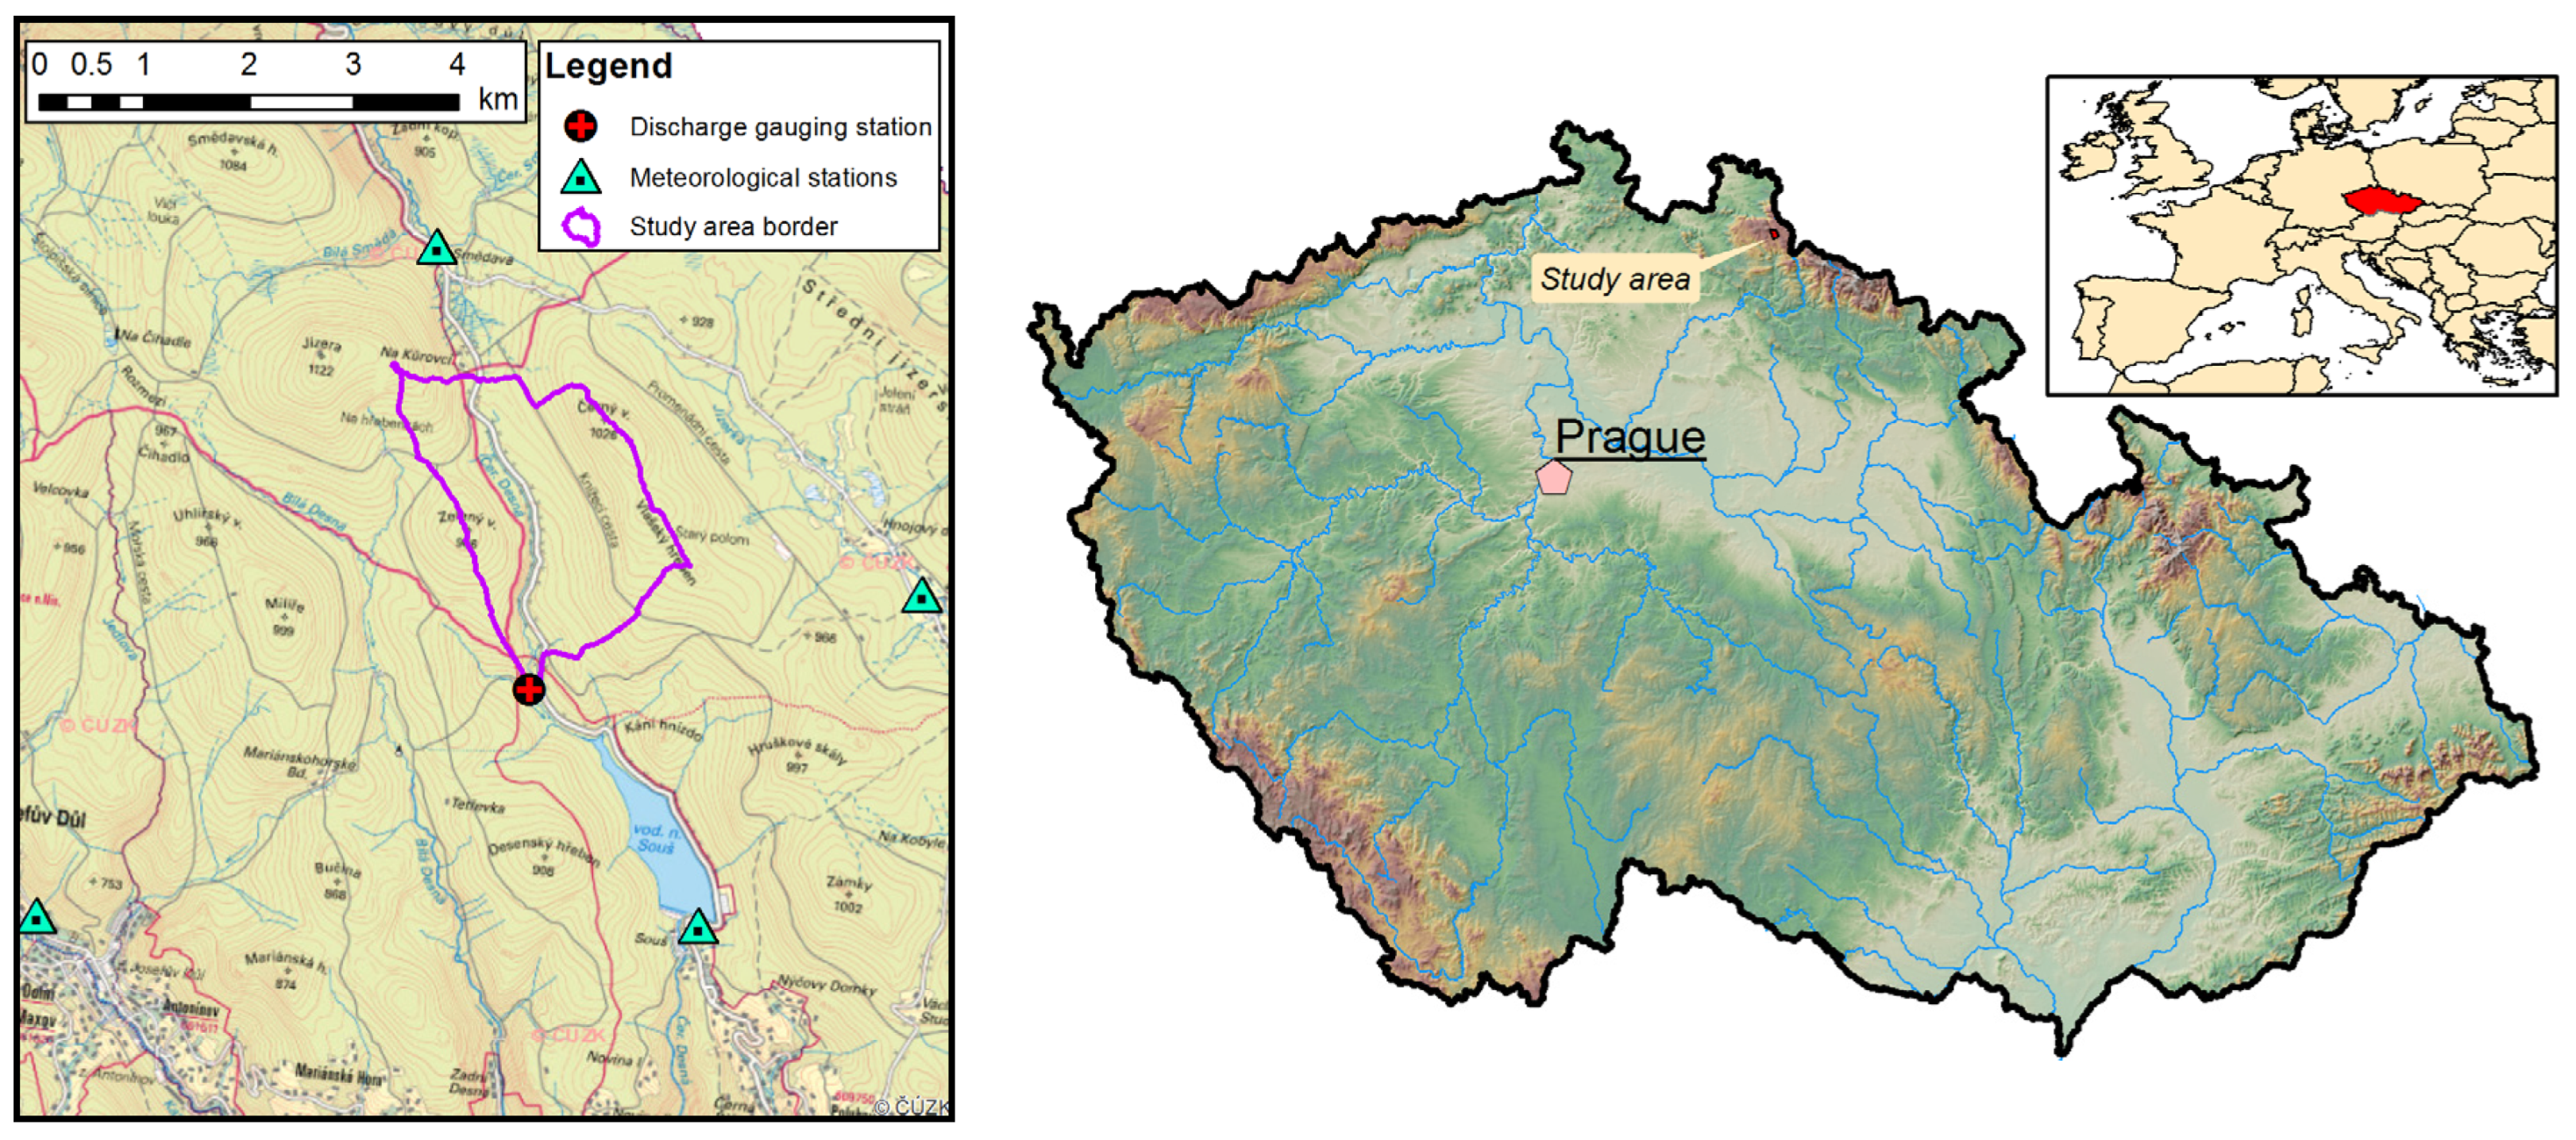
2.1. Study Area
The catchment used for this study is located in Jizera Mountains in northern Bohemia close to the border with Poland (see Figure 1, right). It has a total area 4.61 km2 and it is completely forested. The catchment is situated upstream of a big reservoir Souš on the stream Černá Desná. Land use within the area is homogeneous and consists of forest (see Figure 1, left). The area of Jizera Mountains is equipped quite well by meteorological stations although some of them are operated only in the summer period. For this study, four of them located in the proximity of the study catchment were selected which are operated by Czech Hydrometeorological Institute throughout whole year.
2.2. Data
For intended type of analysis, the basic type of data is the series of measured discharges. In this case, the hourly data were available for the period from September 2014 to December 2017. Another type of data necessary for given purpose were the series of measured precipitations. The data for the same period were available for four stations spread around the catchment—Josefův Důl, Souš, Jizerka, Smědava (see Figure 1). Additionally, temperature data were used to exclude periods with snowpack to avoid the influence of snowmelt.
The analyses were carried out for parts of runoff hydrographs starting after the end of rainfall and lasting at least 40 h. In total, five events were selected for further analysis. The details of selected events are in the Table 1.
2.3. Methods
Falling limbs of selected hydrographs were simulated by the mathematical equations representing the linear reservoir concept which considers the catchment as a tank with vertical walls drained by the outlet at the bottom. Runoff (Q) is then directly proportional to the storage (S) by the recession constant (k) as described by the Equation (1).
The linear reservoir concept gives together with mass conservation law expressed by the differential Equation (2) after solution the exponential equation describing the runoff from the catchment for rainless period and neglected evapotranspiration (Equation (3)).
The recession constant k can be then expressed from the Equation (3) and calculated for each pair of known runoff values within the rainless period using Equation (4).
2.4. Evaluation
The calculation of recession constant k for each point on each limb and all following points on the same limb produces a number of values which can be then evaluated statistically. The evaluation should be carried out with respect to the aim of it. The mean, standard deviation and quartiles were calculated for the datasets of k values corresponding to considered events. Then, it is obvious that the applicability of linear reservoir concept to one single event increases with the decreasing variability of k values calculated for this event. The variability can be assessed by the detail analysis of the distribution of k values within the dataset for each event but it can be assessed in general using the value of standard deviation.
The applicability of the linear reservoir concept for one single event doesn’t mean yet the applicability of the concept for the catchment in general as the catchment response may vary from event to event according to the actual catchment conditions. Hence, it is necessary to carry out the assessment of the variability of k values among the set of events. The suitability of the linear reservoir concept for the catchment in general can be then assessed by the comparison of k values corresponding to single events.
Above mentioned analyses can provide a good proof of linear reservoir concept applicability for a given catchment. However, only the analysis of simulated flows can provide the overview of the fit of measured and simulated data. This can be done in different ways. In this paper, the visual check has been chosen as a first step of more complex assessment which will be followed later by the detail analysis of the model performance with respect to the discharge value itself and the lag from it to the simulated value. The visual check was done for both the average of k value for each single event and the global average value for all the considered events.
3. Results
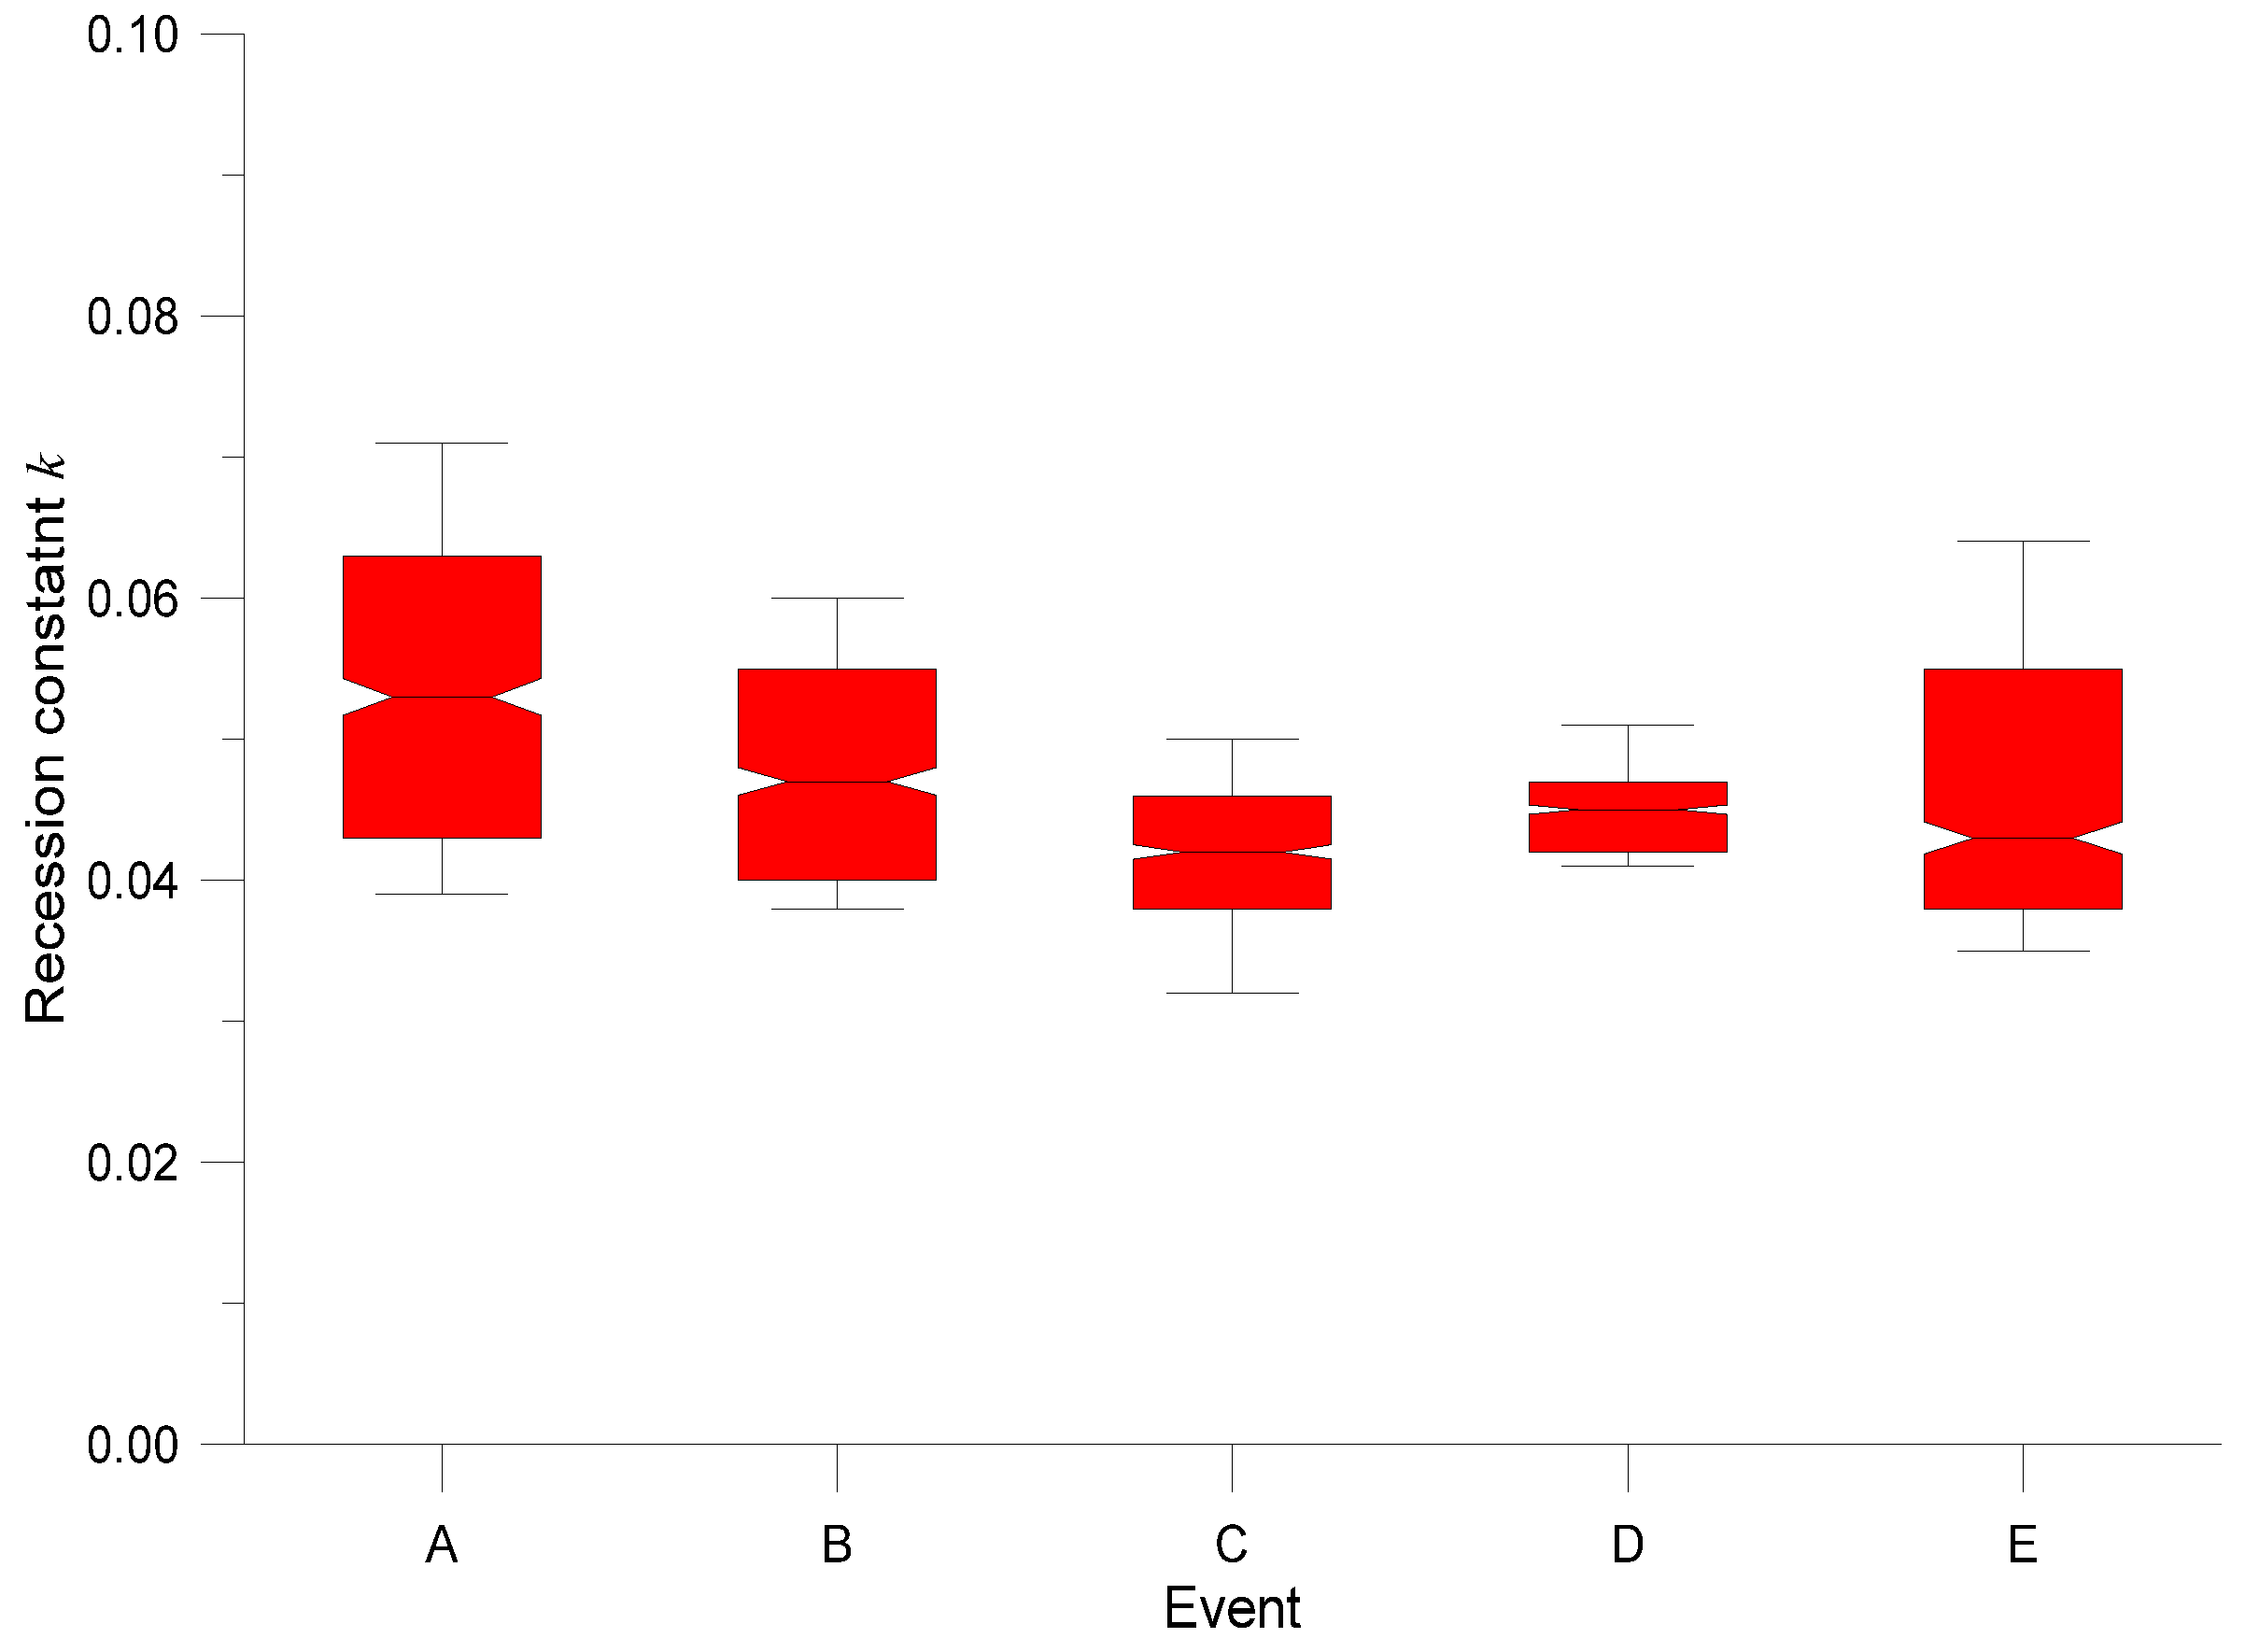
First, the runoff conditions were evaluated for each single event individually by calculating the statistics of k values. The results are presented in the Table 2. For a better overview of the results, the box and whisker plot was drawn based on calculated statistics (see Figure 2). Mean values of recession constant k vary between 0.043 and 0.054 while medians between 0.043 and 0.053. The results indicate that the values of recession constant k are close one to another. The variability was highest for events A and E while it was very low mainly for event D. The similarity of recession constants for different events will be later analyzed by two-tailed t-test. However, these results indicate in general that it could be possible to treat the study catchment as a linear reservoir.
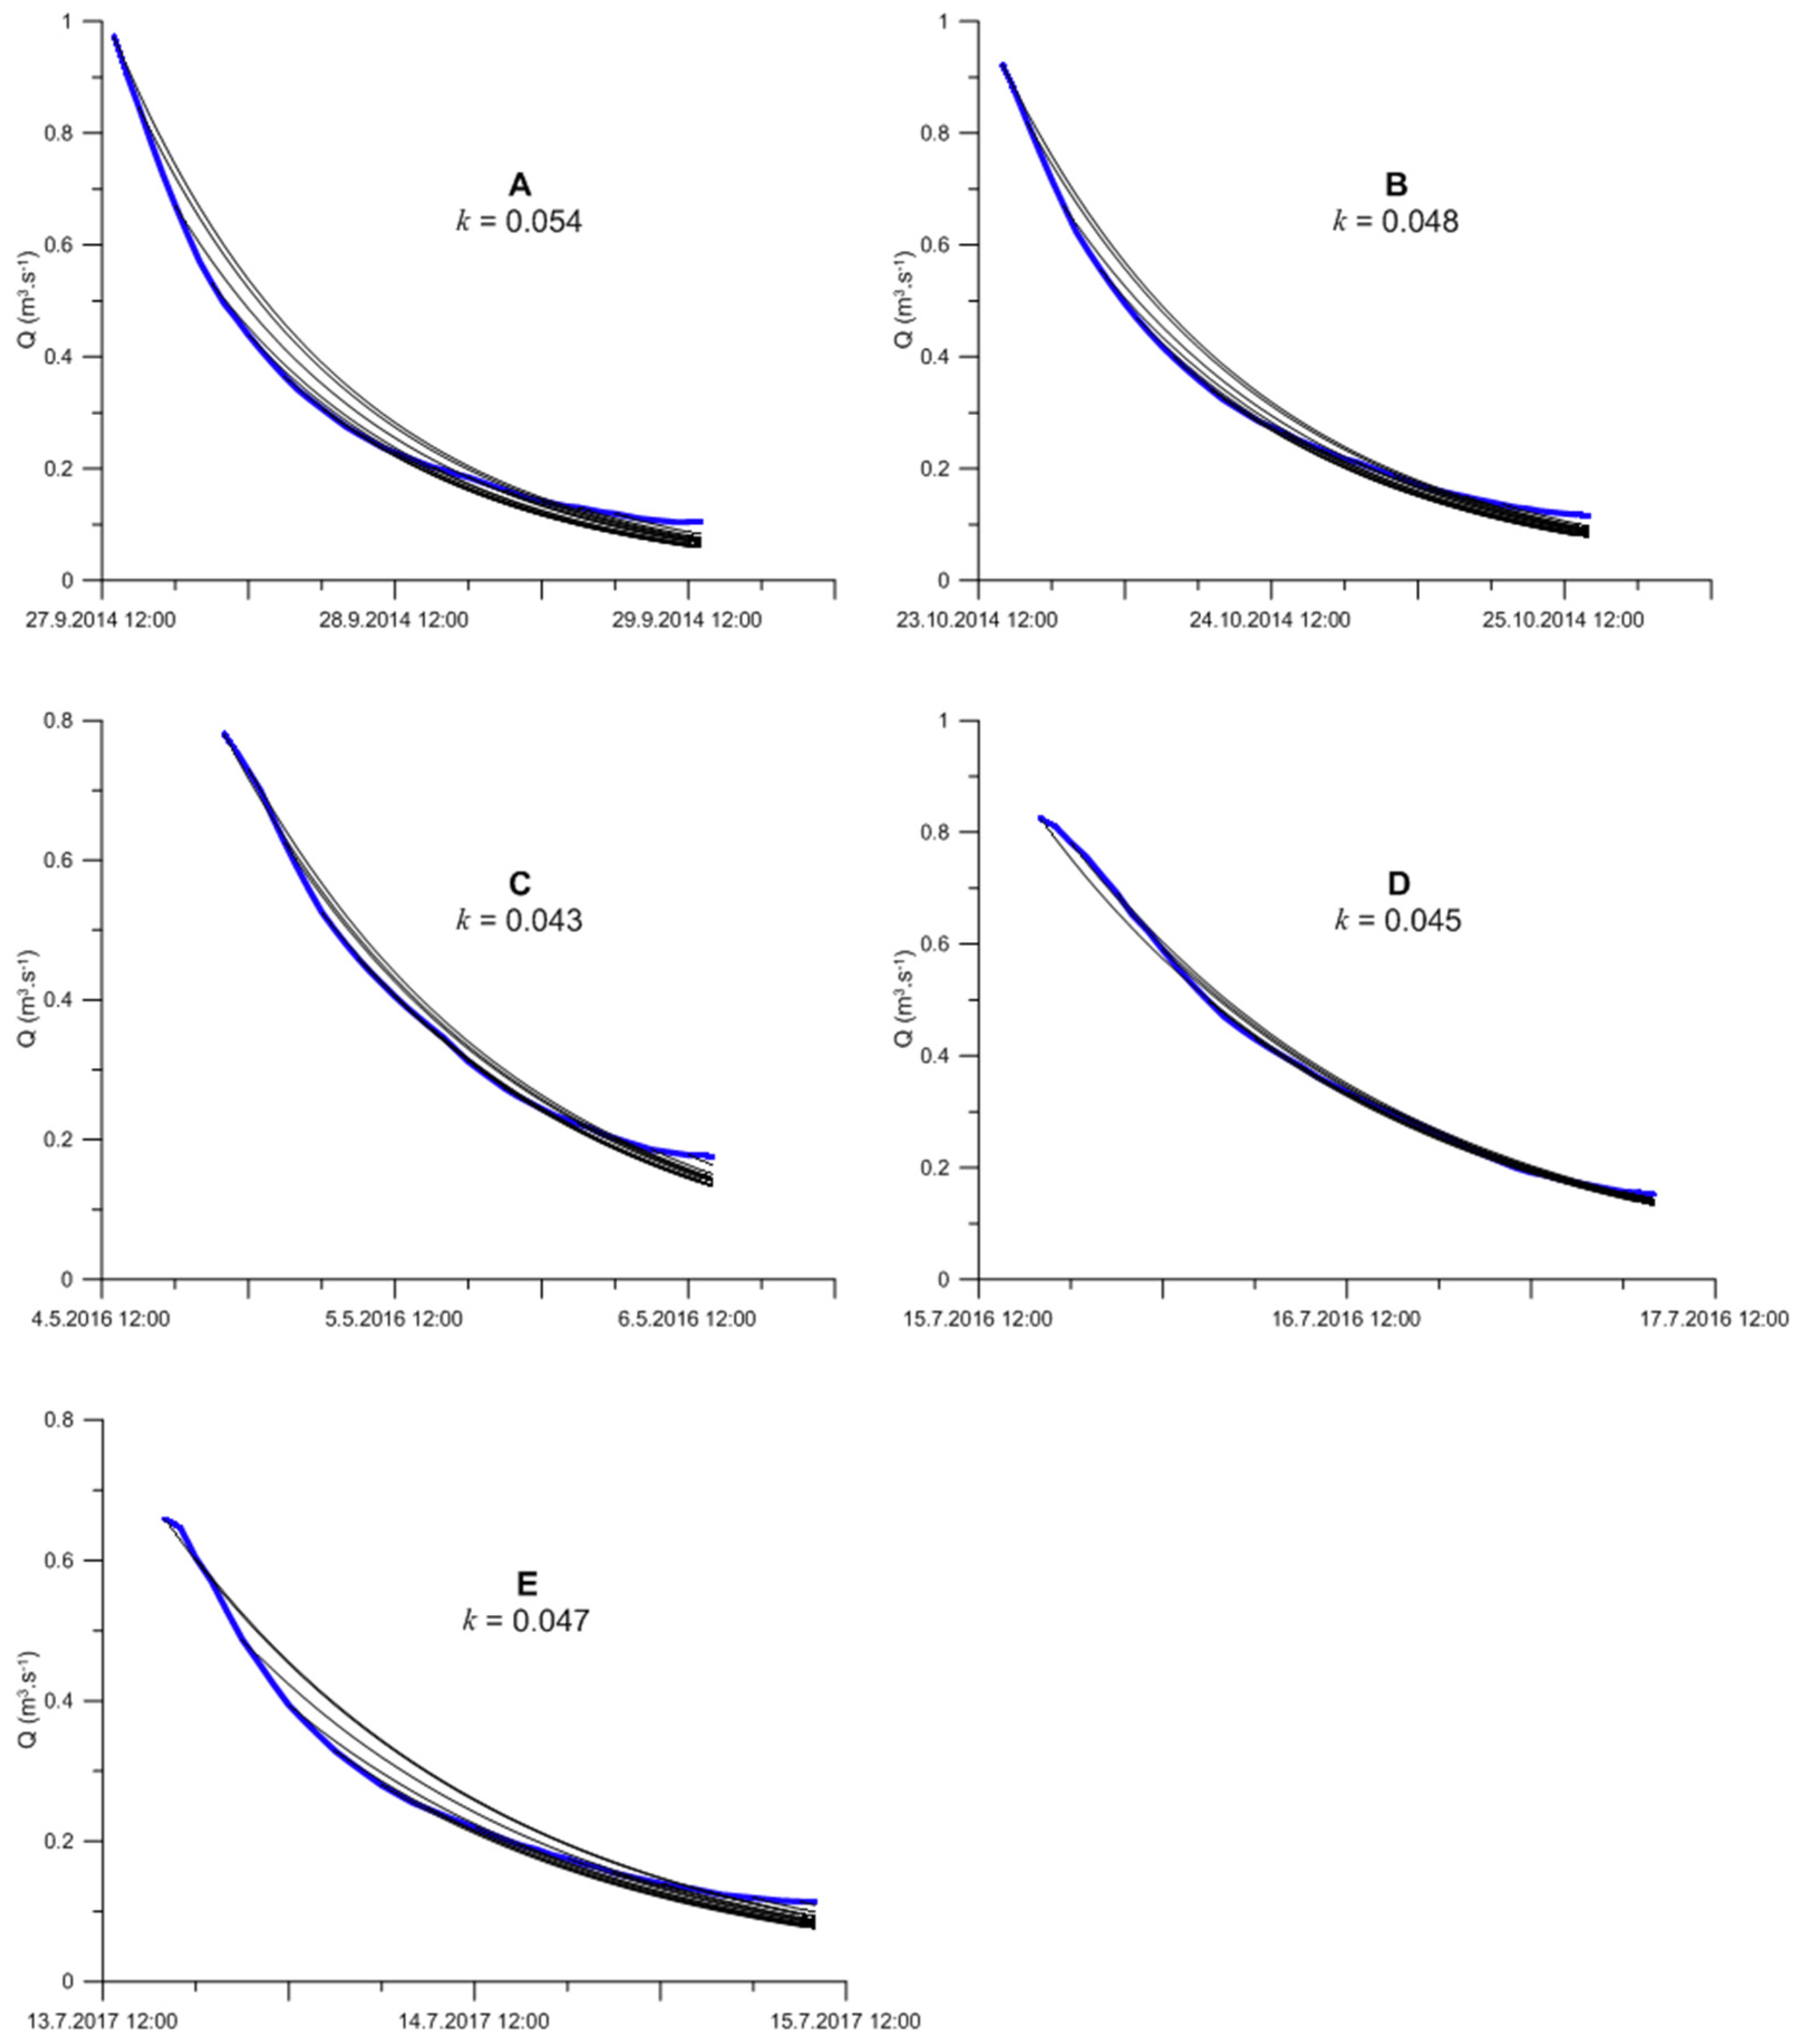
The average values of recession constant calculated for single events were then used to simulate discharges. The simulation was done from each third measured value of discharge forward. Simulated discharges were then plotted together with those measured (see Figure 3). It is clear from the plots that the discharge is simulated quite well when considering specific values of recession constant. The best fit can be seen for events C and D. However, the deviation of simulated curves is visible despite the recession factor values are calculated individually for each event. Furthermore, it seems to follow similar trend. The slope of recession curve is steeper for simulated values then for those measured in case of higher discharges and it is opposite in case of lower discharges.
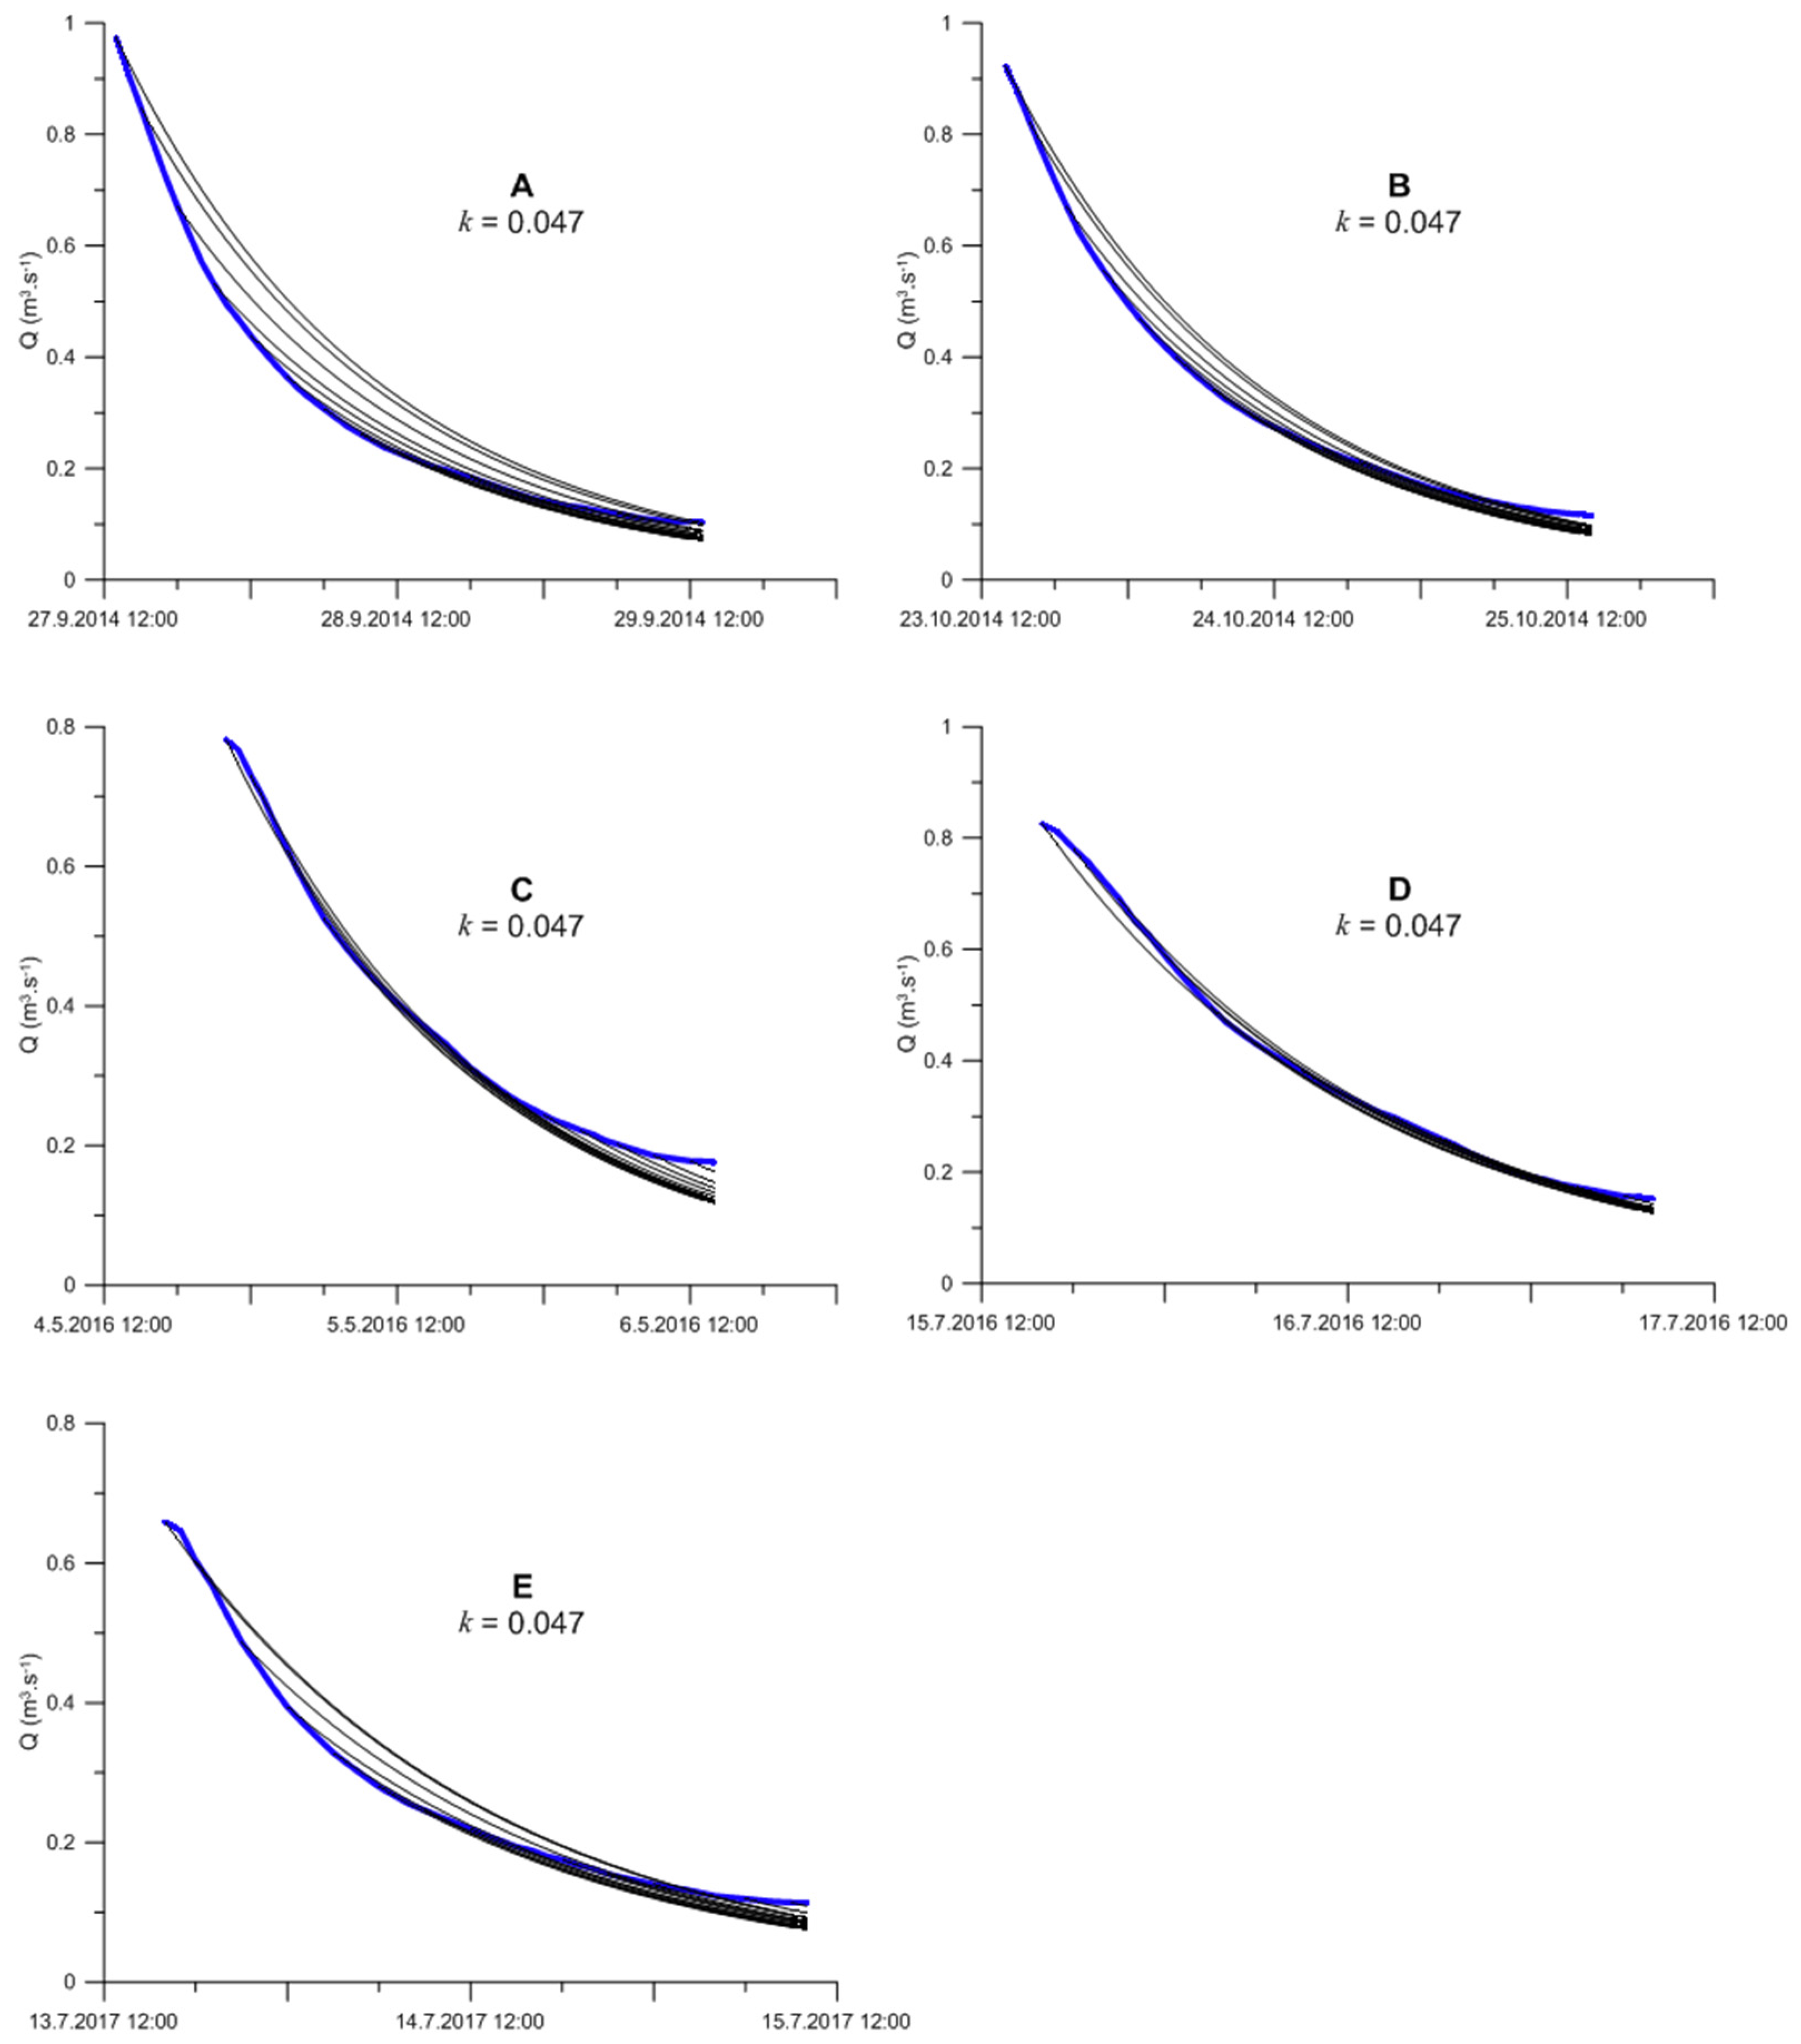
The results of simulation with one global value of recession coefficient k are similar to those calculated with individual k values (see Figure 4). The deviations of simulated values from those measured is a bit stronger but the fit seems to be still quite well. It is best for the event D which was expected as the individual value of recession constant for this event is the same as the global one. On contrary, the event A seems to produce relatively big deviation mainly for higher discharges.
There is one more remark which should be mentioned at this point which is related to the end of all analyzed recession curves. All simulated recession curves tend to be falling faster than those observed. This means that the simulated rate of catchment draining is higher at lower discharges and that the catchment would reach the state of drought earlier than in reality.
4. Conclusions
First, it is necessary to state that presented analyses must be considered as an initial phase of more complex research. It was tested whether it could be possible to treat small simple mountainous catchment as a linear reservoir. In total, parts of falling limbs of five runoff hydrographs were used for this purpose. The values of recession constant were calculated in two ways. First, the average value was calculated for each event separately and the discharges were simulated starting at different points on the measured falling limbs. The results show quite well fit to the measured discharges. Second, the global average value of the recession constant was calculated from all considered events. This value was then used to simulate discharges starting again at different points on the measured falling limbs. The results of such simulation fit measured data less than in the previous case. In both cases, the simulated curves are characterized by smaller curvature resulting in overestimation of simulated discharges at upper parts of falling limbs and underestimation at lower parts of falling limbs.
The results achieved by presented analyses seem to be good but there are hints indicating that the performance of model can be improved. Furthermore, the possibility of generalization of the results is limited by the relatively short duration of analyzed falling limbs. The improvement can be achieved in different ways. Further research will focus on other different model structures. Mainly models consisting in nonlinear reservoir [16] or in a set of reservoirs combined either in parallel or in series [17]. Both types of models can mainly improve the fitting of observed data by those simulated as they can provide higher curvature of simulated lines. This can be achieved by powering the storage to the value higher than 1 in case of nonlinear reservoir. In case of the set of reservoir, the improvement can be achieved by the combination of two parallel linear reservoirs with different recession constant and well-set distribution of precipitation water between them. Even later phase will include also the simulation during periods with precipitation.
Author Contributions
The paper was written by V.D. The analyses were performed by V.D. with the contribution of T.D. Both authors worked together on the data preparation and initial processing.
Acknowledgments
This paper presents the research undertaken within the research project NAZV KUS QJ1620395 “Restoration and building of ponds in forest areas as a part of sustainable water resources management in CZ” funded by Ministry of Agriculture of the Czech Republic. The support is highly acknowledged.
Conflicts of Interest
The authors declare no conflict of interest. The founding sponsors had no role in the design of the study; in the collection, analyses, or interpretation of data; in the writing of the manuscript, and in the decision to publish the results.
References
- David, V.; Davidová, T. Identification and frequency analysis of drought events in the Blanice River catchment (Czech Republic). In Drought: Research and Science-Policy Interfacing; Andreu, J., Solera, A., Paredes-Arquiola, J., Haro-Monteagudo, D., van Lanen, H., Eds.; CRC Press: Boca Raton, FL, USA, 2015; pp. 177–182. [Google Scholar]
- David, V.; Davidová, T. Assessment of summer drought in 2015 using different indices in the catchment of Blanice River. Proc. Eng. 2016, 162, 45–55. [Google Scholar] [CrossRef]
- Potop, V.; Türkott, L.; Kožnarová, V.; Možný, M. Drought episodes in the Czech Republic and their potential effects in agriculture. Theor. Appl. Climatol. 2010, 99, 373–388. [Google Scholar] [CrossRef]
- Zahradníček, P.; Trnka, M.; Brázdil, R.; Možný, M.; Štěpánek, P.; Hlavinka, P.; Žalud, Z.; Malý, A.; Semerádová, D.; Dobrovolný, P.; et al. The extreme drought episode of August 2011–May 2012 in the Czech Republic. Int. J. Climatol. 2015, 35, 3335–3352. [Google Scholar] [CrossRef]
- Ministry of Agriculture of the Czech Republic and the Ministry of the Environment of the Czech Republic. The Concept of Drought Impact Prevention in the Territory of the Czech Republic. Available online: https://www.mzp.cz/C1257458002F0DC7/cz/news_170724_sucho/$FILE/koncepce_sucho_material.pdf (accessed on 31 January 2018).
- Pavelková, R.; Frajer, J.; Havlíček, M.; Netopil, P.; Rozkošný, M.; David, V.; Dzuráková, M.; Šarapatka, B. Historical ponds of the Czech Republic: An example of the interpretation of historic maps. J. Maps 2016, 12 (Suppl. 1), 551–559. [Google Scholar] [CrossRef]
- Šantrůčková, M.; Demková, K.; Weber, M.; Lipský, Z.; Dostálek, J. Long term changes in water areas and wetlands in an intensively farmed landscape: A case study from the Czech Republic. Eur. Countrys. 2017, 9, 132–144. [Google Scholar] [CrossRef]
- Act. No 114/1992 Coll., on the Conservation of Nature and Landscape. Available online: http://aplikace.mvcr.cz/sbirka-zakonu/ViewFile.aspx?type=c&id=2551 (accessed on 8 August 2018).
- Graham, D.N.; Butts, M.B. Flexible, integrated watershed modelling with MIKE SHE. Watershed Model. 2005, 849336090, 245–272. [Google Scholar]
- Downer, C.W.; Ogden, F.L. GSSHA: Model to simulate diverse stream flow producing processes. J. Hydrol. Eng. 2004, 9, 161–174. [Google Scholar] [CrossRef]
- Buytaert, W.; De Bièvre, B.; Wyseure, G.; Deckers, J. The use of the linear reservoir concept to quantify the impact of changes in land use on the hydrology of catchments in the Andes. Hydrol. Earth Syst. Sci. 2004, 8, 108–114. [Google Scholar] [CrossRef]
- Pedersen, J.T.; Peters, J.C.; Helweg, O.J. Hydrographs by Single Linear Reservoir Model. J. Hydraul. Div. 1980, 106, 837–852. [Google Scholar] [CrossRef]
- Peters, E.; Torfs, P.J.J.F.; Van Lanen, H.A.J.; Bier, G. Propagation of drought through groundwater—A new approach using linear reservoir theory. Hydrol. Process. 2003, 17, 3023–3040. [Google Scholar] [CrossRef]
- Maillet, E.T. Essais d’hydraulique Souterraine & Fluviale; A. Hermann: Paris, France, 1905. [Google Scholar]
- Brodie, R.S.; Hostetler, S. A review of techniques for analysing baseflow from stream hydrographs. In Proceedings of the NZHS-IAH-NZSSS 2005 Conference, Auckland, New Zealand, 29 November–1 December 2005; Volume 28. [Google Scholar]
- Wittenberg, H. Nonlinear analysis of flow recession curves. In IAHS Publications-Series of Proceedings and Reports-International Association Hydrological Sciences; IAHS: London, UK, 1994; Volume 221, pp. 61–68. [Google Scholar]
- Wagener, T.; Wheater, H.; Gupta, H.V. Rainfall-Runoff Modelling in Gauged and Ungauged Catchments; World Scientific: Singapore, 2004. [Google Scholar]
Figure 1.
The study area with the location of meteorological and discharge gauging stations (left) and location of the study area in the Czech Republic (right).
Figure 1.
The study area with the location of meteorological and discharge gauging stations (left) and location of the study area in the Czech Republic (right).

Figure 2.
Boxplot of k values statistics for assessed events (whiskers at 10/90 percentile).

Figure 3.
Plot of measured discharges (blue line) and discharges simulated using the value of recession constant averaged for single events for different starting points on the falling limb (black lines). Letters A to E relates to single events (see Table 2).
Figure 3.
Plot of measured discharges (blue line) and discharges simulated using the value of recession constant averaged for single events for different starting points on the falling limb (black lines). Letters A to E relates to single events (see Table 2).

Figure 4.
Plot of measured discharges (blue line) and discharges simulated using the global average value of recession constant for different starting points on the falling limb (black lines). Letters A to E relates to single events (see Table 2).
Figure 4.
Plot of measured discharges (blue line) and discharges simulated using the global average value of recession constant for different starting points on the falling limb (black lines). Letters A to E relates to single events (see Table 2).


Table 1.
Overview of events selected for analysis.
| ID | Date | Start Q (m3·s−1) | End Q (m3·s−1) | Duration (h) |
|---|---|---|---|---|
| A | 27–29 September 2014 | 0.973 | 0.104 | 48 |
| B | 23–25 October 2014 | 0.922 | 0.115 | 48 |
| C | 4–6 May 2016 | 0.781 | 0.178 | 40 |
| D | 15–17 July 2016 | 0.825 | 0.152 | 40 |
| E | 13–15 July 2017 | 0.659 | 0.106 | 42 |
Table 2.
Statistics of k value datasets.
| Event | Mean | Median | Standard Deviation |
|---|---|---|---|
| A | 0.054 | 0.053 | 0.012 |
| B | 0.048 | 0.047 | 0.009 |
| C | 0.043 | 0.043 | 0.006 |
| D | 0.045 | 0.045 | 0.004 |
| E | 0.047 | 0.043 | 0.011 |
Publisher’s Note: MDPI stays neutral with regard to jurisdictional claims in published maps and institutional affiliations. |
© 2018 by the authors. Licensee MDPI, Basel, Switzerland. This article is an open access article distributed under the terms and conditions of the Creative Commons Attribution (CC BY) license (https://creativecommons.org/licenses/by/4.0/).
Share and Cite
MDPI and ACS Style
David, V.; Davidová, T. Analysis of Flood Hydrographs in Order to Predict the Shape of Their Falling Limbs. Proceedings 2018, 2, 639. https://doi.org/10.3390/proceedings2110639
AMA Style
David V, Davidová T. Analysis of Flood Hydrographs in Order to Predict the Shape of Their Falling Limbs. Proceedings. 2018; 2(11):639. https://doi.org/10.3390/proceedings2110639
Chicago/Turabian StyleDavid, Václav, and Tereza Davidová. 2018. "Analysis of Flood Hydrographs in Order to Predict the Shape of Their Falling Limbs" Proceedings 2, no. 11: 639. https://doi.org/10.3390/proceedings2110639