Classification of Hematoxylin and Eosin Images Using Local Binary Patterns and 1-D SIFT Algorithm †

1
Department of Electrical and Electronics Engineering, Bilkent Univesity, 06800 Ankara, Turkey
2
Department of Informatics, Middle East Technical University, 06800 Ankara, Turkey
*
Author to whom correspondence should be addressed.
†
Presented at the International Workshop on Computational Intelligence for Multimedia Understanding (IWCIM), Kos Island, Greece, 2 September 2017.
Proceedings 2018, 2(2), 94; https://doi.org/10.3390/proceedings2020094
Published: 18 January 2018
(This article belongs to the Proceedings of International Workshop on Computational Intelligence for Multimedia Understanding (IWCIM))
Abstract
:In this paper, Hematoxylin and Eosin (H&E) stained liver images are classified by using both Local Binary Patterns (LBP) and one dimensional SIFT (1-D SIFT) algorithm. In order to obtain more meaningful features from the LBP histogram, a new feature vector extraction process is implemented for 1-D SIFT algorithm. LBP histograms are extracted with different approaches and concatenated with color histograms of the images. It is experimentally shown that, with the proposed approach, it possible to classify the H&E stained liver images with the accuracy of .
1. Introduction
As a lethal disease, cancer effects many people around the globe. According to the World Cancer Report published in 2014 [1], approximately 14 million people experience this disease every year and 8 million patients have died because of it. Namely, “Cancer” is a general term for malignant tumors. These rapid growing abnormal tumors invades different tissues and organs in time. This process is called metastatic invasion. Since this invasion is the one of the major reasons of the deaths, observing its level is important.
The level of metastasis can be graded by a pathologist under a microscope with the help of certain tissue stains. This staining process helps to reveal the related parts and makes the cancerous cells distinguishable under the microscope. Hematoxylin and Eosin (H&E) staining is a commonly used procedure to this end. It is possible to observe cancer cells in a tissue stained with H&E staining. However, investigating tissues under a microscope is a time consuming process. In order to aid the pathologist while working with H&E stained tissues, computer based algorithms and tools are developed [2,3,4,5,6,7]. Also computer programs such as ImageJ [8] and Fiji [9] are also being used by the pathologist due to their successful built in machine learning tools.
As a robust and famous algorithm the Local Binary Patterns (LBP) [10] constructs a histogram which reveals the important information about the patterns. It has been used in many pattern recognition, classification and tracking applications and proven to be a powerful method [11,12,13,14]. On the other hand, as a novel algorithm 1-D SIFT is first implemented for merging the similar super pixels [15]. Later in [16], it is extended with feature vector extraction process and shown that it can be used in classification applications.
In this paper, we combined both LBP and 1-D SIFT algorithms together. Our aim here is to classify the normal and cancerous H&E stained liver tissue images. Additionally, a new feature extraction approach for 1-D SIFT algorithm is implemented and used for same purpose. The outline of this paper is as follows. In Section 2, a brief information about both LBP and 1-D SIFT algorithm is given with the explanation of the new feature extraction process. Section 3 presents the conducted experiments and resulting classification accuracies.
2. Classification of Hematoxylin and Eosin (H&E) Stained Images
2.1. Local Binary Patterns
Local Binary Pattern (LBP) algorithm is a famous descriptor used in pattern recognition and classification applications. It was first described in 1996 in [10]. Since then it is used in many applications and proven to be a powerful and robust algorithm.
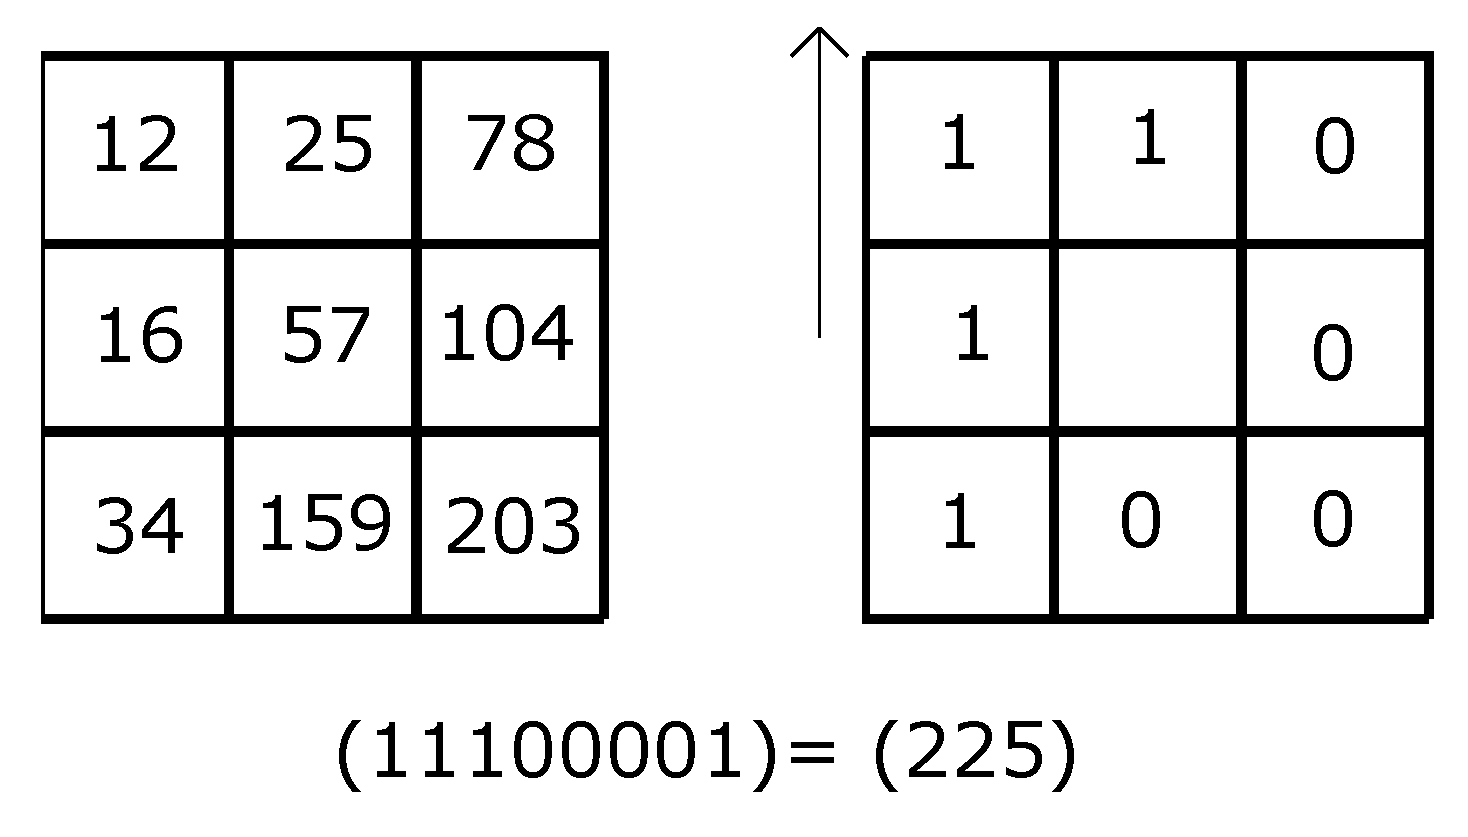
As it is shown in Figure 1 the LBP algorithm thresholds the neighboring pixels according to center pixels gray value. Later a decimal number is obtained and from these decimal numbers a histogram is constructed.This histogram and the decimal numbers tells us many things about the pattern like spots, corners, edges etc. As an extension to the basic LBP, the uniform LBP patterns introduced in [17]. A LBP code is said to be uniform if and only if its decimal code has at most two transitions. While constructing the uniform LBP histogram each uniform LBP has its own bin and the all other non uniform LBP codes are inserted in the same bin. By using the uniform LBP codes, it is possible to achieve shorter histogram while having rotation invariant representation of the pattern. Furthermore, LBP histograms can be extracted from the girds on the image. Later, these sub histograms concatenated together and form the main histogram. With this approach spatial information about the pattern is added to the LBP histogram [18].
2.2. One Dimensional Scale Invariant Feature Transform (1-D SIFT) Algorithm
One Dimensional Scale Invariant Feature Transform (1-D SIFT) algorithm is implemented as a dimensional extension of SIFT algorithm and used in merging similar super pixels [15]. However, in [15], steps like key point detection, feature vector extraction and matching weren’t implemented. In [16] 1-D SIFT algorithm is expanded to incorporate these steps and used for classification of Hematoxylin and Eosin (H&E) stained images.
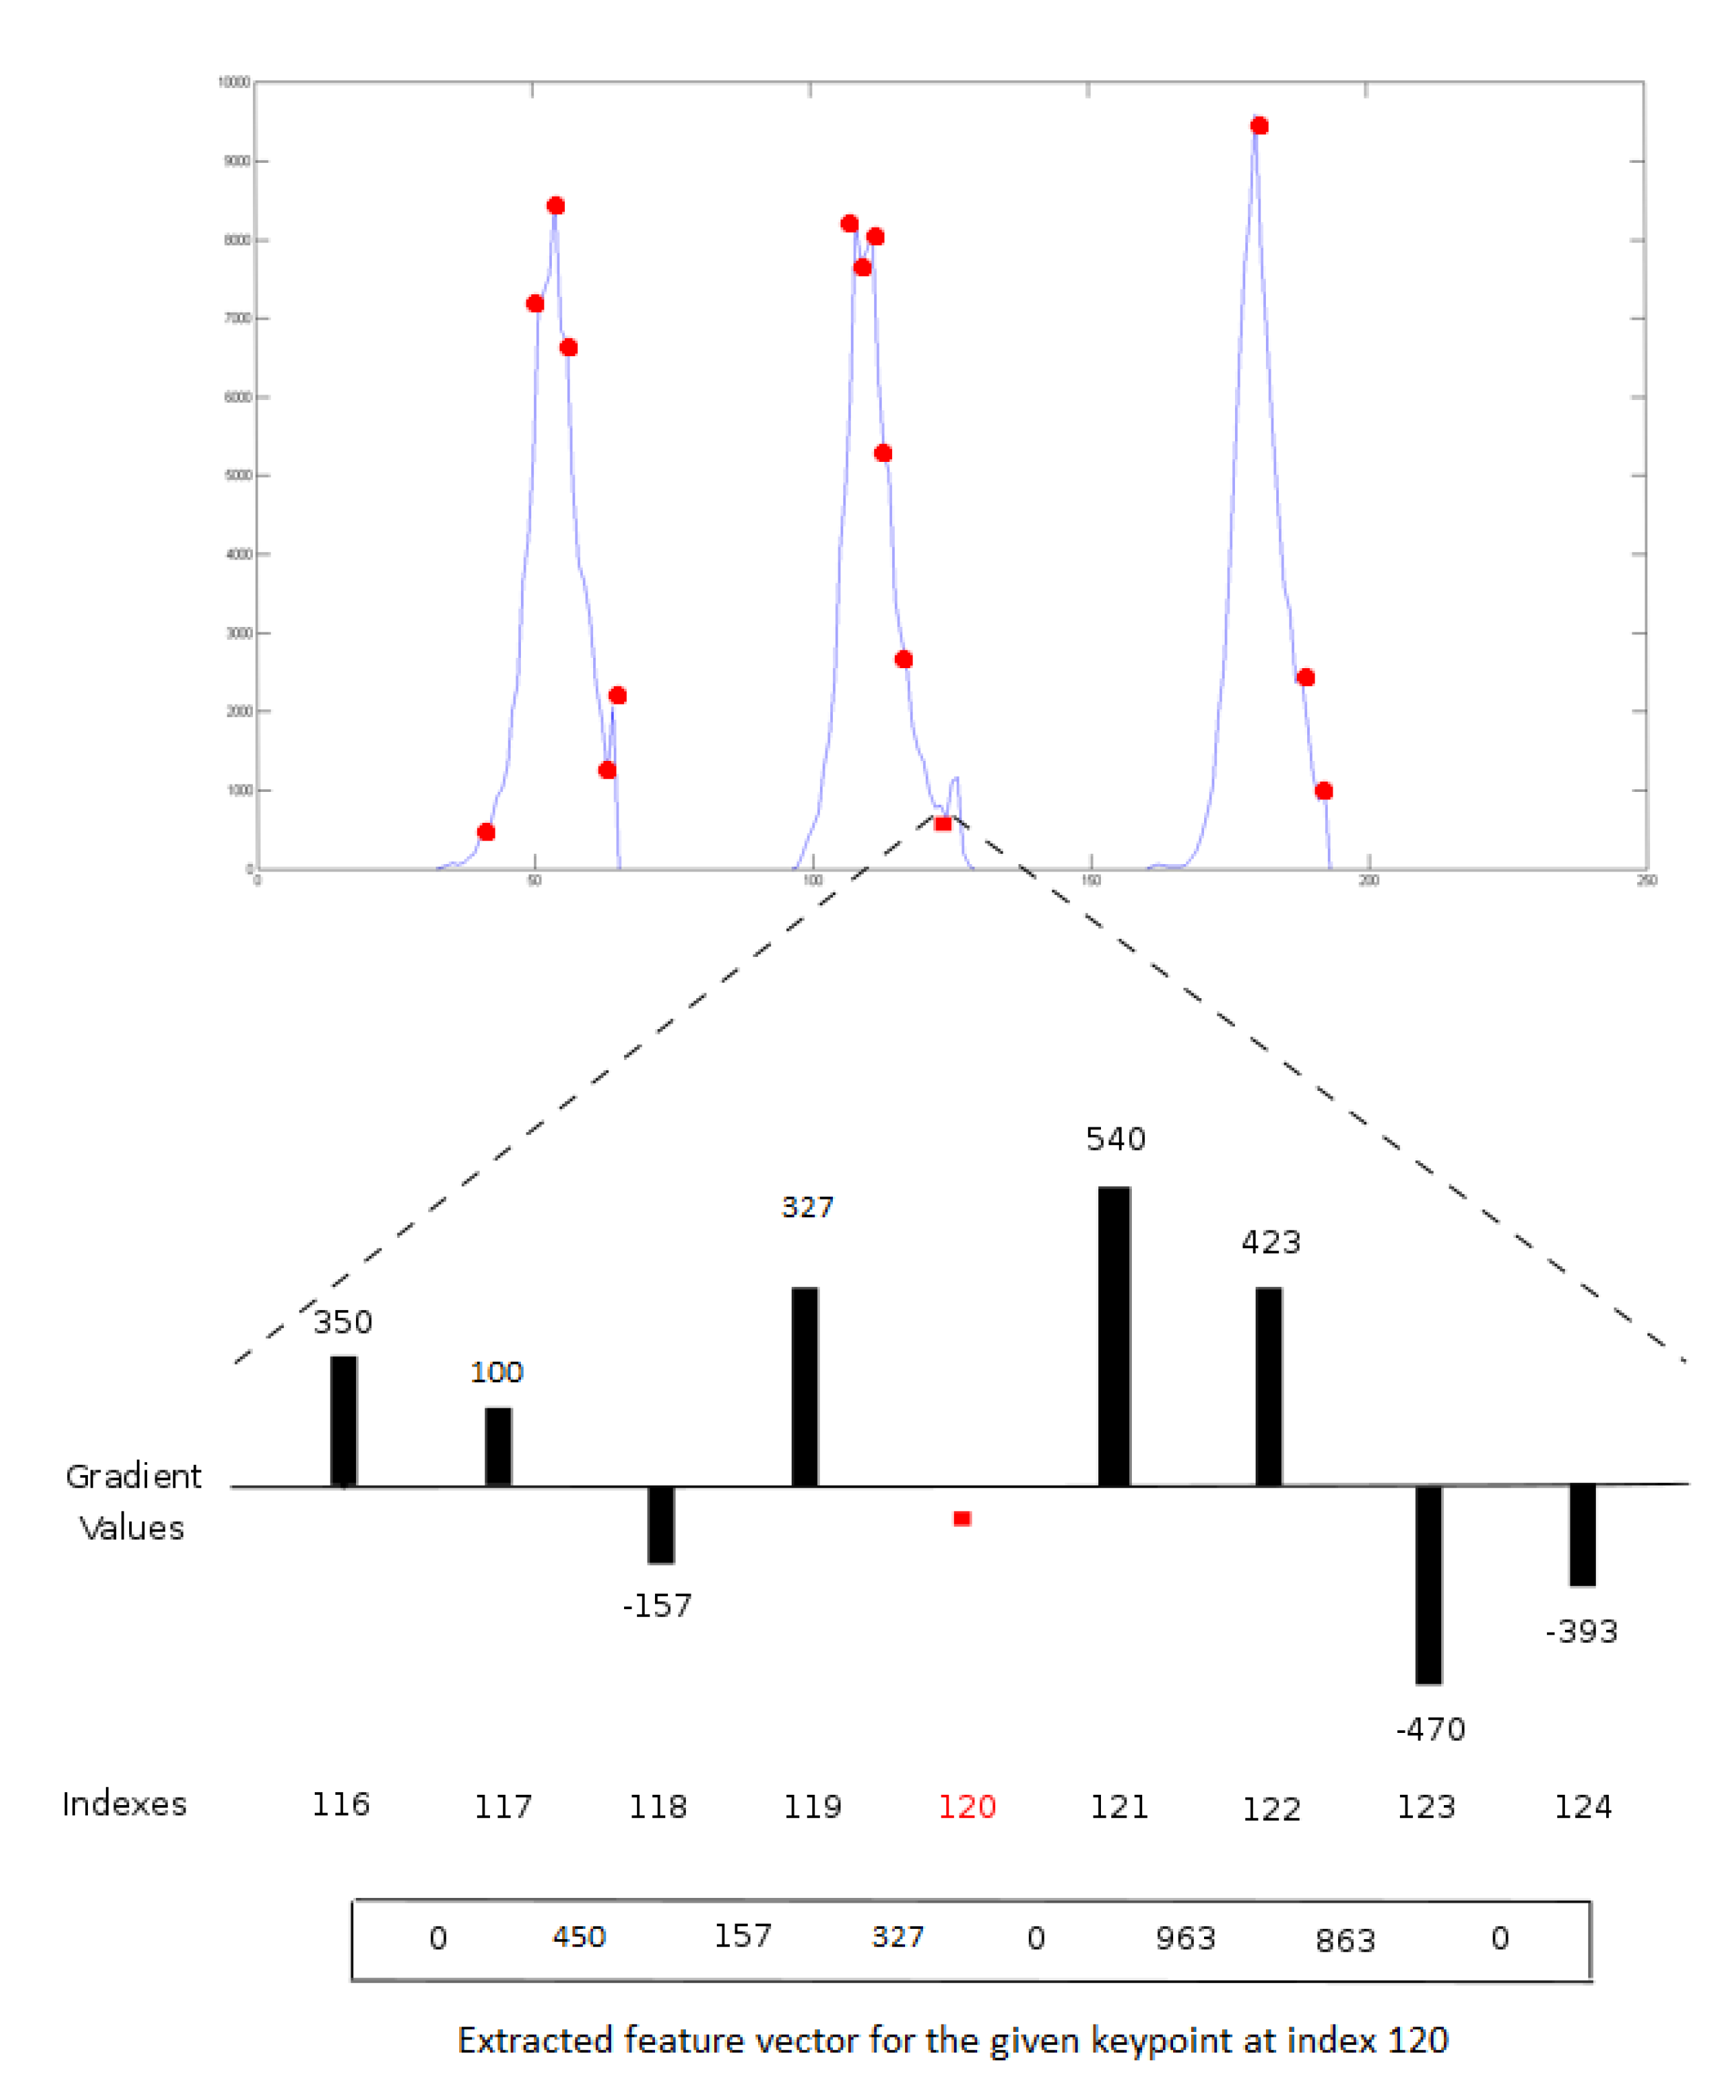
In SIFT [19], identical key points are extracted from images after filtering them with 2-D difference of Gaussian filters. On the other hand in 1-D SIFT algorithm, key points are extracted using color histograms. Similar to the SIFT algorithm, in 1-D SIFT approach, difference of Gaussian (DoG) filters are used. Instead of using the image itself, color histogram of the image is filtered with 1-D DoG filters. After constructing the octaves both local minima and extrema points are determined in each level. If it is possible to backtrack an extrema or a minima location from coarsest level to the highest level, that location is taken as a key point. Later on the gradient values of the main color histogram is extracted. With these gradient values a feature vector is created. Thus we will be representing the image with many feature vectors where their number is equal to the number of key points extracted. In Figure 2, the feature vector extraction process for the 1-D SIFT algorithm is graphically explained. Key point locations are shown with a red dots on the 32-binned RGB histogram. For the keypoint at index 120 the gradient values are paired together and according to their signs and their magnitudes placed into feature vector. The negative values are summed and inserted into the first element where positive ones are also summed and placed into the second element of the feature vector. Thus, a feature vector with four pairs is constructed. In addition to the this feature extraction process, a new feature extraction approach is also followed. As we mentioned before the LBP histogram contains important information about edges, spots etc. Thus instead of taking the gradient magnitudes we simply took the histogram magnitudes itself in feature vector construction. This mod update for the 1-D SIFT algorithm is called Magnitude 1-D SIFT (M-1-D SIFT) algorithm.
In this work, 1-D SIFT algorithm is applied to the LBP histograms. Our aim here is to classify the H&E stained cancer images using these two algorithms. Different LBP histogram extraction processes are followed and the related feature vectors are extracted. Later these feature vectors used in classification process.
3. Experimental Approaches and Results
Our data set contains 454 H&E stained liver images which are taken from 56 different patients. 270 of these samples are from the patients which diagnosed with cancer and other 184 images are from healthy patients. These images are bought from Biomax [20] and acquired with 20× magnification where the size of the images chosen as 300 × 300 pixels.
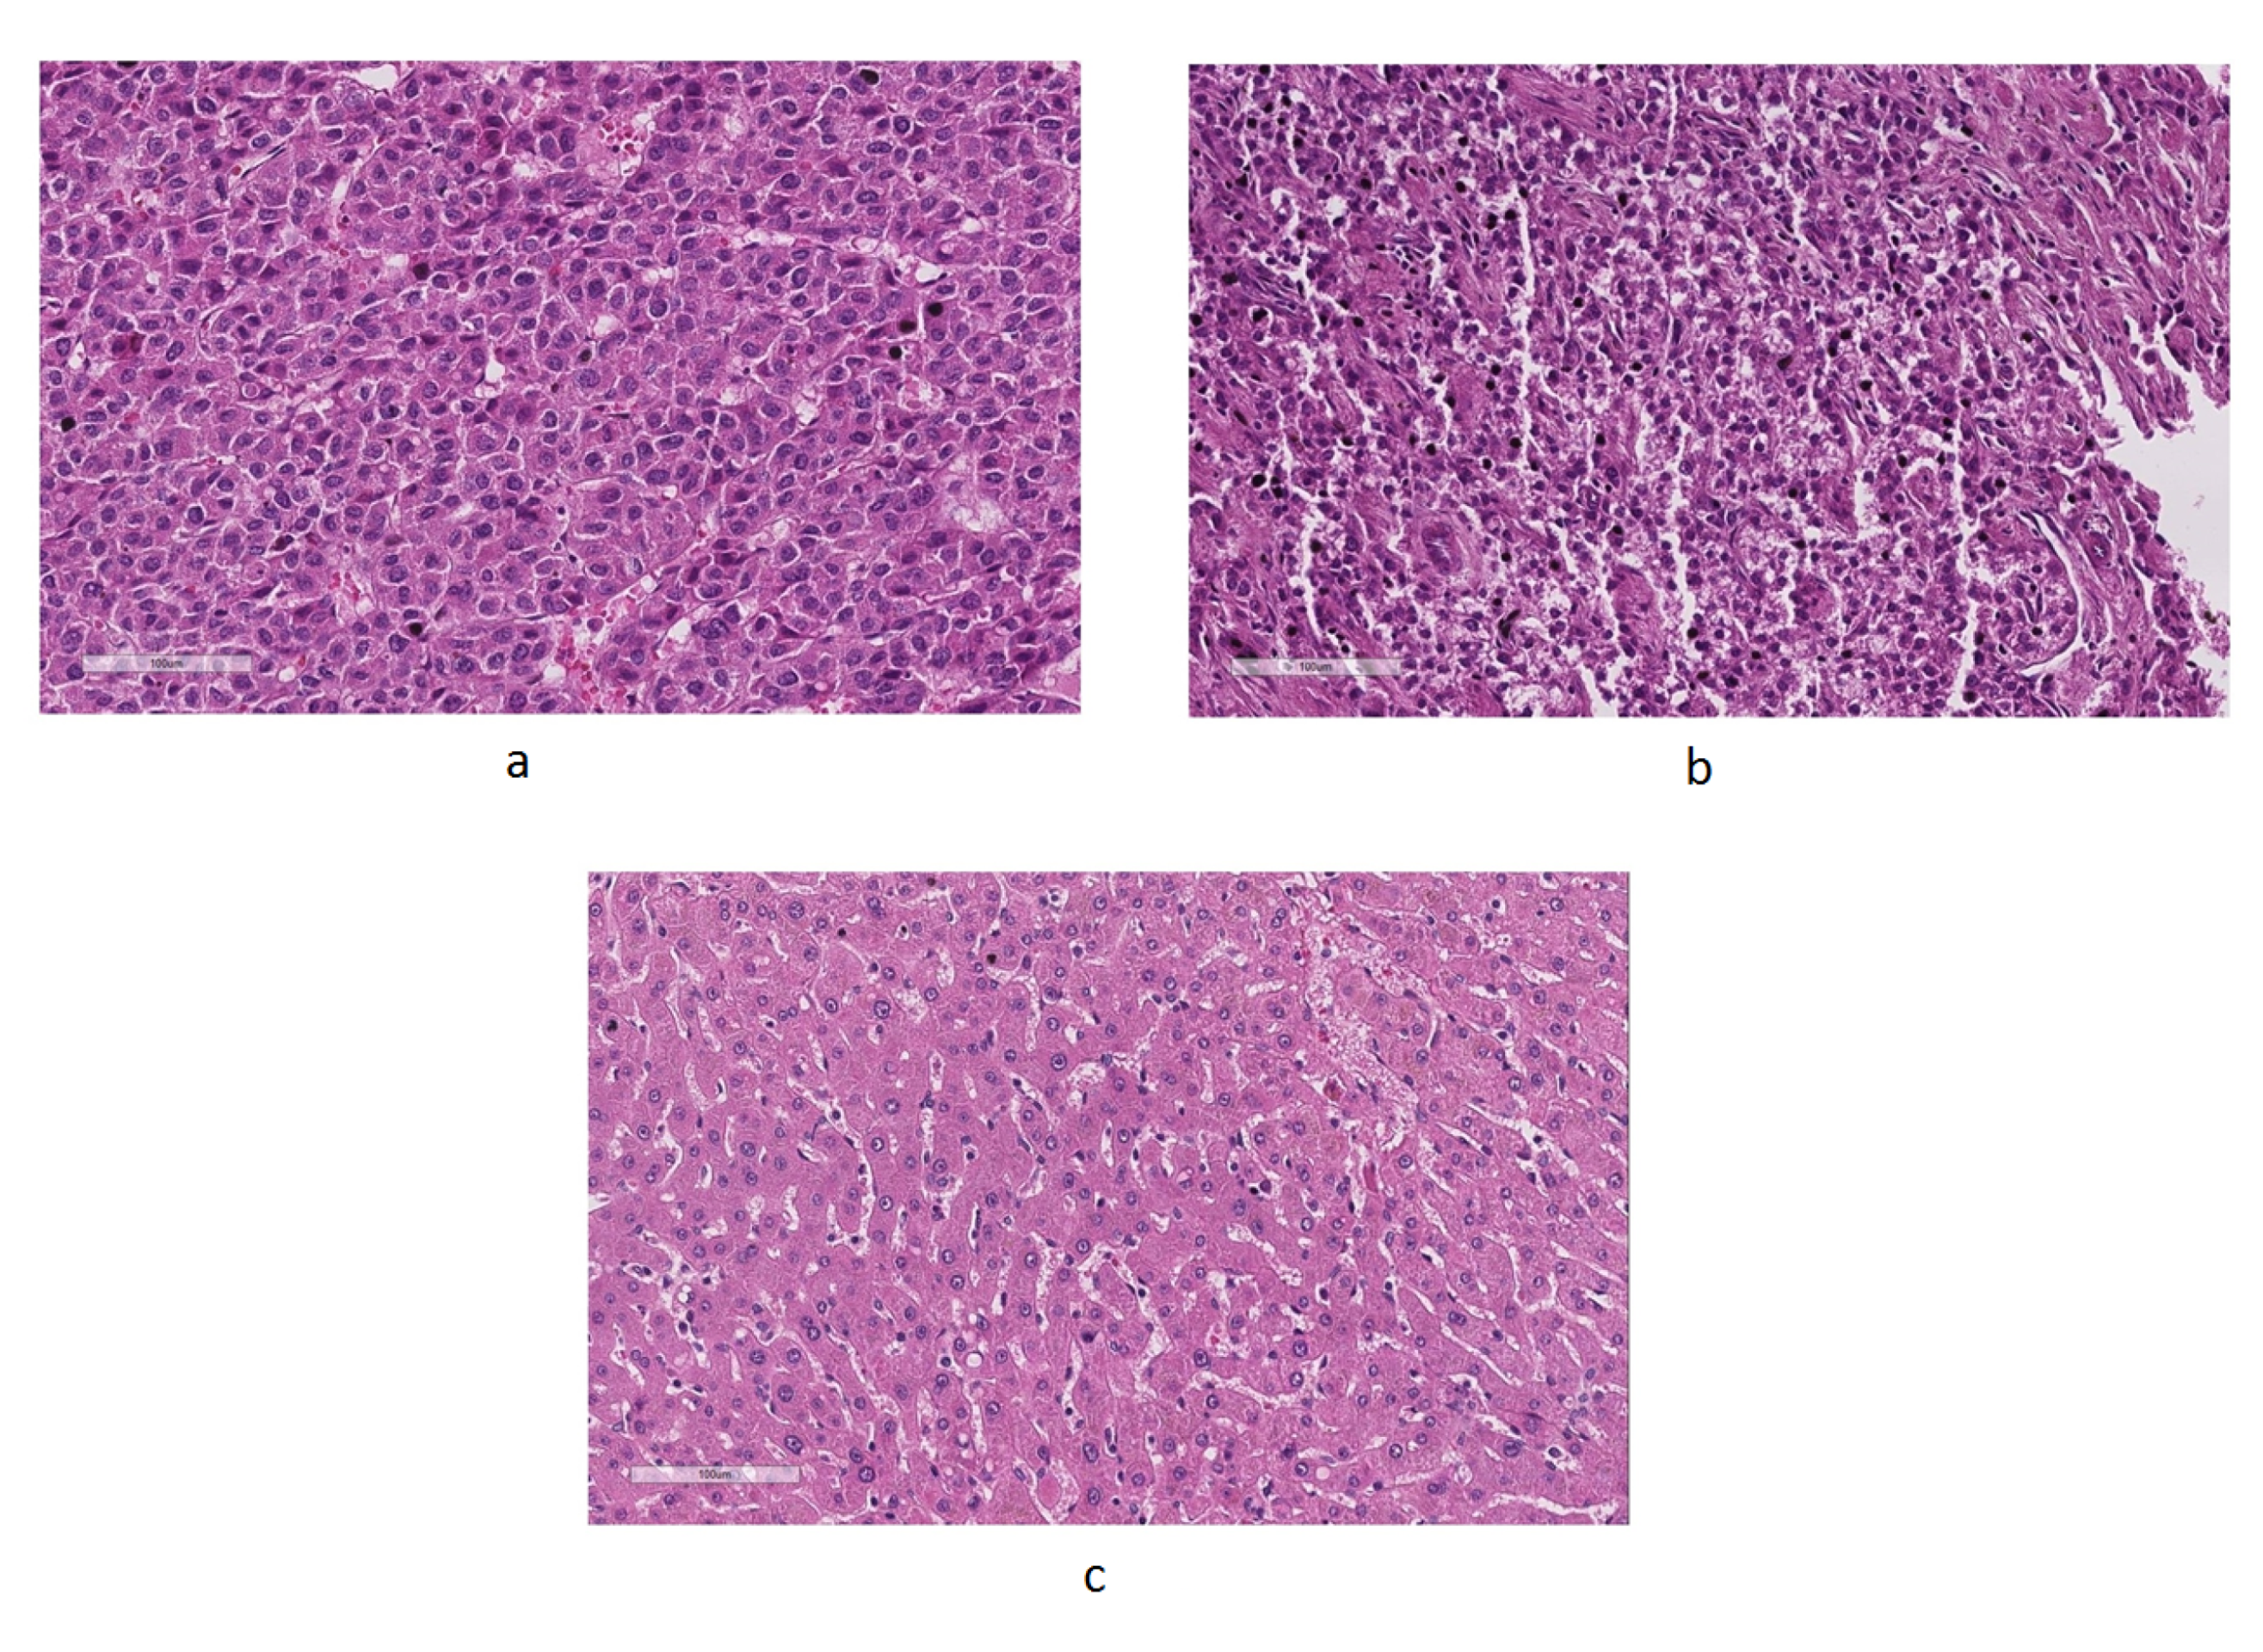
In Figure 3, H&E stained liver tissue images are shown. As it can be seen from the Figure 3 that there is an obvious pattern difference in between normal and cancerous images but some similarities are also exists. Thus, we conduct different experiments to reveal these differences:
- Experiment I: The uniform LBP histogram of the image is extracted by using gird approach without weights [14]. Then, we used 1-D SIFT feature vector extraction process.
- (Experiment II): The uniform LBP histogram is again obtained with grid approach without weights but feature vectors are extracted with M-1-D SIFT algorithm.
- (Experiment III): In this experiment, the best color histogram combination for H&E image classification given in [16] is combined with Uniform LBP histogram which extracted with grid approach. Feature vectors are again constructed with M-1-D SIFT method.
- (Experiment IV): Lastly, the same procedure in experiment III is applied but now instead of using grid approach the uniform LBP histogram is extracted from the whole image itself.
Classification accuracies of the conducted experiments are obtained by using the Keypoint Matching (KM) and Efficient Nearest Neighbor Indexing (ENNI) methods presented in [19]. During the experiments we used VLfeat implementations of these algorithms [21]. In the classification process we exclude the all other images of the same patient out of the data set. Later, the extracted feature vectors are compared with the other feature vectors in the data sets by using KM and ENNI algorithms. During the decision process, the KM algorithm uses the first two nearest results which gives the closes euclidean distance. Note that, as in SIFT algorithm, the distance between best two results taken as least 0.8. On the other hand, the ENNI algorithm uses a modified decision tree approach. It starts the search from the nearest bin. After we obtained all class decisions for each feature vector in a given image, a majority voting is conducted in order to get final class decision (normal or cancerous) for the image.
In Table 1 the resulting classification accuracies are given. As it is shown in Table 1 that, M-1-D SIFT approach gives better results than non-modified version. Since there are some color differences between the normal and cancerous images, adding color histograms to LBP histograms greatly increased the success of the experiments.
4. Conclusions
In this work, we expand our previously implemented 1-D SIFT algorithm with the new M-1-D SIFT feature extraction approach. It is shown that the both methods are compatible with different LBP histograms. It is experimentally proven that with the use of presented approaches, it is possible to classify the H&E stained liver tissue images with 88% accuracy. As a future work we are planning to use different types of LBP histograms and conduct additional experiments and further extend the M-1-D SIFT feature extraction process.
References
- Stewart, B.; Wild, C.P. World Cancer Report 2014; International Agency for Research on Cancer: Lyon, France, 2014. [Google Scholar]
- Monaco, J.; Tomaszewski, J.; Feldman, M.; Moradi, M.; Mousavi, P.; Boag, A.; Davidson, C.; Abolmaesumi, P.; Madabhushi, A. Detection of prostate cancer from whole-mount histology images using markov random fields. In Proceedings of the Workshop on Microscopic Image Analysis with Applications in Biology (in Conjunction with MICCAI), New York, NY, USA, 5–6 September 2008. [Google Scholar]
- Basavanhally, A.; Agner, S.; Alexe, G.; Bhanot, G.; Ganesan, S.; Madabhushi, A. Manifold learning with graph-based features for identifying extent of lymphocytic infiltration from high grade, her2+ breast cancer histology. 2008. Available online: http://www. miaab. org/miaab-2008-papers/27-miaab-2008-paper-21.pdf (accessed on 1 March 2010).
- Graham, R.L.; Hell, P. On the history of the minimum spanning tree problem. Ann. Hist. Comput. 1985, 7, 43–57. [Google Scholar] [CrossRef]
- Gurcan, M.N.; Boucheron, L.E.; Can, A.; Madabhushi, A.; Rajpoot, N.M.; Yener, B. Histopathological image analysis: A review. IEEE Rev. Biomed. Eng. 2009, 2, 147–171. [Google Scholar] [CrossRef] [PubMed]
- Kiang, T. Random fragmentation in two and three dimensions. Z. Astrophys. 1966, 64, 433–439. [Google Scholar]
- Aurenhammer, F. Voronoi diagrams—A survey of a fundamental geometric data structure. ACM Comput. Surv. 1991, 23, 345–405. [Google Scholar] [CrossRef]
- Schindelin, J.; Rueden, C.T.; Hiner, M.C.; Eliceiri, K.W. The imagej ecosystem: An open platform for biomedical image analysis. Mol. Reprod. Dev. 2015, 82, 518–529. [Google Scholar] [CrossRef] [PubMed]
- Schindelin, J.; Arganda-Carreras, I.; Frise, E.; Kaynig, V.; Longair, M.; Pietzsch, T.; Preibisch, S.; Rueden, C.; Saalfeld, S.; Schmid, B.; et al. Fiji: An open-source platform for biological-image analysis. Nat. Methods 2012, 9, 676–682. [Google Scholar] [CrossRef] [PubMed]
- Ojala, T.; Pietikäinen, M.; Harwood, D. A comparative study of texture measures with classification based on featured distributions. Pattern Recognit. 1996, 29, 51–59. [Google Scholar] [CrossRef]
- Li, W.; Chen, C.; Su, H.; Du, Q. Local binary patterns and extreme learning machine for hyperspectral imagery classification. IEEE Trans. Geosci. Remote Sens. 2015, 53, 3681–3693. [Google Scholar] [CrossRef]
- Nosaka, R.; Fukui, K. Hep-2 cell classification using rotation invariant co-occurrence among local binary patterns. Pattern Recognit. 2014, 47, 2428–2436. [Google Scholar] [CrossRef]
- Zhao, G.; Pietikainen, M. Dynamic texture recognition using local binary patterns with an application to facial expressions. IEEE Trans. Pattern Anal. Mach. Intell. 2007, 29, 915–928. [Google Scholar] [CrossRef] [PubMed]
- Ahonen, T.; Hadid, A.; Pietikäinen, M. Face recognition with local binary patterns. In Proceedings of the Computer Vision-Eccv 2004, Prague, Czech Republic, 11–14 May 2004; pp. 469–481. [Google Scholar]
- Yorulmaz, O.; Oğuz, O.; Akhan, E.; Tuncel, D.; Atalay, R.Ç.; Çetin, A.E. Multi-resolution super-pixels and their applications on fluorescent mesenchymal stem cells images using 1-d sift merging. In Proceedings of the 2015 IEEE International Conference on Image Processing (ICIP), Quebec, QC, Canada, 27–30 September 2015; pp. 2495–2499. [Google Scholar]
- Oğuz, O.; Akbaş, C.E.; Mallah, M.; Taşdemir, K.; Güzelcan, E.A.; Muenzenmayer, C.; Wittenberg, T.; Üner, A.; Cetin, A.; Atalay, R.Ç. Mixture of learners for cancer stem cell detection using cd13 and h and e stained images. In Proceedings of the SPIE Medical Imaging, International Society for Optics and Photonics, San Diego, CA, USA, March 2016. [Google Scholar]
- Ojala, T.; Pietikainen, M.; Maenpaa, T. Multiresolution gray-scale and rotation invariant texture classification with local binary patterns. IEEE Trans. Pattern Anal. Mach. Intell. 2002, 24, 971–987. [Google Scholar] [CrossRef]
- Ahonen, T.; Hadid, A.; Pietikainen, M. Face description with local binary patterns: Application to face recognition. IEEE Trans. Pattern Anal. Mach. Intell. 2006, 28, 2037–2041. [Google Scholar] [CrossRef] [PubMed]
- Lowe, D.G. Distinctive image features from scale-invariant keypoints. Int. J. Comput. Vis. 2004, 60, 91–110. [Google Scholar] [CrossRef]
- Biomax. Available online: http://www.biomax.us/tissue-arrays.
- Vedaldi, A.; Fulkerson, B. Vlfeat: An open and portable library of computer vision algorithms. In Proceedings of the 18th ACM international conference on Multimedia, Firenze, Italy, 25–29 October 2012. [Google Scholar]
Figure 1.
LBP algorithm binary code extraction.

Figure 2.
A single feature vector construction process in 1-D SIFT algorithm.

Figure 3.
H&E stained liver cancerous (a,b) and normal (c) images.


Table 1.
Keypoint Matching (KM) and Efficient Nearest Neighbor Indexing (ENNI) Classification Accuracies.
Table 1.
Keypoint Matching (KM) and Efficient Nearest Neighbor Indexing (ENNI) Classification Accuracies.
| Experiment | KM (%) | ENNI (%) |
|---|---|---|
| Experiment I | 77.97 | 77.97 |
| Experiment II | 79.95 | 79.73 |
| Experiment III | 82.15 | 82.15 |
| Experiment IV | 88.12 | 88.10 |
Publisher’s Note: MDPI stays neutral with regard to jurisdictional claims in published maps and institutional affiliations. |
© 2018 by the authors. Licensee MDPI, Basel, Switzerland. This article is an open access article distributed under the terms and conditions of the Creative Commons Attribution (CC BY) license (https://creativecommons.org/licenses/by/4.0/).
Share and Cite
MDPI and ACS Style
Oğuz, O.; Çetin, A.E.; Atalay, R.Ç. Classification of Hematoxylin and Eosin Images Using Local Binary Patterns and 1-D SIFT Algorithm. Proceedings 2018, 2, 94. https://doi.org/10.3390/proceedings2020094
AMA Style
Oğuz O, Çetin AE, Atalay RÇ. Classification of Hematoxylin and Eosin Images Using Local Binary Patterns and 1-D SIFT Algorithm. Proceedings. 2018; 2(2):94. https://doi.org/10.3390/proceedings2020094
Chicago/Turabian StyleOğuz, Oğuzhan, A. Enis Çetin, and Rengul Çetin Atalay. 2018. "Classification of Hematoxylin and Eosin Images Using Local Binary Patterns and 1-D SIFT Algorithm" Proceedings 2, no. 2: 94. https://doi.org/10.3390/proceedings2020094