Risk of Climate Change Impacts on Drought and Forest Fire Based on Spatial Analysis and Satellite Data †


Ho Chi Minh City University of Technology, Vietnam National University, 268 Ly Thuong Kiet Street, District 10 Ho Chi Minh City, Vietnam
*
Author to whom correspondence should be addressed.
†
Presented at the 2nd International Electronic Conference on Water Sciences, 16–30 November 2017; Available online: http://sciforum.net/conference/ecws-2.
Proceedings 2018, 2(5), 189; https://doi.org/10.3390/ecws-2-04959
Published: 18 January 2018
(This article belongs to the Proceedings of The 2nd International Electronic Conference on Water Sciences)
Abstract
:Drought is considered a serious disaster after floods and typhoons and is tending to increase frequency and intensity due to climate change on a global scale. In addition, droughts also cause large and small fires that occur daily around the world, damaging forests and forest ecosystems and having a significant impact on the economy, society, and people. This paper presents the situation of forest fires in U Minh Ha forest of Ca Mau province, which is the southernmost province of Vietnam. The study used satellite imagery processing, which combined spatial analysis to identify areas of fire sensitivity, in the face of drought risk associated with climate change in the dry season in 2016. AHP hierarchy analysis was performed using factors such as surface temperature, leaf moisture, vegetation cover, vegetation density, the distance to water sources, the distance to residential areas, and the distance to fire protection establishments. The results show that the zone with average fire sensitivity accounted for nearly half of the forest area and is distributed in the south and southwest. The high fire sensitivity area is negligible. The study results are useful for planning strategies to protect forest resources against the drought risk caused by climate change, which is becoming increasingly harsh.
1. Introduction
Following flood and storm, drought is regarded as one of the most devastating disasters and is increasing in frequency and intensity due to global climate change. Drought reduces or disables the ability to meet the water needs of people, plants, and animals, causing serious impacts on the survival and development of the ecosystem. In the context of global warming today, the impact of drought on forests leading to the risk of fire is the most obvious manifestation. The consequences caused by forest fires appear both immediate and long-term in many ways. Especially in tropical forest conditions, the consequence of forest fires is enormous, specifically including [1] forest degradation, land degradation, loss of ecosystems and biodiversity, reducing air quality and causing atmospheric pollution, demolition of water basins, economic damage, and influence on life and human health. Forest fire is one of the causes of negative impacts on forests, the environment, ecology, as well as the economy, society, and people.
The study area is the U Minh Ha forest, a large wetland ecoregion in the Mekong Delta and the whole country, with many species of flora and fauna. Total natural area is 54,254 ha, in which forestry land is 40,576 ha. The terrain is relatively flat. The soil is often flooded during the rainy season and is affected by alum [1]. The weather in the dry season from 2015 to 2016 is relatively complicated. El Nino has negatively impacted the area and caused prolonged heat. Water levels in some canals are depleted, causing difficulties for transportation of means and water for forest fire fighting. At the peak of the dry season (March and April 2016), the U Minh Ha forest area was dry on 43,000 ha with a high fire risk, in which the level IV and V alert equivalent to dangerous and extreme levels occupied up to 43,545.5 ha, and fire could occur at any time [1].
2. Methodology
2.1. Data
The main data used in the study was Landsat 8 satellite image with 8 spectral bands (Bands 1–7 and 9) with a spatial resolution of 30 m; Band 8 (panchromatic) had a resolution of 15 m; 2 thermal bands had a resolution of 30 m (adjusted resolution from 100 m). The scene of 126 path and 53 row was taken on 7 April 2016, representing the end of the dry season (2015–2016) in the study area. The data set is free to download from the USGS earthexplorer.usgs.gov website. In addition, the map data of the study area in the shape file format with a scale of 1:25,000 was also collected for the overlapping calculation.
2.2. Evaluation Method
The study was based on the fire risk index (FRI) model [2], which is determined by the sum of the weighted Fi parameters as follows:
where the component parameters, including type and density of vegetation cover, leaf moisture, surface temperature, and distances to residential areas, water supply, and fire protection establishments, were determined for the study area. These factors are determined from the remote sensing indices and GIS data.
2.2.1. Normalized Difference Vegetation Index
Normalized difference vegetation index (NDVI) represents the density (or freshness) of vegetation coverage on land, which is an important element in research on forest fire [1]. NDVI is calculated from the spectrum of visible and near-infrared light that is reflected by vegetation. Fresh plants absorb most of the visible light and reflect much of the near-infrared light. Sparse or poor vegetation reflects more visible light and less infrared light. The formula for calculating this index is as follows:
where NIR is near-infrared band corresponding with Landsat 8 Band 5; VIS is visible band corresponding with Landsat 8 Band 4. The calculated NDVI for 1 pixel always ranges from −1 to +1. Zero (0) means no vegetation, and nearly +1 indicates the highest possible density of green leaves [3].
2.2.2. Normalized Difference Water Index
Bo-Cai Gao (1996) proposed a normalized difference water index (NDWI), which uses the wavelengths 0.86 and 1.24 µm to determine vegetation humidity. NDWI is sensitive to changes in liquid water content of the vegetation cover, so it can also be called the leaf humidity index. NDWI, compared with NDVI, is less affected by the aerosol scattering phenomenon in an atmosphere. The formula of NDWI was provided by Gao (1996) and is as follows:
where SWIR1 is the shortwave infrared band corresponding with Landsat 8 Band 6 with a wavelength in the range 1.566–1.651 µm. It is an electromagnetic wave that absorbs much water.
2.2.3. Land Surface Temperature
Land surface temperature (LST) is an important parameter in physical interaction between land surface and atmosphere with the exchange process of water and energy [4,5]. LST can be measured from 2 thermal infrared Bands 10 and 11 of the TIRS sensor on the Landsat 8 satellite [6]. LST (Ts) is determined by the Stefan–Boltzmann Law, which is as follows:
where TB is at-satellite brightness temperature and ε is emissivity, where they are determined by Equations (5) and (6), as follows:
where Lλ is the top of the atmosphere radiation (Watts/(m2 * srad * μm)); K1 is the band-specific thermal conversion constant from the metadata (K1_CONSTANT_BAND_x where x is Band 10 or 11); K2 is the band-specific thermal conversion constant from the metadata (K2_CONSTANT_BAND_x where x is Band 10 or 11); εv and εs are the emissivities of full vegetation and bare soil; Pv is the vegetation fraction, calculated by NDVI.
2.2.4. Land Cover
With the same impact of factors such as weather and topography, whether a forest area is prone to fire or not, the rapid or slow spread of fire is highly dependent on the type of land cover and the characteristics of each type of fuel elements in the fire triangle. The U Minh Ha forest includes the following types of land cover (according to data on digitized maps of forest status in Ca Mau in 2015–2016 provided by Ca Mau Forest Protection Department–FPD [1]): the Melaleuca forest at the age of 1, 2, 3, 4, and 5; planted forest without reserve (T0); acacia hybrid; agricultural land; residential land; vacant land; water.
Each land cover type has different potential threats of forest fire. They are given a score ranging from highest to lowest based on their effect level on forest fire. This classification is established by a multi-criteria analysis and survey based on the opinions of experts and people with specialized knowledge on this issue.
2.2.5. Distances to Residential Areas, Water Resources, and Forest Fire Prevention and Fighting Establishments
The distances to residential areas, water resources, and forest fire prevention and fighting establishments are socio-economic and management factors, and for the U Minh Ha forest, their importance in determining the risk of forest fire must not be ignored. The distance from the forest to these three areas will be classified in a range from near to far and rasterized in ArcGIS. This is a tool used to calculate and assign values (in floating point format) to the distance of each raster cell (the vector will be transformed into a raster) to the nearest source in a straight line. The map layers will then be reclassified to assign a new value as an integer (unique value) followed by a weighted overlap with other information classes.
2.2.6. The Analytic Hierarchy Process and Weight Assignment
The analytic hierarchy process (AHP) and weight assignment subdivide a large problem into several sub-problems (or choices) after the relevant effects are considered. Each sub-problem can be divided into several sub-criteria. All of the above components will be graded (or weighted) in accordance with a set of evaluation criteria, i.e., scored from low to high depending on the priority and the level of impact of that factor on the entire problem or on an individual sub-problem. Breaking down a problem and objectively ranking priorities for component issues can be helpful when consulting and getting advice from experts or knowledgeable people in a field of interest [7,8,9,10,11]. The total order method for calculating sets of weights for objects with the formula is as follows:
where wi is the standard weight of the variable layer i; ti is the primary score of variable i; n is the number of variable layers (n = 7); ri is the relative rank corresponding with variable layer i synthesized from surveyed opinion. Then, each variable layer is divided into sub-criteria and scored from 1 to 5 (least influential to most influential) using an equal interval method due to its simplicity and easy-to-use characteristics [2].
3. Results
To determine weight, the research conducted a survey on local forest rangers, officials of the Department of Natural resources and Environment and people with specialized knowledge according to interview questionnaire, which is set up by seven criteria effecting forest fire risk. The results are shown in Table 1 and Table 2.
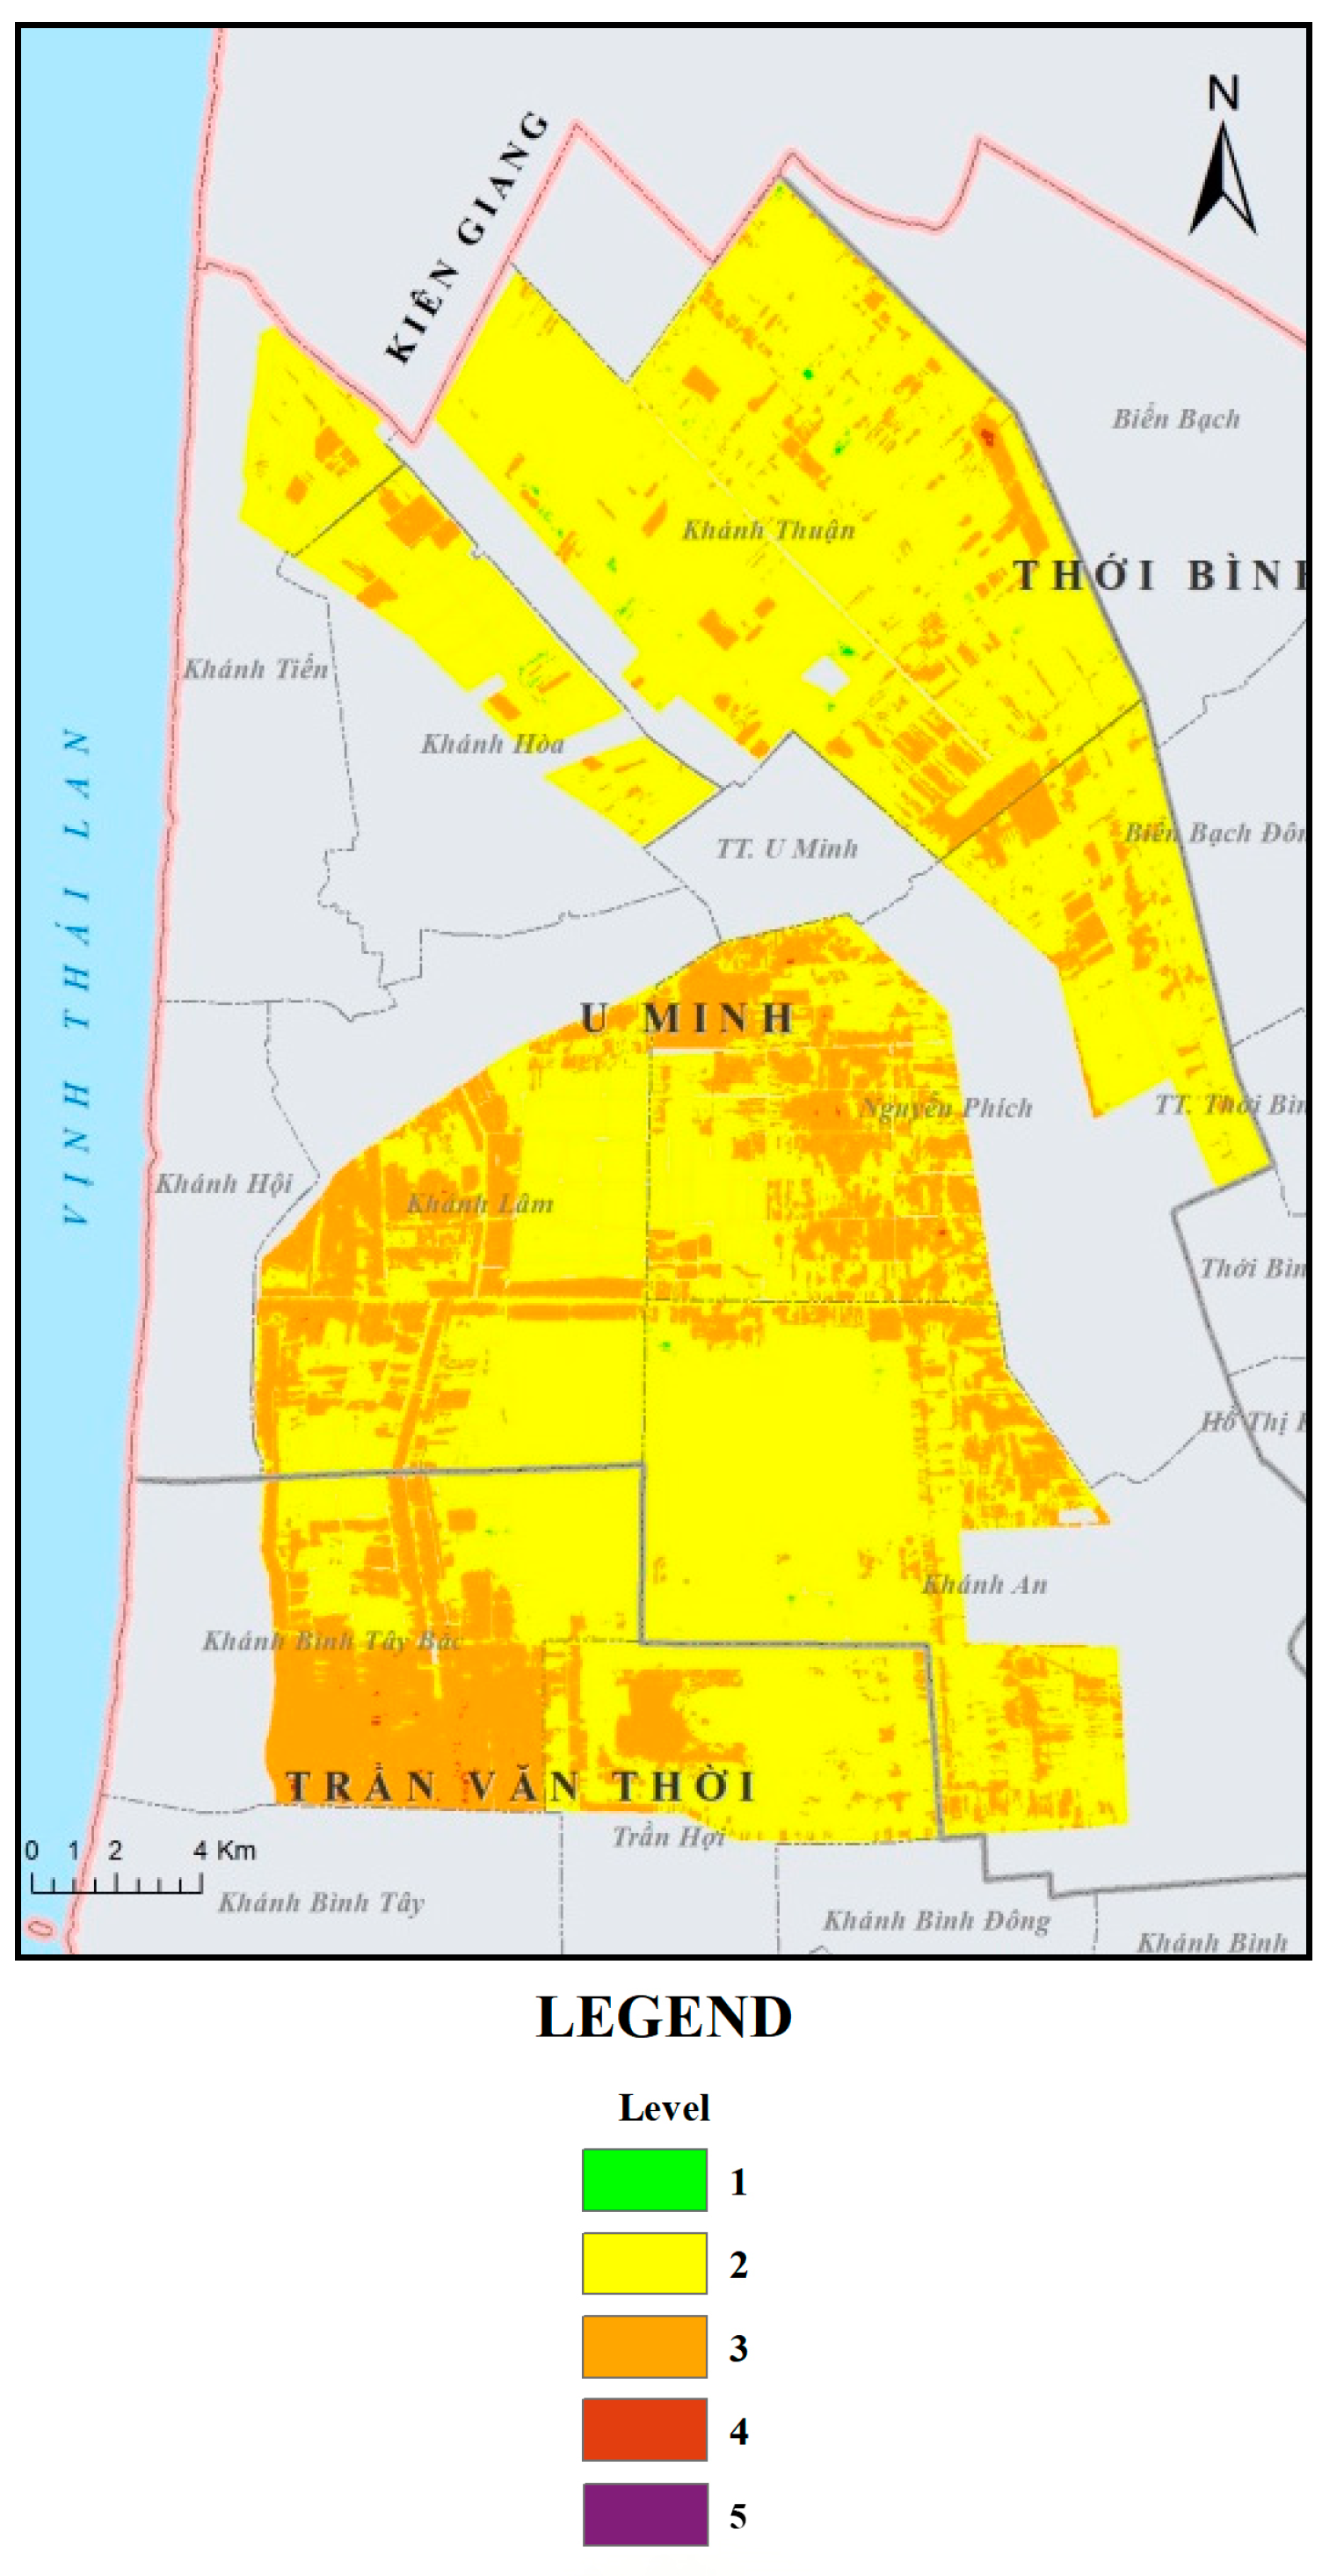
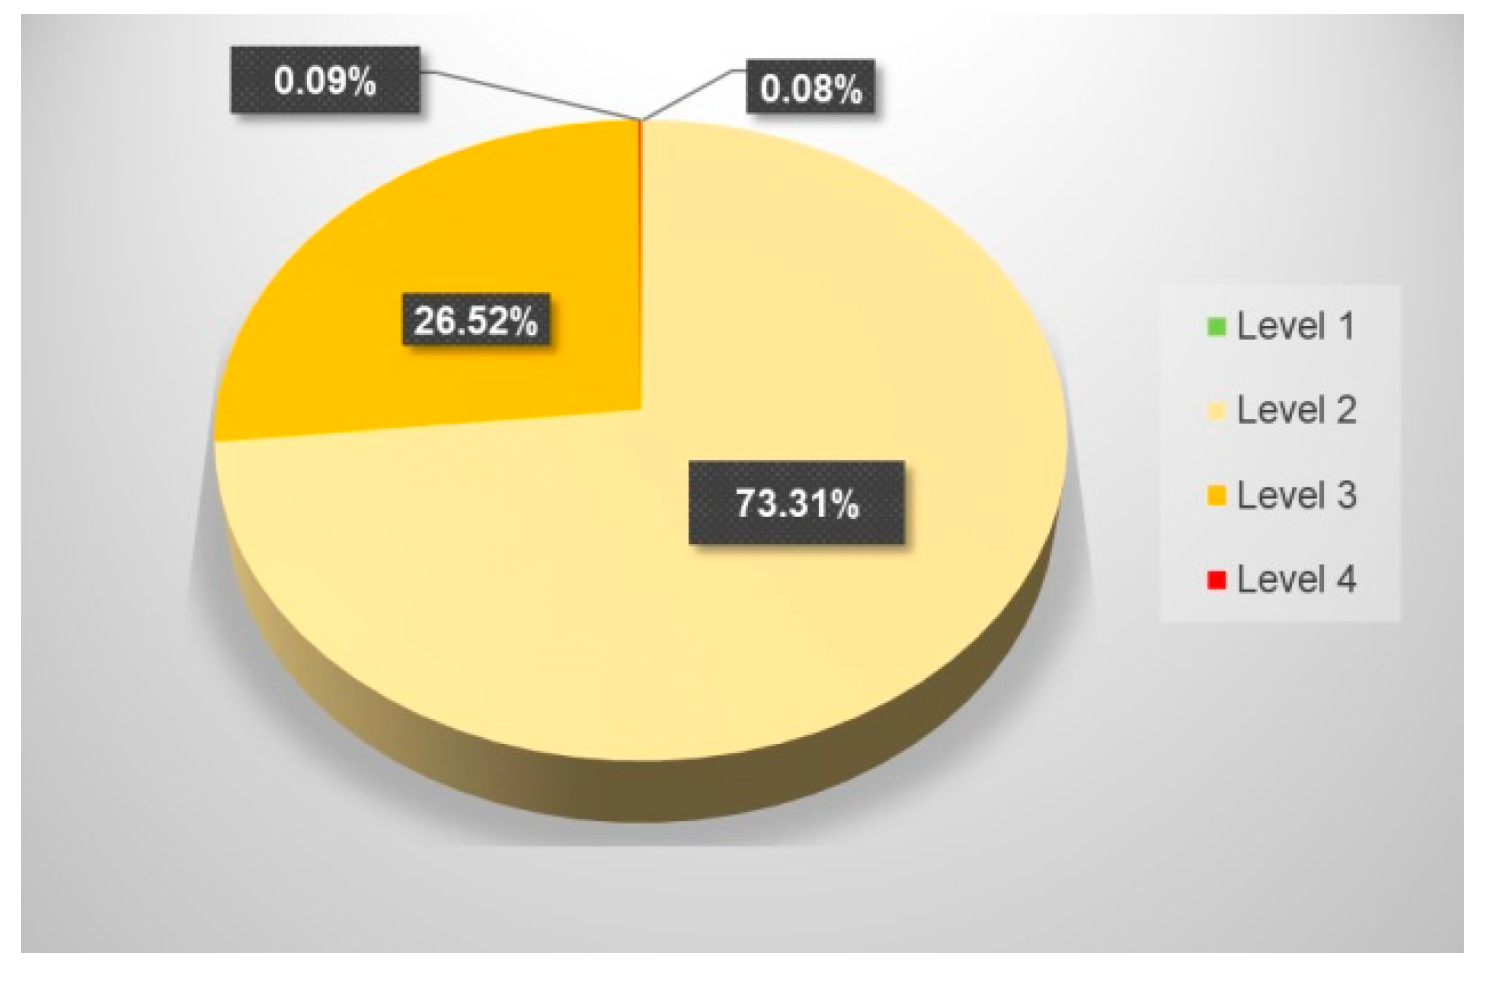
The spatial analysis of the component data layers was performed with ArcGIS software. Each layer was changed to Raster as an integer value before being input to the Weighted Overlay tool. If the original raster data was in a floating point format (continuous value, such as temperature, NDVI, and distance), reclassification had to be implemented on a scale of 5. Next, we entered the weight (% Influence) for each layer. The value per pixel was multiplied by the weight of the layer containing it before it was added to the pixels of the other layers. The results produced a map that contained all criteria corresponding to the fire risk index formula (Figure 1 and Figure 2). The results show that, in the study area, the zone with average fire sensitivity accounts for nearly half of the forest area and is distributed in the south and southwest. The high fire sensitivity area is negligible (Table 3). These study results are useful for planning strategies to protect forest resources against the drought risk caused by climate change, which is now becoming increasingly harsh.
4. Conclusions
In the past, forest fire in the Melaleuca forest deteriorated peat resources and biological diversity in the U Minh Ha forest. In the future, if the abnormal development of climate and consequences from climate changes continue to take place (salty intrusion and extreme weather), protecting biological diversity of the Melaleuca forest’s ecology will be difficult. For example, the saline intrusion causing the death of Melaleuca forests or forest fires has caused a loss of biodiversity. Therefore, this results is very usefull for the managers. It will help them to have further investments in solutions in time to protect the forest from the risk of climate change.
References
- Ca Mau Forest Protection Department. Explanation of Forest Fire Prevention and Fighting Plan in Dry Season 2016–2017 in Ca Mau Province; Ca Mau Forest Protection Department: Ca Mau, Vietnam, 2016. [Google Scholar]
- Ghobadi, G.J.; Gholizadeh, B.; Dashliburun, O.M. Forest fire risk zone mapping from geographic information system in Northern Forests of Iran (Case study, Golestan province). Int. J. Agric. Crop Sci. 2012, 4, 818–824. [Google Scholar]
- Earth Observatory—NASA. Measuring Vegetation (NDVI & EVI): Normalized Difference Vegetation Index (NDVI). Available online: https://earthobservatory.nasa.gov/Features/MeasuringVegetation/measuring_vegetation_2.php (accessed on 5 August 2017).
- Liang, S.; Li, X.; Wang, J. Advanced Remote Sensing: Terrestrial Information Extraction and Applications; Academic Press: Cambridge, MA, USA, 2012. [Google Scholar]
- Zhang, Z.; He, G. Generation of Landsat surface temperature product for China, 2000–2010. Int. J. Remote Sens. 2013, 34, 7369–7375. [Google Scholar] [CrossRef]
- USGS. Landsat 8 (L8) Data Users Handbook. Available online: https://landsat.usgs.gov/landsat-8-l8-data-users-handbook (accessed on 10 February 2016).
- Saaty, T.L. The Analytic Hierarchy Process: Planning, Priority Setting, Resource Allocation; McGraw-Hill International Book Co.: New York, NY, USA, 1980. [Google Scholar]
- Saaty, T.L. Decision Making for Leaders: The Analytical Hierarchy Process for Decisions in a Complex World; Lifetime Learning Publications: Maastricht, The Netherlands, 1982. [Google Scholar]
- Saaty, T.L. Decision making with the analytic hierarchy process. Int. J. Serv. Sci. 2008, 1, 83–98. [Google Scholar] [CrossRef]
- Saaty, T.L.; Alexander, J.M. Conflict Resolution: The Analytic Hierarchy Approach; Praeger: Santa Barbara, CA, USA, 1989. [Google Scholar]
- Saaty, T.L.; Vargas, L.G. Models, Methods, Concepts & Applications of the Analytic Hierarchy Process; Kluwer Academic Publishers: Dordrecht, The Netherlands, 2001. [Google Scholar]
Figure 1.
Forest fire sensitivity map of the U Minh Ha forest in dry season 2015–2016.

Figure 2.
Percentage of area by fire sensitivity level in U Minh Ha forest.


Table 1.
Weight for 7 variable layers.
| Variable Layer | ri | ti | wi (%) |
|---|---|---|---|
| Surface temperature | 1 | 7 | 2500 |
| Leaf humidity | 2 | 6 | 2143 |
| Distance to water resource | 3 | 5 | 1786 |
| Distance to forest fire prevention and fighting works | 4 | 4 | 1429 |
| Vegetation density | 5 | 3 | 1071 |
| Land cover type | 6 | 2 | 714 |
| Distance to residence | 7 | 1 | 357 |
Table 2.
Weight and giving points to sub-criteria.
| Criteria | Weight % | Sub-Criteria | Point |
|---|---|---|---|
| Distance to residence (m) | 3.57 | 0 ÷ 1000 | 5 |
| 1000 ÷ 2000 | 4 | ||
| 2000 ÷ 3000 | 3 | ||
| 3000 ÷ 4000 | 2 | ||
| Over 4000 | 1 | ||
| Surface temperature (°C) | 25.00 | 43.5 ÷ 47.5 | 5 |
| 39.5 ÷ 43.5 | 4 | ||
| 35.5 ÷ 39.5 | 3 | ||
| 31.5 ÷ 35.5 | 2 | ||
| 27.5 ÷ 31.5 | 1 | ||
| Leaf humidity (NDWI) | 21.43 | −1 ÷ −0.142 | 5 |
| −0.142 ÷ −0.008 | 4 | ||
| −0.008 ÷ 0.125 | 3 | ||
| 0.125 ÷ 0.259 | 2 | ||
| 0.259 ÷ 1 | 1 | ||
| Vegetation density (NDVI) | 10.71 | 0.396 ÷ 1 | 5 |
| 0.259 ÷ 0.396 | 4 | ||
| 0.123 ÷ 0.259 | 3 | ||
| −0.014 ÷ 0.123 | 2 | ||
| −1 ÷ −0.014 | 1 | ||
| Land cover type | 714 | Melaleuca ≥ V, IV | 5 |
| Melaleuca III, II, I | 4 | ||
| Acacia hybrid | 3 | ||
| Agricultural land | 2 | ||
| T0, bare land, residence | 1 | ||
| Distance to forest fire prevention and fighting plan (m) | 1429 | Over 3508 | 5 |
| 2631 ÷ 3508 | 4 | ||
| 1754 ÷ 2631 | 3 | ||
| 877 ÷ 1754 | 2 | ||
| 0 ÷ 877 | 1 | ||
| Distance to water resource (m) | 1786 | Over 1279 | 5 |
| 960 ÷ 1279 | 4 | ||
| 640 ÷ 960 | 3 | ||
| 320 ÷ 640 | 2 | ||
| 0 ÷ 320 | 1 |
Table 3.
Area of forest ranking in fire sensitivity level.
| Level | Area (ha) | Ratio (%) |
|---|---|---|
| 1 | 41.58 | 0.08 |
| 2 | 39,115.53 | 73.31 |
| 3 | 14,149.71 | 26.52 |
| 4 | 46.08 | 0.09 |
| 5 | 0 | 0 |
| Tổng | 53,352.90 | 100.00 |
Publisher’s Note: MDPI stays neutral with regard to jurisdictional claims in published maps and institutional affiliations. |
© 2018 by the authors. Licensee MDPI, Basel, Switzerland. This article is an open access article distributed under the terms and conditions of the Creative Commons Attribution (CC BY) license (https://creativecommons.org/licenses/by/4.0/).
Share and Cite
MDPI and ACS Style
Van, T.T.; Tien, T.V.; Toi, N.D.L.; Bao, H.D.X. Risk of Climate Change Impacts on Drought and Forest Fire Based on Spatial Analysis and Satellite Data. Proceedings 2018, 2, 189. https://doi.org/10.3390/ecws-2-04959
AMA Style
Van TT, Tien TV, Toi NDL, Bao HDX. Risk of Climate Change Impacts on Drought and Forest Fire Based on Spatial Analysis and Satellite Data. Proceedings. 2018; 2(5):189. https://doi.org/10.3390/ecws-2-04959
Chicago/Turabian StyleVan, Tran Thi, Tran Viet Tien, Nguyen Duong Lam Toi, and Ha Duong Xuan Bao. 2018. "Risk of Climate Change Impacts on Drought and Forest Fire Based on Spatial Analysis and Satellite Data" Proceedings 2, no. 5: 189. https://doi.org/10.3390/ecws-2-04959