Elasticity Constants of a Two-Phase Tungsten Thin Film †

ICD-LASMIS, Université de Technologie de Troyes, 10000 Troyes, France
*
Author to whom correspondence should be addressed.
†
Presented at the 18th International Conference on Experimental Mechanics, Brussels, Belgium, 1–5 July 2018.
Proceedings 2018, 2(8), 423; https://doi.org/10.3390/ICEM18-05272
Published: 27 May 2018
(This article belongs to the Proceedings of The 18th International Conference on Experimental Mechanics)
Abstract
:The IET was used to determine the macroscopic elasticity constants of the multiphase coating. In order to determine the macroscopic elasticity constants of the film firstly, a critical assessment of Young’s modulus determination was done by comparing all the models proposed in the literature. The best model was identified and a study was performed to identify and quantify the most influent factors on the global uncertainty. Secondly, an enhanced formulation to determine the shear modulus of coating by IET was developed. The methodology was applied on a tungsten thin film deposited by DC magnetron sputtering.
1. Introduction
In order to improve the physicochemical and mechanical properties of a material, new surface treatment processes were developed. Among the most common processes we can mention: PVD, CVD and thermal spray. The elastic properties of thin films are different from those of bulk materials and depend on the technique of elaboration and its parameters. Moreover, a coating is generally polycrystalline, textured and composed of different phases. This makes it necessary to control the elasticity of the coated components.
The present paper proposes a methodology to determine the elasticity constants of a multiphase polycrystalline textured thin film. Firstly, the macroscopic elasticity constants of a coating will be determined by using IET. Therefore, a study of the models proposed in the literature to determine the Young’s modulus of films will be done with a view to identify the best model. Secondly, an uncertainty study will be performed to identify the errors or uncertainty sources and evaluate their contributions. Then an enhanced analytical formulation to determine the shear modulus of thin films will be developed. It is valid for any ratio of coating to substrate thicknesses. Finally, an example of application on a tungsten thin film deposited by DC magnetron sputtering will be presented.
2. Theoretical Background
2.1. Impulse Excitation Technique
The principle of the measurement is to perform a two-steps frequency measurement, a first one for the substrate without deposition and a second one for the coated substrate. Then, knowing the elastic modulus of the substrate, the density of both coating and substrate and the resonance frequencies of the coated beam and the substrate, the Young’s modulus of the coating can be determined through analytical expressions.
2.2. Analytical Models to Determine the Young’s Modulus of a Coating
Lopez has developed a model for a rectangular beam, which does not take into account the shift of the neutral axis after deposition (Equation (1)) [1].
Pautrot and Mazot, in their model, take into account the shift of the neutral axis (Equation (2)) [2]:
where: is the Young’s modulus and the indices c and s mean respectively the coating and the substrate, , , , .
Berry’s model (Equation (6)) [3] is a simplified approach which can be obtained from the first order Taylor series expansion of either Pautrot’s or Lopez’s model.
The CLBT model is based on the Classical Laminated Beam Theory [4]:
For a one layer coating (substrate + coating):
A divergence between Berry’s and Lopez’s models has been noticed by Mazot [1] for a thicknesses ratio in the order of . Moreover, the difference between the models becomes larger for higher ratios. To analyze quantitatively the differences between the models, a comparison with a finite element model, taken as a reference, will be performed to assess the trueness of the method. Then, an uncertainty analysis will be done to compare the behavior of the different models with regard to their sensitivity to various uncertainty sources.
3. Results and Discussion
3.1. Identification of the Best Model to Measure Young’s Modulus
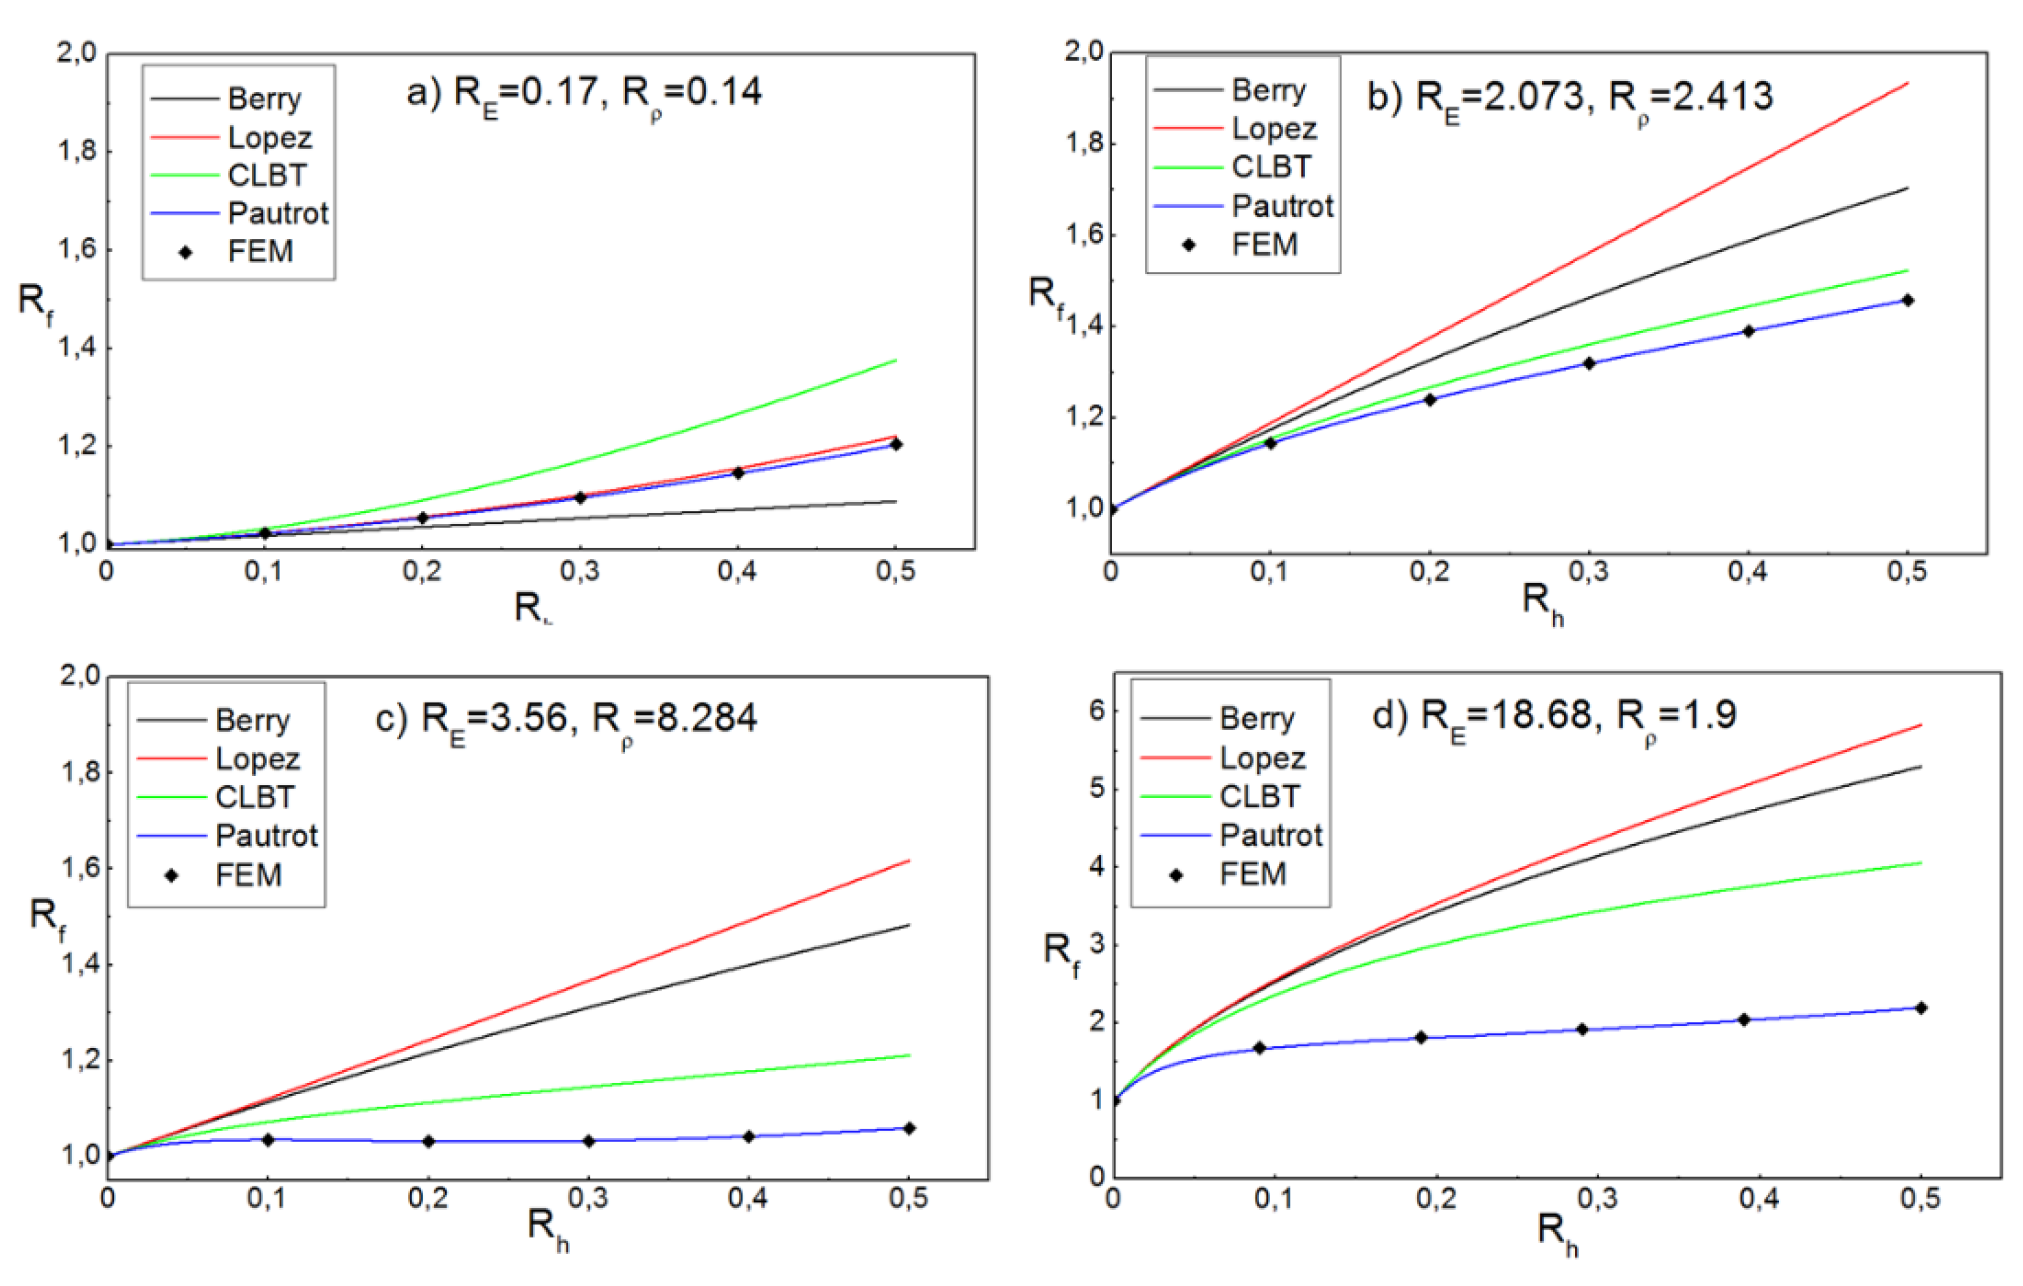
In order to identify the best model, a parametric comparison of the analytical models with the developed finite element model (more details can be found in [5]) was done as a function of the thickness ratio , the Young’s modulus ratio and the density ratio . Four different and ratios were chosen and was varied from to . Figure 1 represents the evolution of the frequency ratio as a function of , and ratios. A good agreement between the Pautrot’s model and the Finite Element Model (FEM) for any , and ratios can be seen. The divergence of the other models can be clearly seen and it may be due to the different assumptions on which is based each model. Based on these results, Pautrot’s model is recommended to determine the Young’s modulus of coatings.
3.2. Uncertainty Analysis
The uncertainty analysis was performed following the guidelines of the Guide to the expression of uncertainty in measurement [6]. More explanation about the uncertainty calculation can be found in our previous work [5]. The results of an example of application on an aluminum thin film deposited on a steel substrate are listed in Table 1. From Table 1, we can conclude that the main sources of uncertainty are the density and the thickness of the coating and the frequency before and after deposition.
3.3. Shear Modulus
The principle of the measurement is the same that used to determine the Young’s modulus. The shear modulus can be determined using Gadaud’s model (Equation (11)) [7]:
where: , , , , is the first torsional resonance frequency of the whole bilayer beam. G, h, b and are respectively the shear modulus, thickness, width and density. The indices c and s mean respectively the coating and the substrate.
This model is valid only if the thickness of the coating is very small compared to that of the substrate. It does not take into account the shift of the neutral axis after deposition. We developed a new formulation considering the shift of the neutral axis; applicable with any shear moduli, thicknesses and density ratios. The proposed relation was established thanks to the application of the Hamilton’s principle based on the minimization of the strain and kinetic energy [8] (Equation (12)):
where:
To check the reliability of the developed formulation, a comparison between Gadaud’s model, the new enhanced formulation and the FEM was done (Figure 2). The comparison was performed with a combination of four different and ratios with variation of the ratio between and . From Figure 2, a good agreement between the FEM and the new formula can be seen.
3.4. Determination of the Macroscopic Elasticity Constants
The Pautrot’s model and the new enhanced formulation have been applied to determine the macroscopic elasticity constants of a tungsten thin film deposited on glass substrates by DC magnetron sputtering (Table 2). For more details about the deposition parameters, the reader can refer to our previous work [8]. The resonance frequencies of the substrate and coated beam have been determined using the IET. The uncertainty analysis was performed following the methodology detailed in our previous work [5]. The elasticity constants are listed in Table 2. The uncertainty on the substrate and coating elasticity constants are respectively presented in Table 3 and Table 4.
4. Conclusions
In order to obtain the macroscopic elasticity moduli of a film, we have applied literature models after measurements by the IET. We have identified the best model and have done an uncertainty analysis to determine the sensitivity of the models to the different sources of errors. Then we have developed a new formulation to determine the shear modulus.
Tungsten film has been deposited by DC magnetron sputtering and the macroscopic elasticity constants of the coating have been determined by IET.
Acknowledgments
The authors would like to thank the co-founders of CEMAV project: Région Grand Est/Champagne Ardenne and the European Union (Fond Européen de Développement Régional).
References
- Mazot, P.; Pautrot, S. Détermination du module d’Young de dépôts par flexion dynamique: Application aux systèmes bicouche et tricouche. Ann. Chim. Sci. Mater. 1998, 23, 821–827. [Google Scholar] [CrossRef]
- Pautrot, S.; Mazot, P. Mesures par méthode dynamique du module d’Young du dépôt de chrome sur un acier allié. Rev. Met. Paris 1993, 90, 1665–1672. [Google Scholar] [CrossRef]
- Berry, B.S.; Pritchet, W.C. Vibrating reed internal friction apparatus for films and foils. IBM J. Res. Dev. 1975, 19, 334–343. [Google Scholar] [CrossRef]
- López-Puerto, A.; Oliva, A.I. A vibrational approach to determine the elastic modulus of individual thin films in multilayers. Thin Solid Films 2014, 565, 228–236. [Google Scholar] [CrossRef]
- Slim, M.F.; Alhussein, A.; Billard, A.; Sanchette, F.; François, M. On the determination of Young’s modulus of thin films with impulse excitation technique. J. Mater. Res. 2016, 32, 497–511. [Google Scholar] [CrossRef]
- JCGM 100 (The Joint Committee for Guides in Metrology). Evaluation of Measurement Data—Guide to the Expression of Uncertainty in Measurement; JCGM: Paris, France, 2008. [Google Scholar]
- Gadaud, P.; Milhet, X.; Pautrot, S. Bulk and coated materials shear modulus determination by means of torsional resonant method. Mater. Sci. Eng. A 2009, 521–522, 303–306. [Google Scholar] [CrossRef]
- Slim, M.F.; Alhussein, A.; Sanchette, F.; Guelorget, B.; François, M. An enhanced formulation to determine the Young’s and shear moduli of thin films by means of Impulse Excitation Technique. Thin Solid Films 2017, 631, 172–179. [Google Scholar] [CrossRef]
Figure 1.
Comparison between analytical and numerical models for different Young’s modulus and density ratios: (a) ; (b) ; (c) ; (d) .
Figure 1.
Comparison between analytical and numerical models for different Young’s modulus and density ratios: (a) ; (b) ; (c) ; (d) .

Figure 2.
Evolution of the frequency ratio as a function of the thicknesses ratio for: (a) ; (b) ; (c) ; (d) .
Figure 2.
Evolution of the frequency ratio as a function of the thicknesses ratio for: (a) ; (b) ; (c) ; (d) .


Table 1.
Contribution of each uncertainty source (in GPa and %) on the coating Young’s modulus uncertainty.
Table 1.
Contribution of each uncertainty source (in GPa and %) on the coating Young’s modulus uncertainty.
| Pautrot | Lopez | Berry | CLBT | ||||||
|---|---|---|---|---|---|---|---|---|---|
| GPa | % | GPa | % | GPa | % | GPa | % | ||
| repeatability | |||||||||
| Microphone position | |||||||||
| Misalignment error | |||||||||
| Repeatability | |||||||||
| Microphone position | |||||||||
| Misalignment error | |||||||||
Table 2.
Elasticity constants of the glass substrates and the as-deposited tungsten film.
| Sample | ||||||
|---|---|---|---|---|---|---|
| 1 | .0 | |||||
| 2 |
Table 3.
Uncertainties on the glass substrate elasticity constants obtained by IET.
| Sample | ||||||
|---|---|---|---|---|---|---|
| GPa | % | GPa | % | % | ||
| 1 | ||||||
| 2 | ||||||
Table 4.
Uncertainties on the coating elasticity constants obtained by IET.
| Sample | ||||||
|---|---|---|---|---|---|---|
| GPa | % | GPa | % | % | ||
| 1 | 5.43 | |||||
| 2 | 5.39 | |||||
Publisher’s Note: MDPI stays neutral with regard to jurisdictional claims in published maps and institutional affiliations. |
© 2018 by the authors. Licensee MDPI, Basel, Switzerland. This article is an open access article distributed under the terms and conditions of the Creative Commons Attribution (CC BY) license (https://creativecommons.org/licenses/by/4.0/).
Share and Cite
MDPI and ACS Style
Slim, M.F.; Alhussein, A.; François, M. Elasticity Constants of a Two-Phase Tungsten Thin Film. Proceedings 2018, 2, 423. https://doi.org/10.3390/ICEM18-05272
AMA Style
Slim MF, Alhussein A, François M. Elasticity Constants of a Two-Phase Tungsten Thin Film. Proceedings. 2018; 2(8):423. https://doi.org/10.3390/ICEM18-05272
Chicago/Turabian StyleSlim, Mohamed Fares, Akram Alhussein, and Manuel François. 2018. "Elasticity Constants of a Two-Phase Tungsten Thin Film" Proceedings 2, no. 8: 423. https://doi.org/10.3390/ICEM18-05272