Blast Loading of Concrete Pipes Using C-4 Charges †


1
Structural Impact Laboratory (SIMLab), Department of Structural Engineering, Norwegian University of Science and Technology (NTNU), NO-7491 Trondheim, Norway
2
Norwegian Defence Estates Agency (NDEA), NO-0103 Oslo, Norway
*
Author to whom correspondence should be addressed.
†
Presented at the 18th International Conference on Experimental Mechanics (ICEM18), Brussels, Belgium, 1–5 July 2018.
Proceedings 2018, 2(8), 428; https://doi.org/10.3390/ICEM18-05292
Published: 8 June 2018
(This article belongs to the Proceedings of The 18th International Conference on Experimental Mechanics)
Abstract
:The E39 coastal highway route in Norway is envisioned a future without ferries. A submerged floating tunnel built in concrete has been suggested as a means of crossing wide and deep fjords. Blast loading against this type of structure could have disastrous consequences, and potentially cause the collapse of the entire structure. To investigate the response of tubular concrete structures subjected to blast loading, standard off-the-shelf unreinforced concrete pipes were tested using live explosives. A plastic explosive was used to generate the load, and the tests were filmed by two synchronised high-speed cameras. Three pressure sensors equidistant from the charge position logged the pressure. Further, three different positions for the charges were used to investigate the effect of charge position. The charge size was varied for each position to find the amount of explosives needed to breach the pipe. It was found that a contact charge detonated from the outside requires almost twice the explosive amount to breach the pipe than a contact charge detonated from the inside, suggesting a significant confinement effect. Numerical simulations using finite elements produced good qualitative results.
1. Introduction
The Norwegian Public Roads Administration (NPRA) has initiated a large research project regarding a potentially ferry-free coastal highway route E39 from Trondheim to Kristiansand [1]. Part of this route involves crossing some wide and deep fjords, where one of the considered crossing alternatives is a Submerged Floating Tunnel (SFT) built in concrete [2]. The SFT concept involves several challenges, ranging from fluid-structure interaction [3] to ship impact [4]. Another major concern is internal blast loading from accidents involving tankers transporting dangerous cargo like liquid natural gas or gasoline, or from terrorist attacks.
Several studies have investigated blast loading against general plane concrete structures, such as beams [5] or slabs [6,7]. Few studies have considered blast loading against tubular concrete structures, hence a partial goal of this study is to expand the available experimental database on this topic. To this end, plain concrete pipes were loaded by C-4 charges from one of three different positions: (i) centrically placed in the cross-section, (ii) in contact with the pipe wall on the inside, and (iii) in contact with the pipe wall on the outside. Spherical charges were used for the first case, while cubic charges were used to ensure proper contact in the latter two cases.
Another goal of the study is to investigate how well finite element (FE) simulations are able to reproduce some of the experimental results. The commercially available code ABAQUS/Explicit [8] has been used to carry out simulations for the case with centrically placed charges. The simulations were Lagrangian only, and the ConWep approach [8] based on experimental data [9] was used to describe the load. Given the fairly simple numerical model, the results were good qualitatively. For future numerical studies of this problem, a technique for including the confinement of the pressure should be included, as well as a more in-depth calibration of the material model.
2. Concrete Pipes
The test specimens were commercially available off-the-shelf plain concrete pipes originally intended for drainage. Reinforced pipes are outside the scope of the current study. Because these plain concrete pipes are mass produced, the geometric and material properties are very similar between the specimens. The producer routinely samples the concrete and conducts cube compression tests at different stages of the curing process. Samples taken 1 day, 7 days and 28 days after casting gave cube compressive strengths fc of 38.2 MPa, 64.1 MPa and 83.3 MPa, respectively. The water/cement ratio was 0.37, and the maximum aggregate size was 8 mm. An estimate for the mass density was made to approximately 2600 kg/m3.
A sketch of the pipe geometry is shown in Figure 1, where the pipe is cut to show the charge. An additional sketch showing the three different charge positions on the cross-section is included on the right. These are (i) centrically placed, (ii) in contact with the pipe on the inside, and (iii) in contact with the pipe on the outside. The total length ℓ of each pipe is 1560 mm, and it has an internal diameter Di = 200 mm and pipe wall thickness tw = 41 mm, thus making the outer diameter Do = 282 mm. At the pipe ends, the geometry is altered to enable construction of a long, continuous drainage pipeline.
3. Blast Load Testing
3.1. Test Setup
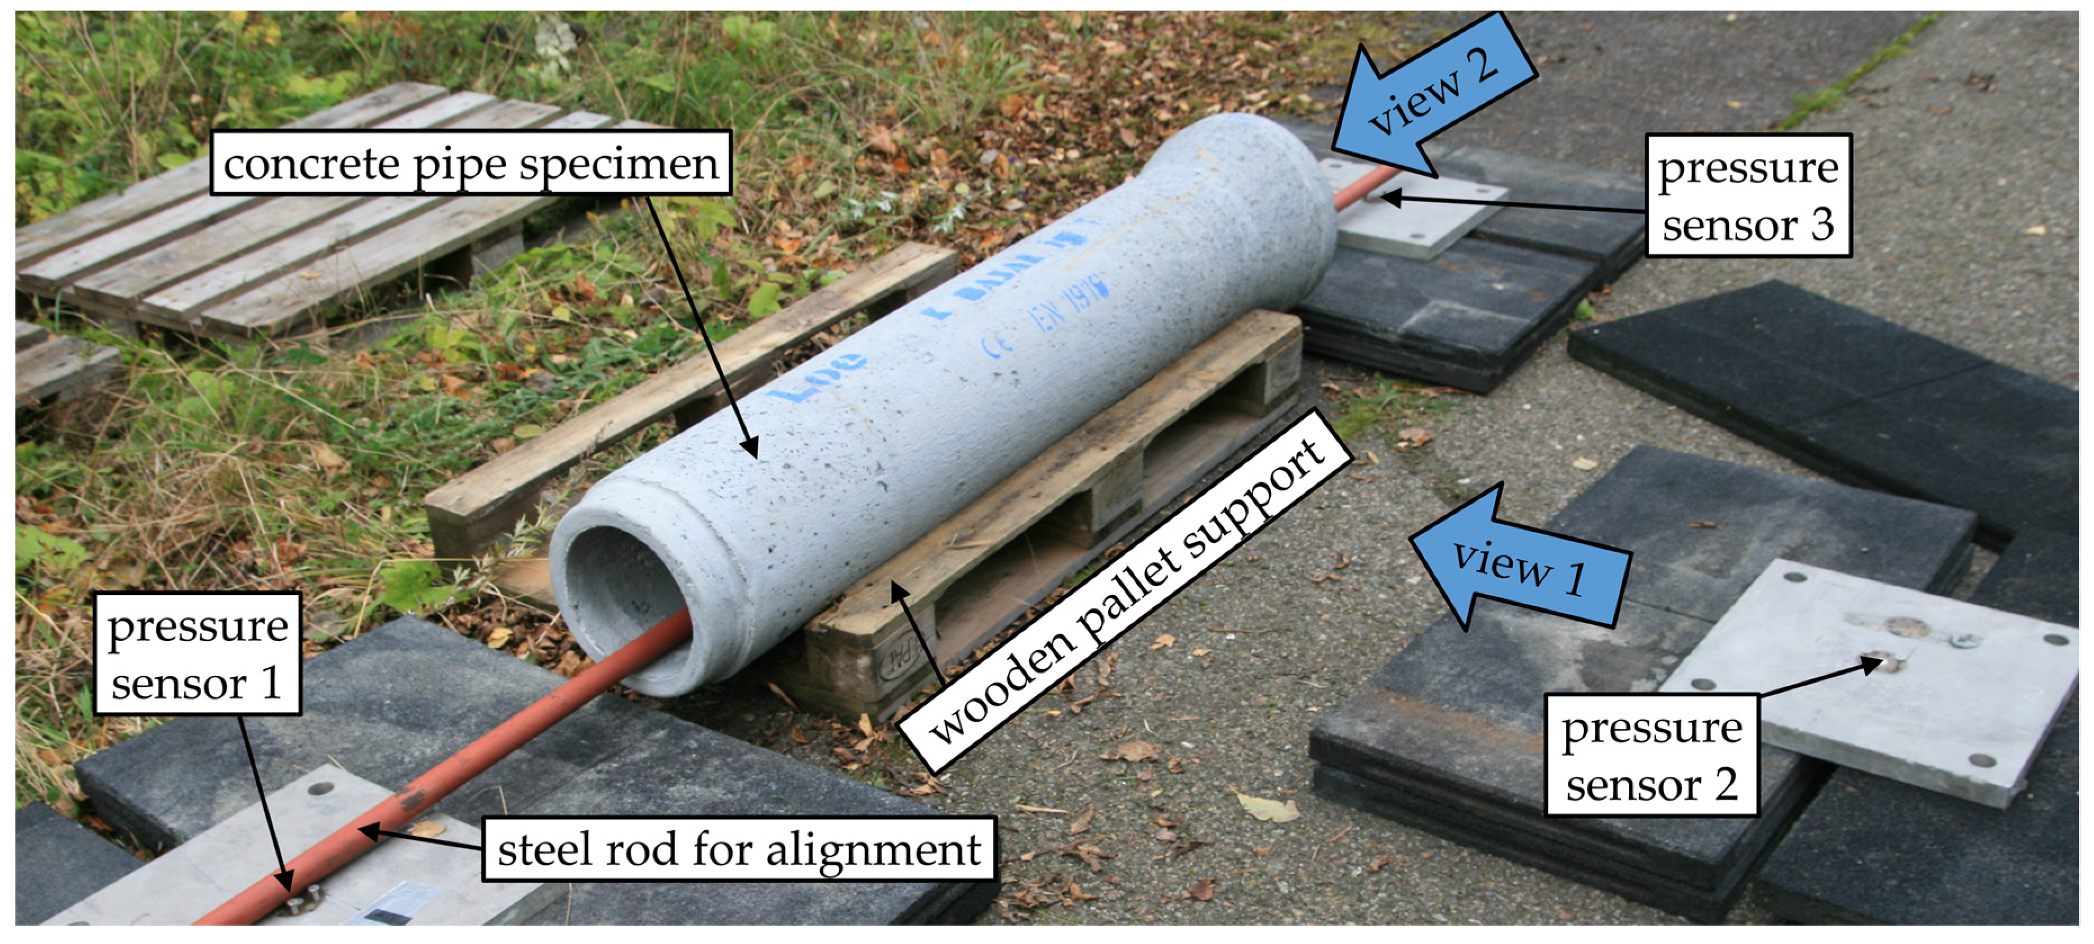
A picture of the test setup is shown in Figure 2. During testing, the concrete pipes rested on a wooden pallet which provided continuous support and prevented the pipes from rolling. Three Kistler piezo-electric pressure sensors at equidistant points from the charge (approximately 1315 mm) were used to record the pressure at a sampling rate of 1 MHz. Sensors 1 and 3 were placed along the main axis of the pipe, while sensor 2 was placed at the same distance from the charge, perpendicular to the main axis. A steel rod was used to align sensors 1 and 3 with the pipe. The pressure sensors were flush mounted on 400 × 400 × 30 mm aluminium plates, thus making sure that they stay in place. The blue arrows in Figure 2 show the direction of the camera views. Two synchronised Phantom v2012 high-speed cameras capturing images at a rate of 22000 frames per second filmed from within protective containers. The C-4 charges placed in the centre of the cross-section were spherical, and placed on a styrofoam support. The contact charges were shaped as cubes for firm contact, and a styrofoam spring was used to ensure contact for the inside contact charges. To ensure proper contact for the outside charges, the detonator cord was tightened to put a slight stress on the charge. The C-4 charges were moulded around the detonator, which is equivalent to approximately 1.0 g of C-4. The detonator is an electrically ignited blasting cap, and the same type was used for all tests.
In total, 10 concrete pipes were tested (identified by roman numerals) using charge masses W ranging from 5.0 g to 15.0 g (see Table 1). The standoff distance R, meaning the distance from the charge position to the target, is half the inner diameter, which is 100 mm for the centrically placed spherical charges. From W and R, the Hopkinson-Cranz scaled distance Z is obtained,
Uncertainties in blast load predictions increase rapidly as Z decreases, but measurements of reflected pressure and impulse at Z = 0.32 m∙kg1/3 suggest that the scaling law is applicable for this value of Z and above [10]. The tests herein (Z > 0.42 m∙kg1/3) are therefore close to the edge of the validity range, and should be used with care. For the contact charges, the notion of a scaled distance does not make sense, as the standoff distance is zero. Table 1 shows the experimental matrix. The maximum pressures recorded among the three sensors 1, 2 and 3 in each experiment are listed in Table 1 as P1, P2 and P3, respectively.
3.2. Experimental Results
For the smallest centrically placed charge (10.0 g in position (i)), no cracks were noted in the pipe. Increasing the charge size to 12.5 g produced long longitudinal surface cracks along the pipe, but no through-thickness cracks were noted. The pipe maintained its integrity and remained in one piece. A charge of 13.5 g caused the pipe to break into few and large oblong pieces and fragments. Increasing the charge size beyond this would most likely produce more fragments of smaller size. The end sections of the concrete pipes remained whole, so the fragmentation was confined to the central area of the pipe closest to the charge (see the left part of Figure 3).
Charge positions (i), (ii) and (iii) had one overlapping charge size, namely 10.0 g C-4, which produced very different results. For position (i), the pipe remained intact for a 10.0 g charge. Shifting to position (ii), 10.0 g C-4 broke the pipe into several large pieces (similar to what was observed for 13.5 g in position (i)). In the third and final position, a 10.0 g charge produced cratering on both the inside and outside, but no through-thickness cracks.
From position (i), 13.5 g C-4 was needed to breach the pipe and cause through-thickness cracks. It was observed that a cubic contact charge of mass 6.0 g was sufficient to create damage through the thickness of the pipe wall from the inside, while from the outside this amount had to be increased to 12.5 g. The damage mode for the pipe after a detonation in position (iii) was quite distinct compared with position (i) and (ii) as illustrated in Figure 3. When loaded from the inside (position (i) and (ii)), the pipe always broke into several pieces given a sufficiently large charge. Charges placed on the outside of the pipe never broke the pipe into pieces, but produced a crater underneath the charge on both sides of the pipe wall. Increasing the charge on the outside produced a hole through the thickness, but no fragmentation.
Curves of the pressure time histories from the three tests with 10.0 g C-4 are plotted in Figure 4. It shows that the data from position (iii) differs both qualitatively and quantitatively from the other two positions, which produced similar data. The pressure recordings from sensors 1 and 3 were consistent among each other, where larger charges gave larger pressures. Where the charge size difference was 1.0 g, it was difficult to discern the different pressure-time histories. Readings from pressure sensor 2 were fluctuating, and it was hard to extract any useful information from it (see Figure 4).
4. Numerical Simulations
4.1. Numerical Setup
The numerical simulations were conducted using the commercially available finite element programme ABAQUS/Explicit [8]. Only position (i) from the experiments have been simulated, because the ConWep module used to generate the load is based on experimental data from spherical (and hemispherical) charges some distance from the target [9]. Hence, the ConWep approach is not valid for contact charges. The approach works by applying a pressure-time curve to a specified surface (the inside of the pipe) based on the charge size, the distance to the charge, and the angle between the surface normal and the vector directed towards the charge [8]. The aim of this numerical study is then to see how well the finite element simulations are able to recreate the experiments using charge position (i), and will therefore be a mainly qualitative study.
The pipe was meshed by 8-node linear brick elements with reduced integration. An element size of about 10 mm was used (about 55000 elements in total), offering a fair compromise between speed and accuracy [6]. The “concrete damage plasticity model” in ABAQUS [8], based on the work by Lubliner et al. [11] and Lee and Fenves [12], was used to represent the concrete material. The calibration was based on previsously obtained material data [6,13], and scaled according to the data provided by the manufacturer. The material has separate damage parameters for compressive and tensile damage. No particular boundary conditions were applied because this is a fast transient problem. A reference point at the centre of the pipe cross-section was specified as the source of the blast, thus corresponding to charge position (i). The simulated time was 1.5 ms.
4.2. Simulation Results
In general, the qualitative results were encouraging. The damage pattern of long longitudinal cracks observed in the experiments was replicated by the simulations as shown in Figure 5. The legend indicates the tensile damage, ranging from 0.0 (no damage) to 1.0 (maximum damage). The tensile damage close to the charge is high, and extends as “cracks” from the central area. As expected, larger charge sizes produce a larger damaged area in the centre of the pipe. For 15.0 g and 20.0 g C-4, the damaged areas are quite similar, but for the latter there are more and longer “cracks” (see parts (c) and (d) of Figure 5).
While the qualitative results are good, the quantitative predictions of the model are not exact. A charge of 13.5 g C-4 was needed to breach the pipe from position (i) in the experiments, and this amount was approximately halved in the simulations. The main reason for this is probably due to the calibration of the material model. These simulations take only a few minutes to run, which means that a decent estimate can be obtained relatively quickly.
5. Concluding Remarks
Based on the experimental results, detonating a charge either on the inside or on the outside of a concrete pipe produces significantly different responses. When detonating from the inside, cracks along the main axis of the pipe develop and the pipe breaks into oblong pieces (for a sufficiently large charge). Charges placed in contact with the pipe on the outside produced only cratering on the pipe wall, and, for a large enough charge, a hole. This suggests a confining effect for internal detonations, as much more of the charge energy is transferred to the pipe. To produce through-thickness damage, a charge size of 13.5 g was needed for position (i), 6.0 g for position (ii), and 12.5 g for position (iii). When outside, less energy is transferred to the pipe and the pressure generated is free to escape in several directions. This is illustrated in the pressure recordings from Figure 4.
The numerical simulations gave good qualitative data. The ConWep approach does not account for internal reflections and confinement inside the pipe, and is thereby somewhat limited. Still, decent estimates are obtained at low CPU cost. A more detailed calibration of the material model would undoubtedly contribute to more accurate quantitative results.
For future experimental campaigns of this kind, including more pressure sensors along the main axis of pipe would be more useful than sensors perpendicular to it (sensor 2 in this study). With more sensors, it would be possible to validate fluid-structure interaction simulations, which would be a natural extension of the numerical work herein. Testing concrete pipes with and without reinforcement bars would also be a useful investigation. More elaborate material testing could also help improve the calibration of the material model. The end goal is to model a full-scale submerged floating tunnel and make reliable and accurate predictions [13].
Author Contributions
M.K. and T.B. conceived and designed the experiments; M.K. and K.O.H. performed the experiments; M.K. and T.B. analysed the data; K.O.H. contributed plastic explosives and testing equipment; M.K. conducted the numerical simulations; M.K. wrote the paper with input from and proofreading by T.B.
Acknowledgments
The authors would like to thank the Norwegian Public Roads Administration very much for funding through the Ferry-free E39 Coastal Highway Route project. The Norwegian Defence Estates Agency has provided the testing ground and equipment necessary for conducting the experiments herein, for which the authors are very grateful.
Conflicts of Interest
The authors declare no conflict of interest in this study.
References
- Norwegian Public Roads Administration, the E39 Coastal Highway Route. Available online: http://www.vegvesen.no/Vegprosjekter/FerjefriE39/English (accessed on 16 April 2018).
- Eidem, M.; Minoretti, A.; Sekse, J.H. Proposal for a submerged floating tube bridge as part of the Bømlafjord crossing. In Proceedings of the 19th Congress of the International Association for Bridge and Structural Engineering (IABSE), Stockholm, Sweden, 21–23 September 2016; p. Stock-0470-2016-R1. [Google Scholar]
- Remseth, S.; Leira, B.J.; Okstad, K.M.; Mathisen, K.M.; Haukås, T. Dynamic response and fluid/structure interaction of submerged floating tunnels. Comput. Struct. 1999, 72, 659–685. [Google Scholar] [CrossRef]
- Xiang, Y.; Yang, Y. Spatial dynamic response of submerged floating tunnels under impact load. Mar. Struct. 2017, 53, 20–31. [Google Scholar] [CrossRef]
- Peroni, M.; Solomos, G.; Caverzan, A.; Larcher, M.; Valsamos, G. Assessment of dynamic mechanical behaviour of reinforced concrete beams using a blast simulator. EPJ Web Conf. 2015, 94. [Google Scholar] [CrossRef]
- Kristoffersen, M.; Pettersen, J.E.; Aune, V.; Børvik, T. Experimental and numerical studies on the structural response of normal strength concrete slabs subjected to blast loading. Eng. Struct. 2018, in press. [Google Scholar] [CrossRef]
- Oña, M.; Morales-Alonso, G.; Gálvez, F.; Sánchez-Gálvez, V.; Cendón, D. Analysis of concrete targets with different kinds of reinforcements subjected to blast loading. EPJ Spec. Top. 2016, 225, 265–282. [Google Scholar] [CrossRef]
- SIMULIA. ABAQUS 6.14 Online Documentation; Dassault Systèmes: Vélizy-Villacoublay, France, 2014. [Google Scholar]
- Kingery, C.N.; Bulmash, G. Technical Report ARBRL-TR-02555: Airblast Parmeters from TNT Spherical Air Burst and Hemispherical Surface Burst; Aberdeen Proving Ground, Maryland; Defense Technical Information Center: Alexandria, VA, USA, 1984. [Google Scholar]
- Conrath, E.J.; Krauthammer, T.; Marchand, K.A.; Mlakar, P.F. Structural Design for Physical Security, 2nd ed.; American Society of Civil Engineers: Reston, VA, USA, 1999; pp. 2–7 and 2–8. [Google Scholar]
- Lubliner, J.; Oliver, J.; Oller, S.; Oñate, E. A plastic-damage model for concrete. Int. J. Solids Struct. 1989, 25, 299–326. [Google Scholar] [CrossRef]
- Lee, J.; Fenves, G.L. Plastic-damage model for cyclic loading of concrete. J. Eng. Mech. 1998, 124, 892–900. [Google Scholar] [CrossRef]
- Kristoffersen, M.; Minoretti, A.; Børvik, T. Submerged floating tunnels subjected to internal blast loading. In Proceedings of the 7th Transport Research Arena (TRA), Vienna, Austria, 16–19 April 2018; p. 11360. [Google Scholar]
Figure 1.
The concrete pipe geometry and a spherical centrically placed charge are shown on the left, while the cross-section and the three different charge positions are shown on the right.
Figure 1.
The concrete pipe geometry and a spherical centrically placed charge are shown on the left, while the cross-section and the three different charge positions are shown on the right.
Figure 2.
Picture of the experimental setup.

Figure 3.
General damage pattern from the three charge positions: (i) left, (ii) centre, and (iii) right.
Figure 3.
General damage pattern from the three charge positions: (i) left, (ii) centre, and (iii) right.
Figure 4.
Pressure-time histories from tests with charge size 10.0 g at positions (i), (ii) and (iii), where part (a) shows data from sensor 1, part (b) from sensor 2, and part (c) from sensor 3.
Figure 4.
Pressure-time histories from tests with charge size 10.0 g at positions (i), (ii) and (iii), where part (a) shows data from sensor 1, part (b) from sensor 2, and part (c) from sensor 3.
Figure 5.
Tensile damage pattern from numerical simulations of blast loaded concrete pipes using charge position (i), where the charge size is (a) 5.0 g, (b) 10.0 g, (c) 15.0 g, and (d) 20.0 g.
Figure 5.
Tensile damage pattern from numerical simulations of blast loaded concrete pipes using charge position (i), where the charge size is (a) 5.0 g, (b) 10.0 g, (c) 15.0 g, and (d) 20.0 g.

Table 1.
Experimental matrix sorted by charge position and charge weight W.
| Pipe ID | Charge Position | R [mm] | W [g] | Z [m∙kg1/3] | P1 [bar] | P2 [bar] | P3 [bar] | Comment |
|---|---|---|---|---|---|---|---|---|
| III | (i) | 100 | 10.0 | 0.464 | 1.68 | 0.21 | 2.22 | Intact |
| IV | (i) | 100 | 12.5 | 0.431 | 2.13 | 0.24 | 2.64 | Surface cracks |
| VI | (i) | 100 | 13.5 | 0.420 | 2.10 | 0.17 | 2.69 | Large pcs. |
| VIII | (ii) | 0 | 5.0 | - | 1.19 | 0.16 | 1.44 | Scabbing, spalling |
| XV | (ii) | 0 | 6.0 | - | 1.23 | 0.28 | 1.49 | Broke in two, spall |
| IX | (ii) | 0 | 7.5 | - | 1.31 | 0.28 | 1.71 | Large pieces, spall |
| VII | (ii) | 0 | 10.0 | - | 1.39 | 0.18 | 2.02 | More, smaller pcs. |
| XI | (iii) | 0 | 10.0 | - | 0.35 | 0.45 | 0.33 | Crater in and out |
| XVI | (iii) | 0 | 12.5 | - | 0.47 | 1.14 | 0.89 | Small hole |
| XII | (iii) | 0 | 15.0 | - | 0.28 | 0.81 | 0.57 | A bit bigger hole |
Publisher’s Note: MDPI stays neutral with regard to jurisdictional claims in published maps and institutional affiliations. |
© 2018 by the authors. Licensee MDPI, Basel, Switzerland. This article is an open access article distributed under the terms and conditions of the Creative Commons Attribution (CC BY) license (https://creativecommons.org/licenses/by/4.0/).
Share and Cite
MDPI and ACS Style
Kristoffersen, M.; Hauge, K.O.; Børvik, T. Blast Loading of Concrete Pipes Using C-4 Charges. Proceedings 2018, 2, 428. https://doi.org/10.3390/ICEM18-05292
AMA Style
Kristoffersen M, Hauge KO, Børvik T. Blast Loading of Concrete Pipes Using C-4 Charges. Proceedings. 2018; 2(8):428. https://doi.org/10.3390/ICEM18-05292
Chicago/Turabian StyleKristoffersen, Martin, Knut Ove Hauge, and Tore Børvik. 2018. "Blast Loading of Concrete Pipes Using C-4 Charges" Proceedings 2, no. 8: 428. https://doi.org/10.3390/ICEM18-05292