Use of Spectral Entropy for Damage Detection in Masonry Buildings in the Presence of Mild Seismicity †


1
Department of Structural, Geotechnical and Building Engineering, Politecnico di Torino, 10129 Turin, Italy
2
Department of Architecture and Design, Politecnico di Torino, 10125 Turin, Italy
*
Author to whom correspondence should be addressed.
†
Presented at the 18th International Conference on Experimental Mechanics (ICEM18), Brussels, Belgium, 1–5 July 2018.
Proceedings 2018, 2(8), 432; https://doi.org/10.3390/ICEM18-05288
Published: 4 June 2018
(This article belongs to the Proceedings of The 18th International Conference on Experimental Mechanics)
Abstract
:The seismic events that struck central Italy in 2016 caused severe damage to a wide range of buildings and infrastructures. Masonry buildings were particularly affected, even for low values of peak ground acceleration. In this paper, the data recorded for three masonry buildings belonging to the Seismic Observatory of Structures (OSS) network are used to detect their seismic damage by means of Spectral Entropy (SE). However, entropy measures are sensitive to the energy inserted in the system, since an input of energy can lead to a more deterministic behavior of the structure and thus to a reduction of the entropy indicator. When non-stationary time series are used to evaluate the presence of damage (e.g. mild seismicity) the entropy of the system could be underestimated, leading to misleading results. For these reasons, in this paper an indicator based on SE is proposed to assess the occurrence of damage also in the presence of mild seismicity.
1. Introduction
The evaluation of the structural integrity of a building is one of the principal aims of permanent structural health monitoring (SHM) systems. The continuous monitoring of strategic buildings and structures has become a popular tool in engineering practice, especially because it assists their long-term maintenance and management [1]. Within SHM procedures, the ones related to dynamic monitoring allow static and/or dynamic features of the monitored structure to be checked, by measuring the structural response at chosen strategic points. These procedures allow the detection of structural anomalies which may indicate damage. In the present paper, Spectral Entropy (SE) [2], is used to detect the damage in three masonry buildings that were hit by the seismic sequence in central Italy in 2016–2017. These buildings belong to the Seismic Observatory of Structures (OSS) network and their permanent monitoring systems recorded the various seismic events. SE is employed to quantify the level of order/disorder of the time-series, where a non-stationary behavior of the signals is encountered. When damage occurs, the level of SE increases due to the occurrence of irreversible system irregularities, which increase the disorder of the records. At the same time, the introduction of a deterministic behavior, such as that related to the seismic input, decreases the disorder of the records, leading to a lower estimation of SE. The procedure proposed in the present paper allows the employment of SE even for data recorded during mild seismic events, for which the seismic input would differ along the seismic sequence. Due to the seismic wandering related to the amplitude of the input [3], the mild seismic records should be selected far from the main shock events, which can temporarily compromise the capability of damage indicators. The procedure leads to the definition of an entropy indicator, BE, which is a parameter related to the SE-Energy (H-E) curve, where H and E are the SE and the energy of the signals, respectively.
2. Materials and Methods
SE [2], has been widely applied in mechanical engineering [4], as well as in clinical and biological studies [5], where there is the need to analyze pathological behaviors of complex phenomena (e.g., heartbeat). SE use the Time-Frequency distribution (TFD) of a signal x(t) to build a probabilistic distribution, P(q), as follows:
where S(r,q) is the power spectrogram of the signal. By assuming an entropy measure, it is then possible to evaluate the entropy over the probabilistic distribution calculated with Equation (1). In the present paper we assume the Shannon entropy measure in information theory:
and thus, H represents the Shannon SE of the signal x(t). In Equations (1) and (2) r and q are natural positives numbers related to the time, t, and the frequency axis, f, by: t = tsr and f = frq, where ts is the sampling time and fr the frequency resolution. The energy of the signal is instead defined by the well-known relation: . Since entropy, as stated previously, can be affected by the presence of the seismic input, in the present paper we analyze the trend of H with respect to E for each seismic event. H can be fitted following a linear law in the ln(H/E) − ln(E) plane:
The linear law becomes a power law in the H-E plane:
In Equations (3) and (4), a and b are the fitted parameters of the linear law in the ln(H/E)-ln(E) plane; while (1 + a) and BE are the shape and scaling factors of the power law H(E), respectively. Since the indicator BE can be seen as a normalized SE with respect to a power law of the energy, it is also less sensitive to the presence of a seismic input. BE also provides information about the order/disorder of the records along their energy value. The higher BE is, the higher the disorder of the records for different energy values. The M (number of channels) records have been used to perform the fitting of the n-th seismic event. In a continuous monitoring of the buildings, BE becomes a function of the seismic events, BE = BE(n). If we consider the event n = 1 as the reference configuration of the structure, BEr=BE(1) is assumed to be the reference entropy indicator and it can be used to assess the evolution of the damage by studying the normalized difference between BE(n) and BEr:
In Equation (5), D(n) is the damage index for the event n. A positive value of D indicates the occurrence of damage in the analyzed building with respect to the reference configuration.
3. Case Studies
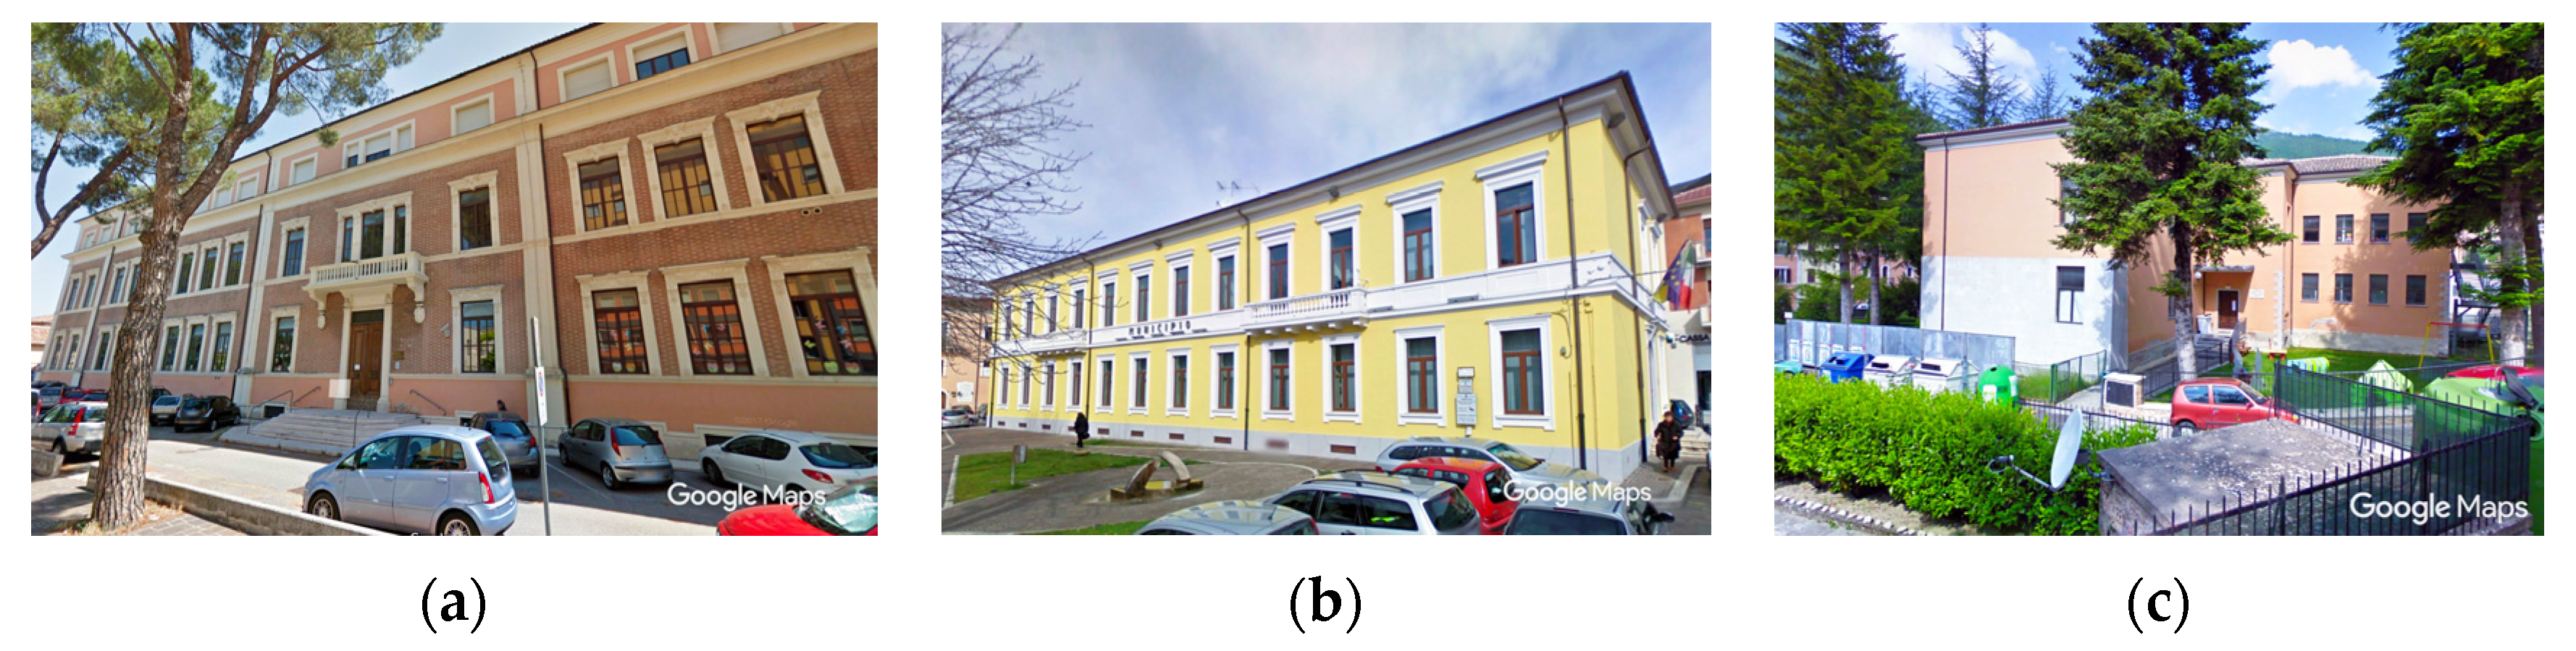
The recent earthquakes that struck Italy highlighted the vulnerabilities of masonry buildings [6,7,8,9]. In this Section, SE is applied to monitored buildings in order to detect the damage that occurred during the various seismic events of the central Italy earthquakes. The selected buildings are the Court of Fabriano (AN), the Town Hall of Pizzoli (AQ) and the School of Visso (MC). All these buildings are part of the network of strategic buildings monitored by the OSS. The OSS, is a nationwide network founded by the Italian Dipartimento della Protezione Civile (DPC) in the 1990s. The aim of the OSS network is to monitor various strategic Italian buildings, such as bridges, schools, hospitals and city halls [10].
Starting from August 2016 a large seismic sequence struck central Italy. Between August 2016 and January 2017 there were 9 seismic events with a magnitude higher than 5.0. In more detail, the earthquake that struck this area on 30 October 2016 (06:40 UTC) had a magnitude of 6.6 [11], which is the largest earthquake in Italy since the Irpinia earthquake that struck southern Italy in 1980, with a magnitude of 6.9. The buildings analyzed have a mixed brick-stone masonry structure and were built between the 1920s and 1940s. Two of them had already been damaged in a previous seismic event. The Town Hall of Pizzoli was slightly damaged in the L’Aquila earthquake in 2009, while the school in Visso was damaged in the Umbria-Marche earthquake in 1997. However, only the school was retrofitted with strengthening interventions [12]. The Court of Fabriano is equipped with 31 accelerometers. The dynamic monitoring system installed on the Pizzoli Town Hall is instead composed of 17 accelerometers [13], while the one installed in the school building in Visso counts 23 accelerometers [12].
Figure 1 and Figure 2 show the three buildings and the observable damage after the seismic sequence, respectively. The OSS permanent monitoring systems allowed the recording of the seismic response of the three masonry buildings before and during this seismic sequence. The available main shocks of this seismic swarm are reported in Table 1, together with the Peak Ground Acceleration (PGA) recorded at the base of each building in the three orthogonal directions.
4. Results and Discussion
As can be seen in Figure 3, H follows a linear law with respect to E in a ln()-ln() plane. This is true for each building and for all the analyzed seismic events. The curves fit the experimental data (centered to 0-mean and scaled to 1-variance) in a least-squares sense. The results of the fitting procedure are reported in Table 2.
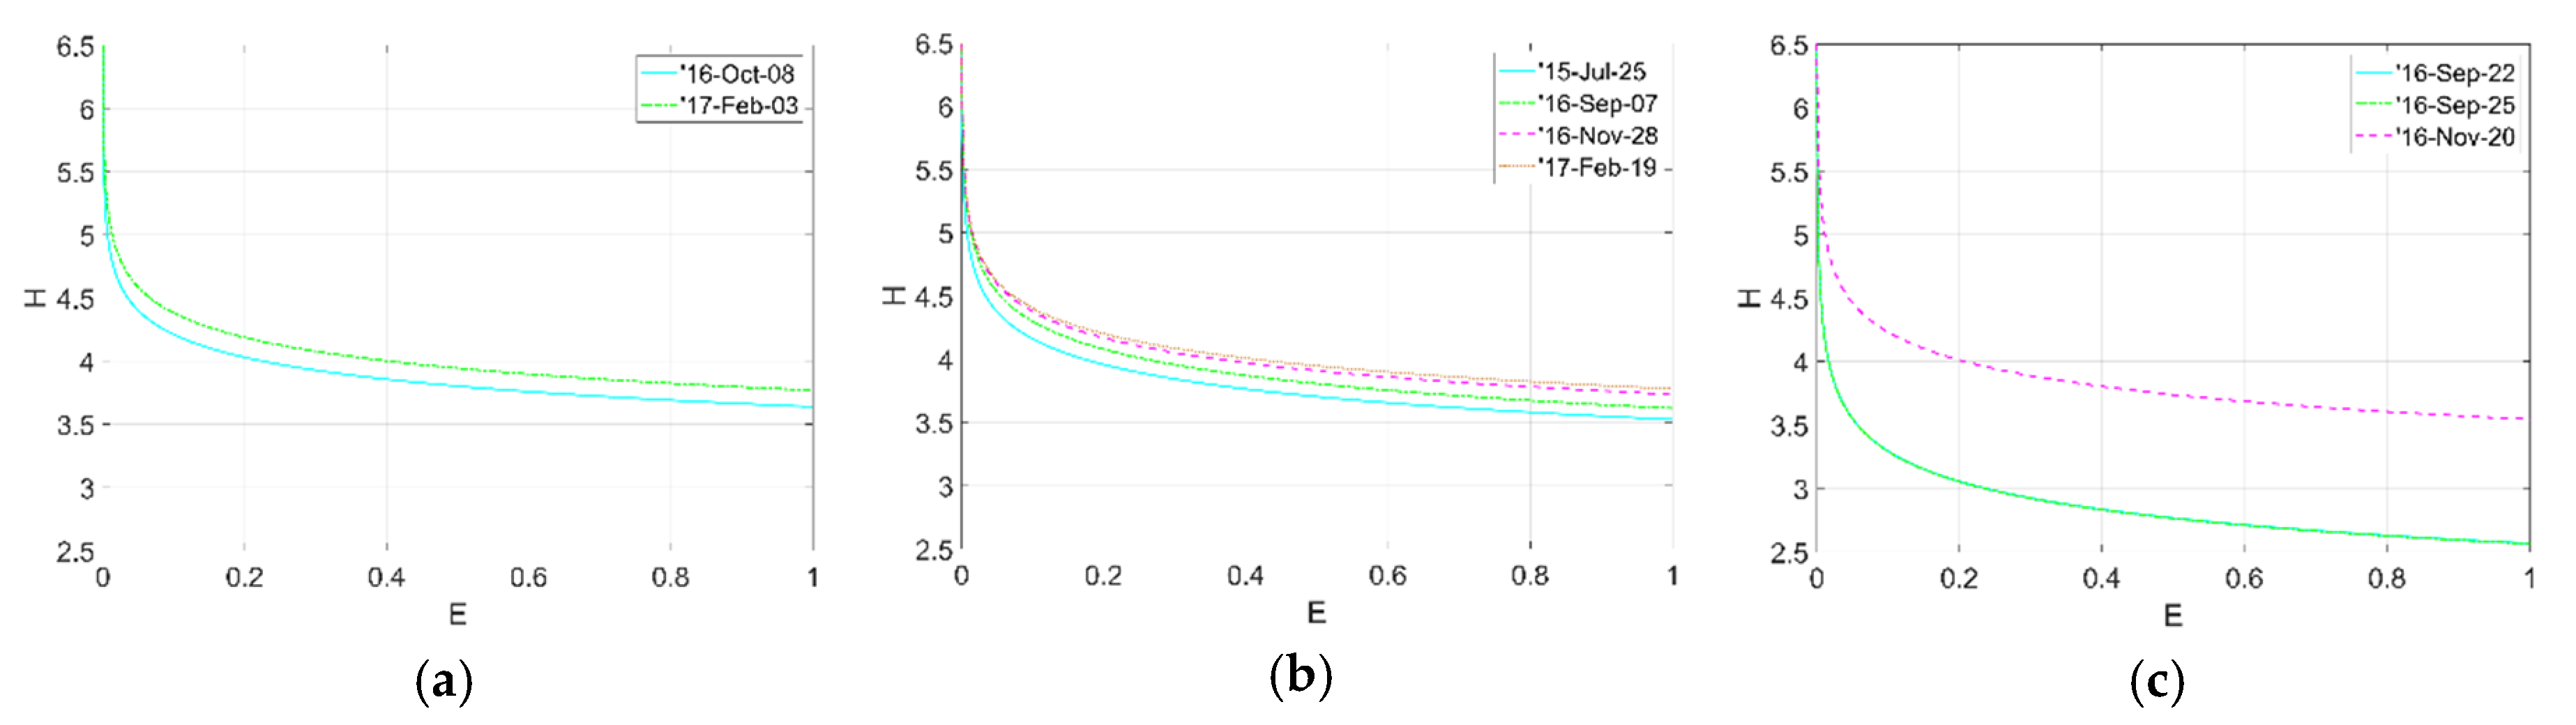
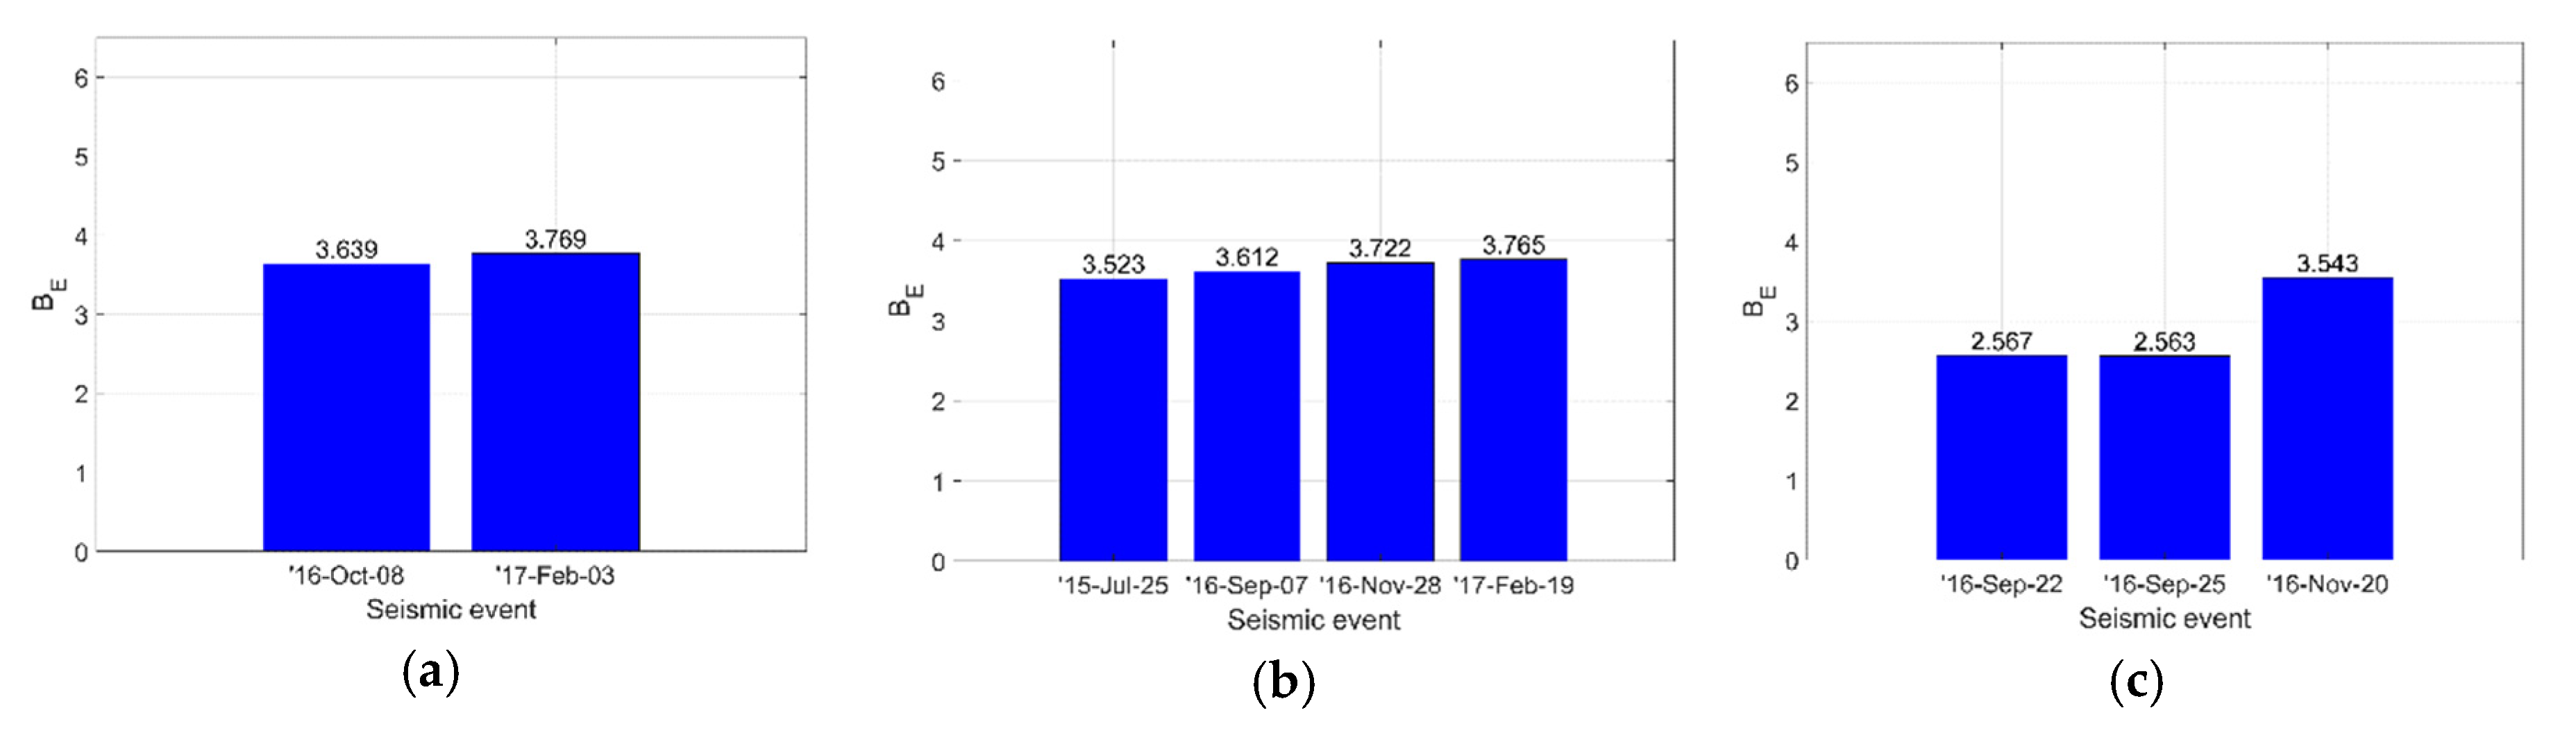
It is now possible to analyze the power law curves of the seismic sequence for the case studies. In Figure 4 it is possible to note how, as the seismic sequence proceeds, the curves tend to higher values of H, in accordance with the occurrence of strong earthquakes during the analyzed period (from 2016-Aug to 2017-Feb) which may have damaged the three buildings. In Figure 4c it is also possible to note how the school building in Visso exhibits the greater difference between the reference curve (2016-Sep-22), and the one at the end of the seismic sequence (2016-Nov-20). The entropy indicator, BE, is then depicted in Figure 5.
It is worth noting that the three buildings exhibit very different results in terms of BE. In more detail, the building in Fabriano is characterized by an almost constant BE. The Town Hall of Pizzoli, instead, exhibits a constant growing trend, while in the case of Visso a strong increase of BE is depicted between 2016-Sep-25 and 2016-Nov-20.
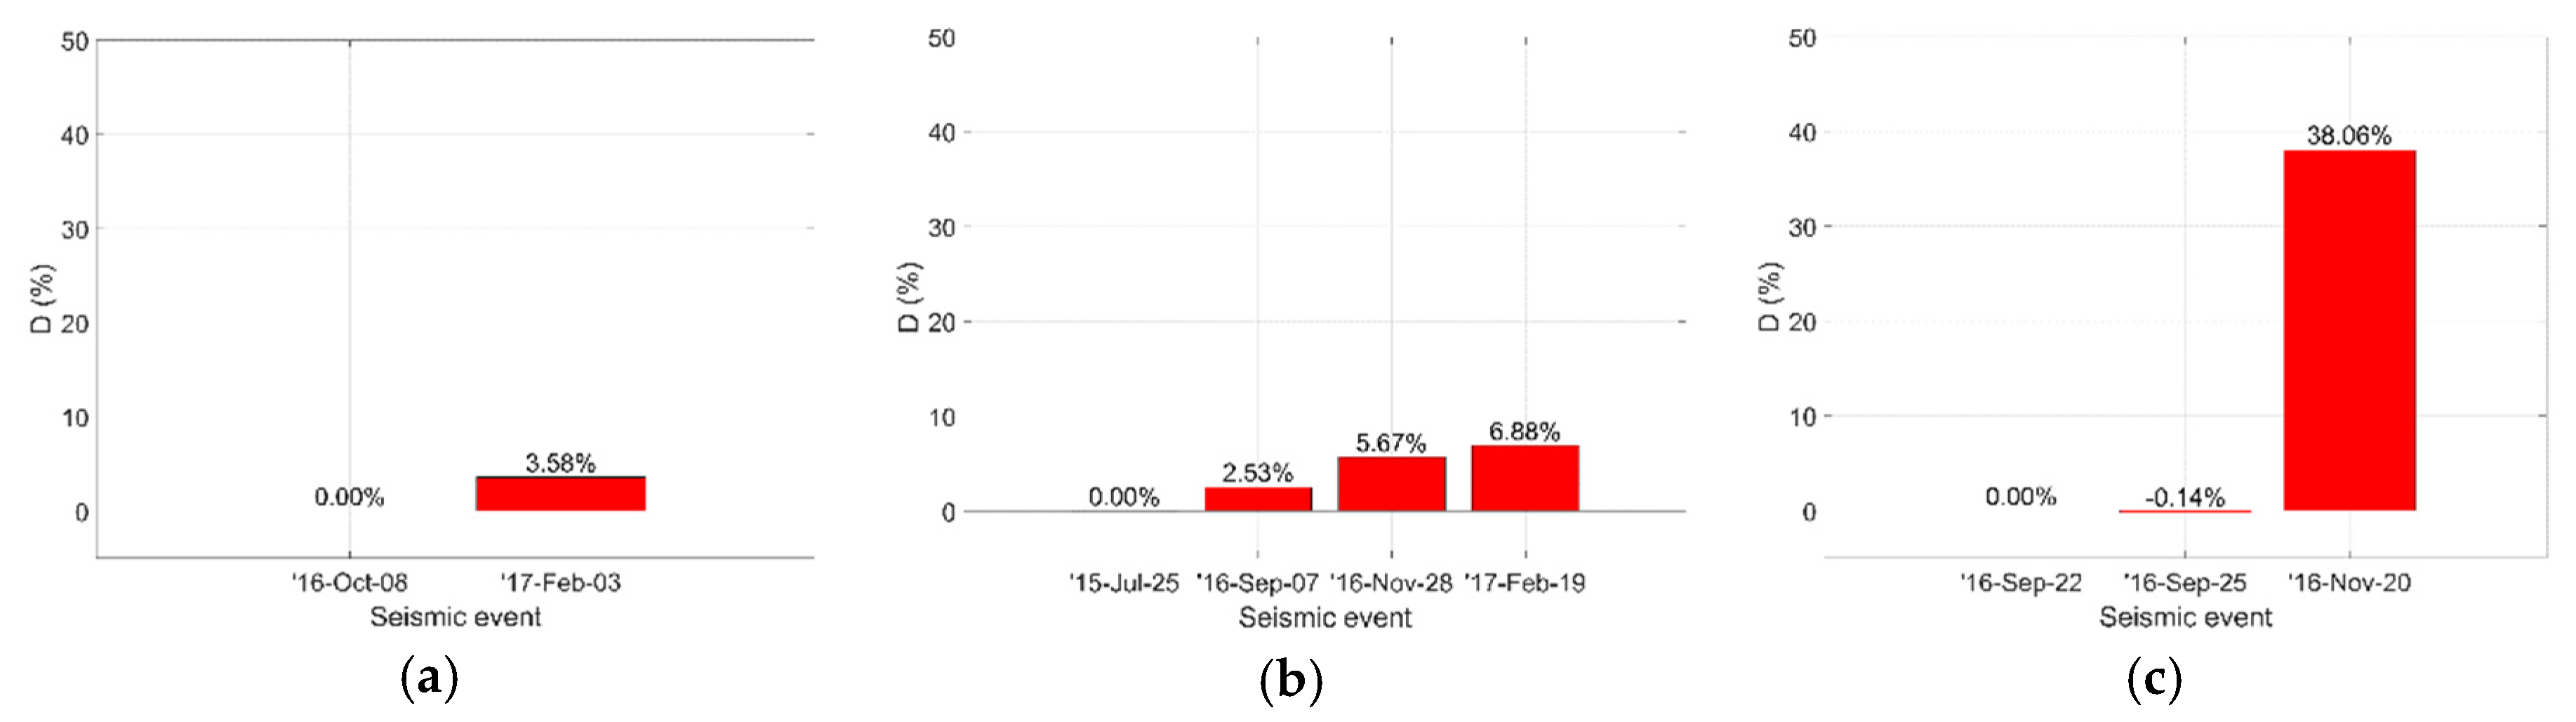
Using Equation (5), it is then possible to calculate the damage index, D, of the three buildings. The index is represented in Figure 6. Since D follows the trend of BE, also in this case the three buildings exhibit very different results. For Fabriano, the damage index increases by about 3.58% after the seismic sequence. Today the building is operating regularly and open to the public. No important damage was detected to the structure following the seismic sequence (from 2016-Aug to 2017-Feb) (Figure 2a), thus the building was considered safe. For the building in Pizzoli, the damage index constantly grows, reaching 6.88% at the end of the seismic sequence. It is important to note that the Town Hall of Pizzoli was affected by various main shocks between each analyzed mild event. The main shocks occurred on 2016-Aug-24a/24b, 2016-Oct-26a/26b, 2016-Oct-30, 2017-Jan-18a/18b/18c/18d and the main increment in D (about 3.14%) occurred between 2016-Sep-07 and 2016-Nov-28, thus after the main shocks of 2016-Oct. The building was temporarily closed after the seismic events for slight damage in the inner walls (Figure 2b). Finally, in the case of Visso, the damage index between 2016-Sep-22 and 2016-Sep-25 is almost zero, in accordance with the fact that between those days no seismic event occurred. On the contrary, a strong increase of D is found with the mild event of 2016-Nov-20 (after the main shocks of 2016-Oct). It is known that after the main events of 2016-Oct the building in Visso showed severe and widespread damage in the entire structure. The D index reaches 38.06% at the end of the seismic sequence. Since then (see Figure 2c), the building has been closed for safety reasons.
5. Conclusions
In the present study, the damage detection for three masonry buildings affected by the central Italy earthquakes in 2016 has been undertaken by means of Spectral Entropy, using the Shannon entropy measure. Since the entropy level can be compromised by the seismic input, an entropy indicator that provides information about the order/disorder of the system at various levels of the energy of the signals is proposed. The damage index, D, calculated by using the entropy indicator, BE, provides results in accordance with the damage observed in the buildings and with the evolution of the seismic sequence for all the case studies. A minor drawback of this method is that it can only be used far from strong seismic events (more than a week), which can temporarily compromise the estimation of the damage index, probably due to the seismic wandering effects. As for future works, an instantaneous estimate of the entropy indicator, BE, could help in providing real-time information on the state of health of the structure.
Author Contributions
R.C. is the head of the local unit of ReLUIS and supervised the work; E.L. and G.M. equally contributed to the paper.
Acknowledgments
This research has been conducted within the activities of the Italian DPCRELUIS 2014-2018 special project “Seismic Observatory of Structures” (OSS) and DPC-RELUIS 2014-2018 PR.1 “Masonry Structures”.
References
- Masciotta:, M.G.; Ramos, L.; Lourenço, P. The importance of structural monitoring as a diagnosis and control tool in the restoration process of heritage structures: A case study in Portugal. J. Cult. Herit. 2017, 27, 36–47. [Google Scholar] [CrossRef]
- Powell, G.; Percival, I. A spectral entropy method for distinguishing regular and irregular motion of Hamiltonian systems. J. Phys. A Gener. Phys. 1979, 12, 2053–2071. [Google Scholar] [CrossRef]
- Ceravolo, R.; Matta, M.; Quattrone, A.; Fragonara, L.Z. Amplitude dependence of equivalent modal parameters in monitored buildings during earthquake swarms. Earthq. Eng. Struct. Dyn. 2017, 46, 2399–2417. [Google Scholar] [CrossRef]
- Sharma, V.; Parey, A. Gearbox fault diagnosis using RMS based probability density function and entropy measures for fluctuating speed conditions. Struct. Health Monit. 2017, 16, 682–695. [Google Scholar] [CrossRef]
- Melia, U.; Claria, F.; Vallverdu, M.; Caminal, P. Measuring instantaneous and spectral information entropies by shannon entropy of choi-williams distribution in the context of electroencephalography. Entropy 2014, 16, 2530–2548. [Google Scholar] [CrossRef]
- Dolce, M.; di Bucci, D. Comparing recent Italian earthquakes. Bull. Earthq. Eng. 2017, 15, 497–533. [Google Scholar] [CrossRef]
- Penna, A.; Morandi, P.; Rota, M.; Manzini, C.; da Porto, F.; Magenes, G. Performance of masonry buildings during the Emilia 2012 earthquake. Bull. Earthq. Eng. 2014, 12, 2255–2273. [Google Scholar] [CrossRef]
- Sorrentino, L.; Cattari, S.; da Porto, F.; Magenes, G.; Penna, A. Seismic behaviour of ordinary masonry buildings during the 2016 central Italy earthquakes. Bull. Earthq. Eng. 2018. [Google Scholar] [CrossRef]
- Di Ludovico, M.; Digrisolo, A.; Graziotti, F.; Moroni, C.; Belleri, A.; Caprili, S.; Carocci, C.; Dall’Asta, A.; de Martino, G.; de Santis, S.; et al. The contribution of ReLUIS to the usability assessment of school buildings following the 2016 central Italy earthquake. Boll. Geofis. Teor. Appl. 2017, 58, 353–376. [Google Scholar]
- Dolce, M.; Nicoletti, M.; de Sortis, A.; Marchesini, S.; Spina, D.; Talanas, F. Osservatorio sismico delle strutture: The Italian structural seismic monitoring network. Bull Earthq. Eng. 2015, 15, 621–641. [Google Scholar] [CrossRef]
- Gruppo di Lavoro INGV sul terremoto di Amatrice. Secondo rapporto di sintesi sul Terremoto di Amatrice Ml 6.0 del 24 Agosto 2016 (Italia Centrale). 2016. [Google Scholar] [CrossRef]
- Ceravolo, R.; de Lucia, G.; Matta, E.; Quattrone, A.; Fragonara, L.Z. Equivalent modal parameters in monitored buildings during the recent Italian seismic events. In Proceedings of the XVII Convegno ANIDIS—L'ingegneria sismica in Italia, Pistoia, Italy, 17–21 September 2017. [Google Scholar]
- Ceravolo, R.; De Lucia, G.; Lenticchia, E.; Miraglia, G. Use of combinatorial optimisation strategies for model updating of monitored buildings. In Proceedings of the 10th International Masonry Conference, Milan, Italy, 9–11 July 2018. [Google Scholar]
Figure 1.
The three case studies: (a) Court of Fabriano; (b) Town Hall of Pizzoli; (c) School of Visso.
Figure 1.
The three case studies: (a) Court of Fabriano; (b) Town Hall of Pizzoli; (c) School of Visso.

Figure 2.
Some damage observable after the seismic sequence: (a) Fabriano; (b) Pizzoli; (c) Visso.

Figure 3.
Fitting, in the ln()-ln() plane, of the experimental data for the buildings in: (a) Fabriano, mild seismic event of 2017-Feb-03; (b) Pizzoli, mild seismic event of 2017-Feb-19; (c) Visso, mild seismic event of 2016-Nov-20.
Figure 3.
Fitting, in the ln()-ln() plane, of the experimental data for the buildings in: (a) Fabriano, mild seismic event of 2017-Feb-03; (b) Pizzoli, mild seismic event of 2017-Feb-19; (c) Visso, mild seismic event of 2016-Nov-20.

Figure 4.
Power law curves, in the H-E plane, of the seismic sequence for the buildings in: (a) Fabriano; (b) Pizzoli; (c) Visso.
Figure 4.
Power law curves, in the H-E plane, of the seismic sequence for the buildings in: (a) Fabriano; (b) Pizzoli; (c) Visso.

Figure 5.
Entropy indicator, BE, of the seismic sequence for: (a) Fabriano; (b) Pizzoli; (c) Visso.

Figure 6.
Damage index, D [%], of the seismic sequence for: (a) Fabriano; (b) Pizzoli; (c) Visso.


Table 1.
Available main shocks and related PGAs of the buildings (x: major axis of the building, y: minor axis of the building, z: vertical axis of the building).
Table 1.
Available main shocks and related PGAs of the buildings (x: major axis of the building, y: minor axis of the building, z: vertical axis of the building).
| Main Shock | Building | PGA-x [g] | PGA-y [g] | PGA-z [g] |
|---|---|---|---|---|
| 2016-Aug-24a (01:36 UTC) | Fabriano | 0.04 | 0.05 | 0.03 |
| Pizzoli | 0.08 | 0.09 | 0.06 | |
| Visso | 0.33 | 0.32 | 0.13 | |
| 2016-Oct-26a (17:10 UTC) | Fabriano | 0.03 | 0.03 | 0.02 |
| Pizzoli | 0.02 | 0.02 | 0.02 | |
| Visso | 0.29 | 0.21 | 0.41 | |
| 2016-Oct-26b (19:18 UTC) | Fabriano | 0.08 | 0.09 | 0.08 |
| Pizzoli | 0.02 | 0.03 | 0.02 | |
| Visso | 0.36 | 0.48 | 0.31 | |
| 2016-Oct-30 (06:40 UTC) | Fabriano | 0.05 | 0.04 | 0.05 |
| Pizzoli | 0.11 | 0.11 | 0.06 | |
| Visso | 0.29 | 0.30 | 0.33 | |
| 2017-Jan-18b (10:14 UTC) | Fabriano | 0.01 | 0.01 | 0.00 |
| Pizzoli | 0.11 | 0.10 | 0.08 | |
| Visso | - | - | - |
Table 2.
Parameters, a and b, of the linear laws.
| Fabriano | Pizzoli | Visso | |||||||
| Seismic event | 2016 Oct-08 | 2017 Feb-03 | 2015 Jul-25 | 2016 Sep-07 | 2016 Nov-28 | 2017 Feb-19 | 2016 Sep-22 | 2016 Sep-25 | 2016 Nov-20 |
| a | −1.063 | −1.065 | −1.072 | −1.075 | −1.070 | −1.068 | −1.108 | −1.108 | −1.077 |
| b | 1.291 | 1.326 | 1.259 | 1.284 | 1.314 | 1.325 | 0.942 | 0.941 | 1.265 |
Publisher’s Note: MDPI stays neutral with regard to jurisdictional claims in published maps and institutional affiliations. |
© 2018 by the authors. Licensee MDPI, Basel, Switzerland. This article is an open access article distributed under the terms and conditions of the Creative Commons Attribution (CC BY) license (https://creativecommons.org/licenses/by/4.0/).
Share and Cite
MDPI and ACS Style
Ceravolo, R.; Lenticchia, E.; Miraglia, G. Use of Spectral Entropy for Damage Detection in Masonry Buildings in the Presence of Mild Seismicity. Proceedings 2018, 2, 432. https://doi.org/10.3390/ICEM18-05288
AMA Style
Ceravolo R, Lenticchia E, Miraglia G. Use of Spectral Entropy for Damage Detection in Masonry Buildings in the Presence of Mild Seismicity. Proceedings. 2018; 2(8):432. https://doi.org/10.3390/ICEM18-05288
Chicago/Turabian StyleCeravolo, Rosario, Erica Lenticchia, and Gaetano Miraglia. 2018. "Use of Spectral Entropy for Damage Detection in Masonry Buildings in the Presence of Mild Seismicity" Proceedings 2, no. 8: 432. https://doi.org/10.3390/ICEM18-05288