Open Source and Independent Methods for Bundle Adjustment Assessment in Close-Range UAV Photogrammetry
by
 , , ,
, , ,
Arnadi Murtiyoso
1,* ,
,
Pierre Grussenmeyer
1,
Niclas Börlin
2,
Julien Vandermeerschen
3 and
Tristan Freville
3 1
ICube Laboratory UMR 7357, Photogrammetry and Geomatics Group, National Institute of Applied Sciences (INSA), 24 Boulevard de la Victoire, 67084 Strasbourg, France
2
Department of Computing Science, Umeå University, 90187 Umeå, Sweden
3
Drone Alsace, 4 Rue Sainte-Catherine, 67000 Strasbourg, France
*
Author to whom correspondence should be addressed.
Drones 2018, 2(1), 3; https://doi.org/10.3390/drones2010003
Submission received: 22 December 2017
/
Revised: 31 January 2018
/
Accepted: 3 February 2018
/
Published: 7 February 2018
Abstract
:Close-range photogrammetry as a technique to acquire reality-based 3D data has, in recent times, seen a renewed interest due to developments in sensor technologies. Furthermore, the strong democratization of UAVs (Unmanned Aerial Vehicles) or drones means that close-range photogrammetry can now be used as a viable low-cost method for 3D mapping. In terms of software development, this led to the creation of many commercial black-box solutions (PhotoScan, Pix4D, etc.). This paper aims to demonstrate how the open source toolbox DBAT (Damped Bundle Adjustment Toolbox) can be used to generate detailed photogrammetric network diagnostics to help assess the quality of surveys processed by the commercial software, PhotoScan. In addition, the Apero module from the MicMac software suite was also used to provide an independent assessment of the results. The assessment is performed by the careful examination of some of the bundle adjustment metrics generated by both open source solutions. A UAV project was conducted on a historical church in the city center of Strasbourg, France, in order to provide a dataset with a millimetric level of precision. Results showed that DBAT can be used to reprocess PhotoScan projects under similar conditions and derive useful metrics from them, while Apero provides a completely independent verification of the results of commercial solutions. Overall, this paper shows that an objective assessment of photogrammetric results is important. In cases where problems are encountered in the project, this assessment method can be useful to detect errors that may not be explicitly presented by PhotoScan.
1. Introduction
Improvements in sensor technologies, supported by developments in image processing algorithms, has renewed the interest in image-based 3D mapping of reality. In that regard, the method of close-range photogrammetry has been used many times to capture 3D information from 2D images (e.g., shape, position and size) [1]. Close-range photogrammetry has seen various applications, such as the modeling of facades [2], buildings [3,4], monuments [5,6], etc. Developments in imaging sensor technology have made this method a great alternative or complement to terrestrial laser scanners [7,8,9]. Furthermore, the use of low-cost sensors such as smartphone images has also increased [10].
In parallel with those developments, image processing algorithms have also seen a significant improvement in the past two decades. The development of computer vision-derived algorithms has largely facilitated the photogrammetric workflow, enabling the automation of much of the previously manual work. This includes the development of image feature matching [11] that enables the automatic extraction and matching of tie points. Similarly, improvements in dense matching algorithms [12,13] have rendered the photogrammetric process very powerful, enabling it to produce dense point clouds up to one point per pixel [14]. In photogrammetry, UAVs (Unmanned Aerial Vehicles) have provided the means to capture images at close ranges, but from aerial points of view. This has enabled the 3D mapping of difficult or inaccessible parts [15].
The developments in the field of photogrammetry, aided by the popularization of UAVs, have sparked the creation of various software packages that offer photogrammetric and/or Structure-from-Motion (SfM) processing. Despite the presence of many open source solutions [16,17], commercial solutions remain very popular among users [18,19], especially outside the photogrammetric community. This is mainly due to the fact that commercial solutions tend to provide fairly accurate results with simpler and more streamlined user interfaces. A simplified workflow offers utility to a broad user base, but can hide the more complex functionality, which can be valuable to expert users. This is particularly important in projects that require detailed metrics such as high precision mapping, where the user often requires more control of the processing parameters. As far as geomatic requirements are concerned, it is still in the interest of the user to understand their results at a detailed enough level to be able to assess the quality of the results and determine if any part of the project may be improved.
An important aspect of photogrammetric quality is exterior orientation. This step influences the quality of the rest of the workflow, such as the dense image matching. Exterior orientation is often resolved using a bundle adjustment, with initial values calculated from other methods such as the Direct Linear Transformation (DLT), consecutive relative orientation, spatial resection, etc. [20]. The main aim of this paper was to demonstrate how two open source bundle adjustment solutions can be used to provide valuable diagnostics for the output of a commercial software. The commercial software evaluated was Agisoft PhotoScan, which is a popular software for 3D mapping [18]. The open source solutions used to evaluate the PhotoScan results were DBAT (Damped Bundle Adjustment Toolbox) [21] and Apero [16]. While Apero is a full photogrammetric module representing the whole photogrammetric process (usually coupled with MicMac for its dense matching step), DBAT has the capability to take PhotoScan projects as the input. This effectively means that DBAT can be used to reprocess PhotoScan’s results, while providing more flexibility and detailed metrics than PhotoScan (e.g., posterior standard deviations, sigma naught, correlations between parameters, etc.) [22]. These statistics can be used, for example, to determine the quality of images, the presence of outlier observations in the bundle adjustment process or the quality of the computed external and internal parameters.
Comparisons of bundle adjustment computation between PhotoScan and other open source solutions have been the object of study of several other papers. Open source solutions are often used to perform the comparison, as they provide a more open algorithm, which the users may parametrize to match their needs. Apero in particular has been used for such comparisons in previous research [23,24,25]. Other papers focus on optimizing PhotoScan processing [26] and assessing the results of PhotoScan projects in terms of computed covariances of both internal and external parameters [27], similar to DBAT’s functionality. The method applied in this paper follows the work already described in a previous publication [22]. However, the experiments in this paper were performed on a new dataset with a higher number of high-precision control points, which allows a more robust comparison. Furthermore, another independent comparison with Apero was also performed in order to give an objective assessment of the PhotoScan project.
For the purposes of this paper, a UAV flight was conducted on the St-Paul church (Figure 1), located in the city of Strasbourg, France. The church is located in the Neustadt quarter, which was recently inscribed into the UNESCO list of World Heritage in the summer of 2017. The eastern facade of the church was then taken for the experiments regarding the quality of its bundle adjustment, by means of comparing the results generated by PhotoScan, DBAT and Apero.
2. Related Work
2.1. UAV
As the name suggests, an Unmanned Aerial Vehicle (UAV) comprises a flying platform that is controlled from a ground station using a communication data link [28]. Although it had its beginnings with military applications, its use in the geomatics domain has continued to increase. Furthermore, the integration of imaging sensors, and recently positioning apparatuses, such as GNSS receivers, has increased its potential for close-range applications, as it complements classical terrestrial close-range data acquisition [29].
Being a versatile system, the UAV has seen many uses in various domains; from photography and video recording to more metric applications. In its role as an aid to photogrammetric work, the UAV has been applied in various fields, such as disaster management [14,30], 3D building reconstruction [31], surveying/mapping [32], environmental conservation [18] and heritage documentation [15,33].
Several types of UAVs exist [28,29]. The main types available in the surveying and mapping industry usually involve either a fixed-wing or a multi-rotor platform [34]. A fixed-wing UAV typically has the advantage of a larger mapping zone and lighter weight. However, it is more limited in payload and may be more sensitive to wind conditions [15]. Exceptions to this case include larger sized fixed-wing UAVs, which are often fueled by combustion engines rather than electric batteries. The multi-rotor type provides a more robust frame with the possibility to take a larger payload, but is limited in coverage. The fixed-wing type is therefore suited for mapping large areas following classical aerial photogrammetry, while the multi-rotor one is more suited for close-range applications. Indeed, a multi-rotor UAV was used in this paper to obtain close-range images of the object of study. Some problems encountered in close-range photogrammetry are specific to this technique, since it involves a more complex geometric configuration of camera stations when compared to aerial photogrammetry [22]. For example, close-range photogrammetry can involve an unordered set of camera station positions and overlaps with varying Ground Sampling Distance (GSD) values, whereas in aerial photogrammetry, these parameters are generally well defined.
2.2. Bundle Adjustment
A crucial step in the photogrammetric workflow is the determination of the positions and attitudes of the camera stations in 3D space. The associated process involves the calculation of the exterior orientation parameters [1,35], called extrinsic parameters in the computer vision domain [36]. This analytical procedure is sometimes referred to as “aerotriangulation”, although traditionally, aerotriangulation was the term applied to the densification of ground controls (“bridging”) [37].
Several approaches exist for performing the exterior orientation, e.g., image resection and relative orientation [1]. The bundle adjustment technique enables the solving of the exterior orientation problem using image coordinates and the collinearity conditions. Mathematically speaking, a bundle adjustment is a non-linear least-squares optimization problem on the simultaneous estimation of the 3D point coordinates of the points on the image and the external camera parameters, potentially including the internal parameters [25]. In the latter case, the bundle adjustment process is sometimes referred to as “self-calibration” or “auto-calibration”. The bundle adjustment process may involve control points, as well as embedded GNSS/IMU data. Any observation can furthermore be weighted according to their precision [36]. This enables a rigorous solution to the exterior orientation problem.
- Free-network bundle adjustment: The free-network approach involves a calculation of the exterior parameters in an arbitrary coordinate system, followed by a 3D similarity transformation to align the network to the coordinate system of the control point (“the real world system”). In classical aerial photogrammetry, this approach echoes the relative orientation (free network orientation) and the absolute orientation (similarity transformation) steps.
- Block bundle adjustment: The block bundle approach involves a simultaneous least-squares estimation of the 3D point coordinates, the external camera parameters and, optionally, the internal camera parameters, in the coordinate system of the control points. This is done by introducing at least three control points and integrating them within the computation matrix. Appropriate weights can be applied to these observations.
The free-network approach is less rigorous than the block bundle approach, and deformations on the model might occur due to the lack of external constraint and/or imperfect calibration of the internal camera parameters [25,39]. However, the free-network method is faster since it involves fewer observations. It is therefore often performed as an initial step using a minimal amount of control points. The resulting arbitrary orientation may then be used to guide other control point observations. At the end of this process, fine-tuning using the block bundle adjustment approach is performed. The Apero command Tapas and the basic workflow of PhotoScan use the free-network approach. The 3D similarity transformation in Apero and PhotoScan is managed by the GCPBascule command and the 3D markers, respectively. On the contrary, in the block bundle approach, the control points are taken into account directly in the computation. A model deformation is therefore less likely to happen, and the network is more stable. The Campari command in Apero, as well as DBAT by default employs the block bundle adjustment approach.
The classical least-squares adjustment performed during the bundle adjustment process corresponds to the undamped Gauss–Newton optimization method [40]. However, several factors such as the absence of appropriate initial values or the low intersection angles between the images may prevent the iterative solution from reaching convergence [41]. Several damping methods may be applied in order to optimize the results [40,42].
2.3. Software Solutions
In parallel with improvements in imaging sensors, a significant development in image processing algorithms has led to various photogrammetric software programs. In general, modern SfM/photogrammetry-based solutions are available in both a commercial and an open source nature. In terms of commercial software, Agisoft PhotoScan is one of the most commonly used [18,33,43]. Other popular solutions include Pix4D, Photomodeler, RealityCapture and 3DF Zephyr [39,44]. The openMVG page (https://github.com/openMVG accessed on 20 December 2017) provides a comprehensive list of the available open source 3D reconstruction libraries. Some notable examples of open source programs offering a complete photogrammetric workflow include IGN (the French national mapping agency)’s Apero-MicMac package [42], the ISPRS Scientific Initiative project GRAPHOS [17] or VisualSFM [45]. Partial algorithms and software programs performing a specific part of the general photogrammetric workflow also exist, for example DBAT [21], which calculates the bundle adjustment step, and SURE [46], which generates 3D dense point clouds from pre-oriented images. The programs listed above perform the computations locally. Other software programs that perform the computations in the cloud include Autodesk’s Recap, KU Leuven’s Arc3D [39] and the Replicate project [10].
In this paper, a critical analysis of the bundle adjustment results of the commercial software PhotoScan was performed. This involved the reprocessing of the PhotoScan project using DBAT, in order to derive detailed metrics. These metrics were then used to verify the results given by PhotoScan. In addition, an independent bundle adjustment processing using Apero was also performed. Metrics from DBAT and Apero were also generated and used to assess the results and detect problems in the photogrammetric project.
2.3.1. Agisoft PhotoScan
PhotoScan is a stand-alone software developed by the company Agisoft LLC. It performs 3D reconstruction of objects from images and employs the whole photogrammetric workflow. PhotoScan has a user-friendly interface with several simplified functionalities and parameters, which nevertheless manages to deliver a fairly accurate result. Few things are known about the algorithms employed by PhotoScan. The tie point extraction and detection may employ an improved version of SIFT [33]. Furthermore, the dense matching method used may be a variant of the Semi-Global Matching (SGM) algorithm [12,19]. In terms of bundle adjustment, little has been published about the approach used by PhotoScan.
As a commercial software, PhotoScan focuses on the results rather than detailed control of the processing parameters. This is advantageous for many users as it simplifies the workflow and renders the 3D reconstruction of objects easier. However, the lack of control may be a drawback in metric applications, as often encountered by photogrammetrists [22]. In order to render the interface more user-friendly, many processing parameters in PhotoScan are preset with default values. Furthermore, fewer metrics related to the bundle adjustment and dense matching results are given (correlation levels, exterior orientation standard deviation values, etc.). This makes it more difficult to validate the results and detect any existing problems in the project in the case where the resulting precision is unsatisfactory. However, the authors of PhotoScan seem to have taken notice of this inflexibility for advanced users. Starting with Version 1.3.0, dated 5 February 2017, PhotoScan reports standard deviations for and correlation coefficients between the interior orientation parameters in its report file. PhotoScan Version 1.3.4 was used for the experiments in this paper.
2.3.2. DBAT
The Damped Bundle Adjustment Toolbox (DBAT) is a set of functions developed in the MATLAB language (www.mathworks.com/products/matlab.html accessed on 20 December 2017) for the purpose of calculating bundle adjustment solutions [40]. DBAT was originally developed to test different damping methods for the bundle adjustment process. This has been applied, for example, to help camera self-calibration using the extended collinearity equations to converge by only using the Exif values of the images [41,47]. Furthermore, DBAT has been tested to reprocess real-world datasets, such as a small sample of large-format aerial images [21] and close-range photogrammetry projects, both terrestrial and UAV-based [22,48]. DBAT provides comprehensive statistics, such as posterior standard deviations of exterior and interior parameters, intersecting angles between images, sigma naught, correlations between the computed parameters, etc. The reported statistics can be used to validate the results and if necessary to detect errors and redress the project in order to increase its quality [22]. Originally, DBAT was designed to process export files from Photomodeler, but can today load and process PhotoScan projects as well. In this regard, DBAT can be used to reprocess PhotoScan projects and derive more detailed metrics from them. However, DBAT reproduces PhotoScan projects in a broad manner, while generating some bundle adjustment diagnostics. Some inconsistencies are therefore to be expected. For example, PhotoScan seems to relatively scale the tie point image observations by a factor related to the feature scale, which is not reproduced in DBAT. In this paper, the used DBAT Version was 0.7.0.1, available from GitHub (https://github.com/niclasborlin/dbat accessed on 20 December 2017).
2.3.3. Apero
Apero is part of an open source 3D reconstruction module developed by the French national mapping agency (IGN). Apero performs bundle adjustment with the Levenberg–Marquardt damping method [42] from the tie points generated and matched by the Pastis module. Pastis is an interface to SIFT++ [16,33], which itself is an improved version of the SIFT feature detection algorithm [11]. Pastis and Apero are usually coupled with the dense matching module MicMac [49]. Together, the Pastis-Apero-MicMac family of functions enables the user to perform the complete photogrammetric workflow up to the generation of mesh models and orthophotos.
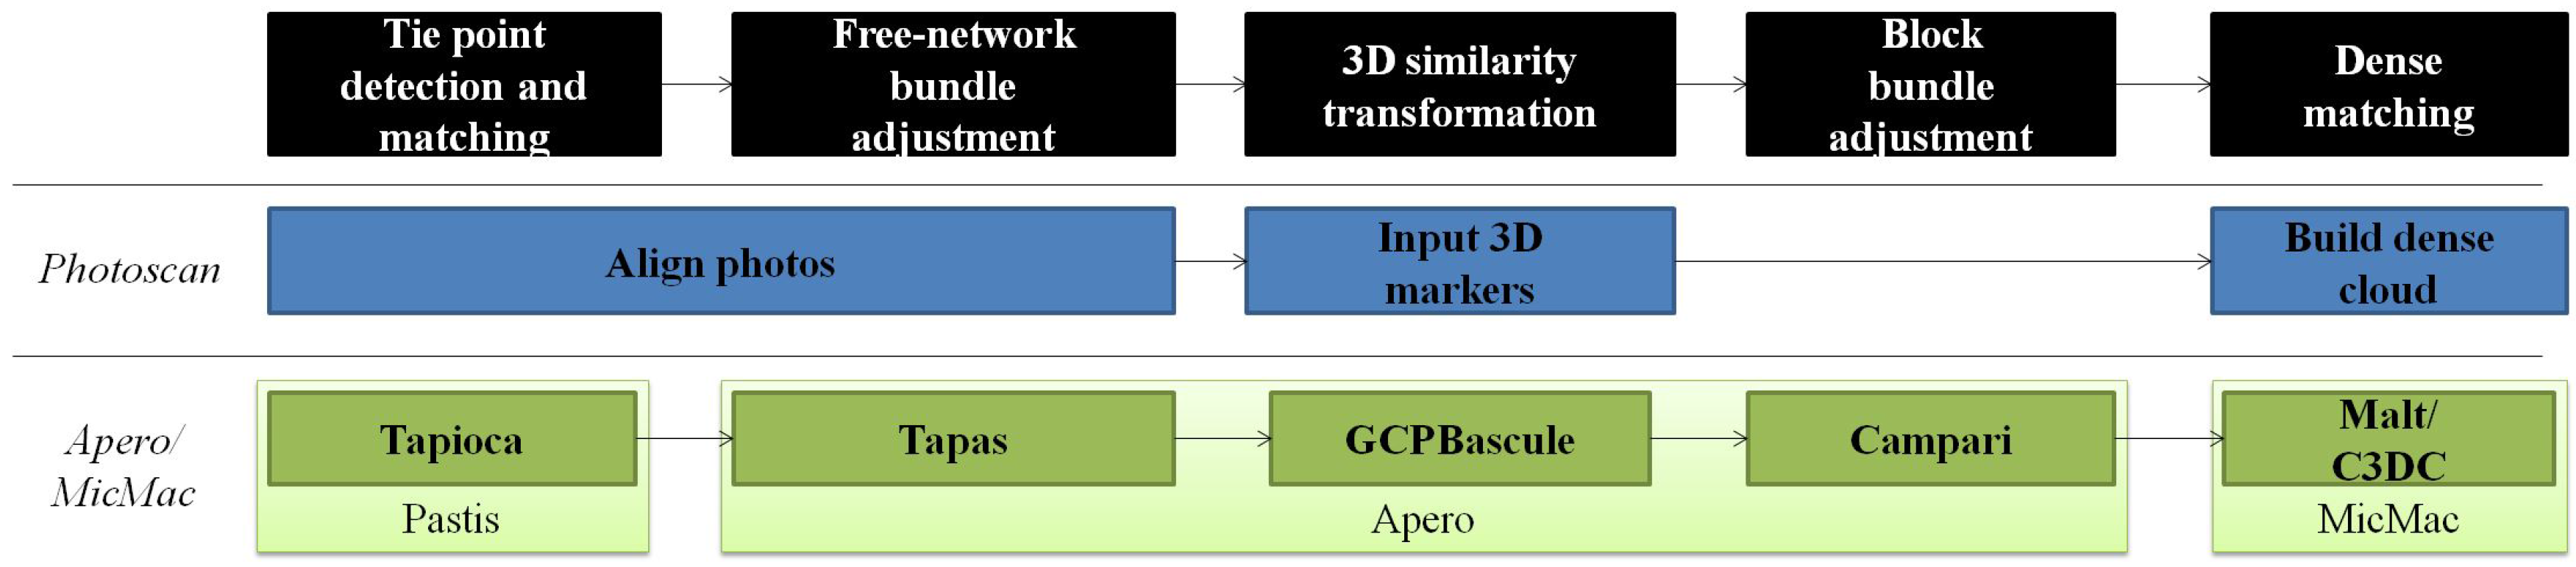
The functionality of the Pastis-Apero-Micmac suite can be accessed by performing commands on two levels [42]. The lower level involves the manipulation of XML-files, and the higher level consists of automated commands that may be invoked in a command window environment. In the higher-level command, Tapioca acts as an interface to Pastis, while Apero has several separate commands. Tapas performs a bundle adjustment in the free network mode, which can be followed by 3D similarity transformation by using the command GCPBascule. The resulting initial orientation can be used to guide the user to measure other control points, before performing a simultaneous bundle block adjustment using the command Campari. For dense matching, Malt and C3DC act as interfaces to MicMac. In this paper, only the Apero part will be used due to the focus on the bundle adjustment step. The tie points were however generated by Pastis (using the Tapioca command). A comparison of the functionalities of PhotoScan and Apero and the corresponding photogrammetric tasks can be seen in Figure 2.
3. Data Acquisition and Research Design
In this paper, the UAV DJI Phantom 4 Professional was used to acquire the data. The Phantom 4 Professional was released in November 2016 and includes a 20-megapixel on-board still sensor. It is equipped with a three-axis stabilization gimbal and may fly for roughly 30 min for each flight. The sensor is a CMOS with a three-micron pixel size, with an 8.8-mm focal length. It is a multi-rotor type UAV with four rotors. The Phantom 4 sensor is integrated with the system; the image acquisitions were therefore performed using the on-board sensor, equipped with a standard frame camera lens, i.e., not a fish-eye lens. The UAV employs a global shutter as opposed to a rolling shutter.
The UAV was used to acquire the images of St-Paul’s church, a historic 19th century church located in the city of Strasbourg, France. The project therefore also serves as a 3D documentation for this particular cultural heritage. In terms of building material, the edifice was built using Alsatian red sandstone. This provides enough textures for the feature matching step and eventually the dense matching process. Both perpendicular and oblique photos were taken, following the same flight plan (Figure 3). It should be noted that UAV projects are strictly regulated by the French government. However, close-range photogrammetry projects such as the one performed in this research fit one of the scenarios set by the regulations, with an 8-kg limit on the UAV weight and a 100-m limit of operation between the pilot and the UAV [50].
3.1. Project Planning
Before the image acquisition was performed, a topographical survey was conducted around the object of interest using a Trimble S8 robotic total station. Traverse points were measured around the church, from which detail points on the facade were measured. Some of the detail points were used as Ground Control Points (GCP), while others were used as Check Points (CP). The whole traverse network was attached to the French national cartographic projection system using a GNSS receiver and the RTK (Rapid Time Kinematic) method. Two traverse points were fixed in planimetric coordinates, while the altitude of one of the two points was fixed. The altitude values of the points were measured by GNSS, as no leveling benchmark was found near the building. Each GCP and CP was measured twice from two stations, in order to enable a spatial intersection computation on their coordinates. At the end of the topographical survey, all measurements were calculated in a least-squares block adjustment using the software Covadis (http://www.geo-media.com/solutions/logiciel-covadis accessed on 20 December 2017). This was done in order to determine the standard deviation values for each control point and enable the use of weighting in the bundle adjustment process. The obtained standard deviation values were of the order of 5 mm. On average, the planimetric precision of the control points resulting from this process was 4 mm, while the average altimetric precision was 2 mm.
The UAV was flown using a combination of perpendicular and oblique photos in order to cover difficult parts of the building. The flight strips were performed systematically in a vertical fashion; the oblique photos followed the same flight strip design. A rough flight plan was designed beforehand to ensure enough overlap and side-lap between the images and strips, respectively, and given to the pilot. The final flight configuration resembled the designed one, although some modifications needed to be performed in the field. Furthermore, additional flights were carried out to capture more complex parts of the edifice, such as the central spire.
The project was planned to homogenize the lighting conditions and the resulting image texture as much as possible. Thus, flights were performed during the morning or the afternoon to avoid hard sunlight around noon. Cloudy days were preferred for flights over sunny days. In terms of geometric planning, the UAV was flown at an approximate camera-to-object distance of between 5 and 10 m. This corresponds to a theoretical average GSD of 2 mm. In total, three separate flights were performed to photograph the entire building. However, in this paper, only one flight over the eastern facade of the building will be discussed.
3.2. Experiments
The images were processed using the standard PhotoScan pipeline, from the tie point generation, bundle adjustment and self-calibration, up to the creation of 3D models. In this paper, we focus on the bundle adjustment results for the 485 images of the eastern facade of the church. A total of 29 marked points (see Figure 4) was measured manually. Sixteen points were used as GCP. The remaining thirteen were used as CP. The distribution of GCP followed the classical photogrammetric convention that control points should be placed at the object’s perimeters in order to ensure a uniform 3D transformation of the model [51].
The experiments were designed to assess and compare the bundle adjustment results from PhotoScan with DBAT and Apero. DBAT was used to reprocess the bundle adjustment computations of the PhotoScan project. Thus, DBAT computations used the same 2D point measurements and 3D GCP control measurements as PhotoScan to reprocess the project and provide detailed bundle adjustment diagnostics. In contrast, the Apero comparison was performed using only the same images as input. Thus, the Apero computations were based on measurements of different tie points rather than those generated by PhotoScan.
A graphical representation of the conducted experiments is shown in Figure 5. GCP and CP residuals were compared between PhotoScan and DBAT in Experiment 1 and PhotoScan and Apero in Experiment 2. This method of bundle adjustment assessment is often used in the literature [52,53,54]. After the comparisons were performed and the results validated, metrics from the open source algorithms were then used to perform a quality assessment of the project. The objective of the quality assessment was to investigate whether improvements and error detection can be performed on PhotoScan projects by the open source solutions, to potentially enable a more precise photogrammetric end product.
The GCP standard deviation values obtained from the topographic survey were used as weighting factors. Furthermore, the manual marking error was set to 0.3 pixels, and the automatic tie point error was set to one pixel. The weightings of the observations in the bundle adjustment were therefore dictated by the a priori values. Identical weighting settings were used for all three algorithms (PhotoScan, DBAT and Apero) in order to compare their results under similar computing conditions.
DBAT provides more metrics than PhotoScan at the end of the computation. This may be exploited further in order to detect potential errors or outliers in the project, and thus, in this regard, DBAT can be used as a quality control tool. An example to this use of DBAT as a quality control tool will be further elaborated in Section 4.2. In the event that an unknown error comes with the project, this may be useful for the user to find these errors, which otherwise may not be detectable in PhotoScan alone.
The goal of Experiment 2 was to reprocess the original images independently. Thus, in this experiment, each software detected its own set of tie points from the same input images. Furthermore, the control points were measured manually in each software. As in Experiment 1, the observation weights for both the automatic and manual tie point measurements were set to be identical in both software in order to assess the bundle adjustment process in similar conditions. In Apero, this was regulated by using the Campari command to perform a block bundle adjustment with pre-assigned weights.
4. Results and Discussions
4.1. Bundle Adjustment Assessment
All three algorithms succeeded in computing the orientation parameters of all images in the project. Results from PhotoScan were reprocessed in DBAT using the Gauss–Newton–Armijo method, while Apero performed the bundle adjustment based on tie points provided by Pastis. A visual representation of the orientation results of the three algorithms can be seen in Figure 6.
In PhotoScan proper, the reported 3D GCP RMS error was 5.3 mm. This is close to the expected result, considering that the theoretical GSD was around 2 mm and the GCP precision was 5 mm. The 3D CP RMS error was slightly higher, 6.3 mm.
4.1.1. Experiment 1: Reprocessing of PhotoScan Using DBAT
In the first experiment, the PhotoScan project was reprocessed using DBAT. The main objective of Experiment 1 was to investigate whether DBAT can recreate the PhotoScan results. Diagnostics from DBAT can then be used to assess the quality of the project. The evaluation was based on the GCP and CP residual RMS. The GCP and CP residuals are shown in Table 1 and Table 2, respectively.
Overall, the DBAT residual RMS values for the GCP and CP have differences of 0.0–0.5 mm from those of PhotoScan. These slight differences are virtually negligible, since they correspond to 0.2 pixels when the GSD is taken into account. As the manual marking error was assumed to be 0.3 pixels, an error of this magnitude falls largely within the marking tolerance (hypothesized to be 1.96 for a 95% confidence level).
The largest disparity between 3D residuals was for Points 123 and 126, with a difference of 3.5 mm between DBAT and PhotoScan. However, the results suggest that DBAT is able to reproduce PhotoScan’s results to a reasonable degree and within the expected tolerance, thus validating the results given by PhotoScan.
4.1.2. Experiment 2: Independent Check Using Apero
In the second experiment, a similar comparison was performed between PhotoScan and Apero. The number of tie points used by PhotoScan and Apero was on average 4,000 points per image and 15,000 points per image, respectively. The GCP and CP residuals are shown in Table 3 and Table 4.
The Apero GCP residuals were higher than that of PhotoScan, 8.0 mm. This is higher than the theoretical GSD of 2 mm, which roughly represents the lowest geometric value attainable by an observation on an image. However, it is still within the tolerance when considering the 5-mm GCP precision. The Apero CP residual RMS was similar to the the ones generated by the PhotoScan/DBAT results. The observed difference in residual size may be due to the different processes used to detect and filter tie points. Especially, a less aggressive tie point filtering strategy in Apero might explain the elevated residuals. An alternate hypothesis is that PhotoScan employs a better blunder detection algorithm for the automatic tie points. Nevertheless, the Apero results show that millimetric result can be obtained from this dataset.
4.2. Quality Control
Conclusions from Experiments 1 and 2 can be used to validate PhotoScan’s results. Experiment 1 showed that using the same initial values and under similar weighting conditions, PhotoScan’s results can be recreated by DBAT. Meanwhile, Experiment 2 showed that a similar order of precision can be achieved independently using Apero. In terms of computing time, DBAT took 1 h and 13 min and Apero 54 min to finish the bundle adjustment process, using a computer with a 24-core Intel(R) Xeon(R) 2.4-GHz processor and 50 GB of RAM. It should be noted that much of this computing time is used to calculate the covariance matrix for the observations, which means that projects with more observations would typically require longer computing time. In total, 485 images, 16 manual GCPs and 192,814 automatic tie points were processed. The bundle adjustment analysis provided by PhotoScan is limited to the GCP and CP residuals, as well as the image residuals of the observations, internal parameter correlations and standard deviations. However, both DBAT and Apero generate other metrics related to the quality of the result of their respective bundle adjustment processes.
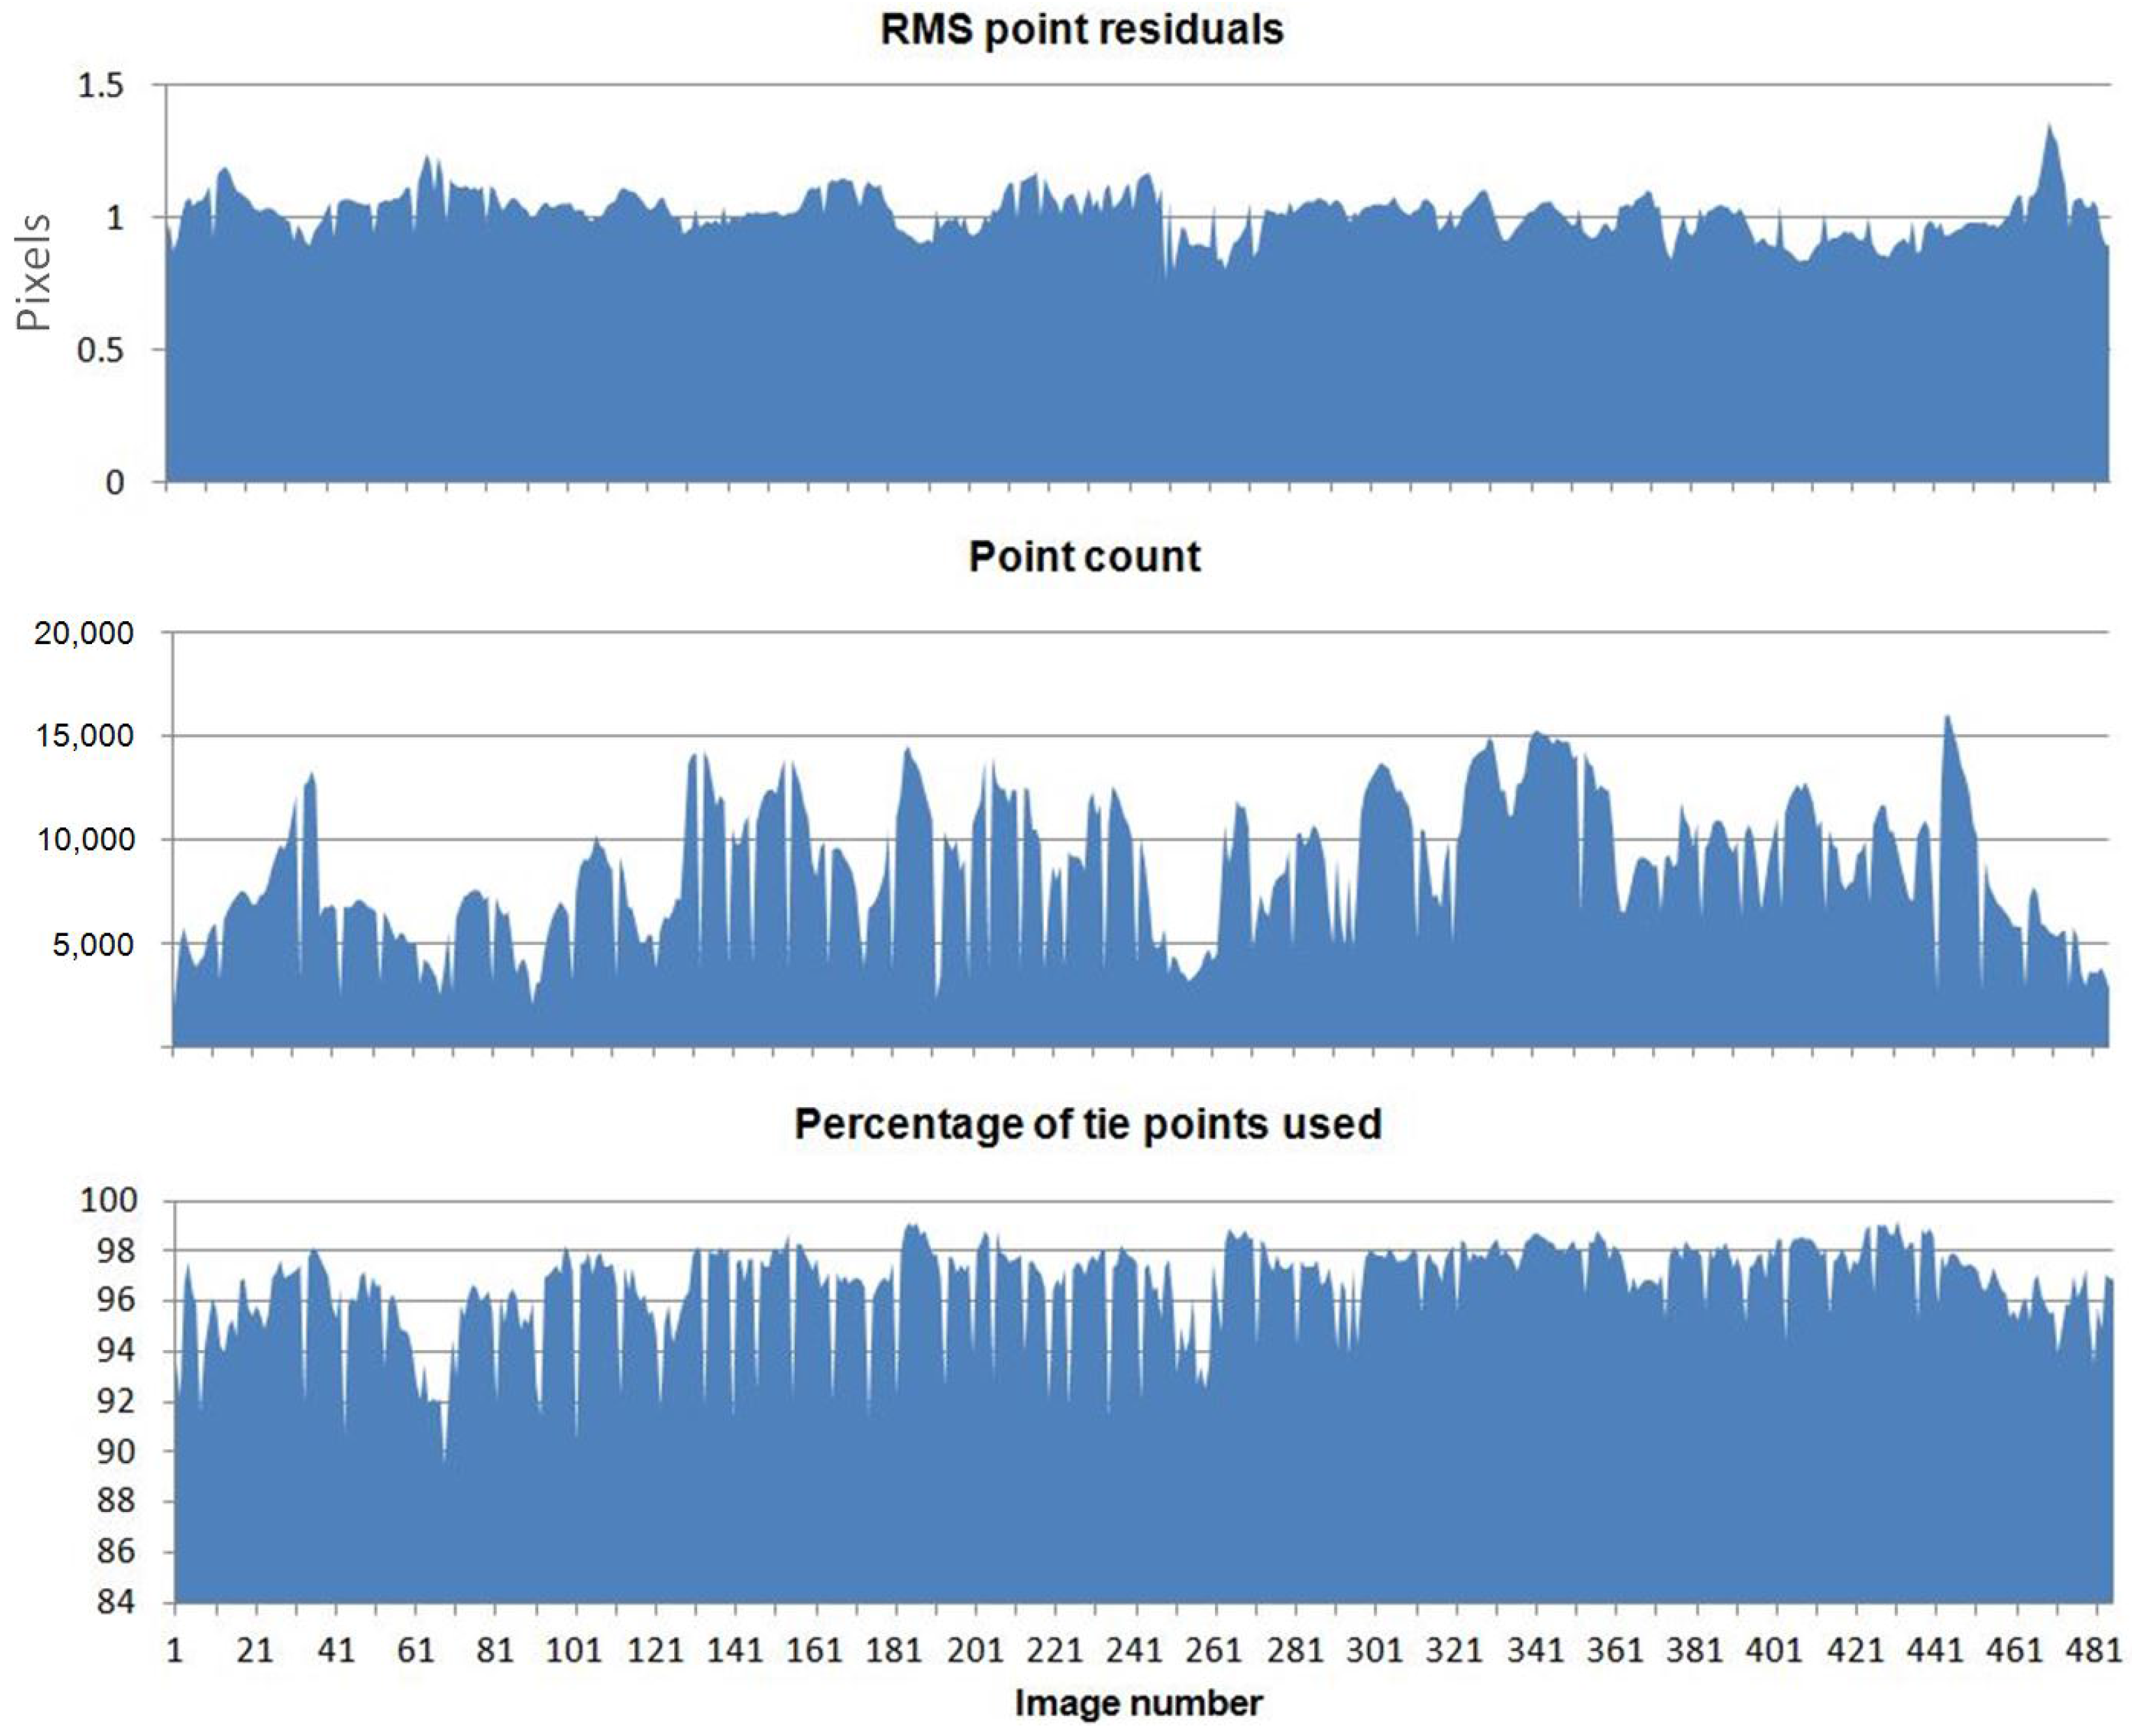
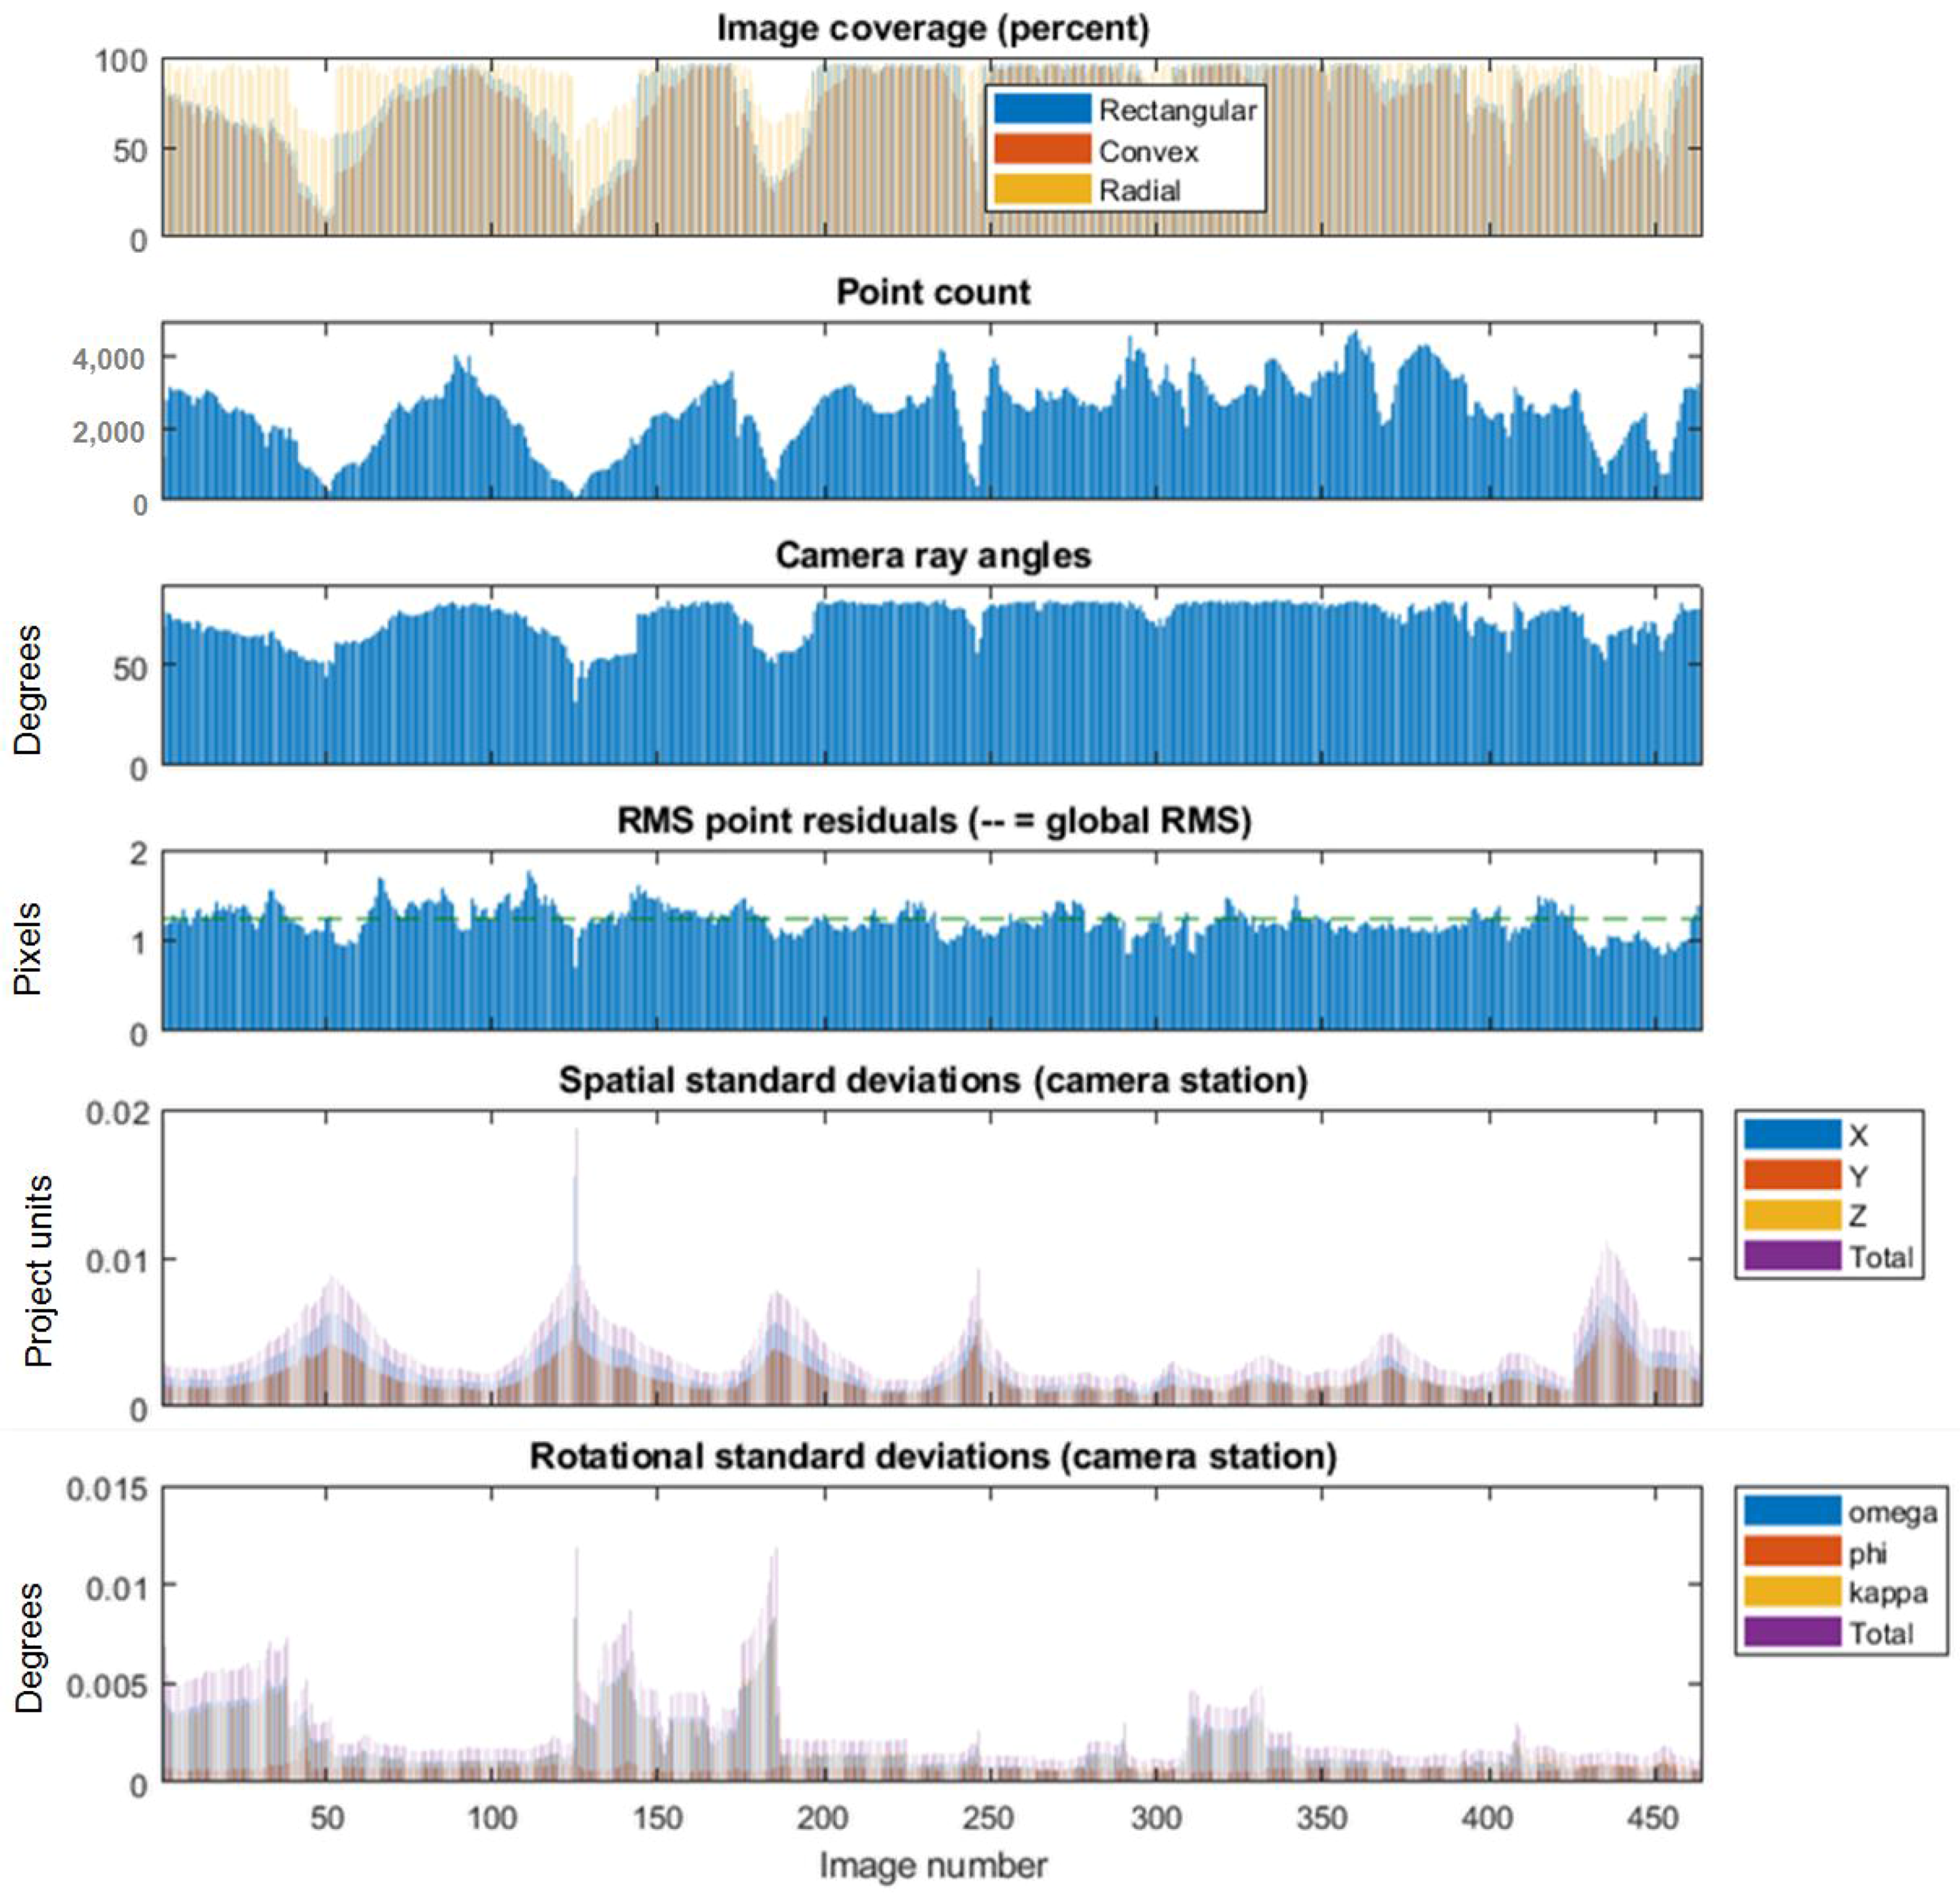
The metrics presented by DBAT include the image coverage, the number of automatic tie points for each image, the overall tie point residuals for each image, as well as the standard deviations for the positions and rotational attitudes of each camera station. The DBAT statistics are presented graphically in Figure 7. The statistics generated by Apero include the overall tie point residuals, the number of automatic tie points and the percentage of points deemed useful for the bundle adjustment. A graphical representation of the Apero statistics can be seen in Figure 8.
An analysis of Figure 7 reveals some interesting results. For example, some spatial standard deviation values of the camera stations reach 2 cm. This correlates with the low point count for those particular images, sometimes also with a decrease in camera ray angles. In some cases, the rotational standard deviation peaked to more than 0.01 degrees, something that may be due to a lower number of tie points, although the connection is less clear. Nevertheless, the correlation between the number of tie points in an image and the precision of its exterior orientation parameters is expected, as fewer observations will generate lower precision due to a lower redundancy. In addition, the image coverage correlates with the number of tie points in the images. Overall, the statistics provide clues as to what parts of the model would benefit from adding more measurements and/or images.
The metrics generated by Apero provide similar information, although with less obvious conclusions of where to improve the model. The Apero plots do show that the number of automatic points is much higher than that generated by PhotoScan. It should be noted that in both experiments, no post-bundle adjustment filtering of tie points were carried out. The number of detected points can also be used as an indication of image quality, since images with worse quality, e.g. blurred or not focused, have fewer features available for detection during the image matching step. Indeed, the number of tie points detected by Apero seems to be correlated to the percentage of tie points used in the bundle adjustment process. Figure 8 also shows that in general, Apero takes more than 90% of the detected tie points for the bundle adjustment, with a small part of the images where less than 90% were used. This can also be an indication of the quality of the images. Finally, in terms of the RMS point residuals, both DBAT and Apero gave an average value of around one pixel, which corresponds to the assumed precision of the automatically-detected tie points. In terms of posterior manual marking precision, the mean value of 0.28 pixels was obtained. This corresponds also to the expected prior value of 0.3 pixels set in the start of the bundle adjustment process.
Even though the exact algorithm used by PhotoScan remains difficult to ascertain due to its black-box nature, these approaches may help users to better understand the results they receive and eventually improve them. Indeed, with the lack of more metrics, some problems in the dataset cannot be detected within PhotoScan, as has been shown in this section.
5. Conclusions
This paper aims to demonstrate how open source solutions can be used to provide valuable survey diagnostics for bundle adjustment results generated by a commercial software, in this case PhotoScan. The experiments were conducted using a close-range UAV dataset. The relatively complex network configuration of a close-range UAV dataset compared to classical aerial photogrammetry, the inconsistent nature of its overlaps and intersecting angles, as well as the varying average GSD make it more important and difficult to detect weak parts of the network.
Two open source packages were used to provide a comparison of the bundle adjustment results. The DBAT toolbox processed the same tie point measurements as PhotoScan, whereas a comparison with the Apero package provided a case where different tie points from the same image set were used.
The results show that for this particular project, PhotoScan generated bundle adjustment results that are of the same millimetric order as the theoretical GSD. This was validated by both DBAT and Apero, which produced similar precision as estimated by the GCP and CP residuals. The results were achieved under the same weighting conditions. A downside of PhotoScan is the relative lack of detailed metrics for its orientation computation. This lack may mask potential problems in the dataset. In this paper, the DBAT results suggest that some improvements on the project can be made, particularly by adding more overlapping photos for some zones with lower exterior orientation precision. The Apero results provide some indication of the image quality that might be used for similar reasons.
Overall, this paper shows that an objective assessment of photogrammetric results is important. Errors may be hidden within the project, which limits the potential of the photogrammetric data. If the generated precision is within the project requirement, this may not be an issue. However, when problems occur within a dataset, bundle adjustment metrics, such as those provided by DBAT and, to a lesser degree, Apero, can be very helpful to detect the error. Unfortunately, this has yet to be integrated fully into commercial software such as PhotoScan. In this case, open source methods may be used to check the validity of the projects and to analyze the results in more detail. However, with the ever-increasing use of commercial photogrammetry/SfM software for mapping purposes, we have seen many improvements in this regard. If the recent addition of internal orientation errors and correlations in PhotoScan is anything to go by, open source solutions might lead the commercial software authors in the right direction. This will be a very welcome development for photogrammetrists and UAV users alike.
Acknowledgments
The project was conducted in collaboration with the Drone Alsace company (www.drone-alsace.fr), which provided the UAV images. The research also benefits from the Indonesian Endowment Fund for Education (LPDP), Republic of Indonesia. The authors would also like to thank Yi-Chou Lu for his help in performing the topographical survey.
Author Contributions
Arnadi Murtiyoso and Pierre Grussenmeyer conceived and designed the experiments. Arnadi Murtiyoso performed the experiments and analysed the data. Niclas Börlin worked on the version of DBAT used in this research. Julien Vandermeerschen and Tristan Freville were in charge of data acquisition and archiving. Julien Vandermeerschen contributed in the data pre-processing and PhotoScan processing. Arnadi Murtiyoso, Pierre Grussenmeyer, and Niclas Börlin wrote the paper.
Conflicts of Interest
The authors declare no conflict of interest. The sponsors had no role in the design of the study; in the collection, analyses, or interpretation of data; in the writing of the manuscript, and in the decision to publish the results.
References
- Grussenmeyer, P.; Al Khalil, O. Solutions for exterior orientation in photogrammetry: A review. Photogramm. Rec. 2002, 17, 615–634. [Google Scholar] [CrossRef]
- Fritsch, D.; Becker, S.; Rothermel, M. Modeling Façade Structures Using Point Clouds From Dense Image Matching. In Proceedings of the International Conference on Advances in Civil, Structural and Mechanical Engineering, Hong Kong, China, 3–4 August 2013; pp. 57–64. [Google Scholar]
- Alidoost, F.; Arefi, H. An image-based technique for 3D building reconstruction using multi-view UAV images. Int. Arch. Photogramm. Remote Sens. Spat. Inf. Sci. 2015, XL-1/W5, 43–46. [Google Scholar] [CrossRef]
- Hanan, H.; Suwardhi, D.; Nurhasanah, T.; Bukit, E.S. Batak Toba Cultural Heritage and Close-range Photogrammetry. Procedia Soc. Behav. Sci. 2015, 184, 187–195. [Google Scholar] [CrossRef]
- Suwardhi, D.; Menna, F.; Remondino, F.; Hanke, K.; Akmalia, R. Digital 3D Borobudur—Integration of 3D Surveying and Modeling Techniques. Int. Arch. Photogramm. Remote Sens. Spat. Inf. Sci. 2015, XL-5/W7, 417–423. [Google Scholar] [CrossRef]
- Murtiyoso, A.; Grussenmeyer, P. Documentation of heritage buildings using close-range UAV images: Dense matching issues, comparison and case studies. Photogramm. Rec. 2017, 32, 206–229. [Google Scholar] [CrossRef]
- Grenzdörffer, G.J.; Naumann, M.; Niemeyer, F.; Frank, A. Symbiosis of UAS Photogrammetry and TLS for Surveying and 3D Modeling of Cultural Heritage Monuments—A Case Study About the Cathedral of St. Nicholas in the City of Greifswald. Int. Arch. Photogramm. Remote Sens. Spat. Inf. Sci. 2015, XL-1/W4, 91–96. [Google Scholar]
- Grussenmeyer, P.; Landes, T.; Alby, E.; Carozza, L. High Resolution 3D Recording and Modelling of the Bronze Age Cave “Les Fraux” in Perigord (France). Int. Arch. Photogramm. Remote Sens. Spat. Inf. Sci. 2010, XXXVIII, 262–267. [Google Scholar]
- Remondino, F. Heritage recording and 3D modeling with photogrammetry and 3D scanning. Remote Sens. 2011, 3, 1104–1138. [Google Scholar] [CrossRef] [Green Version]
- Nocerino, E.; Lago, F.; Morabito, D.; Remondino, F.; Porzi, L.; Poiesi, F.; Rota Bulo, S.; Chippendale, P.; Locher, A.; Havlena, M.; et al. A smartphone-based 3D pipeline for the creative industry—The replicate eu project. Int. Arch. Photogramm. Remote Sens. Spat. Inf. Sci. 2017, 42, 535–541. [Google Scholar] [CrossRef]
- Lowe, D.G. Distinctive image features from scale invariant keypoints. Int. J. Comput. Vis. 2004, 60, 91–110. [Google Scholar] [CrossRef]
- Hirschmüller, H. Accurate and efficient stereo processing by semi-global matching and mutual information. IEEE Int. Conf. Comput. Vis. Pattern Recognit. 2005, 2, 807–814. [Google Scholar]
- Furukawa, Y.; Ponce, J. Accurate, dense, and robust multi-view stereopsis. IEEE Trans. Pattern Anal. Mach. Intell. 2009, 32, 1362–1376. [Google Scholar]
- Achille, C.; Adami, A.; Chiarini, S.; Cremonesi, S.; Fassi, F.; Fregonese, L.; Taffurelli, L. UAV-based photogrammetry and integrated technologies for architectural applications-methodological strategies for the after-quake survey of vertical structures in Mantua (Italy). Sensors 2015, 15, 15520–15539. [Google Scholar] [CrossRef] [PubMed] [Green Version]
- Murtiyoso, A.; Grussenmeyer, P.; Koehl, M.; Freville, T. Acquisition and Processing Experiences of Close Range UAV Images for the 3D Modeling of Heritage Buildings. In Proceedings of the 6th International Conference on Digital Heritage EuroMed 2016. Progress in Cultural Heritage: Documentation, Preservation, and Protection: Part I, Nicosia, Cyprus, 31 October–5 November 2016; Ioannides, M., Fink, E., Moropoulou, A., Hagedorn-Saupe, M., Fresa, A., Liestøl, G., Rajcic, V., Grussenmeyer, P., Eds.; Springer International Publishing: Berlin, Germany, 2016; pp. 420–431. [Google Scholar]
- Pierrot-Deseilligny, M.; Clery, I. Apero, an Open Source Bundle Adjusment Software for Automatic Calibration and Orientation of Set of Images. Int. Arch. Photogramm. Remote Sens. Spat. Inf. Sci. 2012, XXXVIII, 269–276. [Google Scholar] [CrossRef]
- González-Aguilera, D.; López-Fernández, L.; Rodriguez-Gonzalvez, P.; Guerrero, D.; Hernandez-Lopez, D.; Remondino, F.; Menna, F.; Nocerino, E.; Toschi, I.; Ballabeni, A.; Gaiani, M. Development of an all-purpose free photogrammetric tool. Int. Arch. Photogramm. Remote Sens. Spat. Inf. Sci. 2016, 41, 31–38. [Google Scholar] [CrossRef]
- Burns, J.H.R.; Delparte, D. Comparison of Commercial Structure-From-Motion Photogrammety Software Used for Underwater Three-Dimensional Modeling of Coral Reef Environments. Int. Arch. Photogramm. Remote Sens. Spat. Inf. Sci. 2017, XLII-2/W3, 127–131. [Google Scholar] [CrossRef]
- Remondino, F.; Spera, M.G.; Nocerino, E.; Menna, F.; Nex, F. State of the art in high density image matching. Photogramm. Rec. 2014, 29, 144–166. [Google Scholar] [CrossRef]
- Luhmann, T.; Robson, S.; Kyle, S.; Boehm, J. Close-Range Photogrammetry and 3D Imaging, 2nd ed.; De Gruyter: Berlin, Germany, 2014; p. 684. [Google Scholar]
- Börlin, N.; Grussenmeyer, P. External Verification of the Bundle Adjustment in Photogrammetric Software Using the Damped Bundle Adjustment Toolbox. Int. Arch. Photogramm. Remote Sens. Spat. Inf. Sci. 2016, XLI-B5, 7–14. [Google Scholar]
- Murtiyoso, A.; Grussenmeyer, P.; Börlin, N. Reprocessing Close Range Terrestrial and UAV Photogrammetric Projects with the DBAT Toolbox for Independent Verification and Quality Control. Int. Arch. Photogramm. Remote Sens. Spat. Inf. Sci. 2017, XLII-2 W8, 171–177. [Google Scholar] [CrossRef]
- Ouédraogo, M.M.; Degré, A.; Debouche, C.; Lisein, J. The evaluation of unmanned aerial system-based photogrammetry and terrestrial laser scanning to generate DEMs of agricultural watersheds. Geomorphology 2014, 214, 339–355. [Google Scholar] [CrossRef]
- Jaud, M.; Passot, S.; Le Bivic, R.; Delacourt, C.; Grandjean, P.; Le Dantec, N. Assessing the accuracy of high resolution digital surface models computed by PhotoScan® and MicMac® in sub-optimal survey conditions. Remote Sens. 2016, 8, 1–18. [Google Scholar] [CrossRef]
- Remondino, F.; Del Pizzo, S.; Kersten, T.P.; Troisi, S. Low-cost and open-source solutions for automated image orientation - a critical overview. Prog. Cult. Herit. Preserv. 2012, 7616 LNCS, 40–54. [Google Scholar]
- James, M.R.; Robson, S.; D’Oleire-Oltmanns, S.; Niethammer, U. Optimising UAV topographic surveys processed with structure-from-motion: Ground control quality, quantity and bundle adjustment. Geomorphology 2017, 280, 51–66. [Google Scholar] [CrossRef]
- James, M.R.; Robson, S.; Smith, M.W. 3-D uncertainty-based topographic change detection with structure-from-motion photogrammetry: precision maps for ground control and directly georeferenced surveys. Earth Surface Process. Landf. 2017, 42, 1769–1788. [Google Scholar] [CrossRef]
- Colomina, I.; Molina, P. Unmanned aerial systems for photogrammetry and remote sensing: A review. ISPRS J. Photogramm. Remote Sens. 2014, 92, 79–97. [Google Scholar] [CrossRef]
- Nex, F.; Remondino, F. UAV: platforms, regulations, data acquisition and processing. In 3D Recording and Modelling in Archaeology and Cultural Heritage: Theory and Best Practices; Remondino, F., Campana, S., Eds.; chapter Photogramm; Archaeopress: Oxford, UK, 2014; pp. 73–86. [Google Scholar]
- Baiocchi, V.; Dominici, D.; Mormile, M. UAV application in post-seismic environment. Int. Arch. Photogramm. Remote Sens. Spat. Inf. Sci. 2013, XL-1/W2, 21–25. [Google Scholar] [CrossRef]
- Roca, D.; Laguela, S.; Diaz-Vilarino, L.; Armesto, J.; Arias, P. Low-cost aerial unit for outdoor inspection of building façades. Autom. Constr. 2013, 36, 128–135. [Google Scholar] [CrossRef]
- Cramer, M. The UAV @ LGL BW project—A NMCA case study. In Proceedings of the 54th Photogrammetric Week, Stuttgart, Germany, 9–13 September 2013; pp. 165–179. [Google Scholar]
- Chiabrando, F.; Donadio, E.; Rinaudo, F. SfM for orthophoto generation: a winning approach for cultural heritage knowledge. Int. Arch. Photogramm. Remote Sens. Spat. Inf. Sci. 2015, XL-5/W7, 91–98. [Google Scholar] [CrossRef]
- Remondino, F.; Barazzetti, L.; Nex, F.; Scaioni, M.; Sarazzi, D. UAV photogrammetry for mapping and 3D modeling-current status and future perspectives. Int. Arch. Photogramm. Remote Sens. Spat. Inf. Sci. 2011, XXXVIII, 25–31. [Google Scholar] [CrossRef]
- Schenk, T. Introduction to Photogrammetry; Department of Civil and Environmental Engineering and Geodetic Science, The Ohio State University: Columbus, OH, USA, 2005; pp. 79–95. [Google Scholar]
- Granshaw, S.I. Photogrammetric Terminology: Third Edition. Photogramm. Rec. 2016, 31, 210–252. [Google Scholar] [CrossRef]
- Wolf, P.; DeWitt, B.; Wilkinson, B. Elements of Photogrammetry with Applications in GIS, 4th ed.; McGraw-Hill Education: New York, NY, USA, 2014; p. 696. [Google Scholar]
- Granshaw, S.I. Bundle Adjustment Methods in Engineering Photogrammetry. Photogramm. Rec. 1980, 10, 181–207. [Google Scholar] [CrossRef]
- Bedford, J. Photogrammetric Applications for Cultural Heritage; Historic: Swindon, UK, 2017; p. 128. [Google Scholar]
- Börlin, N.; Grussenmeyer, P. Bundle adjustment with and without damping. Photogramm. Rec. 2013, 28, 396–415. [Google Scholar] [CrossRef]
- Börlin, N.; Grussenmeyer, P. Experiments with Metadata-derived Initial Values and Linesearch Bundle Adjustment in Architectural Photogrammetry. ISPRS Ann. Photogramm. Remote Sens. Spat. Inf. Sci. 2013, II-5/W1, 43–48. [Google Scholar]
- Rupnik, E.; Daakir, M.; Pierrot Deseilligny, M. MicMac - a free, open-source solution for photogrammetry. Open Geospat. Data, Softw. Stand. 2017, 2, 14. [Google Scholar] [CrossRef]
- Verhoeven, G. Taking Computer Vision Aloft - Archaeological Three-dimensional Reconstructions from Aerial Photographs with PhotoScan. Archaeol. Prospect. 2011, 18, 67–73. [Google Scholar] [CrossRef]
- Murtiyoso, A.; Koehl, M.; Grussenmeyer, P.; Freville, T. Acquisition and Processing Protocols for UAV Images: 3D Modeling of Historical Buildings using Photogrammetry. ISPRS Ann. Photogramm. Remote Sens. Spat. Inf. Sci. 2017, Vol. 4, 163–170. [Google Scholar] [CrossRef]
- Wu, C. VisualSFM : A Visual Structure from Motion System. 2017. Available online: http://ccwu.me/vsfm/ (accessed on 4 December 2017).
- Wenzel, K.; Rothermel, M.; Haala, N.; Fritsch, D. SURE-The IfP software for dense image matching. In Proceedings of the 54th Photogrammetric Week, Stuttgart, Germany, 9–13 September 2013; pp. 59–70. [Google Scholar]
- Börlin, N.; Grussenmeyer, P. Camera Calibration using the Damped Bundle Adjustment Toolbox. ISPRS Ann. Photogramm. Remote Sens. Spat. Inf. Sci. 2014, II, 89–96. [Google Scholar] [CrossRef]
- Dall’Asta, E.; Thoeni, K.; Santise, M.; Forlani, G.; Giacomini, A.; Roncella, R. Network design and quality checks in automatic orientation of close-range photogrammetric blocks. Sensors 2015, 15, 7985–8008. [Google Scholar] [CrossRef] [PubMed]
- Pierrot-Deseilligny, M.; Paparoditis, N. A multiresolution and optimization-based image matching approach: An application to surface reconstruction from SPOT5-HRS stereo imagery. In Int. Arch. Photogramm. Remote Sens. Spat. Inf. Sci. 2006, XXXVI, 1–5. [Google Scholar]
- DGAC (Direction générale de l’aviation civile). Arrêté du 17 Décembre 2015 Relatif à L’utilisation de L’espace Aérien par les Aéronefs qui Circulent Sans Personne à Bord; 2015. [Google Scholar]
- Kraus, K.; Waldhäusl, P. Manuel de Photogrammétrie; Hermes: Paris, France, 1998. [Google Scholar]
- Gerke, M.; Przybilla, H.J. Accuracy Analysis of Photogrammetric UAV Image Blocks: Influence of Onboard RTK-GNSS and Cross Flight Patterns. Photogramm. Fernerkund. Geoinf. 2016, 2016, 17–30. [Google Scholar] [CrossRef]
- Kim, J.; Lee, S.; Ahn, H.; Seo, D.; Park, S.; Choi, C. Feasibility of employing a smartphone as the payload in a photogrammetric UAV system. ISPRS J. Photogramm. Remote Sens. 2013, 79, 1–18. [Google Scholar] [CrossRef]
- Ai, M.; Hu, Q.; Li, J.; Wang, M.; Yuan, H.; Wang, S. A robust photogrammetric processing method of low-altitude UAV images. Remote Sens. 2015, 7, 2302–2333. [Google Scholar] [CrossRef]
Sample Availability: The 3D model of the St-Paul church resulting from this project can be consulted through the following Sketchfab link: https://skfb.ly/6vtQT (accessed on 20 December 2017). |
Figure 1.
The St-Paul neo-gothic church located in the UNESCO World Heritage site of Neustadt, in the city of Strasbourg, France. Imagery of the eastern facade was used for the experiments in this paper.
Figure 1.
The St-Paul neo-gothic church located in the UNESCO World Heritage site of Neustadt, in the city of Strasbourg, France. Imagery of the eastern facade was used for the experiments in this paper.
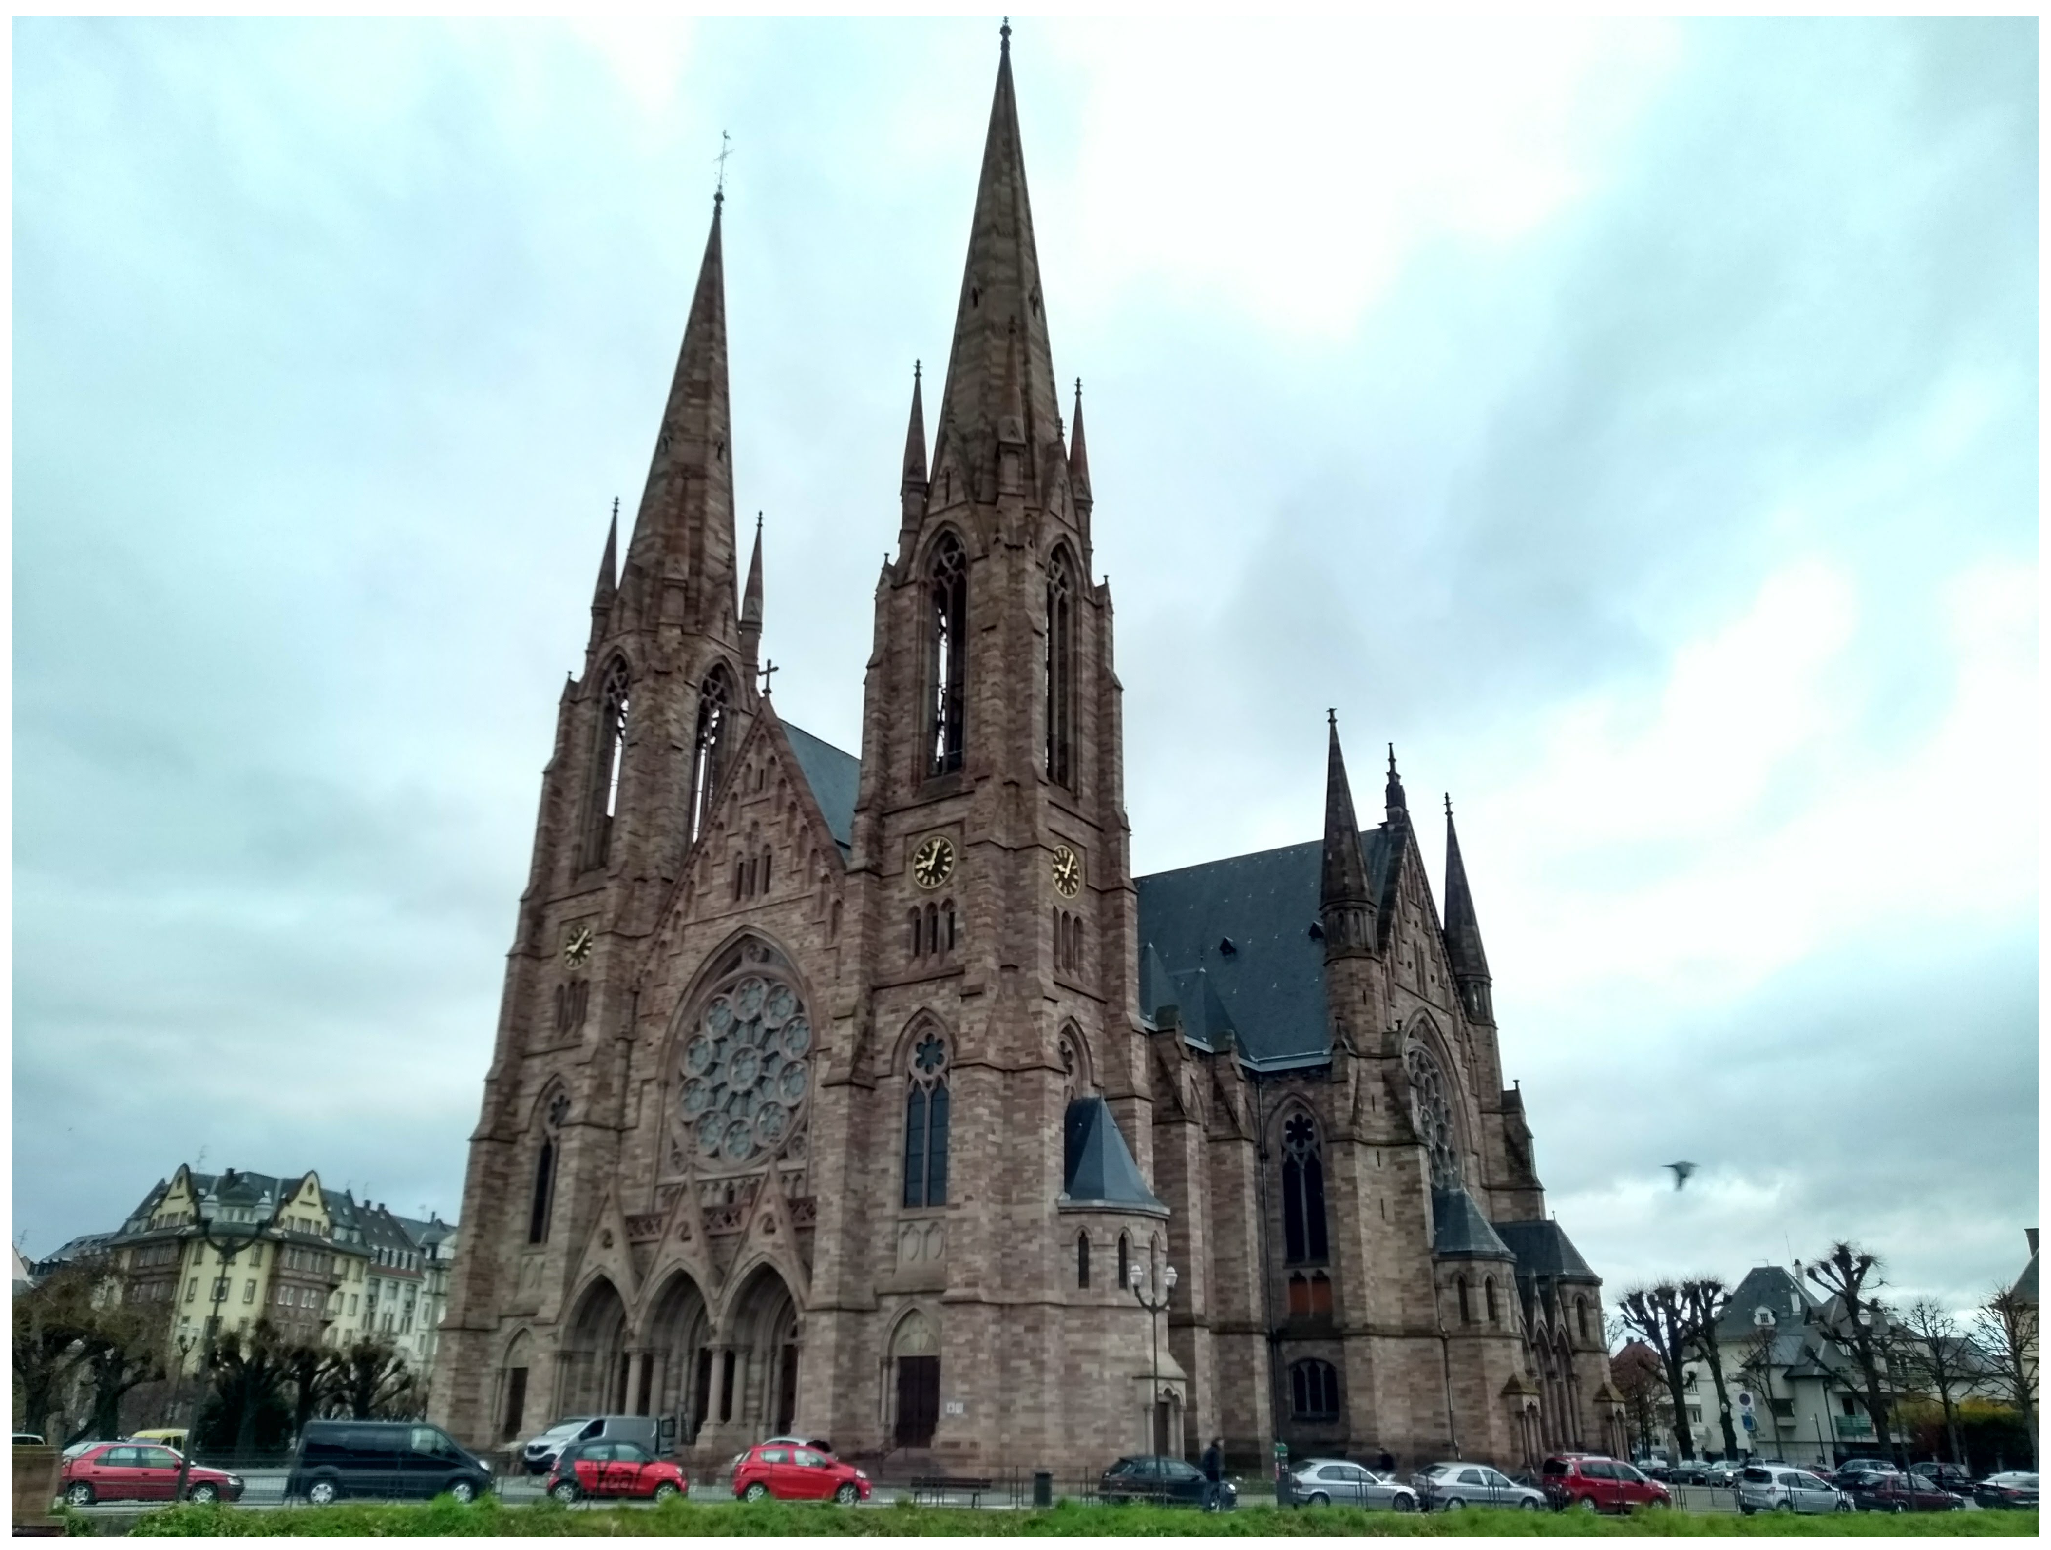
Figure 2.
Comparison between the commands in Apero and menu options in PhotoScan and their roles in the photogrammetric workflow. For Apero/MicMac, darker green denotes the high level automated commands, while lighter green denotes lower level XML-based commands.
Figure 2.
Comparison between the commands in Apero and menu options in PhotoScan and their roles in the photogrammetric workflow. For Apero/MicMac, darker green denotes the high level automated commands, while lighter green denotes lower level XML-based commands.

Figure 3.
Illustration of the flight plan, with perpendicular and oblique photos following the same vertical flight strip design. The flown path largely followed the original flight plan. However, some modifications were performed by the pilot based on the conditions in the field.
Figure 3.
Illustration of the flight plan, with perpendicular and oblique photos following the same vertical flight strip design. The flown path largely followed the original flight plan. However, some modifications were performed by the pilot based on the conditions in the field.
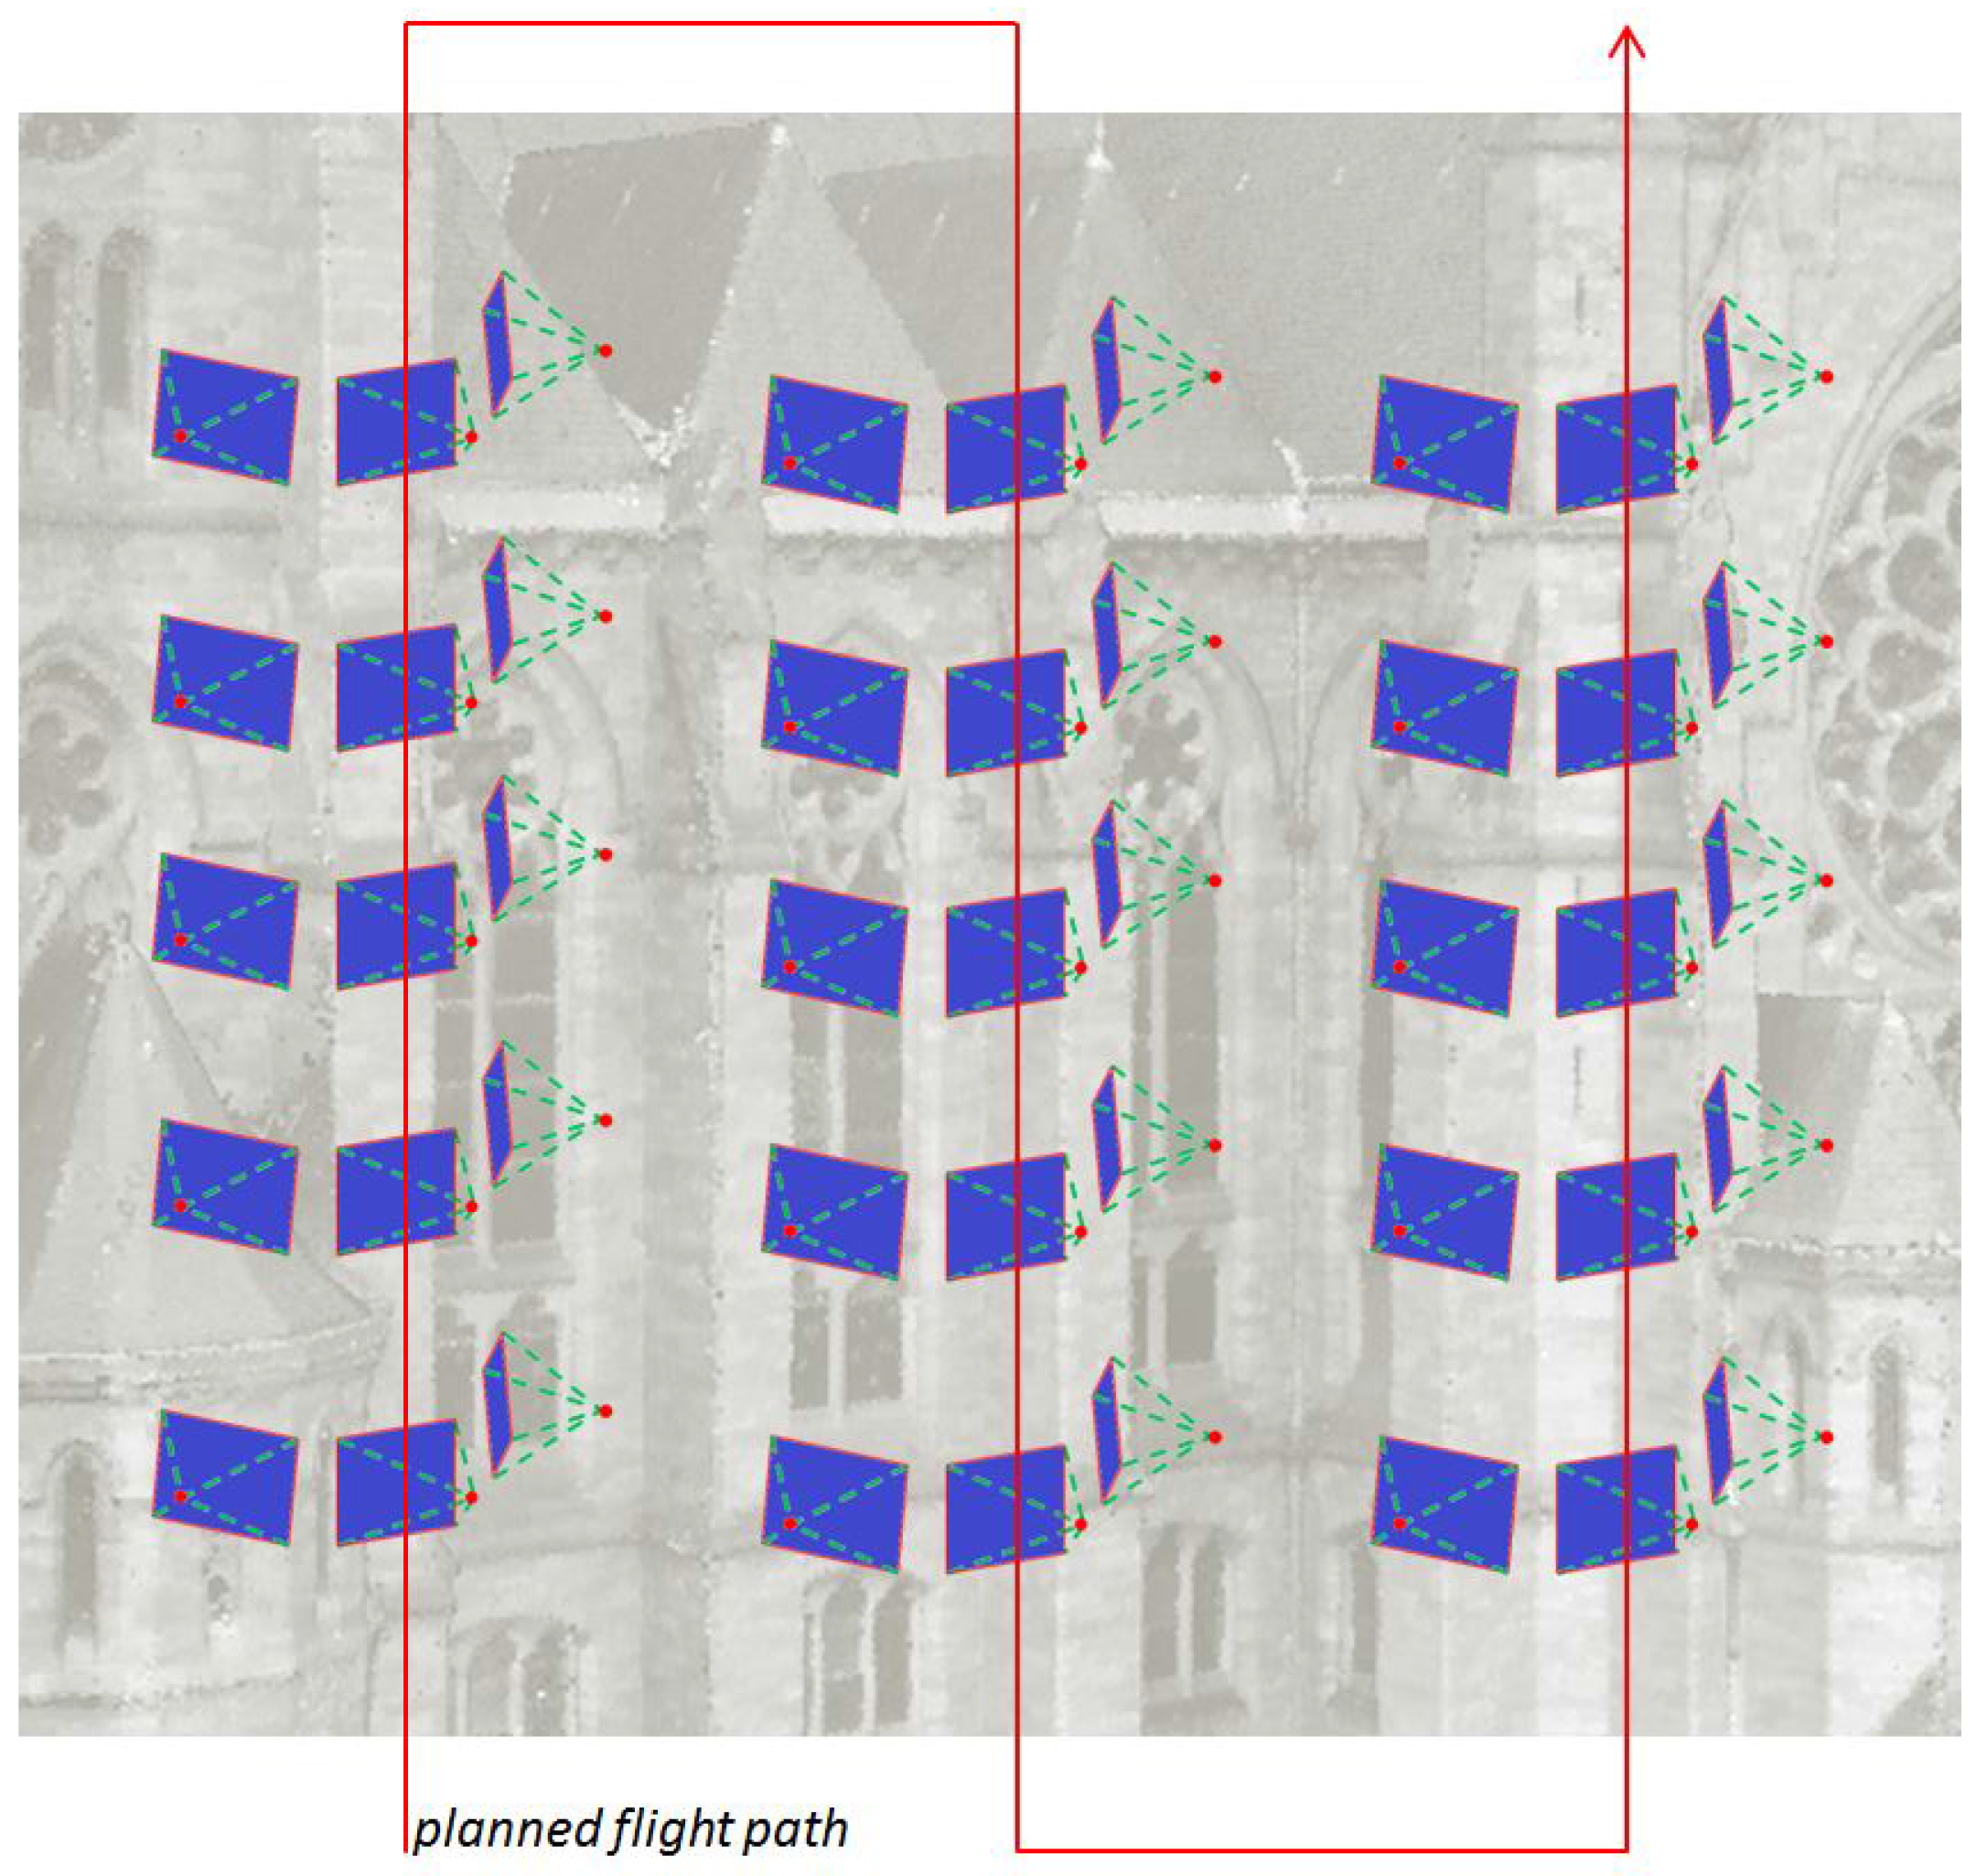
Figure 4.
Distribution of the ground control points and the check points on the eastern facade of St-Paul’s church. Green triangles denote GCPs while orange triangles denote Check Points (CPs).
Figure 4.
Distribution of the ground control points and the check points on the eastern facade of St-Paul’s church. Green triangles denote GCPs while orange triangles denote Check Points (CPs).
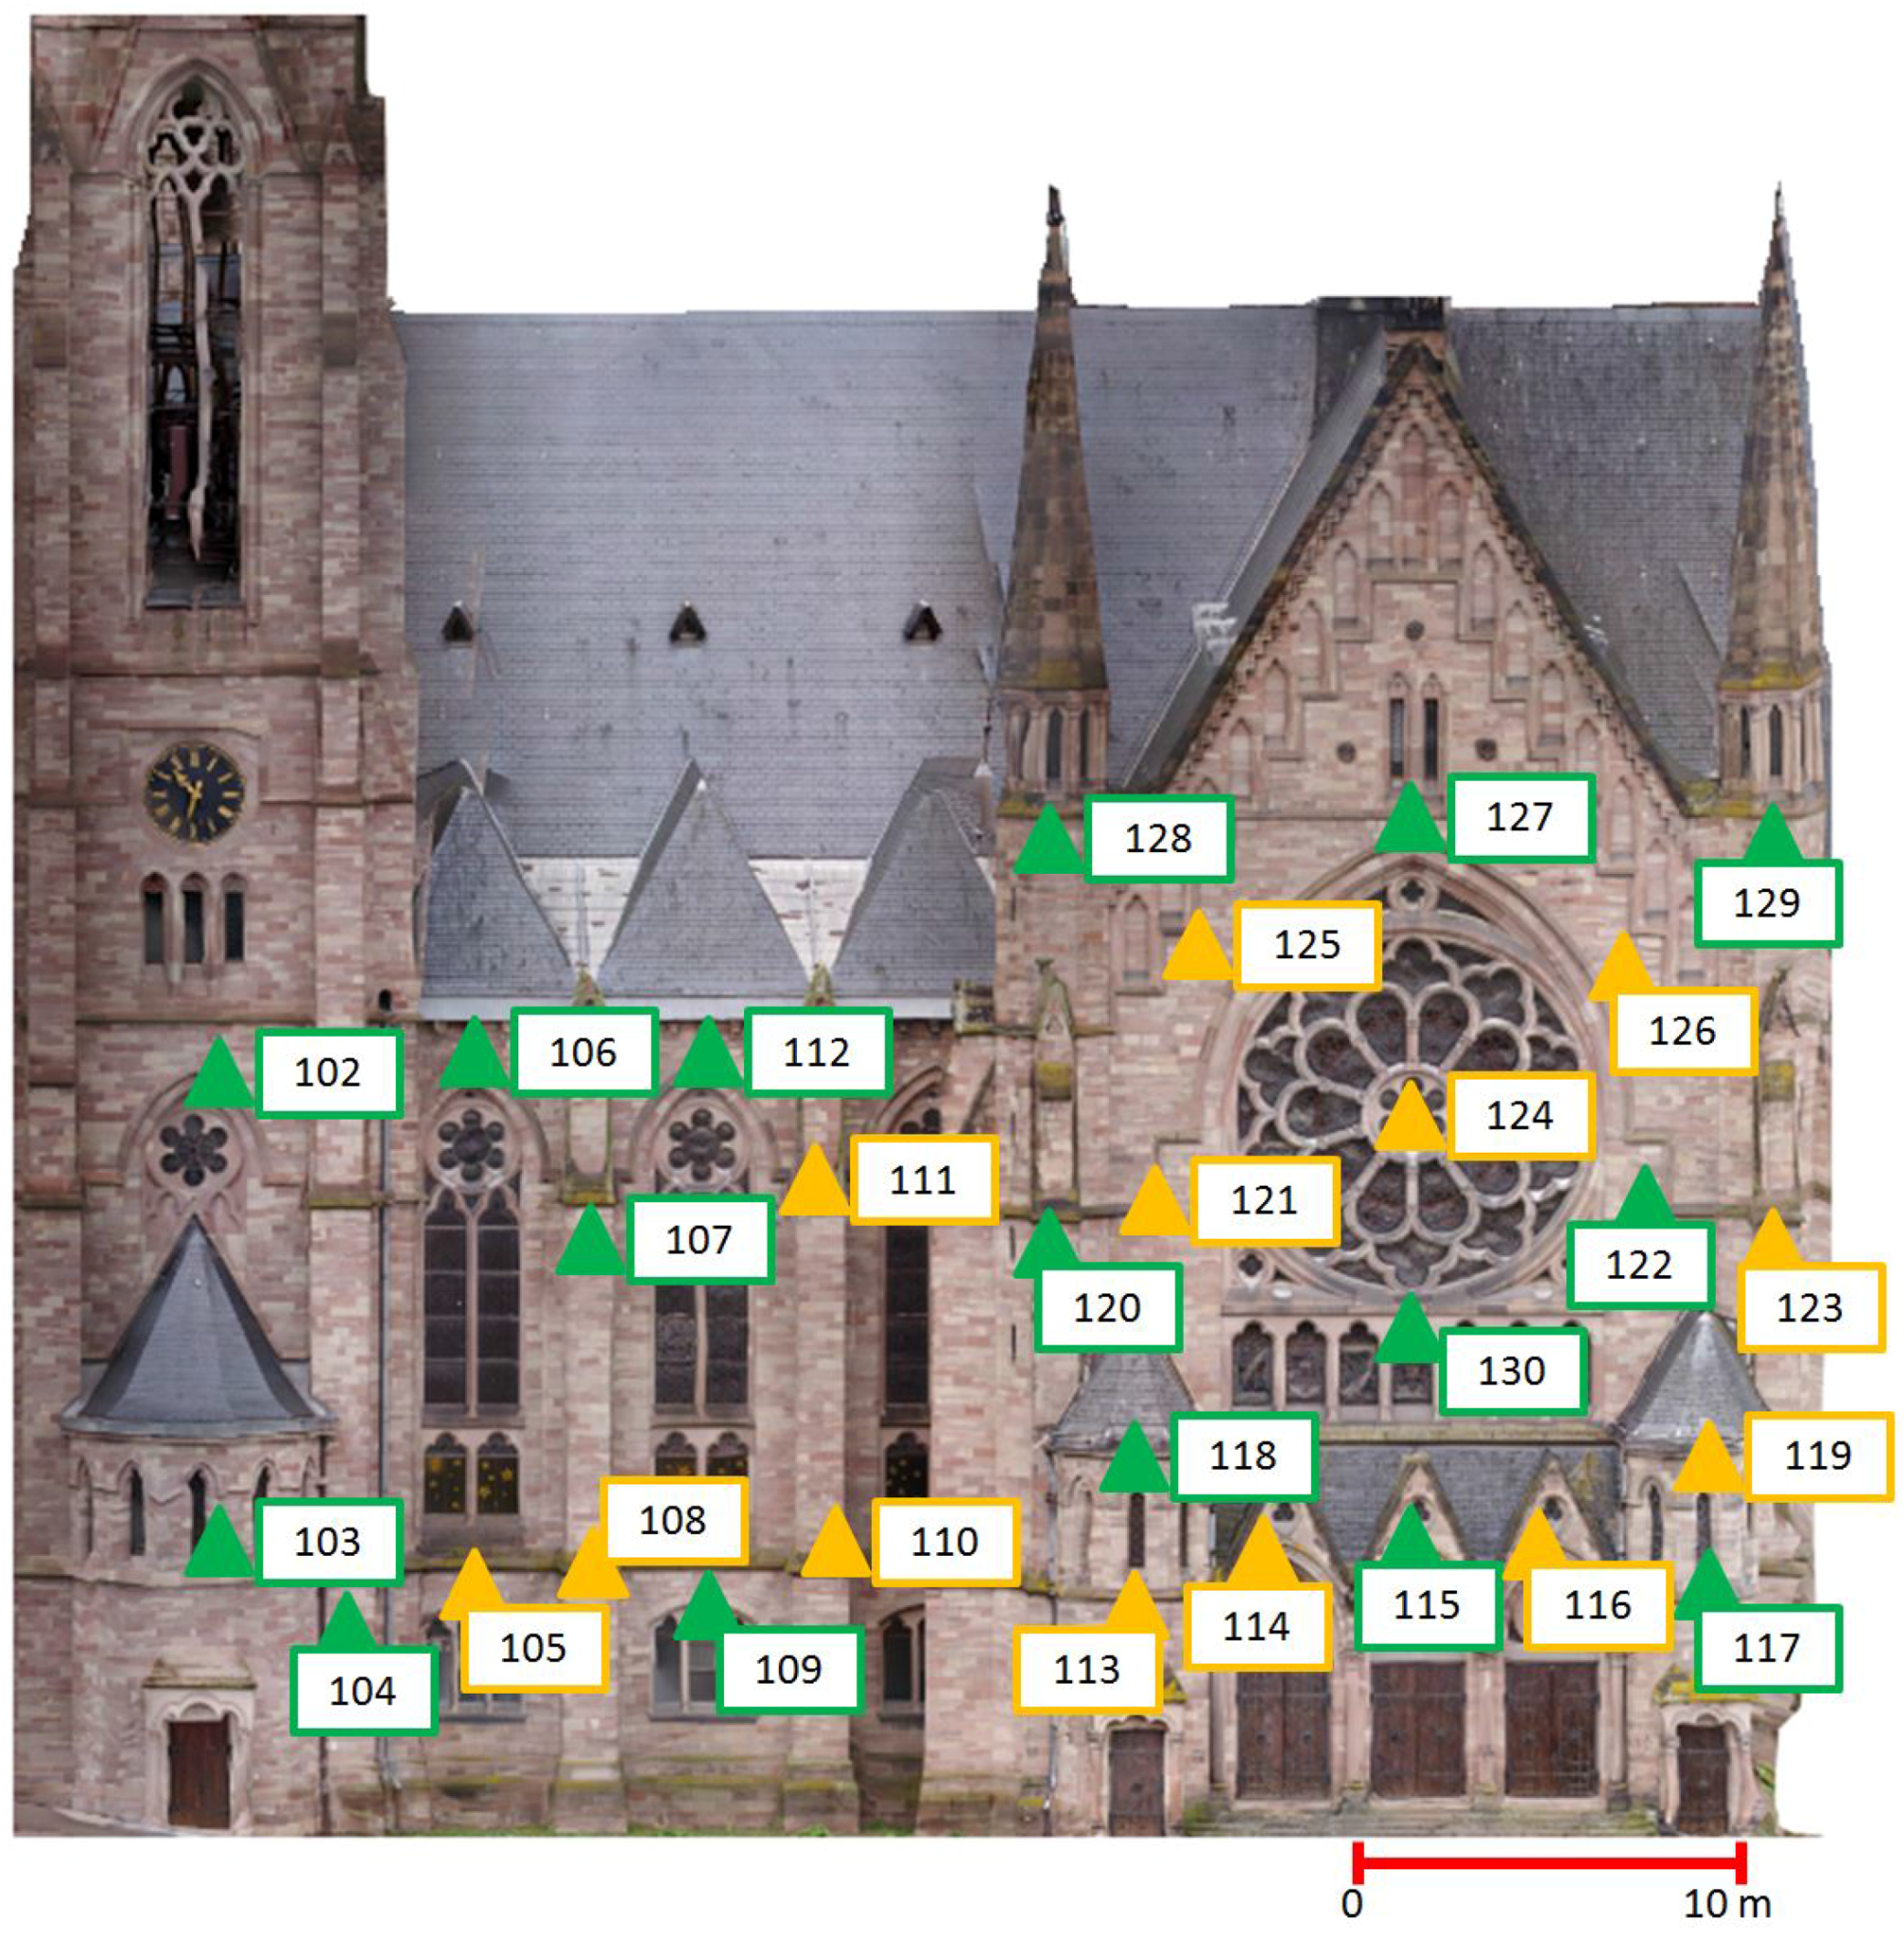
Figure 5.
Flowchart of the conducted experiments involving PhotoScan, DBAT and Apero. Two experiments were performed in order to compare PhotoScan to DBAT and Apero, respectively, followed by a project quality control based on the bundle adjustment metrics reported by open source solutions.
Figure 5.
Flowchart of the conducted experiments involving PhotoScan, DBAT and Apero. Two experiments were performed in order to compare PhotoScan to DBAT and Apero, respectively, followed by a project quality control based on the bundle adjustment metrics reported by open source solutions.
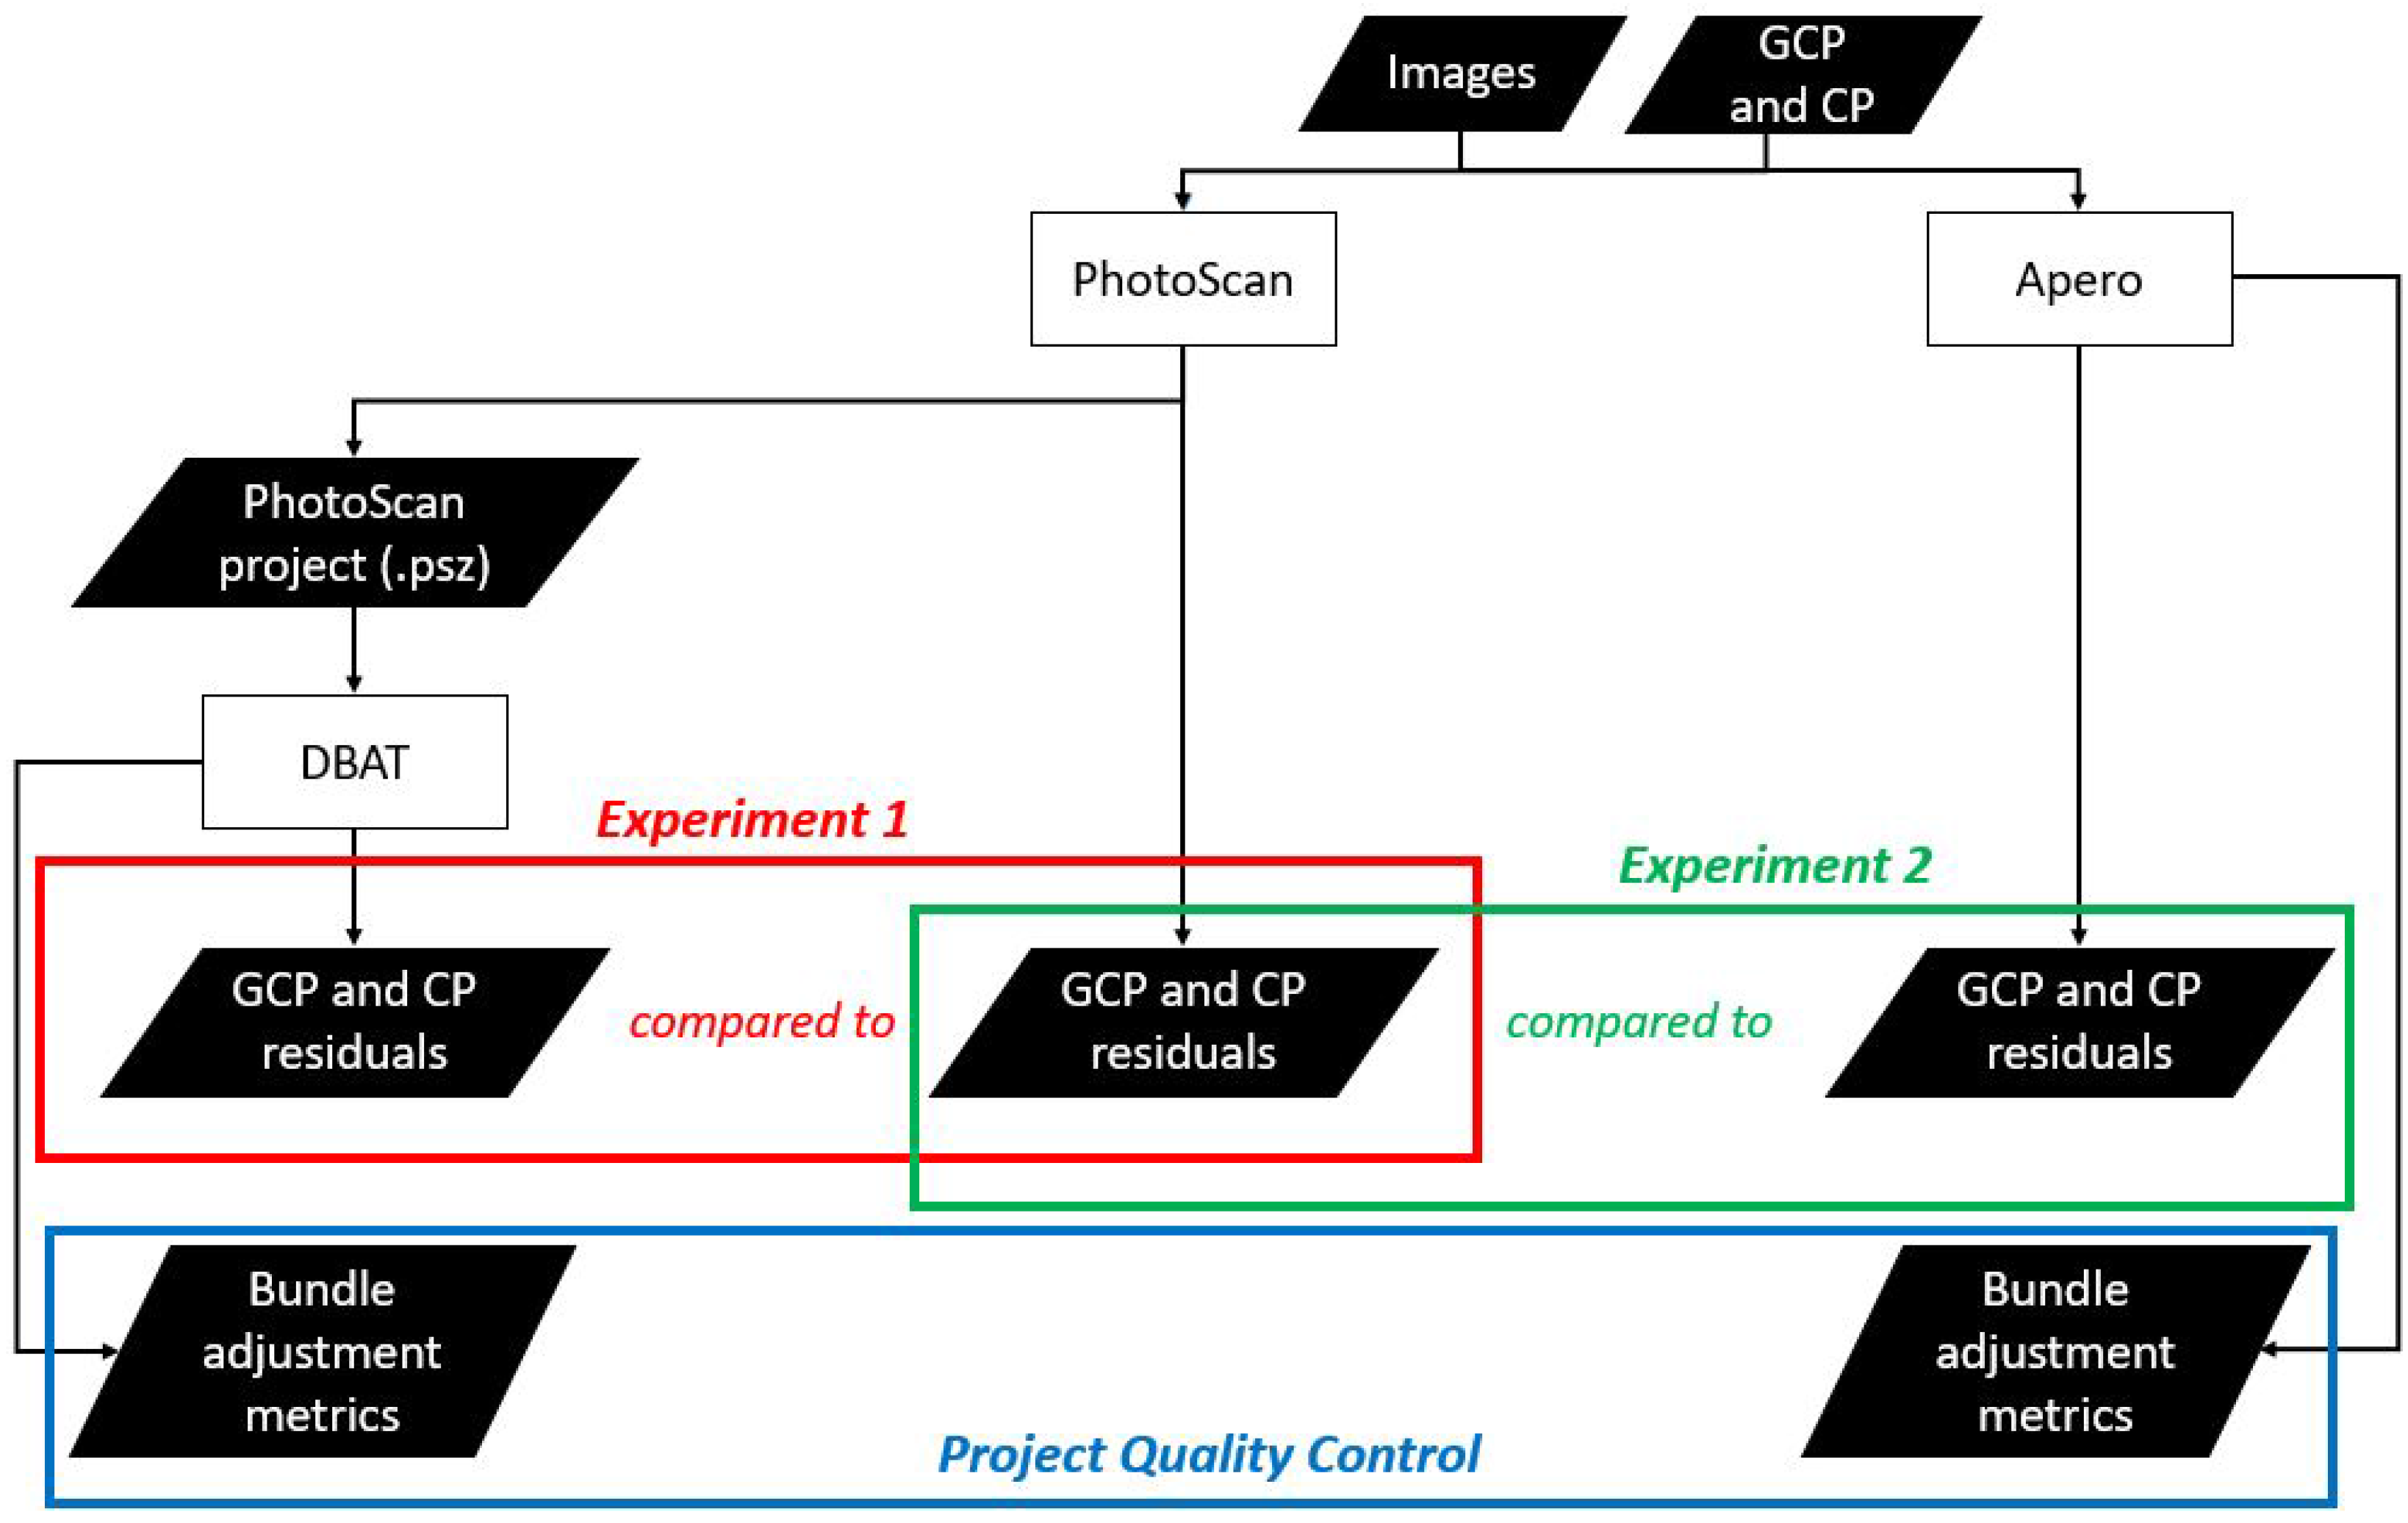
Figure 6.
Results of the external orientation process showing the positions and attitudes of each camera station, together with the sparse point clouds generated from the respective feature matching process. PhotoScan and DBAT processed the same tie point measurements. Apero generated its own set of tie point measurements from the same input images as PhotoScan. (a) PhotoScan; (b) DBAT; (c) Apero.
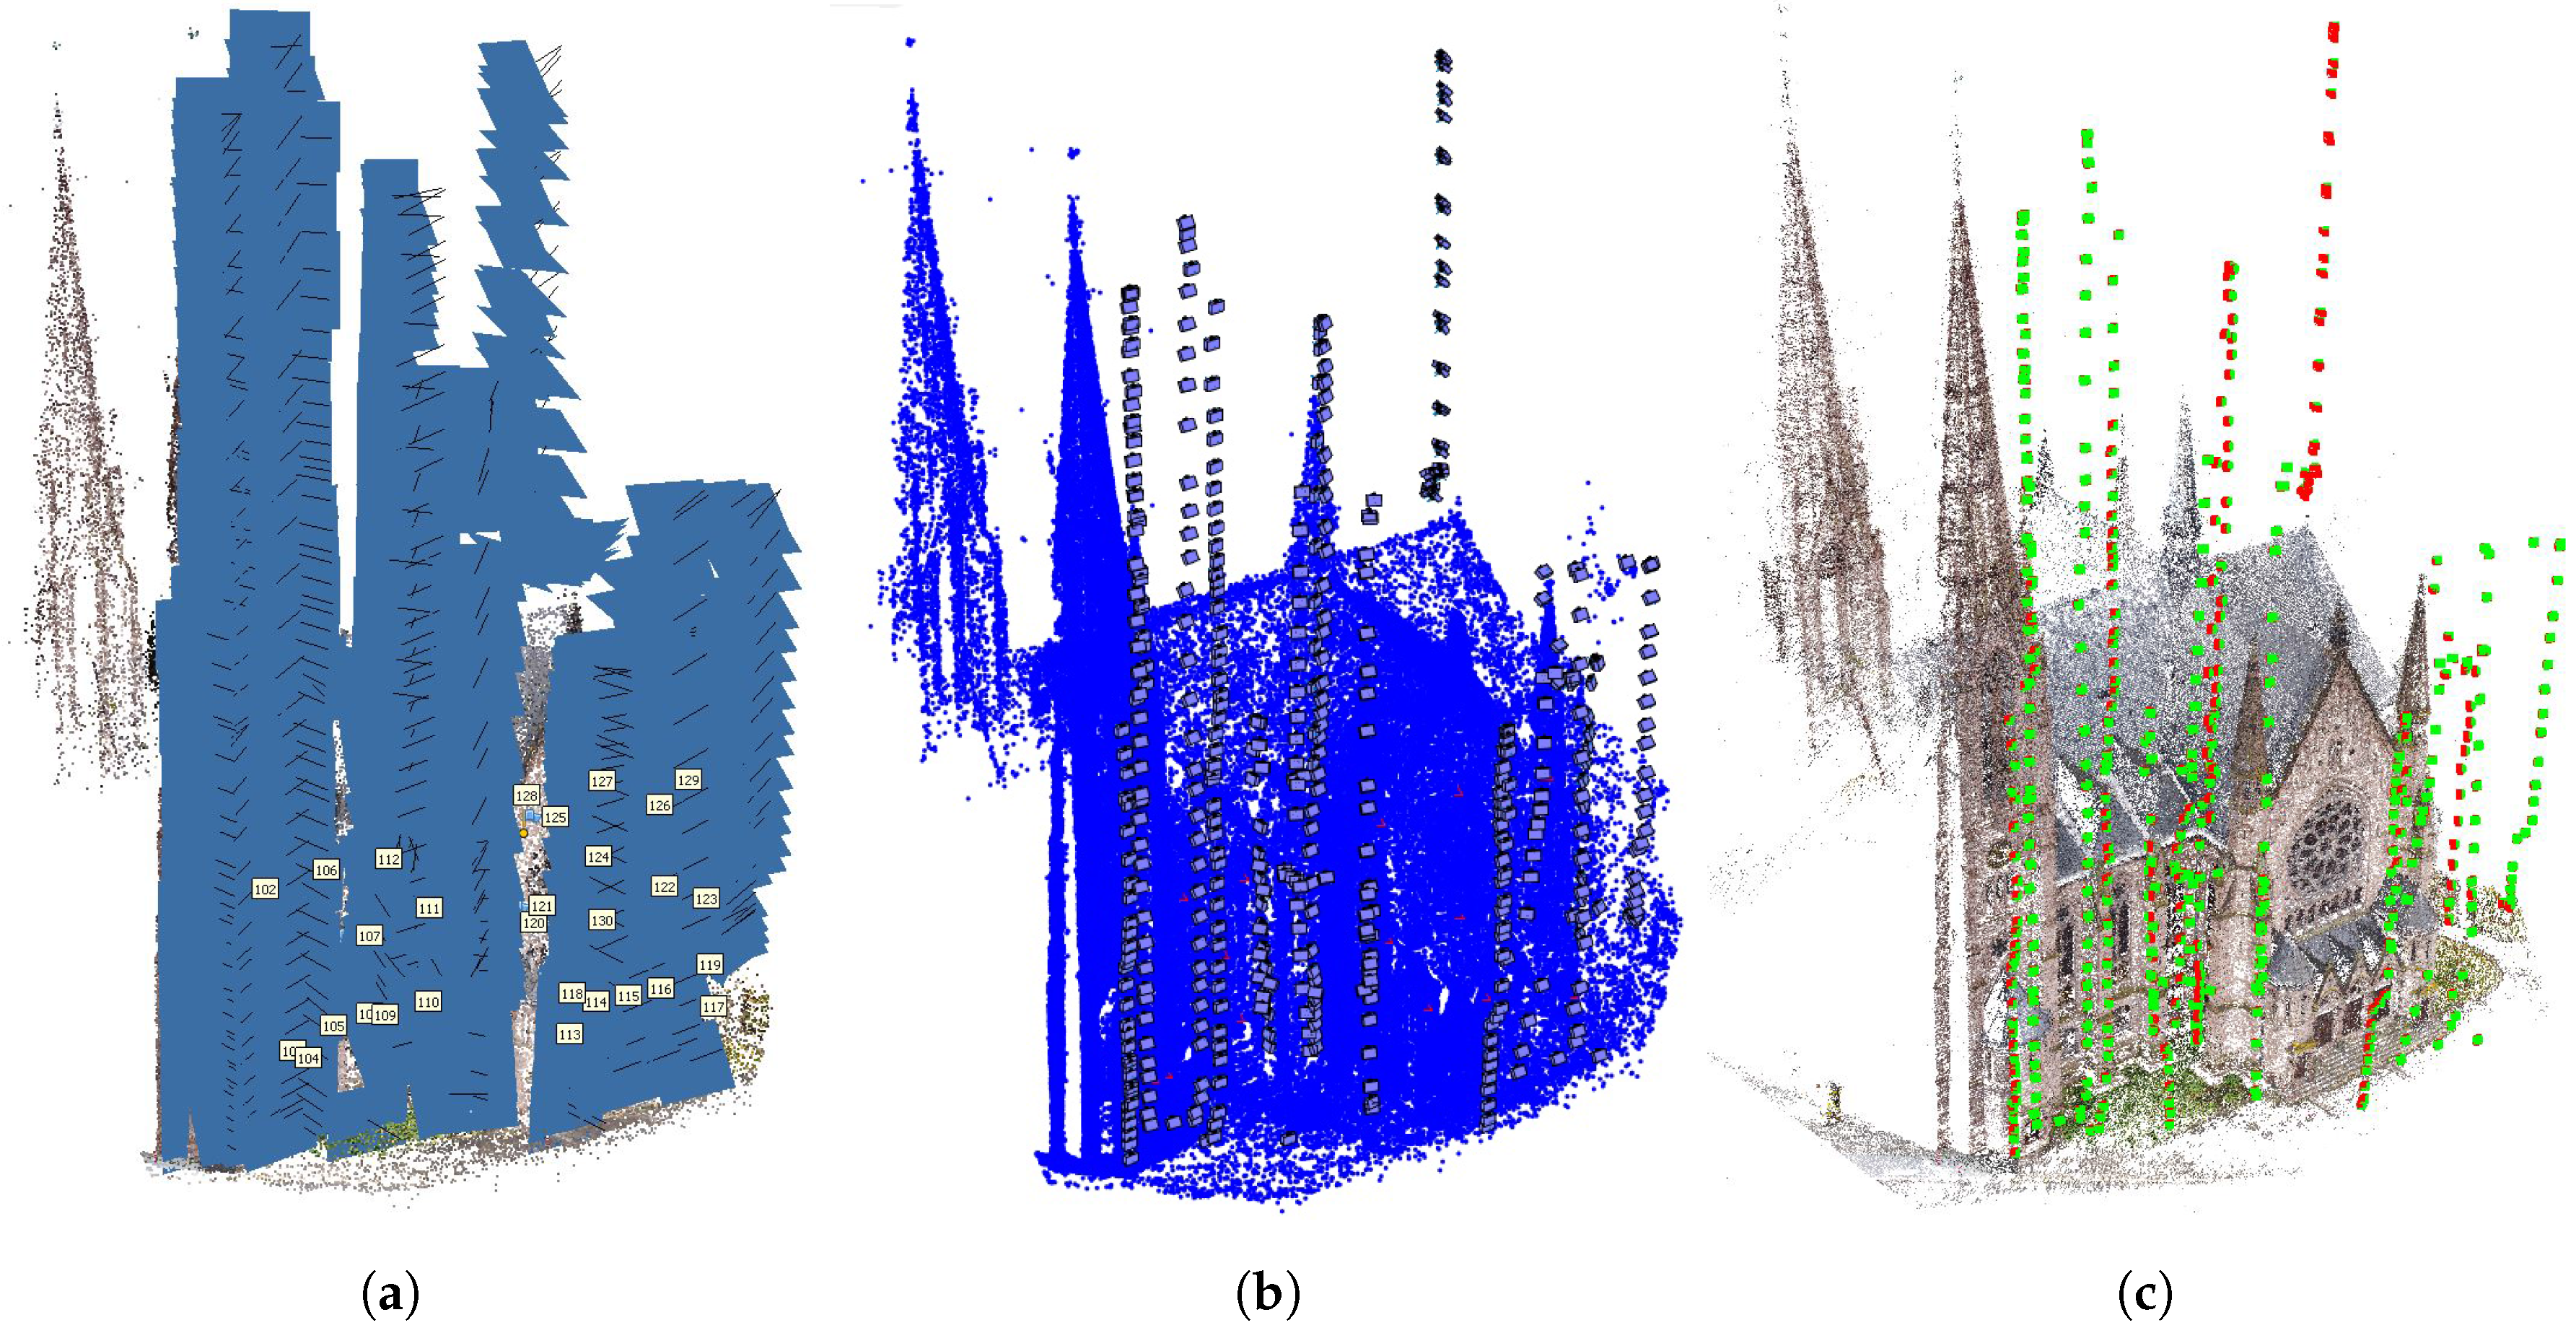
Figure 7.
Project statistics generated by DBAT related to the quality of the images and their exterior orientation parameters. Large point residuals or high standard deviations of the exterior parameters provide clues to problematic areas within the project, as does low image coverage, point count or ray angles.

Figure 8.
Project statistics generated by Apero related to the quality of tie points used in the bundle adjustment process.
Figure 8.
Project statistics generated by Apero related to the quality of tie points used in the bundle adjustment process.

Table 1.
GCP residuals for PhotoScan and DBAT.
| Point | PhotoScan | DBAT | ||||||
|---|---|---|---|---|---|---|---|---|
| X (mm) | Y (mm) | Z (mm) | 3D (mm) | X (mm) | Y (mm) | Z (mm) | 3D (mm) | |
| 102 | 0.9 | 0.5 | 0.3 | 1.1 | −2.0 | 0.0 | 2.0 | 2.8 |
| 103 | −1.6 | 0.0 | 3.7 | 4.0 | −1.0 | −1.0 | 5.0 | 5.2 |
| 104 | −3.5 | 0.1 | 0.0 | 3.5 | −3.0 | −1.0 | 0.0 | 3.2 |
| 106 | −3.2 | −7.4 | −3.3 | 8.7 | −5.0 | −7.0 | −2.0 | 8.8 |
| 107 | 0.5 | 1.7 | −4.2 | 4.6 | 1.0 | 2.0 | −4.0 | 4.6 |
| 109 | −1.7 | 1.9 | 3.2 | 4.1 | −1.0 | 3.0 | 3.0 | 4.4 |
| 112 | 2.8 | −4.8 | 2.9 | 6.3 | 2.0 | −4.0 | 2.0 | 4.9 |
| 115 | −0.1 | 2.1 | −1.2 | 2.5 | −1.0 | 3.0 | −1.0 | 3.3 |
| 117 | 3.3 | 4.4 | 0.7 | 5.5 | 3.0 | 6.0 | 1.0 | 6.8 |
| 118 | 2.8 | −0.4 | 0.7 | 2.9 | 3.0 | −1.0 | 0.0 | 3.2 |
| 120 | −3.1 | −4.6 | −0.8 | 5.6 | −3.0 | −5.0 | 0.0 | 5.8 |
| 122 | 0.5 | −7.0 | −1.0 | 7.1 | 1.0 | −6.0 | −2.0 | 6.4 |
| 127 | 3.6 | 5.5 | −0.3 | 6.5 | 4.0 | 4.0 | −1.0 | 5.7 |
| 128 | −3.4 | 2.9 | 0.5 | 4.5 | −4.0 | 2.0 | 0.0 | 4.5 |
| 129 | −0.1 | −5.7 | 1.5 | 5.9 | 0.0 | −5.0 | −1.0 | 5.1 |
| 130 | 0.9 | 5.3 | −3.4 | 6.4 | 1.0 | 5.0 | −4.0 | 6.5 |
| RMS | 5.3 | RMS | 5.3 | |||||
Table 2.
CP residuals for PhotoScan and DBAT.
| Point | PhotoScan | DBAT | ||||||
|---|---|---|---|---|---|---|---|---|
| X (mm) | Y (mm) | Z (mm) | 3D (mm) | X (mm) | Y (mm) | Z (mm) | 3D (mm) | |
| 105 | 6.3 | −1.7 | −3.2 | 7.3 | 7.0 | −2.0 | −4.0 | 8.3 |
| 108 | −2.7 | 1.9 | 0.7 | 3.4 | −2.0 | 1.0 | 1.0 | 2.4 |
| 110 | −1.5 | 6.5 | −6.2 | 9.1 | 0.0 | 7.0 | −6.0 | 9.2 |
| 111 | 0.8 | 2.0 | 0.1 | 2.1 | 2.0 | 1.0 | 0.0 | 2.2 |
| 113 | −0.1 | −0.5 | −2.7 | 2.7 | 2.0 | −1.0 | −3.0 | 3.7 |
| 114 | 4.7 | 3.0 | −2.5 | 6.1 | 5.0 | 3.0 | −3.0 | 6.6 |
| 116 | 2.6 | −1.3 | −1.3 | 3.2 | 4.0 | 0.0 | −1.0 | 4.1 |
| 119 | 1.4 | −0.1 | 4.1 | 4.3 | −1.0 | 2.0 | 3.0 | 3.7 |
| 121 | −0.7 | −1.4 | 3.2 | 3.5 | 0.0 | −2.0 | 3.0 | 3.6 |
| 123 | 1.0 | 3.6 | −5.9 | 7.0 | 2.0 | 2.0 | −2.0 | 3.5 |
| 124 | −0.6 | 6.7 | −0.9 | 6.7 | 0.0 | 5.0 | −2.0 | 5.4 |
| 125 | 0.1 | 9.7 | −5.7 | 11.3 | 0.0 | 9.0 | −6.0 | 10.8 |
| 126 | −1.1 | 6.1 | 3.8 | 7.3 | 1.0 | 2.0 | 3.0 | 3.7 |
| RMS | 6.3 | RMS | 5.8 | |||||
Table 3.
GCP residuals for PhotoScan and Apero.
| Point | PhotoScan | Apero | ||||||
|---|---|---|---|---|---|---|---|---|
| X (mm) | Y (mm) | Z (mm) | 3D (mm) | X (mm) | Y (mm) | Z (mm) | 3D (mm) | |
| 102 | 0.9 | 0.5 | 0.3 | 1.1 | 1.1 | 0.9 | 0.4 | 1.5 |
| 103 | −1.6 | 0.0 | 3.7 | 4.0 | 4.6 | −1.3 | −5.9 | 7.6 |
| 104 | −3.5 | 0.1 | 0.0 | 3.5 | 1.3 | −0.6 | −4.9 | 5.1 |
| 106 | −3.2 | −7.4 | −3.3 | 8.7 | 2.6 | 17.0 | 1.9 | 17.3 |
| 107 | 0.5 | 1.7 | −4.2 | 4.6 | −0.7 | −4.3 | 5.5 | 7.0 |
| 109 | −1.7 | 1.9 | 3.2 | 4.1 | 1.9 | −2.6 | −4.6 | 5.6 |
| 112 | 2.8 | −4.8 | 2.9 | 6.3 | −1.7 | 6.9 | −2.8 | 7.6 |
| 115 | −0.1 | 2.1 | −1.2 | 2.5 | −1.2 | 0.7 | 0.4 | 1.4 |
| 117 | 3.3 | 4.4 | 0.7 | 5.5 | −10.7 | −5.5 | −2.5 | 12.2 |
| 118 | 2.8 | −0.4 | 0.7 | 2.9 | −3.7 | −1.9 | −1.7 | 4.5 |
| 120 | −3.1 | −4.6 | −0.8 | 5.6 | 6.6 | 1.6 | 6.4 | 9.3 |
| 122 | 0.5 | −7.0 | −1.0 | 7.1 | −1.3 | 4.7 | 6.6 | 8.2 |
| 127 | 3.6 | 5.5 | −0.3 | 6.5 | −3.3 | −5.0 | −0.8 | 6.0 |
| 128 | −3.4 | 2.9 | 0.5 | 4.5 | 5.0 | 2.5 | −0.9 | 5.7 |
| 129 | −0.1 | −5.7 | 1.5 | 5.9 | 1.8 | 5.2 | −0.4 | 5.5 |
| 130 | 0.9 | 5.3 | −3.4 | 6.4 | −1.1 | −7.0 | 4.9 | 8.6 |
| RMS | 5.3 | RMS | 8.0 | |||||
Table 4.
CP residuals for PhotoScan and Apero.
| Point | PhotoScan | Apero | ||||||
|---|---|---|---|---|---|---|---|---|
| X (mm) | Y (mm) | Z (mm) | 3D (mm) | X (mm) | Y (mm) | Z (mm) | 3D (mm) | |
| 105 | 6.3 | −1.7 | −3.2 | 7.3 | −4.1 | −4.3 | 4.1 | 7.2 |
| 108 | −2.7 | 1.9 | 0.7 | 3.4 | 1.8 | −3.8 | −3.1 | 5.2 |
| 110 | −1.5 | 6.5 | −6.2 | 9.1 | 0.6 | −7.2 | 2.9 | 7.8 |
| 111 | 0.8 | 2.0 | 0.1 | 2.1 | −0.6 | −0.2 | −1.3 | 1.4 |
| 113 | −0.1 | −0.5 | −2.7 | 2.7 | 0.7 | −0.5 | 4.2 | 4.3 |
| 114 | 4.7 | 3.0 | −2.5 | 6.1 | −4.3 | −2.5 | 2.3 | 5.4 |
| 116 | 2.6 | −1.3 | −1.3 | 3.2 | −8.1 | 3.6 | −2.2 | 9.1 |
| 119 | 1.4 | −0.1 | 4.1 | 4.3 | −4.9 | 4.7 | −3.5 | 7.7 |
| 121 | −0.7 | −1.4 | 3.2 | 3.5 | −1.4 | 1.2 | −6.8 | 7.1 |
| 123 | 1.0 | 3.6 | −5.9 | 7.0 | −2.5 | −5.3 | 4.3 | 7.3 |
| 124 | −0.6 | 6.7 | −0.9 | 6.7 | −0.5 | −0.6 | 1.3 | 3.7 |
| 125 | 0.1 | 9.7 | −5.7 | 11.3 | −0.1 | 4.7 | 3.2 | 5.7 |
| 126 | −1.1 | 6.1 | 3.8 | 7.3 | −5.6 | 4.4 | −2.8 | 7.7 |
| RMS | 6.3 | RMS | 6.4 | |||||
© 2018 by the authors. Licensee MDPI, Basel, Switzerland. This article is an open access article distributed under the terms and conditions of the Creative Commons Attribution (CC BY) license (http://creativecommons.org/licenses/by/4.0/).
Share and Cite
MDPI and ACS Style
Murtiyoso, A.; Grussenmeyer, P.; Börlin, N.; Vandermeerschen, J.; Freville, T. Open Source and Independent Methods for Bundle Adjustment Assessment in Close-Range UAV Photogrammetry. Drones 2018, 2, 3. https://doi.org/10.3390/drones2010003
AMA Style
Murtiyoso A, Grussenmeyer P, Börlin N, Vandermeerschen J, Freville T. Open Source and Independent Methods for Bundle Adjustment Assessment in Close-Range UAV Photogrammetry. Drones. 2018; 2(1):3. https://doi.org/10.3390/drones2010003
Chicago/Turabian StyleMurtiyoso, Arnadi, Pierre Grussenmeyer, Niclas Börlin, Julien Vandermeerschen, and Tristan Freville. 2018. "Open Source and Independent Methods for Bundle Adjustment Assessment in Close-Range UAV Photogrammetry" Drones 2, no. 1: 3. https://doi.org/10.3390/drones2010003