Prediction of Feed-Rate Slowdowns in Precise Micromilling Processes


1
Institute of Machining Technology (ISF), TU Dortmund University, D-44227 Dortmund, Germany
2
Department of Computer Science (FI), TU Dortmund University, D-44227 Dortmund, Germany
*
Author to whom correspondence should be addressed.
J. Manuf. Mater. Process. 2018, 2(1), 19; https://doi.org/10.3390/jmmp2010019
Submission received: 31 January 2018
/
Revised: 7 March 2018
/
Accepted: 9 March 2018
/
Published: 14 March 2018
(This article belongs to the Special Issue Precision Manufacturing)
Abstract
:In a production of filigree and complex geometries, different NC-controlled processes such as laser cutting, EDM milling, and micromachining require a constant feed rate to ensure high-quality manufacturing results. Due to the technically limited acceleration ability of the machine tool axes, the nominal feed cannot always be achieved. This in particular is the case when the machine tool has to perform a significant change of direction in corners. In this paper, the impact of too low feed rates on the process of precise micromilling of a hardened high-speed steel AISI (M3:2) 63 ± 1 HRC) is discussed. An unattained feed rate leads to a ploughing dominated process with a high burr formation resulting in a huge potential loss of micromilling processes. Furthermore, a simulation approach is presented which allows the prediction of the actually achieved feed rate. The developed machine model provides a reliable method to identify critical areas in the entire NC program.
1. Introduction
Machining is a significant manufacturing technology in mould and die production. In particular, milling enables the machining of various and complex form elements from different materials and is an important technology for manufacturing non-rotational symmetrical components. Micromachining describes a miniaturisation of conventional machining processes [1]. An exactly defined boundary between macro- and microprocessing does not exist. In general, the structure or tool size can be used for differentiation. A tool diameter of d ≤ 1.0 mm is a typical value [2]. The smallest scientifically investigated [3] and commercially available [4] diameter of a micromilling tool is d = 0.01 mm. In comparison to electric discharge micromachining (µEDM) and laser micro ablation, micromachining processes are characterized by a higher rate of material removal and a better surface quality [5].
A reduction of the tool diameter to the submillimetre range with a linear downscaling of the cutting parameters usually leads to a tool failure during a process application. The reason for this are the so-called size effects [6]. A decisive factor is the cutting edge radius of the tool, as it is not scalable to the same extent as the tool diameter [7]. If the micro tools are made of cemented carbide, the grain size of carbides and the manufacturing process constitute the limitation [8]. Currently, many micromilling tools are made of ultra-fine grain carbide with a grain size of about 0.2 to 0.5 µm. This allows cutting edge radii of about rβ = 1.8 µm for the commercially available tools [9].
This results in a strong influence of the cutting edge radius on the chip formation in micromachining. The relevant boundary value, which is required for a defined chip removal during the cutting process, is the so-called minimum chip thickness, hmin [10]. If the current value falls below hmin, friction and deformation processes dominate the machining process. Albrecht already identified the elastoplastic material behaviour in front of the rounding of the cutting edge in 1960 and described this effect as ploughing [11]. Ploughing is usually considered to be undesirable since it leads to a decreased surface quality and an increased stress of the cutting edge [12]. In a milling process with a chip thickness below this boundary value, a burr may form at the bottom of the slot [13] and/or at the edge of the slot [14]. This in turn leads to post-processing steps [15], which has a negative effect on the production costs.
The complexity of machined geometry of the workpiece requires manufacturing programs with intricate NC paths. This results in many direction changes in the feed motion during the milling processing, which has to be performed by the machine axes. Due to the mass inertia of the machine components and the limited capability of the axes acceleration, only two options are possible: path error or velocity slowdowns (reduction in feed rate) [16]. Generally, the velocity slowdowns are tolerable due to the lower impact on the final dimension and shape accuracy of the machined part. This option leads to deceleration and subsequent acceleration operations during the milling process when a change in the direction of movement has to be performed [17]. The consequence of the deceleration at a constant rotational speed is a lower feed rate and, therefore, a reduction in the chip thickness. The reduction in the feed rate leads to a lower material removal rate and productivity of the processes [18]. Nevertheless, in the field of macromachining, the reduced feed rate has usually no negative effects on the tool load and the surface quality when using suitable and common values for the cutting parameters. A different valuation should be assumed for the micromachining.
In micromachining, the value of the feed per tooth of fz < 10 µm are usually used. Therefore, the reduction of the feed rate can result in a lower chip thickness than hmin. This effect is further increased by the need of cutting speeds of vc > 100 m/min and small tool diameters, which results in a requirement of high rotational speeds of n > 35,000 min−1. Despite the small values of the feed per tooth, these correlations lead to comparatively high feed rates of vf > 2000 mm/min. Due to the small size of the workpiece and its complex shapes, a change of direction has to be performed after just a few micrometres. The requirements compared to the macroprocesses increase significantly. While in macromilling a feed rate slowdown is only to be expected in major changes of direction, such as in the area of a corner, all the NC paths can be influenced in the micromilling, which leads to burr formation and ploughing.
Knowing the actual feed rate would allow to consider critical areas in the machining process and to develop suitable process strategies. However, the required data cannot be determined within the framework of the Computer-Aided Design (CAD) and Manufacturing (CAM) process chain [19]. CAM systems only perform an idealized determination of the process time within a geometric simulation [20]. In this case, the time calculation is carried out continuously at the nominal feed rate. In comparison to the actual process times, significant deviations have to be considered [20].
A virtual machine, for example provided by DMG MORI [21], allows considering the kinematic and dynamic behaviour of the machining centre. However, the locally achieved feed rate cannot be analysed.
To improve the process planning, Lavernhe et al. developed an independent approach for predicting the machine performance and the feed slowdown in a NC program [19]. Considering the supposed maximum kinematical capacities (velocity, acceleration, and jerk) they could calculate the relative tool to surface velocity for X, Y, Z, A, and C axes in a sufficient precision for parallel NC paths on a hyperbolic paraboloid surface. For the prediction model, a constant acceleration behaviour of the axes was supposed. Monreal and Rodriguez measured the process time to analyse the actual feed rates [20]. The investigation showed that there is a dependency between the required process time and corner angle of the examined polygon shape. Moreover, they defined a mathematical function to predict the acceleration behaviour of the machine tool.
The effects of feed rate slowdowns on the surface quality have not yet been addressed. Lavernhe et al. presented a geometric modelling of the surface effects using a simulation approach, but did not consider the reduction of the feed rate below a critical value of the feed per tooth and therefore ploughing effects [22,23]. Freiburg et al. predicted the feed rate for high-feed milling of free formed surfaces. The investigations focused on the effects of feed slowdowns on the formation of surface structures in macromachining [24].
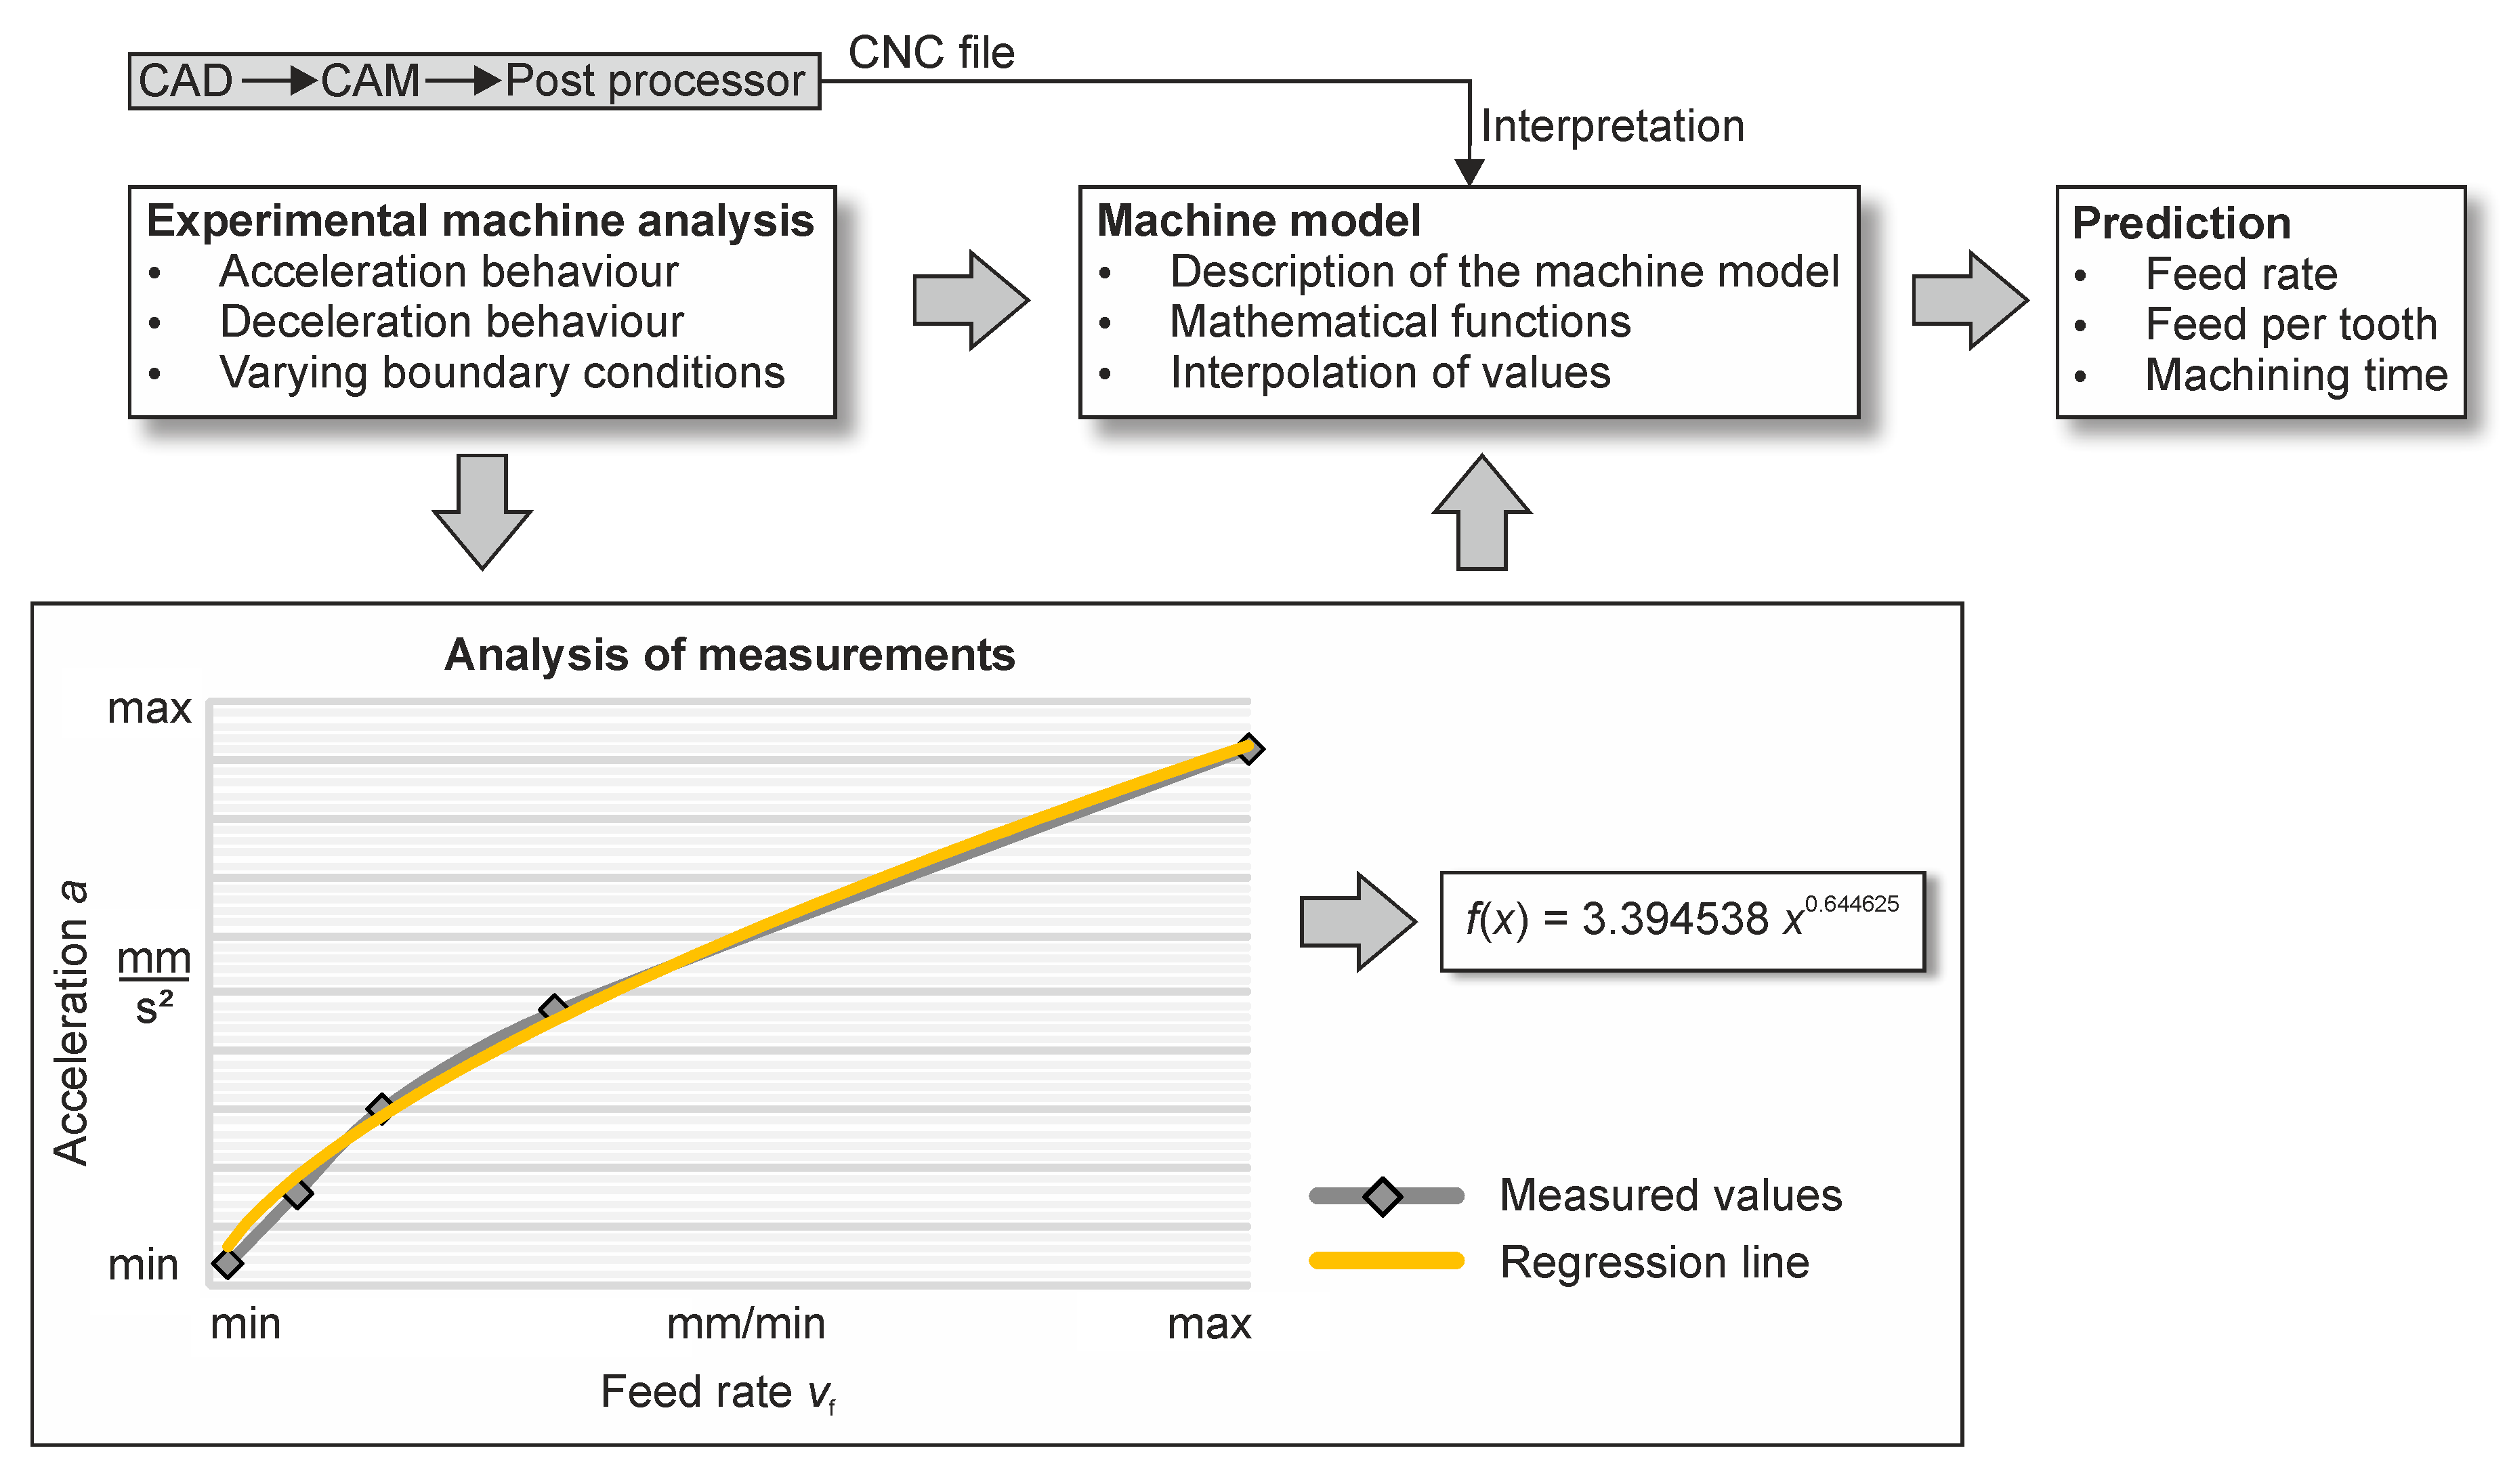
This paper focusses on the effects of the feed rate slowdowns on the surface quality in precise micromilling of a hardened high-speed steel AISI (M3:2) (63 ± 1 HRC). The aim was to determine the boundary values of the feed per tooth in experiments and to identify too low feed rates for the micromilling process. The evaluation of the values was carried out considering the burr formation. To realize the transfer from slot milling to processes with complex engagement situations, a simulation approach is presented which allows the analysis of different NC programs. For this approach, a machine model was developed which is based on the machine behaviour measured (Figure 1). Using this approach, the actually achieved feed rates can be predicted and, therefore, critical areas of too low feed per tooth values can be identified in the entire NC program. In addition, the visualization of such areas can be used to modify NC paths in a CAM system.
2. Materials and Methods
In the following, the experimental setup is defined. Section 2.1, Section 2.2 and Section 2.3 include the specification of the machine tool, micromilling tools and workpiece materials used in the investigation, respectively. Section 2.4 describes the analysis of acceleration behaviour.
2.1. Machine Tool
The experiments were conducted on the CNC-controlled machine HSPC 2522. Due to the high positioning accuracy and repeatability of ±1 µm and a maximum spindle speed of n = 160,000 min−1, this machining centre is well suited for micromachining. According to the technical specifications, a maximum feed rate of vf = 6000 mm/min and an acceleration of the axes of a = 2000 mm/s2 can be achieved. The machine tool is based on a polymer concrete foundation. To limit the distortion of the machine due to the thermal expansion, the room is constantly conditioned to a temperature of 20.8 °C ± 0.1 °C.
2.2. Milling Tools
To identify the lower boundary values for the feed per tooth, micro end-milling cutters with a tool diameter of d = 1.0 mm and a corner radius of rε = 0.05 mm were used. The tools had two cutting edges with a helix angle of λ = 0° and rake angle of γ = 0°. The tools were made of ultra-fine carbide (WC-Co) and were PVD-coated with a TiAlN coating suitable for hard machining. The cutting edges of the tool were ground sharp and had a cutting edge radius of rß = 1.8 ± 0.3 μm as well as an average edge roundness of = 1.0 ± 0.4 μm. The manufacturing of the cavity (e.g., Section 4) was carried out with a ball-end milling cutter with the same tool characteristic.
2.3. Materials
The investigations were carried out in the cobalt-free high-performance high-speed steel AISI (M3:2) (ASP®2023). Due to its high material toughness, this high-performance high-speed steel is preferred for the manufacture of highly stressed tools. It is well suited for the manufacturing of cold working tools such as punches and dies, cold extrusion tools, deep-drawing tools, sintering press tools as well as conventional cutting tools with high demands on tool life [25]. The steel AISI (M3:2) had an average grain size of approximately 3 µm due to the powder metallurgical production. The carbides were homogeneously dispersed. By analysing micro sections of samples, the proportion of about 12% was determined. The material was hardened to a Rockwell hardness of 63 ± 1 HRC.
2.4. Analysis of the Acceleration and Deceleration Behaviour
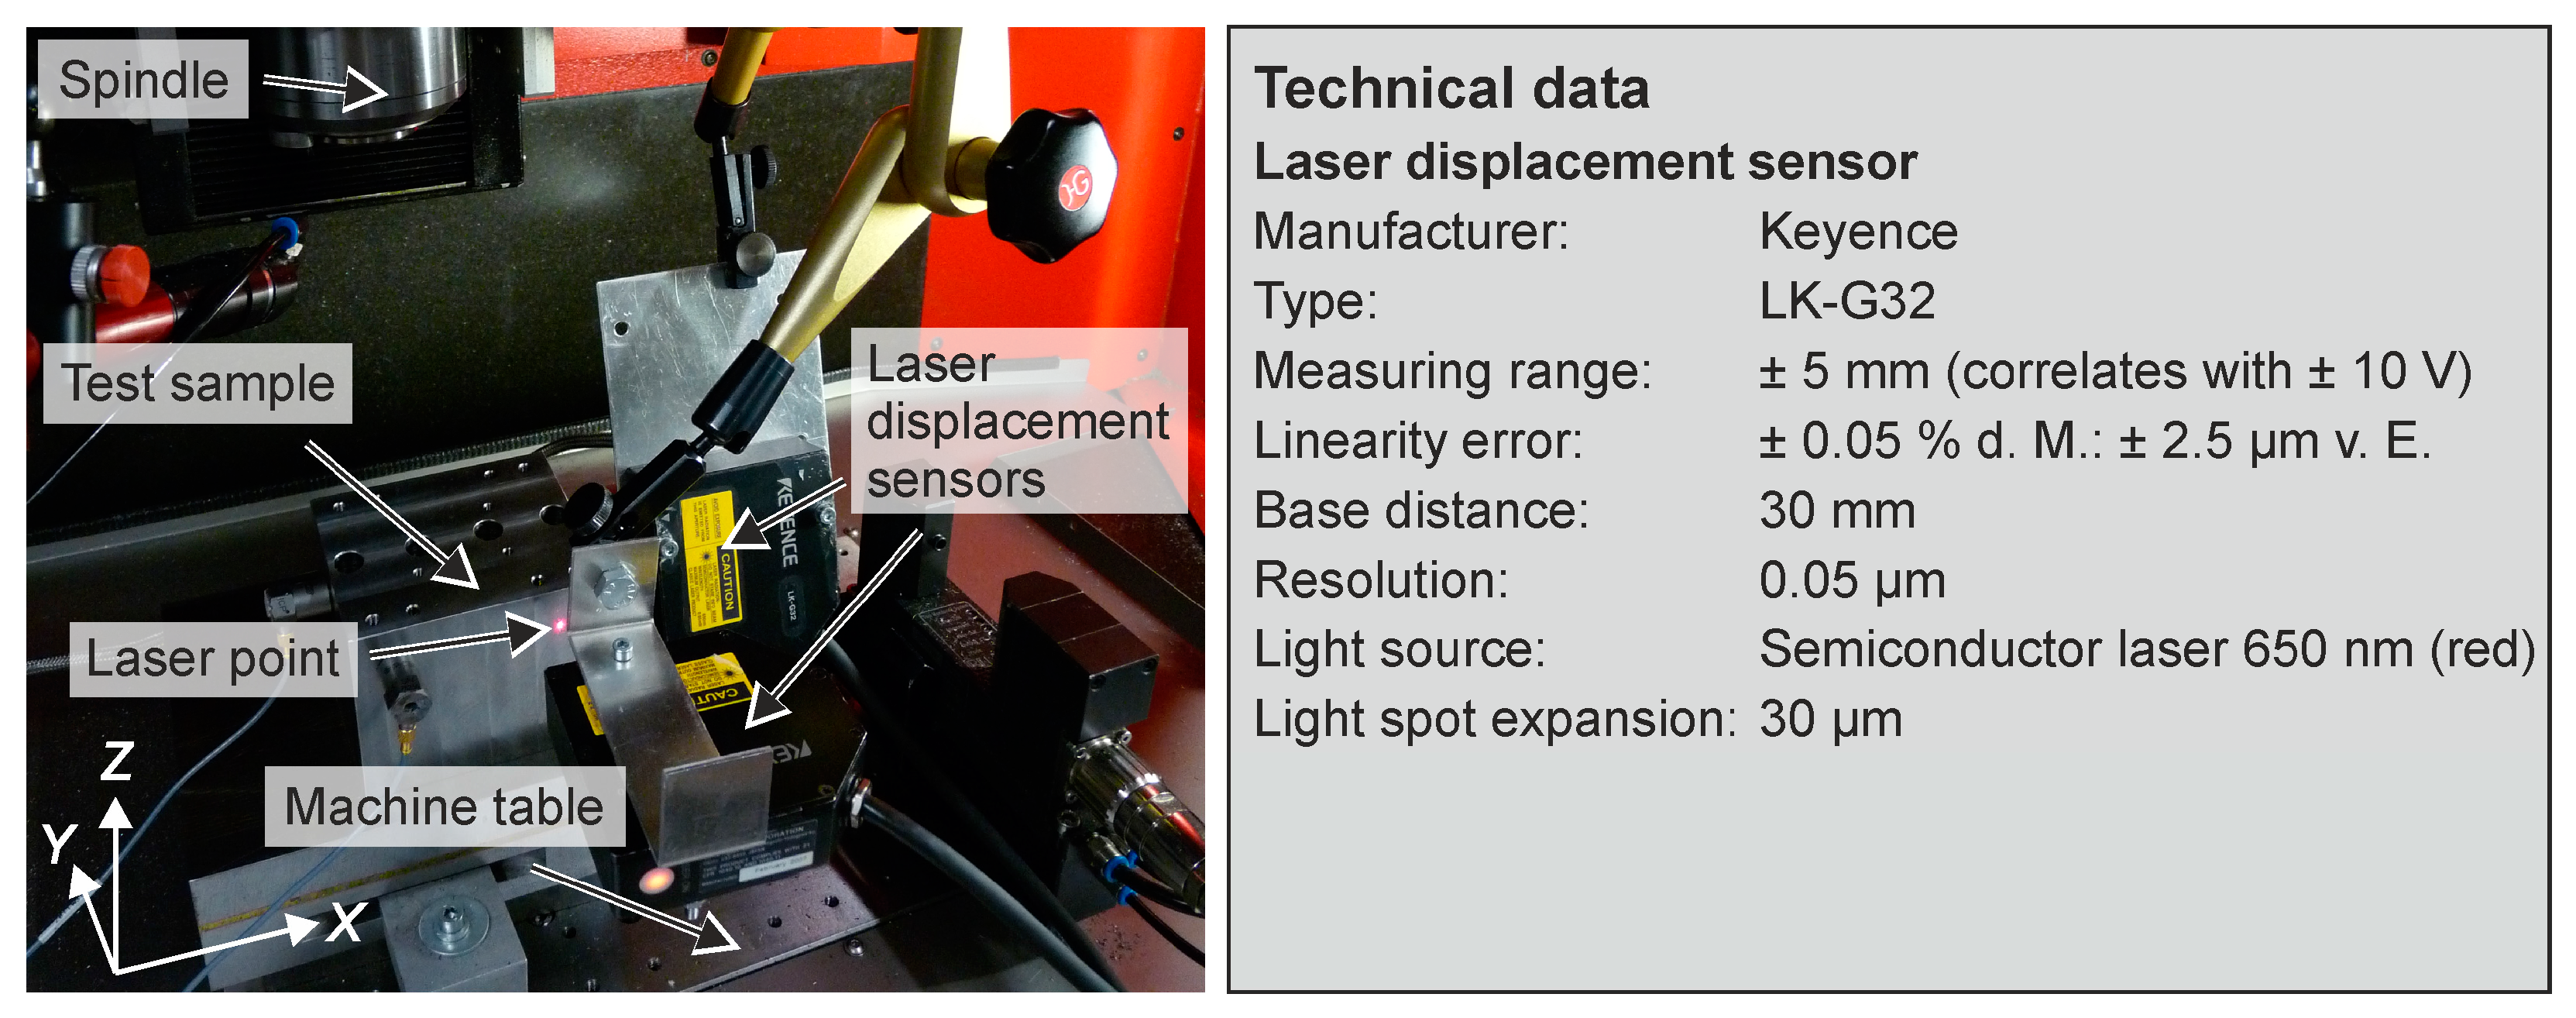
The determination of the acceleration and deceleration behaviour of the machine axes was achieved by using laser displacement sensors, which enabled a detailed recording of the positional changes. The specifications of the laser sensor provide a reliable detection of motion changes in the range of less than one micrometre (Figure 2). The laser sensors were positioned in the X and Y directions of the machine coordinates. The position of the test sample was adjusted to the middle point of the laser measuring range. The influence of the additional load on the machine axes using samples with different weight was examined. No load-related changes were detected during several test runs.
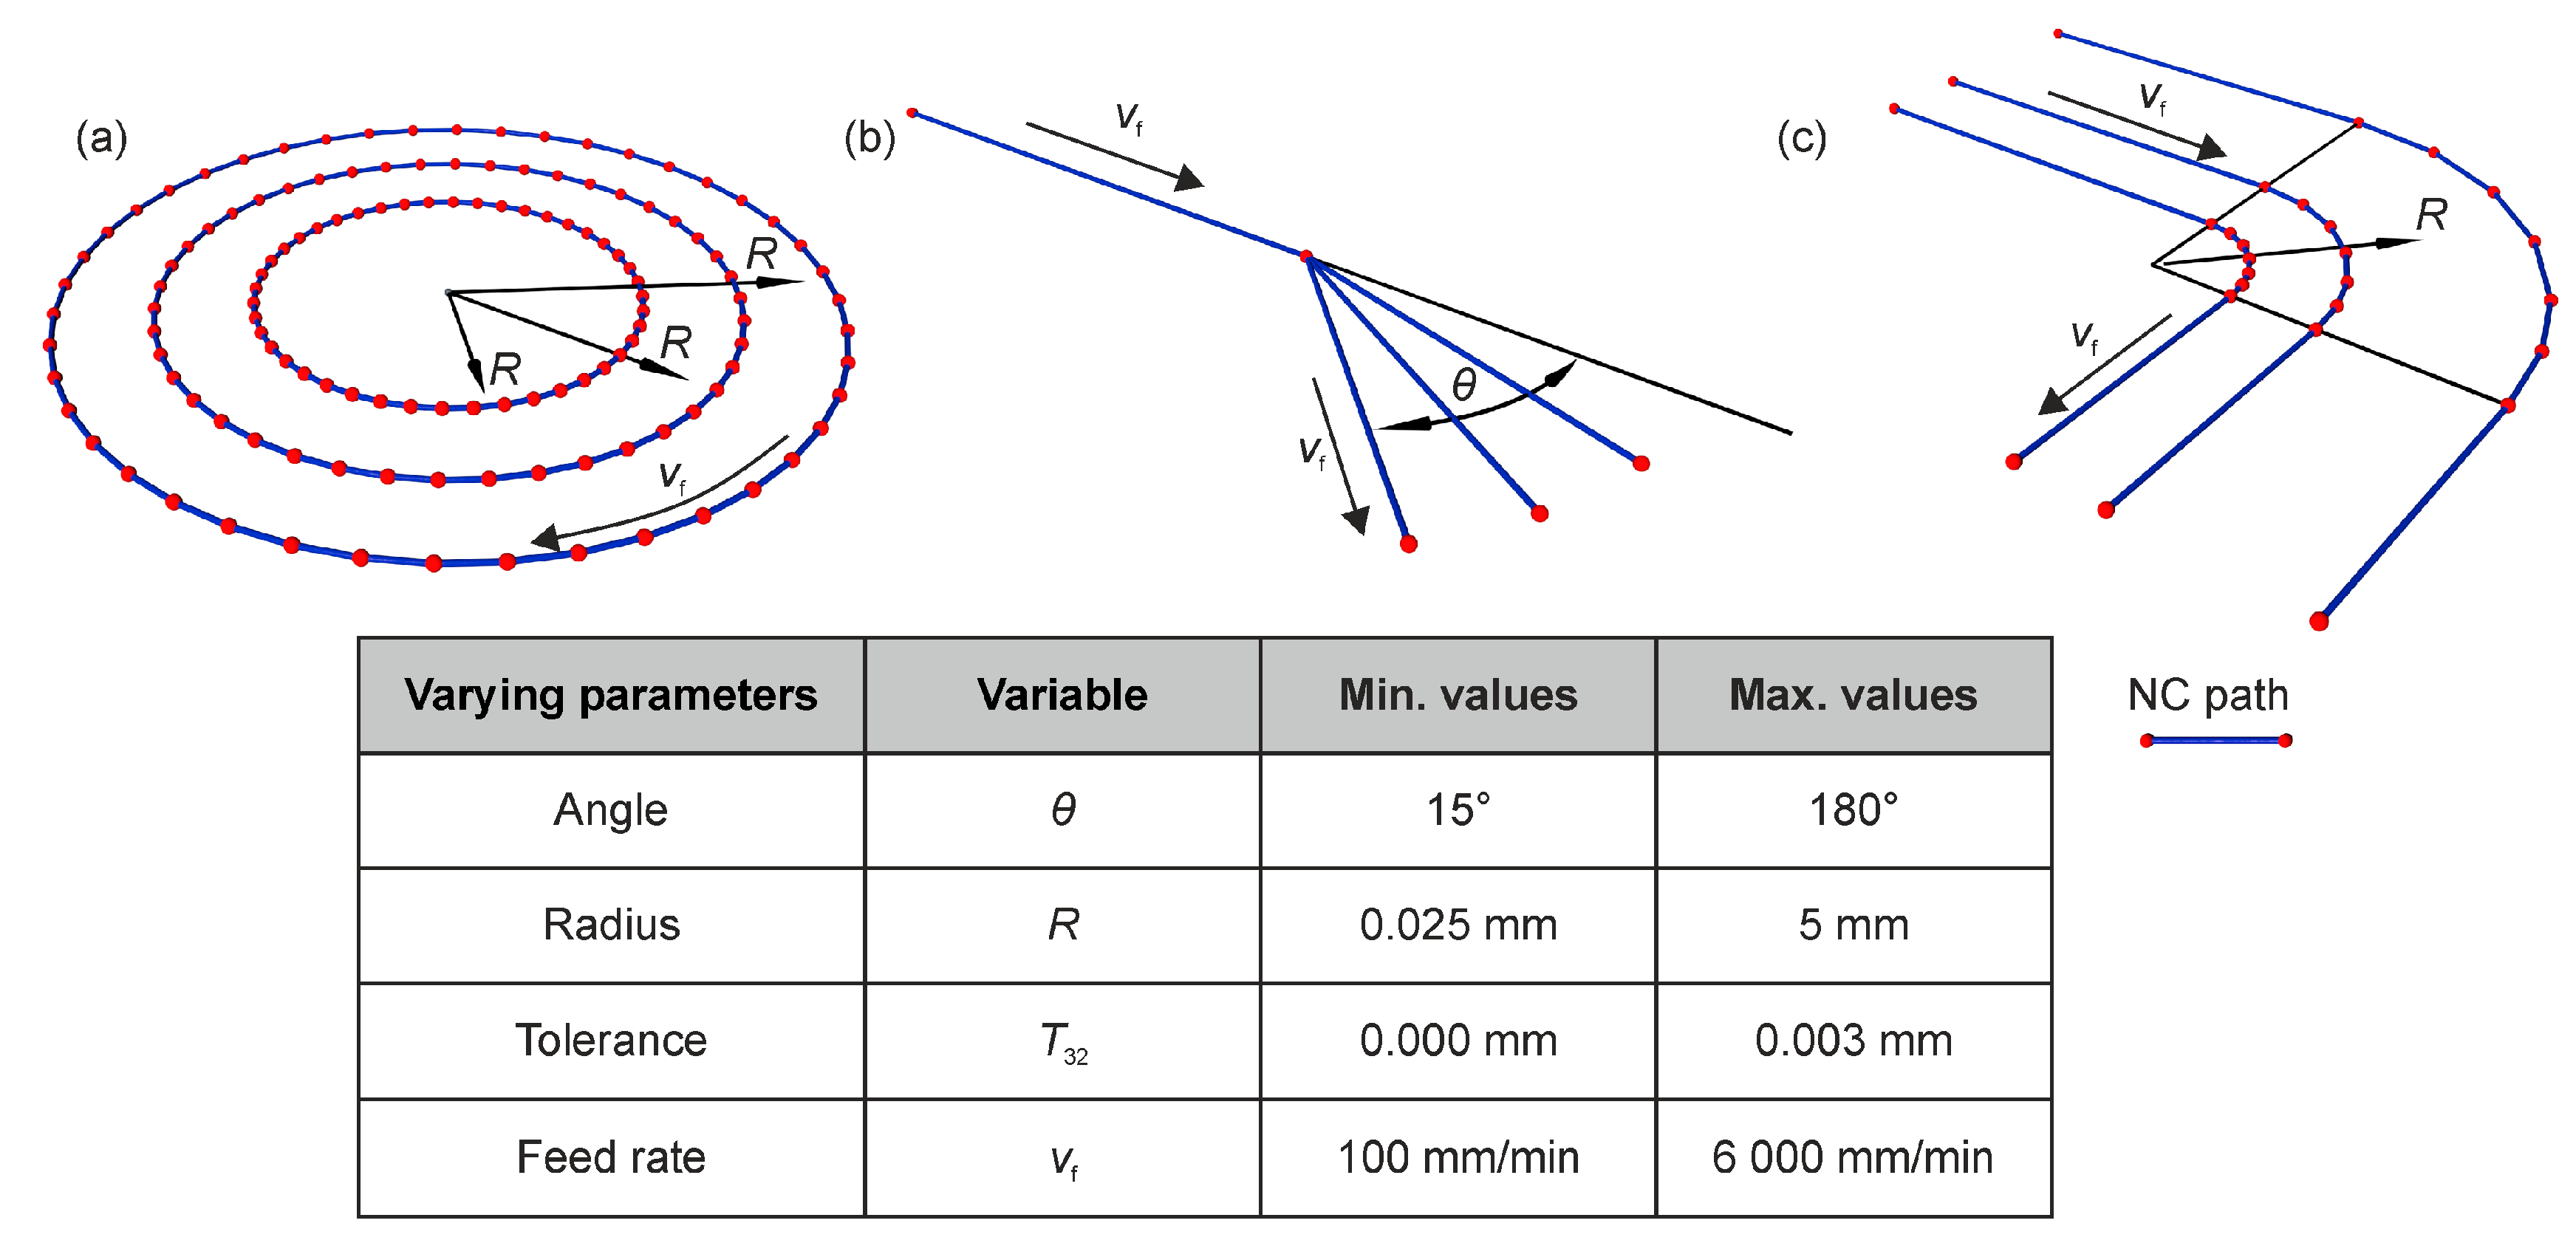
Simple movements of the machine axes were recorded and analysed under varying process settings to map the machine behaviour. Angles θ, radii R, manufacturing tolerances T32 and feed rates vf were varied within investigated intervals shown in Figure 3. The angle θ represents a change in direction (Figure 3b). The manufacturing tolerance T32 is the tolerance defined in Cycle 32 (Heidenhain control or ISO 6983: G62). A higher tolerance value allows the machine control system to deviate significantly from the specified NC points to achieve a smoother NC path and a higher feed rate [26]. The combination of a linear motion and a circular path was also investigated (Figure 3c).
3. Results of the Machining Analysis, Machine Measurement and Modelling Process
In the following, the results of the machining investigation and the analysis of the machine behaviour are presented. The machine model is then described. The validation of the model is carried out using simple machining programs for pocket milling.
3.1. Influence of Varying Feed Rates on the Machining Result
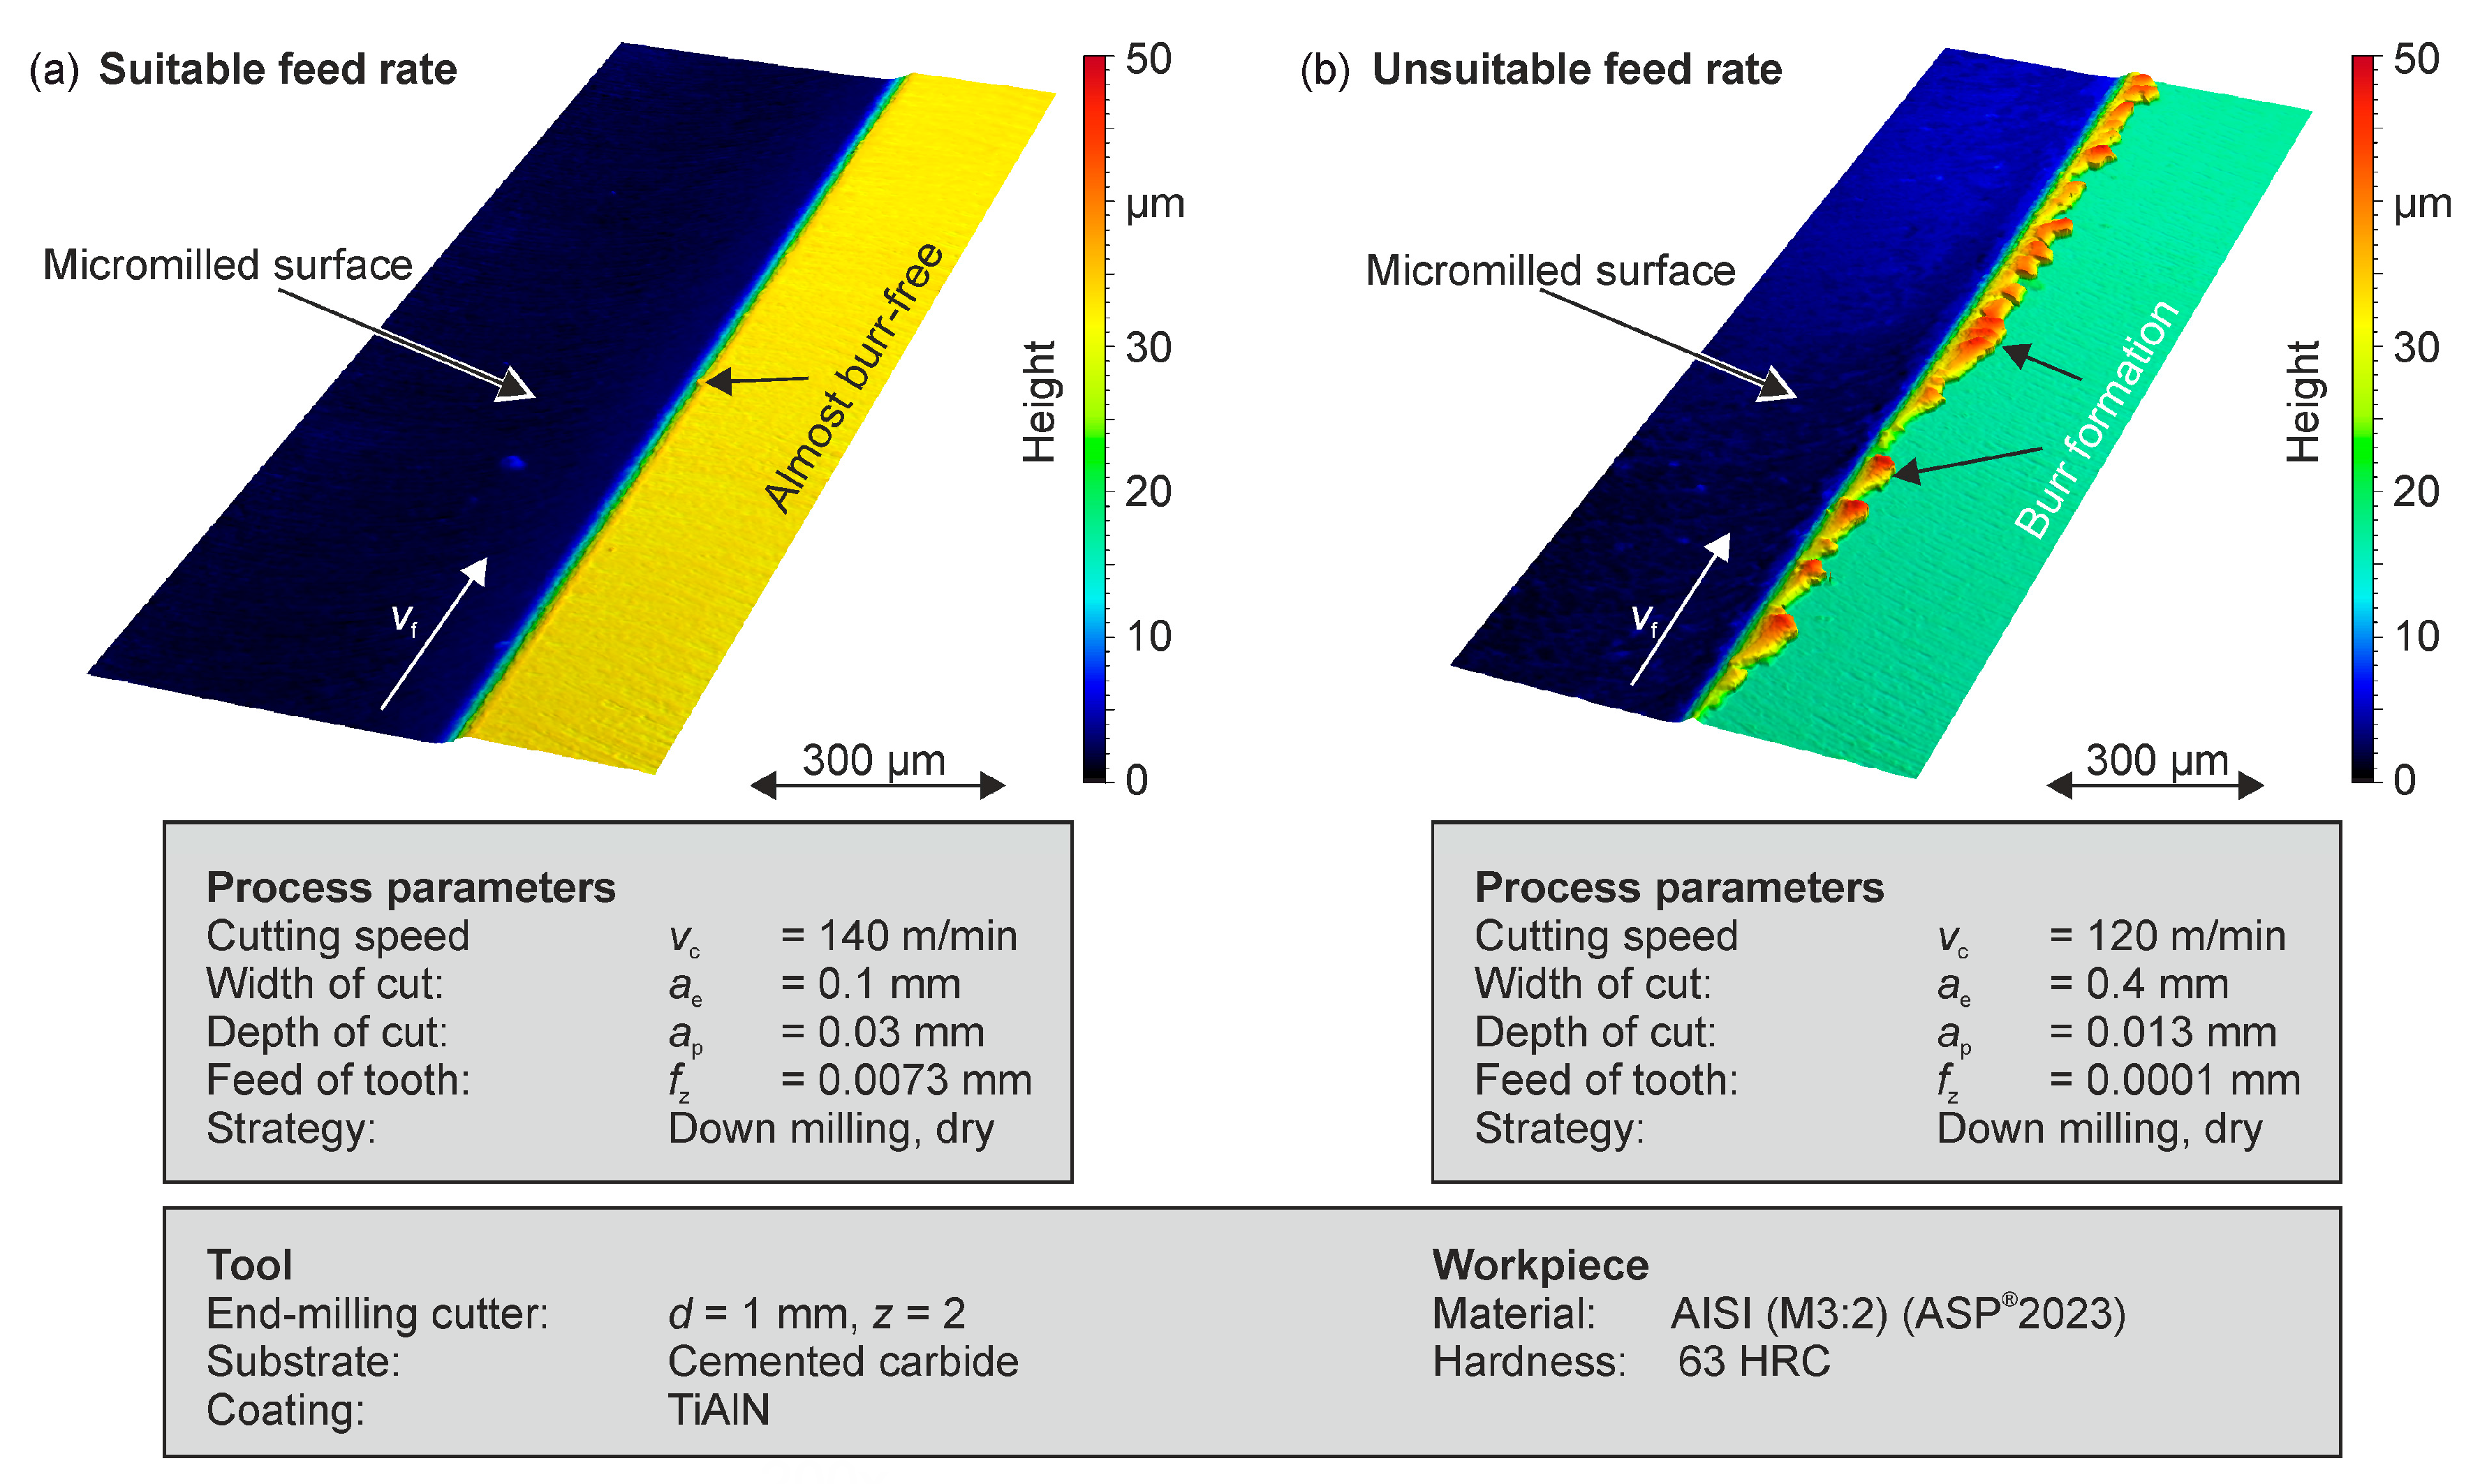
Surface quality is an important evaluation criterion for all common manufacturing processes. This can be carried out by determining the roughness and waviness values, the burr size as well as the residual stress in the subsurface. Machining hardened tool steels generally leads to a lower burr formation and surface roughness than cutting softer materials. However, an adverse setting of cutting parameters can still lead to an undesired burr formation. In particular, if the maximum chip thickness of a tool engagement is less than the value of the minimum chip thickness, a ploughing dominated process is the consequence (Figure 4).
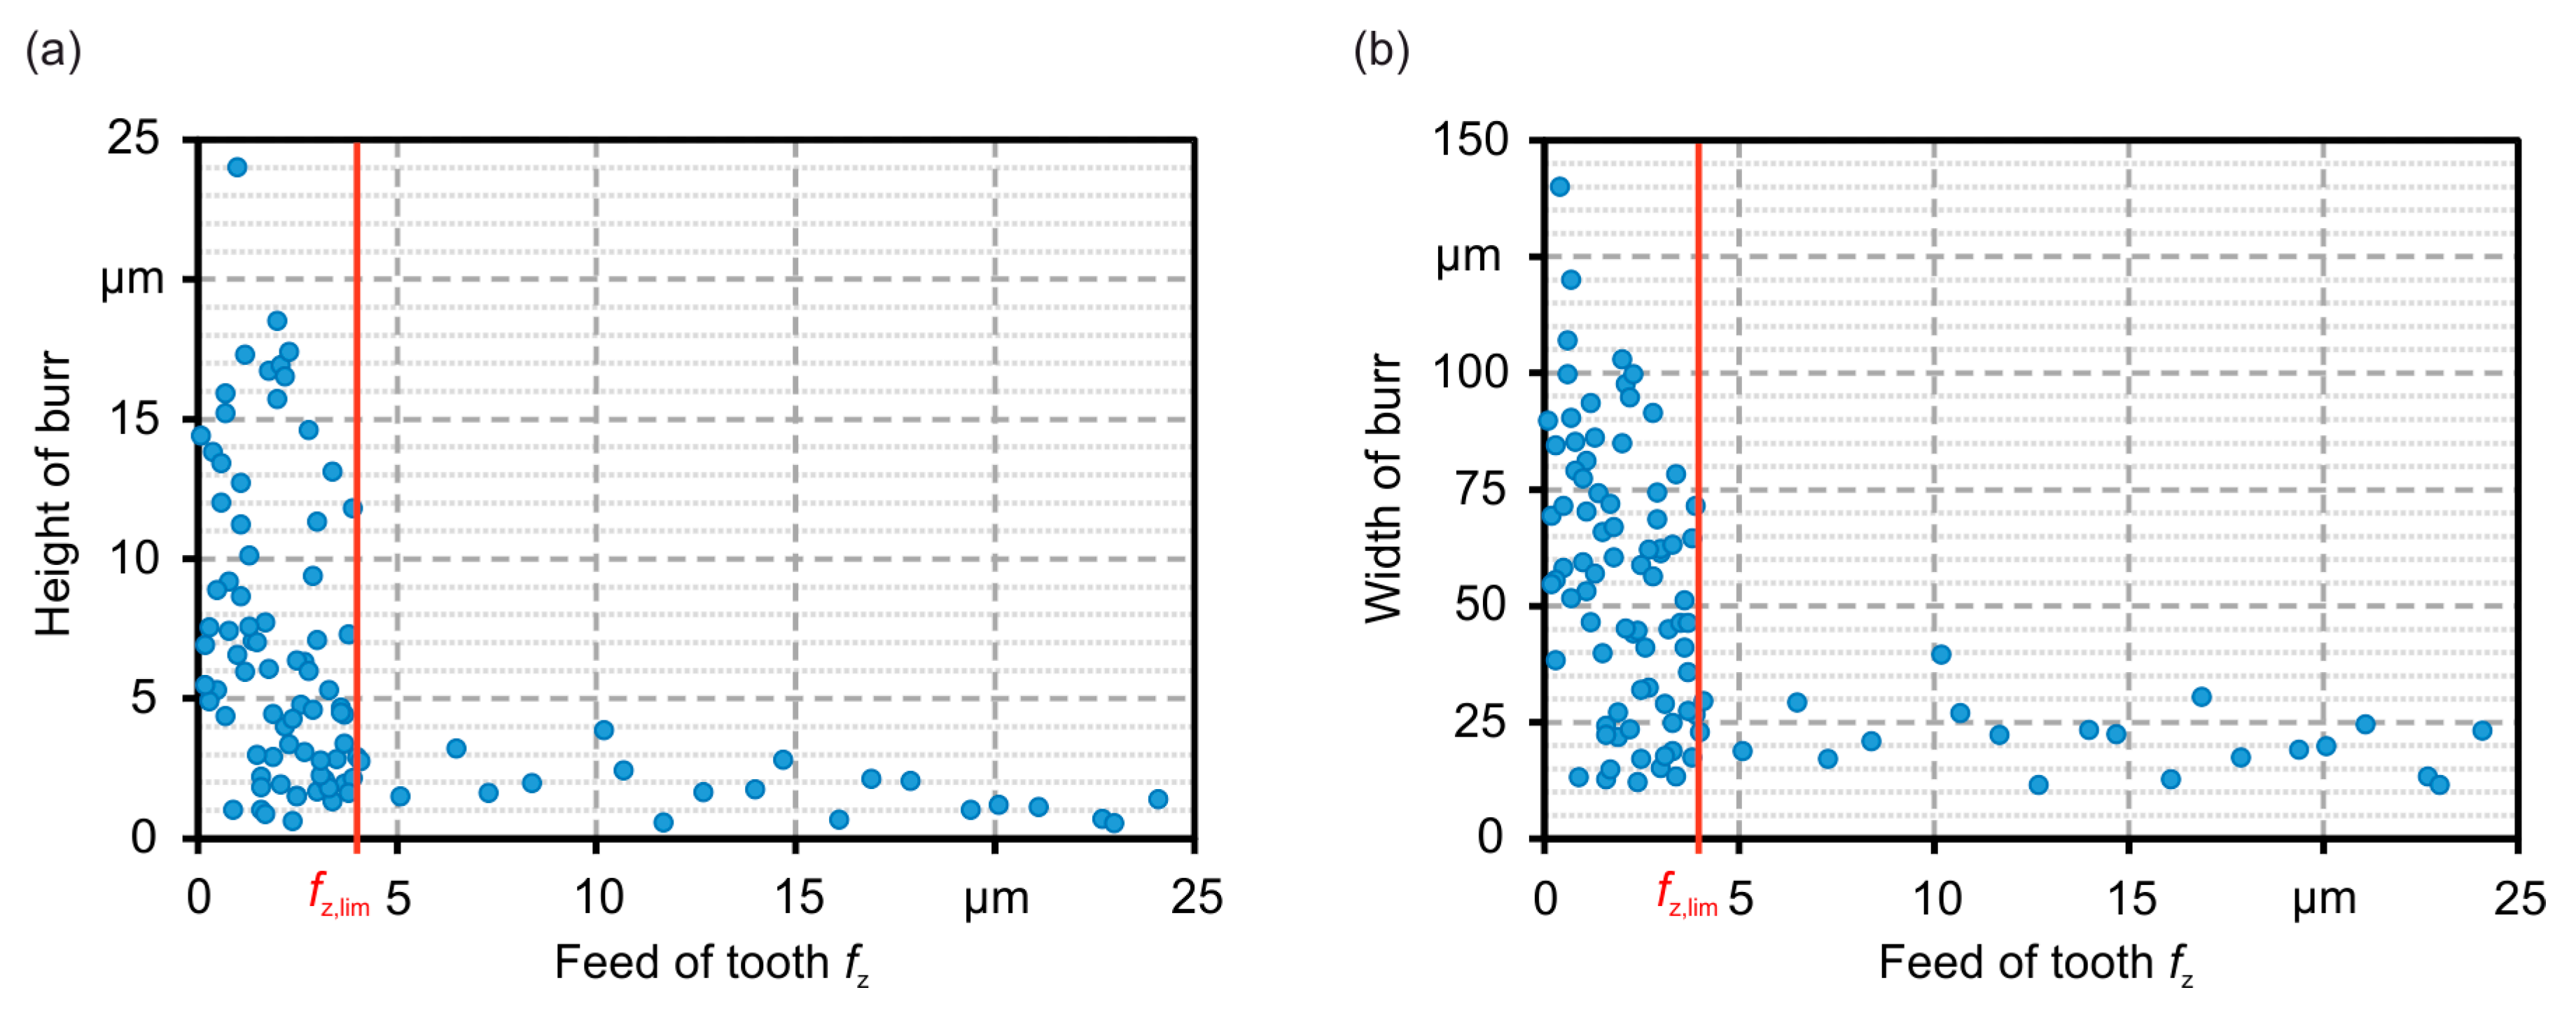
The influence of the feed per tooth on the height of the burr is presented in Figure 5a. Based on the measurement system used and the subsequent evaluation, an uncertainty of ±1.5 μm can be assumed. In the parameter field examined, with tooth feeds of fz > 4 µm no significant dependency was detected. In this range, the height of burr was usually below a value of h0 = 2.4 µm, irrespective of the variation of other cutting parameters (vc, ap, ae). The height of burr only increases significantly in case of tooth feed rates smaller than fz < 4 µm. The same correlation of the feed per tooth was determined for the width of burr, as shown in Figure 5b.
The machining investigation clearly shows that in the micromachining of the hardened high speed steel AISI (M3:2), too low feed rates lead to an unfavourable process with stronger ploughing. The higher amount of plastic deformed material is initially visible by an increase in burr formation. For further consideration, the critical boundary value of the feed per tooth is derived from fz = 4 µm. To take this boundary value into account when designing machining programs, an analysis of the NC program is required, which can determine the real tooth feed rate at any time based on the acceleration behaviour of the machine. In the following, the approach for analysing the acceleration behaviour of the machine is presented.
3.2. Analysis and Evaluation of the Machine Behaviour
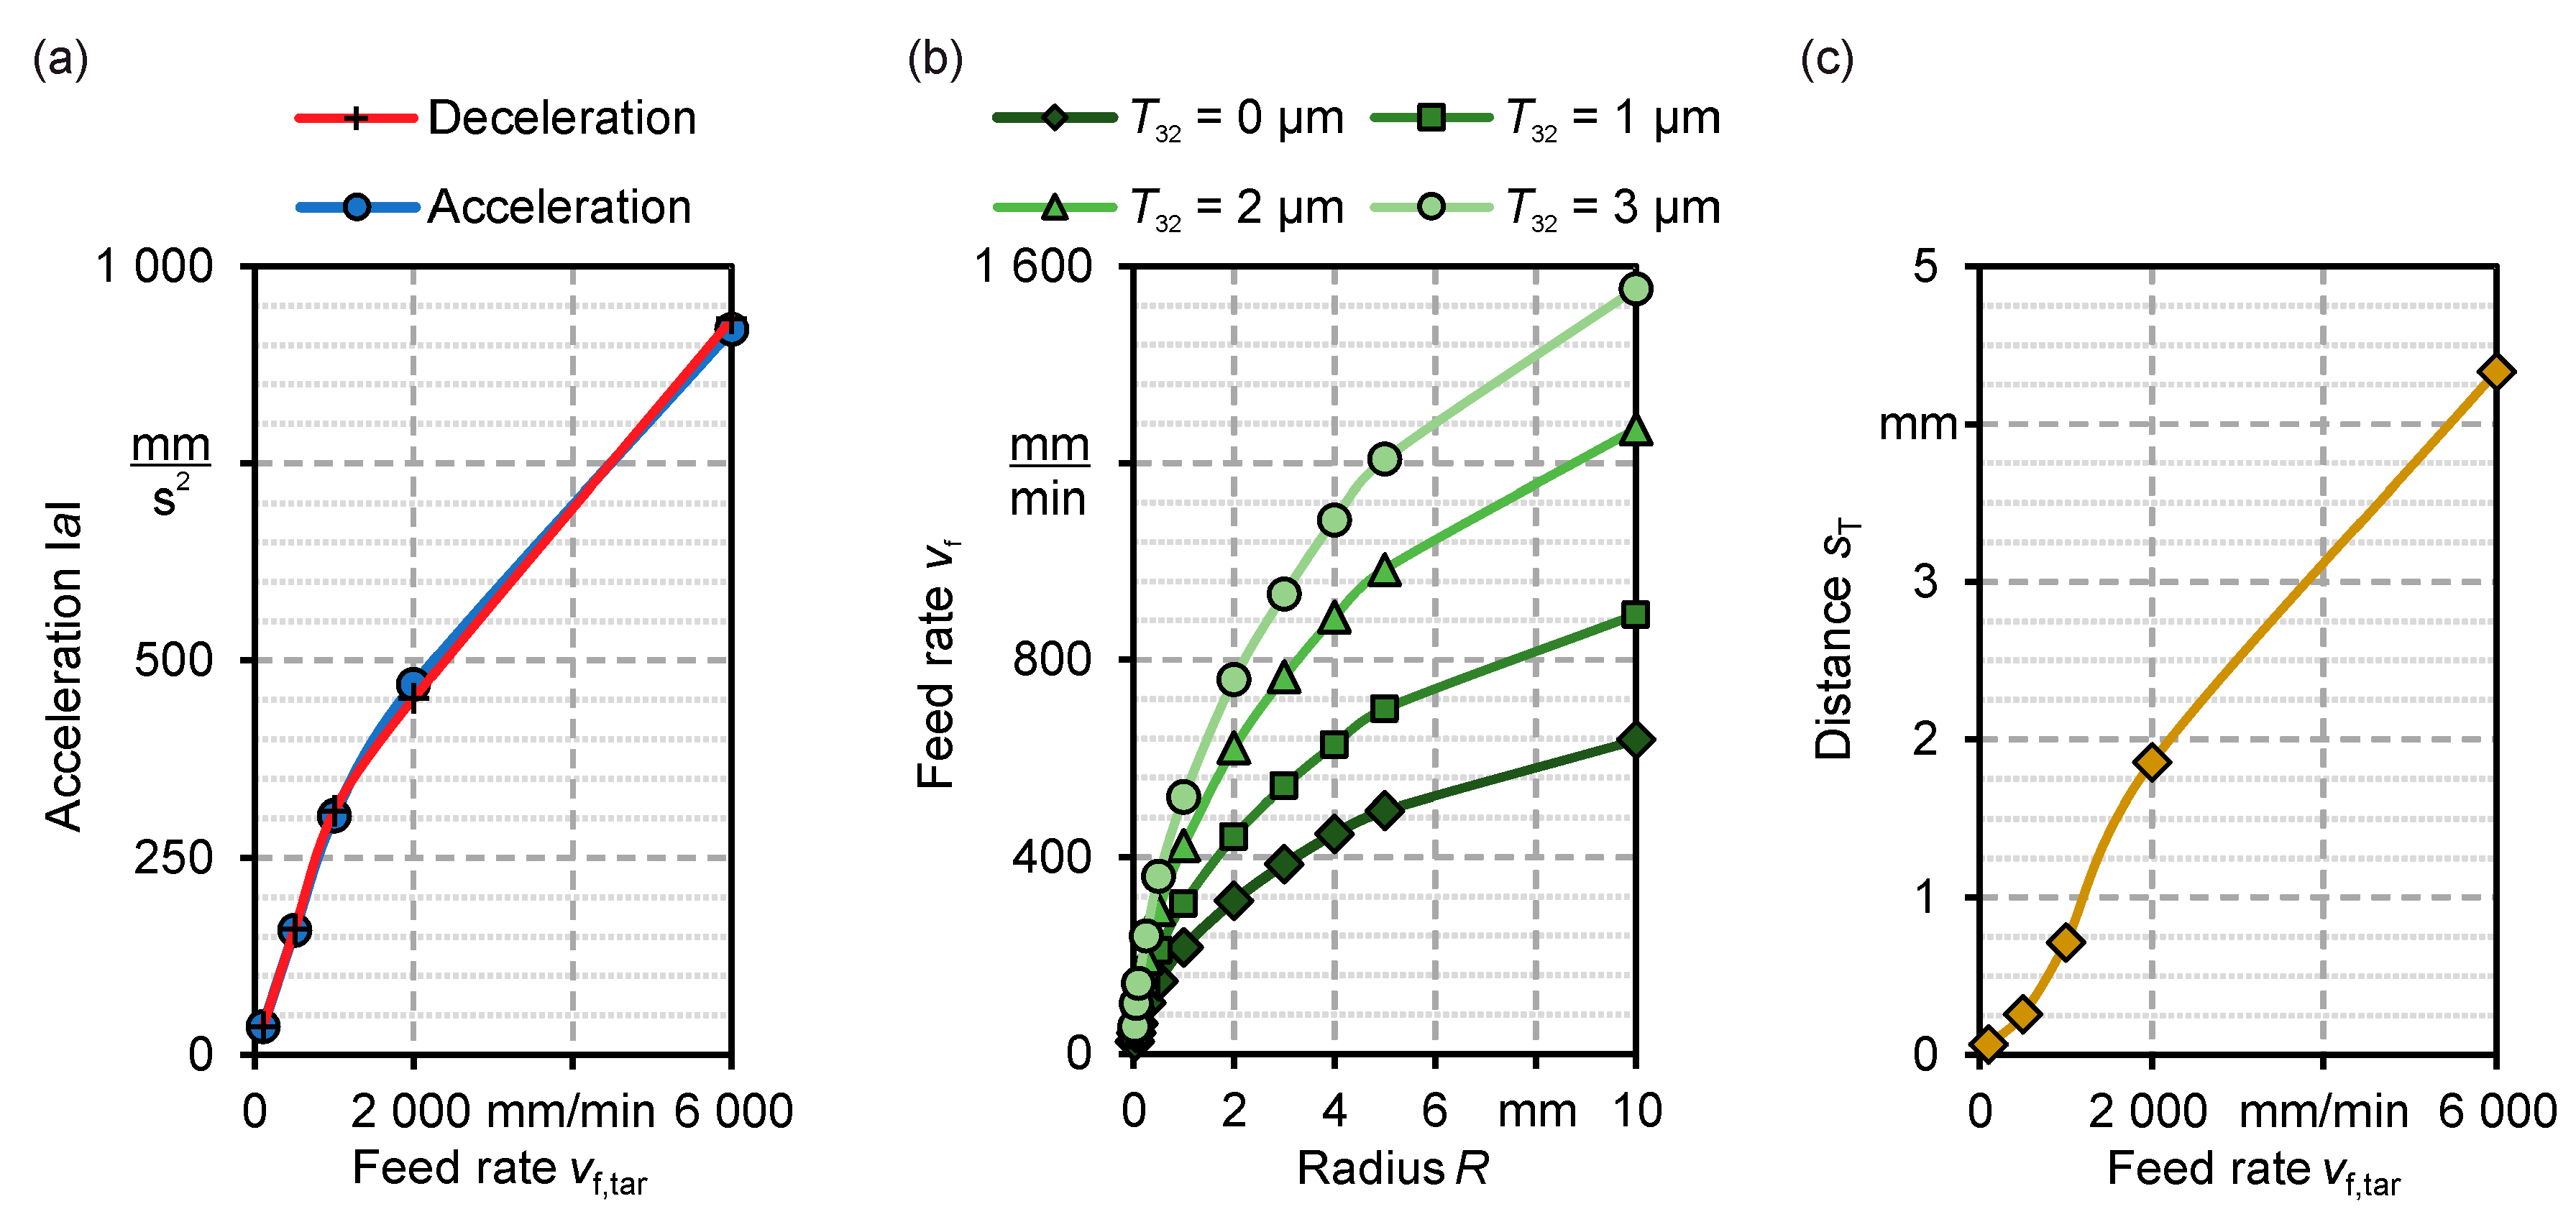
The evaluation of the motion data provides information about the behaviour of the machine axes. If there is a change of direction, the speed of movement will initially be reduced in the current direction until it comes to a standstill. Afterwards, an acceleration in a new direction was performed. The results show that the values for acceleration and deceleration are almost identical under the same boundary conditions (see Figure 6a). For this reason, the following results are presented only for the acceleration. Furthermore, a maximal acceleration of a = 940 mm/s2 was measured for one axis. The manufacturer’s specification of an acceleration value of a = 2000 mm/s2 could not be determined at any time. An influence of a varying angle θ of the change of direction on the acceleration behaviour could not be identified as well. However, the influence of the predetermined feed rate is significant. The higher the value of the feed rate, the greater the acceleration of the machine is. The behaviour is non-linear and can be described using a logarithmic function (Figure 6a). The repeatability of the process was analysed in different tests. Since the deviations in the determined values were significantly less than 1%, the standard deviation is not indicated in the following.
If the milling machine has to move along a circular path, the nominal feed rates cannot usually be achieved. Therefore, the maximum feed rates differ from those of the linear movements. The maximum speed in the curved section depends primarily on the radius of the arc (Figure 6b). The evaluation of the performance of the machine axes showed a logarithmic behaviour in relation to the radius R. The tolerance value T32 also has a high impact on the machine behaviour. By changing this value by a few micrometres, e.g., from T32 = 0 µm to T32 = 2 µm, the maximum speed within the circular motion can be doubled (see Figure 6b).
Before changing the direction of movement, the machine control has to initiate the speed change at a certain distance in order to achieve a necessary deceleration or a timely stopping of the axes. The analysis of the value for this distance sT indicated no dependency on the angle θ. Furthermore, at higher feed rates, the deceleration has to be initiated at an earlier time, as the machine requires a longer distance for this operation (see Figure 6c). At a feed rate of vf,tar = 6000 mm/min, the distance is sT = 4.333 mm.
The machine behaviour can be adequately modelled even for complex processes if the acquired data on the acceleration behaviour is considered. This enables a realistic simulation of the actual feed rates.
3.3. Acceleration Model for Computing the Feed Rates
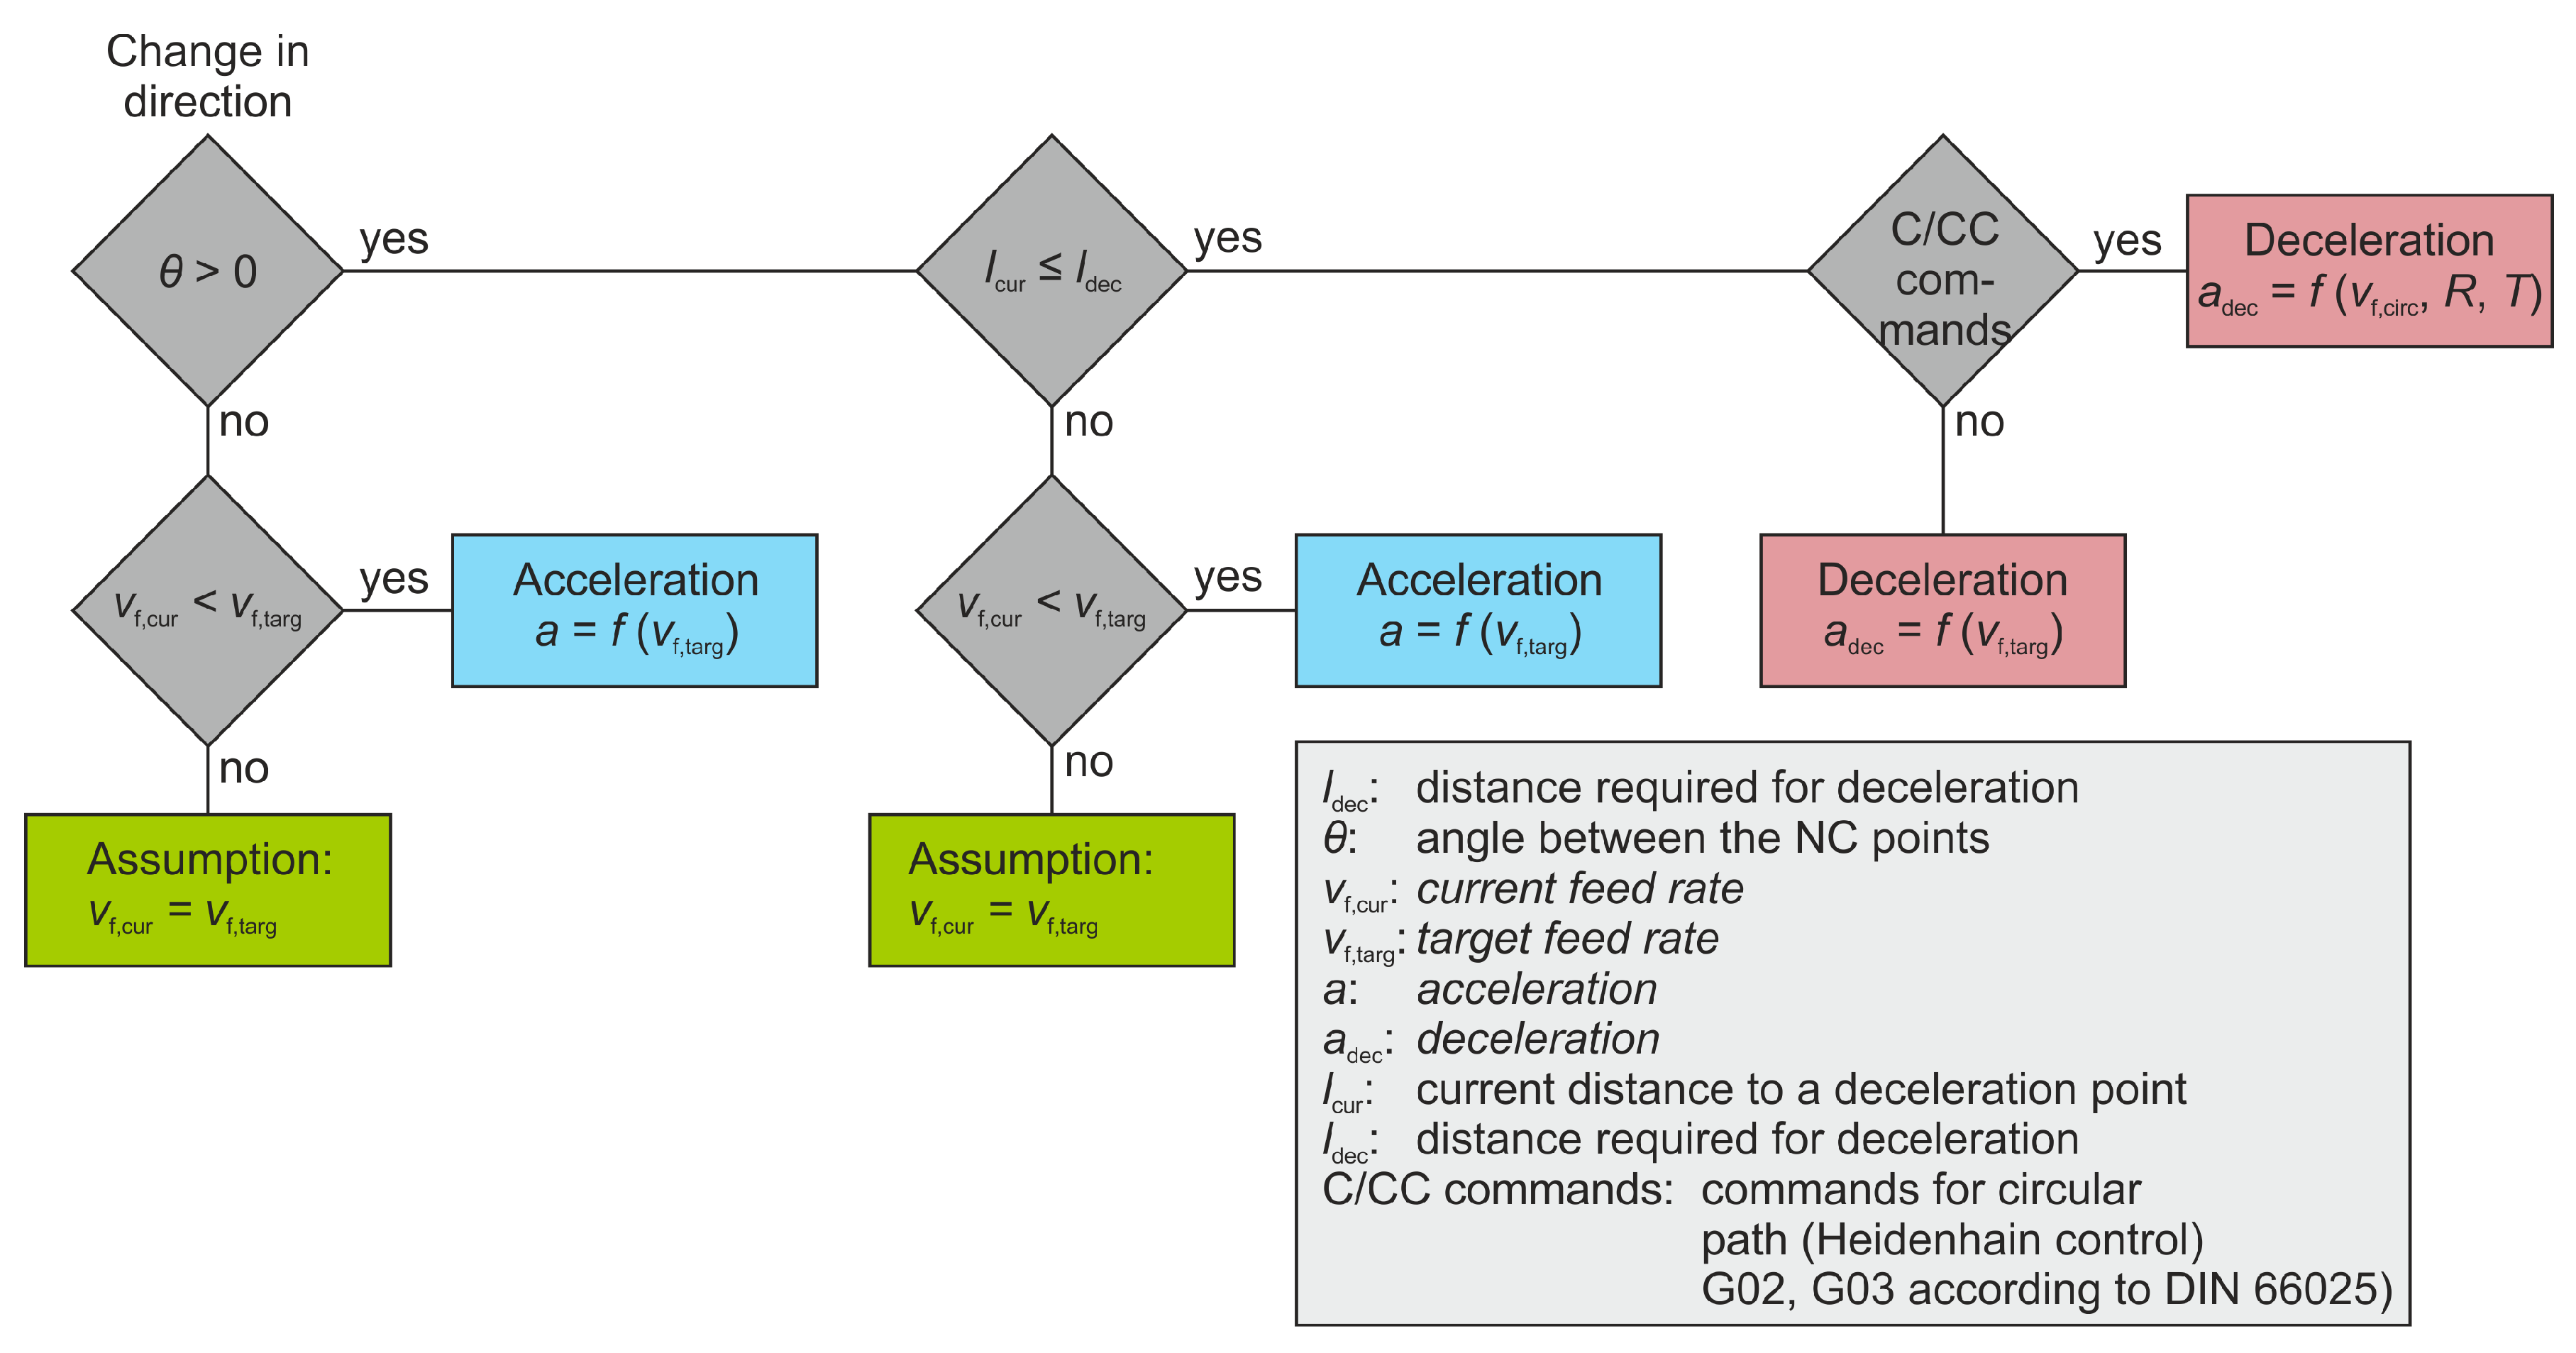
In the following, the acceleration model for calculating the feed rates considering the measured acceleration behaviour of the machine is presented. For the interpretation of conventional NC programs, an NC parser was programmed which interprets the NC paths and extracts the information necessary for an evaluation. Furthermore, the NC paths are discretized to make the calculation of the feed rate more precise. The programmed analysis algorithm identifies the type of movement to be executed during the evaluation of the NC program and differentiates the effect on the speed of the machine. This distinction between the cases can be seen schematically in Figure 7.
The algorithm for the feed simulation needs to distinguish three different situations. A linear path allows a full nominal speed after the acceleration process. The acceleration value is calculated based on the determined function and considering the basic conditions. An edge requires a stop of the machine axes and a subsequent acceleration. The third case is a rounded edge with a constant feed rate during the circle section. For this purpose, knowing the possible speed on a circular path is a necessary information. For example, if a circular path is identified, the defined formulas for determining the achievable feed rate are used to calculate the required speed adjustment. If the distance to the point of directional changes is smaller than the value sT, a deceleration process has to be initiated. The feed rate to the next NC point is reduced by a calculated value.
An efficient evaluation of the NC program was realized by a coloured visualization of the feed rate. However, in this case it is not possible to distinguish exactly whether the feed rate falls below a critical value. Therefore, the feed simulation was extended accordingly with regard to a selective analysis of the feed per tooth values. If the feed per tooth falls below the set boundary value, the NC paths are coded in red, otherwise in green.
3.4. Validation of the Feed Simulation
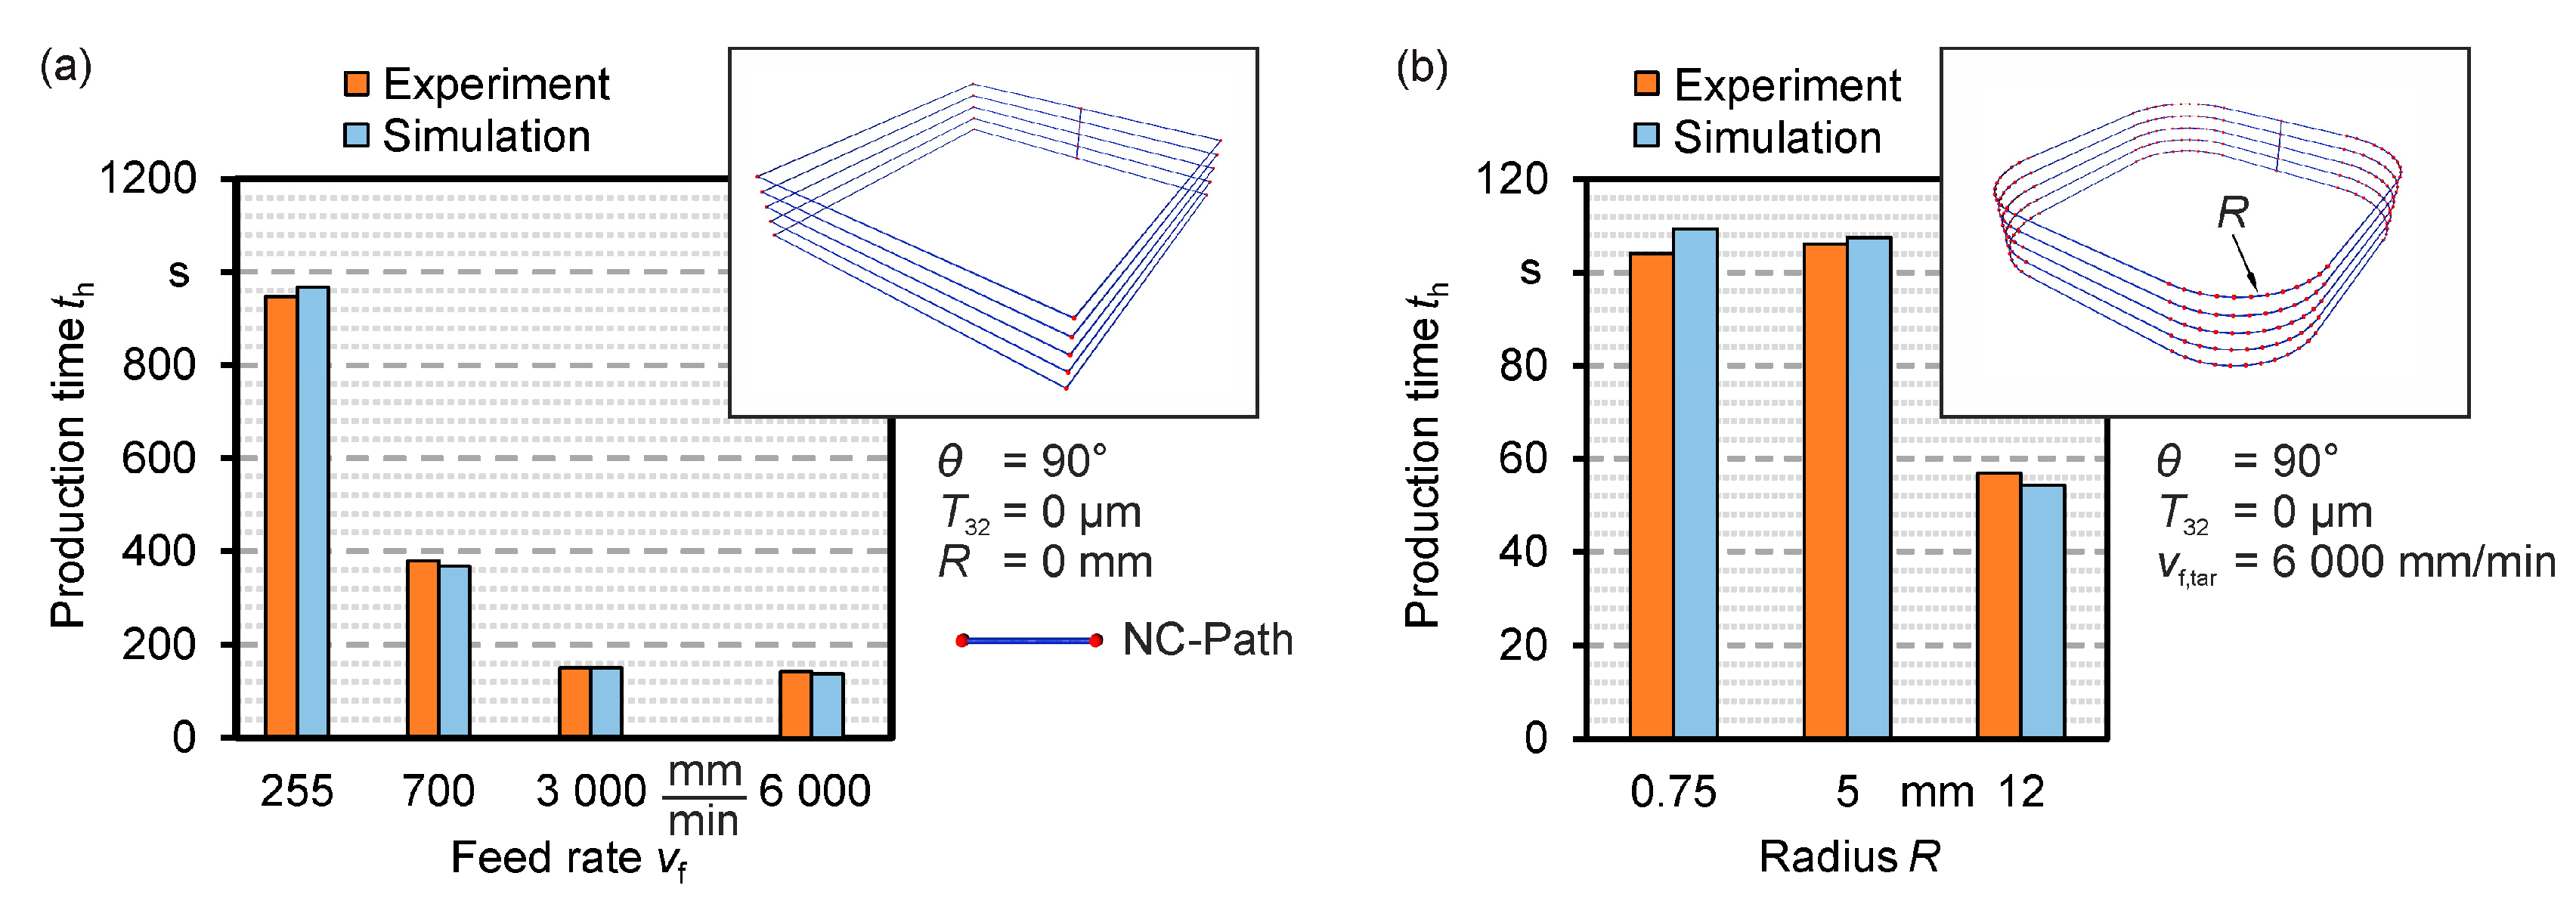
The feed simulation was validated on basic machining tasks such as pocket milling. The analysis was carried out by comparing the main production time th. Figure 8a shows the difference between the simulated and experimentally determined production times. In this investigation, NC programs for pocket manufacturing with varying nominal feed rates were executed. As described before, the presentation of the standard deviation is unnecessary due to the high repetition accuracy of the machine and the negligible deviations. Considering the simulation and the experimental data, the prediction quality of the actual feed rate as well as the production time can be evaluated positively. The maximum value of the relative deviation is ε = 4% at the feed rate of vf = 6000 mm/min. Figure 8b shows a comparison of production times for a milling process of pockets with a varying corner rounding. Even with different radii, the machining time was predicted with sufficient accuracy. The maximum deviation was ε = 5%.
4. Discussion of an Application Case
In the following, the prediction of the actual feed rate is discussed in a realistic application case from a sheet-bulk metal forming process [27]. Dies for this process require filigree cavities to allow the production of functional form elements. Figure 9 illustrates an example of a composition of a forming tool for a forward extrusion process [28].
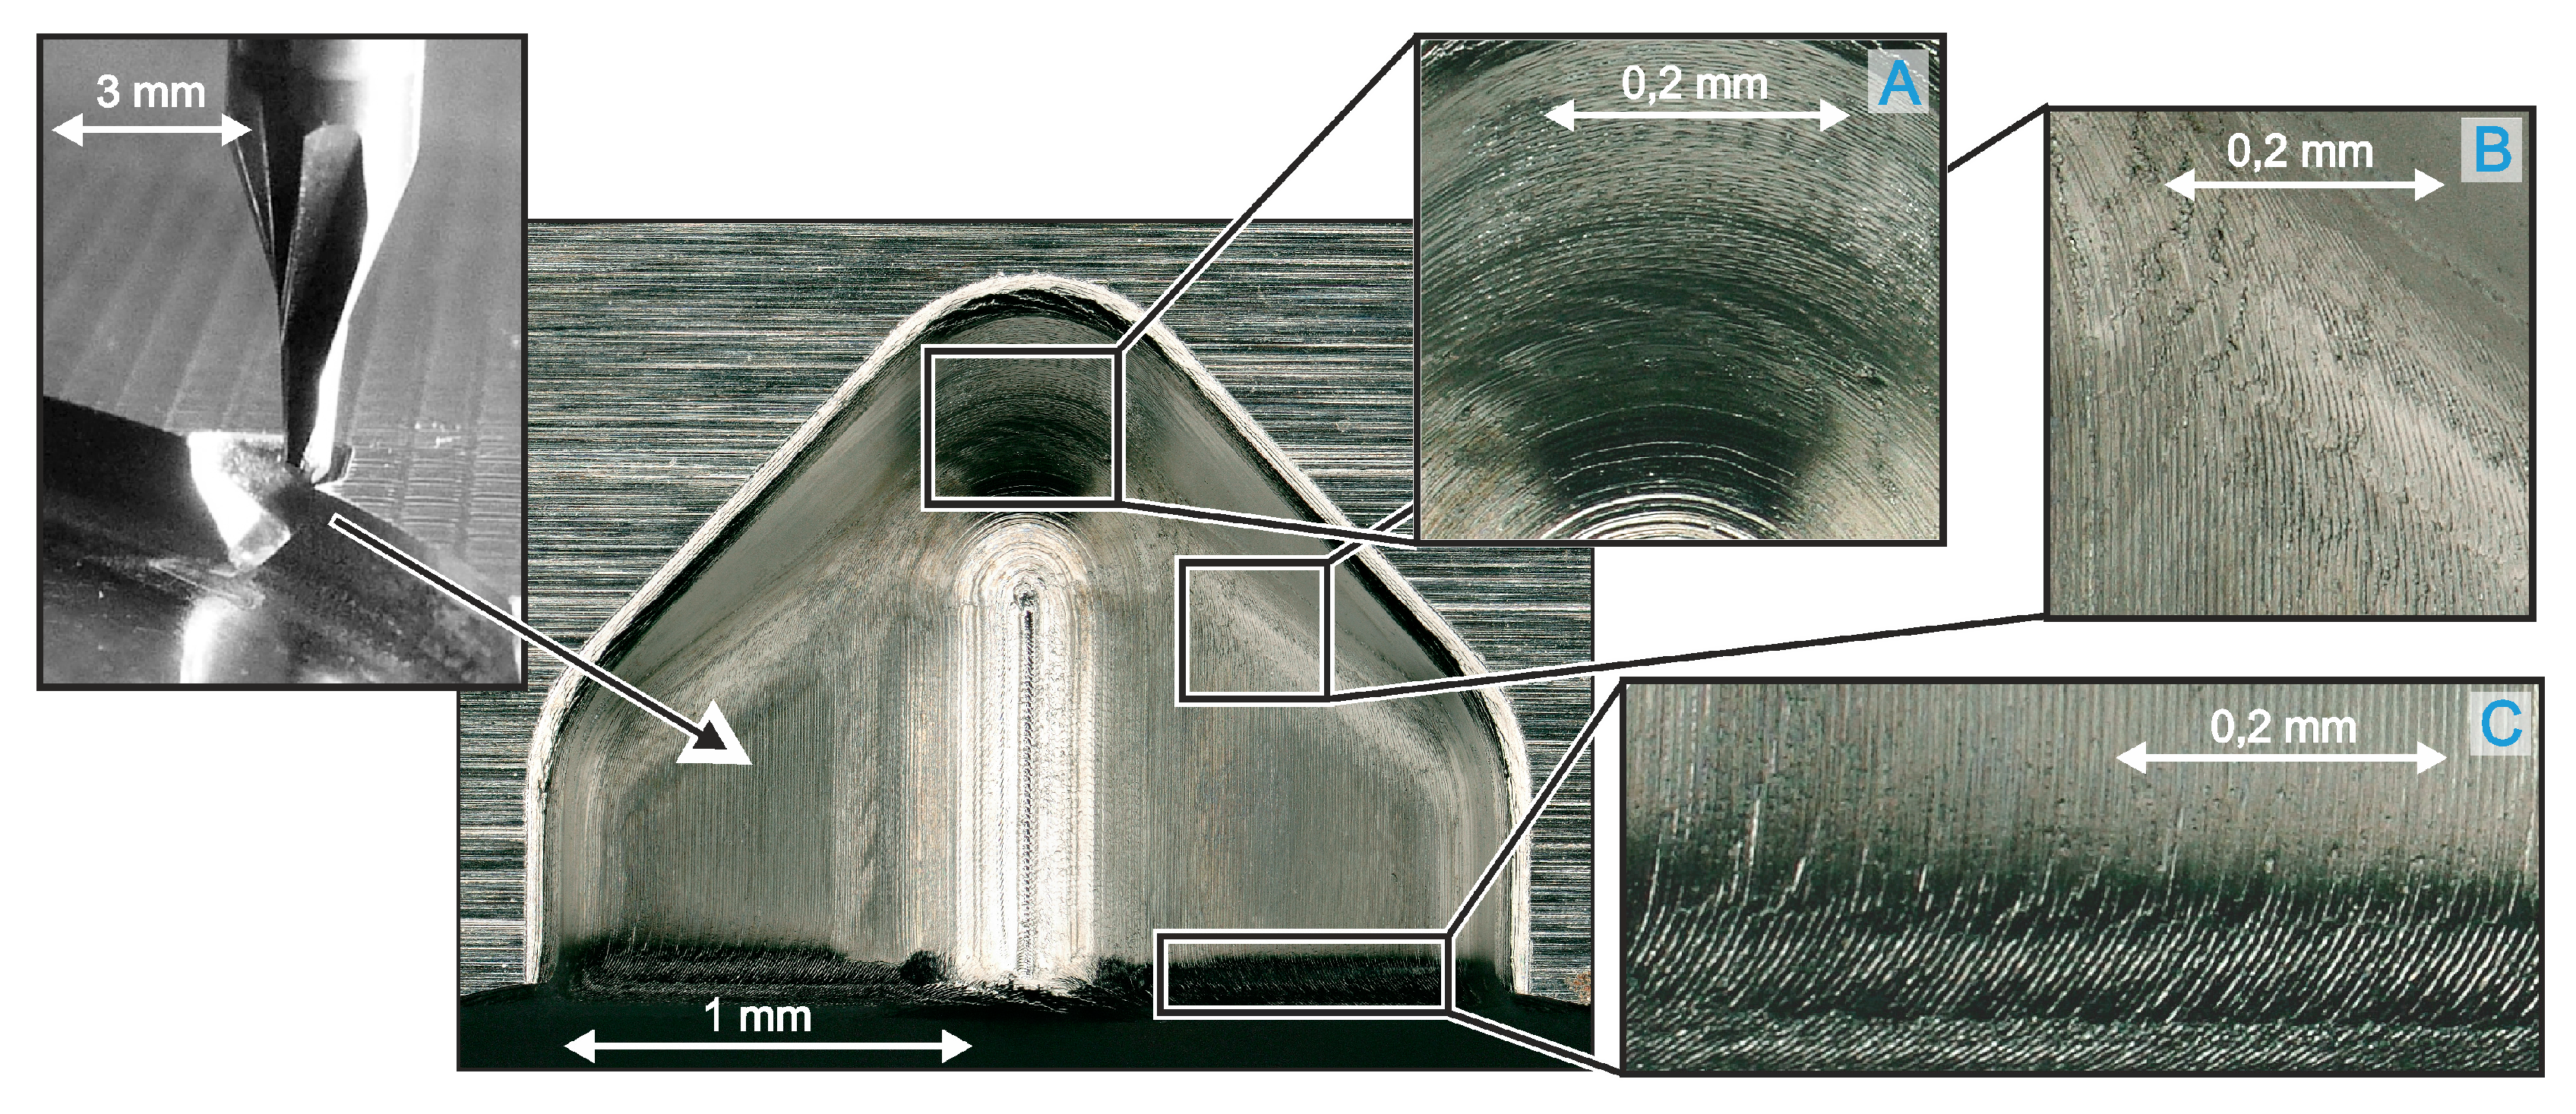
The machining of such micro elements in hardened high-speed steels require an appropriate process design. The use of the cutting parameters from the fundamental investigations is not always effective. Neglecting of the feed rate slowdown can lead to a lower surface quality (e.g., Figure 10). Three areas can be identified on the die element in which a significant loss of the surface quality can be detected. While changes in regions A and B can be explained by a larger engagement angle and, thus, a more unfavourable cutting process, the cause for the defects on the surface in region C could not be identified.
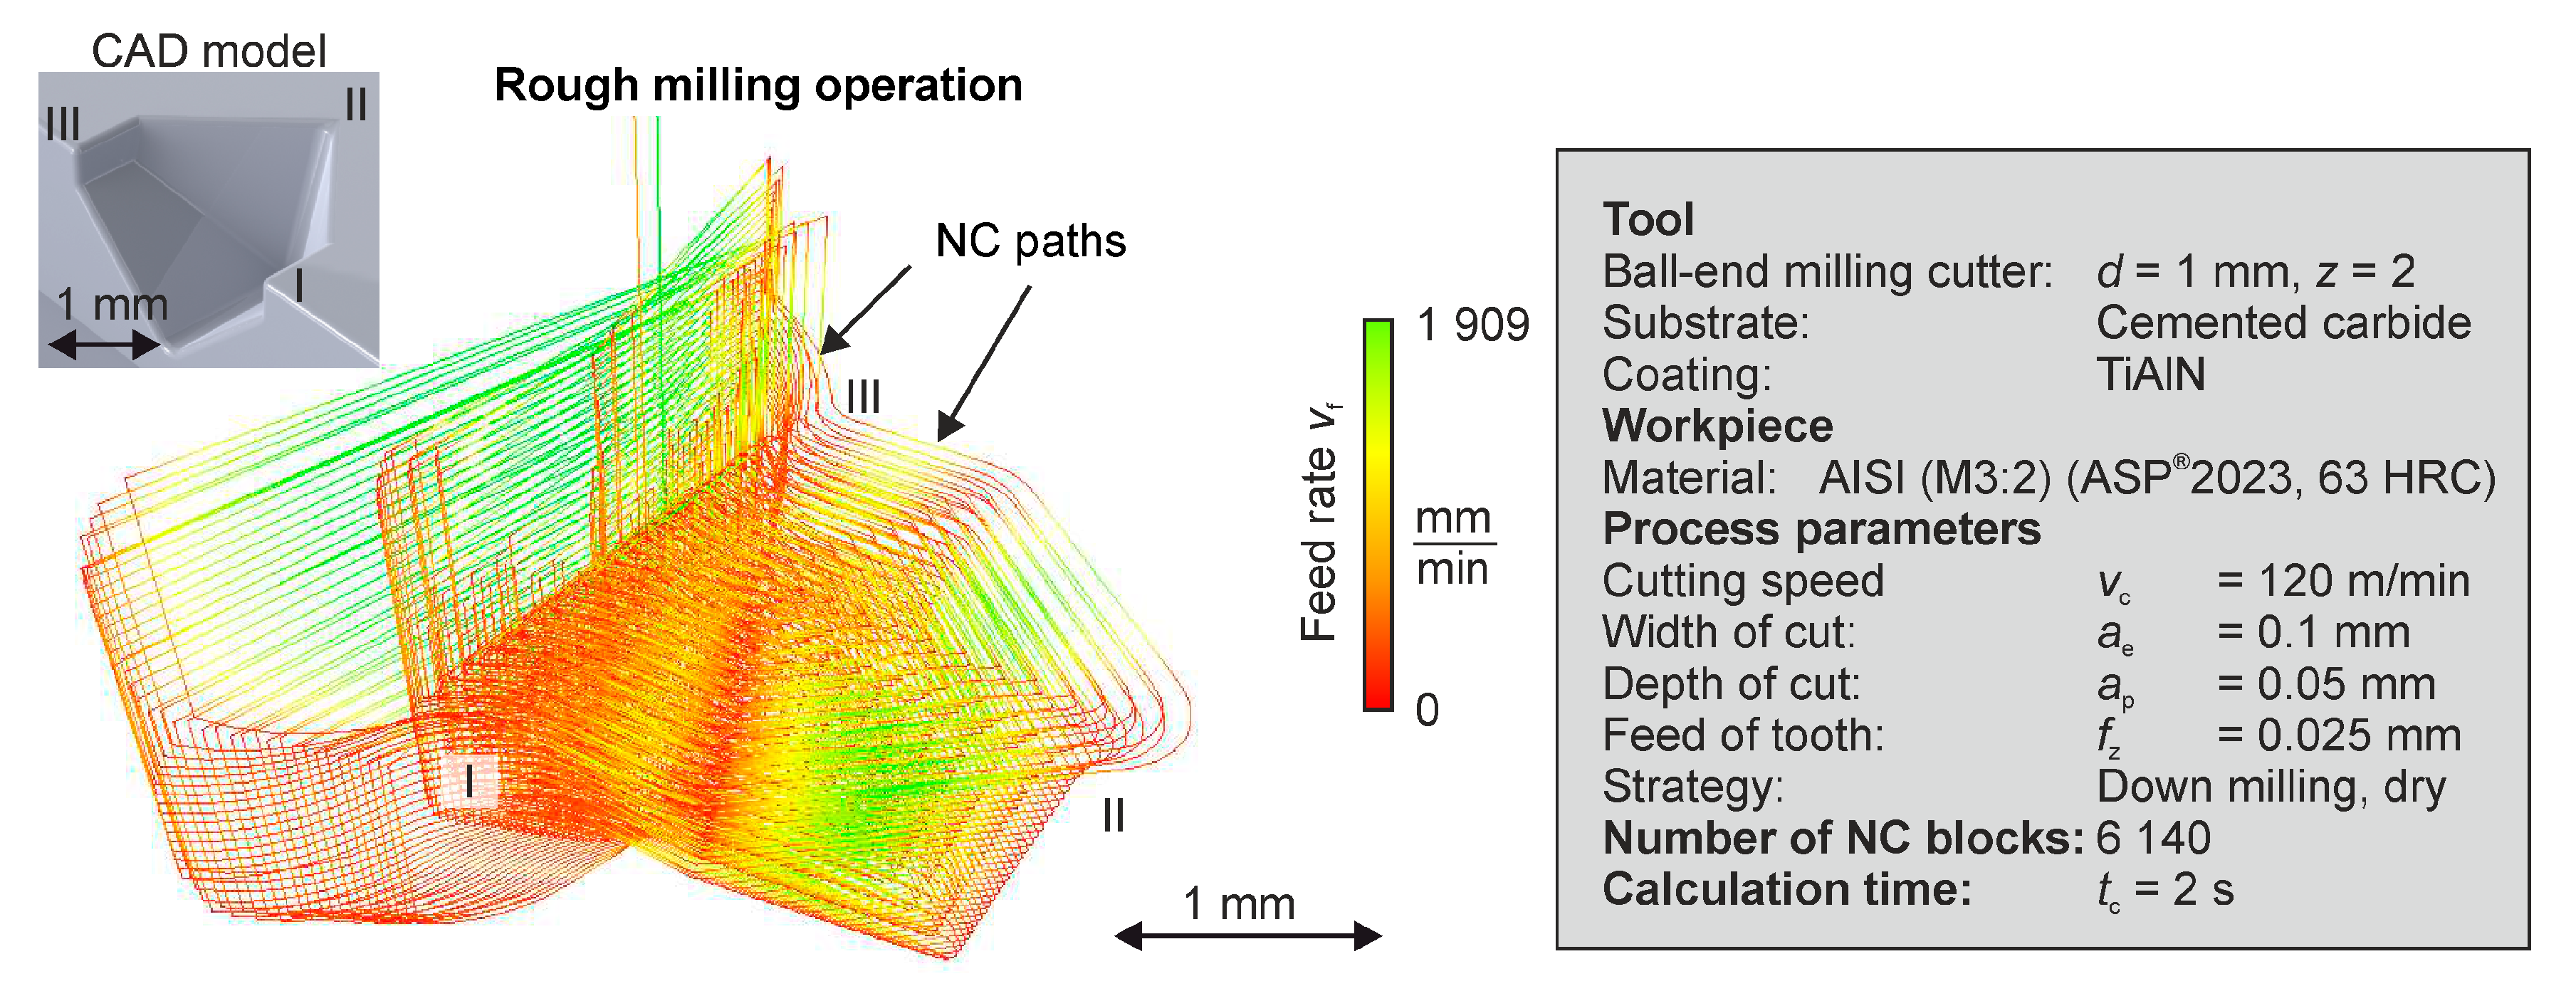
To investigate the influence of the actual feed rate, the NC programs were examined using the feed analysing algorithm. In Figure 11 and Figure 12, visualisation of the actual feed rate for the roughing and the finishing process is presented. Despite the high complexity of the NC programs, both results show an appropriate interpretation of the NC paths. In addition, no irregularities were detected in the calculation of the feed rate, such as unrealistic shifts in the values. The analysis of the roughing process indicates that the feed rate of vf = 1909 mm/min can hardly be achieved. However, for the final surface quality, the simulation of the finishing process is more significant. Due to the lower feed per tooth during the finishing operation, the machine axes have to perform a lower feed rate. In combination with a higher homogeneity of the NC paths resulting in more linear sections, a positive effect on the acceleration behaviour was achieved (Figure 12a). Nevertheless, the corners represent critical areas. Here, the machine tool is incapable of reaching the nominal feed rate. In addition, area C (see Figure 10) presents low feed rates (Figure 12b).
The analysis of the feed per tooth reveals that the previously defined boundary value of fz = 4 µm cannot be achieved (Figure 12c). The programmed tangential tool movement, which is generally considered to be advantageous for the approach and departure movement, results in a significant feed rate slowdown due to a circular path motion. It is assumed that the loss of quality in this area is caused by the unfavourable feed rate. A solution to maintain a higher feed per tooth could be to increase the radius of movement in the CAM system. An optimization approach for segments A and B could be a local reduction of the cutting speed, which leads to a lower rotational speed and feed rate. In the micromachining of hard materials, lower cutting speed has a less negative effect to the surface quality than an unsuitable feed per tooth.
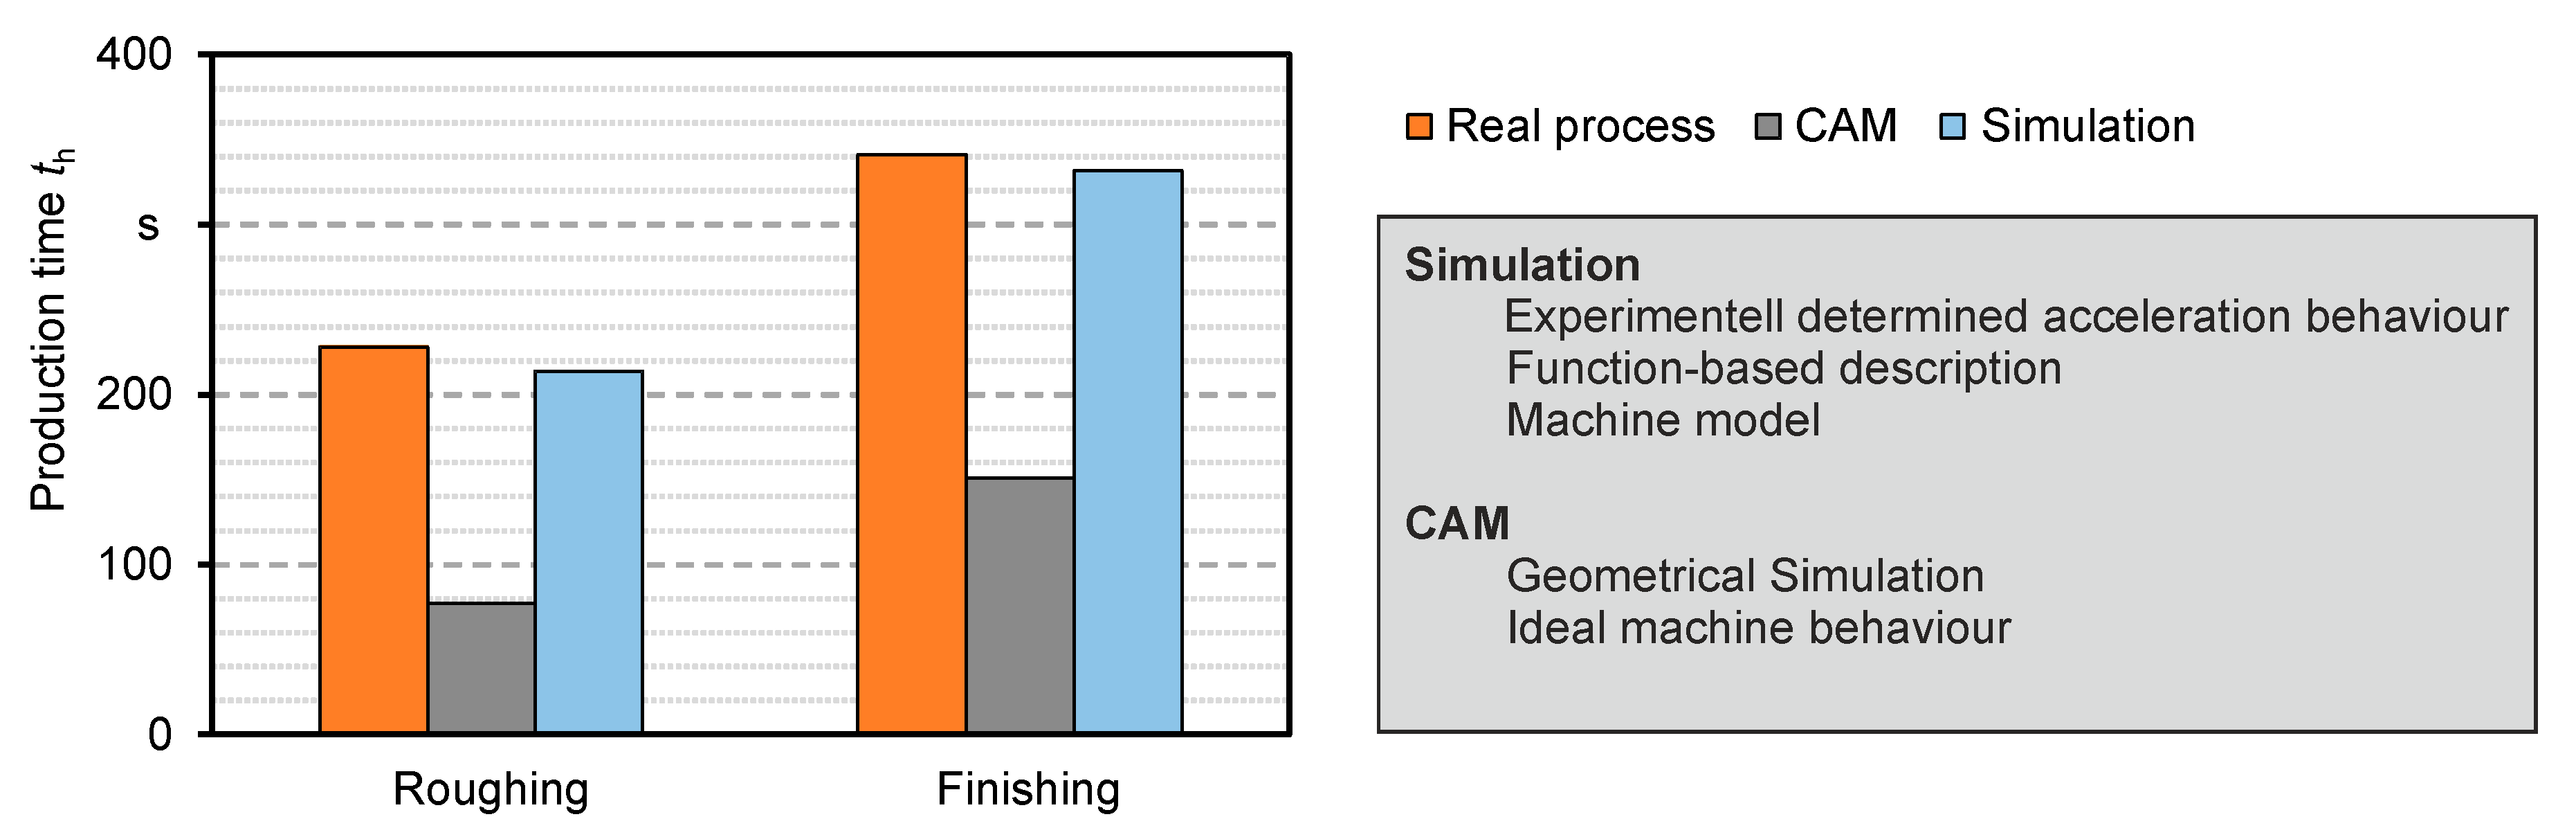
In Figure 13, the prediction quality of the feed simulation is discernible due to the comparison of the production time. The geometrical simulation within a CAM system estimates the theoretical or ideal time. Such simulation approaches calculate the ideal machining time using only the predefined feed rates and neglect any acceleration and deceleration effects of the machine axes. This results in a significant prediction error. For the examined case, a deviation of ΔtP = 151 s for roughing and ΔtP = 190 s for finishing was measured, which corresponds to relative deviations of 196% and 126%, respectively. The developed simulation approach allows a more precise prediction of the production time. The deviation could be reduced to ΔtP = 14 s for roughing and to ΔtP = 9 s for finishing resulting in relative deviations of 7% and 3%, respectively.
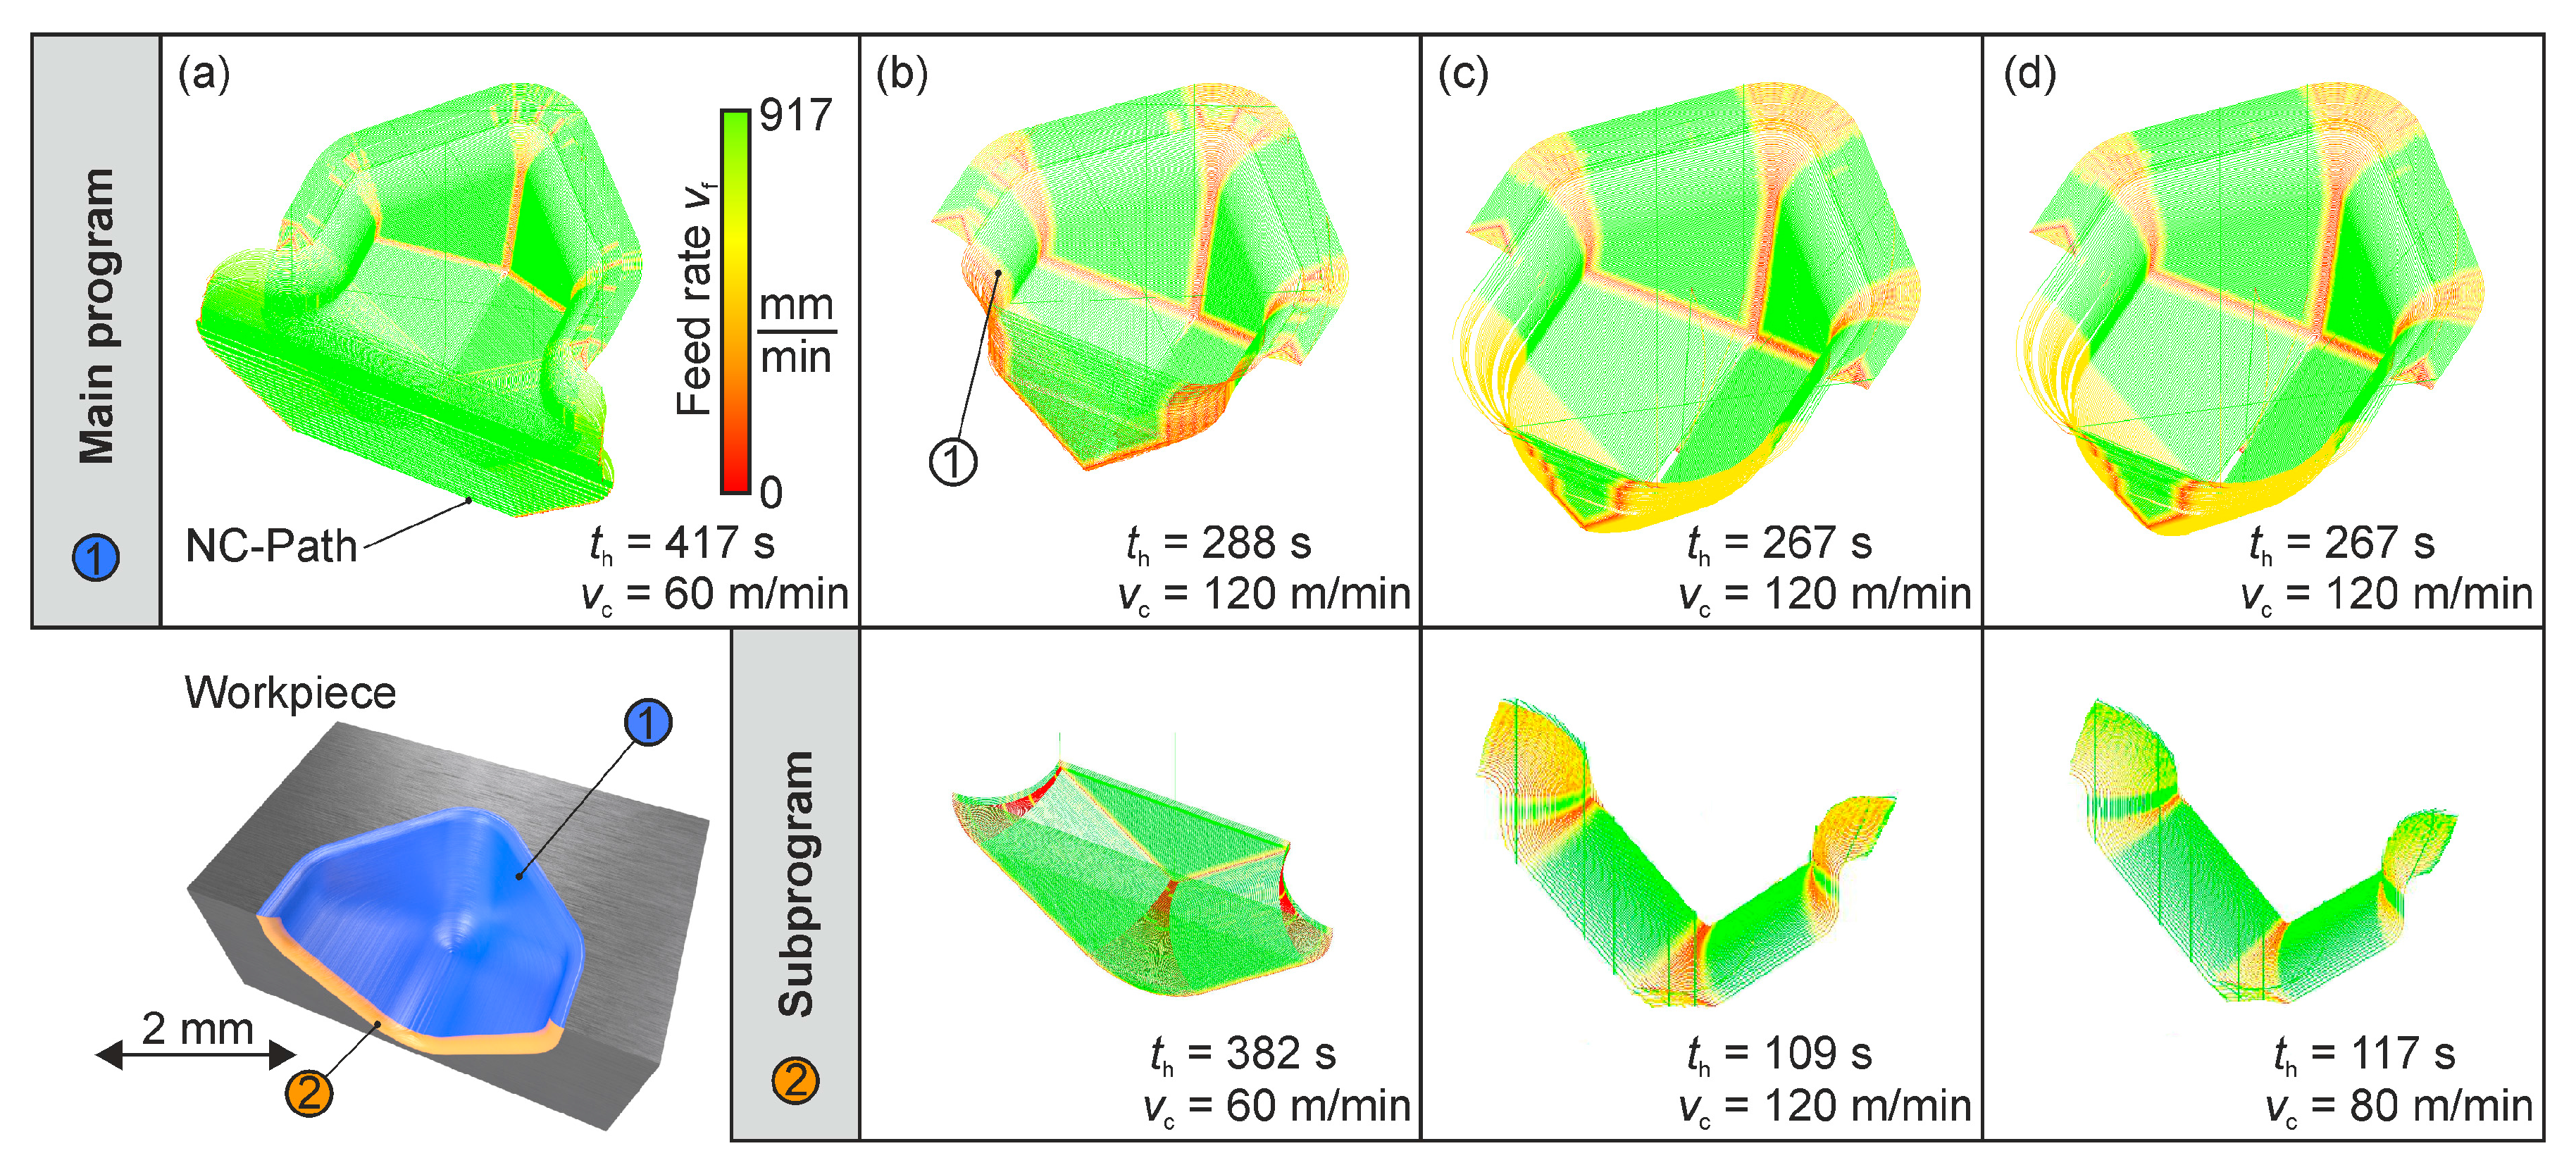
Based on the presented feed simulation, it is possible to identify critical machining areas and to evaluate possible alternative strategies. As an example, the finishing program described above is adapted step-by-step to reduce the occurrence of an unfavourable feed rate around region C. In principle, two strategies are available for optimizing the machining programs without significantly adjusting the workpiece shape or machine kinematics. On the one hand, the entire process can be decelerated by reducing the cutting speed vc due to its influence on the resulting feed rate. As a result, the machine is more likely to be able to carry out the desired changes in direction without major slowdowns in feed rates. On the other hand, a modification of the NC paths with regard to their position, distribution as well as approach and departure movements is the second optimization strategy presented. In this case, a machine movement must be realised which is more favourable for the kinematics of the machine. The adjustments of the respective strategy can globally be applied to the entire machining program or locally to specific areas. However, the consequences of the respective adjustments to the process result must be considered. Both optimisation strategies and further possible combinations are explained based on Figure 14. The following steps are carried out as part of this optimisation:
- (a)
- Global adjustment of the cutting speed
- (b)
- Program subdivision with local adjustment of the cutting speed
- (c)
- Modification of the NC program with regard to path distribution as well as approach and departure movements
- (c)
- Local optimisation of cutting speed
Figure 14a shows the effect of a reduction of the cutting speed from vc = 120 m/min to vc = 60 m/min. All other cutting parameters were kept constant, as described in Figure 12. The feed simulation clearly shows that the ranges of critical feed rates can be reduced or avoided. However, this modification in the existing program leads to a significant increase in production time and can also have a negative impact on the process results. To limit the global impact on the process, the NC program was split up into two NC files to optimize the critical area C in particular. Figure 14b shows that an improvement in region C can be achieved locally without affecting the entire machining program. However, it is still evident from the main program that the change in direction required for the repositioning movements still has a negative influence on the feed rate achieved within the cavity (annotation 1). For this reason, the approach and departure movements were optimised in the next step to remove the influence of a feed rate slowdown from the machining region (see Figure 14c). To achieve a further optimization of the machining program in area C, a local strategy adjustment was carried out, in which the tool now moves along the contour of the tooth cavity. Due to the path strategy shown in Figure 14c, the proportion of linear movements predominates, so that critical feed rates can be reduced. While in the third optimization step the original value of the cutting speed still leads to local conflict areas (c), an additional local reduction of the cutting speed leads to a limitation of the critical feed ranges to an acceptable value (Figure 14d). Due to the more favourable path design, higher cutting speeds can also be achieved than for example in Figure 14b. Due to the limited machine kinematics, it is not possible to avoid areas with critical feed rates completely without adjusting the workpiece shape or the acceleration capabilities of the machine. Therefore, only an optimization of the process can be achieved with the support of the presented feed simulation, considering the given boundary conditions.
5. Conclusions
In micromilling, it is important to ensure a minimum feed per tooth to avoid ploughing in the process which comes along with a significant reduction of surface quality. For the high-speed steel AISI (M3:2) in hardened condition (63 ± 1 HRC), a minimum suitable value of fz = 4 µm was determined, despite the comparatively sharp cutting edges with a rounding of = 1.0 ± 0.4 μm. Due to the limited machine acceleration, it is probable that the nominal feed rate will not be achieved and the actual feed per tooth will come under the determined boundary value for complex paths. However, only a feed simulation can predict these feed rate slowdowns.
Therefore, a machine model was developed based on measured data from the acceleration behaviour of the machine tool. Without precise knowledge of the control mechanisms of the machine or the machine control, an exact prediction of the feed rate was possible. The evaluation was conducted regarding the production time due to the dependence on the feed rate. For different NC programs, an average deviation of approximately 4% was achieved. The colour-based visualization of the feed rate also provides the possibility to evaluate the entire NC program efficiently. Based on this possibility of process evaluation, optimization strategies, based on different NC programs generated in a CAM system, were demonstrated for a realistic application case.
Another advantage of this simulation approach is the transferability to all CNC-controlled processes, such as laser ablation and wire erosion. However, it should be considered that the model is only valid for the examined machine. For other systems, additional measurements are necessary to calibrate the model.
In further investigations, the current limitation to linear axis movements will be extended to include rotary axes. For this purpose, the measurement setup must primarily be modified. The corresponding interpretation in the machine model is already prepared in the approach presented.
Furthermore, in conjunction with a geometric removal simulation, the boundary value for the feed per tooth can be transferred to a boundary value of the chip thickness. In this case, it would be possible to evaluate the feed rate slowdowns during the cutting process directly in the chip formation procedure. If the chip formation can be calculated accurately enough within an FEM, boundary values could be simultaneously determined. However, one disadvantage would be the significantly increased calculation time. To calculate the chip thickness, all tooth engagements have to be evaluated in the geometric simulation.
Acknowledgments
This research was funded by the German Research Foundation (DFG) within the transregional collaborative research centre TR73 “Manufacturing of complex functional components with variants by using a new sheet metal forming process - Sheet-Bulk Metal Forming.” It presents results achieved within the subprojects B2 (“Machining of molds with filigree structures for Sheet-Bulk Metal Forming”).
Author Contributions
Alexander Meijer and Eugen Krebs conceived and designed the experiments, performed the experiments, and analysed the data; Alexander Meijer and Eugen Krebs wrote the paper. Dirk Biermann and Petra Wiederkehr coordinated the investigations and advised the research assistants.
Conflicts of Interest
The authors declare no conflict of interest.
References
- Denkena, B.; Hoffmeister, H.-W.; Reichstein, M.; Illenseer, S.; Hlavac, M. Micro-machining processes for microsystem technology. Microsyst. Technol. 2006, 12, 659–664. [Google Scholar] [CrossRef]
- Cheng, K.; Huo, D. Micro-Cutting: Fundamentals and Applications; Wiley: Hoboken, NJ, USA, 2013. [Google Scholar]
- Kirsch, B.; Bohley, M.; Arrabiyeh, P.A.; Aurich, J.C. Application of Ultra-Small Micro Grinding and Micro Milling Tools: Possibilities and Limitations. Micromachines 2017, 8, 261. [Google Scholar] [CrossRef]
- GDE-Werkzeuge GmbH. Available online: http://www.gde-werkzeuge.de/files/mikro/Mikrofraeser.pdf (accessed on 31 January 2018).
- Park, S.; Malekian, M. Mechanistic modeling and accurate measurement of micro end milling forces. CIRP Ann. Manuf. Technol. 2009, 58, 49–52. [Google Scholar] [CrossRef]
- Vollertsen, F.; Biermann, D.; Hansen, H.N.; Jawahir, I.S.; Kuzman, K. Size effects in manufacturing of metallic components. CIRP Ann. Manuf. Technol. 2009, 58, 566–587. [Google Scholar] [CrossRef]
- De Oliveira, F.-B.; Rodrigues, A.-R.; Coelho, R.-T.; de Souza, A.-F. Size effect and minimum chip thickness in micromilling. Int. J. Mach. Tools Manuf. 2015, 89, 39–54. [Google Scholar] [CrossRef]
- Bissacco, G.; Hansen, H.; Slunsky, J. Modelling the cutting edge radius size effect for force prediction in micro milling. CIRP Ann. Manuf. Technol. 2008, 57, 113–116. [Google Scholar] [CrossRef]
- Krebs, E.; Wolf, M.; Biermann, D.; Tillmann, W.; Stangier, D. High-quality cutting edge preparation of micromilling tools using wet abrasive jet machining process. Prod. Eng. 2018, 12, 45–51. [Google Scholar] [CrossRef]
- Ikawa, N.; Shimada, S.; Tanaka, H. Minimum thickness of cut in micromachining. Nanotechnology 1992, 3, 6–9. [Google Scholar] [CrossRef]
- Albrecht, P. New Development in the Theory of the Metal-Cutting Process. J. Eng. Ind. 1960, 82, 348–358. [Google Scholar] [CrossRef]
- Ikawa, N.; Donaldson, R.R.; Komanduri, R.; König, W.; Aachen, T.H.; McKeown, P.A.; Moriwaki, T.; Stowers, I.F. Ultraprecision Metal Cutting—The Past, the Present and the Future. CIRP Ann. Manuf. Technol. 1991, 40, 587–594. [Google Scholar] [CrossRef]
- Bissacco, G.; Hansen, H.N.; De Chiffre, L. Size Effects on Surface Generation in Micro Milling of Hardened Tool Steel. CIRP Ann. Manuf. Technol. 2006, 55, 593–596. [Google Scholar] [CrossRef]
- Fang, F.Z.; Liu, Y.C. On minimum exit-burr in micro cutting. J. Micromech. Microeng. 2004, 14, 984–988. [Google Scholar] [CrossRef]
- Lee, K. Micro-Burr Formation and Minimization through Process Control; LMA Reports University of California at Berkeley: Berkeley, CA, USA, 2003. [Google Scholar]
- Renton, D.; Elbestawi, M.A. High speed servo control of multi-axis machine tools. Int. J. Mach. Tools Manuf. 2000, 40, 539–559. [Google Scholar] [CrossRef]
- Dugas, A.; Lee, J.J.; Hascoët, J.Y. High speed milling—Solid simulation and machine limits. In Integrated Design and Manufacturing in Mechanical Engineering; Chedmail, P., Cognet, G., Fortin, C., Mascle, C., Pegna, J., Eds.; Kluwer: Dordrecht, The Netherlands, 2002; pp. 287–294. [Google Scholar]
- Pateloup, V.; Duc, E.; Ray, P. Corner optimization for pocket machining. Int. J. Mach. Tools Manuf. 2004, 44, 1343–1353. [Google Scholar] [CrossRef]
- Lavernhe, S.; Tournier, C.; Lartigue, C. Kinematical performance prediction in multi-axis machining for process planning optimization. Int. J. Adv. Manuf. Technol. 2008, 37, 534–544. [Google Scholar] [CrossRef]
- Monreal, M.; Rodriguez, C.A. Influence of tool path strategy on the cycle time of high-speed milling. Comput. Aided Des. 2003, 35, 395–401. [Google Scholar] [CrossRef]
- DMG Mori—Virtual Machine. Available online: http://de.dmgmori.com/produkte/software/dmg-mori-virtual-machine and https://de.dmgmori.com/blob/387044/9cc7581cd0549443051c7d8b8bfb97c1/ps1de15-virtual-machinepdfdata.pdf (accessed on 31 January 2018).
- Lavernhe, S.; Quinsat, Y.; Lartigue, C. Model for the prediction of 3D surface topography in 5-axis milling. Int. J. Adv. Manuf. Technol. 2010, 51, 915–924. [Google Scholar] [CrossRef]
- Lavernhe, S.; Quinsat, Y.; Lartigue, C.; Brown, C. Realistic simulation of surface defects in five-axis milling using the measured geometry of the tool. Int. J. Adv. Manuf. Technol. 2014, 74, 393–401. [Google Scholar] [CrossRef]
- Freiburg, D.; Finkeldey, F.; Hensel, M.; Wiederkehr, P.; Biermann, D. Simulation of surface structuring considering the acceleration behavior by means of spindle control. Int. J. Mech. Manuf. Syst. 2017, in press. [Google Scholar]
- Characteristic of ASP®2023. Available online: http://www.erasteel.com/sites/default/files/media/ GB_Grade_ASP2023.pdf (accessed on 31 January 2018).
- Heidenhain Path Control iTNC 530—User Manual. Available online: http://www.heidenhain.de/fileadmin/ pdb/media/img/895822-15 iTNC530 Design7 de.pdf (accessed on 31 January 2018).
- Merklein, M.; Allwood, J.; Behrens, B.A.; Brosius, A.; Hagenah, H.; Kuzman, K.; Mori, K.; Tekkaya, A.E.; Weckenmann, A. Bulk forming of sheet metal. CIRP Ann. Manuf. Technol. 2012, 61, 725–745. [Google Scholar] [CrossRef]
- Löffler, M.; Andreas, K.; Engel, U.; Schulte, R.; Gröbel, D.; Krebs, E.; Freiburg, D.; Biermann, D.; Stangier, D.; Tillmann, W.; et al. Tribological measures for controlling material flow in sheet-bulk metal forming. Prod. Eng. 2016, 10, 459–470. [Google Scholar] [CrossRef]
Figure 1.
Concept for the feed simulation approach.

Figure 2.
Measurement setup for analysing the acceleration and deceleration behaviour of the machine axes.
Figure 2.
Measurement setup for analysing the acceleration and deceleration behaviour of the machine axes.

Figure 3.
Variation of the process settings to determine the machine behaviour.

Figure 4.
Burr formation during the machining of hardened high-speed steel when using: suitable feed rate (a); and unsuitable feed rate (b).
Figure 4.
Burr formation during the machining of hardened high-speed steel when using: suitable feed rate (a); and unsuitable feed rate (b).

Figure 5.
Influence of the feed per tooth on the: height of burr (a); and width of burr (b).

Figure 6.
Acceleration and deceleration behaviour of the machine axes as a function of the nominal feed rate vf,tar (a); achievable feed rates vf on a circular path as a function of the radius and the manufacturing tolerance (b); and distance values sT to initiate the deceleration as a function of the feed rate vf (c).

Figure 7.
Functionality diagram.

Figure 8.
Comparison between the measured and simulated production time when milling a pocket: without a varying corner radius (a); and with a varying corner radius (b).
Figure 8.
Comparison between the measured and simulated production time when milling a pocket: without a varying corner radius (a); and with a varying corner radius (b).

Figure 9.
Process design of a forward extrusion process (a); and formed geometry (b) adapted from [28].
Figure 9.
Process design of a forward extrusion process (a); and formed geometry (b) adapted from [28].
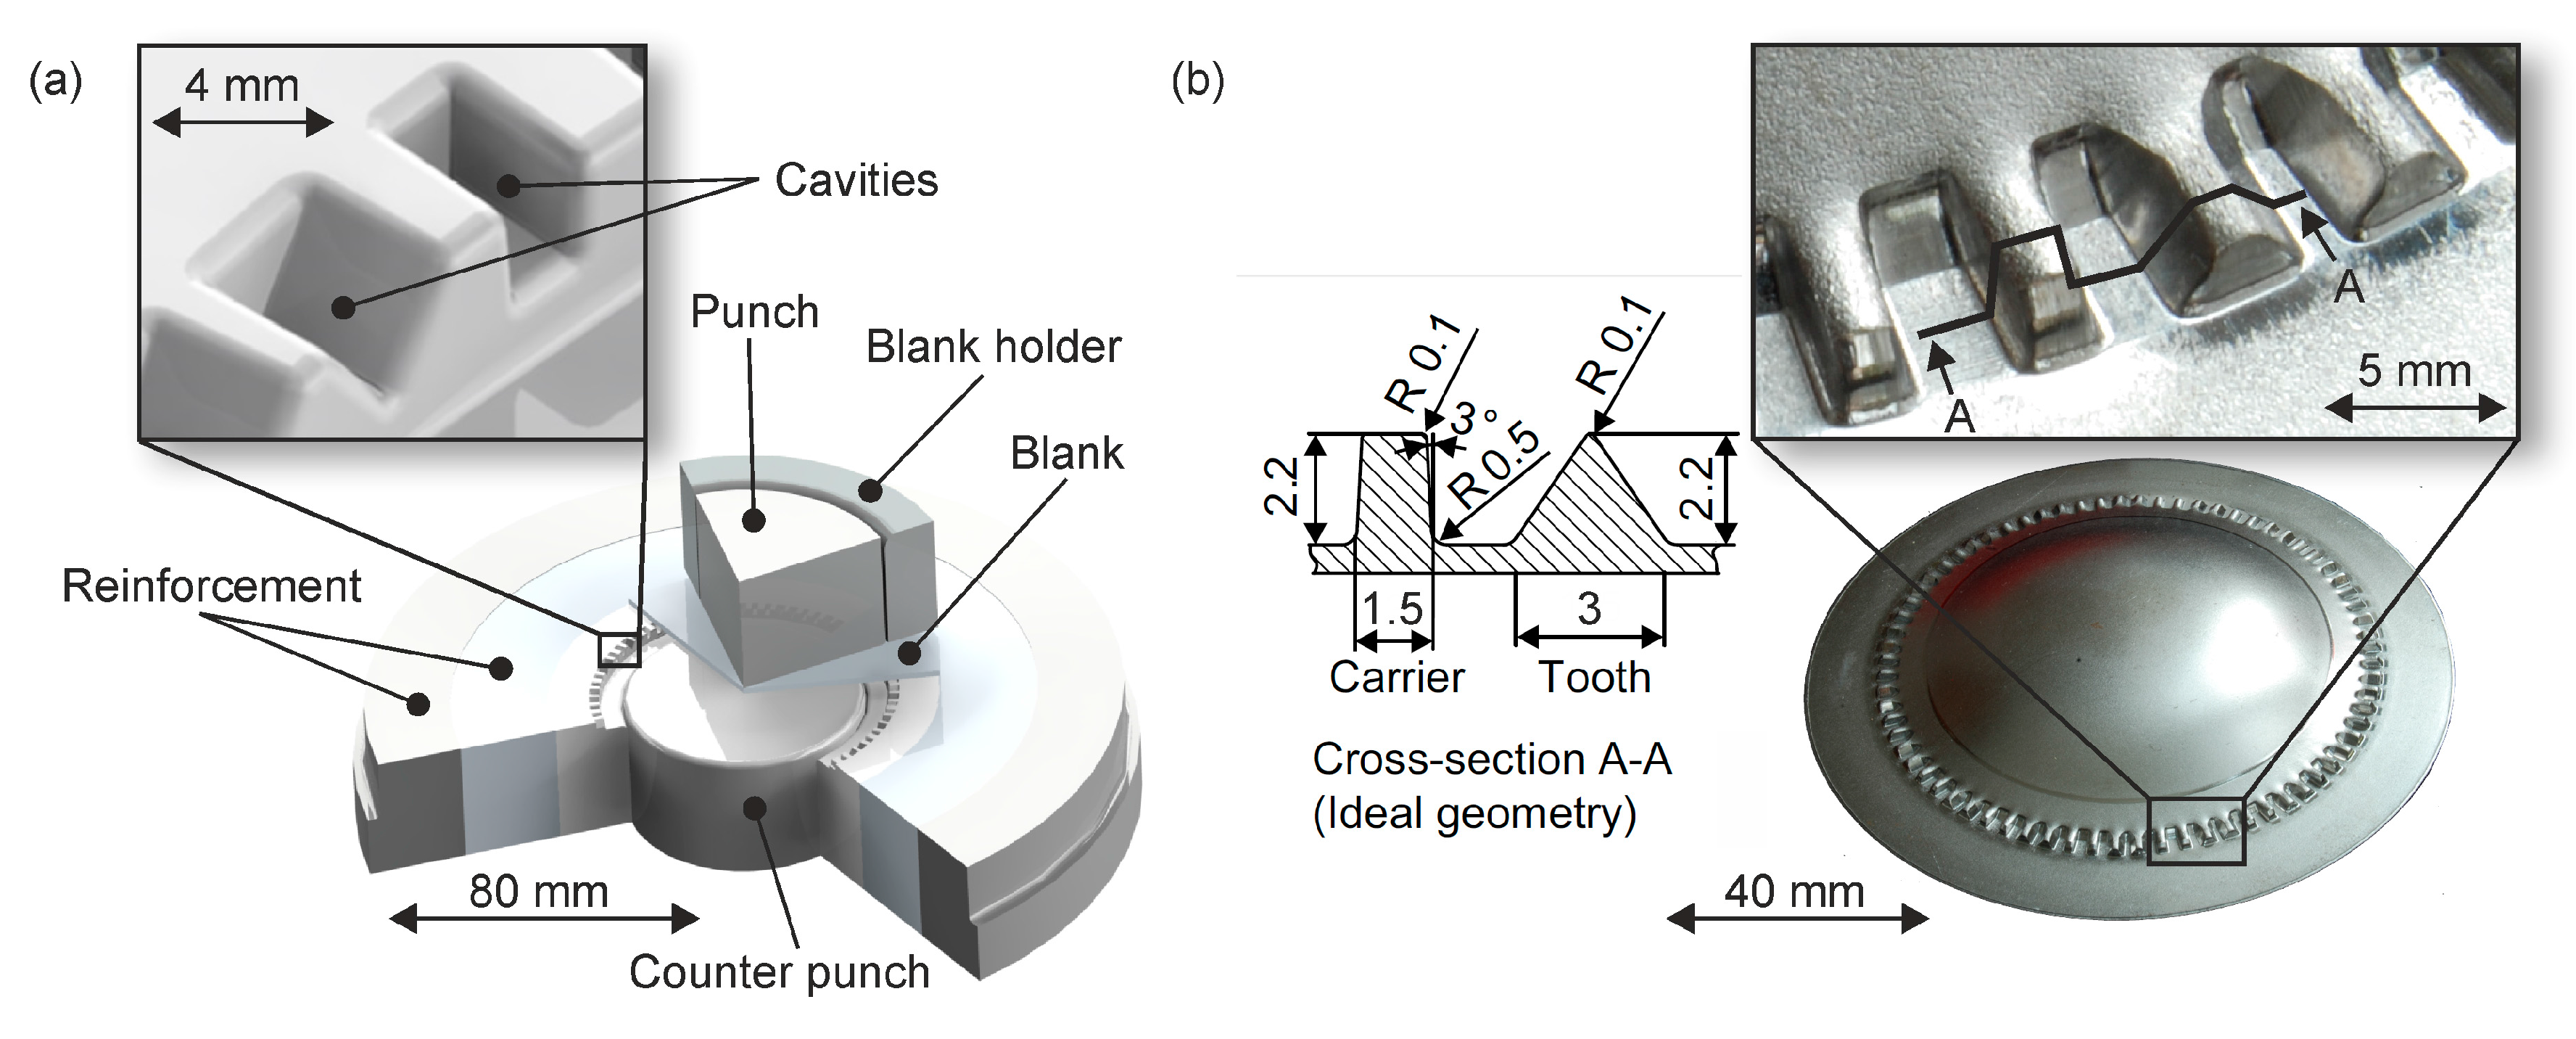
Figure 10.
Manufacturing result of a tooth cavity.

Figure 11.
Analysis of the feed rate vf for a roughing process.

Figure 12.
Analysis of the feed rate vf for a finishing process (a,b); and visualisation of critical areas (c).
Figure 12.
Analysis of the feed rate vf for a finishing process (a,b); and visualisation of critical areas (c).
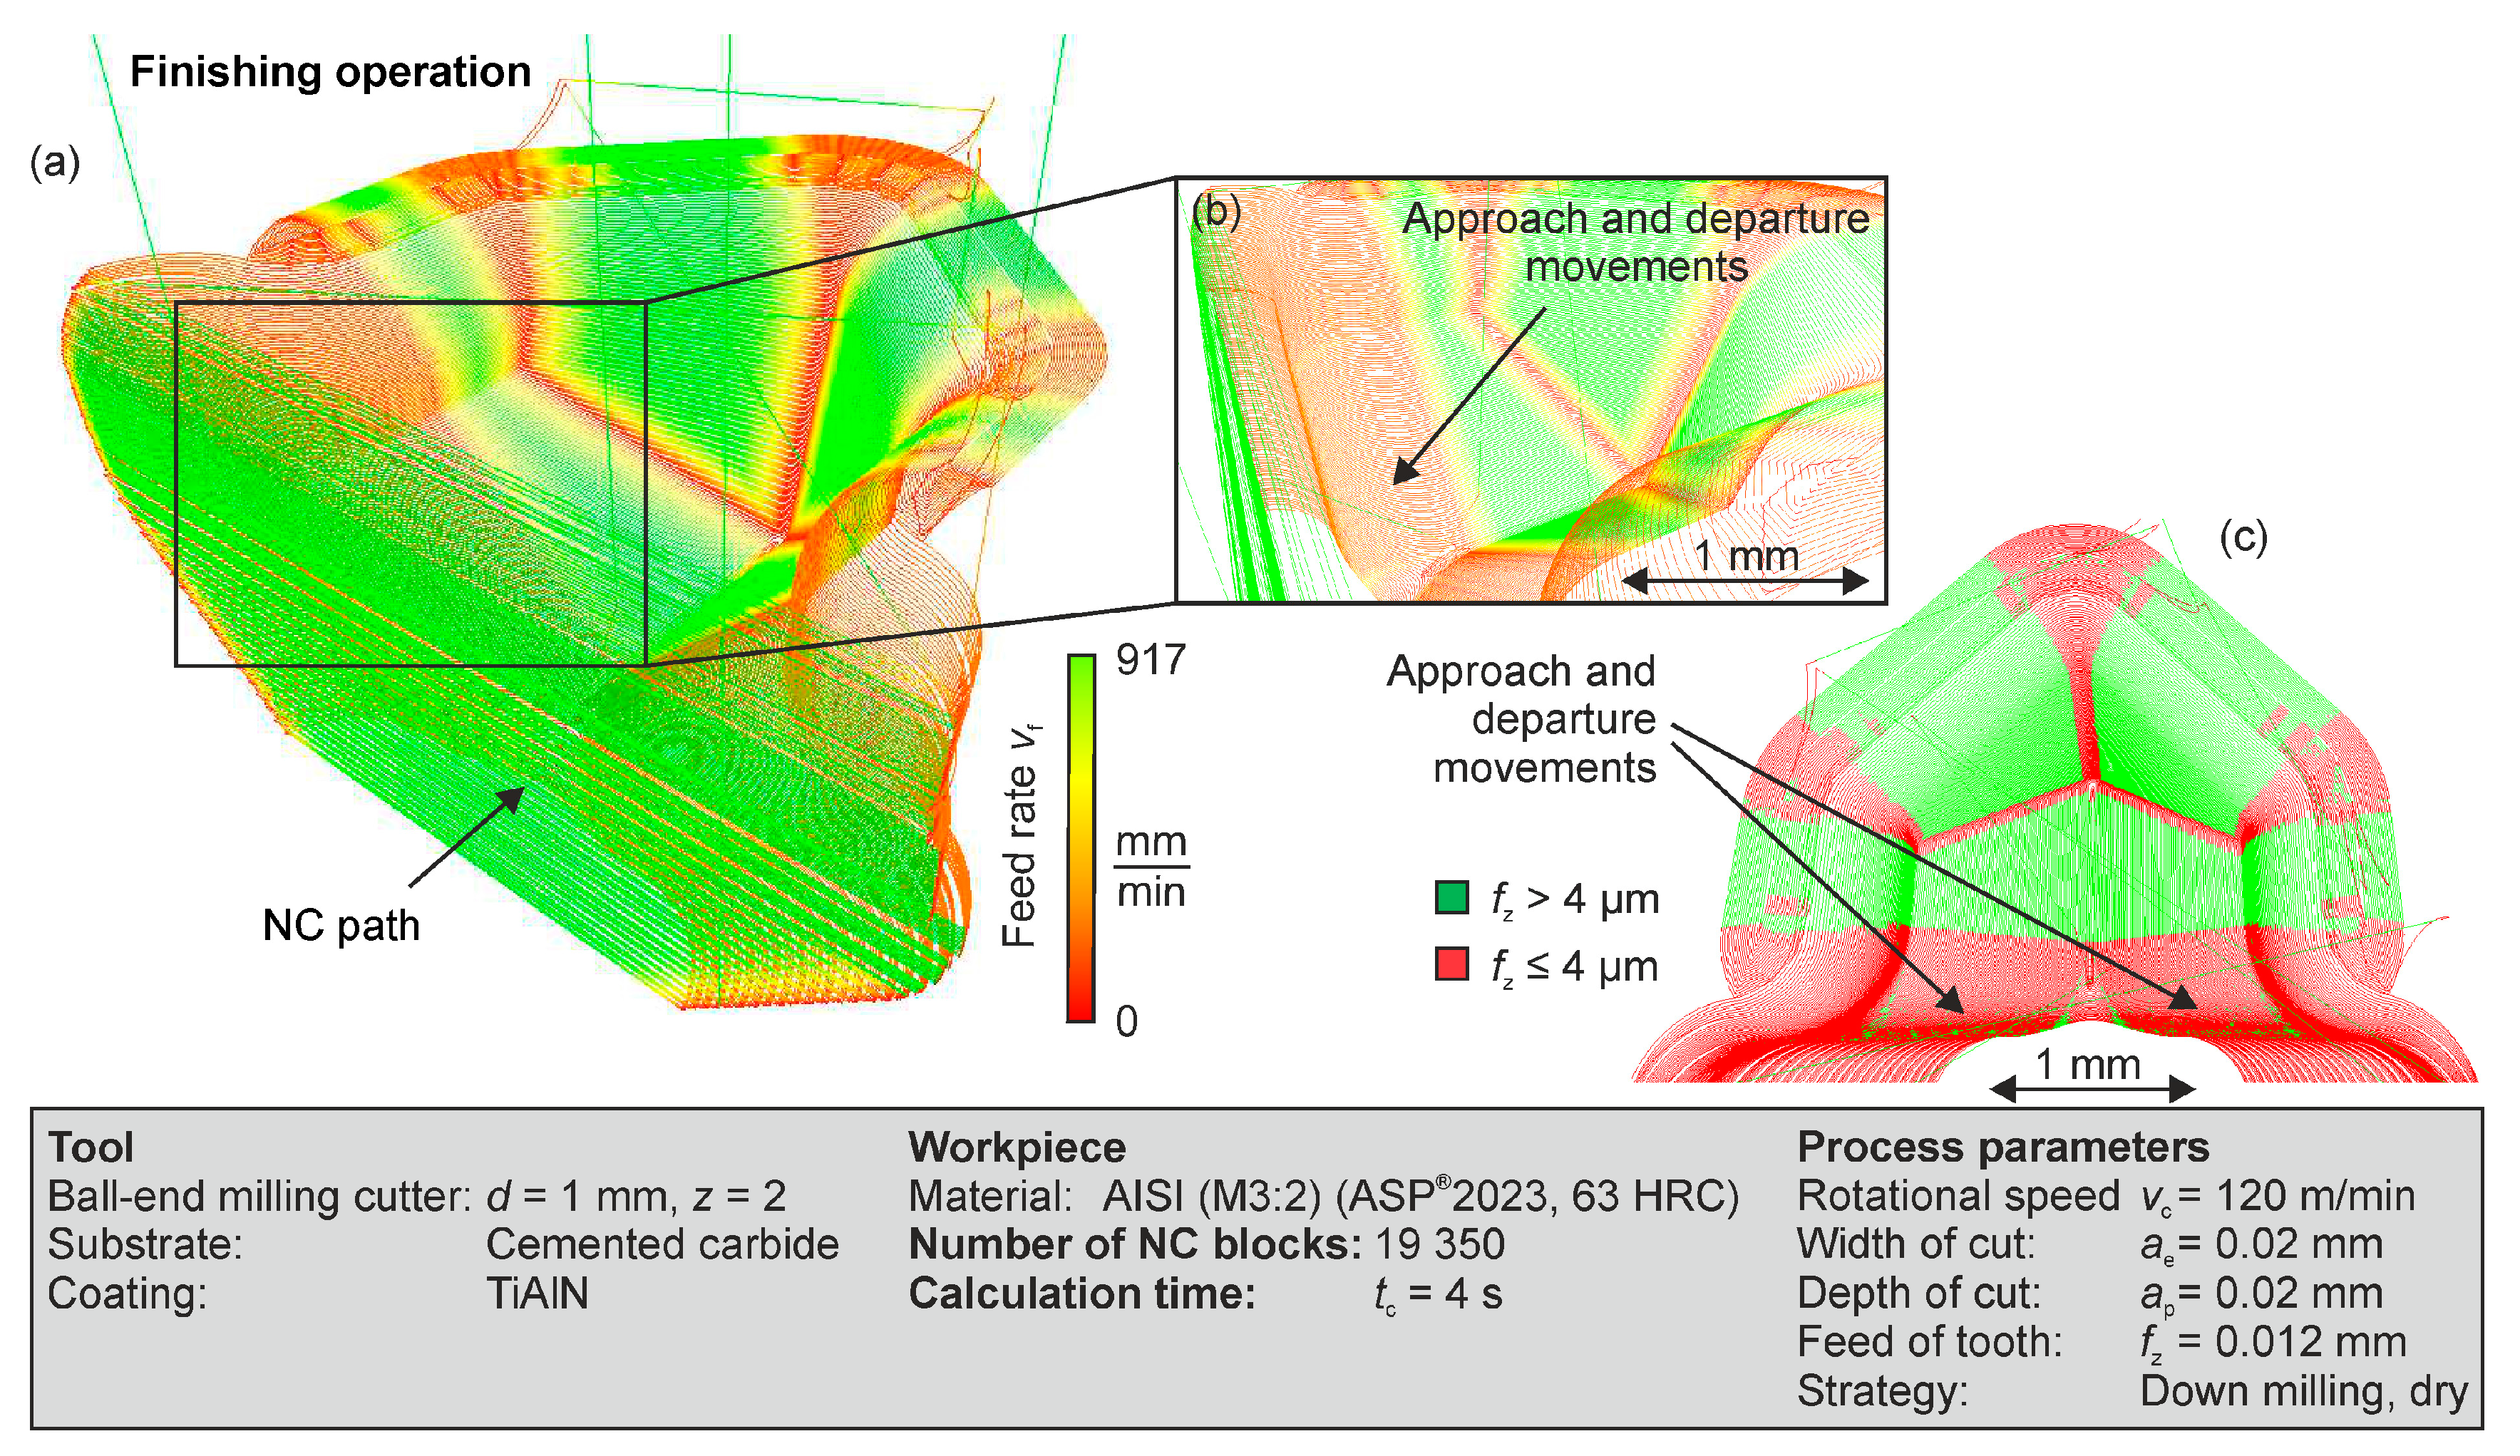
Figure 13.
Comparison of the production time prediction between a CAM system and the feed simulation.
Figure 13.
Comparison of the production time prediction between a CAM system and the feed simulation.

Figure 14.
Analysis of different process strategies within the feed simulation to minimize the influence of feed rate slowdowns.
Figure 14.
Analysis of different process strategies within the feed simulation to minimize the influence of feed rate slowdowns.
© 2018 by the authors. Licensee MDPI, Basel, Switzerland. This article is an open access article distributed under the terms and conditions of the Creative Commons Attribution (CC BY) license (http://creativecommons.org/licenses/by/4.0/).
Share and Cite
MDPI and ACS Style
Meijer, A.; Krebs, E.; Wiederkehr, P.; Biermann, D. Prediction of Feed-Rate Slowdowns in Precise Micromilling Processes. J. Manuf. Mater. Process. 2018, 2, 19. https://doi.org/10.3390/jmmp2010019
AMA Style
Meijer A, Krebs E, Wiederkehr P, Biermann D. Prediction of Feed-Rate Slowdowns in Precise Micromilling Processes. Journal of Manufacturing and Materials Processing. 2018; 2(1):19. https://doi.org/10.3390/jmmp2010019
Chicago/Turabian StyleMeijer, Alexander, Eugen Krebs, Petra Wiederkehr, and Dirk Biermann. 2018. "Prediction of Feed-Rate Slowdowns in Precise Micromilling Processes" Journal of Manufacturing and Materials Processing 2, no. 1: 19. https://doi.org/10.3390/jmmp2010019