Developing a Zener–Hollomon Based Forming Limit Surface for Warm Sheet Forming of Magnesium Alloy

1
Body Manufacturing Engineering at GM Warren Tech Center, 30001 Van Dyke, Warren, MI 48090, USA
2
Mechanical Engineering, University of Michigan—Dearborn, Dearborn, MI 48128, USA
*
Author to whom correspondence should be addressed.
J. Manuf. Mater. Process. 2018, 2(1), 3; https://doi.org/10.3390/jmmp2010003
Submission received: 3 October 2017
/
Revised: 17 December 2017
/
Accepted: 26 December 2017
/
Published: 11 January 2018
Abstract
:The concept of Zener–Hollomon (Z) based Forming Limit Surface (Z-FLS)—which has minor strain, major strain, and ln(Z) as its three axes—was initially proposed in a previous study. In the Z-FLS diagram, strain rate and temperature effects on the major limit strain are reflected by ln(Z). In the current study, the concept of Z-FLS is revisited to provide a practical approach to construct Z-FLS. A Z-FLS then is constructed for magnesium alloy AZ31B sheet material using available experimental forming limit curves. The constructed Z-FLS is used to identify fracture in a non-isothermal warm cup forming process, which was modeled as a coupled thermo-mechanical process. Based on the Z-FLS, the determined limiting draw ratio (LDR) matches well with the published experimental results.
1. Introduction
As the lightest structural metal, magnesium alloys are attractive candidates for lightweighting automotive components [1,2]. However, magnesium alloys have poor formability at room temperature, which is attributed to the fact that basal slip and twinning of the HCP crystal structure of magnesium are the only two active deformation mechanisms at room temperature. At elevated temperatures, the formability of magnesium alloys is improved substantially due to the activation of additional slip systems, e.g., <c + a> slip, and thermally activated dynamic recrystallization [3]. This is the reason for developing warm forming processes for manufacturing magnesium alloy parts [4]. Among the wrought magnesium alloys, AZ31 is the most frequently considered sheet material for automotive applications. Considerable increase in the formability of the AZ31 alloy was observed at temperatures ranging from 200 to 350 °C in warm forming of conical cups by [5], circular cups by [6,7,8] and square cups by [9]. With improved formability, vehicle deck lid inner panels formed from AZ31 sheet alloy using hot gas pressure forming process at 450 °C have been reported by Carter et al. [10].
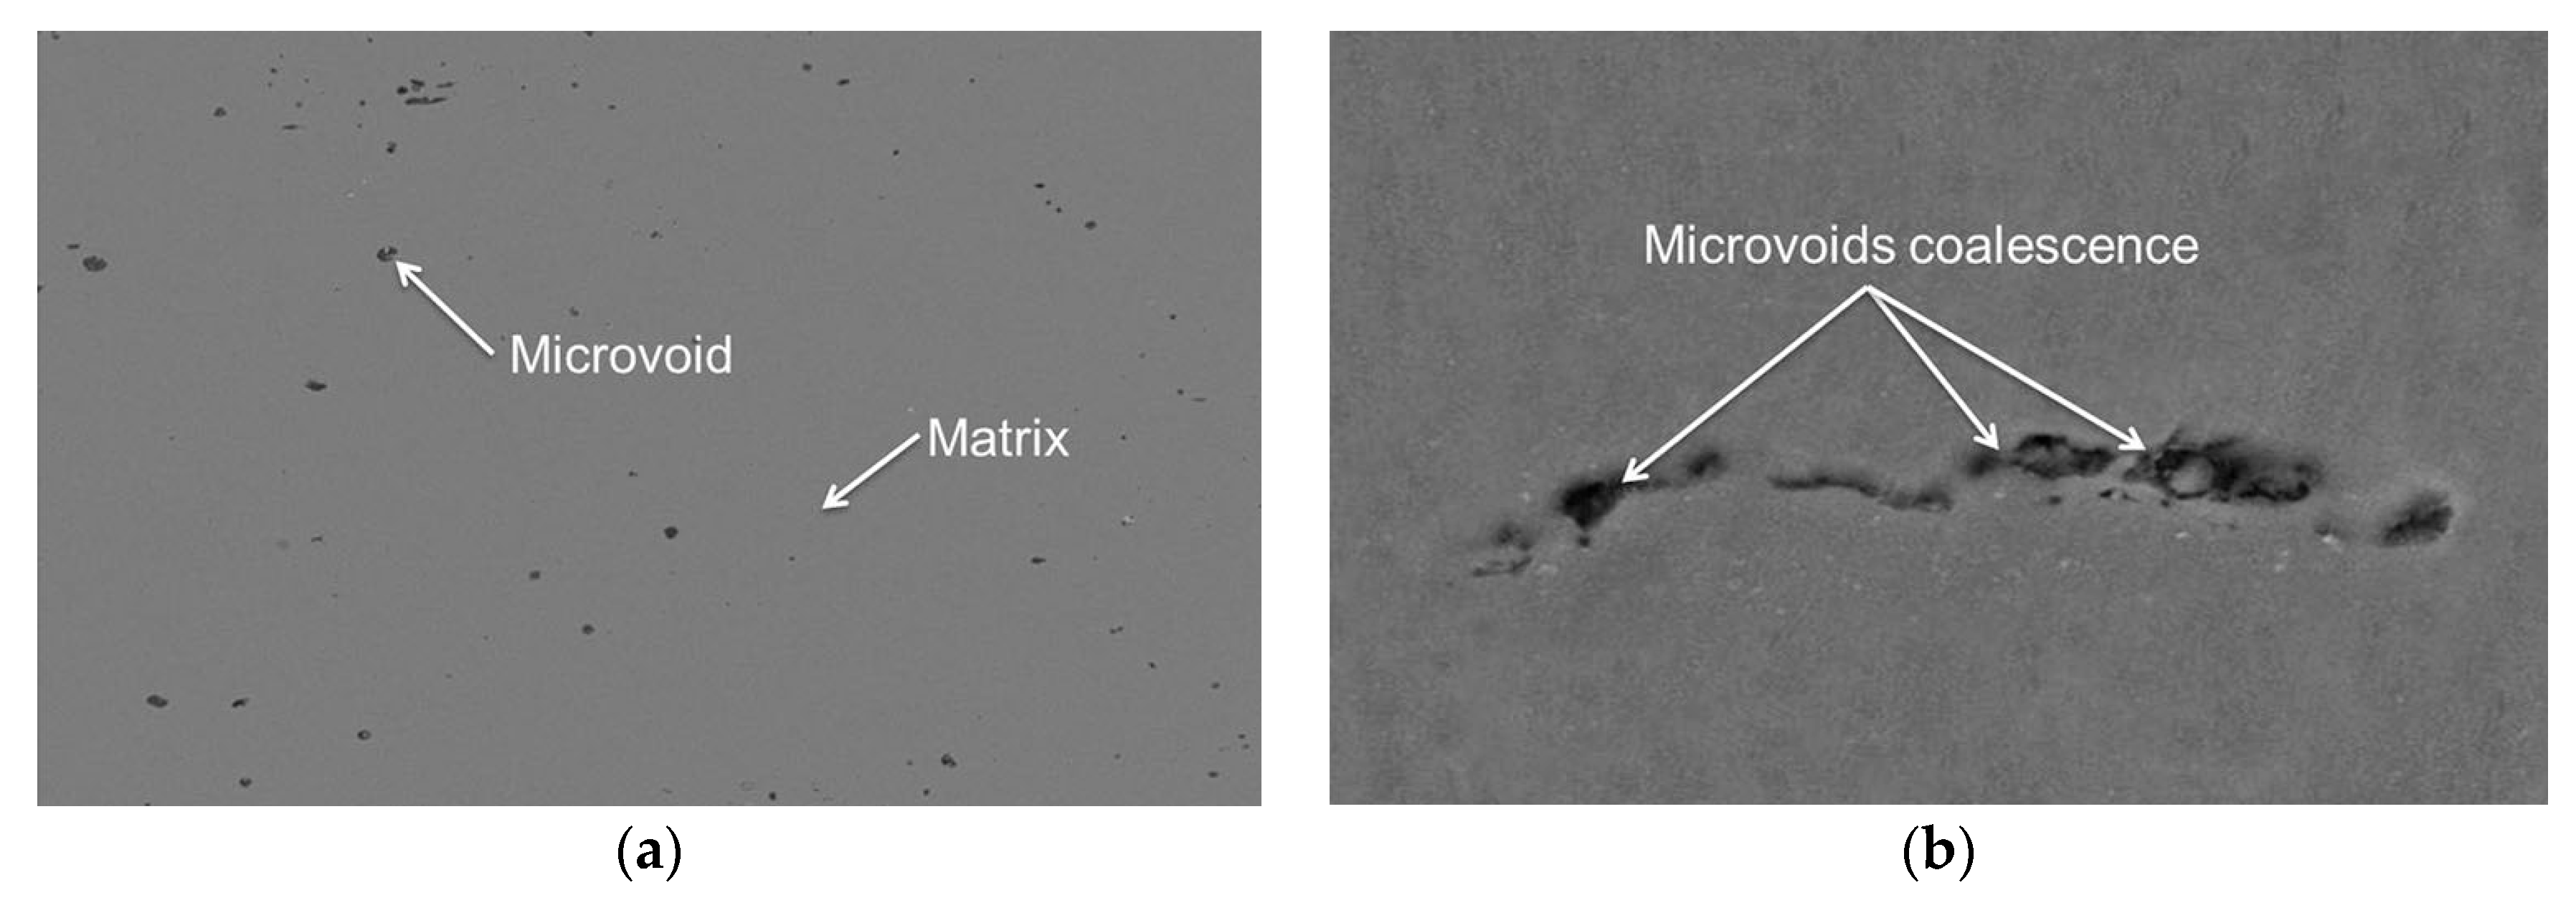
In warm forming magnesium alloy sheet materials, the stretching failure is generally regarded due to ductile fracture mechanism, in which fracture happens as a result of void nucleation, growth, and coalescence. Figure 1 gives a SEM morphology of the AZ31 sheet material at temperature of 100 °C [11]. Figure 1a shows that small amount of voids can be observed before deformation. Due to plastic deformation, the voids grow and coalesce at the initiation of fracture as shown in Figure 1b.
Finite element method based forming simulations are widely used to design and optimize sheet metal forming processes [12]. Fracture and necking failure in sheet metal forming are usually predicted using strain-based Forming Limit Curves (FLCs), in which major local strains at the initiation of localized necking and fracture are plotted against minor local strain [13]. Although it is sensitive to the strain path, the convenience of its implementation and lack of a better criterion has made the use of FLC a widely accepted method in both academia and industry for the identification of localized necking and fracture in sheet metal forming [14,15].
In various studies on formability of magnesium alloys in warm forming conditions, it is observed that the levels of FLCs increase with increasing temperature, but decrease with increasing strain rate [5,7,11,16,17,18,19]. Due to variation in tooling speed and heat transfer between the sheet and the tool, warm forming is, in general a non-isothermal process, which creates spatially and temporally different distribution of strain rates and temperatures on the sheet during the forming operation [6,7,8,9]. Thus, the prediction of fracture in warm forming requires a complete representation of forming limits that vary with strain rates and temperatures. Three-dimensional forming limit diagrams with either temperature or strain rate as the third axis have been proposed [20,21]. A three-dimensional forming limit surface that takes into account both temperature and strain rate was proposed in [1]. In this concept, the Zener–Hollomon parameter (Z), or the so-called temperature-compensated strain rate [22], is used to represent the effects of strain rate and temperature on the forming limit and forms the third axis in the Forming Limit Surface diagram. The three-dimensional FLS, which is termed Z-FLS in the current paper, was based on the observation that the major limit strains on the forming limit curves of aluminum alloy 5083-O sheet at different strain rates and temperatures can be described as a function of ln(Z). In the current study, the concept of Z-FLS is revisited from following two aspects:
- (1)
- Introduction of a normalized Z parameter in natural logarithmic scale , which makes it compatible with the strain values and thus provides a practical and user friendly interface for identifying failure.
- (2)
- Introduction of a construction procedure, in which firstly, major limit strain is represented in a space of and strain ratio (), which is a ratio between minor strain and major limit strain of the measure data point at forming limit; then the major limit strain is transformed into a space of minor strain and . The construction procedure can avoid reduced amount of data points measured at larger minor strain levels, which happens when Z-FLS is constructed in the space of directly [1]. For example, in the test data of sheet material Al 5083 [1,23], at , only four major limit strains can be measured from tested FLCs at temperatures of 423, 473, and 573 °K and strain rates of 10−1/s, 10−2/s, and 10−4/s while 12 data points (major limit strains) can be measured at .
Based on those further developments, a Z-FLS is constructed for AZ31B sheet material by using available forming limit curves and used to identify fracture failure by using FEM simulations of a non-isothermal round cup drawing process.
2. Zener–Hollomon Based Forming Limit Surface (Z-FLS)
The Zener–Hollomon based forming limit surface (Z-FLS) is a three dimensional representation of forming limits of sheet materials that can be expressed in the following equation form.
In this equation, and are the major and minor local strains, and Z represents the Zener–Hollomon parameter [22] given by Equation (2).
where, is the strain rate, Q is the activation energy, R is the gas constant, and T is the sheet temperature in K.
The dependency of the effective strain at fracture on ln(Z) was reported in hot tensile/torsion tests on bulk aluminum alloys [24] and warm forming of magnesium sheet material [25]. Alexandrov et al. [24] used a polynomial function of the form to represent the effective limit strain at uniaxial tension
where A, B, and C are material parameters that are determined by regression analysis of effective limit strains from tensile tests at a few selected temperatures and strain rates. Such an empirical relationship can be observed at other strain paths on the FLCs measured from different temperatures and strain rates on Al5083 sheet material [1,23]. Based on this, the major limit strain can be expressed as
where A, B, and C are functions of strain ratio , which is a ratio between and . They are determined by fitting Equation (4) to experimentally determined FLCs at a few selected temperatures and strain rates and certain strain path, which is represented by . The use of is based on an assumption that sheet material deforms in proportional and quasi-proportional strain paths. Since strains in sheet forming range from −2 to 1 and ln(Z) is a much larger number, a normalized value of ln(Z) was used to make it compatible with the strain values. The normalized value, represented by , is calculated by using the equation
where, ln(Z0) is the value of ln(Z) at the lowest strain rate and the highest temperature in the selected warm forming experiments, i.e., at 300 °C and strain rate of 10−4/s in [26]. Then, replacing ln(Z) with , Equation (4) becomes
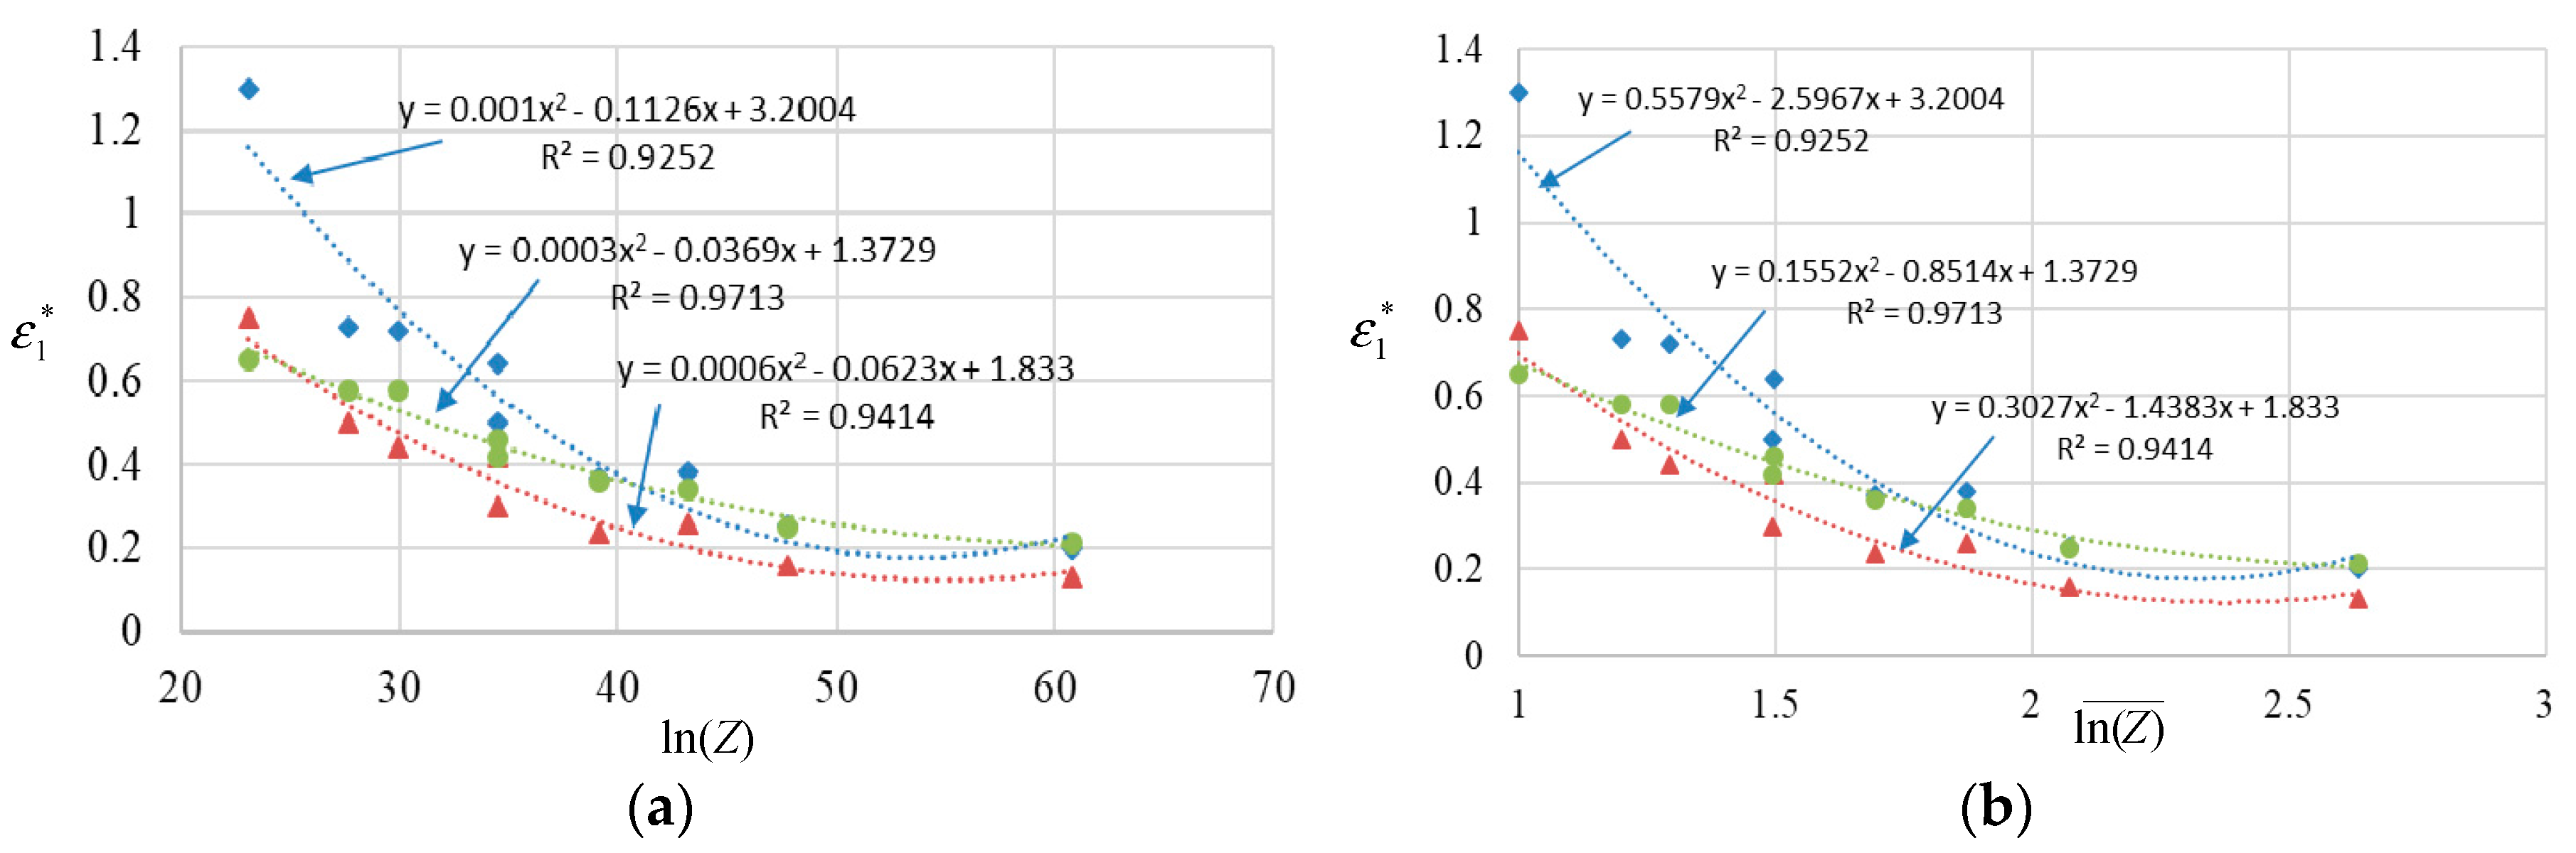
Equation (6) suggests a Z-FLS in a space of . Based on test data in [26], Figure 2 gives major limit strain plots as functions of Equations (4) and (6) under three critical strain paths of Uniaxial Tension (UT), Plane Strain (PS), and Equal Biaxial Tension (EBT). The analysis shows that the same level of correlation coefficient (R2) can be achieved using either ln(Z) or along three different strain paths. This rationalizes the usage of .
Using the major limit strain in Equation (6), Z-FLS can be transformed to a space of as
When working with a finite element forming simulation model to predict forming limit, the risk of fracture can be determined by considering the difference of the major limit strain on the surface of the Z-FLS diagram and the calculated major strains in various elements on the model. In equation form, the difference is given by
If is higher than or equal to zero, fracture will occur. Given a safe margin of 0.05, if is between 0 and −0.05, the element is considered to be at risk of fracture; otherwise, the element is considered safe.
3. Construction of Z-FLS for AZ31 Magnesium Alloy
Forming limit curves (FLCs) reported in the literature at four different temperatures and two different strain rates were used to construct the Z-FLS for an AZ31 magnesium alloy as shown in Figure 3. Three forming limit curves from [5,9], were generated using Nakajima dome test data on 1.2 mm thick rectangular specimens of AZ31 magnesium alloy sheet under isothermal temperature conditions of 100, 200, and 300 °C and a constant punch speed of 0.1 mm/s [5,9]. The obtained FLCs were fitted from measured data from three orientations to the rolling direction, i.e., 0°, 45°, and 90°. In constant speed mechanical stretching tests [26], such as the Nakajima dome test, the strain rate increases with punch travel and its value depends on the punch speed. Albakri et al. [26] have shown that, under balanced biaxial test conditions in a Nakajima dome test, the strain rate in AZ31B sheets reached 0.008 s−1 at a punch speed of 0.1 mm/s and punch displacement of 32 mm. Since the strain rate value was not given in [5,9], it is assumed that the strain rate in their test is approximately 0.008 s−1. The strategy of strain rate determination conforms to the method used by Naka et al. [23], which used the strain rate close to the failure in their tests on determining FLCs. The fourth forming limit curve from [18], was developed using average values from 0° and 90° to the rolling direction based on pneumatic stretching tests on 0.98 mm thick rectangular specimens of AZ31B sheet at 400 °C and a constant strain rate of 0.005 s−1 [18]. It is to be noted that the sheet thickness in the second set of FLC is different than that in the first set. Antoniswamy et al. [27] have shown that initial sheet thickness did not affect the limit strain based on their tests on AZ31B sheet material at two different thicknesses (1.28 mm and 2.0 mm) at a temperature of 350 °C and different strain rates.
Table 1 lists the major limit strain values corresponding to strain ratios ranging from −0.25 to 0.6 based on above discussed FLCs. The major limit strain values in white boxes were measured from FLCs in Figure 3. The values of A, B, and C as a function of minor strain were determined using regression analysis of the data given in Table 1 and are plotted in Figure 4. Using Equation (6), major limit strains corresponding to several other minor strains and were then calculated. These values are in the blue boxes in Table 1.
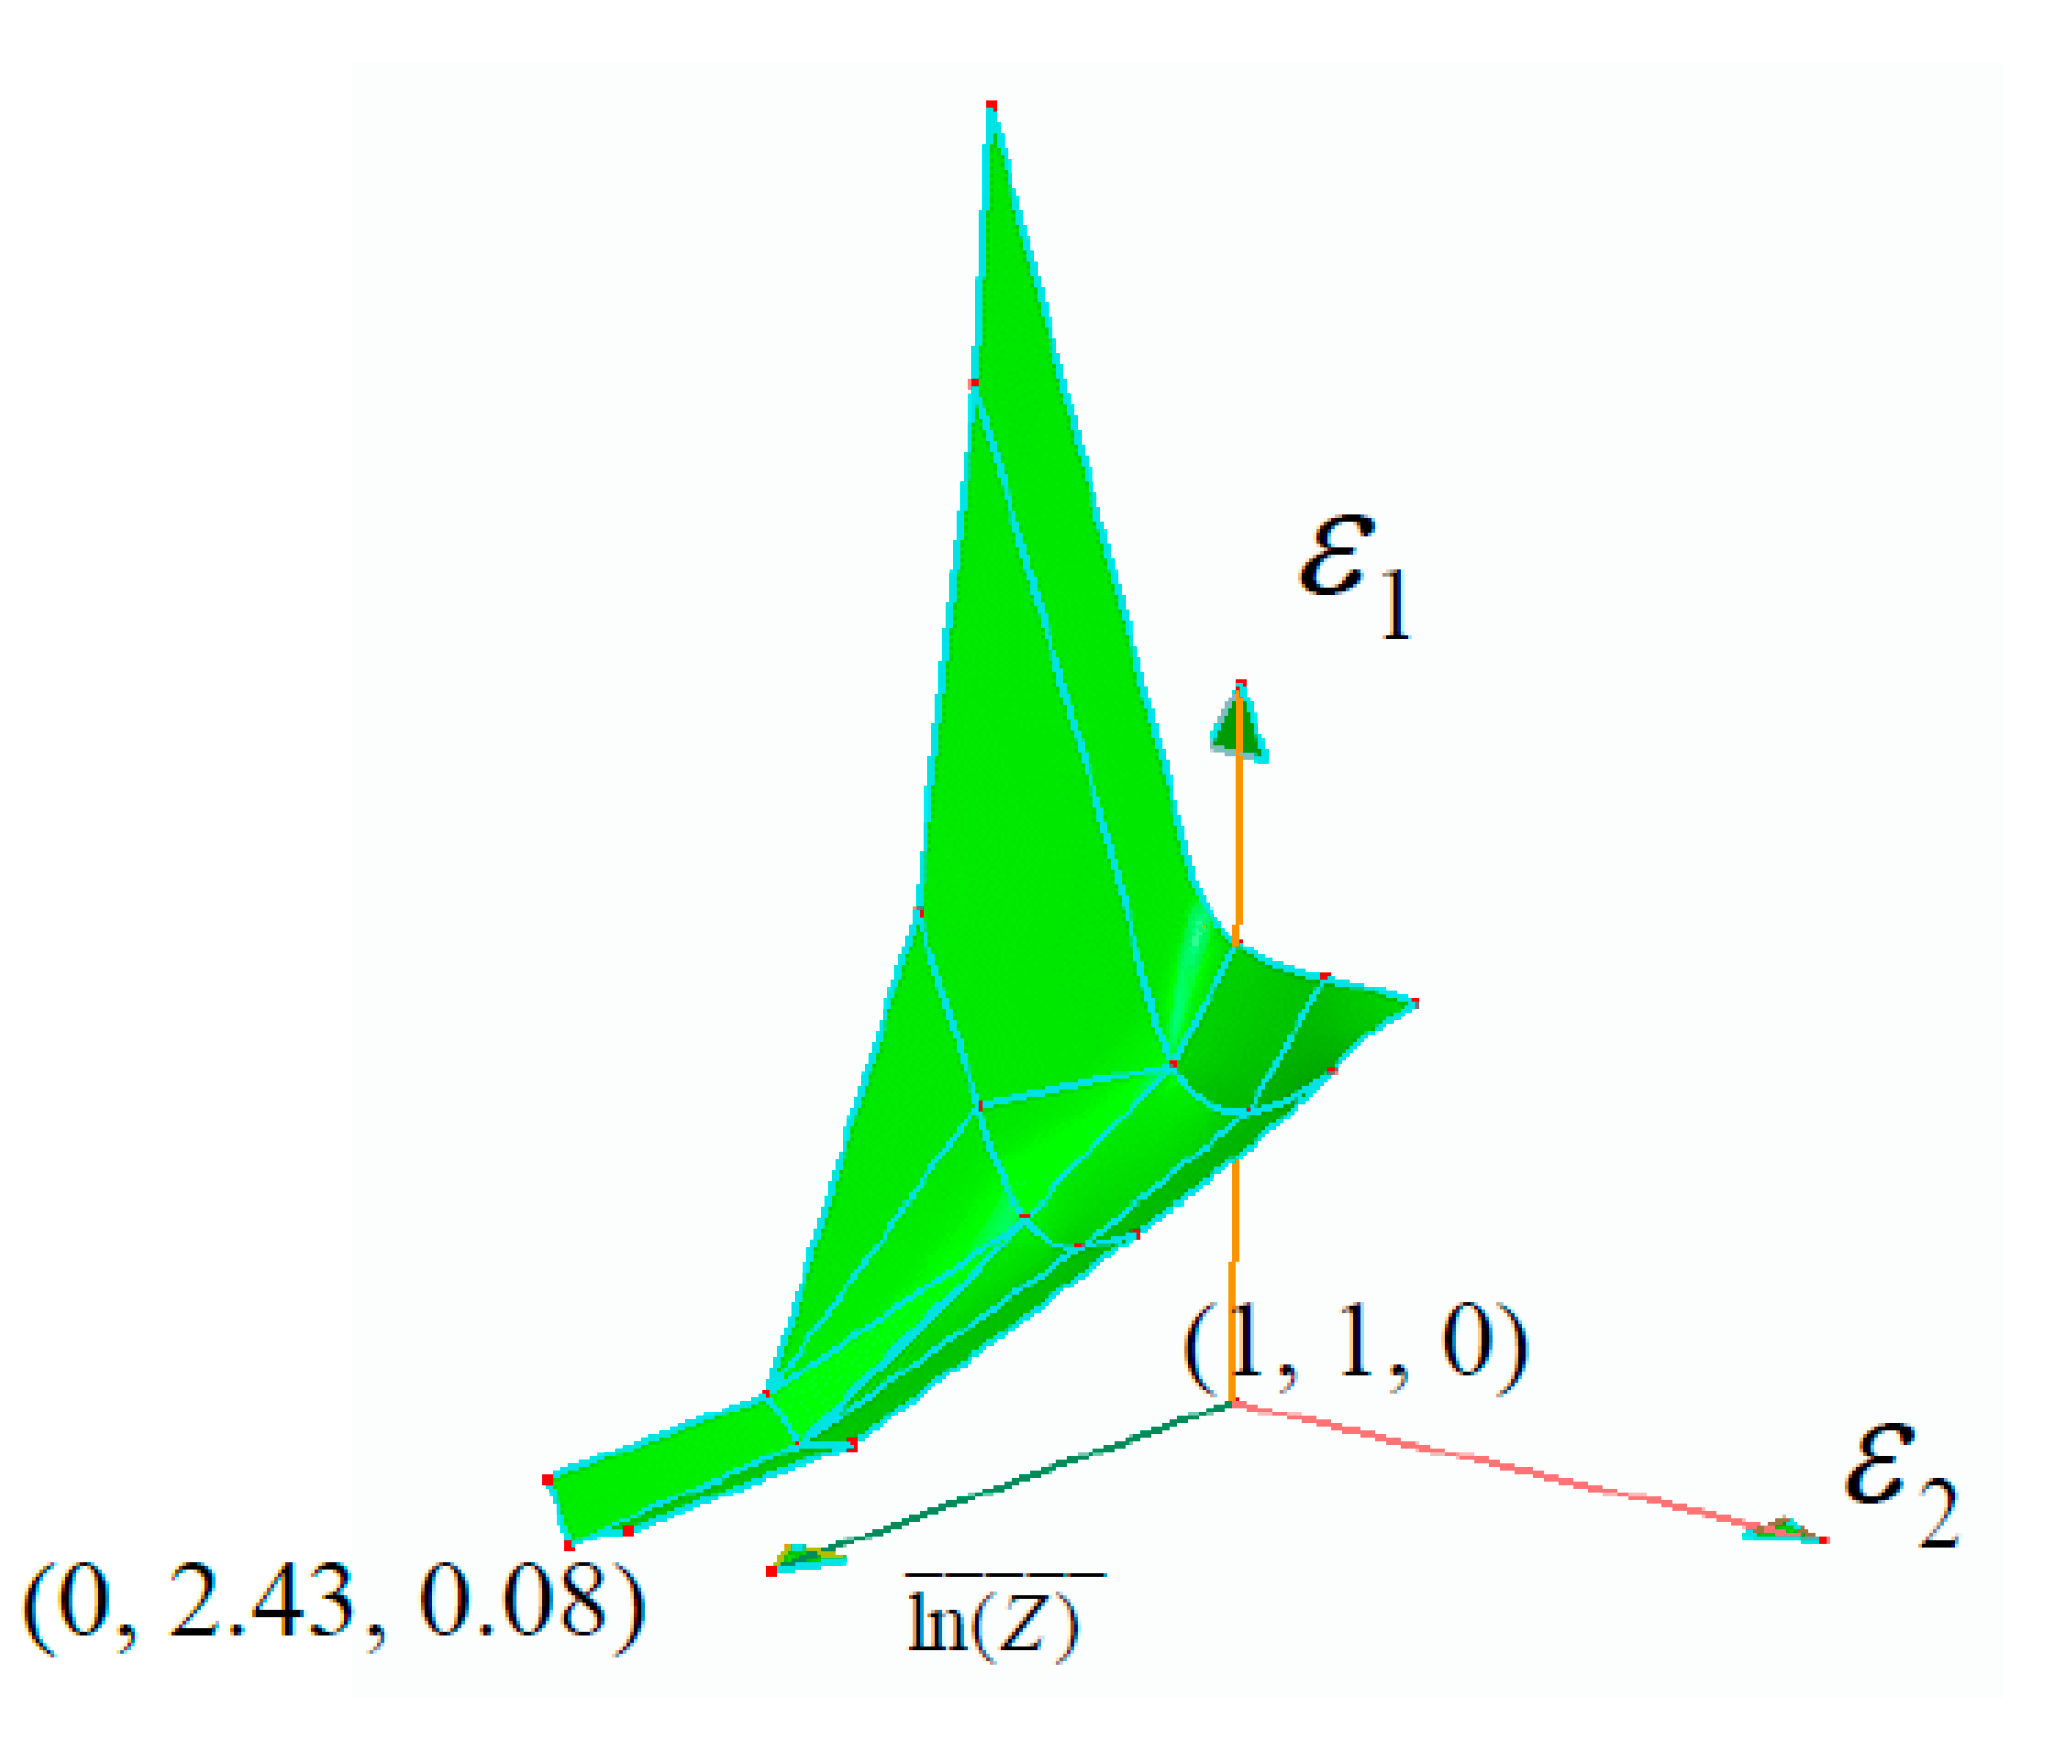
As shown in Table 1, among the four FLCs selected, the lowest ln(Z) is at 400 °C and strain rate of 0.005 s−1. It was calculated using R as 8.31 J mol−1 K−1 and an average activation energy Q of 135 kJ mol−1 [12]. Its value is 18.83, which was used as ln(Zo) for normalizing ln(Z). The upper limit of on the Z-FLS diagram corresponds to a combination of 50 °C temperature and 0.01 s−1 strain rate. Its value is 2.425, which corresponds to a ln(Z) value of 45.67. The selection of this upper limit is based on an assumption that the strain rate effect is trivial at room temperature. Using Equation (7), data in Table 1 was transformed into the space of and a Z-FLS was constructed as shown in Figure 5. In this figure, the major strain from Table 1 is plotted along the vertical axis and the corresponding minor strain , calculated from the strain ratio ρ, is plotted along one of the horizontal axes. The third horizontal axis represents , which has its lowest value at 1. It represents the combined effect of temperature and strain rate.
The use of Equations (6) and (7) to construct of Z-FLS was validated by determining FLCs from the constructed Z-FLS and comparing them with the experimental FLCs reported by Bruni et al. [17] and Hsu et al. [19] by using Nakajima dome tests. The experiments were conducted at 300 °C and two different strain rates, namely 0.001 s−1 and 0.01 s−1. The corresponding are 1.14 and 1.26 as shown in Figure 6. The forming limit curves determined by using Z-FLS and shown by the solid lines match well with the distribution of experimental data [17,19].
4. Fracture Prediction Using Z-FLS
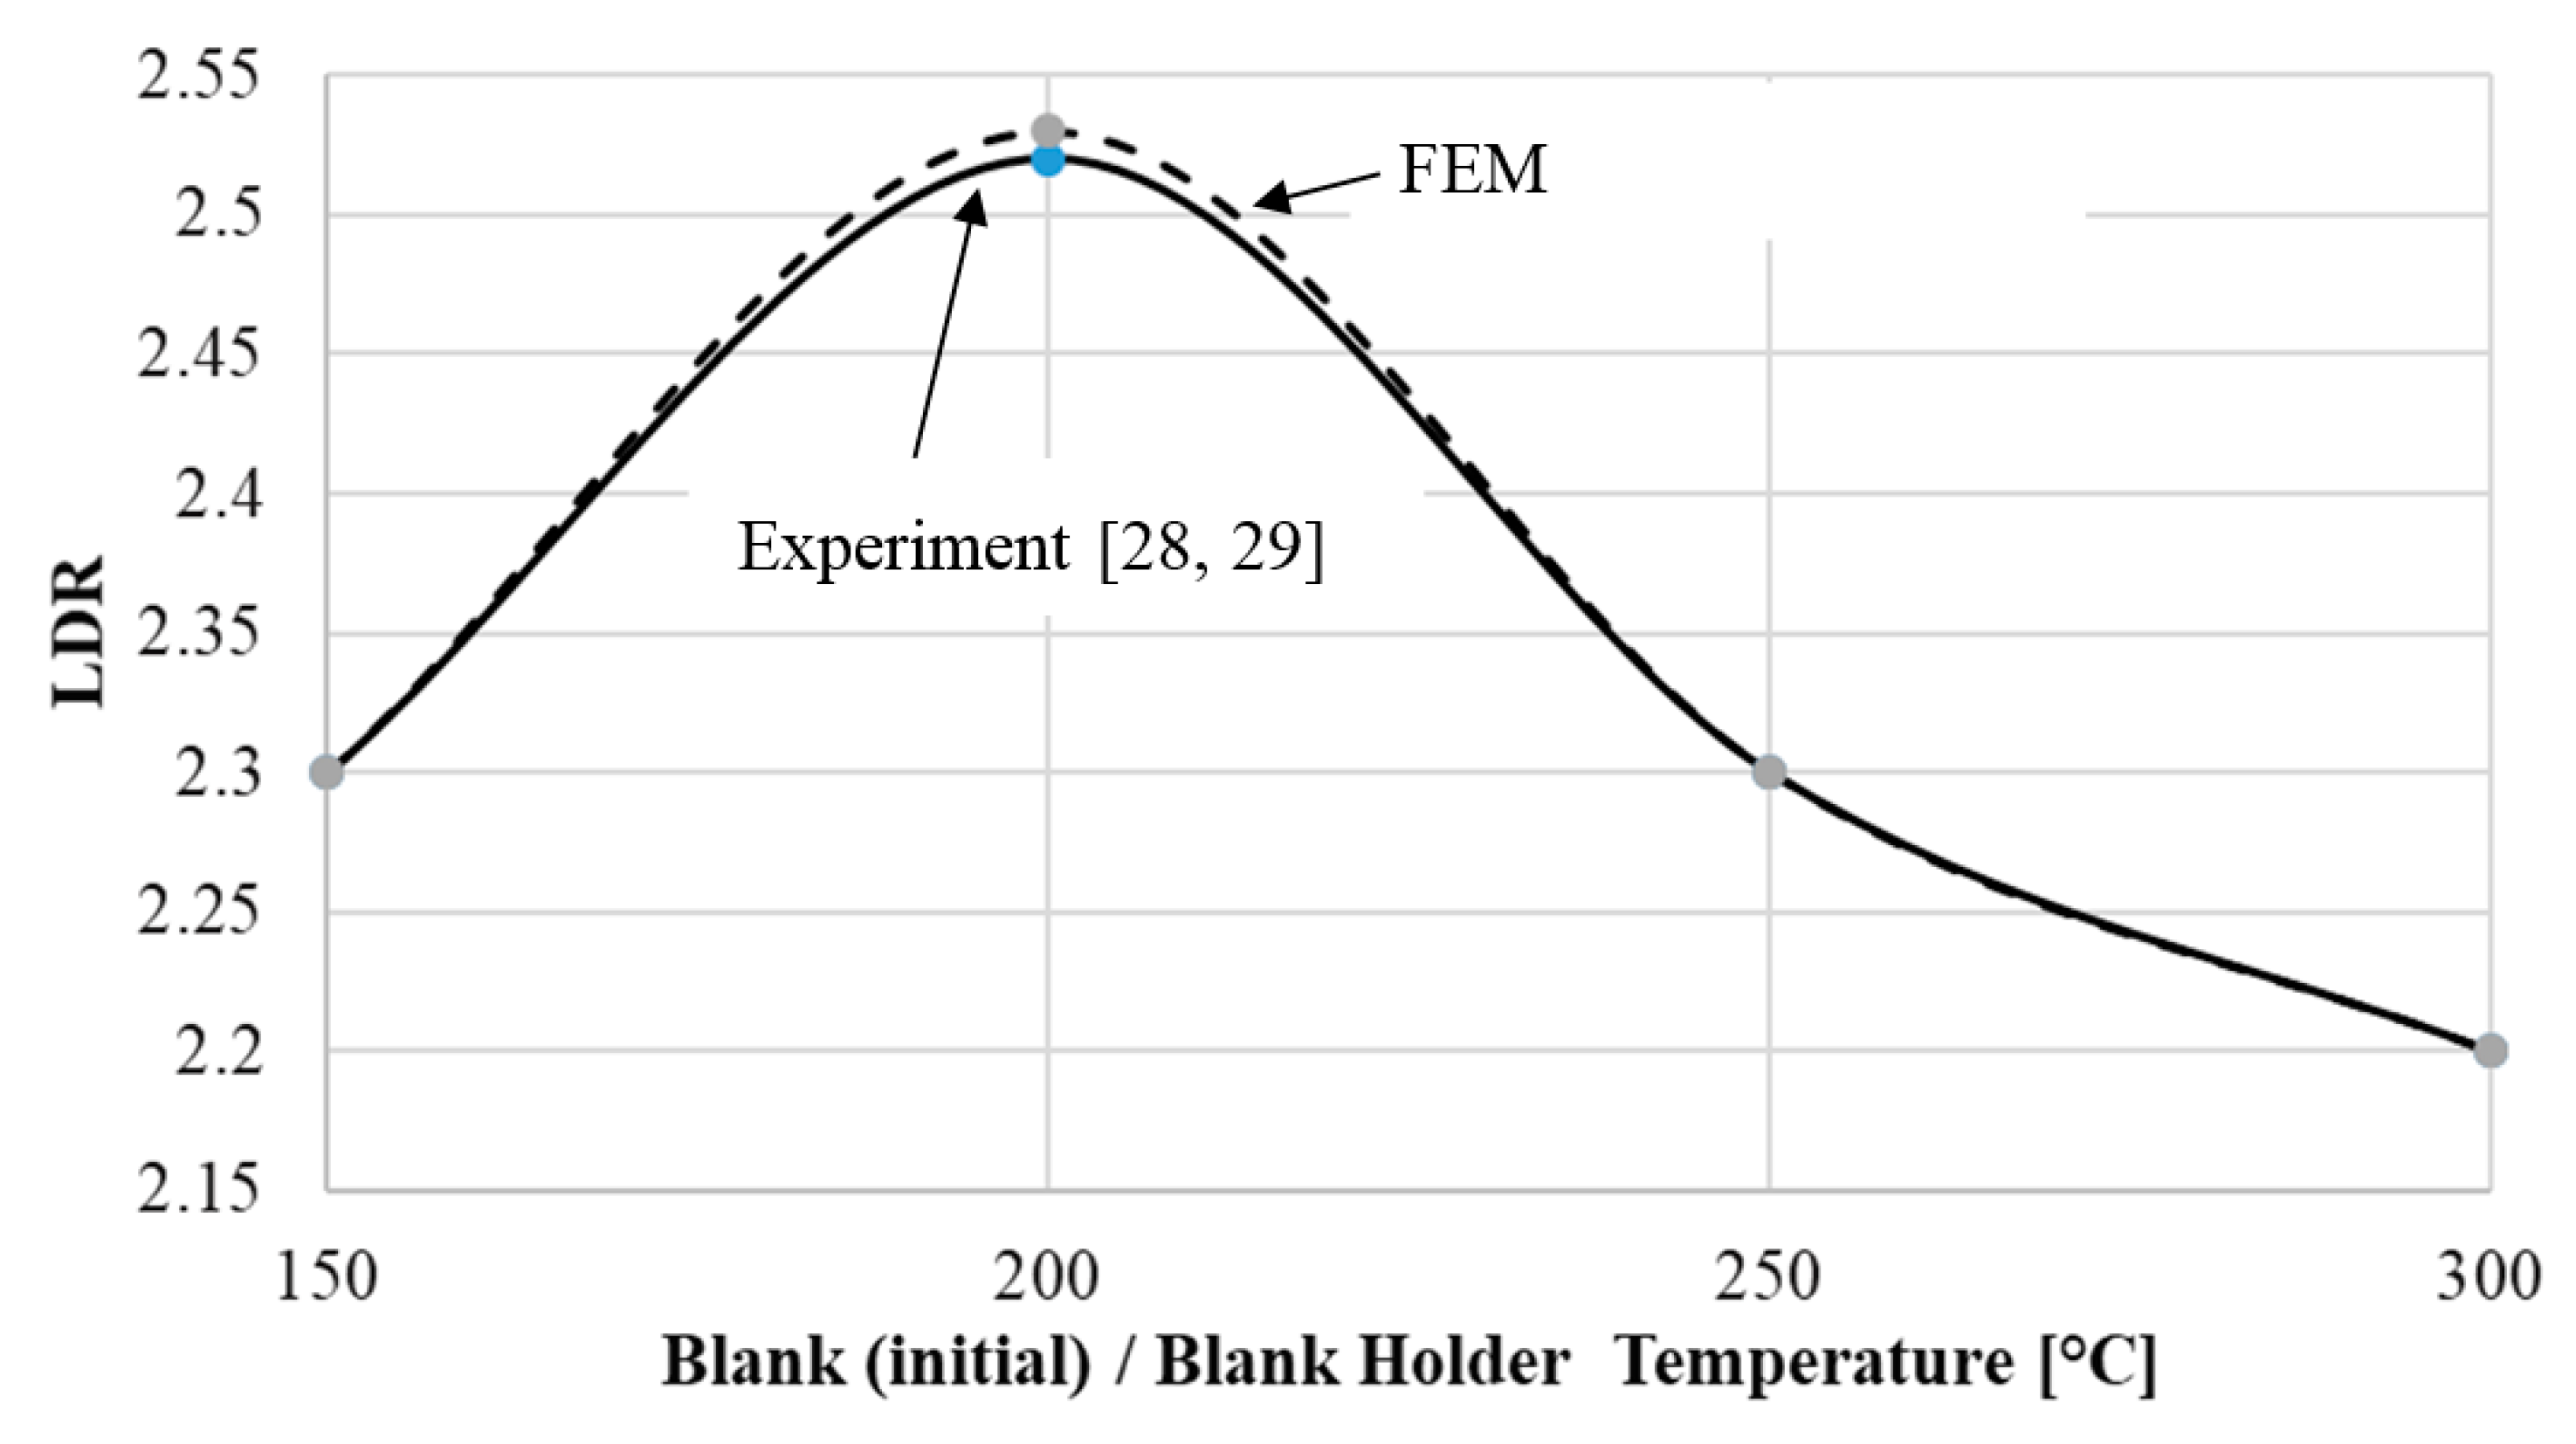
The Z-FLS constructed in Figure 5 is now used to predict fractures in an AZ31B sheet material during a non-isothermal round cup drawing process conducted by Dröder [28] and investigated numerically by Palaniswamy et al. [29]. In the experiments, Dröder determined the limiting draw ratio (LDR) of AZ31B at blank holder/die temperatures ranging from 150 to 300 °C and an initial punch temperature of 25 °C. The punch diameter and initial sheet thickness were 100 mm and 1.3 mm, respectively. At 5 mm/s punch speed and blank holder/die temperature of 200 °C, the maximum LDR was 2.52. In the test, the sheet blank was initially heated to a uniform temperature that is equivalent to blank holder/die temperature. During drawing, the cup bottom lost heat to cold punch while the flange area stayed at a high level due to the heating effect of blank holder/die. In order to predict failure, a thermo-mechanically coupled finite element simulation of the cup drawing process was conducted using the implicit and explicit codes of LS-DYNA. The plastic strains, thickness distribution in the sheet, and punch load were calculated using the explicit dynamic algorithm, while the thermal phenomenon was calculated using the implicit algorithm.
4.1. Flow Stress Modeling
The flow stress at different temperatures and strain rates are expressed by a set of baseline flow stress curves while the strain rate effect is calculated by the Cowper–Symonds equation [30]
where, is the baseline flow stress and is the effective plastic strain rate. C and P are temperature-dependent material parameters and are determined by minimizing the difference between the calculated flow stress and the flow stress at the target high strain rate.
In order to determine C and P in Equation (9), flow stress curves are needed at several temperatures and strain rates that are representative of the warm cup forming process being analyzed. Before localized necking, the strain rate in the cup wall during the cup drawing process with a punch speed of 5 mm/s is estimated to be in a range from 0.01 s−1 to 0.1 s−1. Thus, flow stress curves at temperatures ranging from 25 °C to 300 °C at strain rate of 0.01 s−1 were chosen for baseline while those at strain rate of 0.1 s−1 were chosen as target for determining C and P in Equation (9). The baseline flow stress curves and target flow stress curves were generated using the flow stress model [31] given by Equation (10) and the tensile test data from [28,29]. Based on this model, the strain rate and temperature effect on flow stress is expressed in terms of log (Z/2) as
From the tensile stress–strain diagrams shown in Figure 7a,b, K and n in Equation (10) were determined by regression as
Based on Equation (10), two sets of baseline and target flow stress curves at temperatures ranging from 25 °C to 300 °C were generated as shown in Figure 7c,d.
Then C and P at different temperatures were generated by minimizing the difference between the target flow stress and the baseline flow stress obtained from Equation (10). Table 2 gives the C and p values obtained by using the process described above.
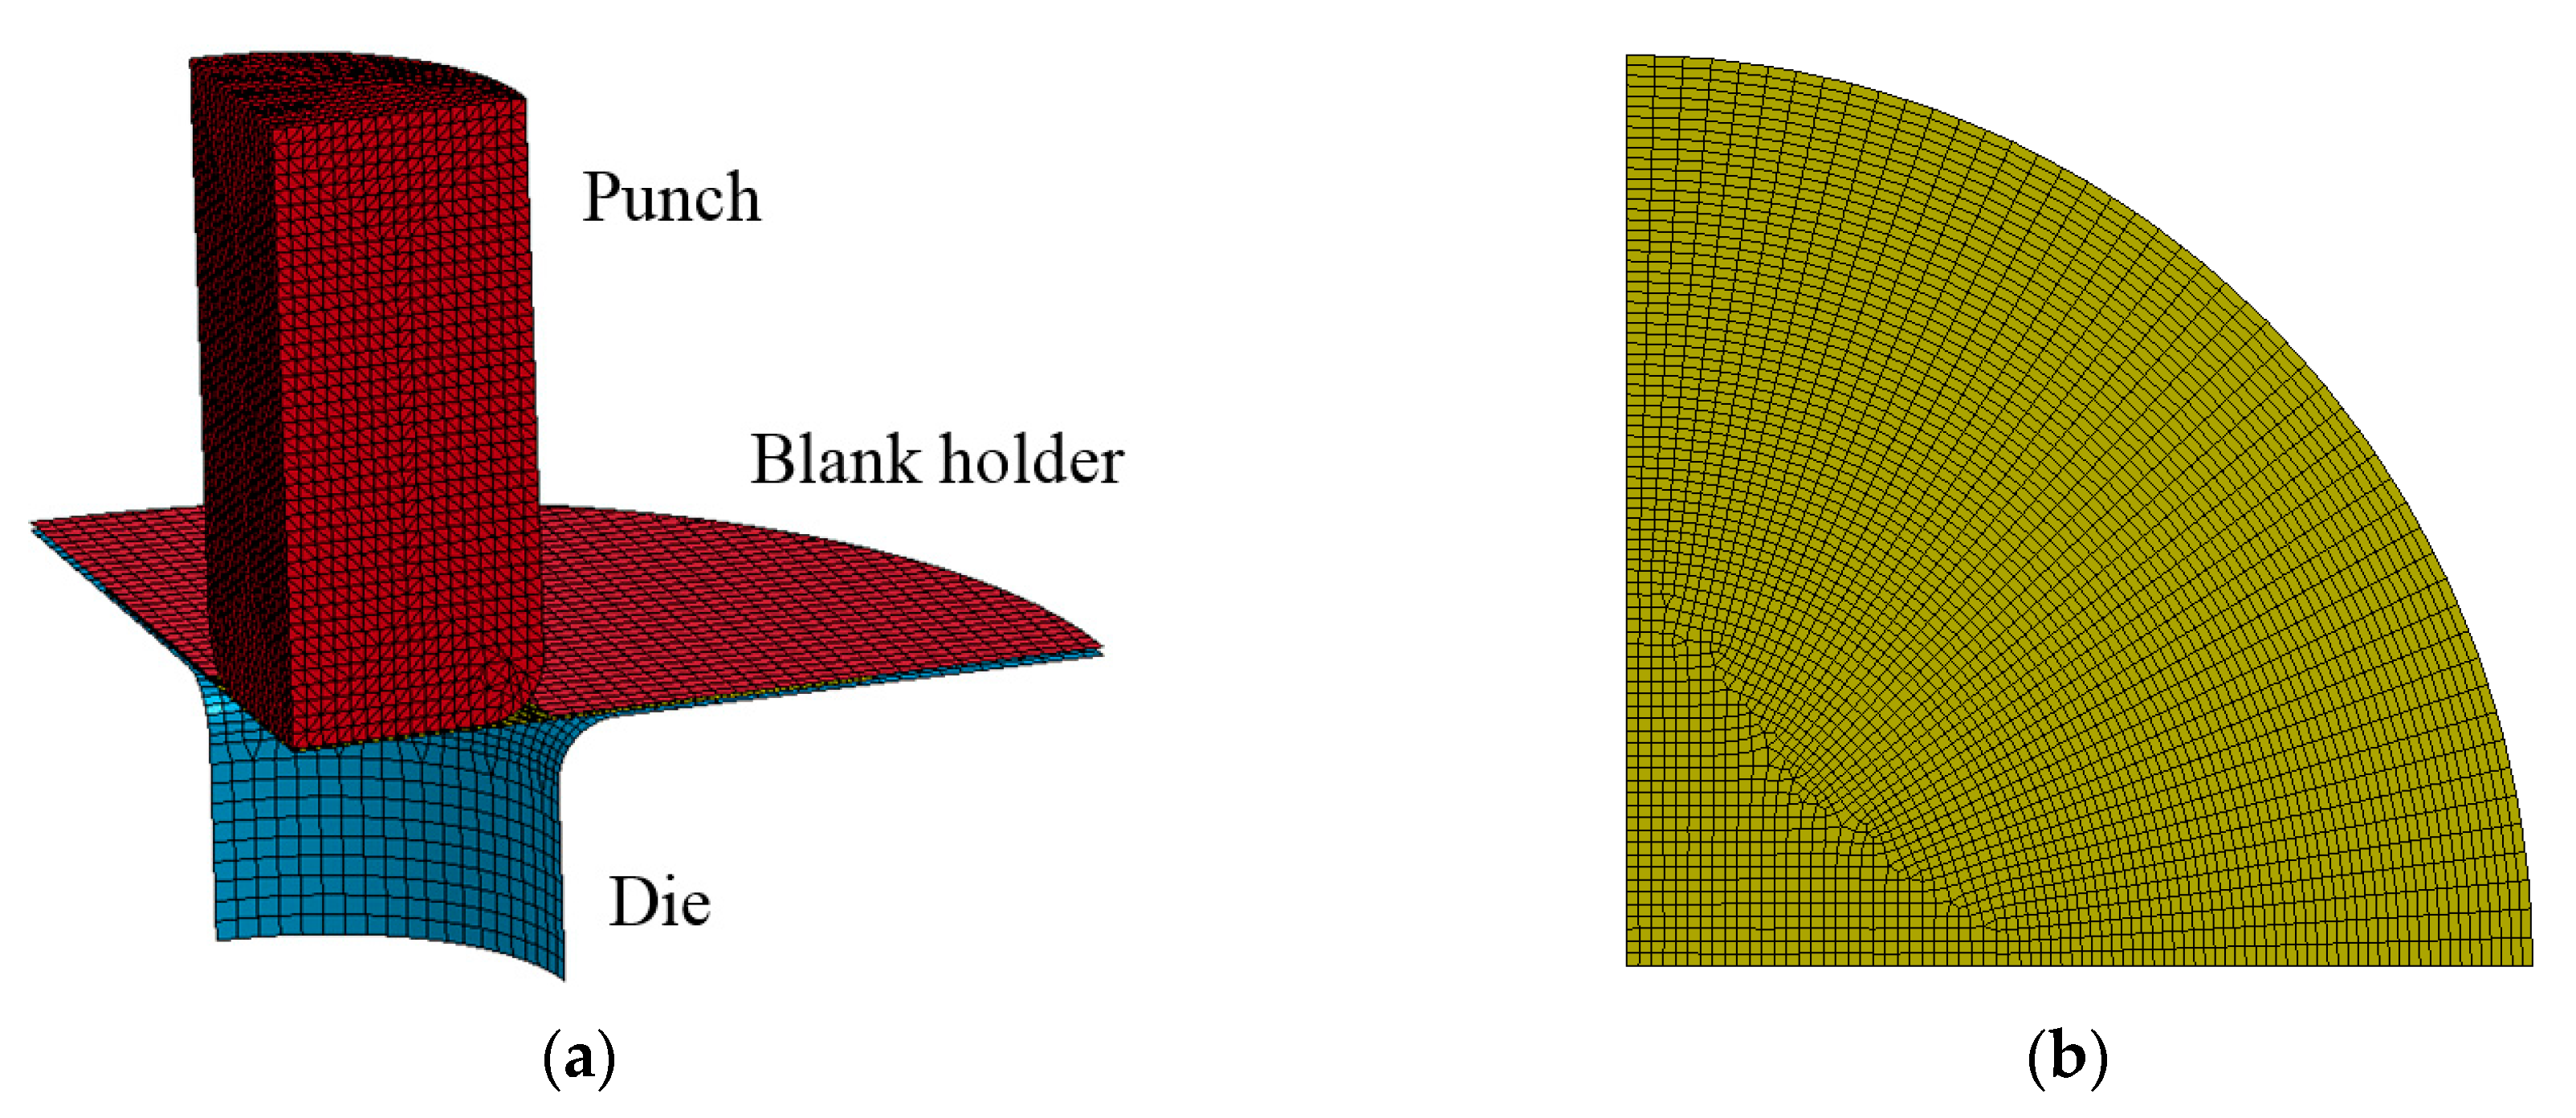
4.2. FEM Modeling of Round Cup Draw
Figure 8 shows the FEM model for the round cup draw. Table 3 lists the processing conditions and Table 4 lists the material properties used in the simulation. The blank holder pressures vary with different setups to be at a minimum level to prevent wrinkling. It is assumed that no phase transformation happens during plastic deformation [4]. Anisotropic behavior of AZ31 sheet material was studied by several studies [3,17,18,30]. Based on polycrystal simulation study, the anisotropy can be explained by the increased activity of non-basal <c + a> and dislocations [3]. In their study, Anew and Duygulu [3] observed that normal anisotropy (r) values at the transverse direction (TD) and 45° direction drop and become closer to those of the rolling direction (RD), at which its r-values vary around 1 at temperatures ranging from 25 °C to 200 °C. Such a trend has also been observed by Tari and Worswick [30] in their study at the temperatures ranging from 200 °C to 250 °C. Based on the observed tendency and to reduce the complexity of material modeling, material deformation is assumed as isotropy in this study.
The tooling components were modeled as rigid, while the sheet blank was modeled as an elastic-viscoplastic material with thermal effects. Material model 106 (MAT 106) in LS-DYNA, which uses von Mises criteria for isotropic yielding, was used to describe the elastic-viscoplastic behavior of the sheet material. The punch was modeled by using tetrahedron solid elements with 10 nodes and an average mesh size of 3 mm and had 8 elements distributed over the punch radius to calculate the heat transfer between the punch and the blank. Since the blank holder and the die temperatures are higher than the punch and blank temperatures, they function as heat source and were modeled by shell elements with an average mesh size of 2.5 mm, which ensured nine elements distributed over the die radius. The sheet blank was meshed with mixed quad and triangular shell elements with an average size of 2 mm. The quad elements were uniformly distributed from the edge of the blank to the start of the bottom flat surface of the punch to avoid high stiffness introduced by the triangular elements. The die displacement was constrained while the punch and the blank holder were allowed to move only in a vertical direction.
The Coulomb friction coefficient at the interfaces between the tooling components and the sheet material was assumed as 0.1 at 25–150 °C, 0.2 at 200 and 250 °C, and 0.4 at 300 °C. The selection of relatively high values of friction coefficients at higher temperatures is based on friction study on magnesium alloys at different lubrication conditions at elevated temperatures [32,33,34,35]. Local increase of friction coefficient at high temperatures is due to the possible failure of lubricant and friction coefficient selection strategy discussed in [36].
4.3. Results and Analysis
In this study, cup drawing at four different temperatures of sheet blank/die/blank holder namely 150, 200, 250, and 300 °C—were simulated. The initial punch temperature was assumed to be 25 °C. The finite element models were first validated by comparing the calculated temperature distribution, punch load, and thickness distribution on the formed cups with the experimental measurements. Then, the Z-FLS in Figure 4 was used to predict fracture and determine the LDRs of the numerically formed cups.
4.3.1. Temperature Distribution
During simulations, the blank holder and die temperatures were maintained at the initial temperature, which caused the flange area to remain at a higher temperature than the rest of the cup. As the sheet blank was drawn into a cup, the cup wall was cooled due to heat loss to the cold punch. The temperature distribution on the cup wall is given in Table 5. The difference between the predicted values in this study and the reported values in [29] is small (<3 °C).
4.3.2. Punch Loads
Punch loads predicted by finite element simulations are compared with the measured values in Figure 9. The cups drawn at 150 and 200 °C do not exhibit any fracture, while the cups drawn at 300 °C fracture at 33 mm punch displacement. The punch loads reach the peak values at about 40 mm stroke at 150 and 200 °C, then decrease due to a reduction of restraining force from the work piece with reduced flange area clamped between the blank holder and the die. At 300 °C, the peak load is reached at a stroke of about 25 mm and stays at this level till the stroke reaches 33 mm, then drops due to the fracture of the cup wall. These trajectories are similar in trend to the punch load trajectories obtained in round cup draw [28,29]. At 150 °C, the predicted punch load is very close to the experimental value; however, at 200 °C and 300 °C, the predicted punch loads are higher at larger punch travels and the peak punch load is higher compared with the experimental values. The possible reasons are: (1) the stress–strain curves were extrapolated after the peak stress in the tensile test data and did not consider the softening stage; and (2) the elements were not deleted when the fracture criterion was met in the case of 300 °C.
4.3.3. Thickness Distribution
Figure 10 shows a comparison of the predicted thinning of the cup wall with experimental measurements at 200 and 250 °C at a draw ratio (DR) of 2.3 [28,29]. The patterns of thinning distribution match with the experimental data. The maximum thinning increases with increases in temperature. Compared with the measurement, the predicted maximum thinning is 3~5% lower while the maximum thickening at the flange is about 8~11% lower in both cases. One possible reason for the difference is our assumption of the constant coefficient of friction at each temperature investigated.
4.3.4. Fracture and Limiting Draw Ratio (LDR)
The constructed Z-FLS in Figure 5 was used to predict fracture and its location on the numerically formed cup. The maximum blank diameter (Do) that can be drawn in the die without fracture was used to calculate the LDR, which is a ratio of Do and punch diameter Dp. The fracture of numerically formed cups was identified by plotting the data points (ε1, ε2, ) of concerned elements against the Z-FLS, see Figure 11. The data points of three elements representing maximum thinning ‘ET’, maximum major strain ‘EM’, and no risk of fracture ‘ES’ are plotted at the initiation of fracture, see Table 6. In all cases, the elements with the maximum major strain and maximum thinning fracture at the same depth of draw. At 250 °C, the thinnest element also develops the highest major strain. The fracture location shifts from location close to punch corner at 150 °C to the upper portion of cup wall at 200, 250, and 300 °C, which conforms to the observation in [29]. This can be explained by increased strength difference between sheet material at the die curvature area and that at the punch radius area, which is strengthened by the cold punch. The identified depths of cup at the initiation of fracture are close to the observations in the experiment [29]. For example, at 300 °C and DR = 2.3, the calculated depth is 33 mm while 32 mm is the measured depth, and at 250 °C and DR = 2.4, the calculated depth is 28.5 mm while 30 mm is the depth reported in the experiment.
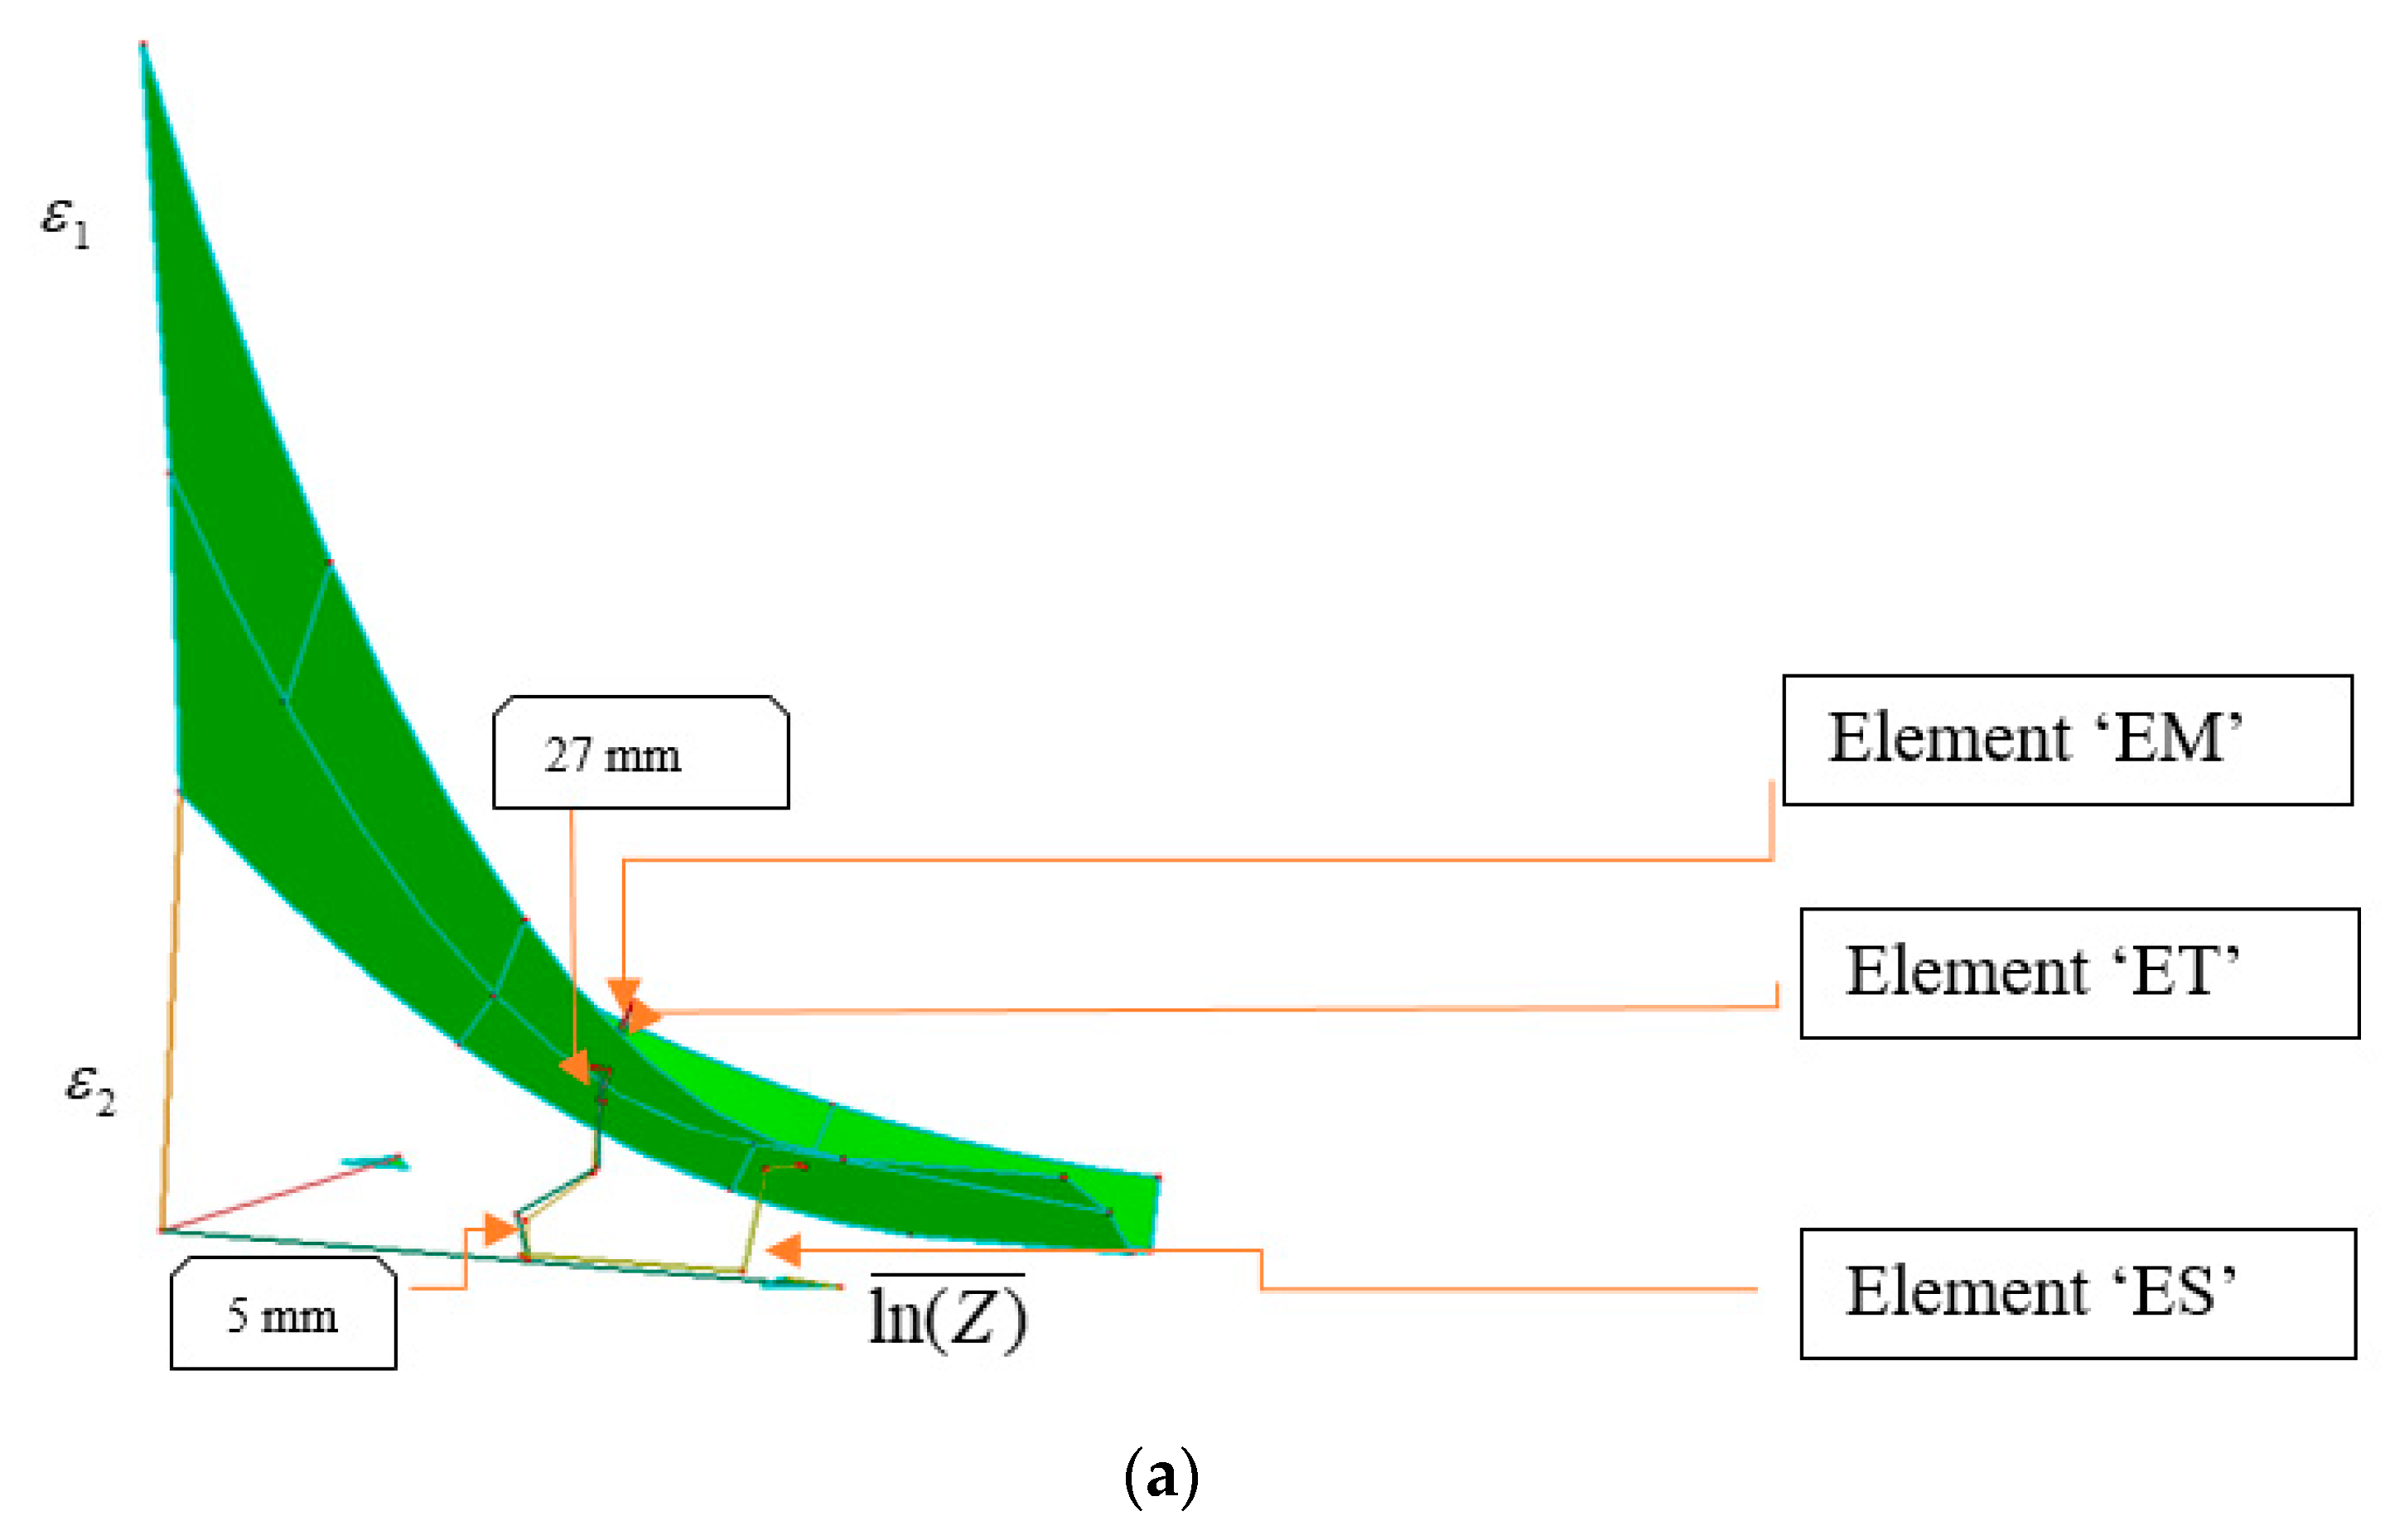
The evolution of the risk of fracture can be observed by plotting historical traces of the critical elements under the Z-FLS diagram. Figure 12a gives a plot of three critical elements in the case of temperature 200 °C. Element ‘ET’ and element ‘EM’ are at about same radial distance from the center of blank and thus are in contact with die and blank holder during most of the punch stroke. Because of this, their temperature remains approximately at 200 °C as shown in Figure 12b. As a result, their major strain traces are close to each other, which reaches the limit strain on the Z-FLS at strain rates of 0.06 s−1 and 0.07 s−1, respectively, when the punch travel becomes equal to 27 mm as shown in Figure 12a. Element ‘ES’, on the other hand, makes an early contact with the cold punch, which brings its temperature down at a faster rate (Figure 12b). The decrease in temperature leads to a faster increase in which increases to about 2.03 at a punch travel of 27 mm, see Figure 12d. However, a decrease in temperature also strengthens the local material and major strain has a slower growth ( s−1) thereafter, as shown in Figure 12c. The slowly increasing major strain helps to keep the element ‘ES’ safe under the Z-FLS.
Figure 13 shows that the predicted LDRs at different temperatures match well with those obtained in the experiment. One exception is at temperature of 200 °C, the prediction is higher by 0.03 (which is less than 0.15%) than the experimental value. The discrepancy is quite small.
5. Conclusions and Discussion
In this study, the concept of forming limit surface (Z-FLS), which utilizes ln(Z) to represent the combined effect of strain rate and temperature on forming limit strains, was revisited to develop a practical approach constructing Z-FLS. A Z-FLS was then constructed for AZ31 magnesium alloy sheet material. A non-isothermal cup drawing process of AZ31 sheet material was modeled using thermo-mechanically coupled finite element forming simulation. The constructed Z-FLS was used to identify failure by fracture on the numerically formed cups. Results show that the depths at fracture and limiting draw ratios match well with the experimental data.
Since both strain rate and temperature effects are represented by a single parameter Z, the Z-FLS may provide a concise and convenient way to take them into account in predicting formability in warm and hot forming. Its usefulness becomes evident in elevated temperature forming, which involves non-isothermal transient conditions, in which both temperature and strain rate change continuously with punch travel. As discussed, the use of available experimental data from various sources and several approximations made in this study may have introduced some uncertainties in the construction of Z-FLS in this paper, but the validity of Z-FLS has been demonstrated by using it to predict FLCs at different temperatures and LDRs in a non-isothermal cup draw and correlating the results closely with experimental data. In practice, Z-FLS will be constructed using the forming limit data at a few carefully selected temperatures and a wide range of strain rates. The Z-FLS can then be used for representing continuously distributed temperature/strain rate field in warm forming condition.
A number of assumptions were made in this study to reduce the analytical complexity of the thermo-mechanical phenomenon that occurs during the warm forming process. Although good correlations were obtained with the experimental data, some of these assumptions, such as microstructural differences in the AZ31 alloys used in experimental data used and variation of thermo-physical properties of the blank and tool materials with temperature, may have introduced uncertainties in the results. Planned experiments need to be done to further validate the Z-FLS diagrams so that they can be utilized in applications with less uncertainties.
Acknowledgments
The FEM simulation and damage calculation were conducted by using LS-DYNA Explicit solver and LS-PrePost 4.3. The efforts of all developers are appreciated. The work is part of the PhD study of the first author [37], which has been approved for publication by General Motors Company. The authors appreciate the approval.
Author Contributions
Z. Q. Sheng: original developer of Z-FLS concept, constructing the Z-FLS, modeling and analysis the warm forming process; wrote major content of this paper; P. K. Mallick: critically reviewed the paper, contributed to the writing and provided several important literature.
Conflicts of Interest
The authors declare no conflict of interest.
Nomenclature
| the baseline flow stress | |
| flow stress | |
| major strain rate | |
| C and P | material parameters at different temperatures in the Cowper and Symonds equation |
| Z | Zener–Hollomon parameter |
| Q | activation energy |
| R | universal gas constant |
| T | absolute temperature |
| , | major and minor strains on the deformed element in the FEM simulation |
| difference of the major limit strain on the FLS and the major strain of the concerned element during the forming operation | |
| effective strain at fracture in tensile test | |
| major limit strain on the FLC |
References
- Sheng, Z.Q. A Temperature and Time Dependent Forming Limit Surface for Sheet Metal Forming at Elevated Temperatures. SAE Int. J. Mater. Manuf. 2012, 5, 277–284. [Google Scholar] [CrossRef]
- Mallick, P.K. Materials, Design and Manufacturing for Lightweight Vehicles; Woodhead Publishing: Cambridge, UK, 2010. [Google Scholar]
- Agnew, S.R.; Özgür, D. Plastic anisotropy and the role of non-basal slip in magnesium alloy AZ31B. Int. J. Plast. 2005, 21, 1161–1193. [Google Scholar] [CrossRef]
- Neugebauer, R.; Altan, T.; Geiger, M.; Kleiner, M.; Sterzing, A. Sheet metal forming at elevated temperatures. CIRP Ann. Manuf. Technol. 2006, 55, 793–816. [Google Scholar] [CrossRef]
- Chen, F.K.; Huang, T.B. Formability of stamping magnesium-alloy AZ31 sheets. J. Mater. Process. Technol. 2003, 142, 643–647. [Google Scholar] [CrossRef]
- Doege, E.; Dröder, K. Sheet metal forming of magnesium wrought alloys—Formability and process technology. J. Mater. Process. Technol. 2001, 115, 14–19. [Google Scholar] [CrossRef]
- Zhang, K.F.; Yin, D.L.; Wu, D.Z. Formability of AZ31 magnesium alloy sheets at warm working conditions. Int. J. Mach. Tools Manuf. 2006, 46, 1276–1280. [Google Scholar] [CrossRef]
- Yoshihara, S.; Nishimura, H.; Yamamoto, H.; Manabe, K.I. Formability enhancement in magnesium alloy stamping using a local heating and cooling technique: Circular cup deep drawing process. J. Mater. Process. Technol. 2003, 142, 609–613. [Google Scholar] [CrossRef]
- Chen, F.K.; Huang, T.B.; Chang, C.K. Deep drawing of square cups with magnesium alloy AZ31 sheets. Int. J. Mach. Tools Manuf. 2003, 43, 1553–1559. [Google Scholar] [CrossRef]
- Carter, J.T.; Melo, A.R.; Savic, V.; Hector, L.G.; Krajewski, P.E. Structural Evaluation of an Experimental Aluminum/Magnesium Decklid. SAE Int. J. Mater. Manuf. 2011, 4, 166–174. [Google Scholar] [CrossRef]
- Zhao, P.J.; Chen, Z.H.; Dong, C.F. Damage and failure analysis of AZ31 alloy sheet in warm stamping processes. J. Mater. Eng. Perform. 2016, 25, 1–9. [Google Scholar] [CrossRef]
- Sheng, Z.Q.; Shivpuri, R. A hybrid process for forming thin-walled magnesium parts. Mater. Sci. Eng. A 2006, 428, 180–187. [Google Scholar] [CrossRef]
- Banabic, D. Sheet Metal Forming Processes: Constitutive Modelling and Numerical Simulation; Springer Science & Business Media: Berlin, Germany, 2010. [Google Scholar]
- Stoughton, T. A general forming limit criterion for sheet metal forming. Int. J. Mech. Sci. 2000, 42, 1–27. [Google Scholar] [CrossRef]
- Bruschi, S.T.; Altan, T.; Banabic, D.; Bariani, P.F.; Brosius, A.; Cao, J.; Ghiotti, A.; Khraisheh, M.; Merklein, M.; Tekkaya, A.E. Testing and modelling of material behaviour and formability in sheet metal forming. CIRP Ann. Manuf. Technol. 2014, 63, 727–749. [Google Scholar] [CrossRef]
- Lee, Y.S.; Kim, M.C.; Kim, S.W.; Kwon, Y.N.; Choi, S.W.; Lee, J.H. Experimental and analytical studies for forming limit of AZ31 alloy on warm sheet metal forming. J. Mater. Process. Technol. 2007, 187, 103–107. [Google Scholar] [CrossRef]
- Bruni, C.; Forcellese, A.; Gabrielli, F.; Simoncini, M. Effect of temperature, strain rate and fibre orientation on the plastic flow behaviour and formability of AZ31 magnesium alloy. J. Mater. Process. Technol. 2010, 210, 1354–1363. [Google Scholar] [CrossRef]
- Abu-Farha, F.; Verma, R.; Hector, L.G. Hot formability curves for four AZ31B magnesium alloy sheets obtained by the pneumatic stretching test. Magn. Technol. 2012, 289–294. [Google Scholar] [CrossRef]
- Hsu, E.; Carsley, J.; Verma, R. Development of forming limit diagrams of aluminum and magnesium sheet alloys at elevated temperatures. J. Mater. Eng. Perform. 2008, 17, 288–296. [Google Scholar] [CrossRef]
- Abu-Farha, F. The development of a forming limit surface for 5083 aluminum alloy sheet. JOM 2011, 63, 72–78. [Google Scholar] [CrossRef]
- Kröhn, M.A.; Leen, S.B.; Hyde, T.H. A superplastic forming limit diagram concept for Ti-6Al-4V. Proc. Inst. Mech. Eng. J. Mater. Des. Appl. Part L 2007, 221, 251–264. [Google Scholar] [CrossRef]
- Zener, C.; Hollomon, J.H. Effect of strain rate upon plastic flow of steel. J. Appl. Phys. 1944, 15, 22–32. [Google Scholar] [CrossRef]
- Naka, T.; Gaku, T.; Hino, R.; Yoshida, F. The effects of temperature and forming speed on the forming limit diagram for type 5083 aluminum–magnesium alloy sheet. J. Mater. Process. Technol. 2001, 113, 648–653. [Google Scholar] [CrossRef]
- Alexandrov, S.; Wang, P.T.; Roadman, R.E. A fracture criterion of aluminum alloys in hot metal forming. J. Mater. Process. Technol. 2005, 160, 257–265. [Google Scholar] [CrossRef]
- Kim, H.K.; Kim, W.J. Failure prediction of magnesium alloy sheets deforming at warm temperatures using the Zener–Hollomon parameter. Mech. Mater. 2010, 42, 293–303. [Google Scholar] [CrossRef]
- Albakri, M.; Abu-Farha, F.; Khraisheh, M. A new combined experimental-numerical approach to evaluate formability of rate dependent materials. Int. J. Mech. Sci. 2013, 66, 55–66. [Google Scholar] [CrossRef]
- Antoniswamy, A.R.; Carpenter, A.J.; Carter, J.T.; Hector, J.; Taleff, E.M. Forming-limit diagrams for magnesium AZ31B and ZEK100 alloy sheets at elevated temperatures. J. Mater. Eng. Perform. 2013, 22, 3389–3397. [Google Scholar] [CrossRef]
- Dröder, K. Analysis on Forming of Thin Magnesium Sheets. Ph.D. Thesis, Institute of Forming Technology and Forming Machines (IFUM), University of Hannover, Hannover, Germany, 1999. (In German). [Google Scholar]
- Palaniswamy, H.; Gracious, N.; Altan, T. Finite element simulation of magnesium alloy sheet forming at elevated temperatures. J. Mater. Process. Technol. 2004, 146, 52–60. [Google Scholar] [CrossRef]
- Tari, D.G.; Worswick, M.J. Elevated temperature constitutive behavior and simulation of warm forming of AZ31B. J. Mater. Process. Technol. 2015, 221, 40–55. [Google Scholar] [CrossRef]
- Sheng, Z.Q.; Shivpuri, R. Modeling Flow Stress of Magnesium Alloys at Elevated Temperature. Mater. Sci. Eng. A 2006, 419, 202–208. [Google Scholar] [CrossRef]
- Sivapragash, M.; Lakshminarayanan, P.R.; Karthikeyan, R.; Hanumantha, M.; Bhatt, R.R. Hot deformation behavior of ZE41A magnesium alloy. Mater. Des. 2008, 29, 860–866. [Google Scholar] [CrossRef]
- Verma, R.; Hector, L.G.; Krajewski, P.E.; Taleff, E.M. The finite element simulation of high-temperature magnesium AZ31 sheet forming. JOM 2009, 61, 29–37. [Google Scholar] [CrossRef]
- Gontarz, A.; Dziubińska, A.; Okoń, L. Determination of friction coefficients at elevated temperatures for some Al, Mg and Ti alloys. Arch. Metall. Mater. 2011, 56, 379–384. [Google Scholar] [CrossRef]
- Lee, Y.; Kim, S.; Park, S.; Yoo, J.; Moon, Y. Friction effect of surface treated tools used for warm forming of Mg alloy sheets. Int. J. Precis. Eng. Manuf. 2014, 15, 2631–2637. [Google Scholar] [CrossRef]
- Kim, H.S.; Muammer, K.; Ni, J.; Ghosh, A. Finite element modeling and analysis of warm forming of aluminum alloys—Validation through comparisons with experiments and determination of a failure criterion. J. Manuf. Sci. Eng. 2006, 128, 613–621. [Google Scholar] [CrossRef]
- Sheng, Z. An Improved Zener-Hollomon Parameter and a New Ductile Failure Criterion for Modeling and Predicting Sheet Metal Forming Limit. Ph.D. Thesis, University of Michigan, Dearborn, MI, USA, 2017. [Google Scholar]
Figure 1.
SEM morphology of AZ31 sheet material at temperature 100 °C: (a) Before deformation; (b) at initiation of fracture. Reproduced with permission from [11].
Figure 1.
SEM morphology of AZ31 sheet material at temperature 100 °C: (a) Before deformation; (b) at initiation of fracture. Reproduced with permission from [11].

Figure 2.
Plots of major limit strains at strain paths of UT (Square solid dots), PS (Circular solid dots) and EBT (Triangular solid dots) as functions of ln(Z) and against data points from measurement at strain rates (10−4/s to 10−2/s) and temperatures (25 °C to 300 °C) in [23]. (a) Function of ; (b) Function of .

Figure 3.
Forming limit curves (FLCs) of AZ31B as reported in [5,9,18] and used for constructing Z-FLS shown in Figure 5. (a) FLCs at 100, 200, and 300 °C and strain rate ~0.008/s [5,9]; (b) FLCs at 400 °C and strain rate 0.005/s [18].
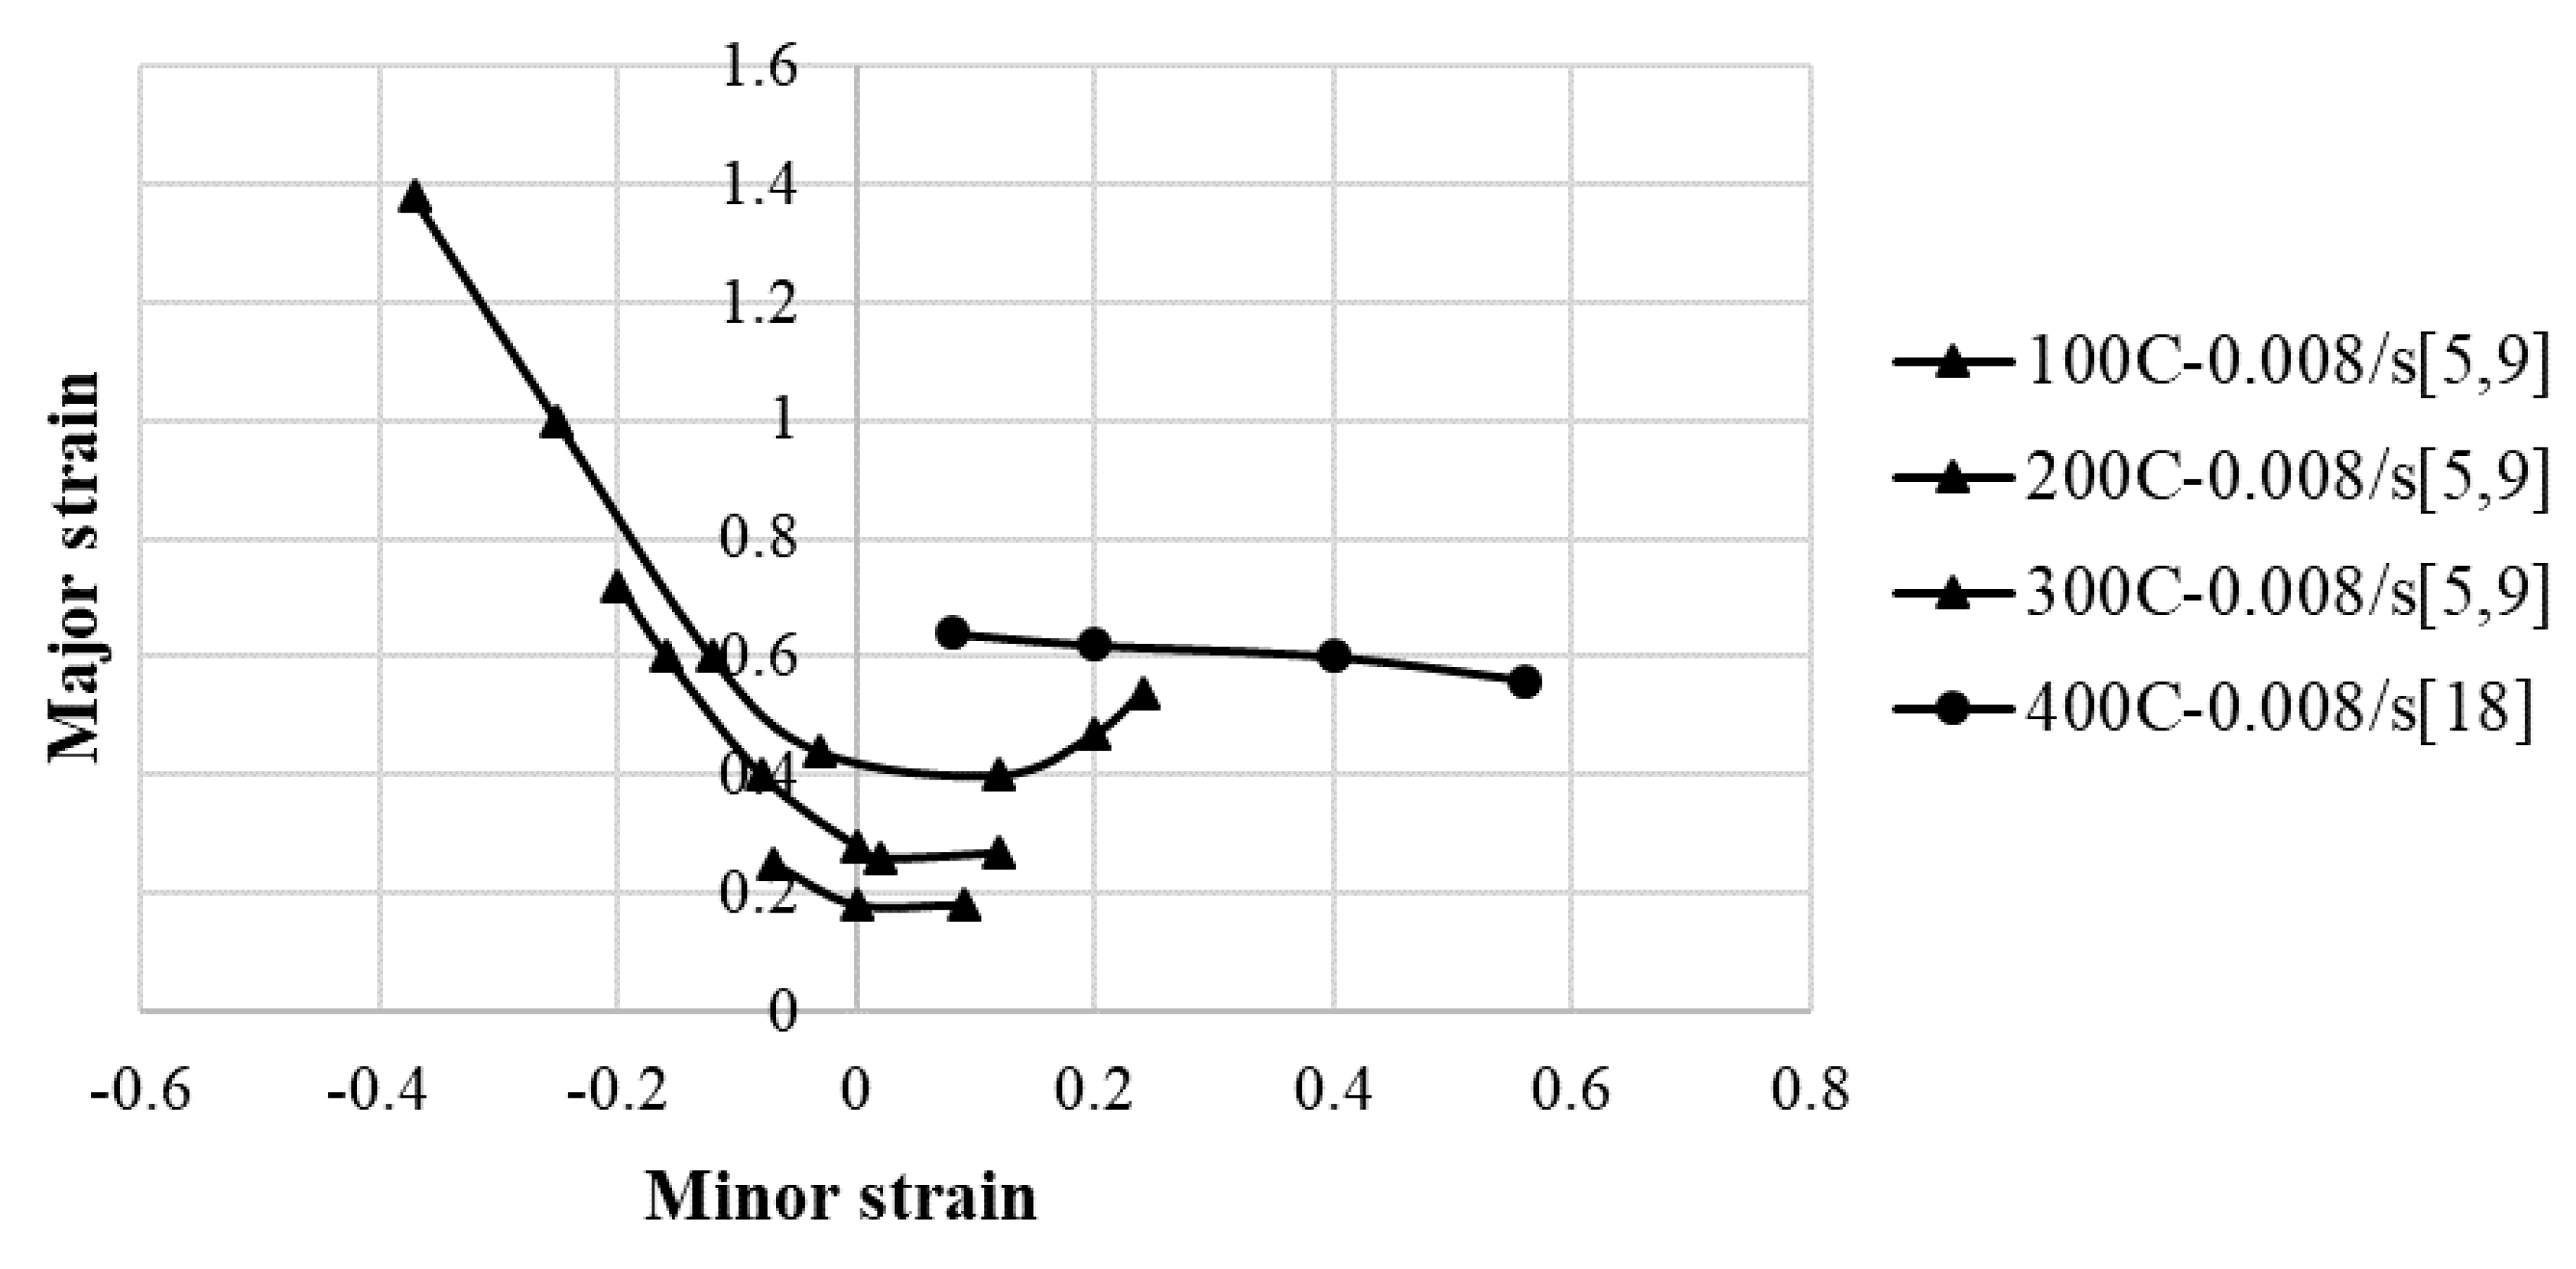
Figure 4.
Plots of material constants (A–C) at different strain ratios.
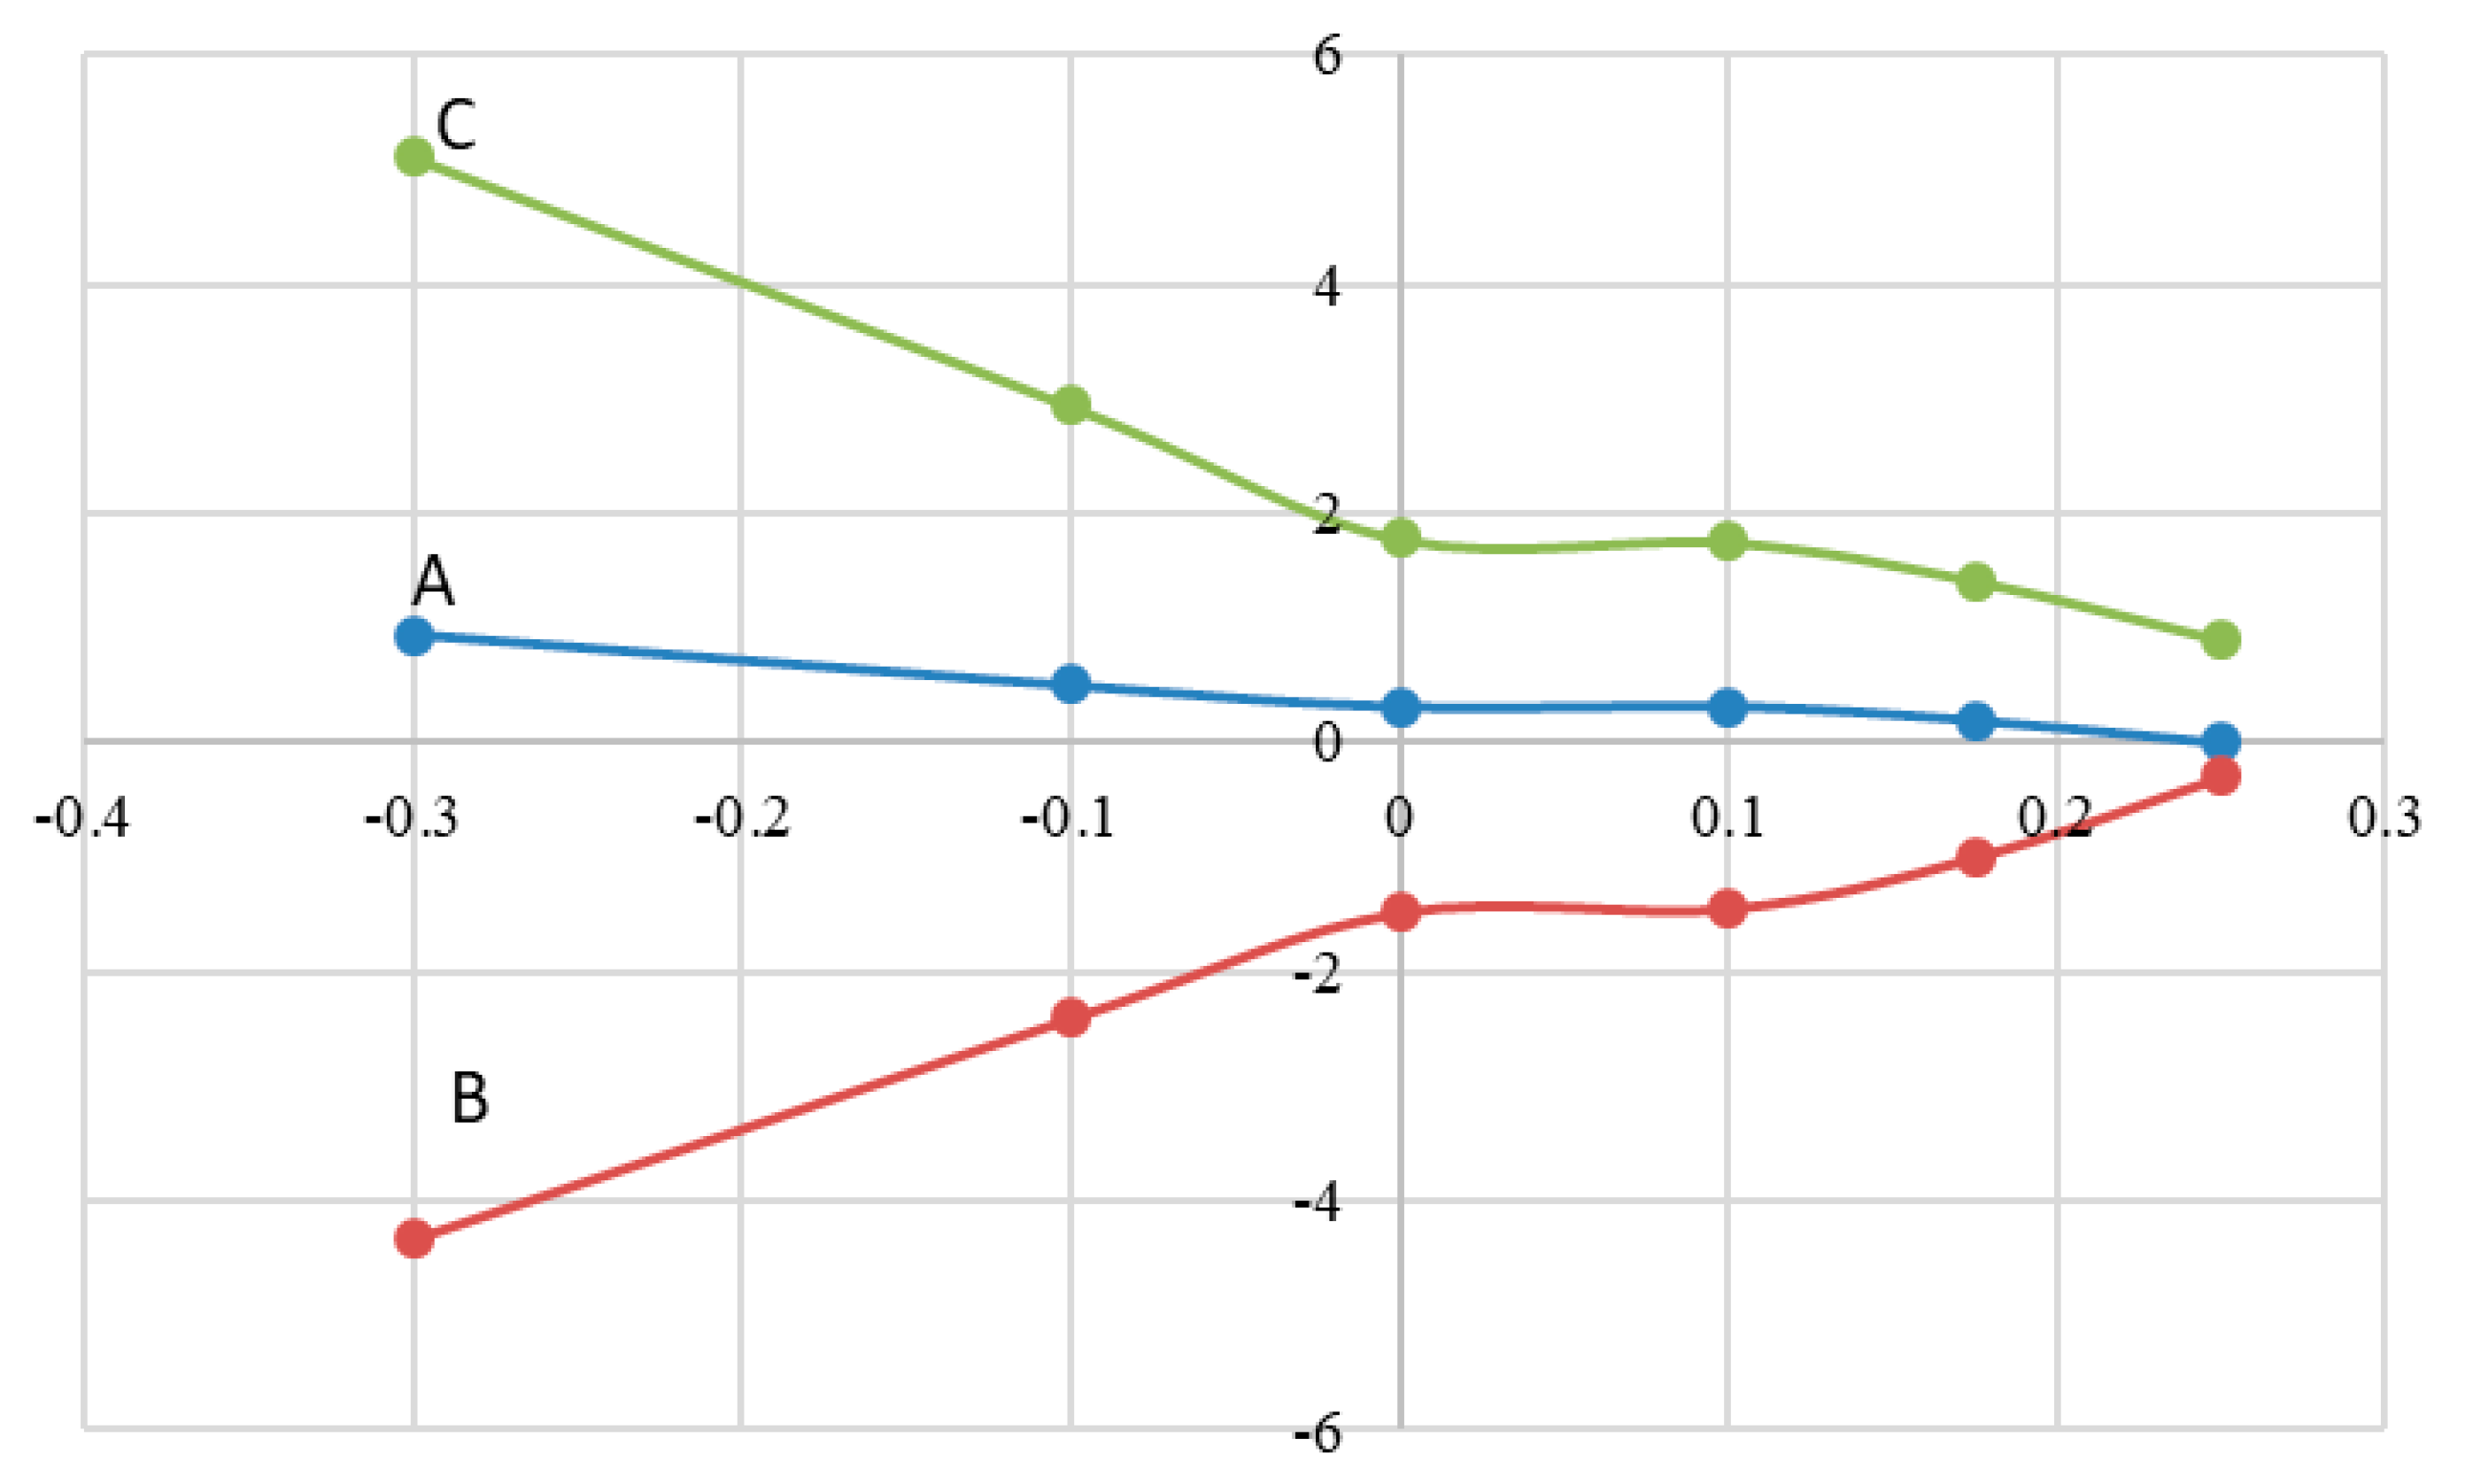
Figure 5.
Z-FLS for AZ31B magnesium alloy.

Figure 6.
FLCs constructed using the Z-FLS in Figure 5 and compared with data reported in [17,19]. (a) FLC at = 1.14 (300 °C and strain rate of 0.001/s): the solid line is from Z-FLS, while green stars are from [19] and circular solid dots are from [17]; (b) FLC at = 1.26 (300 °C and strain rate of 0.01/s): the solid line is from Z-FLS, while green stars are from [19] and the solid dots are from [17].
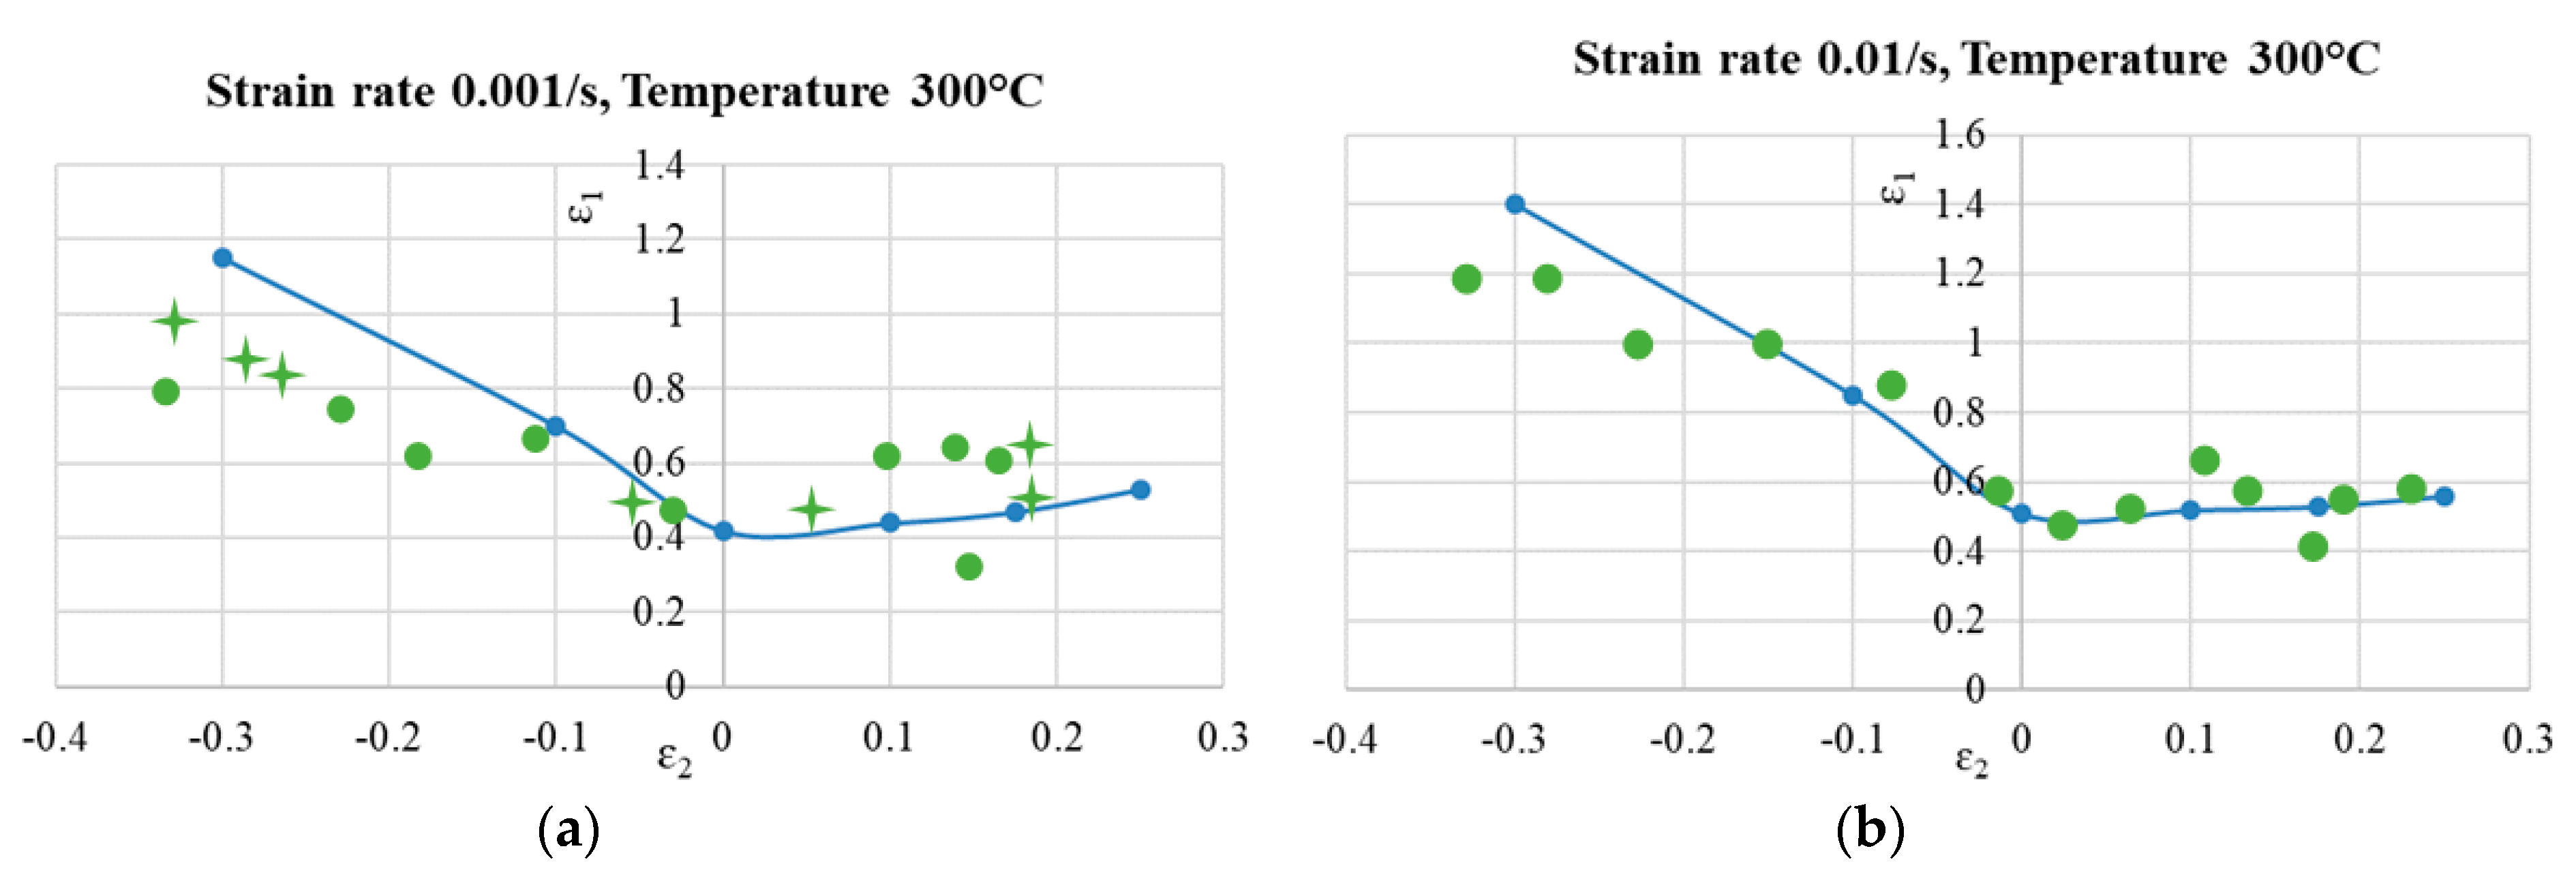
Figure 7.
Flow stress curves: (a) at temperatures from 25 to 235 °C and strain rate of 0.002 s−1; (b) at temperature 200 °C and strain rates from 0.002 to 2.0 s−1 of 1.3 mm thick AZ31B sheet material [28,29]; (c) calculated at strain rate of 0.01 s−1 using Equation (10); (d) calculated at strain rate of 0.1 s−1 using Equation (10).
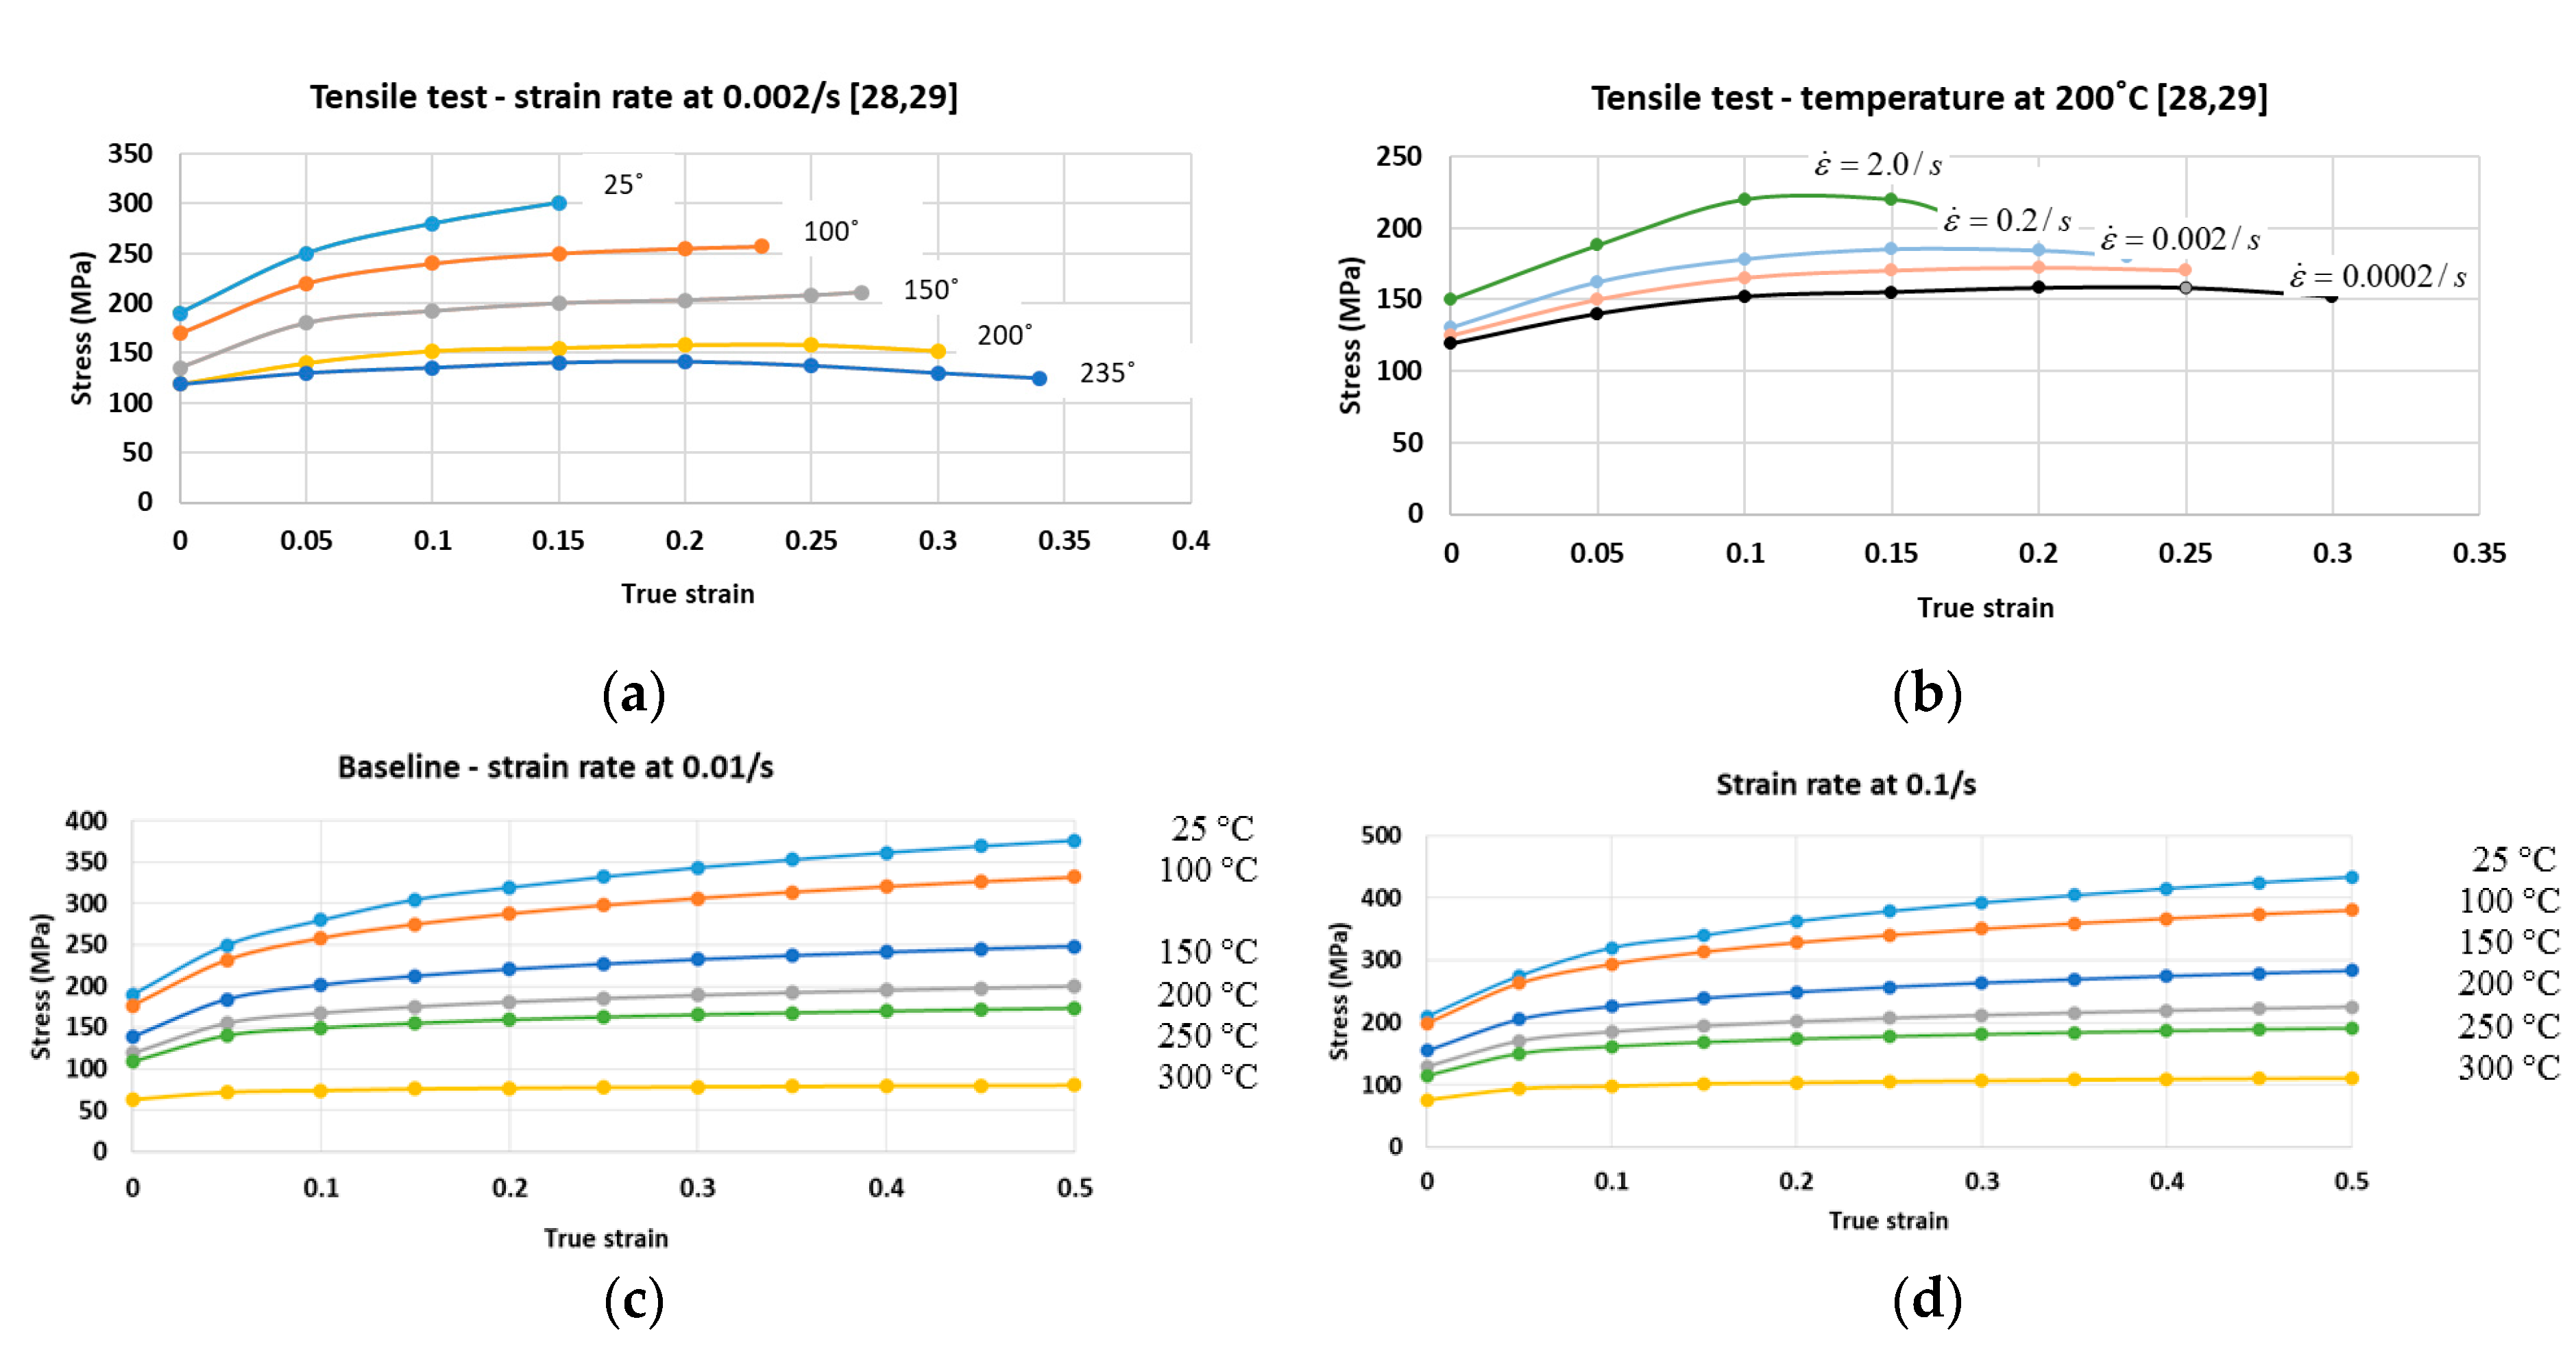
Figure 8.
Finite element model of round cup draw. (a) Tooling design and setup; (b) meshed blank.

Figure 9.
Predicted punch load curves at different temperatures for draw ratio of 2.3 compared with experimental data in [28,29].
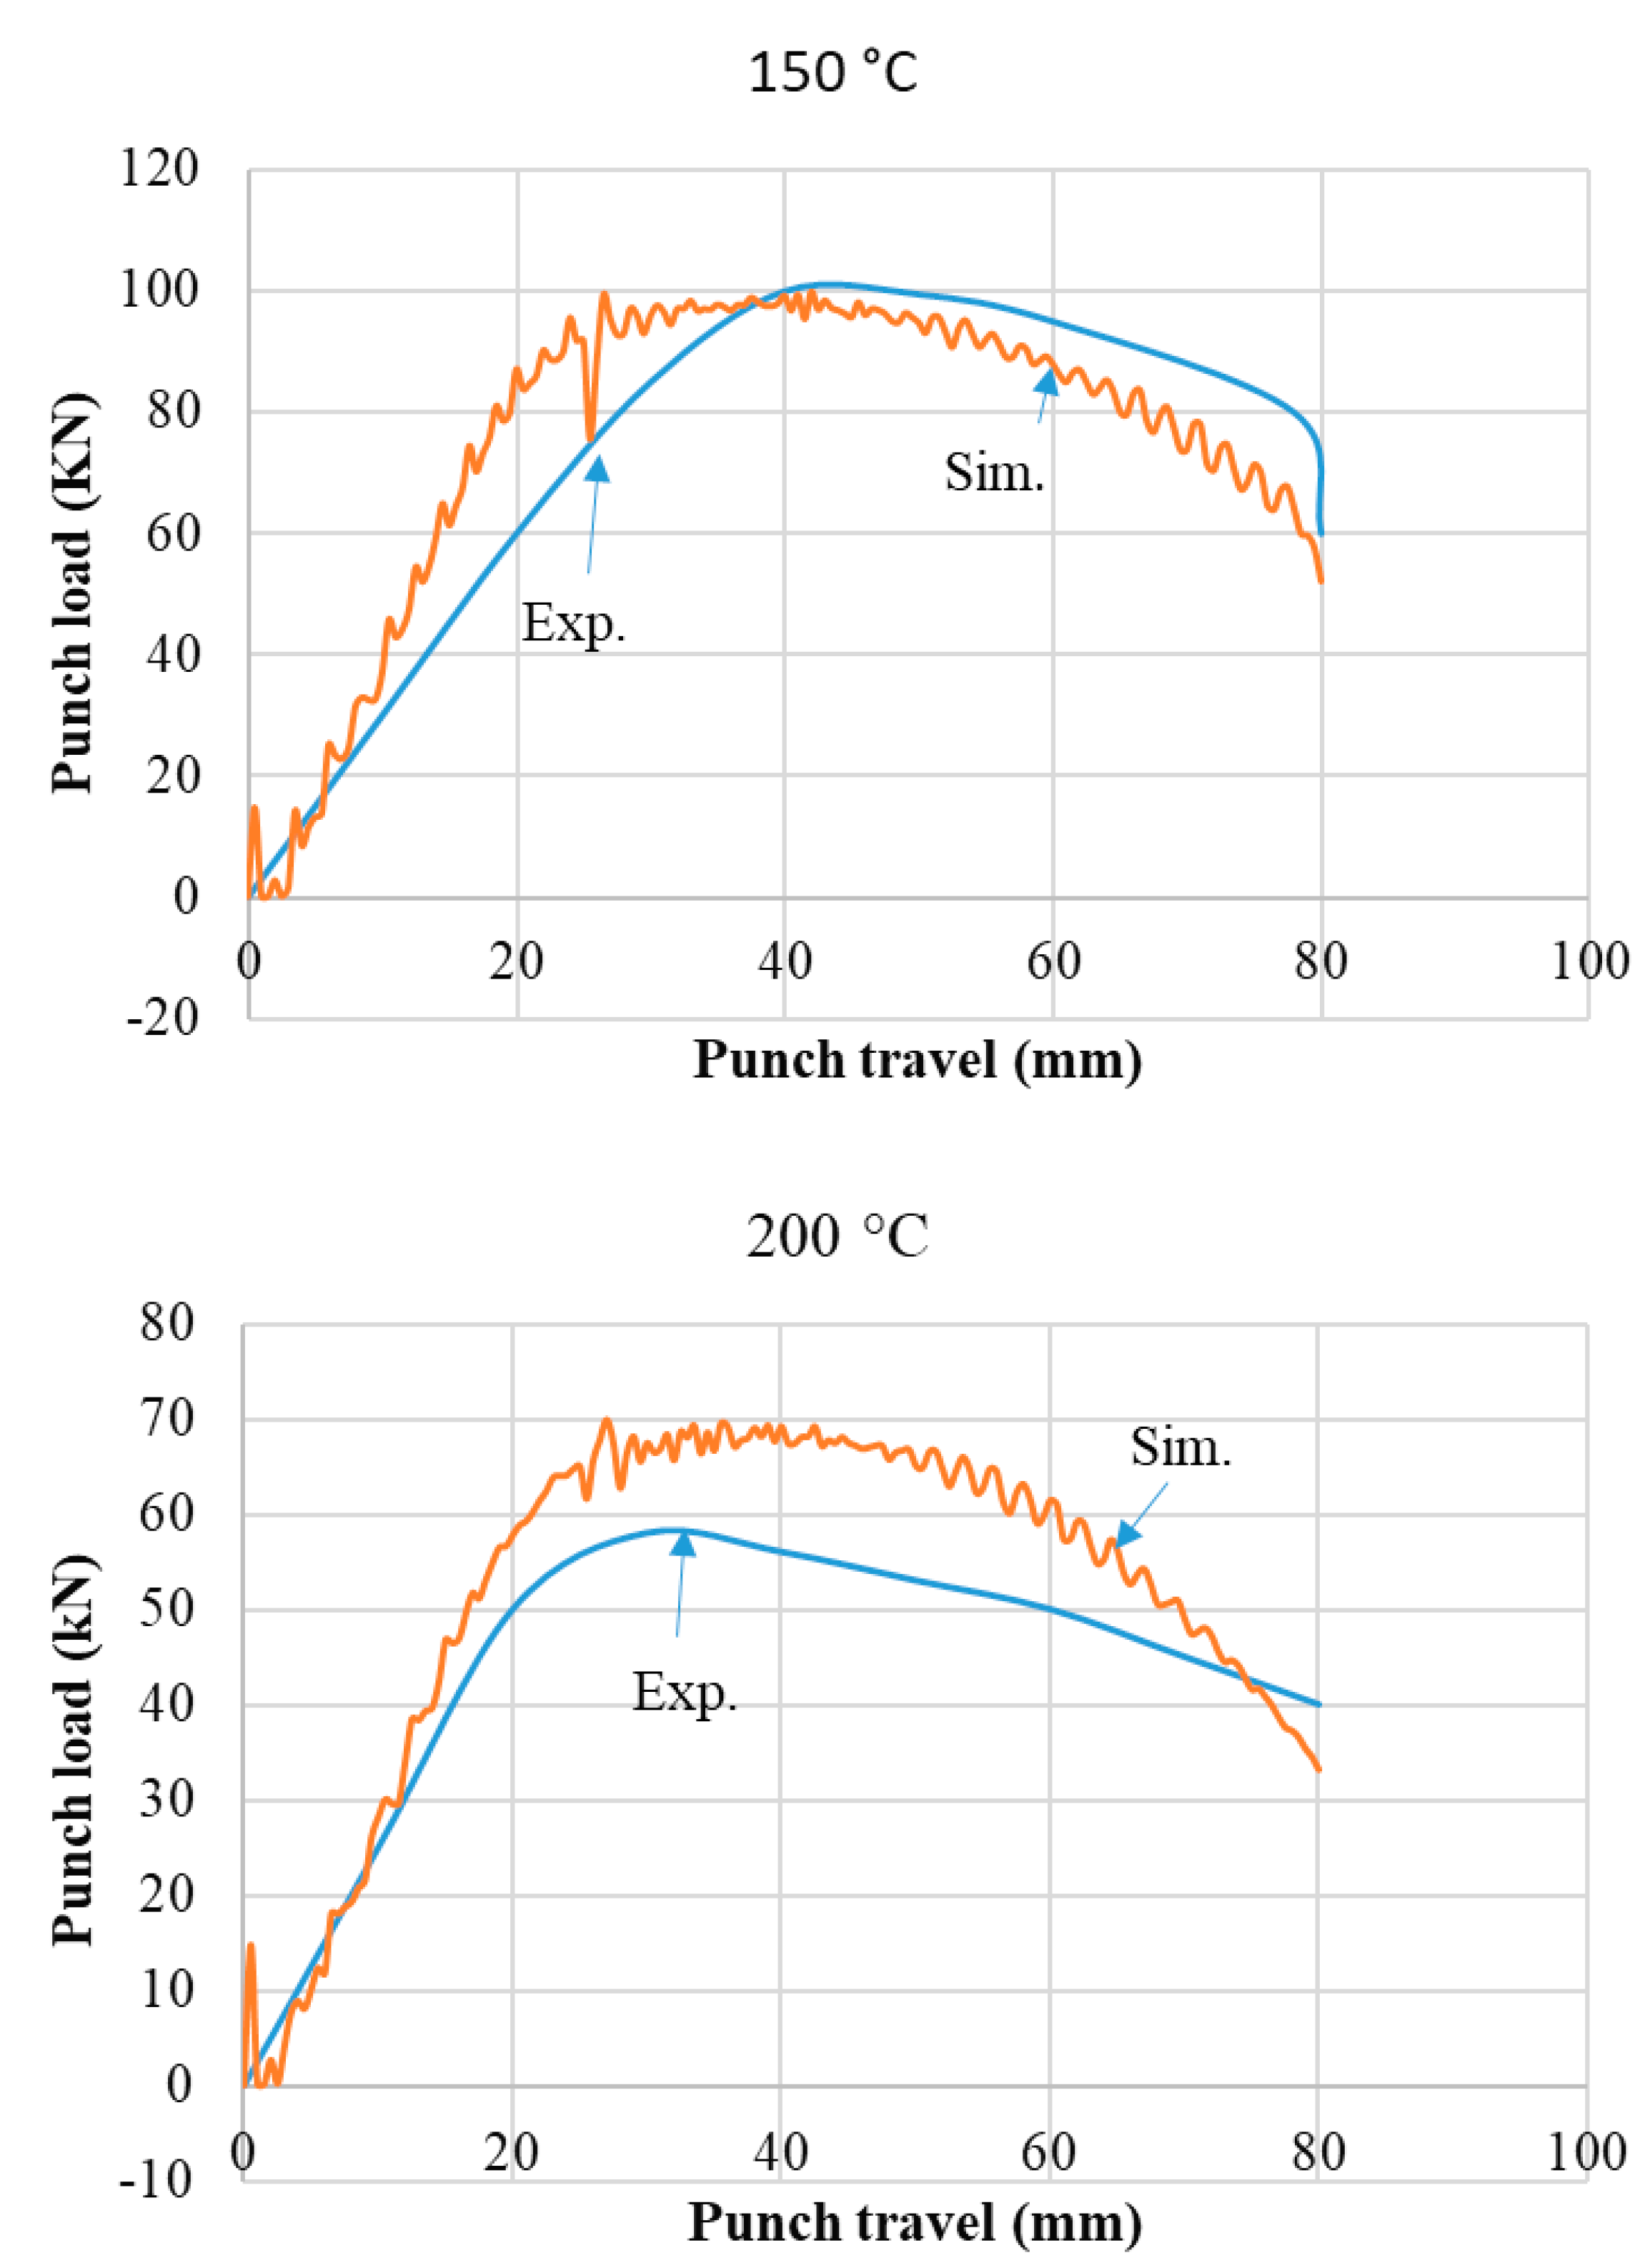
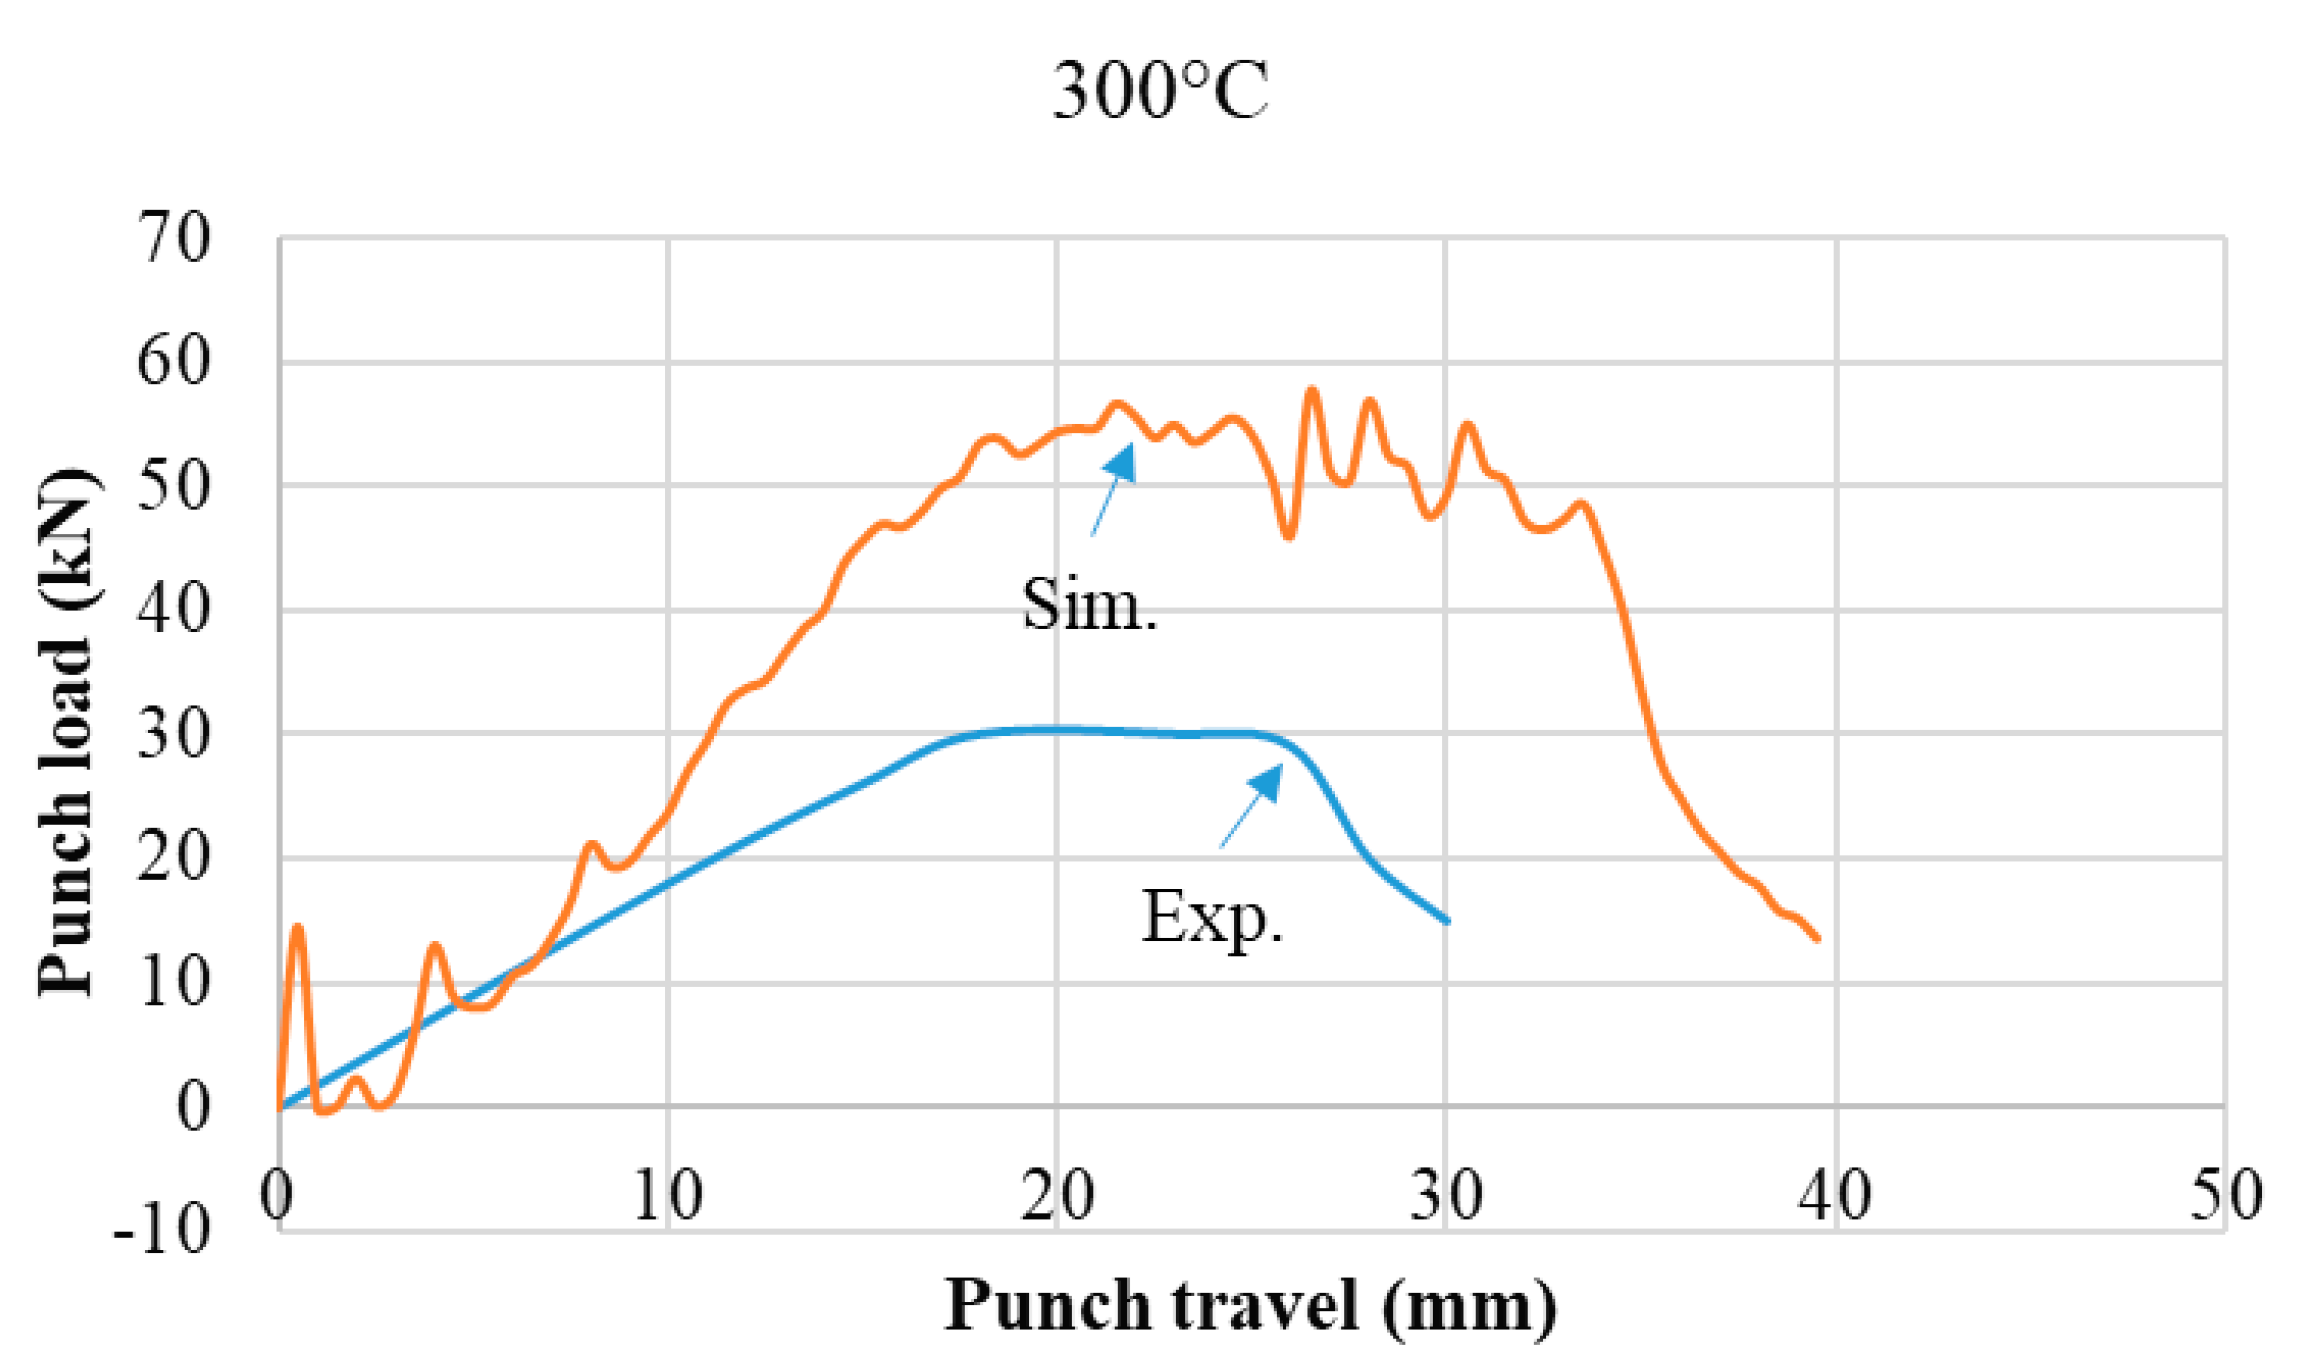
Figure 10.
Comparison of simulated values of thinning (% change in thickness) at a draw ratio of 2.3 with experimental data in [28,29]. (a) 200 °C; (b) 250 °C.
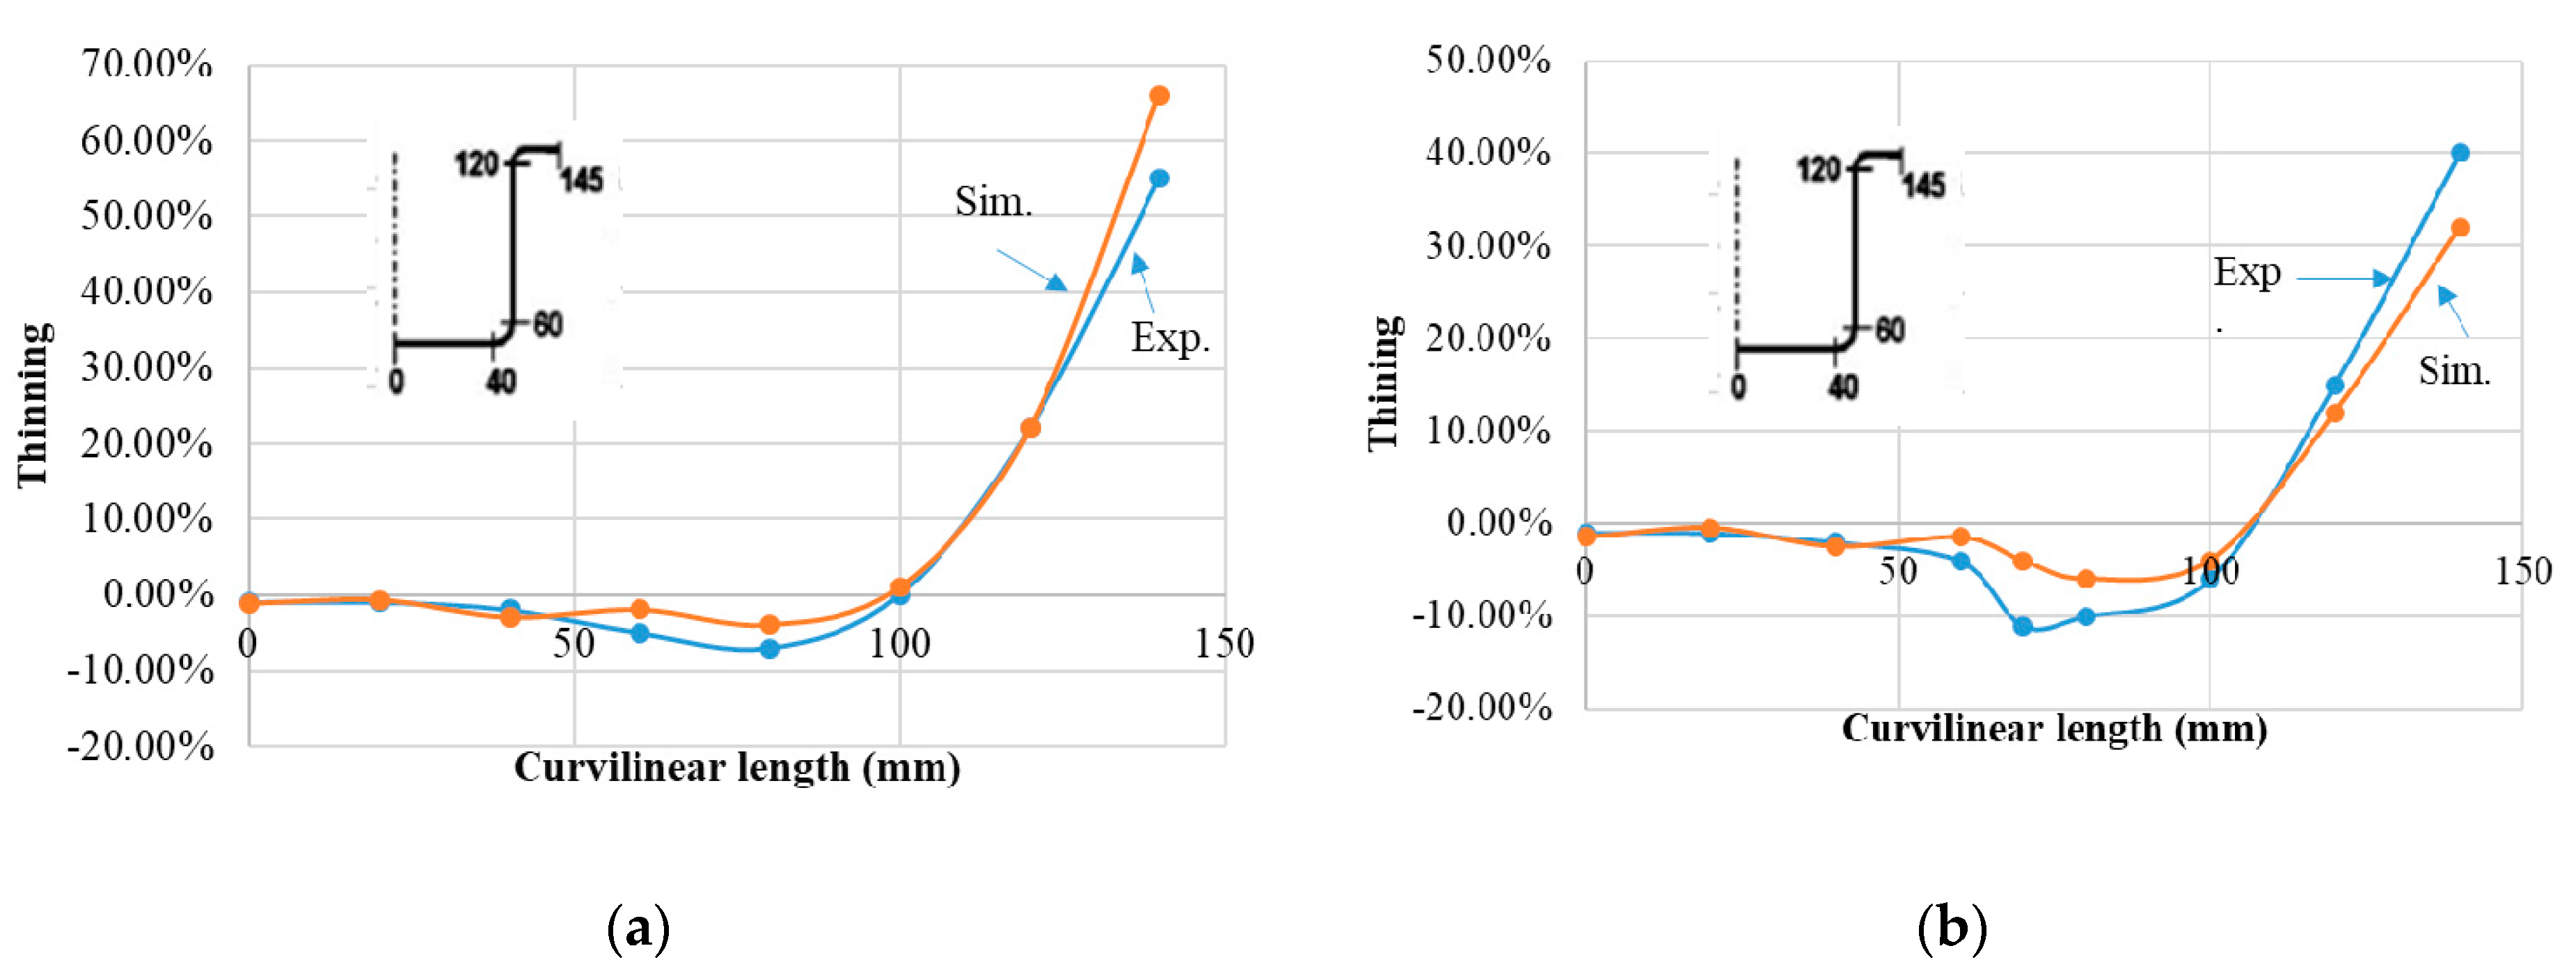
Figure 11.
Fracture identification in drawn cups with the aid of the Z-FLS in Figure 5. (a) Blank/blank holder/die temperature @ 150 °C, DR = 2.4, at 70 mm draw depth; (b) Blank/blank holder/die temperature @ 200 °C, DR = 2.575, at 27 mm draw depth; (c) Blank/blank holder/die temperature @ 250 °C, DR = 2.4, at 28.5 mm draw depth; (d) Blank/blank holder/die temperature @ 300 °C, DR = 2.3, at 33 mm draw depth.
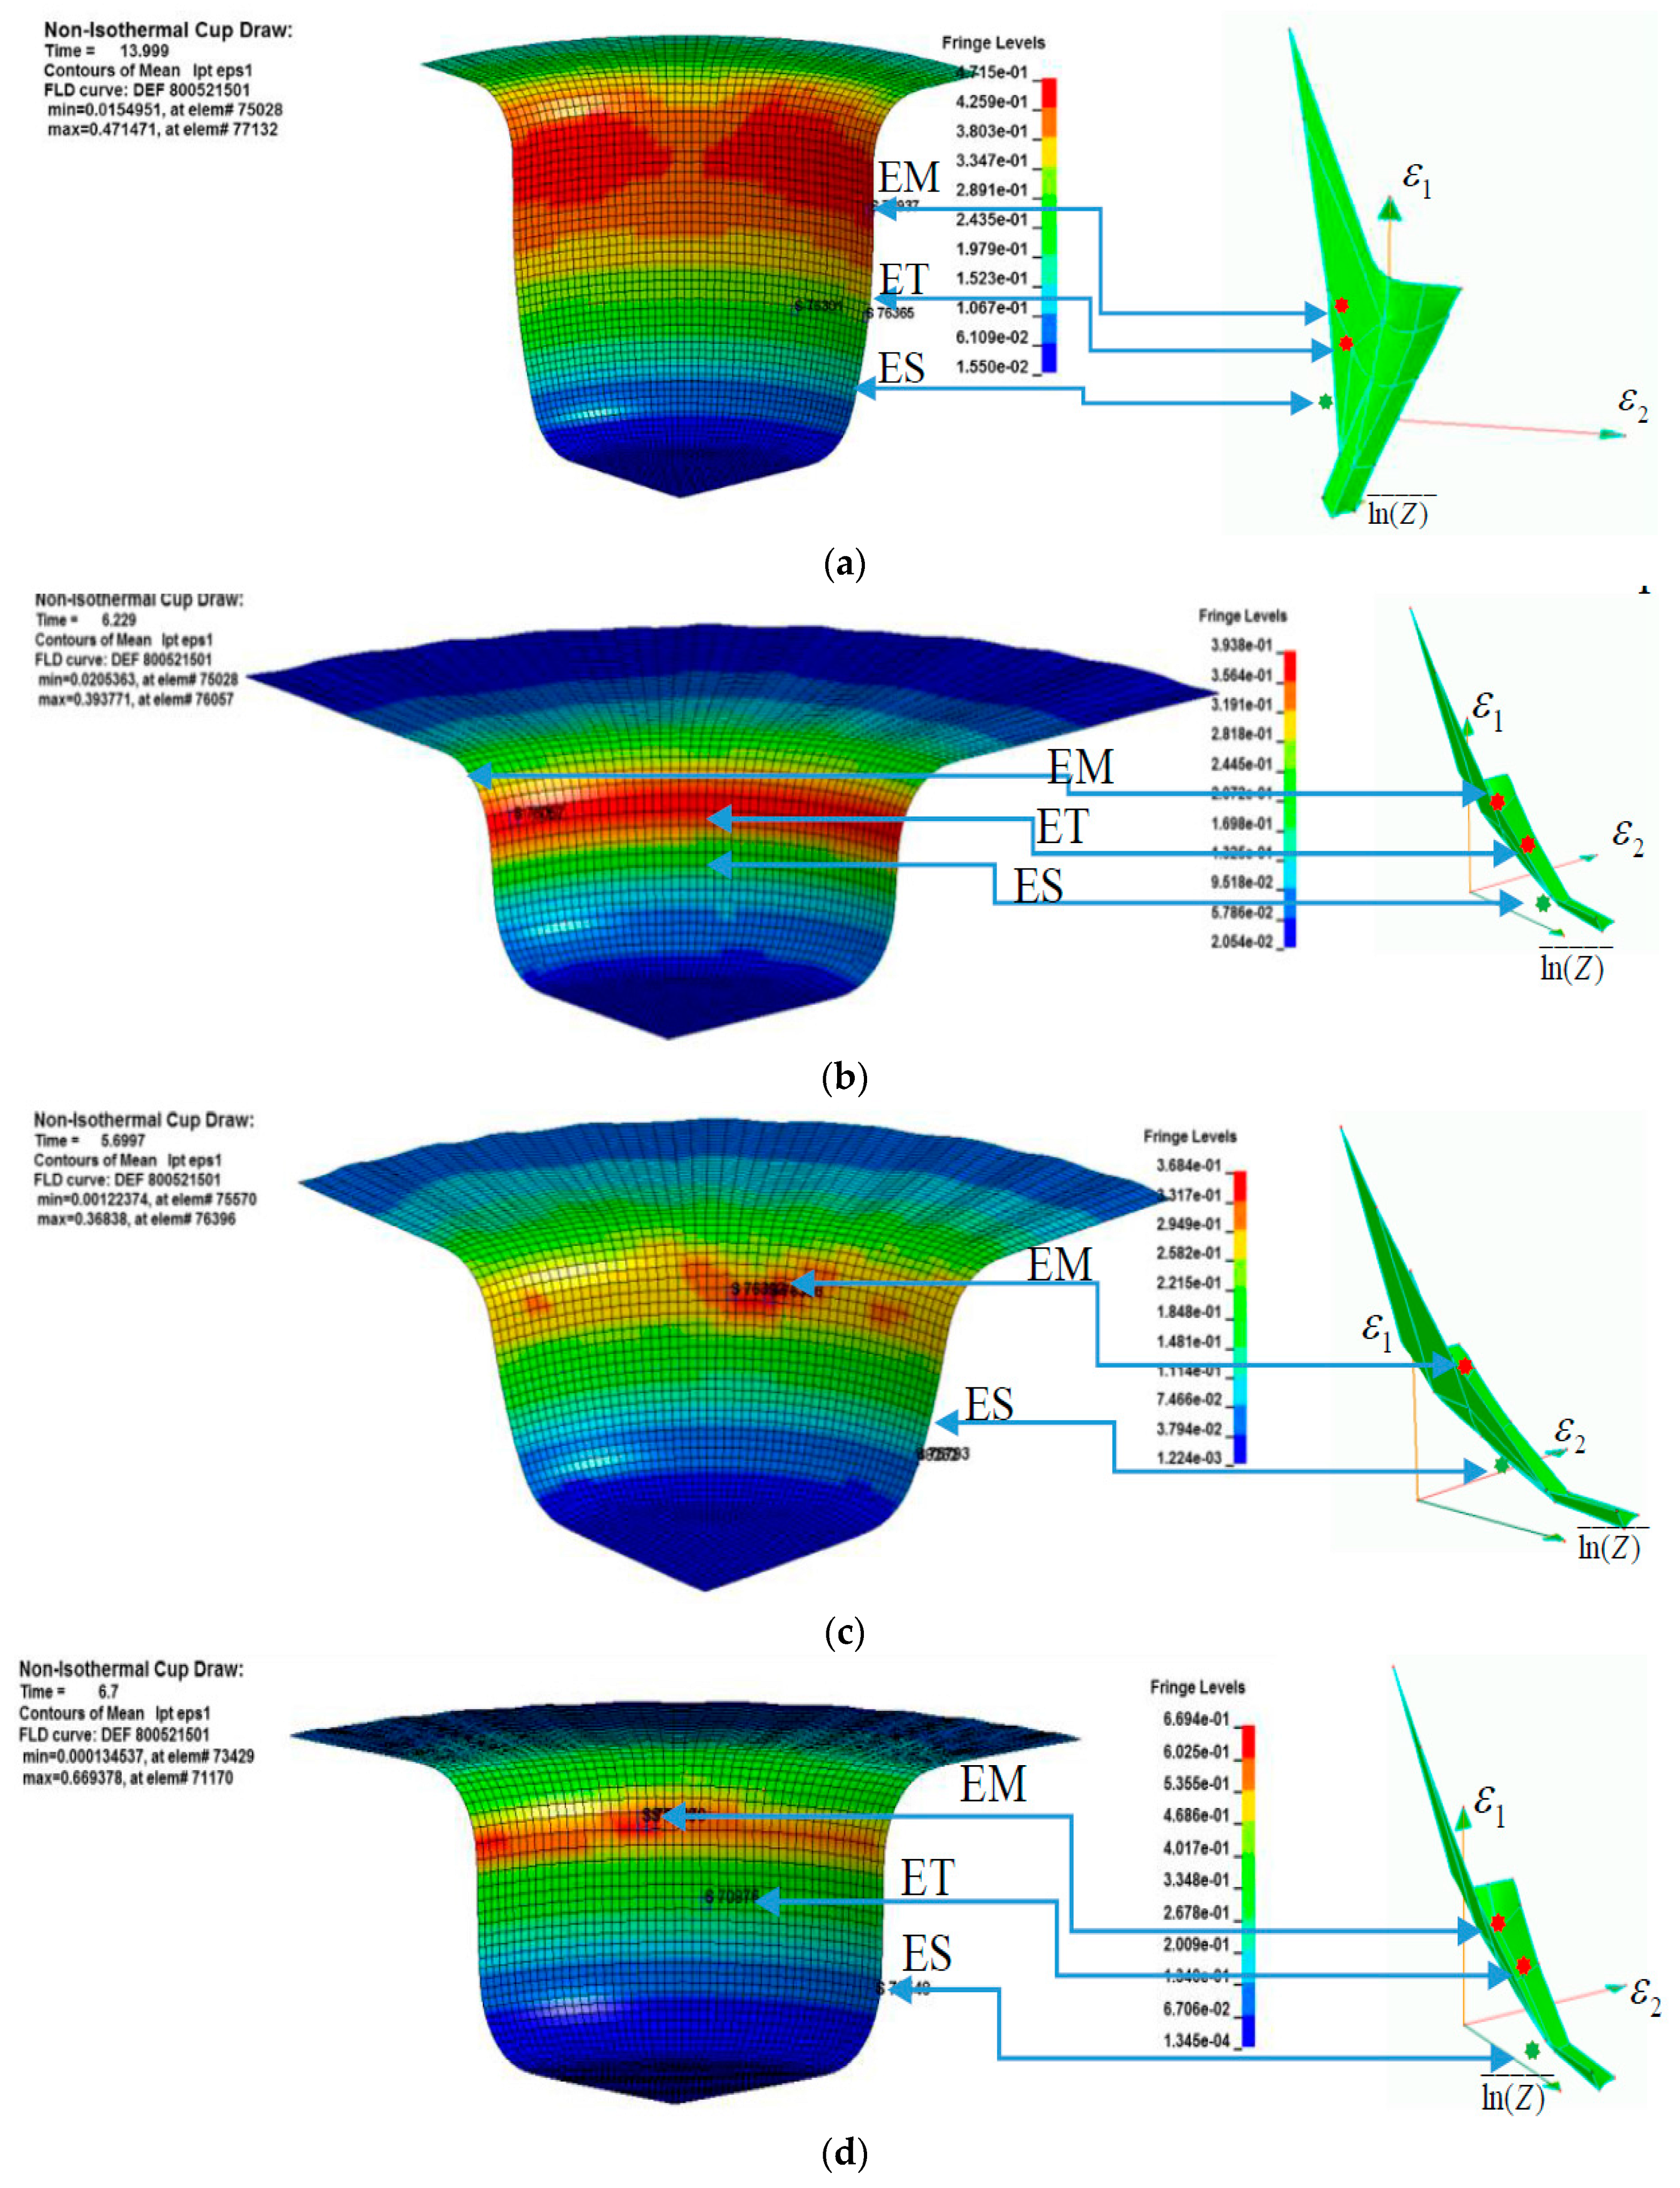
Figure 12.
Historical data of elements on the Z-FLS (200 °C, DR = 2.575). (a) Data evolution in Z-FLS; (b) Temperature (°C) evolution vs. punch travel (mm); (c) Major strain evolution vs. punch travel; (d) evolution vs. punch travel (mm).
Figure 12.
Historical data of elements on the Z-FLS (200 °C, DR = 2.575). (a) Data evolution in Z-FLS; (b) Temperature (°C) evolution vs. punch travel (mm); (c) Major strain evolution vs. punch travel; (d) evolution vs. punch travel (mm).

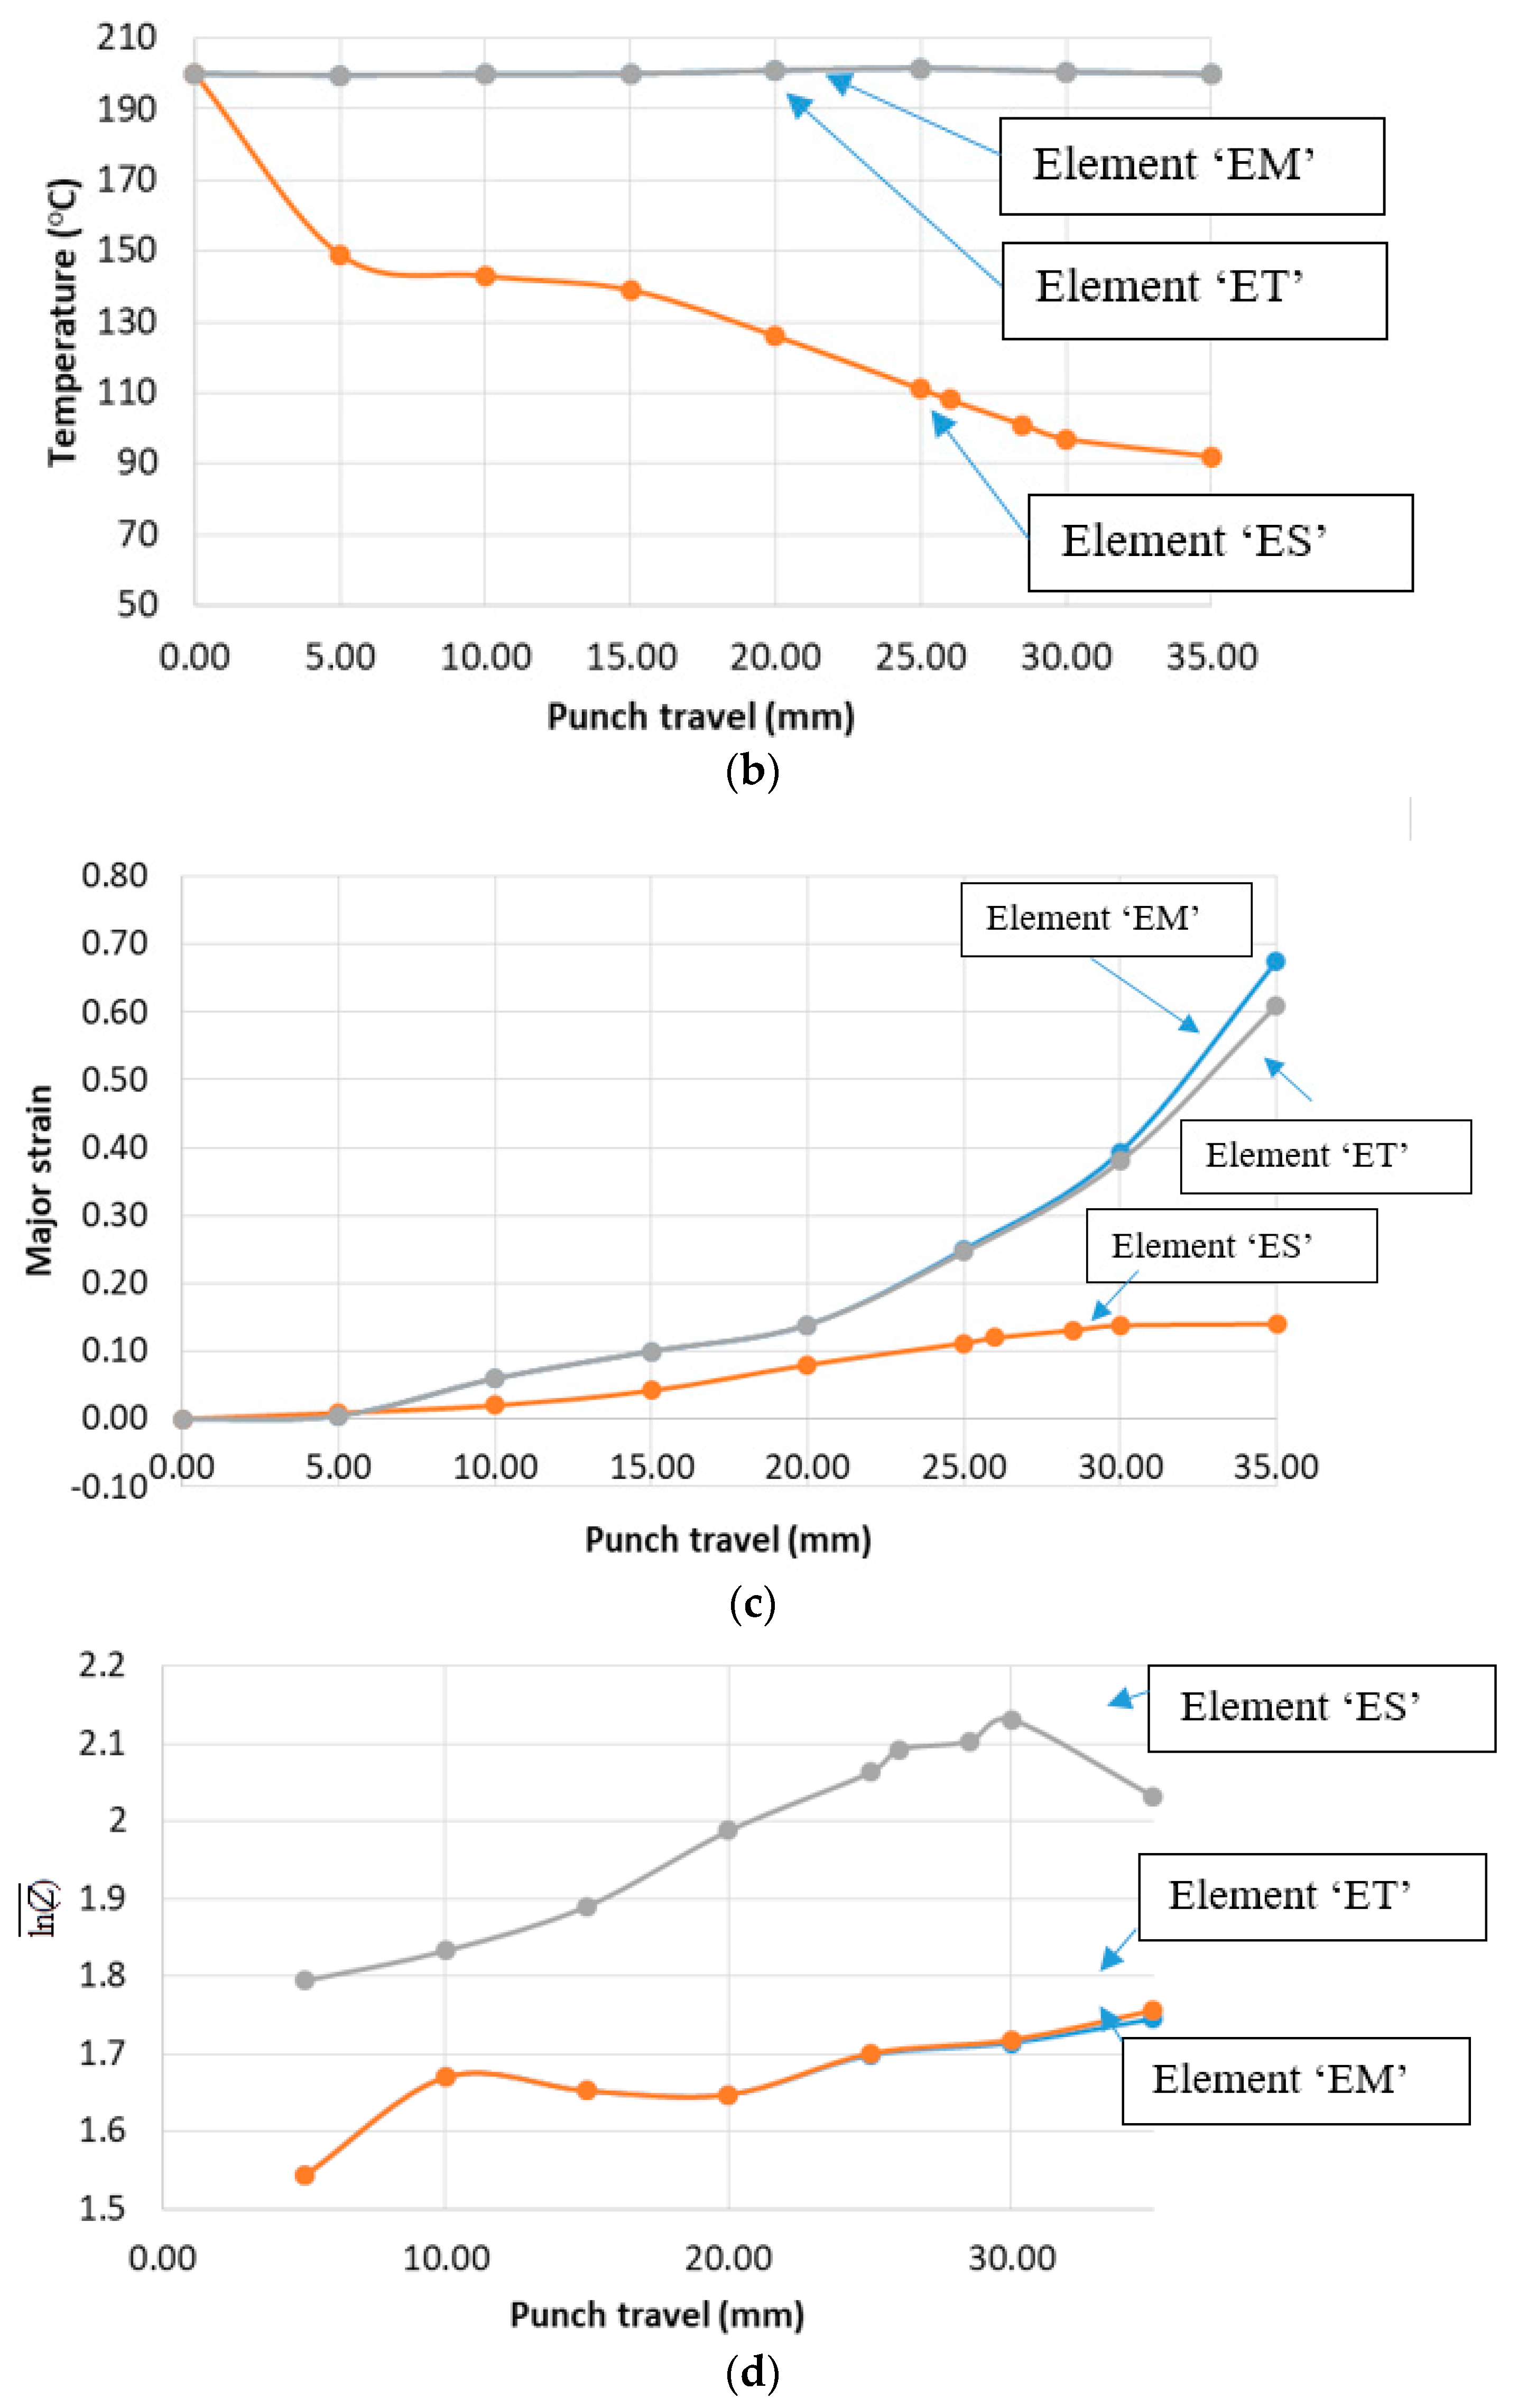
Figure 13.
LDRs at different warm forming temperatures (punch diameter = 100 mm and blank thickness 1.3 mm).
Figure 13.
LDRs at different warm forming temperatures (punch diameter = 100 mm and blank thickness 1.3 mm).


Table 1.
Major limit strains at different strain ratios, temperatures and strain rates. (1)
| (s−1) | T (°C) | ln(Z) | Major Limit Strain () at Strain Ratio (ρ) | |||||
|---|---|---|---|---|---|---|---|---|
| −0.28 | −0.1 | 0 | 0.2 | 0.5 | ||||
| 0.005 | 400 | 18.83 | 1.0 | 1.723 | 0.704 | 0.62 | 0.62 | 0.61 |
| 0.008 | 300 | 23.51 | 1.249 | 1.38 | 0.6 | 0.48 | 0.44 | 0.54 |
| 0.01 | 300 | 23.73 | 1.260 | 1.112 | 0.517 | 0.443 | 0.409 | 0.47 |
| 0.008 | 200 | 29.50 | 1.567 | 0.72 | 0.45 | 0.28 | 0.33 | 0.38 |
| 0.008 | 100 | 38.70 | 2.056 | 0.259 | 0.2 | 0.16 | 0.17 | 0.18 |
| 0.01 | 50 | 45.67 | 2.425 | 0.0948 | 0.087 | 0.08 | 0.138 | 0.168 |
Table 2.
Material parameters in the Cowper and Symonds equation.
| Temperature (°C) | ||||||
|---|---|---|---|---|---|---|
| 25 | 100 | 150 | 200 | 250 | 300 | |
| C | 4 × 10⁵ | 462 | 10 | 11 | 14.5 | 15 |
| P | 1.9 | 2.3 | 2.2 | 2.1 | 2.2 | 4.2 |
| Tooling Setup | |
|---|---|
| Punch diameter (mm) | 100 |
| Punch and die corner radii (mm) | 12 |
| Punch speed (mm/s) | 5 |
| Blank thickness (mm) | 1.3 |
| Flow stress curves | Figure 6c,d |
| Interfacial coefficient of friction | 0.1 at 25–150 °C, 0.2 at 200 and 250 °C and 0.4 at 300 °C |
| Blank holder pressure | 0.5–2.0 MPa |
Table 4.
Thermal properties of AZ31 sheet material and tool material [29].
Table 4.
Thermal properties of AZ31 sheet material and tool material [29].
| Thermal conductivity of the sheet material (W/m K) | 95.8 |
| Heat capacity of the sheet material (J/Kg K) | 1767.5 |
| Thermal conductivity of the tool material (W/m K) | 60.5 |
| Heat capacity the tool material (J/Kg K) | 3410 |
| Interface contact heat conductance (W/m2 K) | 4500 |
| Factor to convert plastic deformation energy to heat | 0.95 |
Table 5.
Predicted temperature distribution on the cup being drawn at 200 °C.
| Time = 6 s, Stroke = 30 mm | Time = 14 s, Stroke = 70 mm | |||
|---|---|---|---|---|
 |  | |||
| Formed in LS-DYNA 3D | ||||
| @ 30 mm Stroke | @ 70 mm Stroke | |||
| Measurement Points | Temperature in LS-DYNA 3D (°C) | Temperature in DEFORM 2D (°C) [29] | Temperature in LS-DYNA 3D (°C) | Temperature in DEFORM 2D (°C) [29] |
| A | 58.3 | 61.3 | 47.5 | 50.1 |
| B | 75 | 77.2 | 64.3 | 67.1 |
| C | 92 | 92.99 | 84.3 | 84.2 |
| D | 107.6 | 108.9 | 102.1 | 101.3 |
| E | 123.8 | 124.6 | 112.5 | 110.4 |
| F | 147.1 | 148.4 | 136.2 | 134.5 |
| G | 154.7 | 156.2 | 154.4 | 152.6 |
| H | 169.7 | 172.1 | 167.5 | 169.6 |
| I | 186.8 | 187.9 | 187.9 | 186.7 |
| J | 201.6 | 203.7 | 203.5 | 203.8 |
Table 6.
Failure status of representative elements in non-isothermal cup draw test.
| Die/Blank Holder Temperature (°C) | Status | Element | (s−1) | T (°C) | Thinning (%) | ||||
|---|---|---|---|---|---|---|---|---|---|
| 150 | Fracture | EM | −0.230 | 0.3 | 0.09 | 89 | 2.254 | 0.01 | 6.8 |
| Fracture | ET | −0.210 | 0.284 | 0.092 | 85 | 2.282 | 0.03 | 7.1 | |
| Safe | ES | −0.400 | 0.40 | 0.004 | 130 | 1.847 | −0.06 | 3.9 | |
| 200 | Fracture | ET | −0.15 | 0.31 | 0.07 | 199 | 1.70 | 0.02 | 15.6 |
| Fracture | EM | −0.13 | 0.3 | 0.06 | 199 | 1.68 | 0.01 | 15.2 | |
| Safe | ES | −0.06 | 0.13 | 0.02 | 121 | 1.981 | −0.07 | 6.3 | |
| 250 | Fracture | ET | −0.215 | 0.4 | 0.1 | 227 | 1.6 | 0.01 | 18.5 |
| Safe | ES | −0.06 | 0.077 | 0.016 | 135 | 2.1 | −0.09 | 1.4 | |
| 300 | Fracture | ET | −0.31 | 0.62 | 0.1 | 285 | 1.42 | 0.02 | 30.1 |
| Fracture | EM | −0.334 | 0.63 | 0.1 | 280 | 1.44 | 0.01 | 28.5 | |
| Safe | ES | −0.074 | 0.095 | 0.013 | 112 | 2.01 | −0.06 | 1.9 |
© 2018 by the authors. Licensee MDPI, Basel, Switzerland. This article is an open access article distributed under the terms and conditions of the Creative Commons Attribution (CC BY) license (http://creativecommons.org/licenses/by/4.0/).
Share and Cite
MDPI and ACS Style
Sheng, Z.Q.; Mallick, P.K. Developing a Zener–Hollomon Based Forming Limit Surface for Warm Sheet Forming of Magnesium Alloy. J. Manuf. Mater. Process. 2018, 2, 3. https://doi.org/10.3390/jmmp2010003
AMA Style
Sheng ZQ, Mallick PK. Developing a Zener–Hollomon Based Forming Limit Surface for Warm Sheet Forming of Magnesium Alloy. Journal of Manufacturing and Materials Processing. 2018; 2(1):3. https://doi.org/10.3390/jmmp2010003
Chicago/Turabian StyleSheng, Z. Q., and P. K. Mallick. 2018. "Developing a Zener–Hollomon Based Forming Limit Surface for Warm Sheet Forming of Magnesium Alloy" Journal of Manufacturing and Materials Processing 2, no. 1: 3. https://doi.org/10.3390/jmmp2010003