Precise In-Process Strain Measurements for the Investigation of Surface Modification Mechanisms


Bremen Institute for Metrology, Automation and Quality Science, University of Bremen, 28359 Bremen, Germany
*
Author to whom correspondence should be addressed.
J. Manuf. Mater. Process. 2018, 2(1), 9; https://doi.org/10.3390/jmmp2010009
Submission received: 8 December 2017
/
Revised: 24 January 2018
/
Accepted: 25 January 2018
/
Published: 30 January 2018
(This article belongs to the Special Issue Precision Manufacturing)
Abstract
:The question, how certain surface layer properties (for example, hardness or roughness) can be specifically influenced in different manufacturing processes, is of great economic interest. A prerequisite for the investigation of the formation of surface layer properties is the metrological assessment of the material stresses during processing. Up to now, no commercial in-process measuring system exists, which is able to determine material stresses in the form of mechanical strains in high-dynamic manufacturing processes with sufficient accuracy. A detailed analysis of the resolution limits shows that speckle photography enables deformation measurements with a resolution in the single-digit nanometer range. Thus, speckle photography basically offers the potential to measure material stresses during processing. Using the example of single-tooth milling, the applicability of speckle photography for in-process stress measurements is demonstrated. Even in such highly dynamic manufacturing processes with cutting speeds up to 10 m/s, the absolute measurement uncertainty of the strain is less than 0.05%. This is more than one order of magnitude lower than the occurring maximal strain. Therefore, speckle photography is suitable for characterizing the dynamic stresses and the material deformations in manufacturing processes.
1. Introduction
Currently, the industrial production of highly stressed components is able to adjust dimensions, shapes or surface geometries with high precision. In contrast, surface layer properties such as inherent stresses and hardness, cannot be controlled easily so far [1]. However, precisely these properties are of decisive importance for the service life and operating behavior of the components [2]. Therefore, it is important to understand the processes occurring during the manufacturing processes, which lead to a change in the material properties, better. A recent step to increase the understanding is the attempt to describe the manufacturing process by means of a so-called process signature [3,4]. The aim is to describe the functional properties of the component independently of the manufacturing process. This is to be achieved by determining the relationship between the material stress during processing and the modification remaining in the material afterwards. The basic prerequisite for this approach is that the stresses in the ongoing manufacturing process can be measured.
Suitable in-process measuring methods are either spot-measuring, invasive material-integrated sensors or surface-measuring non-invasive optical methods based on speckle photography [5]. The speckle photography preferred here uses the random formation of bright and dark spots (speckles) formed by constructive and destructive interference, if a rough surface is illuminated with coherent laser light and observed with an imaging system. The image of the surface topography on the camera chip is superimposed with a speckle pattern and every single speckle is related to a local surface element. Thus, the speckles mark certain surface points and enable tracking of their movement by using digital image/speckle correlation methods (DISC) [6,7]. As a result, speckles offer the possibility to determine the in-plane deformation of a workpiece surface.
Speckle photography is an optimal measuring approach for contactless deformation measurements with nanometer resolution, and is ultimately limited by Heisenberg’s uncertainty principle [8]. The respective theoretical limit of the measurement uncertainty is indirectly proportional to the square root of the number of detected photons and directly proportional to the diffraction limit of the imaging system described by the speckle size.
Advances in laser and camera technology open up new fields of application for speckle photography. First combinations of a high-speed camera and speckle photography have been used to estimate viscoplastic material parameters at high strain-rate conditions for example in split Hopkinson pressure bar arrangements [9,10] or for tensile tests on dual-phase high-strength steels with servo-hydraulic testing machines [11]. Additionally, newly available short-pulse diode lasers (pulse length < 1 ns) with high energy densities of more than 20 µJ and compacts designs also enable an integration of the measurement system’s light source into the limited workspace of a manufacturing machine.
Despite these technical advances, however, there are no commercial in-process measuring systems that are capable of determining material stresses in the form of mechanical strains in highly dynamic manufacturing processes such as single-tooth milling with sufficient accuracy.
In order to identify the potential of speckle photography for an in-process application in the single-tooth milling, the respective resolution limits and the measurement uncertainty are derived and experimental results are presented. The boundary conditions for the measuring system are particularly challenging. At cutting speeds of more than 10 m/s, elastic deformations to a depth of several millimeters are expected. In contrast, the remaining plastic modification is only located in zone near to the edge in the outer 30–50 μm. The maximum deformations in this surface layer are up to 200 nm, therefore resolutions of at least 25 nm should be achieved. This article intends to clarify whether speckle photography fulfills the listed metrological requirements, where the resolution limits of the system lie and whether it can principally contribute to establish process signatures.
2. Experimental Set-Up and Evaluation
A sketch of the measurement setup for single-tooth milling is shown in Figure 1a.
The cutting tool rotates with a speed of vc = 10 m/s. In order to trigger the deformation measurement on the workpiece in the loaded and unloaded state, an optical marker for a reflex light barrier is applied on the tool and its counterweight. This results in a measured image sequence with alternating images of the loaded and unloaded state. The elastic deformation field during the tool engagement is determined by comparing two consecutive images. Additionally, the comparison of two successive unstressed states (e.g., image 1 and 3) yields the plastic modification, which occurred during the intervening tool engagement.
For imaging, a high-speed camera (Optronis CP70, Stemmer Imaging, Puchheim, Germany) with a resolution of 4080 × 3072 pixels and a pixel size of 5.5 μm was employed. The imaging lens (Apo Rodagon, Rodenstock, Munich, Germany) has an adjustable aperture of f/4 to f/22. To achieve the desired magnification a tube extension of 0.5 m length was used. Since there is only little free space between the tool engagement point and the spindle motor, a special periscope optic has been developed (see Figure 1b). A green (λ = 532 nm) short pulse diode laser from Horus Lasers (Soliton GmbH, Gilching, Germany) illuminates the surface with a Gaussian beam profile. Further technical details of the individual components are discussed subsequently in Section 3 with respect to the resulting resolution limit and the measurement uncertainty of the measurement system.
The functional principle of the image processing (the DISC evaluation) is shown in Figure 2. The elastic deformations are determined by comparing speckle images of loaded and unloaded workpiece states. This comparison is performed locally by calculating the position of the maximum cross correlation in an evaluation window WEW in the field of view WFOV. The local surface deformation in the image plane (for example the in-plane workpiece deformation in x-direction, see also Figure 1a) is determined from the difference between the position of the cross correlation’s maximum value and the evaluation window center. In order to obtain the global deformation field, the evaluation window scans across the whole field of view, whereby the local deformation Shiftx,y is stored for each scan position (px, py). Due to the almost Gaussian profile of the cross-correlation function, a two-dimensional Gaussian curve is fitted to the correlation data to determine the maximum position with subpixel resolution [12]. After a corresponding low-pass filtering, the strain and thus the stress can be calculated from the deformation field by gradient formation.
3. Results
3.1. Limits of the Measurement System
The resolutions of the measuring system refers to three variables: The deformation resolution of a speckle pattern in the evaluation window at a point (px, py), the spatial resolution given by the lateral discretization of the points (px, py) and the temporal resolution of the measurement system. In the following subsections the resolutions of the measurement setup are estimated regarding their achieved values as well as their minimal limits.
3.1.1. Deformation Resolution
In a cutting process with standard cutting parameters, maximum deformations up to two micrometers are expected. Thus, with a camera pixel size of 5.5 μm, an evaluation method is required, which is capable of detecting subpixel shifts. Depending on the size of the cross correlation evaluation window as well as the speckle size and by using the two-dimensional Gaussian interpolation method of the DISC, displacements of the speckles in the image plane are detected with a typical resolution of less than 1/100 pixel [5,7]. Note that the subpixel interpolation can still be improved for instance by averaging over a larger number of speckles, which means a larger evaluation window (see Section 3.2.1). However, the chosen size of the evaluation window is a compromise between an increased deformation resolution and a simultaneously reduced lateral resolution.
For the used setup, a resolution of 1/100 pixel (corresponding to 55 nm in the image plane) is achieved with an evaluation window size (width) of WEW = 10 pixels and a speckle diameter of σ = 4 pixels (corresponding to 22 µm in the image plane). In order to derive the deformation resolution in the object plane, the maximal image magnification M is calculated with the speckle diameter σ, the laser wavelength λ and the f-number F by [13]
With the minimal f-number of f/4 of the imaging lens and the laser wavelength of λ = 532 nm the maximal magnification amounts to M = 7.6. Hence, the estimated deformation resolution of the current setup of the measurement system is Res = 55 nm/7.6 ≈ 7 nm.
In an optimized optical setup, a minimal laser wavelength of λ = 405 nm and an f-number of f/1 seems feasible. Then the magnification M increases to a value of 44 and, thus, a resolution limit of about 1 nm is principally achievable.
Note that the resolution deteriorates with an increasing width WFOV of the field of view in the object plane, because of
with NC as the width of the field of view in the image plane in pixels. For NC = 4080 pixels and Res = 7 nm, the field of view amounts to 2.9 mm in the object plane. In order to observe the occurring elastic shifts in the single-tooth milling, a field of view of 4 mm, respectively a magnification of M = 5.6 is desired. The resulting theoretical limit of the deformation resolution then amounts to Res = 10 nm, which is sufficient for the considered application.
3.1.2. Lateral Resolution
The lateral resolution Res in speckle photography is depending on the magnification M of the optics and the size WEW of the evaluation window. As a result of the cross correlation image processing, the algorithms of the DISC calculate only the average deformation in the evaluation window. According to the Nyquist sampling theorem, the lower limit for the scanning step size is SS = WEW/2. For a scan with this step size, the maximum information is included in the evaluated data. According to the chosen evaluation window size of WEW = 10 pixels, the minimum reasonable sampling step is 5 pixels for the present experimental setup.
Taking the window size WFOV, the pixel size σ and the image magnification M of the current measurement system into account, the lateral resolution in the object plane is 5 µm. The limit for the lateral resolution can be calculated from the theoretical maximal magnification of M = 44, which leads to a value of 625 nm. Note that the spatial resolution is principally limited by the diffraction limit of the imaging system (which is related to the speckle size) and the size of the evaluation window.
In order to determine the strain in the material, the gradient of the deformation field must be calculated. Because the gradient calculation is sensitive to noisy data, it is necessary to smooth the deformation field with a low-pass filter. In the application considered here, a sliding average value over 9 (3 × 3) measuring points is used. Therefore the overall lateral resolution rises to 15 μm.
3.1.3. Temporal Resolution
The entire deformation field follows the cutting-tool movement with a maximum speed of 10 m/s. Because the deformation field should not move more than 10 nm during the measurement to prevent blurring of the speckle images, extremely short illumination times in the range of one nanosecond are required. Therefore, the temporal resolution is not determined by the camera, but rather by the illumination system.
The pulse duration of the applied laser and hence the temporal resolution is less than 1 ns. The pulse energy is about 20 µJ, which is sufficient to illuminate the camera with a sensitivity of 5 V/lux-sec.
3.2. Measurement Uncertainty
The performance of the speckle photography method in terms of measurement uncertainty depends on several influences. The assumed dominant factors discussed in this article are the:
- size of the speckles,
- size of the evaluation window,
- grayscale resolution of the camera,
- signal to noise ratio,
- light intensity distribution of the speckles according to the illumination.
In order to determine the individual influence of each of these quantities on the measurement uncertainty, Monte Carlo simulations were performed. The movement Dpixel of the speckle pattern on the camera chip in the image plane in unit pixel was calculated for numerically generated Gaussian speckle patterns, which were shifted in the object plane by a given amount D. The calculations were carried out using the DISC algorithm without low-pass filtering. With this simulation approach, the speckle pattern shift was exactly known and the different contributions to the measurement uncertainty of Dpixel could be examined separately. Finally, the total measurement uncertainty for the deformation D and the strain S was derived with an error propagation calculation, respectively.
3.2.1. Influences of Speckle and Evaluation Window Size
The size of the evaluation window and the speckle size in the image plane have been identified as important influences on the measurement uncertainty. Since both can be selected relative freely, the existence of optimal parameters is investigated. Therefore, the relationships between the size of the evaluation window, the size of the speckles (adjustable by the aperture of the objective lens) and the resulting measurement uncertainty were analyzed. In the simulations, an image noise of the camera (signal to noise ratio SNR = 41 dB) was taken into account in the original and the sub-pixel-shifted speckle pattern, because it was found to be the significant source for the measurement uncertainty (see Section 3.2.2). The grayscale resolution of the camera model was maximized to 64-bit for virtually eliminating the deviations resulting from quantization. In addition, the Gaussian beam profile of the laser was implemented. The obtained measurement uncertainty as a function of the speckle size in the image plane and the evaluation window size (both in pixels) is shown in Figure 3. The simulations revealed a speckle size of 2–5 pixels and an evaluation window size of more than 6 pixels as the optimum for the evaluation of the speckle pattern, if the two-dimensional Gaussian interpolation method is used for the DISC calculation. These values are similar to the results presented by Zhou and Goodson for a fixed number of speckles within the evaluation window [12]. For this reason, a speckle size of 3 pixels and an evaluation window size of 10 pixels are applied in the next considerations as well as in the measurement system. Note that the determined optimum speckle size for the evaluation of the speckle images is similar to the case of particle image velocimetry (PIV), where the lateral shift between two particle images is evaluated. For PIV, the optimum particle size in the image plane amounts to about 2 pixels for an evaluation window of 32 × 32 pixels [14,15].
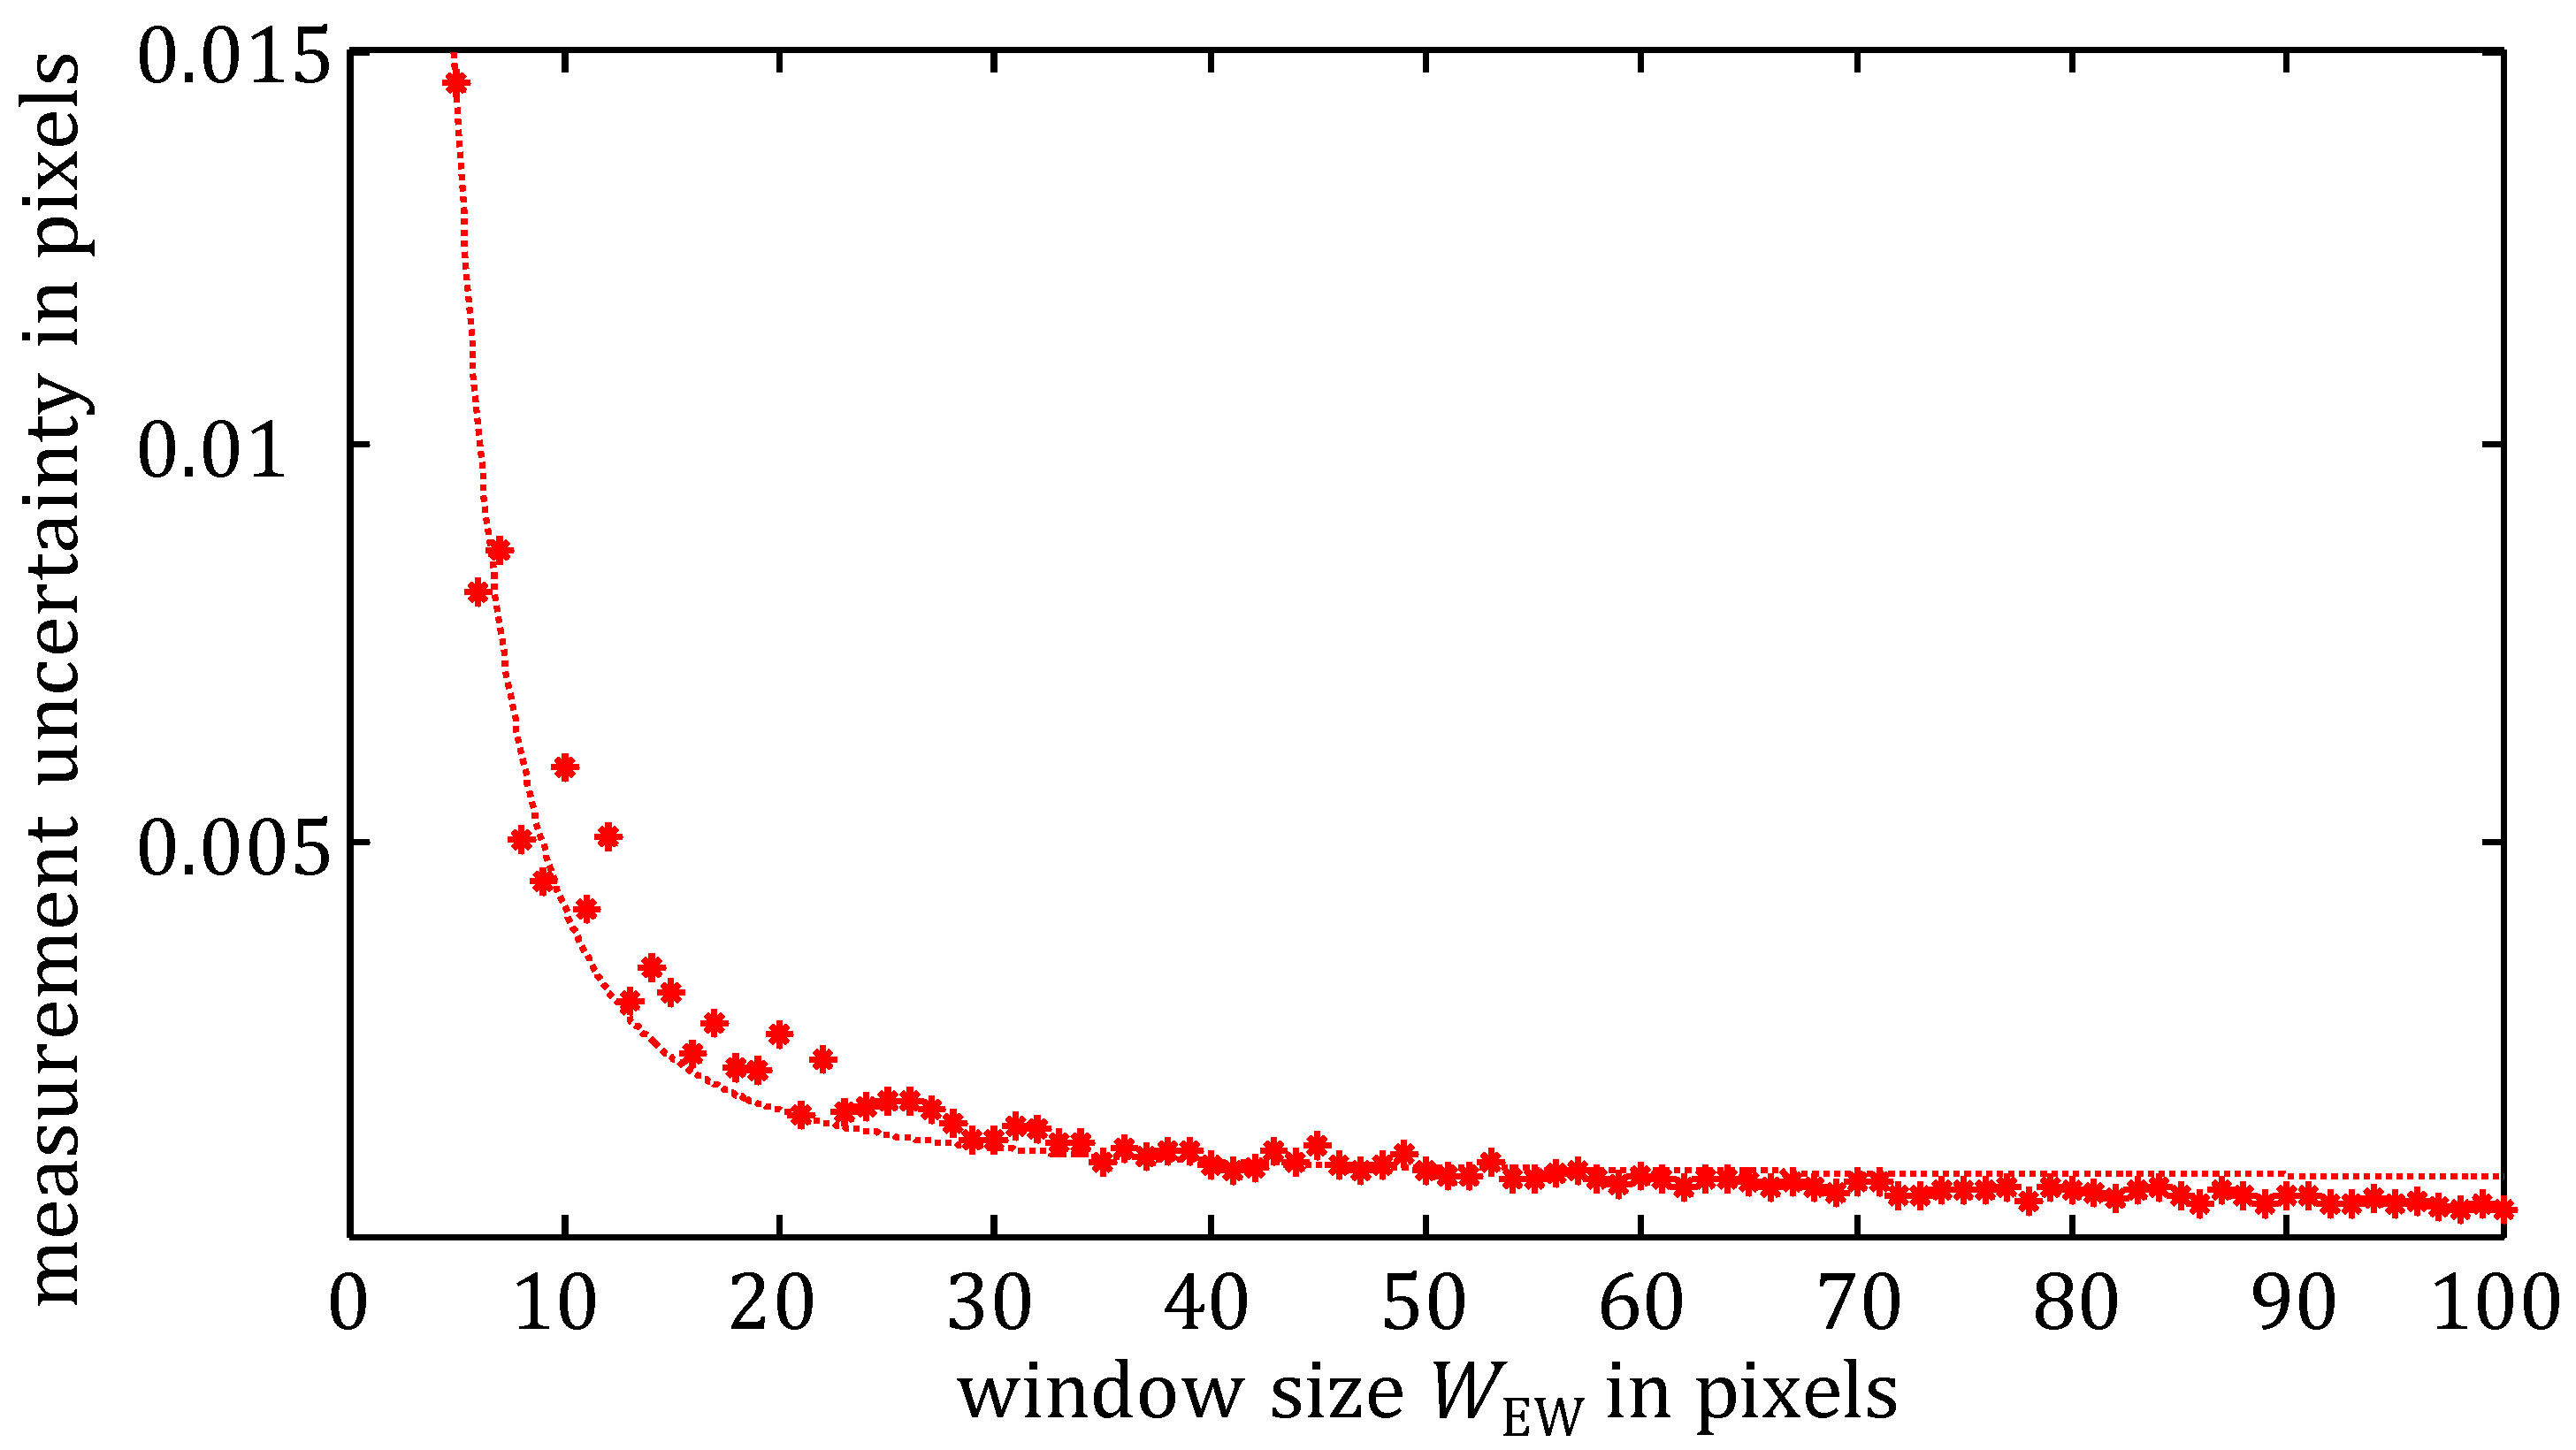
Since the measurement uncertainty is a reciprocal function of the detected light energy, the measurement uncertainty is inversely proportional to the square of the evaluation window size (u(Dpixel) ≈ 1/WEW2). Figure 4 shows this behavior for a fixed speckle diameter of σ ≈ 3 pixels. The uncertainty asymptotically approaches a minimal limit of 0.0002 pixels. Note that the resolution increase is achieved at the expense of a loss of lateral resolution and a larger evaluation time.
3.2.2. Influences of Grayscale Resolution, Signal to Noise Ratio and Light Intensity Distribution of the Speckles
In order to consider the measurement uncertainty due to the grayscale resolution, the image noise was set to zero in the corresponding simulations. For the width of the Gaussian intensity profile of the laser illumination, which indirectly defines the average light intensity of the speckles in the field of view, a full width at half maximum (FWHM) was chosen, that equals the size of the field of view WFOV. The resulting measurement uncertainty u(Dpixel)Bit of the surface shift in pixels is plotted against the bit resolution as a solid line in Figure 5. It decreases exponentially with the discretization and amounts to 0.0005 pixel (black dotted line) for the chosen camera resolution of 10 bit.
For investigating the measurement uncertainty u(Dpixel)SNR resulting from the SNR, a sufficiently high grayscale resolution of the camera was chosen. The simulation result is drawn as a dashed line in Figure 5. The measurement uncertainty decreases exponentially with the SNR. Because the SNR of the used camera is 41 dB, the measurement uncertainty reads u(Dpixel)SNR = 0.0031 pixel (red dotted line).
In addition, the influence of the light intensity distribution of the speckles was examined by varying the width of the illumination spot between 1/3 WFOV and 3 WFOV. As a result, no significant relationship was found. Hence, the uncertainty contribution is set to zero u(Dpixel)LID = 0.
Because the uncertainty contributions u(Dpixel)Bit, u(Dpixel)SNR and u(Dpixel)LID are independent from each other, they are added according to the “Guide to the expression of Uncertainty in Measurement” (GUM) [16]
According to the simulation results, the signal to noise ratio generally has a significantly greater influence on the measurement uncertainty of the system than the grayscale resolution and the light intensity distribution of the speckles. Future efforts should therefore concentrate on an improvement of the camera’s signal to noise ratio.
3.2.3. Measurement Uncertainty of the Deformation and the Strain
Since the gradient formation for the strain calculation requires a prefiltering, a sliding average filter over 3 × 3 = 9 measuring points is applied, cf. Section 3.1.2. Hence, the uncertainty for the averaged deformation Dpixel,filtered is
The determined surface shifts in the image plane given in pixels are converted to metric units via the pixel size and the magnification factor of the objective. Both are summarized in a scaling factor A, which was determined to A = (1034 ± 11) nm/pixel by reference measurements. Thus, the deformation D in nm follows from the relation
The combined measurement uncertainty of the measurement system is finally calculated according to the GUM procedure [16] which results in
As a result, the measurement uncertainty turns out to be dependent on the measured quantity, i.e., the surface shift D. In the considered machining process maximal deformations of 2 µm are expected. For this reason, the maximum cumulative measurement uncertainty reaches u(D) = 22 nm, which is clear below the desired resolution. Since the measurement uncertainty is currently limited by the unknown systematic error of the scaling factor A, which is constant during the measurements, even smaller deformation variations are resolvable. As a result, deformations significantly below the laser wavelength can be studied with the speckle measurement approach.
The strain S in percent is calculated by forming the gradient of the deformation field. Because of the discretization, this corresponds to the slope between two adjacent deformation measuring points D(1) and D(2) with the distance L = 5 µm (lateral measurement resolution):
The uncertainty of the distance L is defined by the tolerances of the cameras pixel spacing. Because the lithographic manufacturing process of the chip is well controlled, the uncertainty contribution from the distance L can be neglected. Therefore, the error propagation for the uncertainty of the two deformation values using Equation (7) results in the strain measurement uncertainty
Maximum strains should be below 2% in the considered manufacturing processes, i.e., a maximum deformation of 100 nm can occur from point 1 to point 2. As a result, the maximum uncertainty for the strain is u(S) = 0.05%.
3.3. Performance of the Measurement System
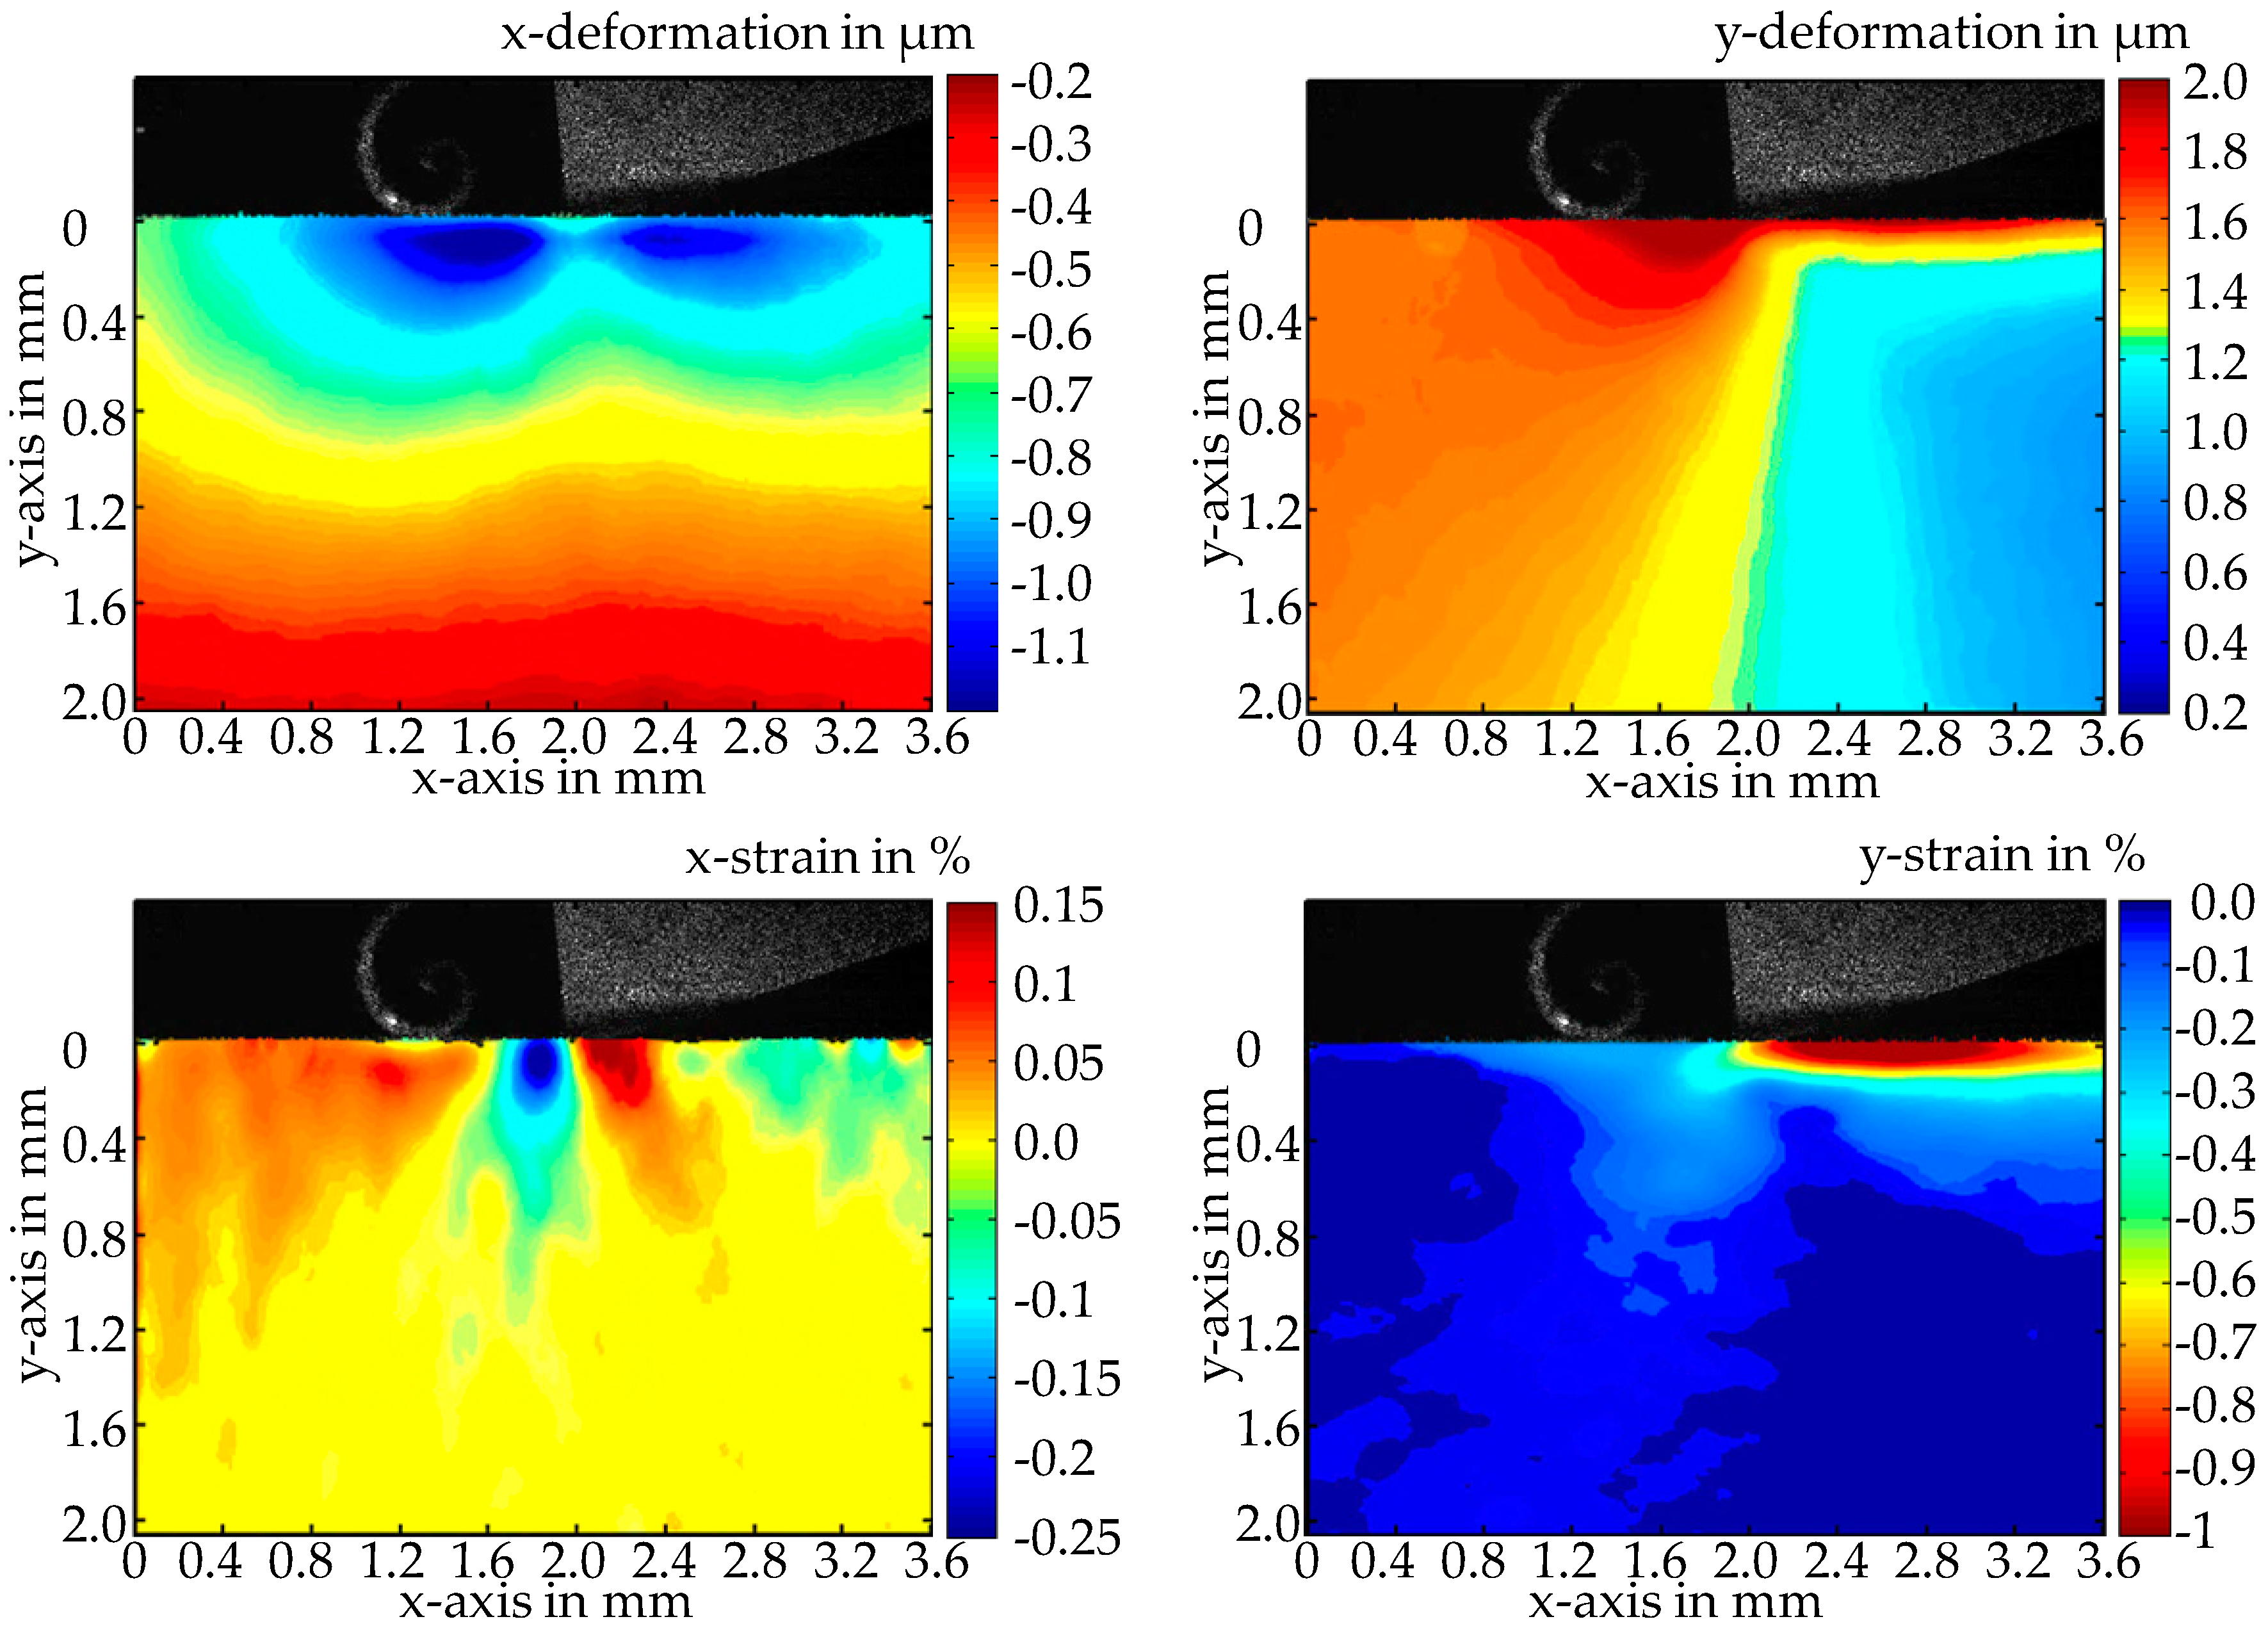
The performance of the speckle photography method for in-process measurements is demonstrated by its application in a single-tooth milling process. According to the chosen evaluation window for the sampling of the speckle image, the measured deformation field has the dimension of 816 × 614 pixels in the image plane and approx. 3.6 mm × 2.7 mm in the object plane. The deformations of the workpiece occurring in the x- and y-direction and the induced strains at the time of the tool engagement are shown in Figure 6.
The measured deformations are more than one order of magnitude higher than the estimated uncertainty of the measurements. Note also the speckle pattern on the cutting tool, which is shown in a gray scale representation in the upper image area. No smearing of the speckle pattern is observed, neither on the tool nor on the chip (forming in front of it), which illustrates the experimentally achieved high time resolution. The y-shift shows the highly dynamic behavior of the mechanical stress. A large portion of the deformation is of purely elastic nature and disappears immediately after the tool engagement. The material is obviously compressed in a wide range (>2 mm) in front of the cutting edge. The maximum y-deformation of 2000 nm is approximately 300 μm in front of the tool. The strain, respectively the stress, is calculated by the gradient of the deformation field. Due to the sharp decrease in deformation directly behind the cutting edge, the strain reaches a minimum here, which almost already equals the modification or plastic deformation remaining in the material. The measured x-deformation shows that the material surrounding the cutting edge is moved approximately one micrometer with the tool. The calculated strain is in agreement with the expected compressive stress that builds up in front of the tool while tensile stresses occur directly behind the cutting edge.
An investigation of the workpiece after the tool engagement yields the plastic deformations, which remain in the outermost edge region about 100 μm below the surface. Due to the low thickness of the region with plastic deformations, high lateral resolutions in the one-digit µm-range are required. Despite the performed averaging of the near-edge values, caused by the mentioned low pass filtering in the DISC algorithm, an evaluation of the data near to the edge is still possible.
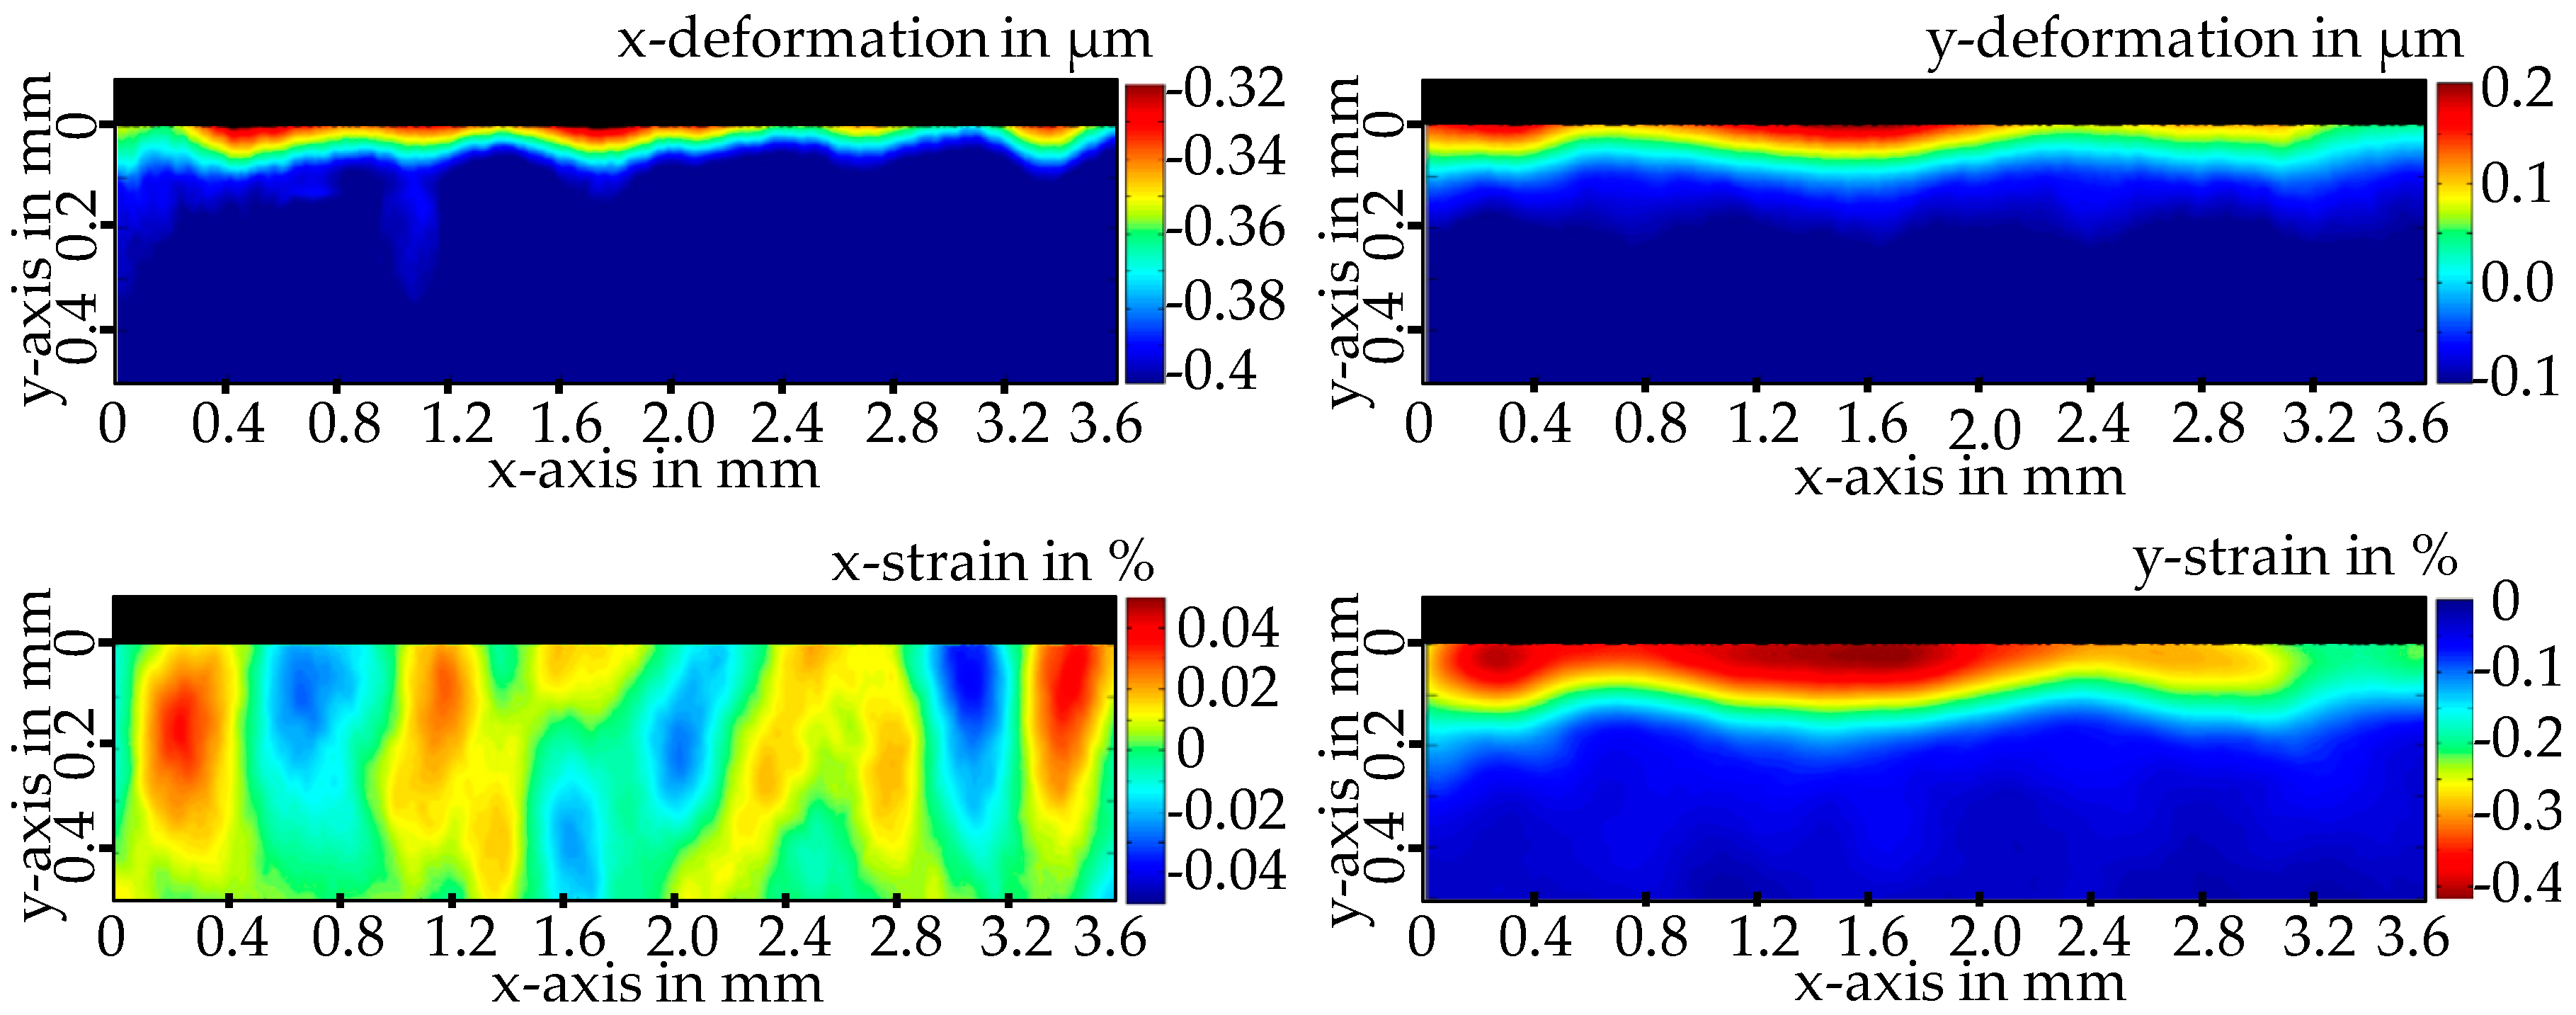
Figure 7 shows the remaining plastic deformations and the calculated strains after tool engagement. The maximum material modification occurs directly in the edge area of the machined surface up to a depth of 50 μm, mainly in y-direction. The material deformation of up to 200 nm leads to a y-strain of approximately −0.4%. Since the tool is moved with a speed of 10 m/s, it is assumed that the elastic strain decreases to zero after 160 μs. The measured x-deformation is less than 80 nm. This illustrates the high resolution of the measuring system. On the other hand, due to the measurement uncertainty for the calculation of the strain, no significant x-strain values could be observed. Despite of that, periodic loads in the form of chatter marks are noticeable in the plastic deformation and in the strain fields as well.
Note that these results could only be obtained due to the high temporal, spatial and deformation resolution of the system. Even in the boundary region, the estimated measurement uncertainty is one order of magnitude smaller than the measured values, which demonstrates the applicability and the high potential of speckle photography for in-process strain measurements.
4. Conclusions and Outlook
The measurement results show that speckle photography is a suitable method for in-process measurements in highly dynamic manufacturing processes such as single-tooth milling. Modern lasers and cameras offer the possibility to establish temporal resolutions of lower than one nanosecond and lateral resolutions of down to 625 nm. In the current measurement system, a filter algorithm for the strain calculation mainly limits the lateral resolution to 15 μm. This filtering should be improved for future detailed analyses of the boundary layer. The system is able to detect deformations in the nanometer range with an estimated uncertainty of less than 22 nm in the single tooth milling process. Currently, the overall measurement uncertainty is dominated by systematic calibration deviations. Hence, efforts to reduce the measurement uncertainty should focus on the calibration. In conclusion, a resolution limit of 1 nm was estimated to be feasible with further system improvements. With the speckle photography, both elastic stresses during processing as well as the plastic modifications remaining in the material can be measured. The speckle photography thus can contribute to establish the so-called process signature.
Acknowledgments
The authors gratefully acknowledge the financial support by the German Research Foundation (DFG) for subproject C04 “In situ measurement of mechanical and thermal material loads” and C06 “Surface optical measurement of mechanical working material loads” respectively within the Transregional Cooperative Research Center SFB/TRR136. They also thank Melanie Willert (subproject F05) and their colleagues from the Labor für Mikrozerspanung for the friendly support during the conduction of the in-process measurements.
Author Contributions
Andreas Tausendfreund carried out the experimental measurements in the single-tooth milling process, performed the simulations and wrote the paper. Dirk Stöbener assisted in analyzing the data, discussing the results and writing the paper. Andreas Fischer carried out several uncertainty calculations and participated in writing the paper.
Conflicts of Interest
The authors declare no conflict of interest.
References
- Jawahir, I.S.; Brinksmeier, E.; M’Saoubi, R.; Aspinwall, D.K.; Outeiro, J.C.; Meyer, D.; Umbrello, D.; Jayal, A.D. Surface integrity in material removal processes: recent advances. CIRP Ann. Manuf. Technol. 2015, 60, 603–626. [Google Scholar] [CrossRef]
- Novovic, D.; Aspinwall, D.K.; Dewes, R.C.; Bowen, P.; Griffiths, B. The effect of surface and subsurface condition on the fatigue life of Ti-25V-15Cr-2Al-0.2C %wt alloy. CIRP Ann. Manuf. Technol. 2016, 65, 523–528. [Google Scholar] [CrossRef]
- Brinksmeier, E.; Klocke, F.; Lucca, D.A.; Sölter, J.; Meyer, D. Process signatures—A new approach to solve the inverse surface integrity problem in machining processes. Procedia CIRP 2014, 13, 429–434. [Google Scholar] [CrossRef]
- Brinksmeier, E.; Gläbe, R.; Klocke, F.; Lucca, D.A. Process signatures—An alternative approach to predicting functional workpiece properties. Procedia Eng. 2011, 19, 44–52. [Google Scholar] [CrossRef]
- Tausendfreund, A.; Stöbener, D.; Dumstorff, G.; Sarma, M.; Heinzel, C.; Lang, W.; Goch, G. Systems for locally resolved measurements of physical loads in manufacturing processes. CIRP Ann. Manuf. Technol. 2015, 64, 495–498. [Google Scholar] [CrossRef]
- Peters, W.H.; Ranson, W.F. Digital imaging techniques in experimental stress analysis. Opt. Eng. 1982, 21, 427–431. [Google Scholar] [CrossRef]
- Tausendfreund, A.; Stöbener, D.; Goch, G. Measuring technique for the detection of process force related component deformations in metalworking manufacturing processes. In Proceedings of the 5th International Conference on Distortion Engineering, Bremen, Germany, 23–25 September 2015; pp. 355–364. [Google Scholar]
- Fischer, A. Fundamental uncertainty limit for speckle displacement measurements. Appl. Opt. 2017, 56, 7013–7019. [Google Scholar] [CrossRef] [PubMed]
- Grantham, S.G.; Siviour, C.R.; Proud, W.G.; Walley, S.M.; Field, J.E. Speckle measurements of sample deformation in the split Hopkinsons pressure bar. J. Phys. IV France 2003, 110, 405–410. [Google Scholar] [CrossRef]
- Kajberg, J.; Wikman, B. Viscoplastic parameter estimation by high strain rate experiments and inverse modelling—Speckle meas-urements and high-speed photography. Int. J. Solids Str. 2007, 44, 145–164. [Google Scholar] [CrossRef]
- Tarigopula, V.; Hopperstad, O.S.; Langseth, M.; Clausen, A.H.; Hild, F. A study of localisation in dual-phase high-strength steels under dynamic loading using digital image correlation and FE analysis. Int. J. Solids Str. 2008, 45, 601–619. [Google Scholar] [CrossRef]
- Zhou, P.; Goodson, K.E. Subpixel displacement and deformation gradient measurement using digital image speckle correlation (DISC). Opt. Eng. 2001, 40, 1613–1620. [Google Scholar] [CrossRef]
- Ennos, A.E. Speckle interferometry. In Dainty, J.C.: Laser Speckle and Related Phenomena, 2nd ed.; Springer: Berlin, Germany, 1984. [Google Scholar]
- Westerweel, J. Fundamentals of digital particle image velocimetry. Meas. Sci. Technol. 1997, 8, 1379–1392. [Google Scholar] [CrossRef]
- Westerweel, J. Theoretical analysis of the measurement precision in particle image velocimetry. Exp. Fluids 2000, 29, 3–12. [Google Scholar] [CrossRef]
- JCGM 100:2008: Guide to the Expression of Uncertainty in Measurement. Available online: https://www.bipm.org/utils/common/documents/jcgm/JCGM_100_2008_E.pdf (accessed on 7 December 2017).
Figure 1.
In-process measurement setup for the single tooth milling process: (a) sketch of the setup; (b) photo of the setup in the working area of a cutting machine (Precitech Freeform 3000) at the Labor für Mikrozerspanung (LFM).
Figure 1.
In-process measurement setup for the single tooth milling process: (a) sketch of the setup; (b) photo of the setup in the working area of a cutting machine (Precitech Freeform 3000) at the Labor für Mikrozerspanung (LFM).
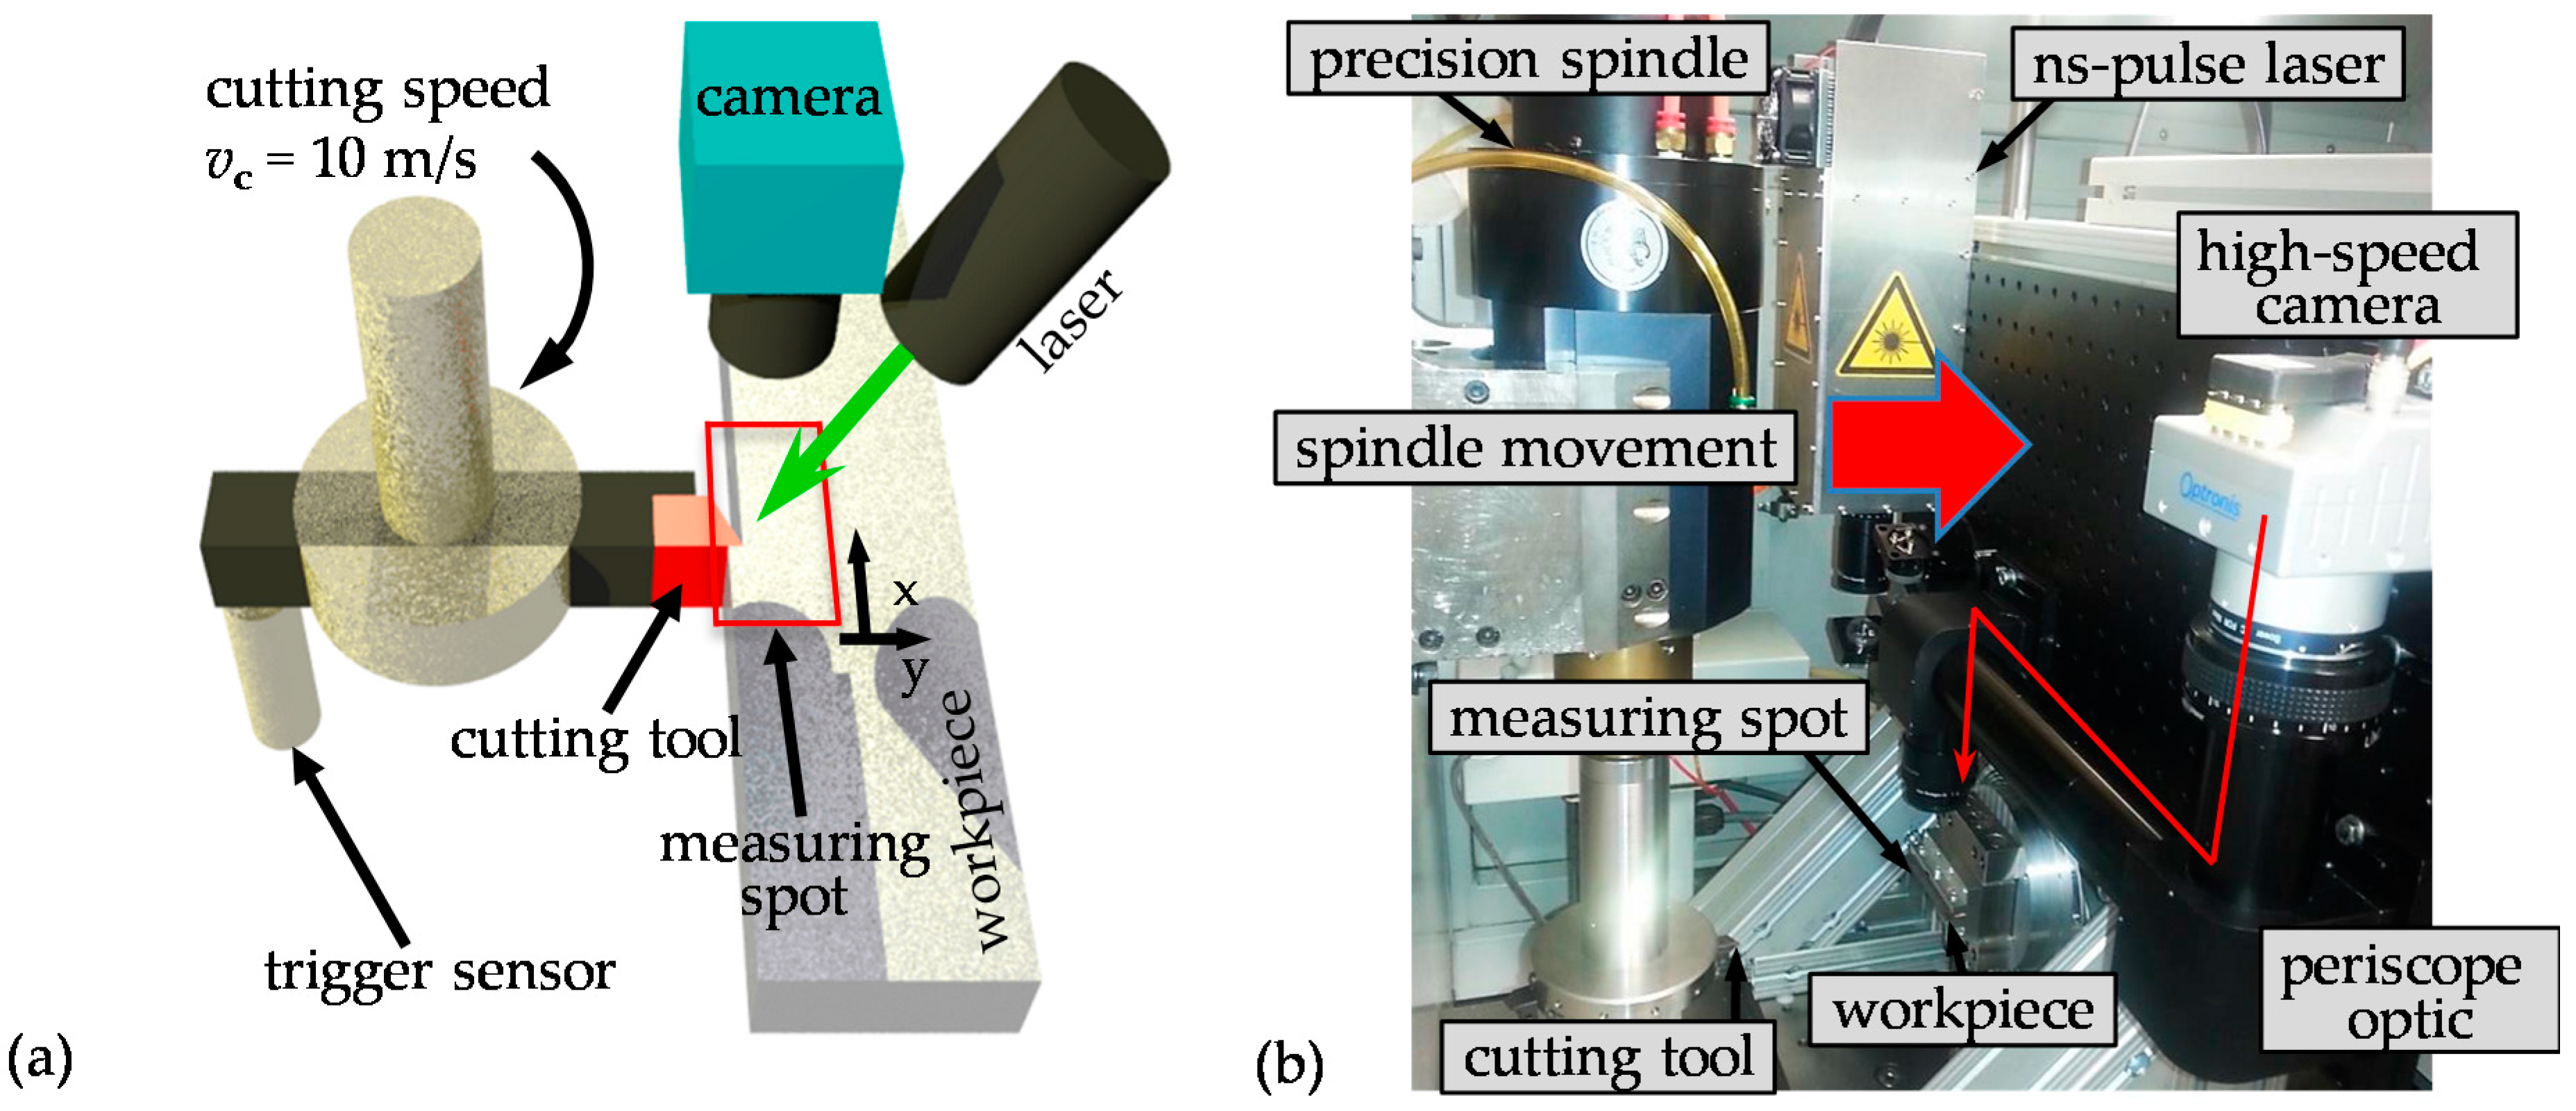
Figure 2.
Principle of image processing (DISC evaluation).
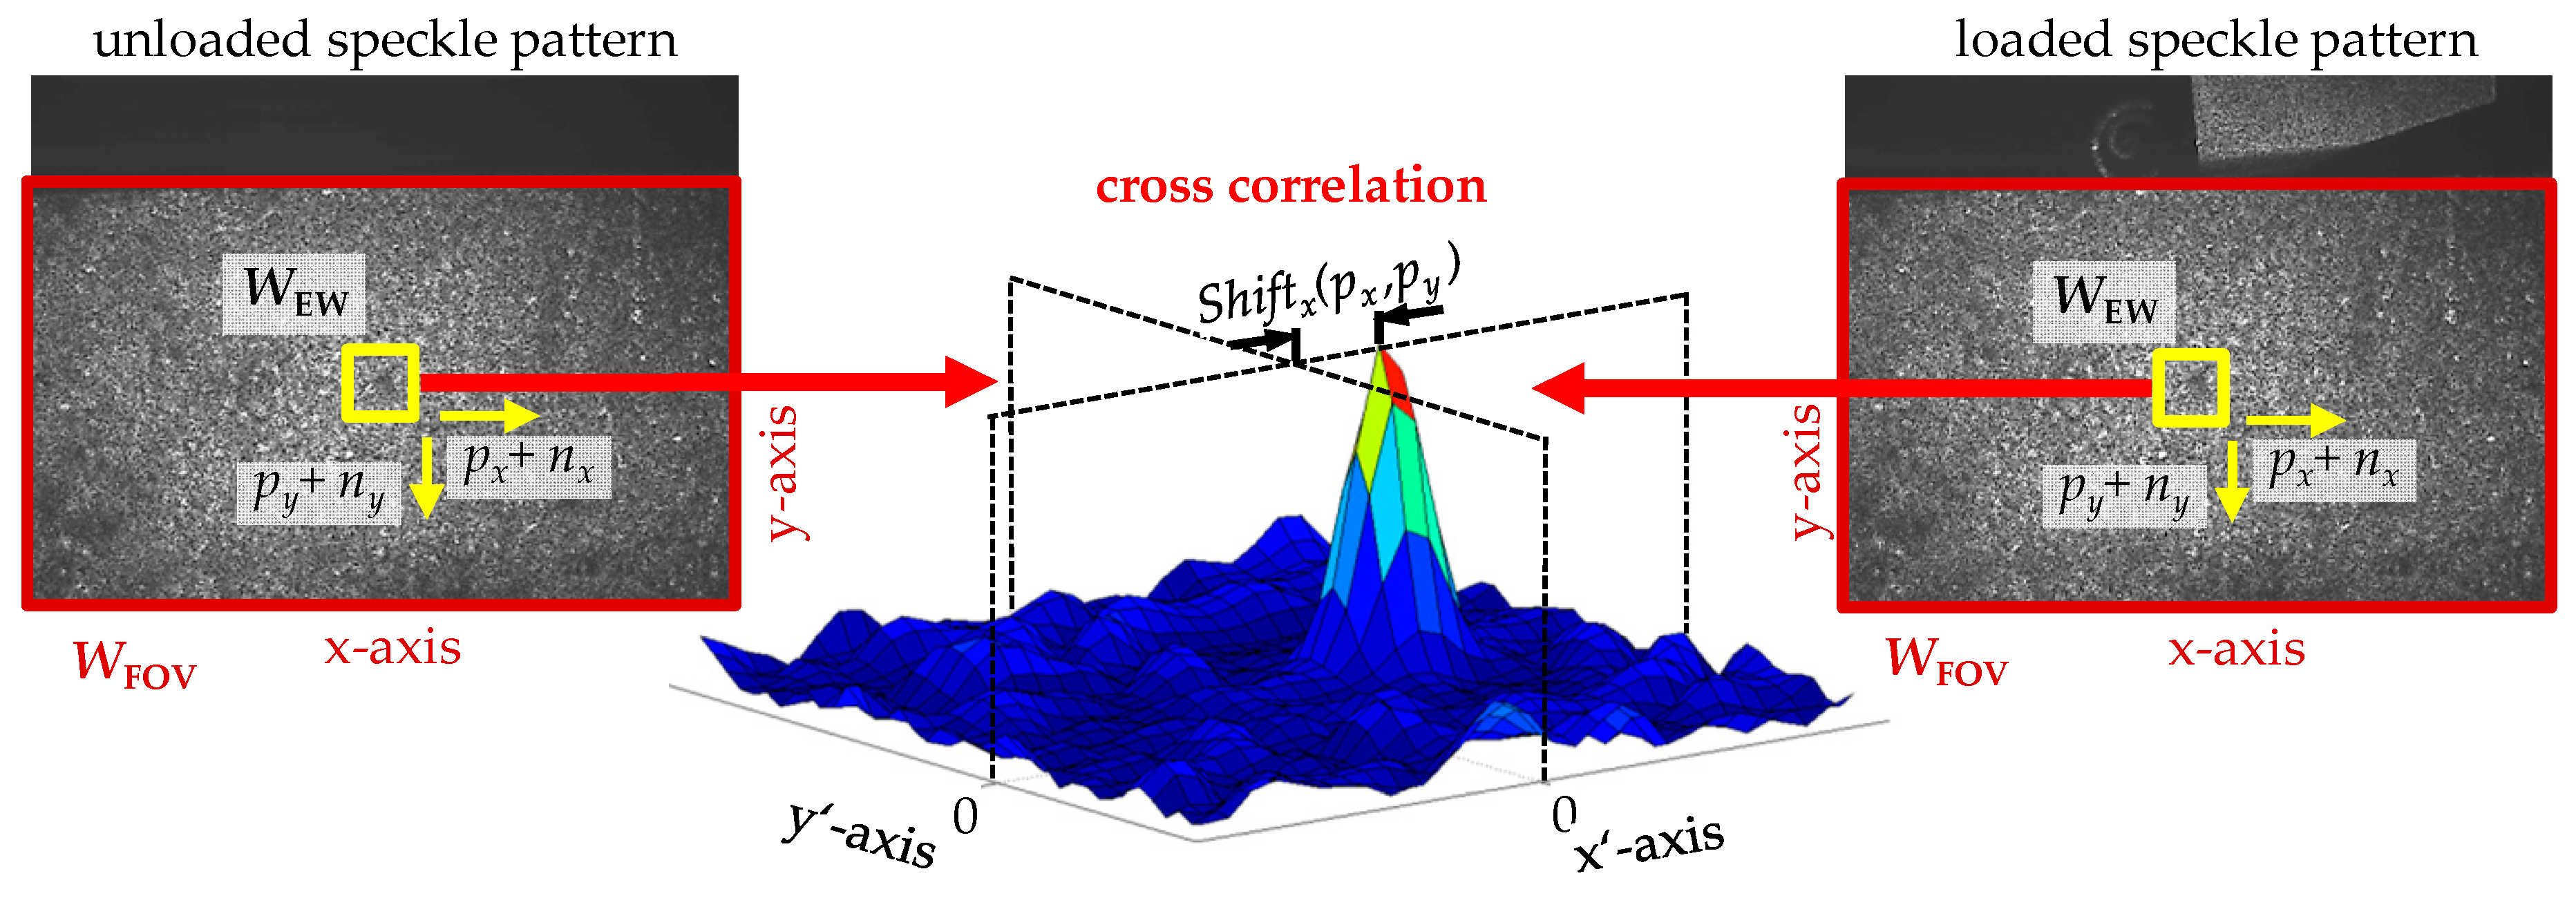
Figure 3.
Measurement uncertainty of Dpixel with respect to the speckle size σ for different sizes WEW of the evaluation window, fitted by double exponential curves.
Figure 3.
Measurement uncertainty of Dpixel with respect to the speckle size σ for different sizes WEW of the evaluation window, fitted by double exponential curves.
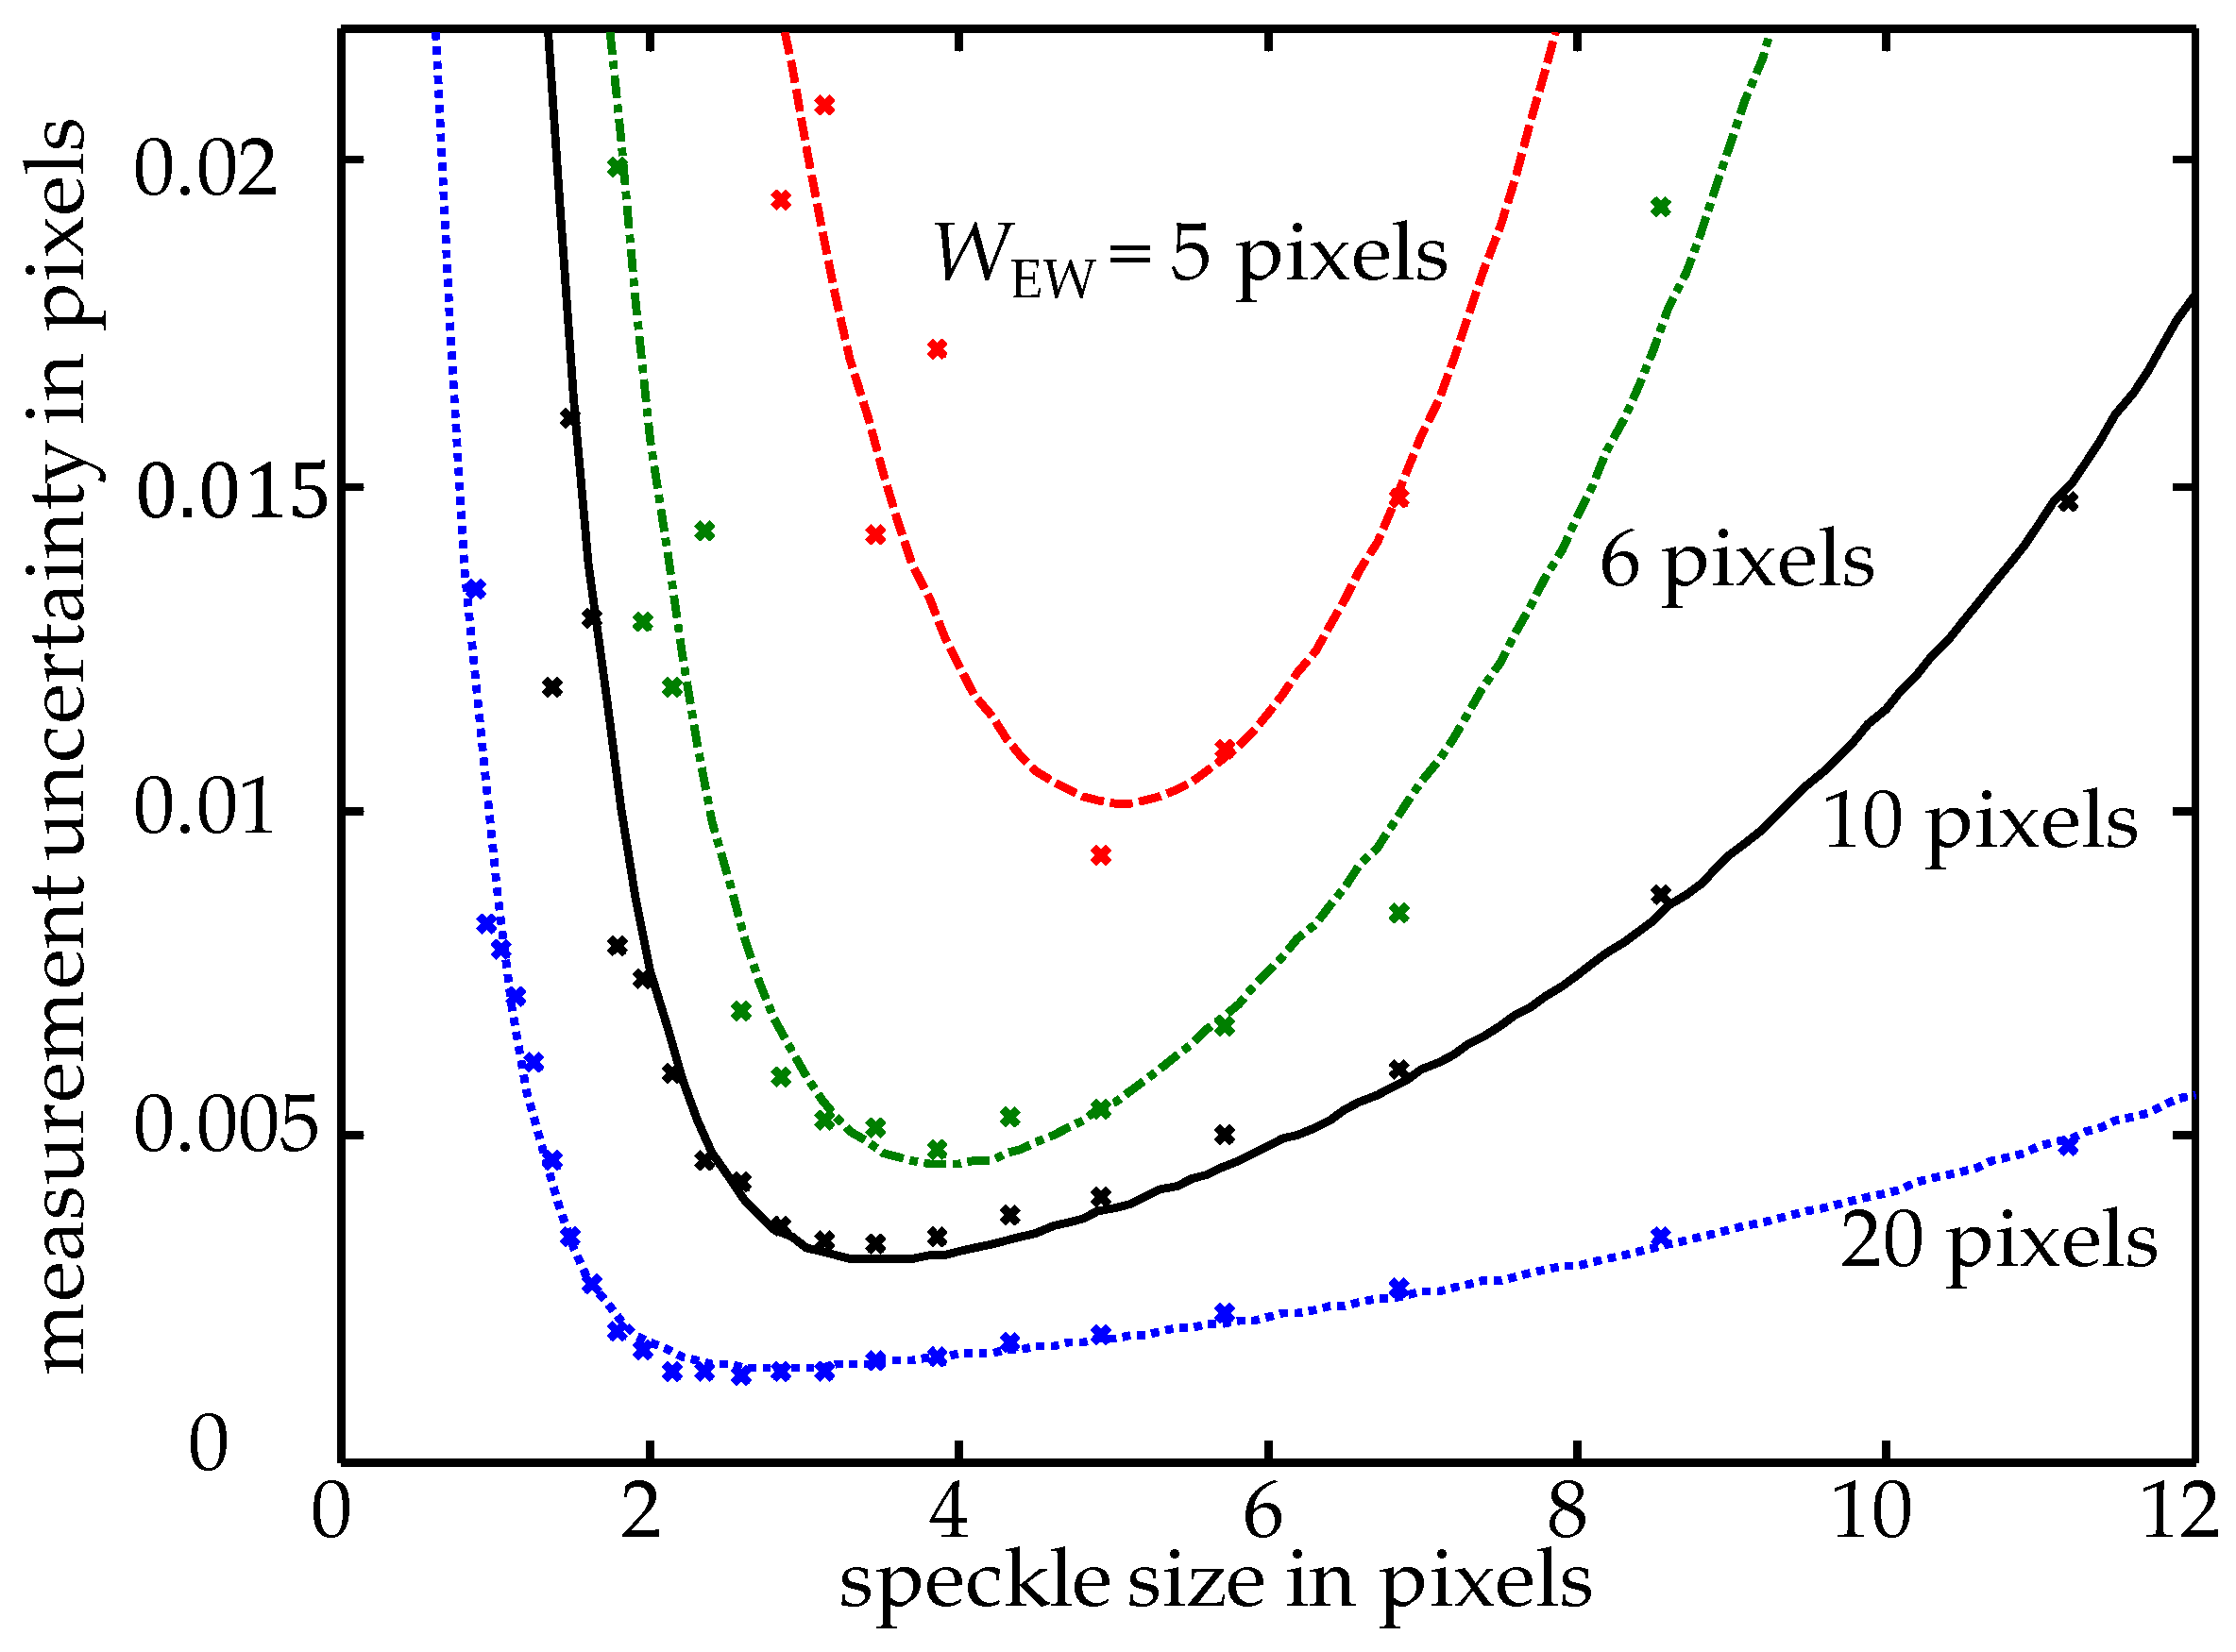
Figure 4.
Measurement uncertainty of Dpixel with respect to the evaluation window size WEW at a constant speckle diameter of σ = 3 pixels approximated with a reciprocal function of the squared window width WEW.
Figure 4.
Measurement uncertainty of Dpixel with respect to the evaluation window size WEW at a constant speckle diameter of σ = 3 pixels approximated with a reciprocal function of the squared window width WEW.

Figure 5.
Measurement uncertainty of Dpixel with respect to the grayscale resolution (black solid curve) and the image noise (red dashed curve), in each case fitted with a power function.
Figure 5.
Measurement uncertainty of Dpixel with respect to the grayscale resolution (black solid curve) and the image noise (red dashed curve), in each case fitted with a power function.
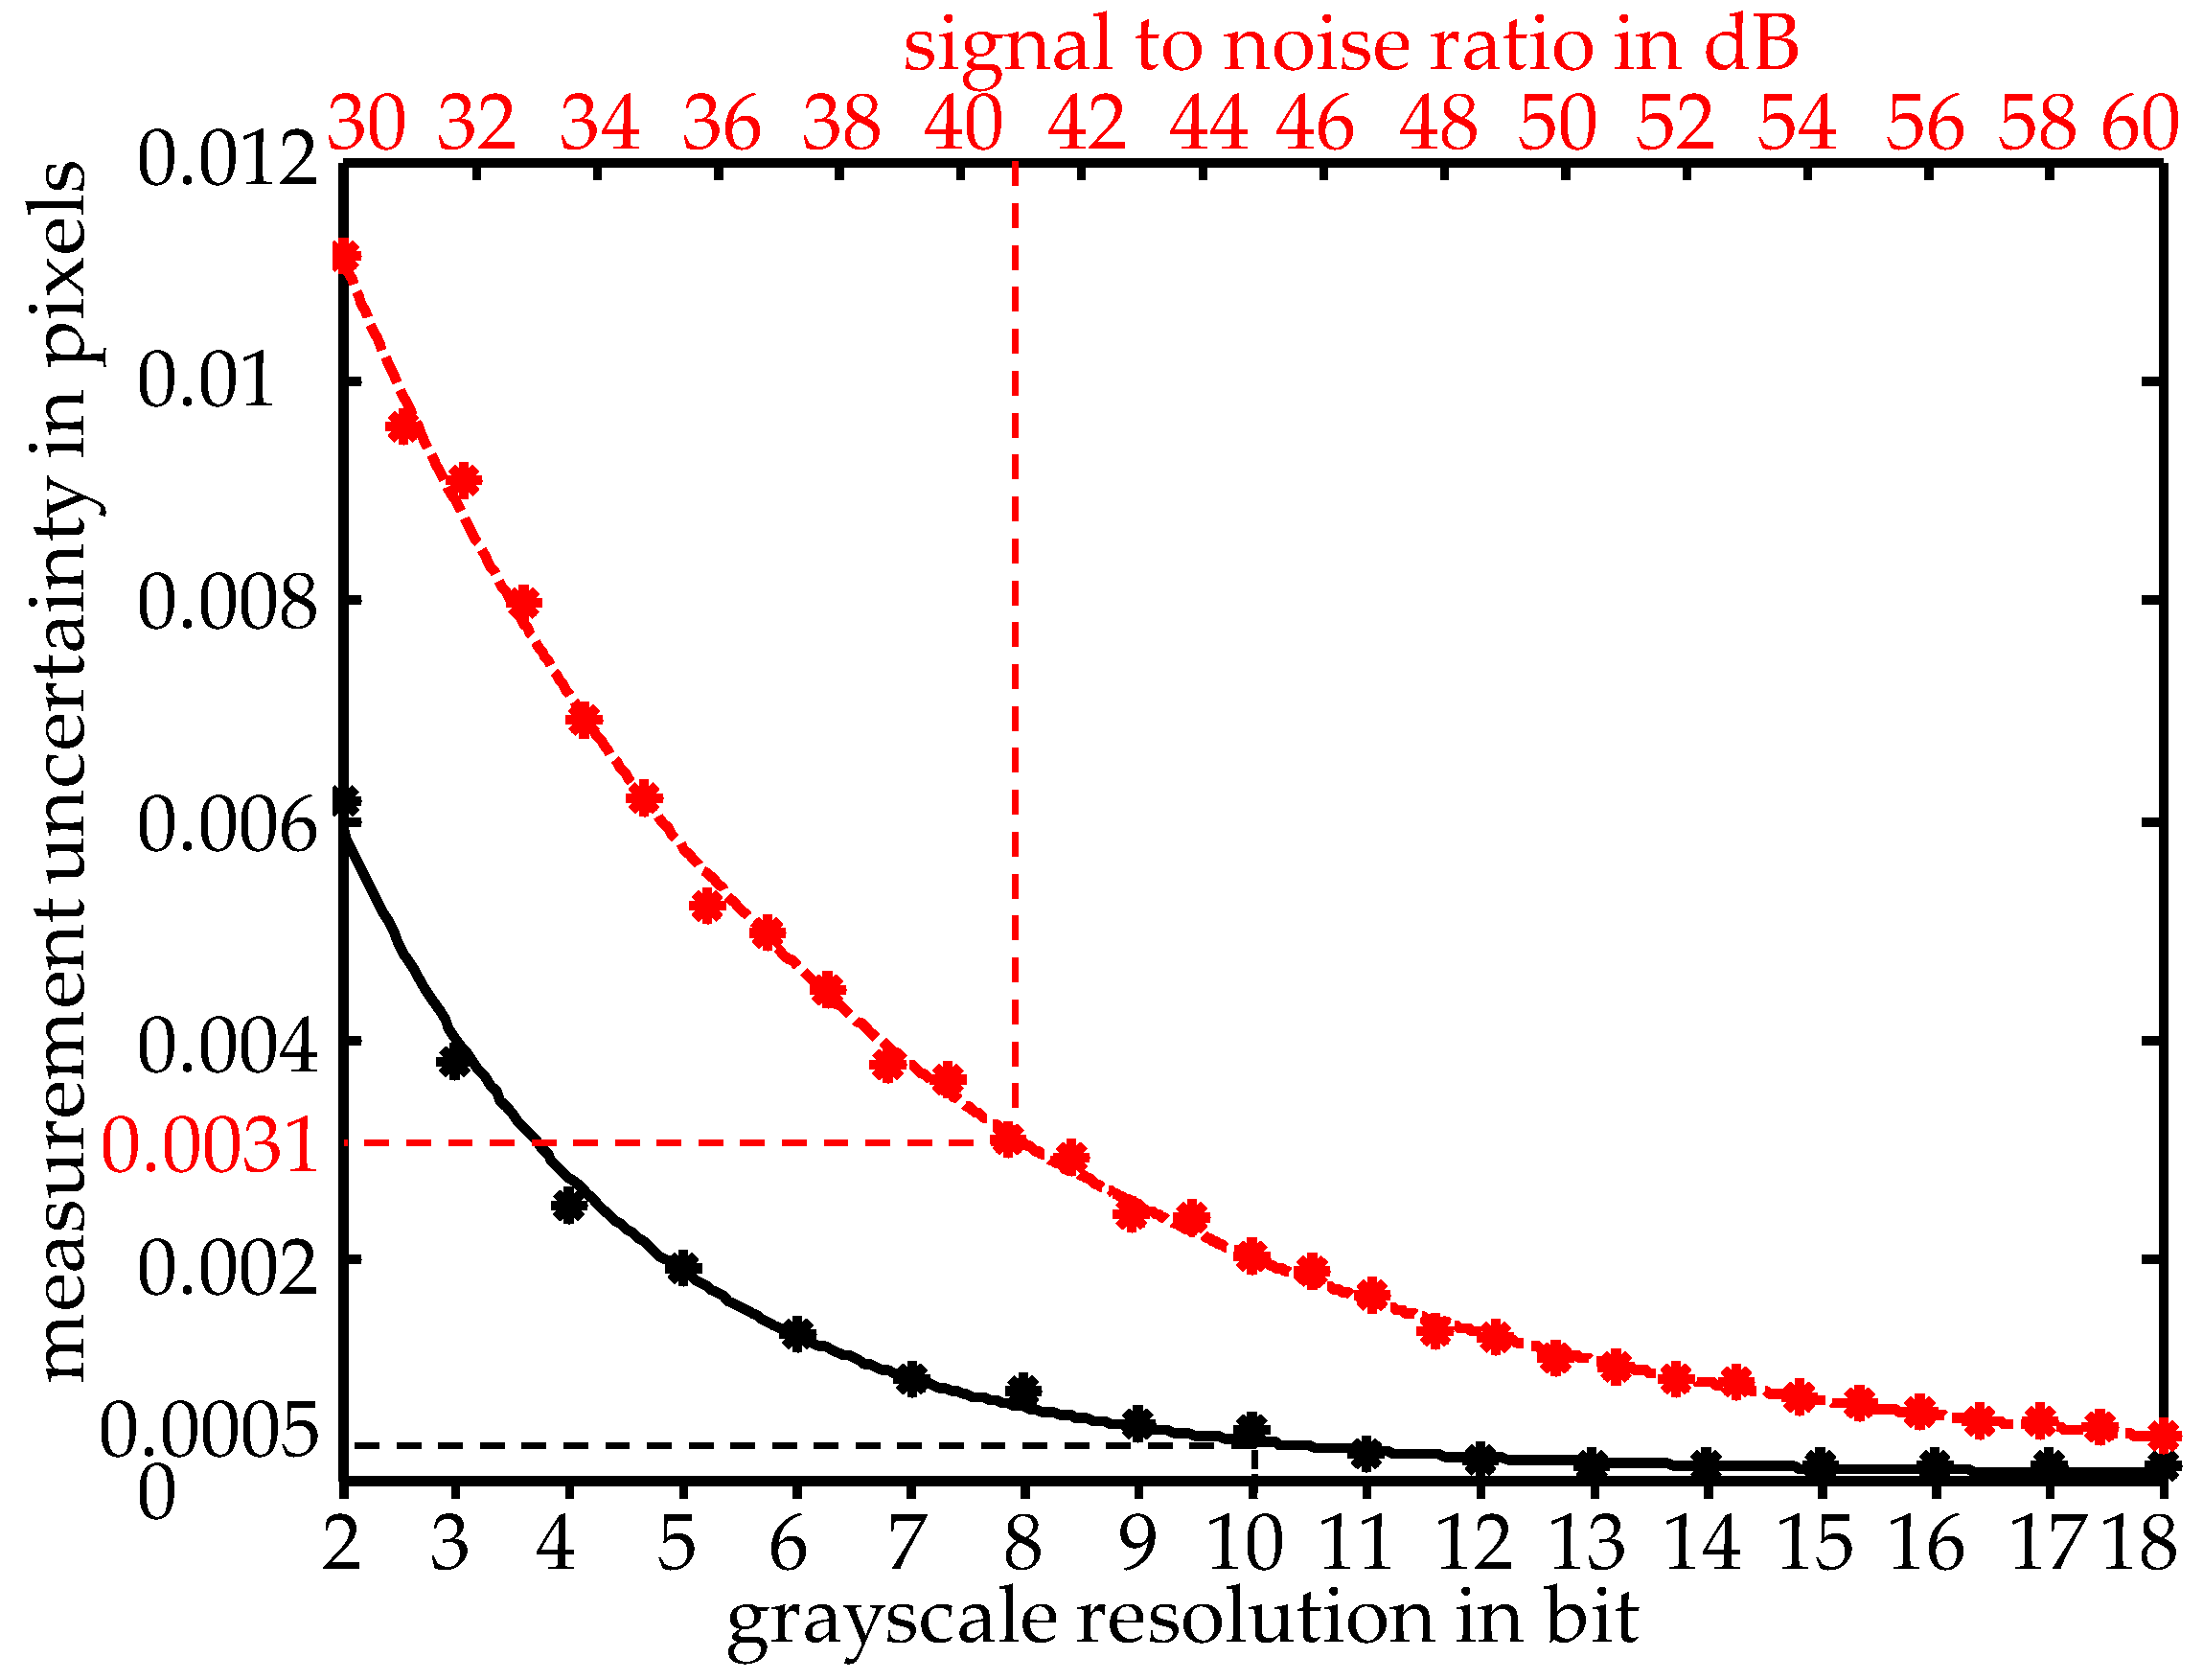
Figure 6.
Dynamic deformation and strain measurements in a single-tooth milling process.

Figure 7.
Remaining plastic deformation and strain measurements after cutting.
© 2018 by the authors. Licensee MDPI, Basel, Switzerland. This article is an open access article distributed under the terms and conditions of the Creative Commons Attribution (CC BY) license (http://creativecommons.org/licenses/by/4.0/).
Share and Cite
MDPI and ACS Style
Tausendfreund, A.; Stöbener, D.; Fischer, A. Precise In-Process Strain Measurements for the Investigation of Surface Modification Mechanisms. J. Manuf. Mater. Process. 2018, 2, 9. https://doi.org/10.3390/jmmp2010009
AMA Style
Tausendfreund A, Stöbener D, Fischer A. Precise In-Process Strain Measurements for the Investigation of Surface Modification Mechanisms. Journal of Manufacturing and Materials Processing. 2018; 2(1):9. https://doi.org/10.3390/jmmp2010009
Chicago/Turabian StyleTausendfreund, Andreas, Dirk Stöbener, and Andreas Fischer. 2018. "Precise In-Process Strain Measurements for the Investigation of Surface Modification Mechanisms" Journal of Manufacturing and Materials Processing 2, no. 1: 9. https://doi.org/10.3390/jmmp2010009