Article

Numerical Simulation of Water Quenching of Large Size Steel Forgings: Effects of Macrosegregation and Grain Size on Phase Distribution

1
Department of Mechanical Engineering, École de Technologie Supérieure, 1100 Notre-Dame West, Montréal, QC H3C 1K3, Canada
2
Finkl Steel-Sorel, 100 McCarthy, Saint-Joseph-de-Sorel, QC J3R 3M8, Canada
*
Author to whom correspondence should be addressed.
J. Manuf. Mater. Process. 2018, 2(2), 34; https://doi.org/10.3390/jmmp2020034
Submission received: 21 March 2018 / Revised: 18 May 2018 / Accepted: 23 May 2018 / Published: 1 June 2018

Abstract

:
In this paper, water quenching of large ingots was simulated using FORGE NxT 1.1® Finite Element code. Simulations were carried out for as-forged medium-carbon low-alloy steel. A novel method is proposed to simulate the different parts of a large size forged block with different chemical compositions and grain sizes using the multiple materials method. The effects of macrosegregation, grain size variation and cooling rate on phase distribution through the volume of the forged block were investigated. The delay in transformation kinetics, which is due to the effect of grain size variation and carbon content, was analyzed. Results show that macrosegregation and grain size variations significantly influence transformation start points and the volume fraction of phases that are present in each location of the forged ingot. The proposed prediction method was validated using high-resolution dilatometry experiments and X-ray diffraction measurements to evaluate accurately the volume fraction of martensite, bainite and the percentage of retained austenite for each condition.

1. Introduction

Large-size forged ingots, made from medium carbon high-strength steel, are extensively used as dies in the automotive industry [1]. Uniform microstructure and hardness through the thickness of the die is an important requirement by mold makers as the surface quality of the part is significantly affected by the mechanical and microstructural characteristics of the die material [2,3]. Therefore, it is of paramount importance to control the manufacturing process in order to obtain the optimum combination of mechanical and microstructural properties.
The medium carbon die steels are produced by ingot casting followed by open die forging before undergoing quench and temper operations [3,4]. The quenching step is very important, since it determines the final grain size, and significantly influences the final distortion, hardness, and mechanical properties [4]. Relatively homogeneous grain size and microstructure can be obtained on small- to medium-size forged blocks. In contrast, very large forged blocks, increasingly in demand by the automotive industry, have been characterized by the presence of macro segregated zones [5] and grain size variation [6] in the final product.
The above variabilities affect the phase transformation kinetics from austenite to martensite, bainite or pearlite during the quench operation and result in non-uniform microstructures and properties. The chemical heterogeneities due to macrosegregation and the variation in grain size are often reduced, in small-size ingots, through subsequent heat treatment and forging operations. However, the situation is much more complex for very large-size forgings and occasionally such defects require rework or may even result in scrapping of the part. On the other hand, due to the stringent quality requirements, non-efficient costly trial and error methods could not be adopted. Therefore, the development of efficient and reliable simulation methods that would predict the impact macrosegregation zones or variable grain size on phase proportions is an important necessity.
Over the past decade, several research works have been devoted to the modeling of phase transformation during water-quenching [7,8]. However, most of them have been focused on calculation of Continuous Cooling Transformation (CCT) diagrams and hardness uniformity [7,9]. Time Temperature Transformation (TTT) or CCT diagrams are important tools to predict microstructure evolution during quenching by allowing the identification of phase boundaries of ferrite, pearlite, bainite, and martensite as a function of cooling rate [10]. In addition to the cooling rate, phase domains and boundaries are also influenced by grain size and chemical composition whether local or global.
A combination of Avrami [11] model, Koistinen-Marburger (K-M) equation [12] and Scheil additivity rule [11,12,13,14,15] have been used to predict phase transformation start and finish temperatures, residual austenite, bainite and martensite transformations as well as grain size variations and carbon content during the cooling process. However, little information is available on the influence of chemical heterogeneity and grain size variation on the volume fraction of the phases during the cooling process of large-size forged blocks [10,13]. Experimental determination of the volume fraction of phases during water-quenching of large blocks is not always possible due to the difficulty of obtaining samples from different sections of the forged slab. To this end, a simulation approach using the multiple-materials numerical method was employed in the present investigation. The method has been used and proven to be efficient for the analysis of manufacturing processes where different properties within the structure of one single part are considered. Specific examples are coextrusion, extrusion, forming of composite materials, and multi-layer rolling [14]. However, to the best knowledge of the authors, this is the first time that this method is used to simulate chemical and microstructural heterogeneities during the quenching process of a large-size forged block. In order to ensure a high level of accuracy and experimentally proven data, a systematic experimental analysis was also carried out in parallel with the simulation work.
Specifically, the present research work focuses on the effects of carbon content gradient and grain size variation on volume fractions of retained austenite, martensite and bainite through the entire volume of a 40-ton forged ingot. FE-based FORGE NxT 1.1® software [14] was used to carry out the simulation work and material physical data were obtained through experimentation, literature or JMatPro® software [16]. Dilatometry experiments simulating actual cooling rates inside the large-size forged block were carried out and in order to validate simulation results of electron microscopy (FE-SEM), as well as X-ray diffraction to determine grain size and the nature and proportions of the different phases.

2. Mathematical Models for Finite Element Analysis

The energy equation for three-dimensional transient heat conduction of a large-sized ingot during water quenching can be described by the following partial differential equation [17]:
x ( λ T x ) + y ( λ T y ) + z ( λ T z ) + q ˙ = ρ c p T t
where λ, ρ and c p are thermal conductivity, density and specific heat, respectively. These thermo-physical parameters are temperature-dependent. The quantity of heat released due to phase transformation [17] which is included in Equation (1) as a heat source is given by:
q ˙ = H · f t
where ∆f, ∆H are respectively the volume fraction, latent heat during an arbitrary time step ∆t.
In the finite element analysis, thermo-physical properties of the phase mixture was approximated by a linear rule of mixture. Thus, any material properties such as density, thermal conductivity, specific heat during transformation of kth constituent of the phase mixture (i.e., austenite, bainite, pearlite or martensite) at a given time step was calculated by:
P ( T , f k ) = k = 1 n P k ( T ) f k
where the summation is performed over the total number of phases present. The term P represents an overall thermal property of the mixture, P k ( T ) is the temperature dependence of the material property of phase k , and f k is the volume fraction of kth constituent.
In this study, the density, thermal conductivity, specific heat and latent heat of each phase were determined using JMatPro® software. The thermo-physical properties of the investigated material are provided in Appendix A.

2.1. Prediction of Phase Fraction

During the quenching process of the large-sized forged block, diffusion-controlled (austenite to ferrite) and non-diffusive type (martensitic) transformations take place in the material. In the case of diffusion-controlled transformation, the volume fraction of the transformed phase was calculated using Scheil’s additivity rule and the Avrami equation [11,15,18]. Specifically, this consisted of dividing the non-isothermal process of quenching into many isothermal segments and then using the TTT diagram of the steel, the fraction transformed was calculated for each segment. It can be understood in the non-isothermal quenching process the summation of the relative fraction reaches unity. Thus, Scheil’s additivity rule is expressed as:
i = 1 n t i t i ( T ) = 1
where τ i ( T ) and t i are the incubation periods under a certain isothermal temperature T and time step, respectively.
The modified form of Avrami equation in which the incubation period is included can be written as:
f i = f m a x [ 1 exp ( b t n ) ]
In the above equation f i and f m a x are the volume fraction and maximum possible transformed volume fraction at time and temperature increment i, respectively. Avrami’s coefficients n and b are functions of temperature.
The concept of the virtual time ( t i * ) and transformed volume fraction ( f i * ) are generally used to explicitly determine the transformed fraction at the time step i. These two variables are usually calculated by the following equations [17]:
t i * = [ ln ( 1 f i 1 ) b i ] 1 n i
f i * = 1 exp ( b i ( t i * + t ) n
Hence, the actual volume fraction is [17]:
f = f i * ( f r i 1 * + f i 1 ) f m a x
Thus, using Equation (7), it is possible to calculate the total volume fraction of the phases transformed by diffusion-controlled process. In the investigated steel, f i * represents the volume fraction of bainite and f r i 1 * that of the retained austenite, at the time iteration i 1 , respectively. The maximum possible transformed volume fraction, f m a x , was also calculated based on a TTT diagram generated by JMatPro®.
The volume fraction of the non-diffusive type transformation (i.e., martensite) was calculated using the Koistinen-Marberger relation [12,15,19]:
f = 1 exp ( α ( M s T ) )
where, M s is the start temperature of martensitic transformation and α is a material constant and varying with the steel composition.

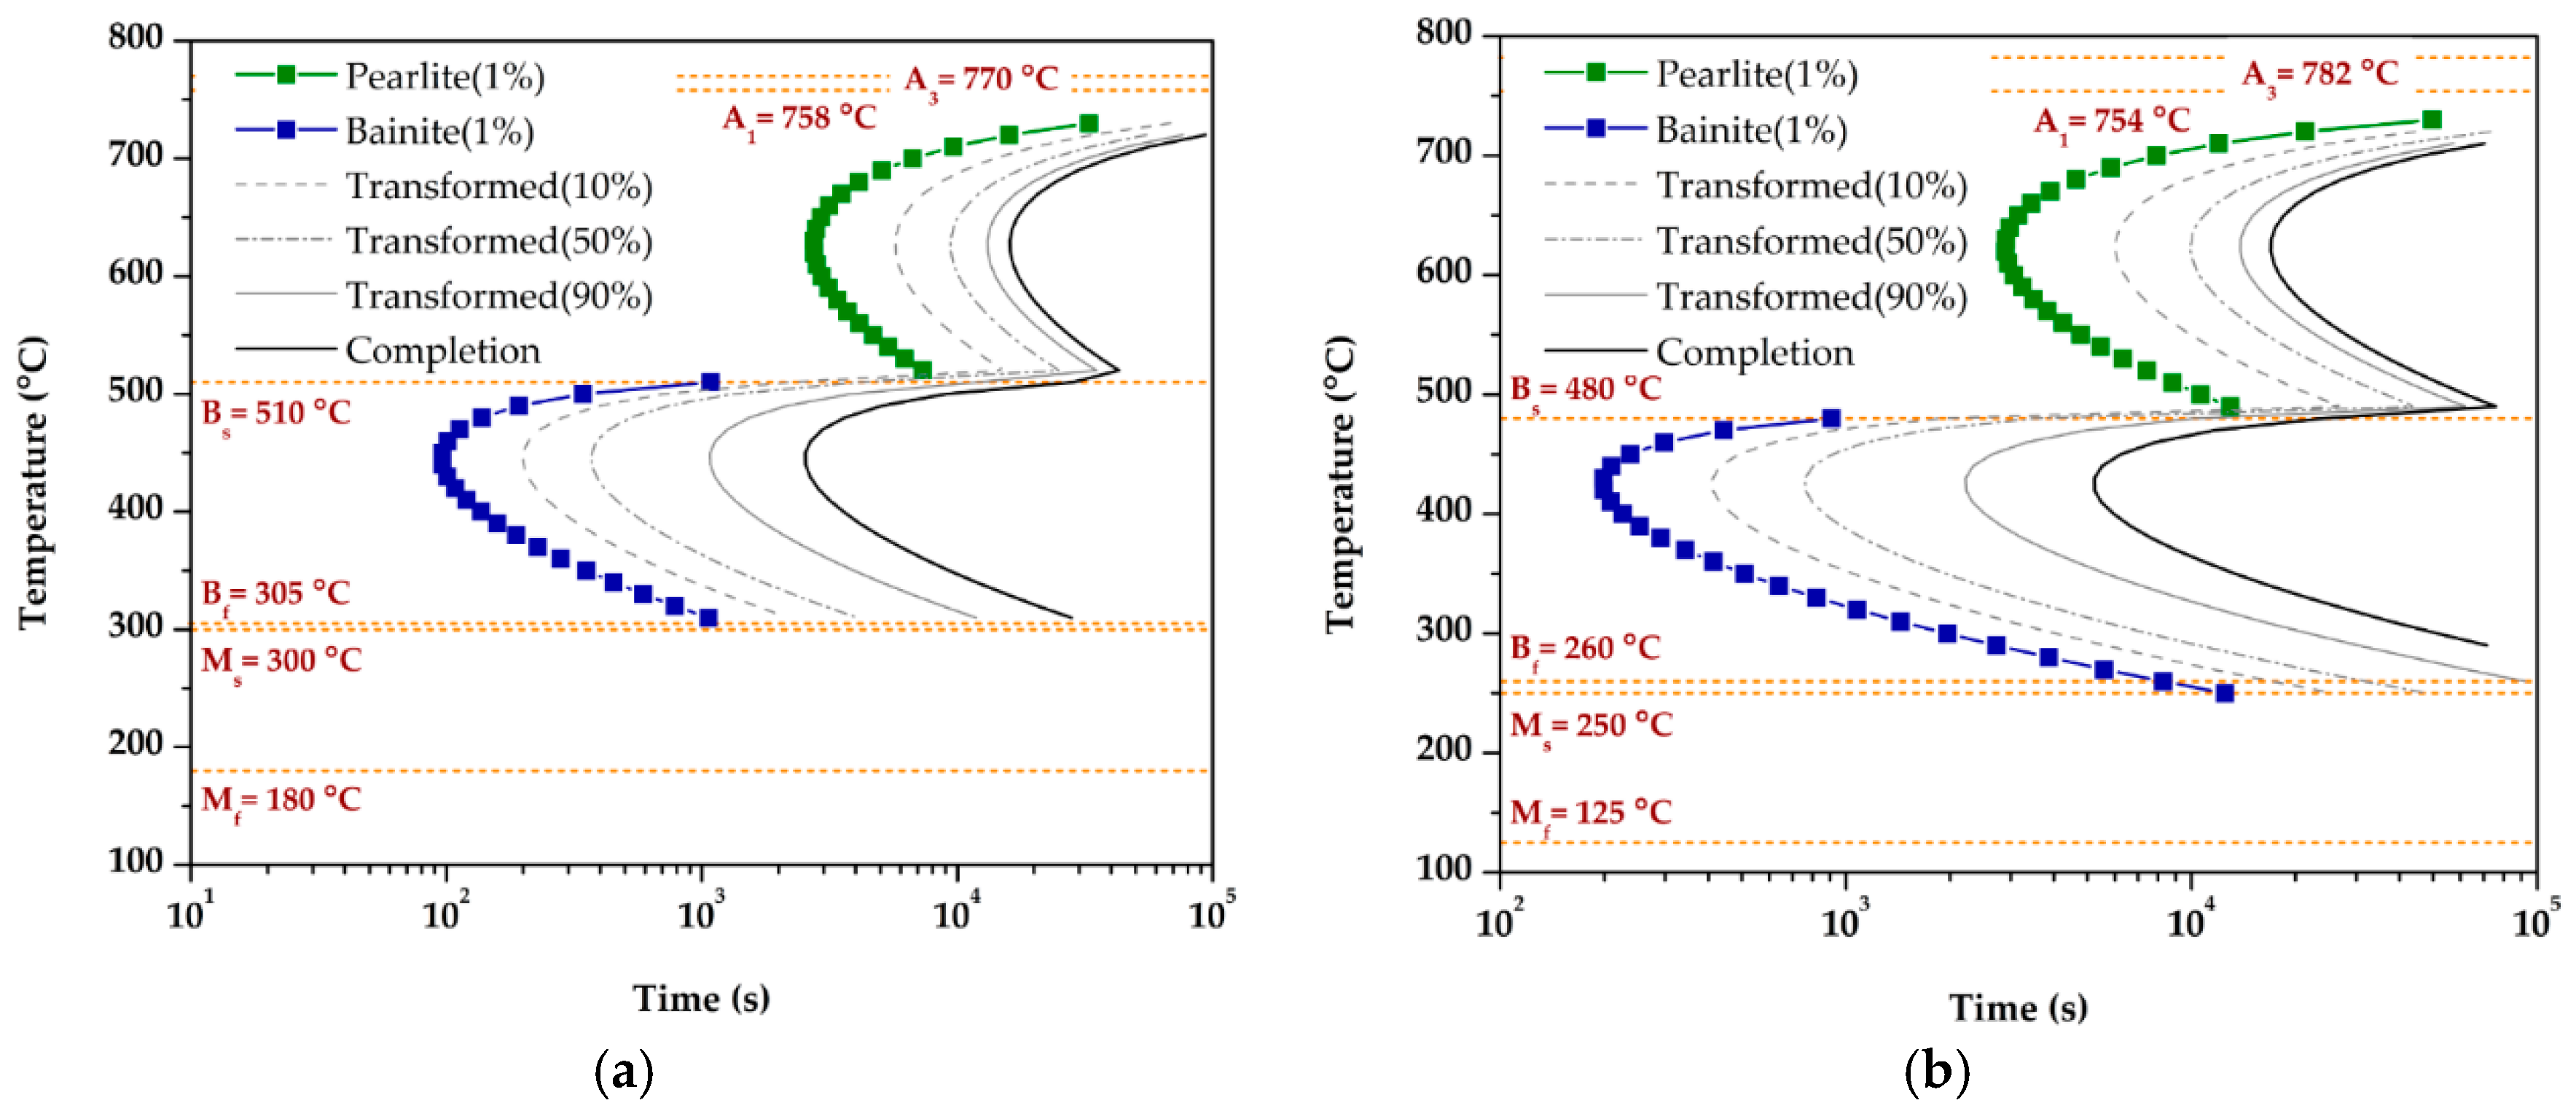
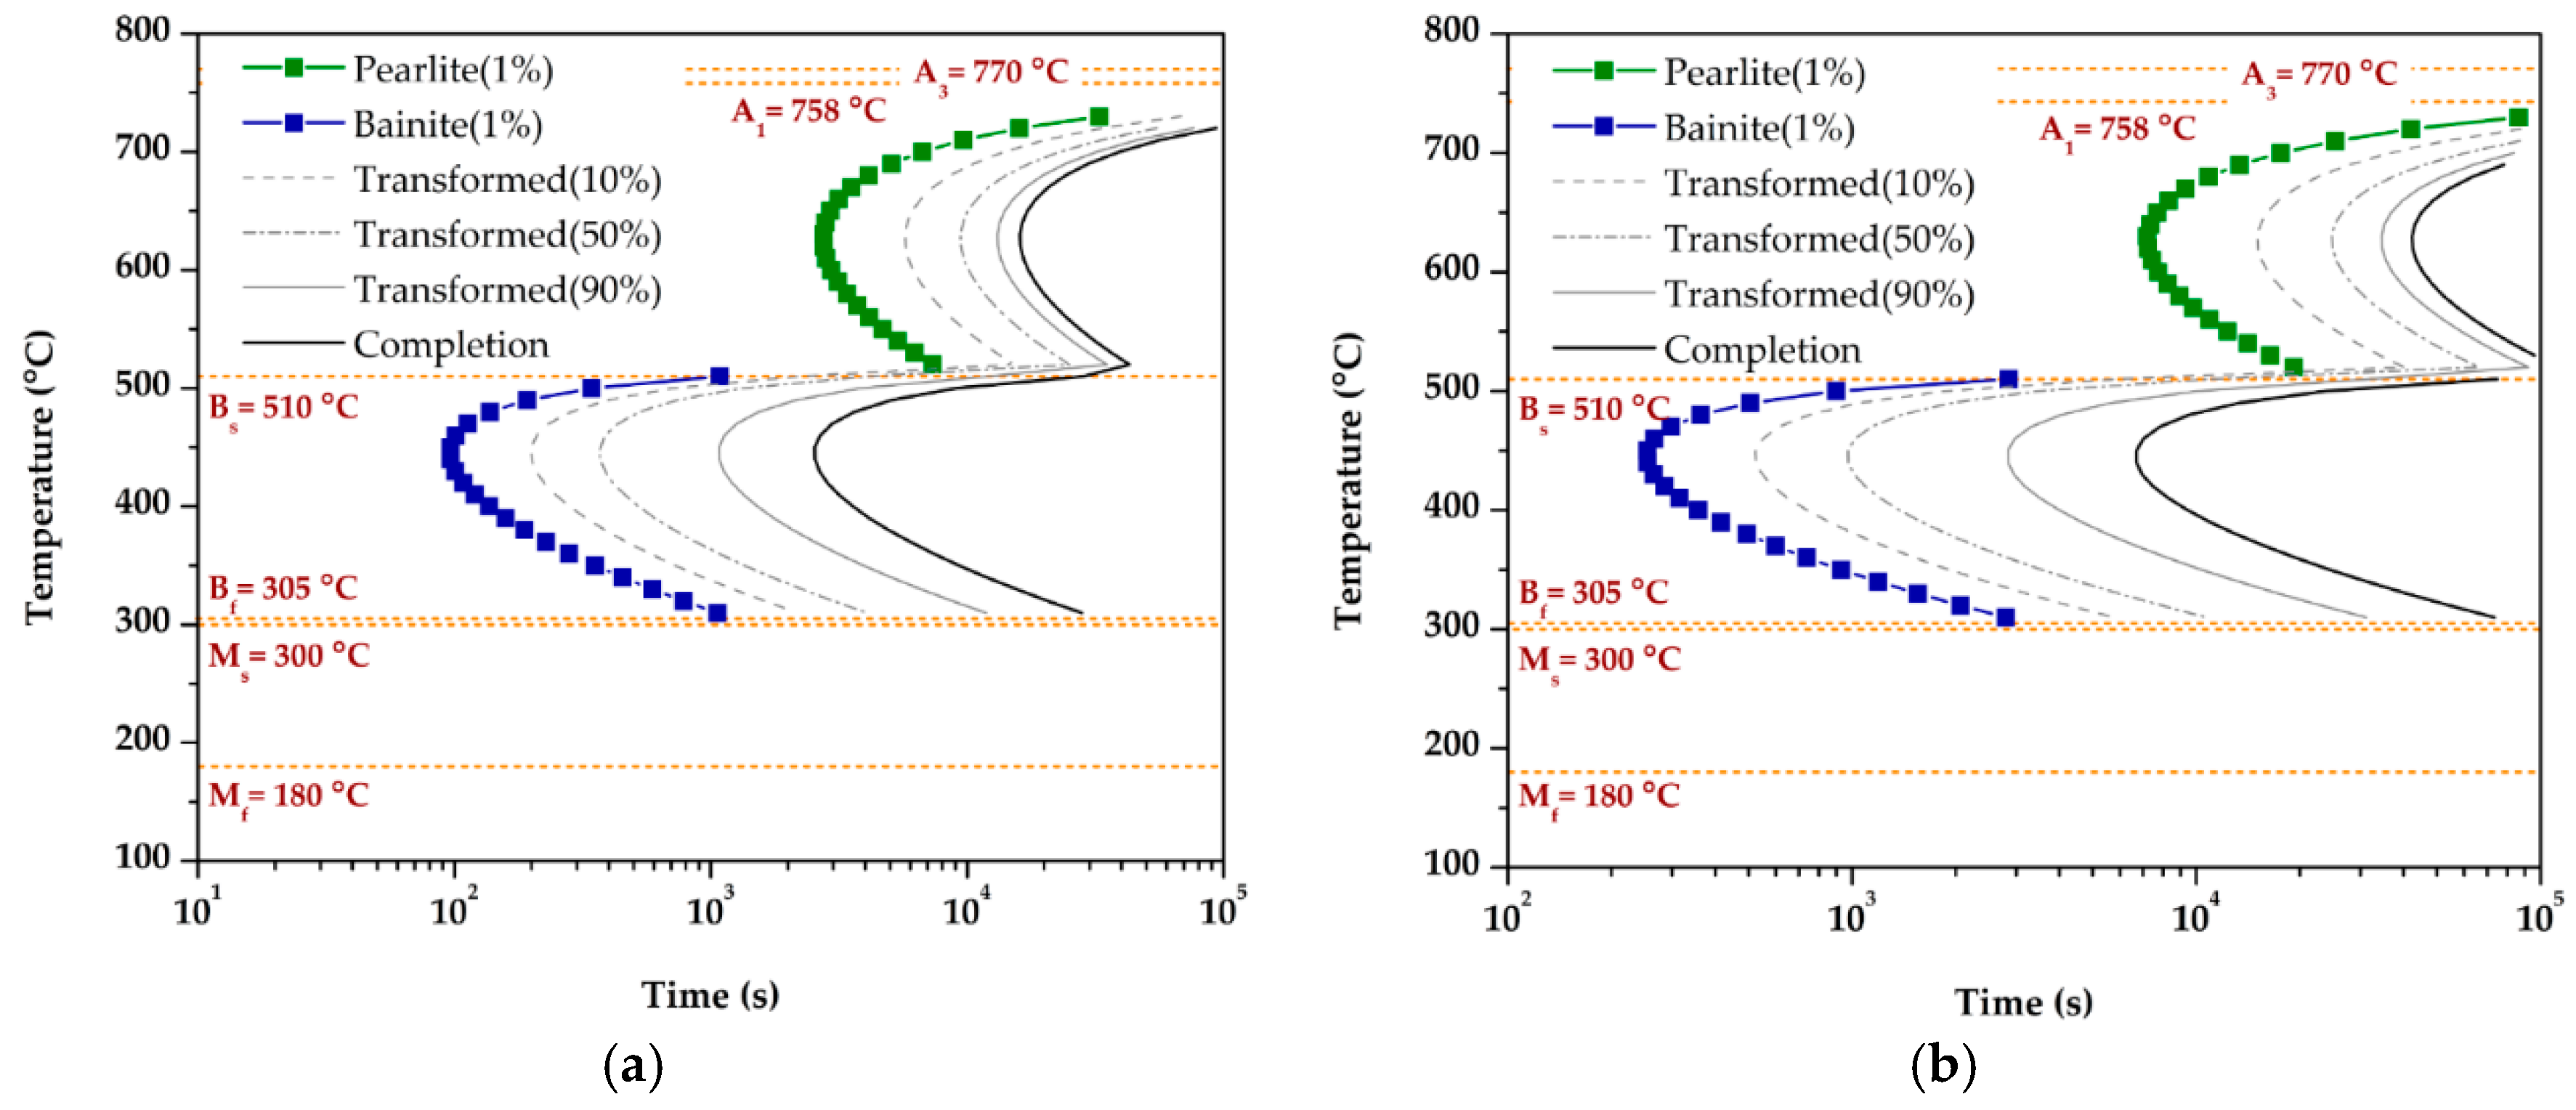
2.2. Transformation Kinetics

For the non-isothermal process at any temperature, the modified Avrami’s coefficients, n(T) and b(T), were used to predict the fraction of the phase transformed. For a given temperature T, it is necessary to know the incubation time and two points of the kinetic transformation curve in order to determine Avrami’s parameters. These two parameters are usually calculated from the obtained TTT diagram by the following equations [19]:
n ( T ) = l n [ l n ( 1 10 % f m a x ( T ) ) l n ( 1 90 % f m a x ( T ) ) ] l n ( t 10 % ( T ) t s t a r t ( T ) t 90 % ( T ) t s t a r t ( T ) )
b ( T ) = l n ( 1 10 % f m a x ( T ) ) ( t 10 % ( T ) t s t a r t ( T ) ) n ( T ) = l n ( 1 90 % f m a x ( T ) ) ( t 90 % ( T ) t s t a r t ( T ) ) n ( T )
The transformation starting time, t s t a r t ( T ) (approximate as 1% transformation) and ending time (e.g., t 10 % ( T ) , t 90 % ( T ) or t 99 % ( T ) ) are obtained from the TTT diagram. It should be noted that the CCT curve can be also approximated by Avrami equation and Scheil’s additivity rule model. JMatPro® software was used to generate both TTT and CCT curves which were then used as input into the modified form of Avrami equation. TTT diagrams depend on the steel composition and the austenite grain sizes which were experimentally measured according to ASTM E3-11 Standard [20]. The as-forged medium-carbon low-alloy steel was provided by Finkl steel, Sorel, Quebec, Canada. The chemical composition of the material is shown in Table 1.
The TTT curves and the critical transformation temperatures for different carbon contents or grain size are illustrated in Figure 1 and Figure 2. It can be seen that, the transformation temperatures and the duration of the phase transformation, in particular martensite and bainite start and finish temperatures, Ms, Mf, Bs and Bf, vary with carbon concentration or grain size. The increase in carbon content results in lower critical transformation temperatures while the transformation starting time decreases with the decrease in grain size.

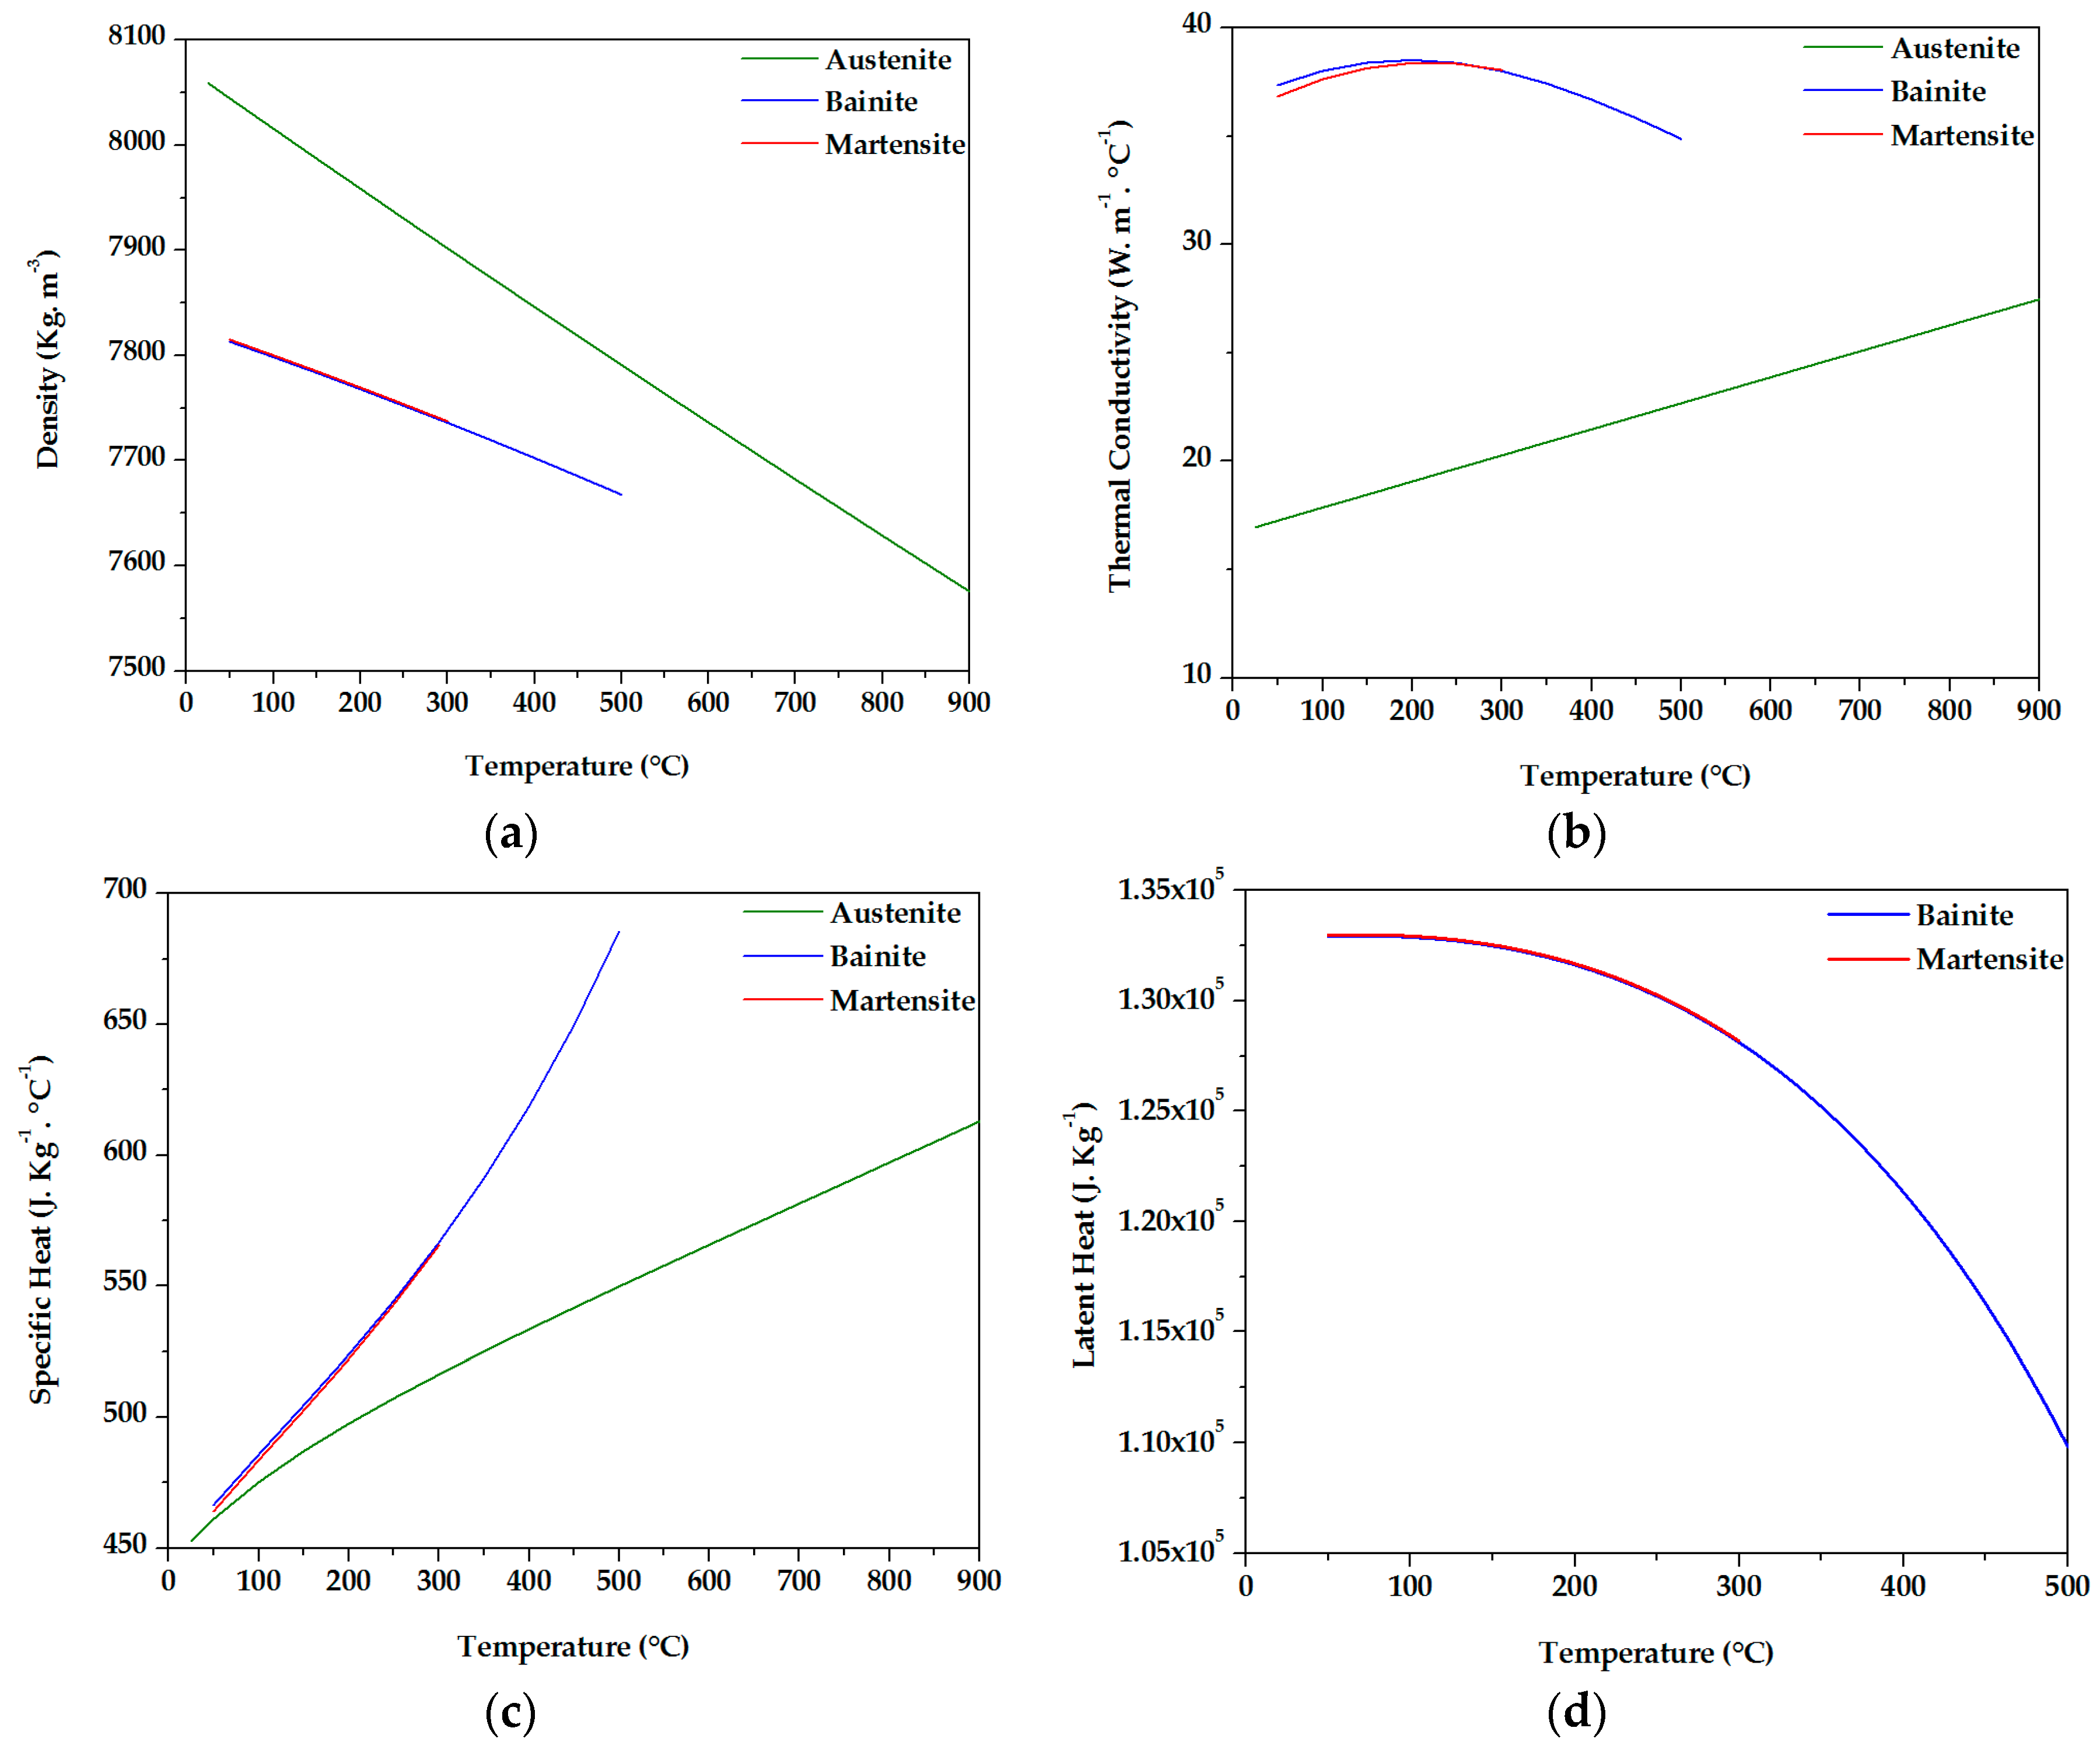
2.3. Model Buildup and Input Data

Simulation of the water-quenching of a 40-ton forged ingot was performed using 3D FEM FORGE NxT 1.1® software. Here, it is worth nothing that the dimensions of the forged block are 2540 × 1270 × 1016 mm3. Because of the symmetry, only one eighth of the geometry of the ingot was considered, and the symmetry faces were set as adiabatic boundaries (see Figure 3). Austenitizing temperature for the ingot was assigned at 900 °C and then the block quenched in water at 25 °C.
As discussed, in order to consider the presence of gradients in grain size and carbon content between the surface and the center, the multiple materials module of FORGE NxT 1.1® software was used [14]. Using this tool, it was possible to create a part with several zones, each one represents a specific material with distinct properties. The discretized FE model with five zones is shown in Figure 4.
Therefore, for each region, the computation differs according to the selected material file [21,22]. It must be noted that in order to reduce the computational cost, the mechanical contact conditions between different zones were neglected. This simplification does not introduce any errors in the present investigation as only thermal aspects are considered in the analysis. The variations of the grain size and carbon concentration associated with each simulation condition are given in Table 2. The properties of the referred zones such as grain size and carbon concentration are provided in Table 3.
Three-dimensional volume meshing using tetrahedral elements were used for the discretization of the forged block. Mesh sensitivity analyses were conducted to optimize the dimension of the elements in order to establish both high accuracy and a reasonable computational cost of the simulation results. Fine tetrahedron meshes (1 mm) were used on the surface while for the inner domain mesh sizes of up to 5 mm were used.
The emissivity of the steel alloys is generally temperature-dependent. The emissivity over the temperature range of 25 °C to 1000 °C was assumed to vary linearly between 0.2 and 0.7, respectively [23,24].
In the water-quenching stage, a coupled computation of the metallurgical changes and thermal field was carried out by considering the latent heat of transformation for each phase. Thermal exchanges including convection between the circulating water and the block were also implemented in the FE model. However, the convective transfer due to fluid motion induced by buoyant and thermocapillary forces was neglected in the simulation. Recorded temperatures at different positions of the ingot provided the approximate value of the heat transfer coefficient used in the simulations. Then a range of convective heat transfer coefficients from 200 W · m 2 · K 1 to 22,000 W · m 2 · K 1 were used to determine the one that predicted with the best accuracy phase distributions after the quenching process. A heat transfer coefficient value of 800 W · m 2 · K 1 was obtained between the workpiece surface and the quenching media. The obtained value is also in agreement with those reported by other researchers in the literatures [17,22,25,26,27]. It should be noted that one of the reasons for this selection is related to the large surface of the component which significantly increases the temperature of the fluid surrounding the block.
The experimental validation procedure consisted of dilatometry experiments simulating the thermal cycling during the quench process using thermo-mechanical simulator Gleeble 3800®, microstructure examination using electron microscopy (Hitachi 8230 FE-SEM) to determine the nature of the different phases, and the proportion of the phases were determined using X’Pert3 MRD PANalytical X-ray diffractometer.

3. Results and Discussion

3.1. Effect of Carbon Contetnt

Figure 5 shows a comparison of the obtained results for conditions (A) and (B) where only the influence of changes in carbon concentration on phase distribution is illustrated. It can be seen that the outer zone (i.e., surface) has a high martensitic volume fraction and the inner zone of the block has a high bainite volume fraction. The results also show that martensitic transformation has been more important in the corners of the ingot for condition (B) as compared to condition (A). In contrast, a significant change in the volume fraction of bainite on the corner and in the center of the block is observed between conditions (A) and (B).
A detailed analysis of the above observations on the evolution of the phases is presented in Figure 6. The results of condition (A), (dashed lines in Figure 6), where both uniform grain size and chemical compositions were assumed, show that in the first 40 mm from the sample surface, the austenite phase has been transformed to 100% martensite. Between 40 mm to 120 mm depth from the surface, the fraction of martensite decreased to nearly 9% while that of bainite increased to approximately 90% and retained austenite content of 1%. From 120 mm to 160 mm depth, the microstructure is composed of 99% bainite with a much lower amount of martensite (0.9%). From 160 mm down to the center of the forged block, the microstructure remains nearly fully bainitic (99%) with the rest being residual austenite.
In contrast to above, when a variable carbon concentration is considered condition (B) solid line (Figure 6), it can be seen that in the first 40 mm from the surface of the block, phase distribution consisted of 84% of martensite, 15% of bainite and 1% of retained austenite. From 40 mm to 120 mm depth, the fraction of martensite decreased to 32% and the fraction of bainite increased from 15% to 67%. As the distance from the surface increases from 120 mm to 160 mm depth, the microstructure becomes much richer in bainite (93%) and leaner in martensite (7%). From 160 mm depth and to the center of the forged block, the microstructure was composed of nearly fully bainitic (99% bainite) and the remaining is considered to be being retained austenite.
The observed differences in the distribution of the phases between conditions (A) and (B) can be interpreted in terms of the influence of carbon concentration in austenite. In fact, an increase in the carbon concentration in austenite leads to a decrease in the bainite start temperature Bs [25], and therefore longer time will be needed for carbon to diffuse away from the interface [28]. This is probably the reason for the observed differences in the slopes of the curves of bainite volume fraction (plain and dotted lines in Figure 6) in the first 200 mm from the surface. Furthermore, the results also show that the ferrite formation, which occurs before the bainite transformation, has had no significant impact on the changes in the slope. This is probably because when carbon concentration is increased in the austenite, the ferrite transformation is delayed, which leads to a decay in the amount of polygonal ferrite formed before bainitic transformation. As a result, the impact of the polygonal ferrite formation on the bainite transformation will also reduce and therefore was not considered in the simulations [28]. For distances of 200 mm or above from the surface of the sample, bainite volume fractions were very similar in both simulations. This could be explained in terms of the precedence of bainite transformation over martensitic transformation at slower cooling rates (i.e., far from the surface zone) as also reported by other authors through experimental work on similar steels [10,29,30].

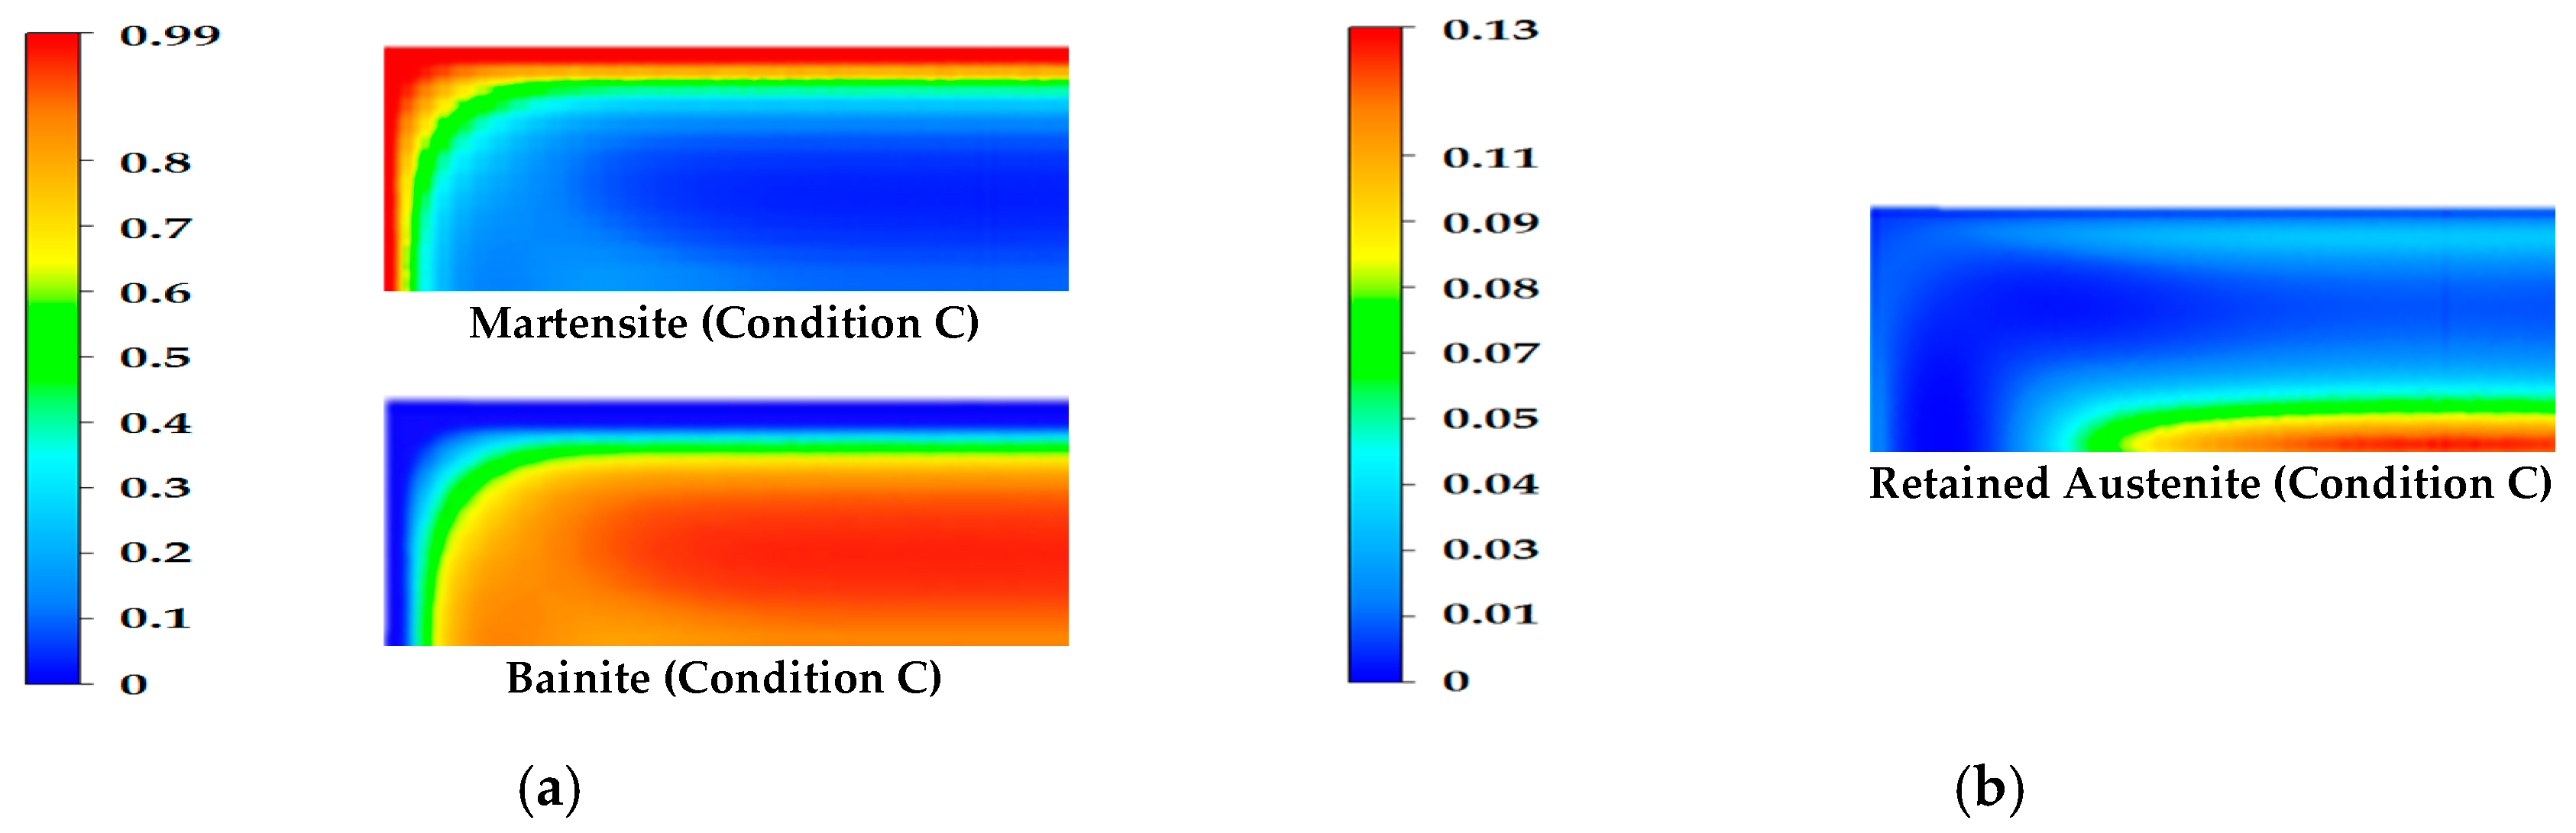
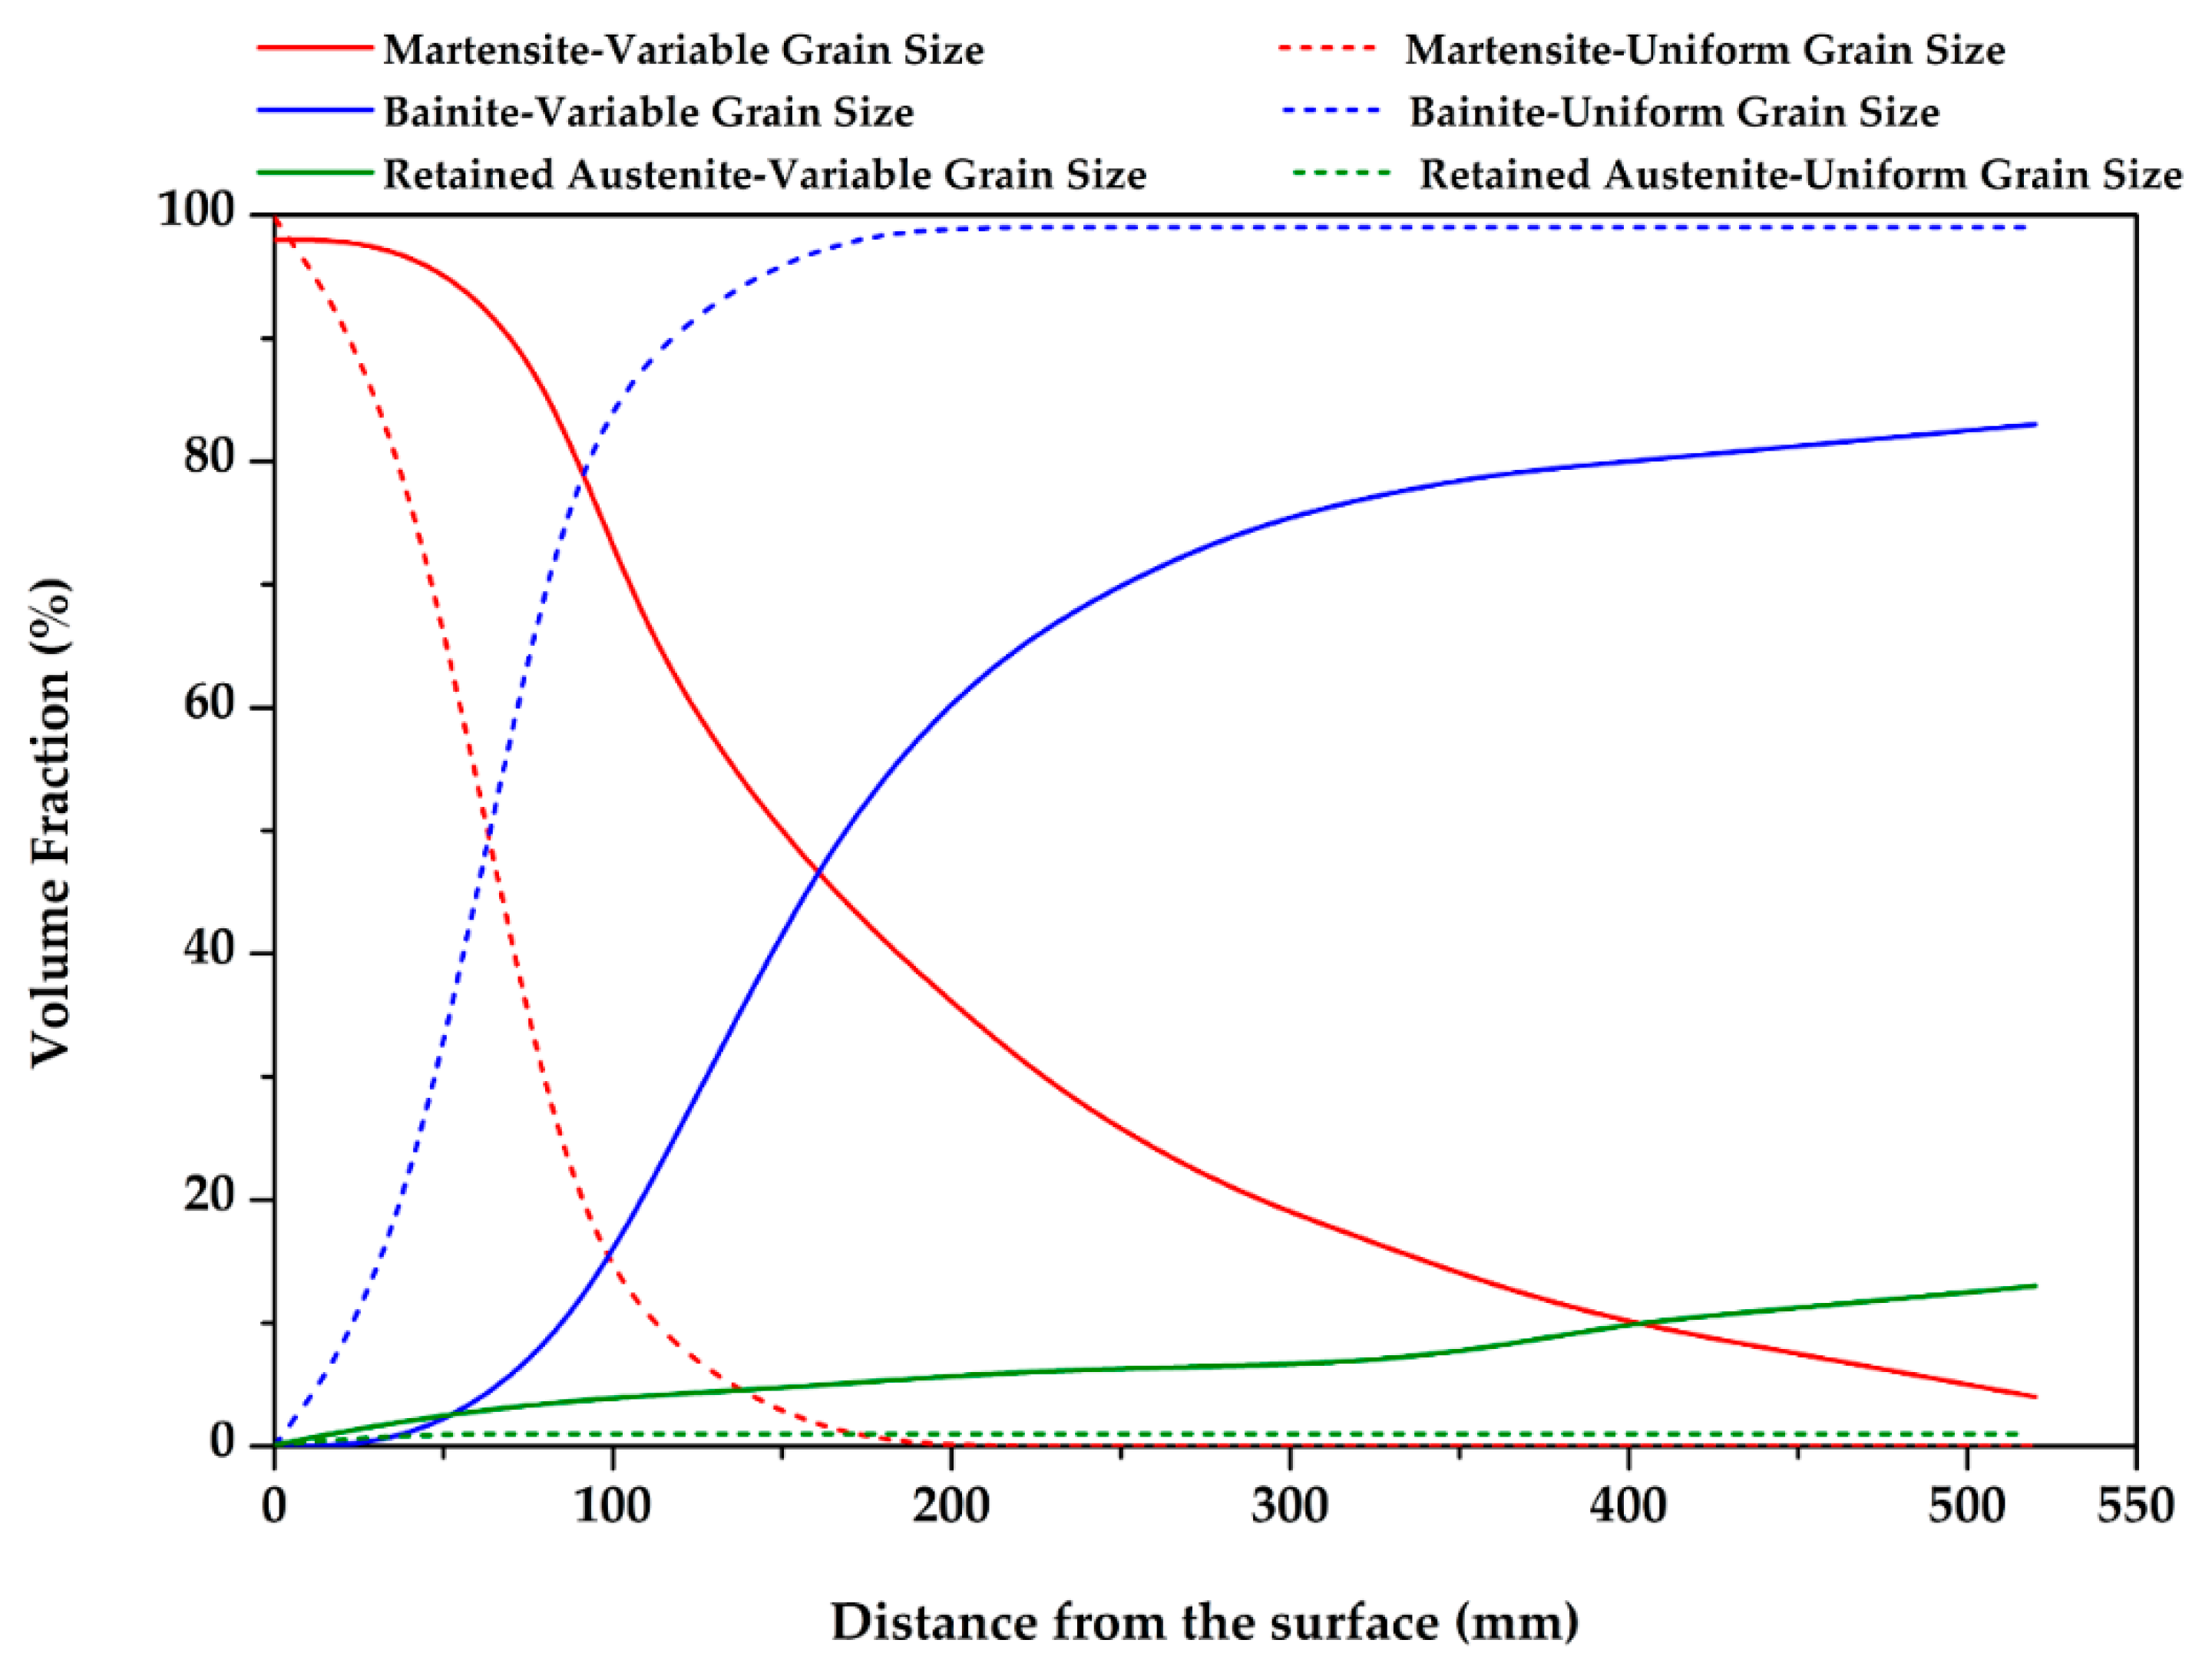
3.2. Effect of Variable Grain Size

The influence of variable grain size on distribution and volume fraction of phases was considered in condition (C) and the results are reported in Figure 7 where a comparison with condition (A) is also presented. The simulation results clearly reveal the significant dependence of the microstructure and volume fraction of phases on grain size. The obtained results are also in agreement with those reported by other researchers [31,32,33,34,35]. Specifically, it can be seen that the outer surface, with smaller grain size, has a higher martensitic volume fraction compared to the inner zones (larger grain size) where higher bainitic volume fraction is found. The results of condition (C) also show that the martensitic and bainitic transformations are more significant in the corners and in the center of the ingot, as compared to condition (A). In contrast, there is a remarkable change in the volume fraction of retained austenite in the center of the block as compared to condition (A) as detailed in Figure 8.
In Figure 8, it can be seen that in the first 40 mm from the surface of the block, phase distribution consists in about 98% of martensite, 1% of bainite and about 1% of retained austenite. From 40 mm to 120 mm depth, the fraction of martensite drops from 98% to 64% while the fraction of bainite increases from 1% to 20%. From 120 mm to 160 mm, the fraction of martensite decreases to 46% and the fraction of bainite and retained austenite move up to 48.5% and 5.7%, respectively. Finally, from 160 mm to the center of the forged block, the microstructure of bainite increase from 48.5% to 83%, retained austenite from 5.7% to 13%, and a small amount of martensite (4%).
The differences in the distribution of the phases between the two simulations indicate that the fast cooling rates in the surface region have promoted the formation of martensite (Figure 7). Moreover, the finer grain sizes in the surface (about 100 μm) compared to the center (about 300 μm) have also contributed to promoting the formation of martensite. Indeed, as reported by Wang and Hu et al. [36,37] a decrease in the grain size stabilizes the austenite phase and accelerates the transformation kinetics by providing more nucleation sites for the martensite. As the distance increases from the surface, the cooling rate decreases and the martensite volume fraction is reduced. In fact, the small amount of martensite observed in the center, shown in Figure 8, is due to software limitation. This is because in the CCT diagrams generated automatically by the algorithm based on grain size, chemical composition and the TTT diagram, the Ms, M50 and Mf temperature lines have been artificially extended to very low cooling rates. As shown above, the volume fraction of bainite in the center (i.e., coarse grain size region) is more important than the one in the fine-grained surface region. This result could be explained in terms of the role of grain boundaries on bainitic growth. As reported by Hu et al. [37], once nucleation is almost completed, grain boundaries act as obstacles to the growth of bainite sheaves. Therefore, bainite growth will be further hindered in presence of small grains than large ones. Moreover, the slow cooling rate in the regions far from the surface will provide more favorable conditions for the formation of bainite and retained austenite, as also reported by Matsuzaki et al. [34].

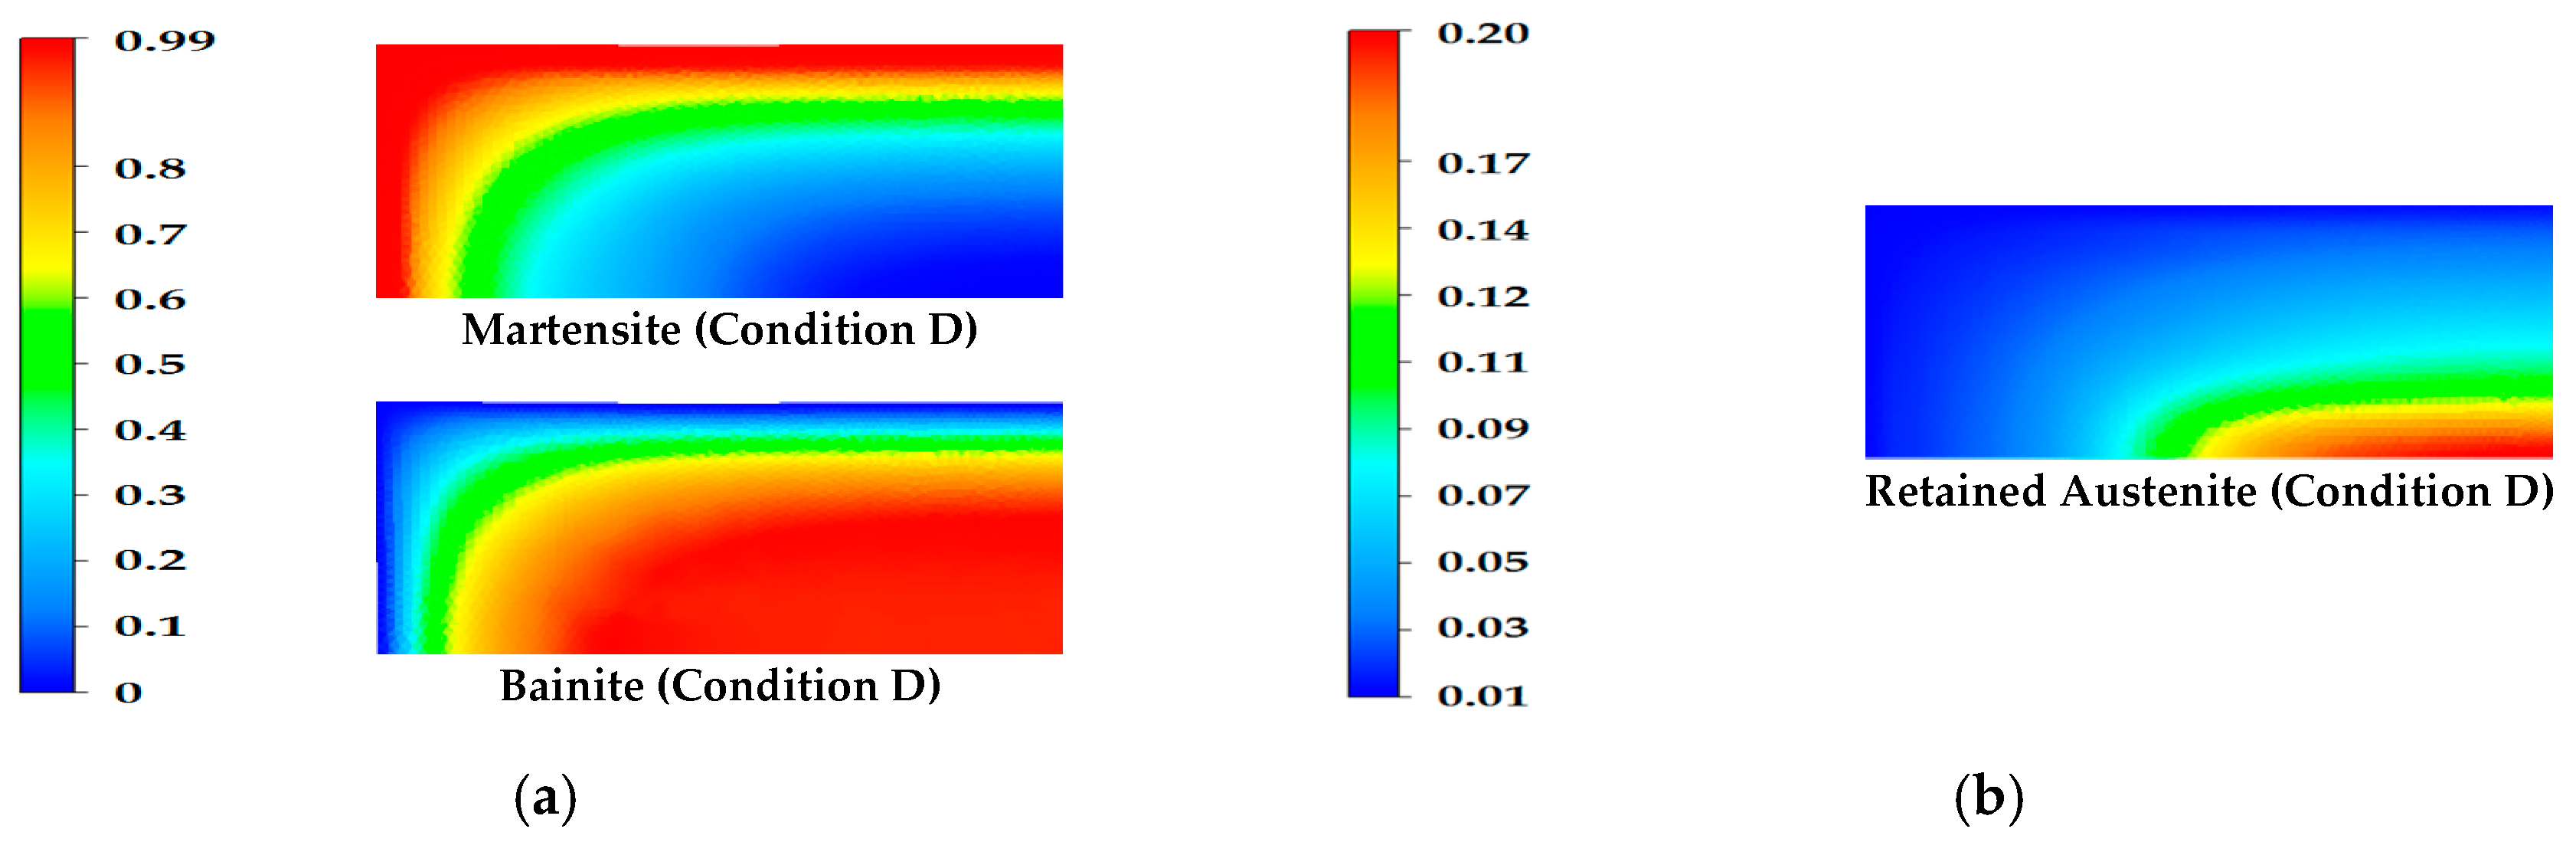
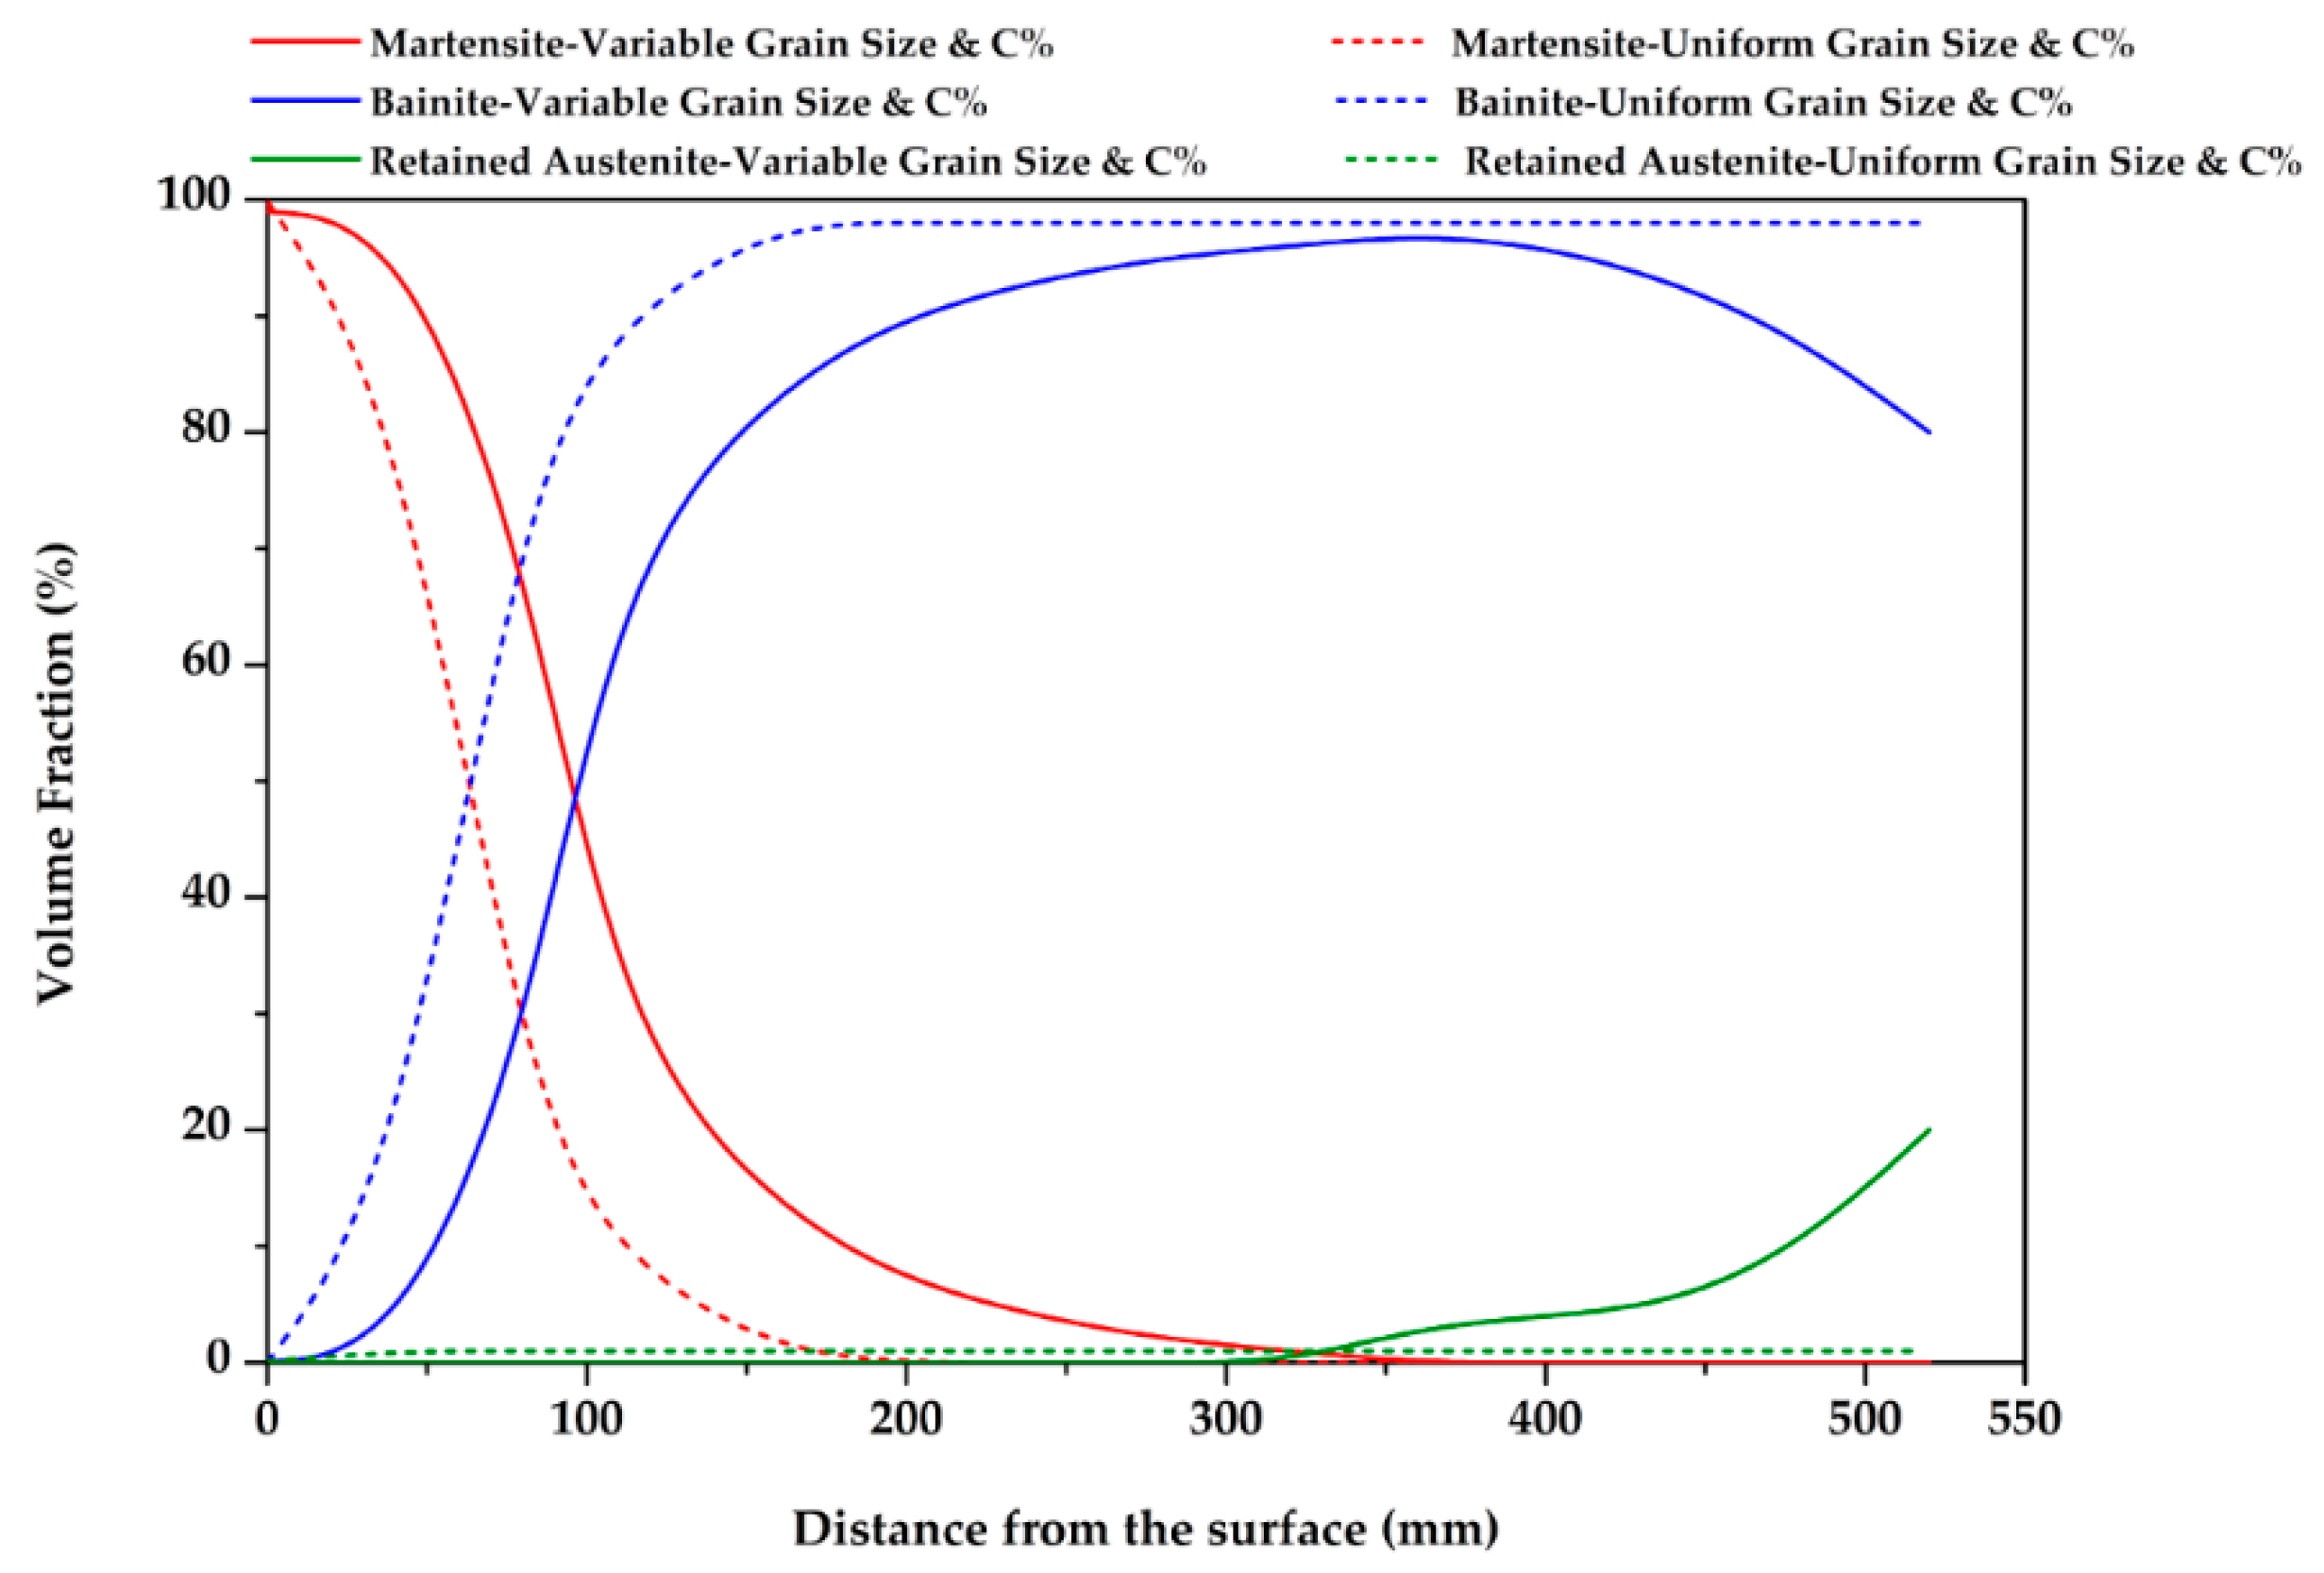
3.3. Effect of Variable Grain Size and Carbon Concentration

Figure 9 shows the simulation screen shots for martensite, bainite and retained austenite and their respective volume fraction maps for condition (D) (which represents the actual industrial case). The results indicate a martensitic microstructure in the outer surface, a combination of martensite and bainite in the mid thickness, and a microstructure composed of bainite and retained austenite at the center. A comparison of Figure 5, Figure 7 and Figure 9 shows that for condition (A), the outer surface has a high martensitic volume fraction while the inner zone of the block has a high bainitic volume fraction. However, different transformation behavior is observed for condition (B) where martensitic and bainitic transformations are more important in the corners. Moreover, it can be seen that there is a small change in the volume fraction of bainite in the center. In contrast, for condition (C), it can be seen that the microstructure obtained in the outer surface is fully martensitic while in the inner zone, it consists of martensite, bainite and retained austenite. This finding is different to the ones obtained for the inner zones in simulations corresponding to conditions (A) and (B).
Detailed results and a comparison with the results for condition (A), as reference, are presented in Figure 10. It can be seen that in the first 40 mm from the surface of the block, phase distribution consists of martensite (88%), bainite (12%), and retained austenite (0%). From 40 mm to 120 mm, the fraction of martensite passes from 88% to 28% and that of bainite from 12% to 69%. From 120 mm to 160 mm depth, the microstructure is increase to 84% bainite and 13% of martensite and 3% of retained austenite. From 160 mm to 360 mm depth, the microstructure is nearly composed of bainite (97%). It must be noted that a slower martensitic transformation rate was observed for condition (D) as compared to conditions (B) or (C). From 360 mm to the center of the forged block (508 mm), the microstructure decrease from 90% to 80% bainite and 20% retained austenite (Figure 10).
Figure 11, Figure 12 and Figure 13 show how the proportions of martensite (Figure 11), Bainite (Figure 12), and retained austenite (Figure 13) vary versus quenching processing time and the depth of the ingot for condition D which is the closest situation encountered in industry. Analysis of Figure 11 reveals that martensite is present at about 320 mm depth after 24,140 s. The analysis of the bainite phase evolution (Figure 12) indicates that a fully bainitic microstructure is reached at higher depths (around 380 mm after 25,000 s). The evolution of retained austenite as a function of time, depth and volume fraction is illustrated in Figure 13. It can be seen that, within the limits considered in the present investigation, the grain size has a stronger influence than carbon concentration on the amount of retained austenite present in the large-size forged block at the end of the quench process. The higher levels of retained austenite predicted for condition D in regions close to the core of the forged block can be related to the grain size variation as discussed above.

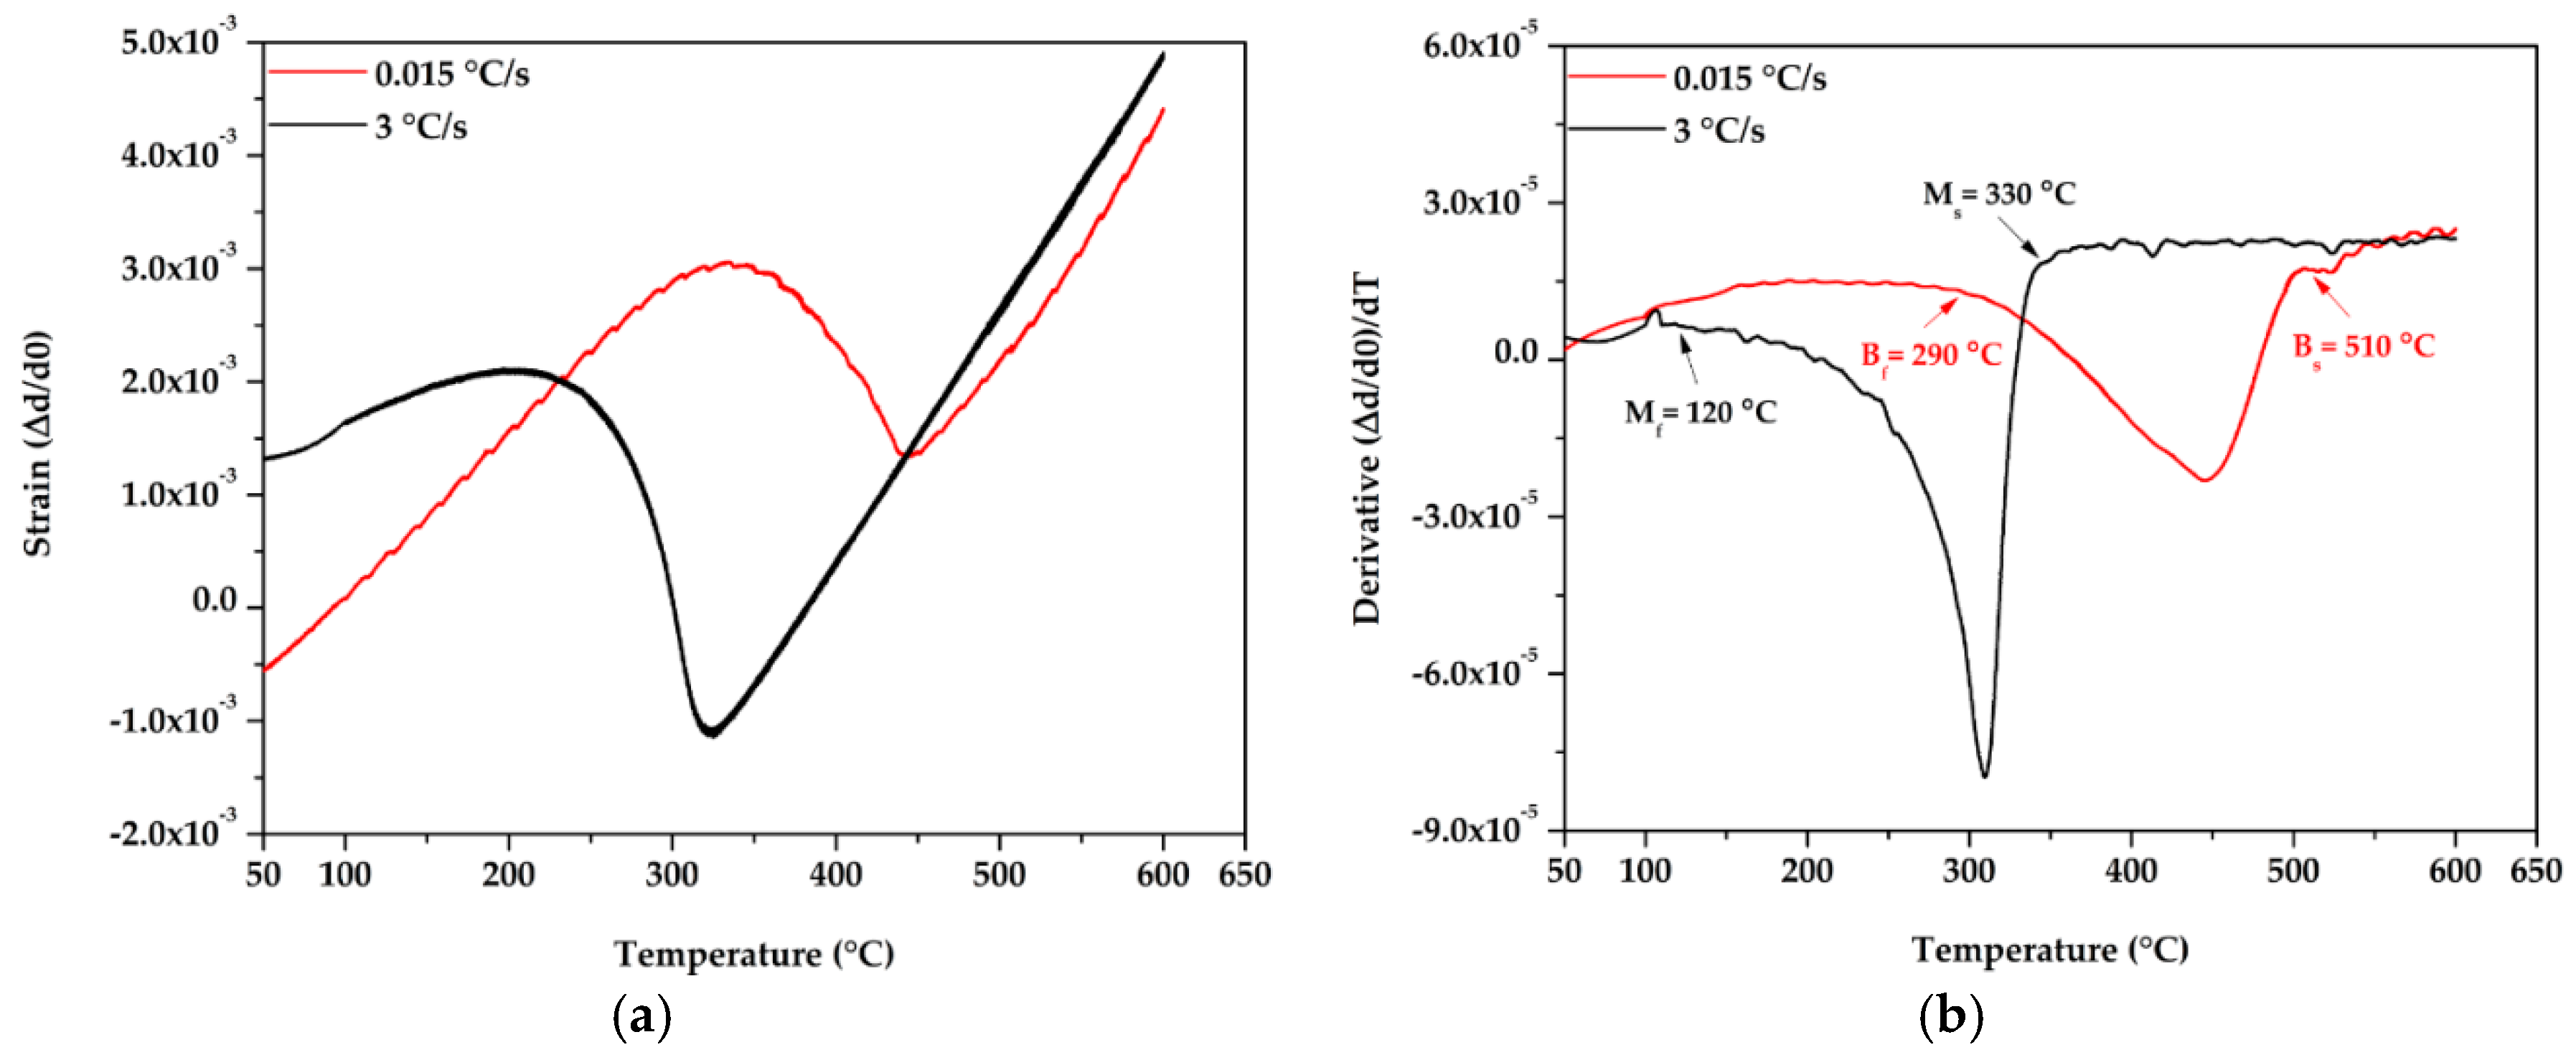
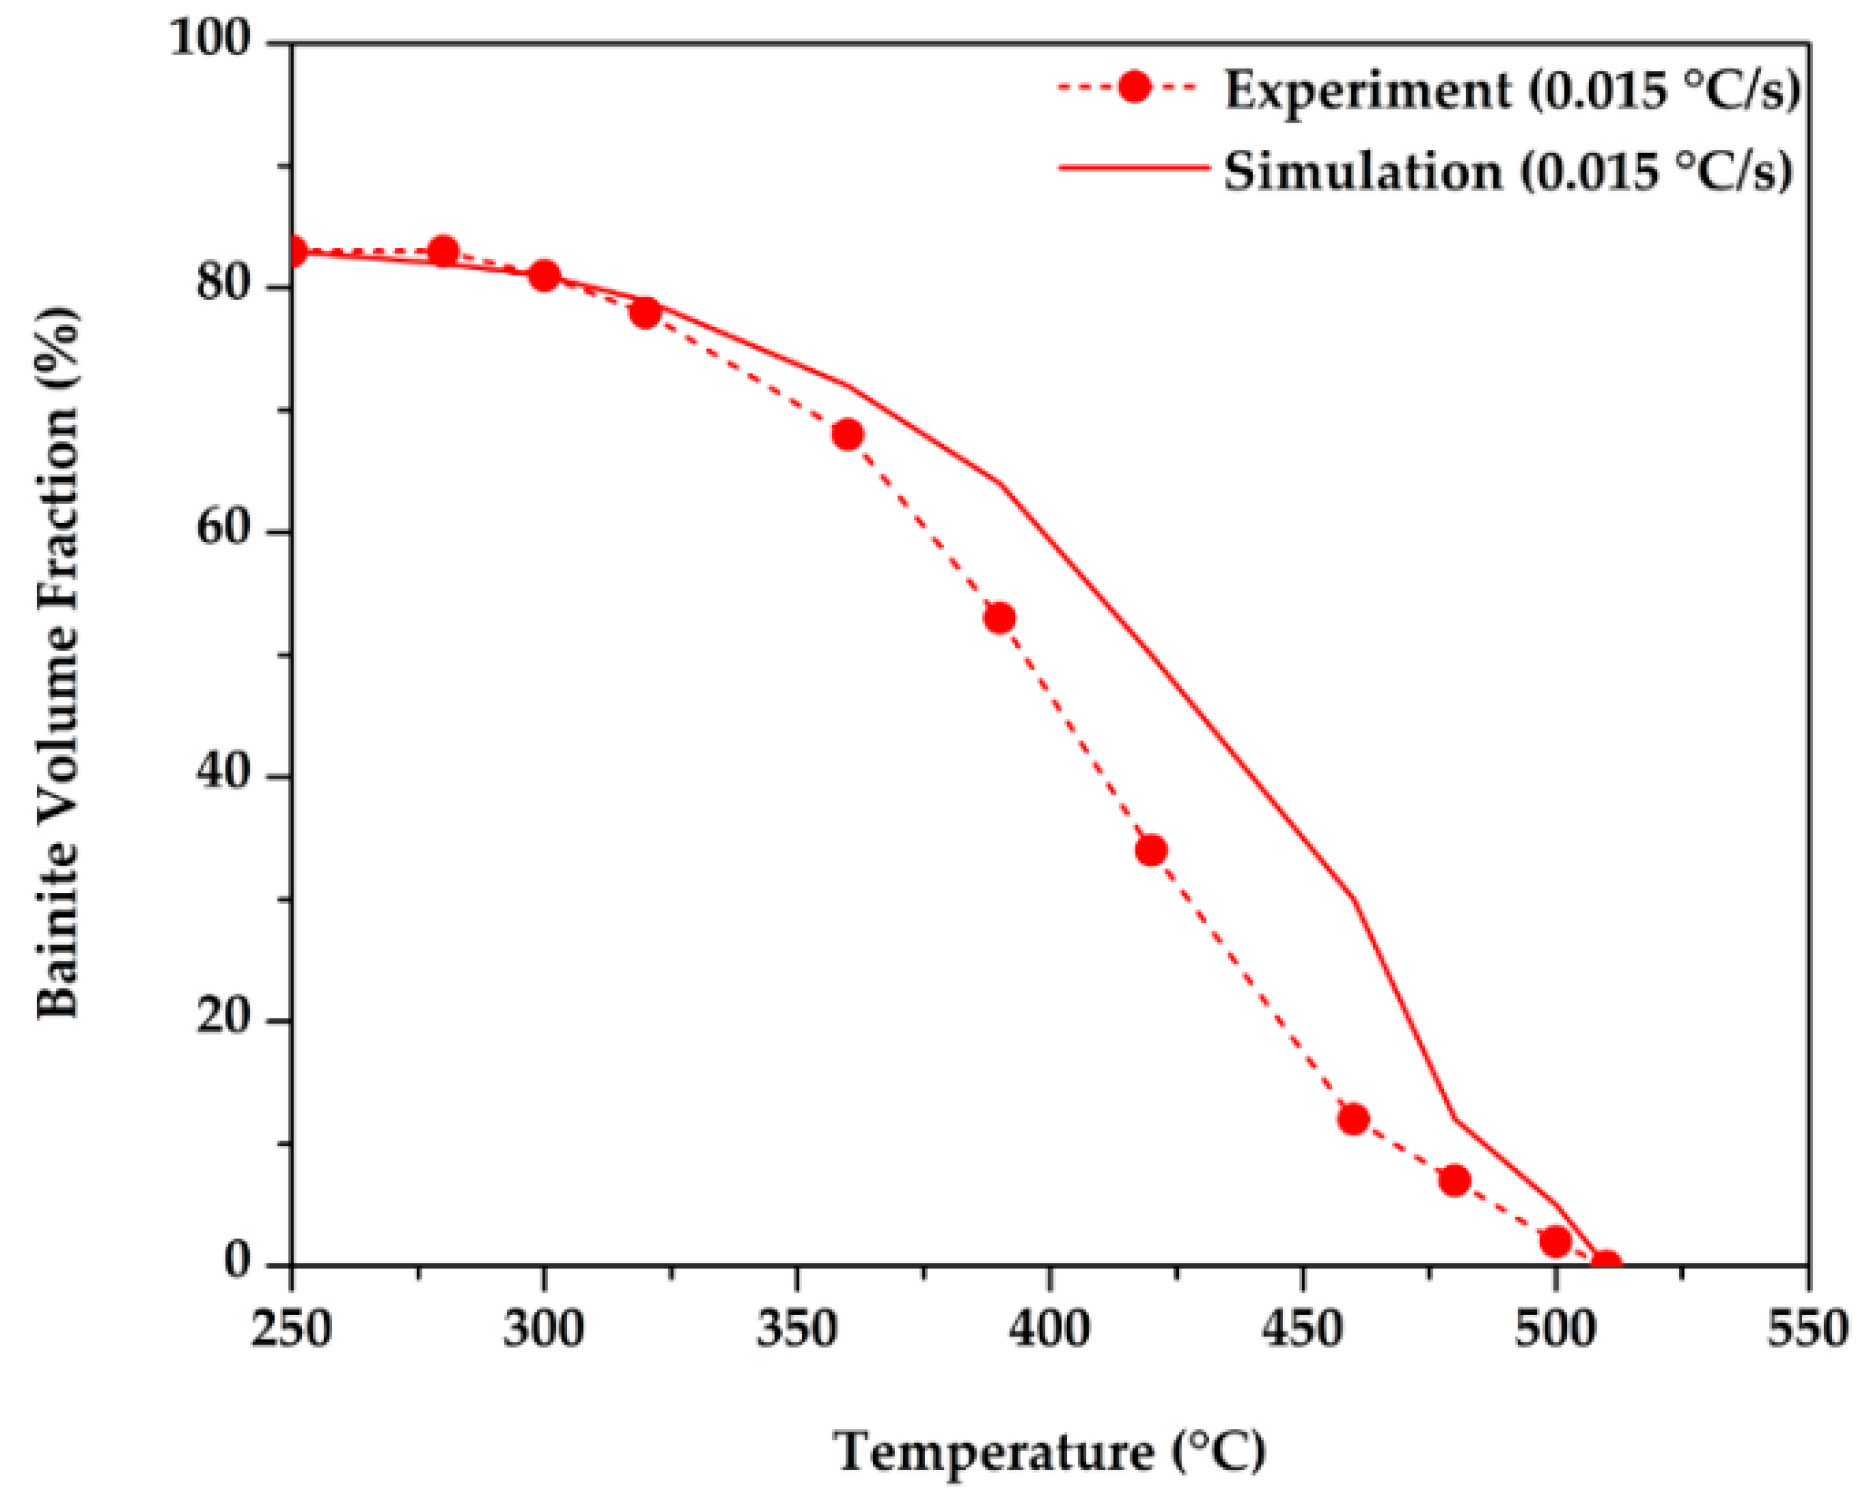
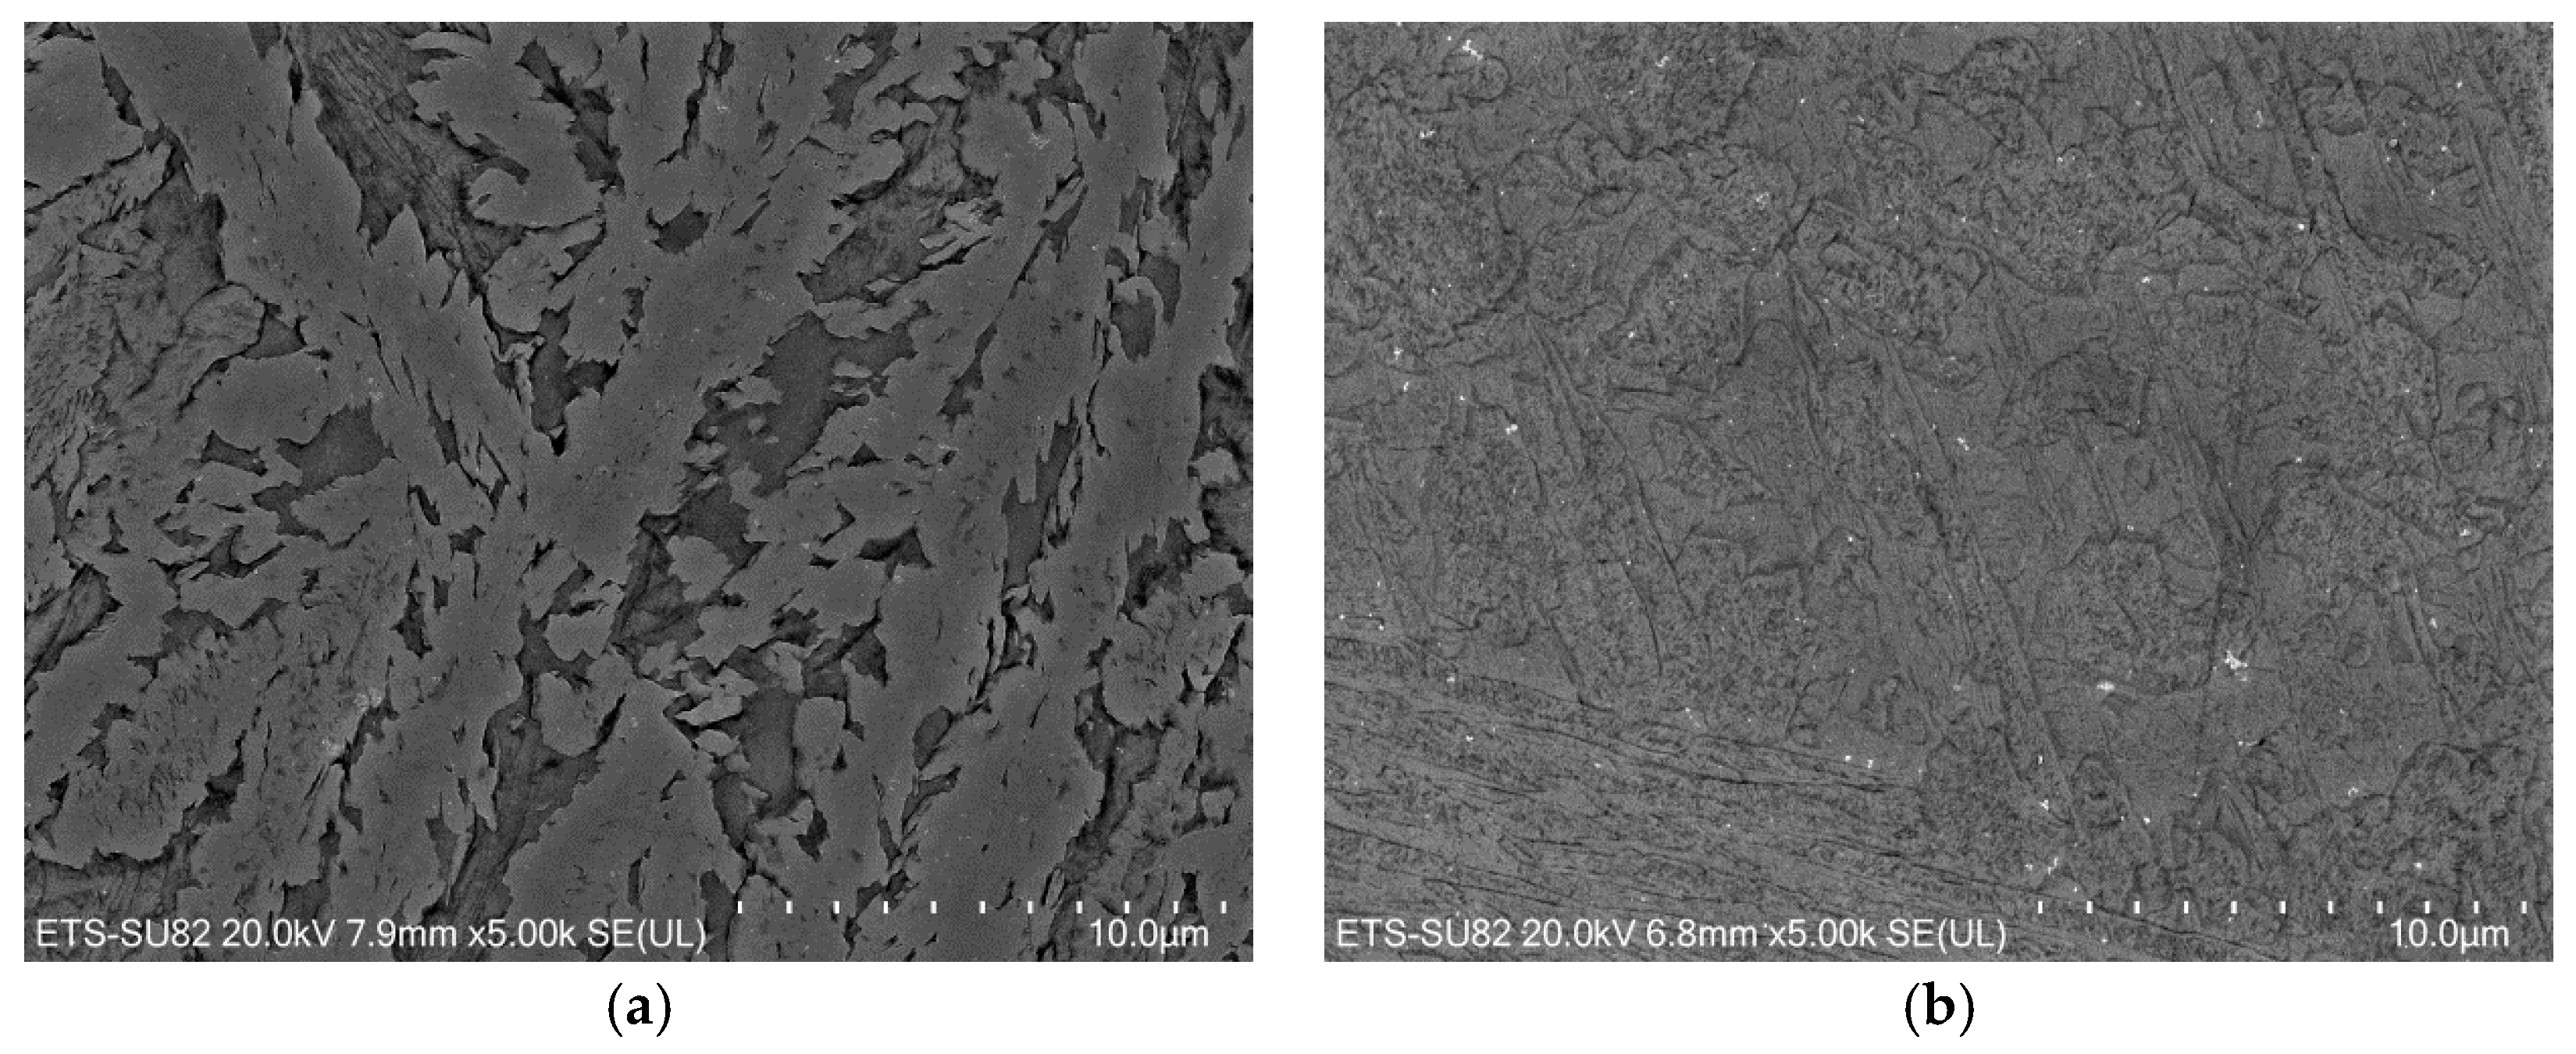
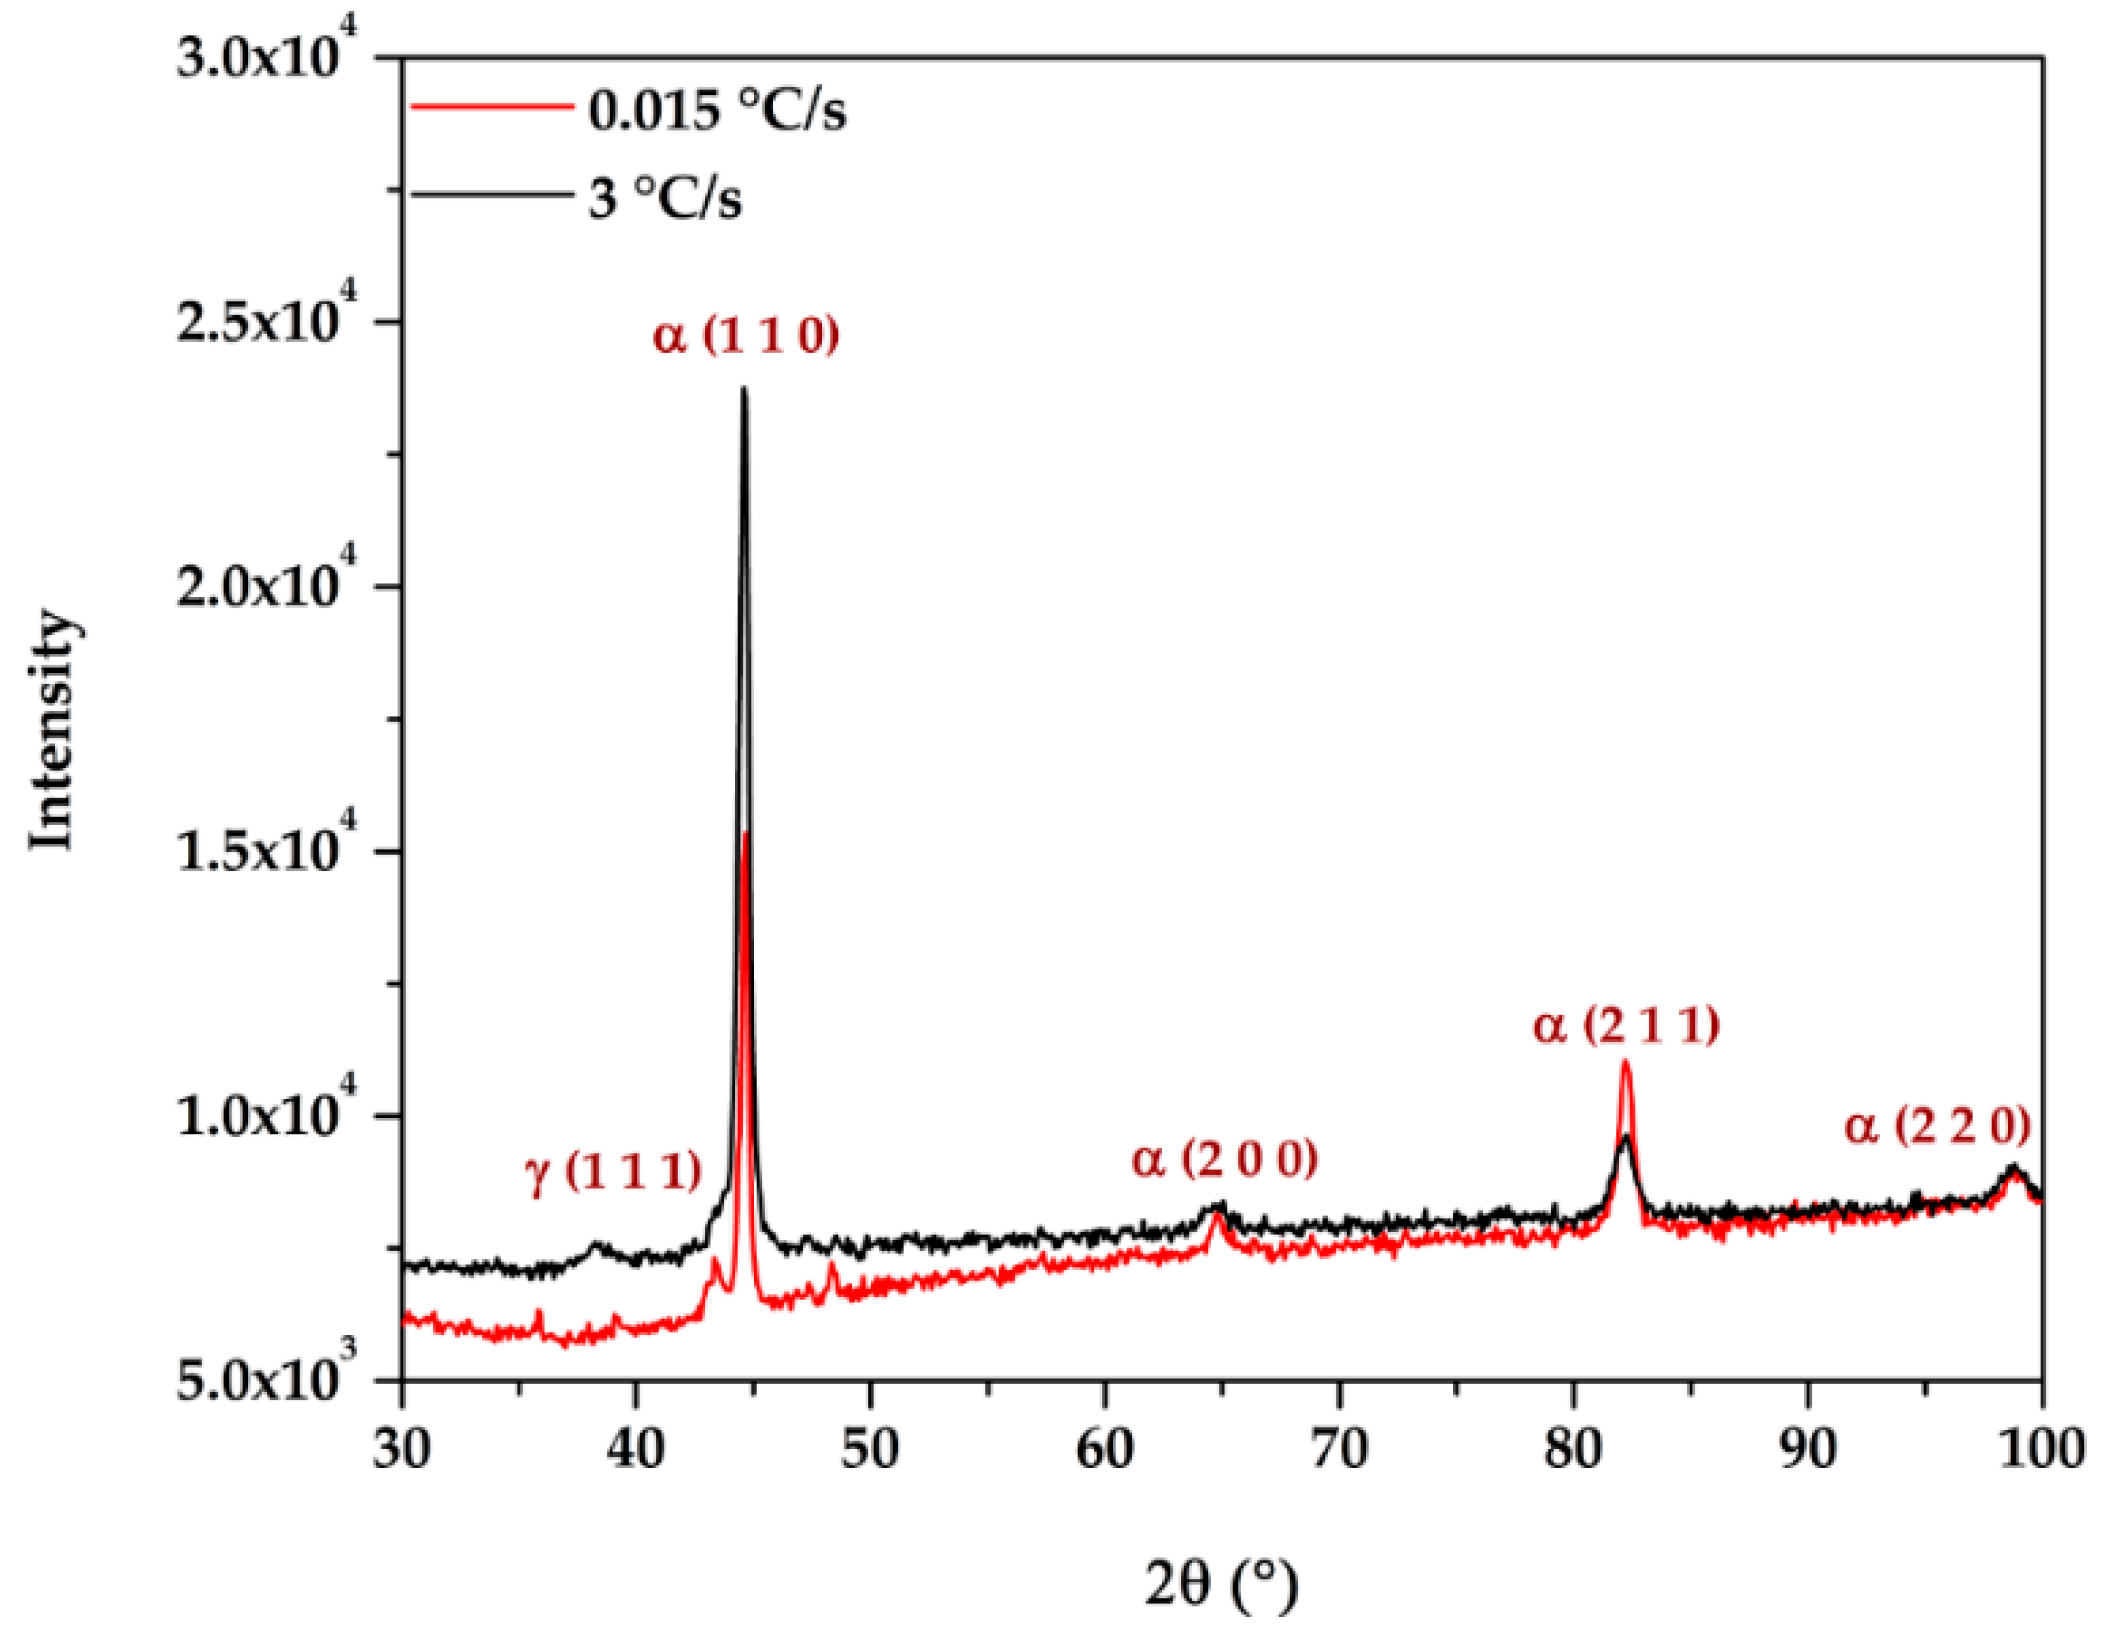
3.4. Experimental Validation

In order to validate the simulation results, dilatometry tests, replicating the cooling patterns corresponding to surface (3 °C/s) and center (0.015 °C/s) regions of the forged ingot, were carried out using the Gleeble 3800® thermo-mechanical simulator. The diameter change D of each sample was recorded as a function of temperature during continuous cooling cycles. From the measurements, the dilatation curve ( D D 0 ) and the first derivative d dT ( D D 0 ) were plotted as shown in Figure 14.
For the 0.015 °C/s cooling rate, a transformation is observed at 510 °C. This corresponds to the start of the bainitic transformation in agreement with the results reported by Chentouf et al. [10] on similar steel. For the 3 °C/s cooling rate, the transformation start temperature was at 360 °C, corresponding to martensitic transformation. The volume fraction of each phase was calculated using the lever rule from the dilatometry data. The comparison between the simulated volume fraction and the measured data is illustrated in Figure 15 and Figure 16.
The relative error between the experimental data and simulation results was calculated by the following relation:
E r r o r = δ S i m δ e x p δ e x p × 100
where δ e x p and δ S i m are the measured and predicted volume fraction of the transformed phases.
As shown in Figure 15 and Figure 16, the volume fractions of bainite and martensite obtained by simulation are in good agreement with the measured data with an error of about 5%. Furthermore, microscopic examination of the microstructure of the samples, as shown in Figure 17, confirmed the FEM simulation as well as the dilatometry results. Specifically, bainite formed only at 0.015 °C/s and martensite at 3 °C/s. The experimental data for bainite and martensite transformation at these two cooling rates also agreed well with the hardness levels (468 HV for 0.015 °C/s and 736 HV for 3 °C/s). The microscopic examination did not also reveal any presence of polygonal ferrite in the examined samples, further supporting the analysis made for the FEM simulations.
The XRD patterns for the 0.015 and 3 °C/s cooling rates are displayed in Figure 18. The significant presence of bainite or martensite in addition to minor amounts of retained austenite is demonstrated in the diffraction pattern. The X-ray patterns also indicate that the austenite phase decreases with increasing the cooling rate, regardless of variations in the carbon content or grain size. Table 4 compares the volume fraction of austenite determined experimentally using X-ray diffraction and predicted by the FEM simulation. The volume fraction of the phases was calculated using the ASTM standard E975-13 [38]. As indicated, in Table 4, for the 0.015 °C/s cooling rate, there is 18% of FCC structure (i.e., retained austenite) and the rest being nearly bainite. For the cooling rate of 3 °C/s, experimental measurements indicated a very small (almost negligible) amount of retained austenite with the microstructure being nearly fully martensitic. In Table 4, the estimated experimental value is lower than the predicted one; however, at such low percentages of volume fraction these differences are not significant.

4. Conclusions

In this paper, the effects of variable grain size and carbon concentration on transformation kinetics and volume fraction of phases through the thickness of a large-size block was employed using the multiple materials method of FORGE NxT 1.1® FEM software.
The following conclusions can be drawn from the present study:
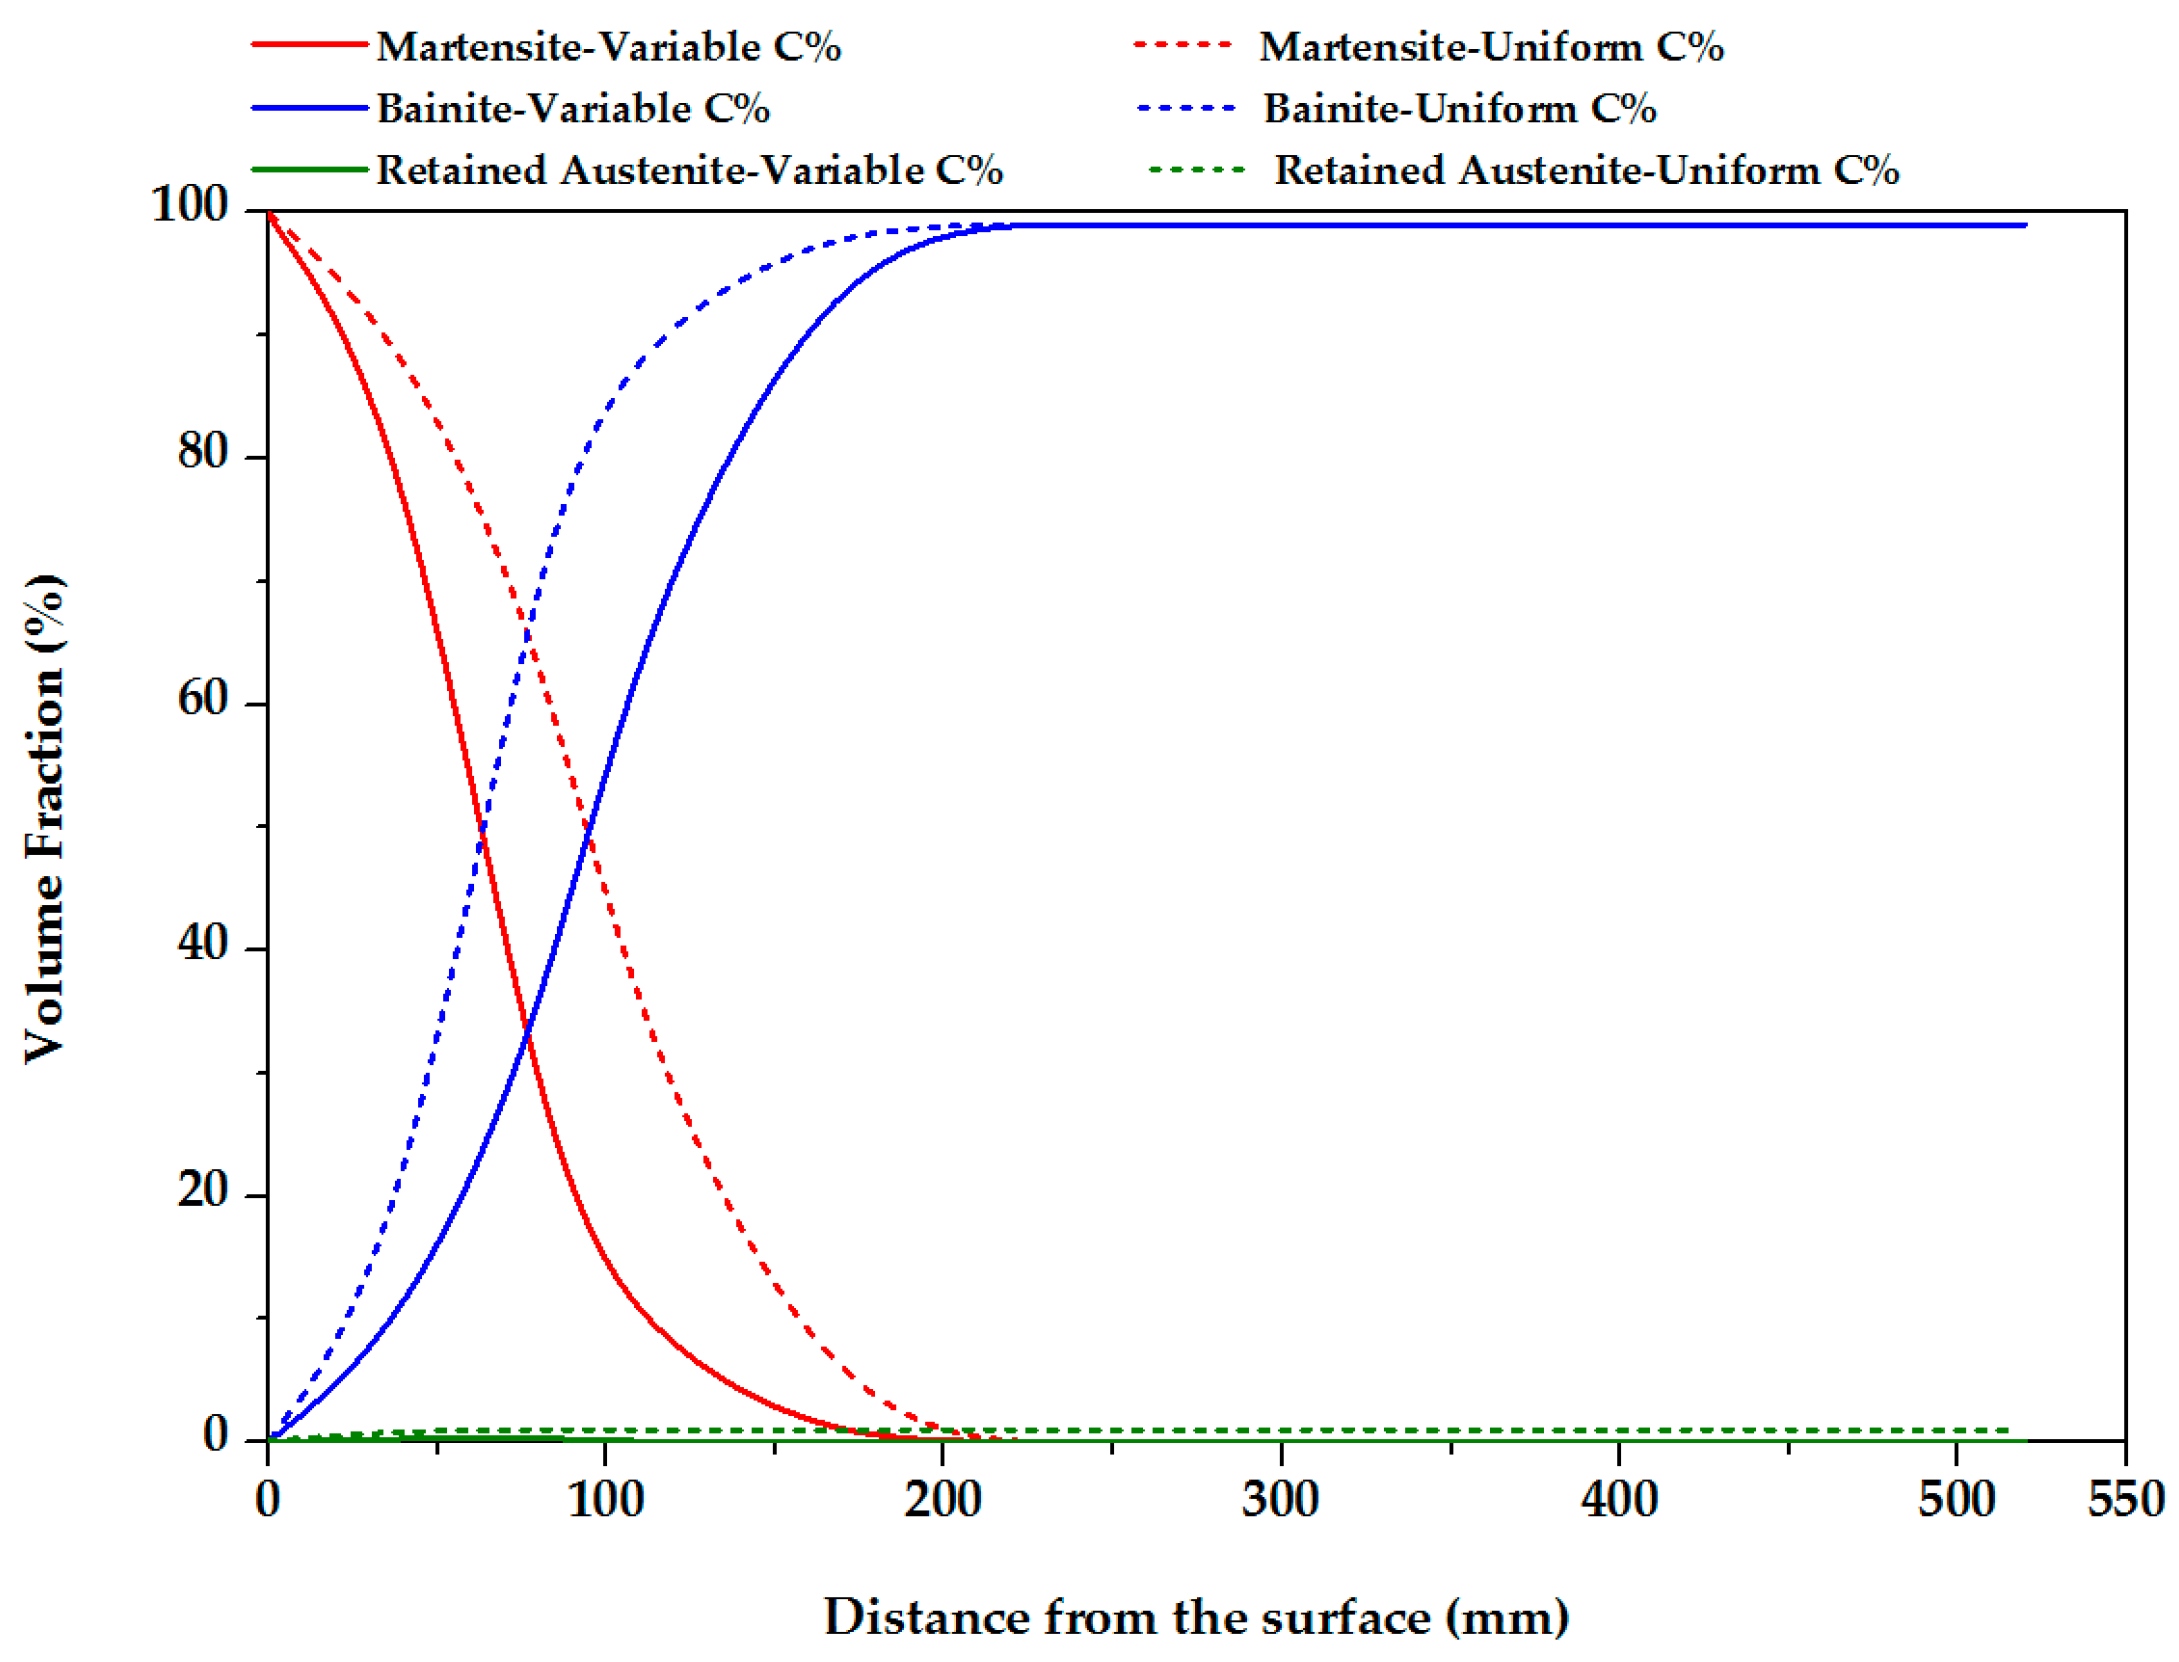
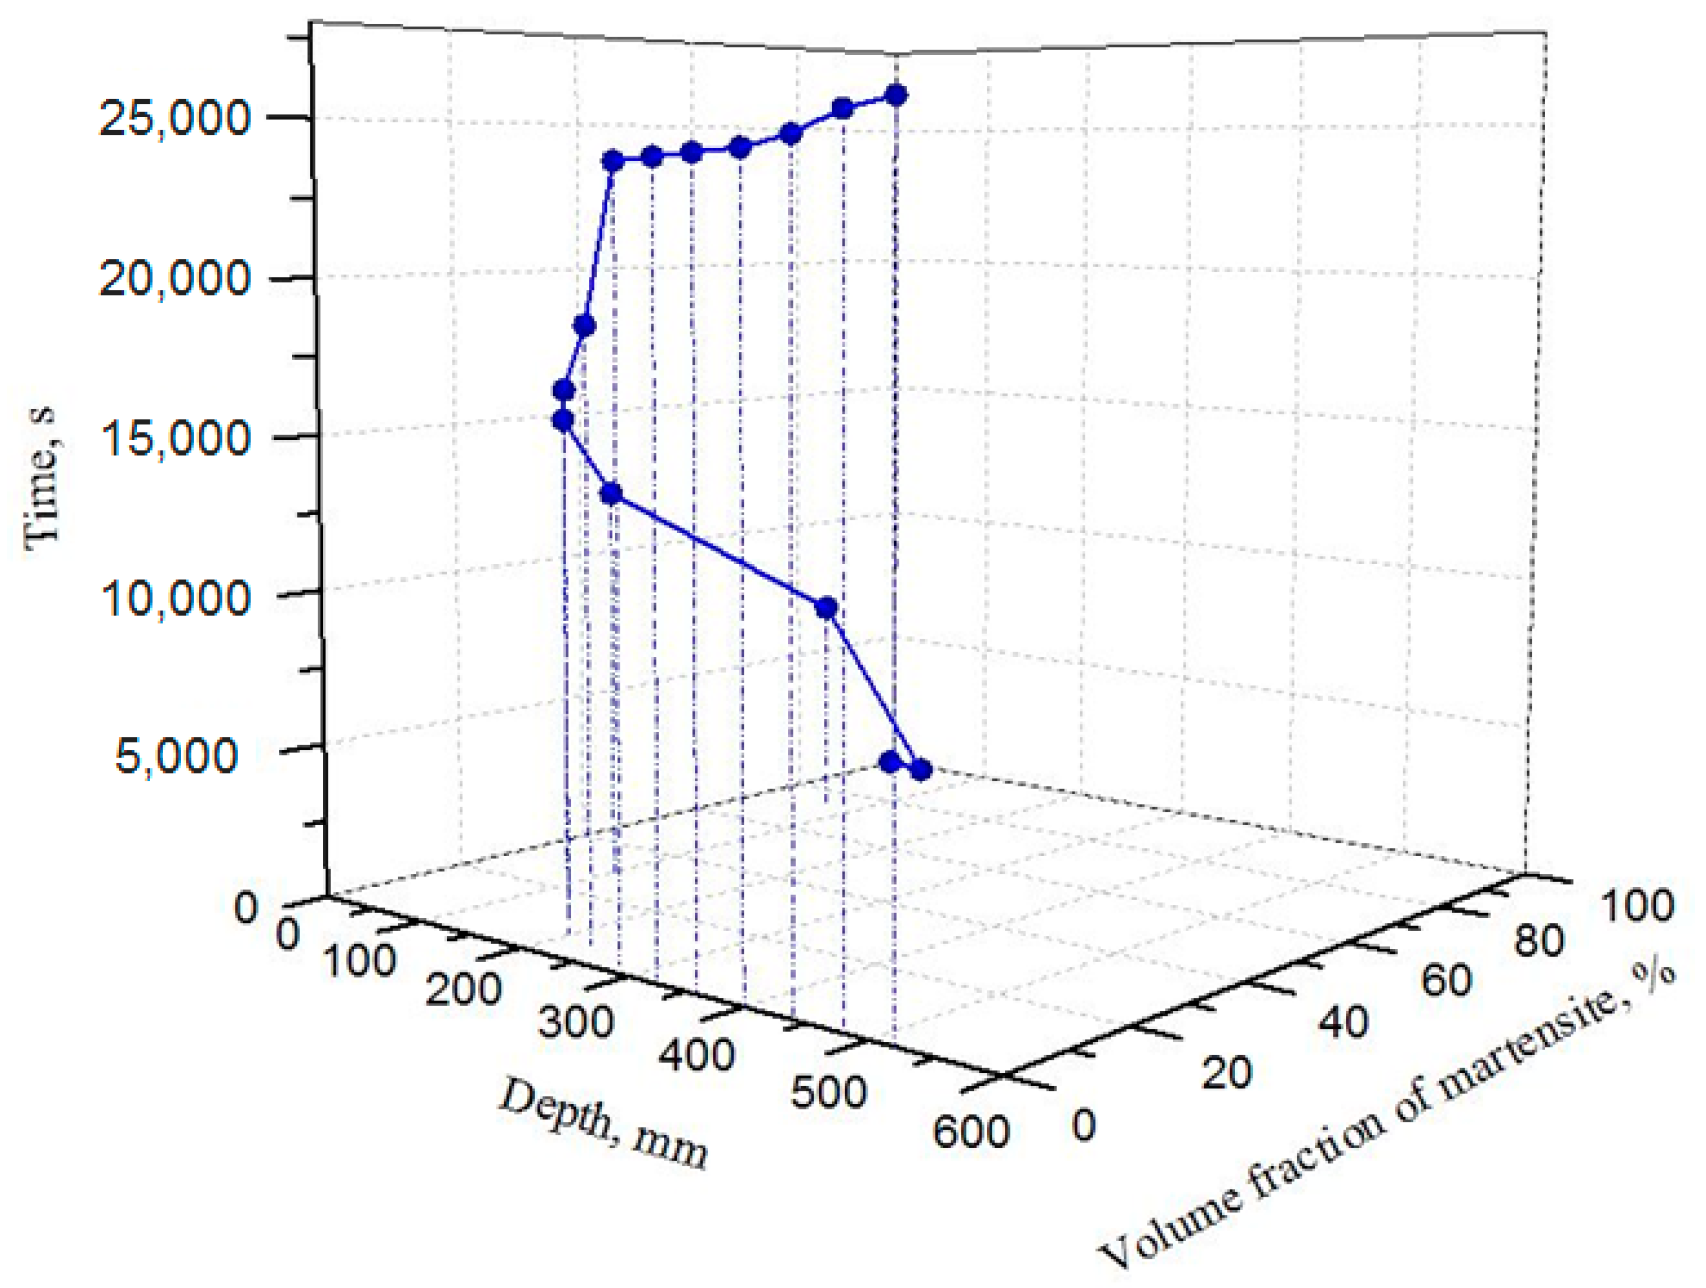
  • The fastest variation in martensite volume fraction was observed for uniform grain size and carbon concentration while an increase in the carbon concentration in austenite led to a decrease in the bainite start temperature Bs.
  • The significant dependence of the microstructure and volume fraction of phases on grain size was demonstrated.
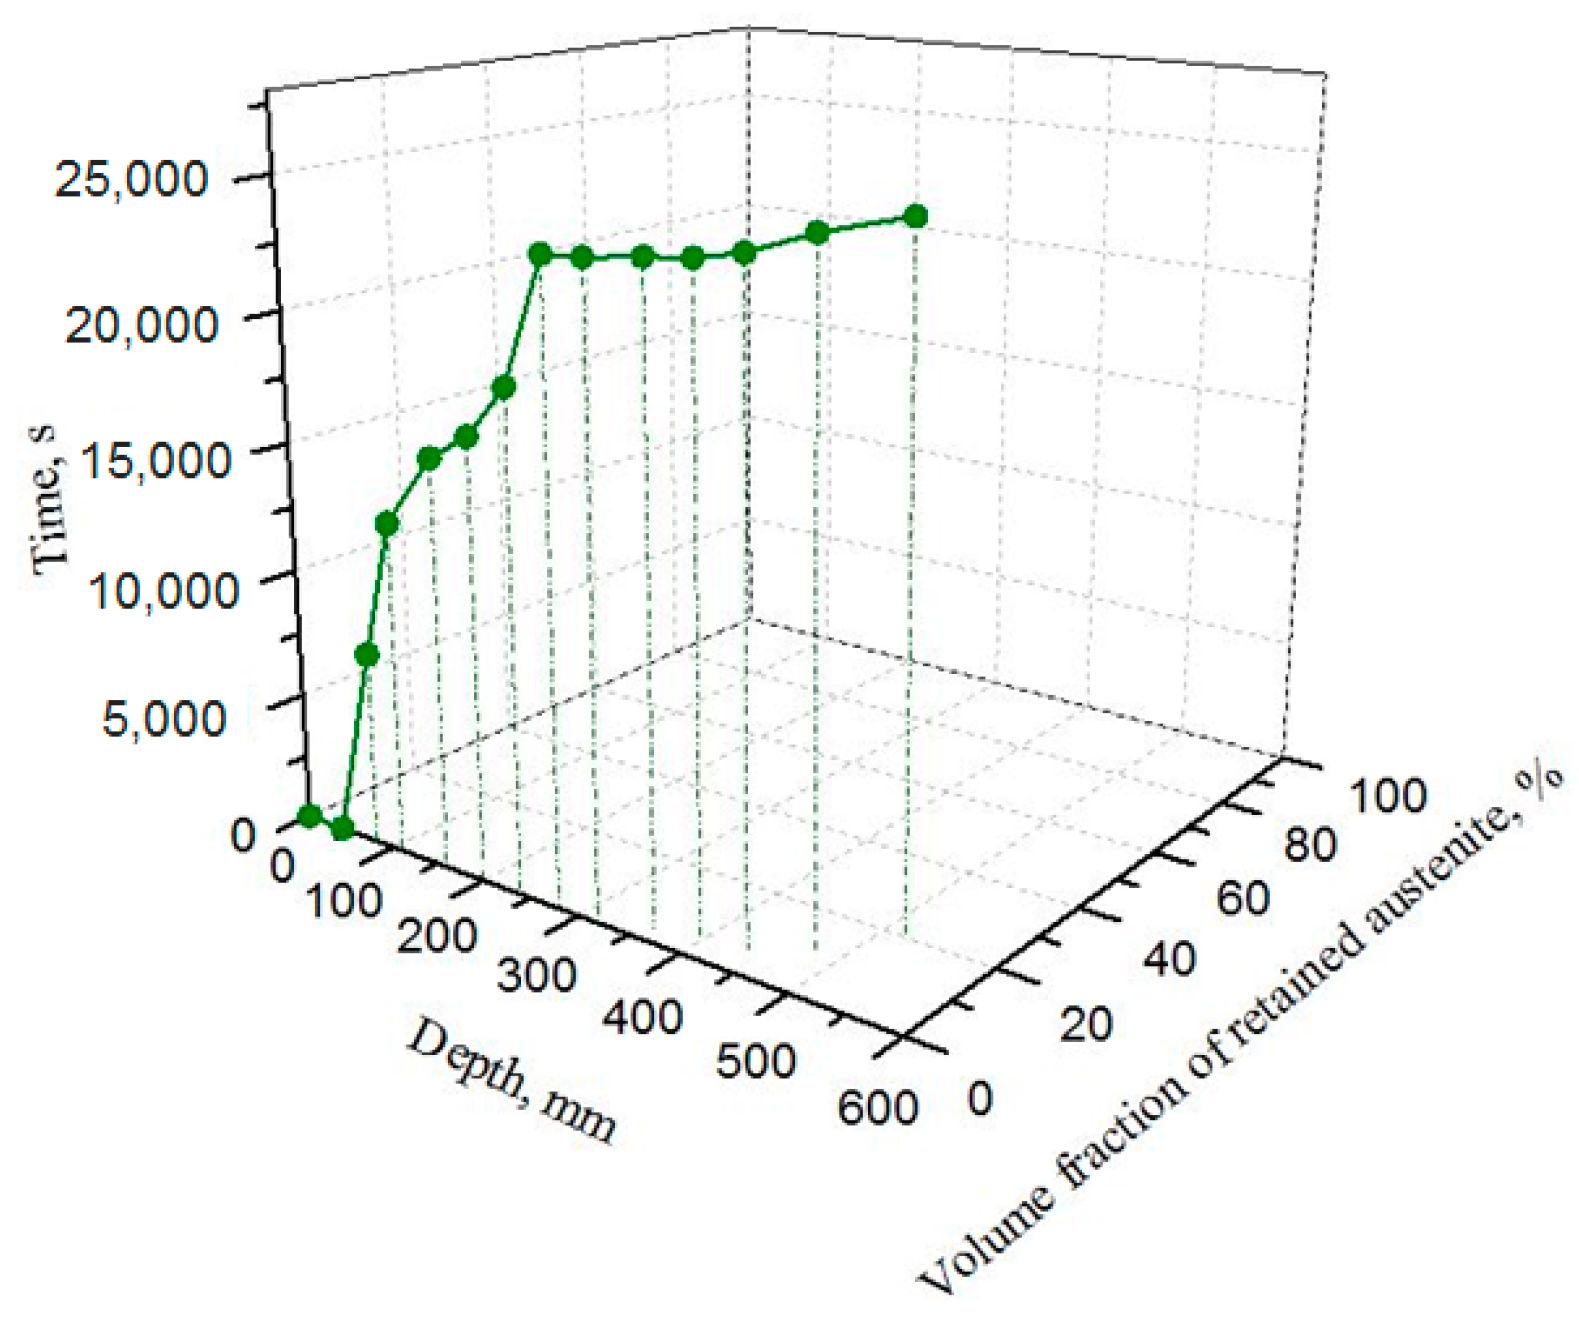
  • Within the limits considered in the numerical solutions, the grain size had a stronger influence than carbon concentration on the amount of retained austenite being existed in the large-size forged block at the end of the quench process.
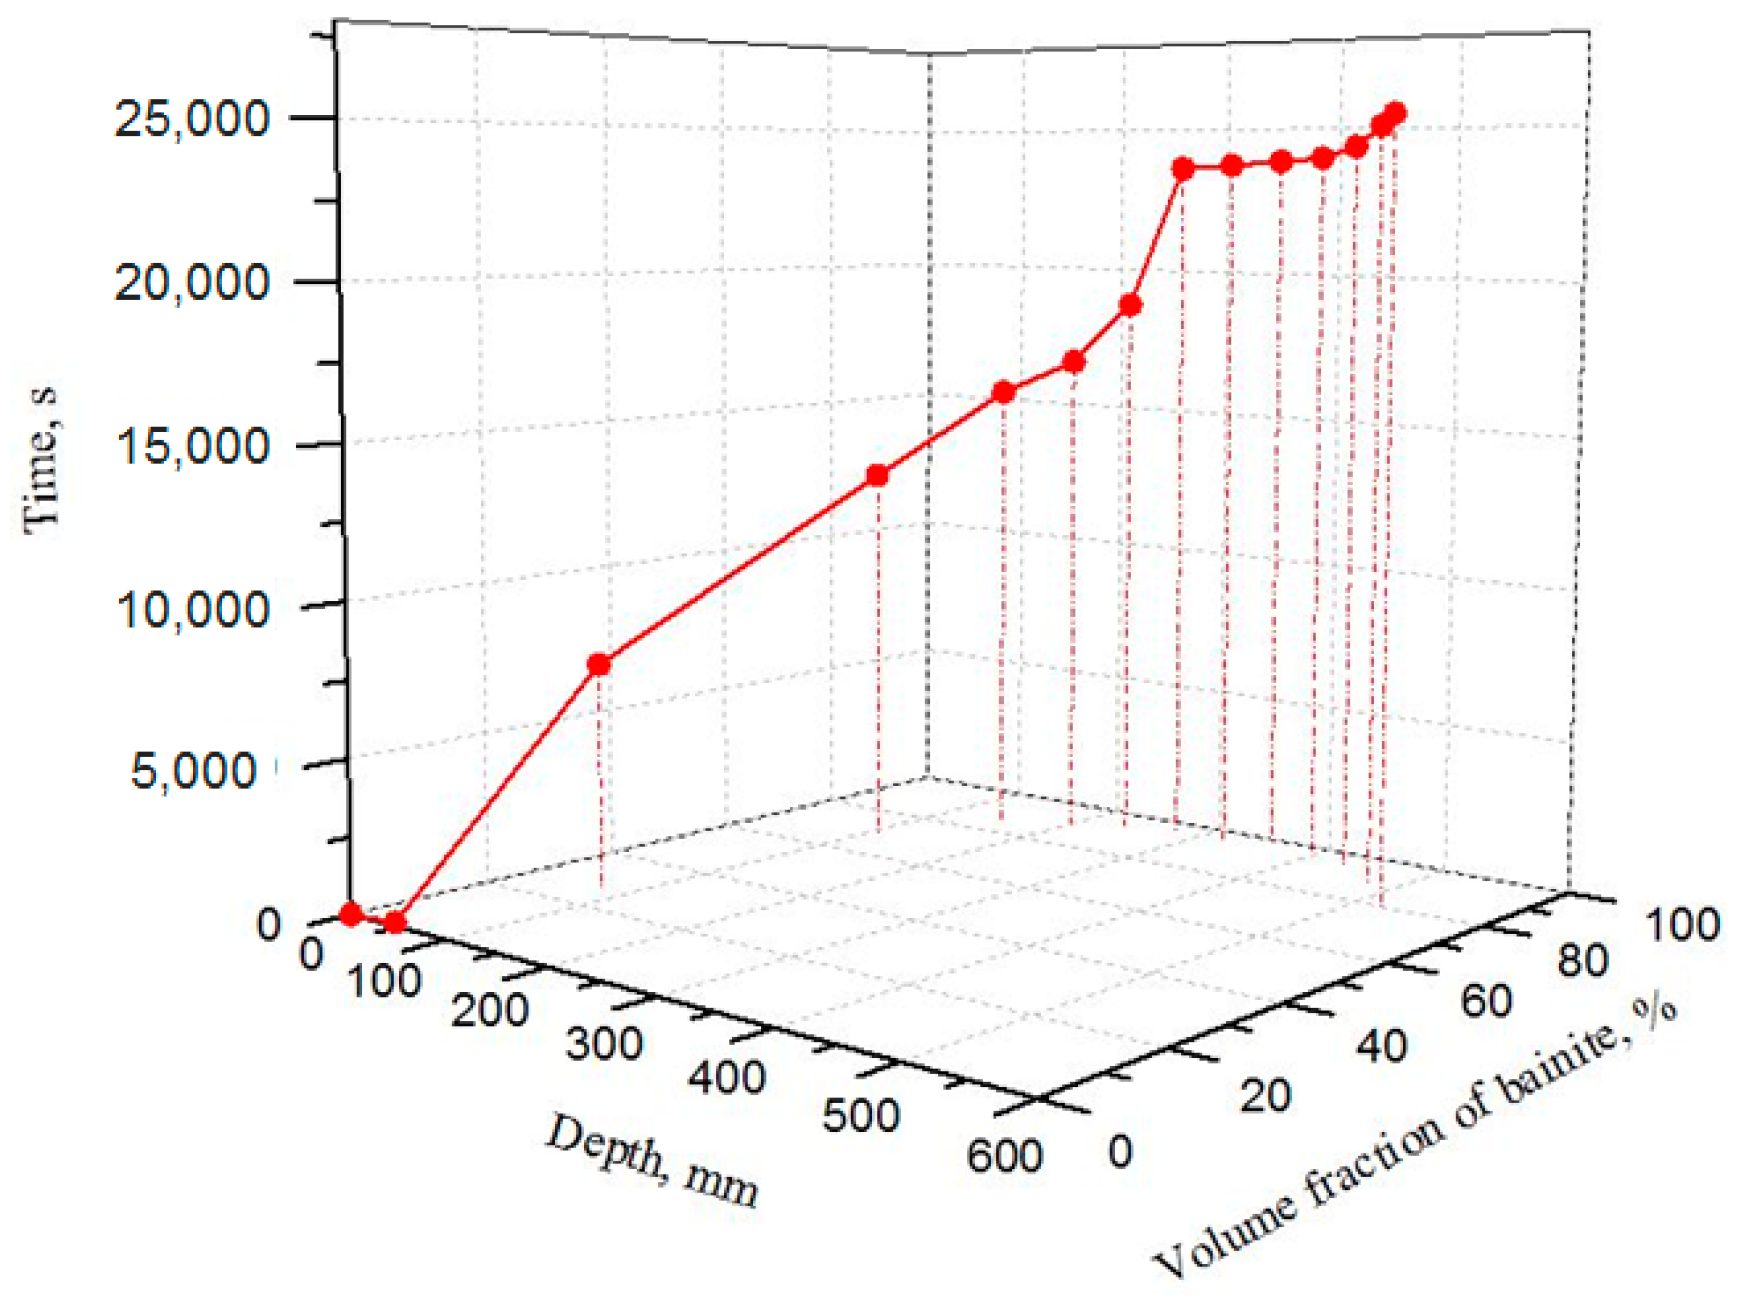
  • The variation of the carbon content and the austenitic grain size influence the values of the volume fraction of retained austenite, bainite and martensite which were obtained after quenching.
  • The simulation results were confirmed by experimental validation demonstrating the applicability of the multiple materials method to the analysis of the quenching process of large-size forged blocks.

Author Contributions

M.L. designed the study and wrote the paper. D.S. verified all the developed numerical and experimental models with FORGE NxT 1.1® FEM software, Gleeble dilatometry program and contributed to writing the manuscript. E.B.F. conceived and designed the experiments; E.B.F. performed the experiments. M.L., D.S. and E.B.F. analyzed the data. J.-B.M. provided samples and developed an industrial experimental setup; J.-B.M. presented valuable comments in the discussion and reviewed the manuscript. M.J. is the main supervisor and contributed to analyzing the results and writing the manuscript.

Funding

This research was funded by [MITACS] grant number [IT03151].

Acknowledgments

The authors acknowledge the support from NSERC in the framework of the CRD Grant number 453683 and MITACS scholarship program (Emna Ben Fredj).

Conflicts of Interest

The authors declare no conflict of interest.

Appendix A

Thermo-physical property datasets are generally developed by thermodynamic simulation software. Since heat treatment simulations require accurate material properties data for the steel being analyzed, the isotropic properties of each phase of the investigated steel were determined using JMatPro® software. The value of 0.3 was selected for the Poisson’s ratio. The density (a), thermal conductivity (b), specific heat (c) and latent heat (d) as a function of temperature are illustrated for austenite, bainite and martensite phases.
Figure A1. (a) Density of austenite, bainite and martensite phases; (b) Thermal conductivity of austenite, bainite and martensite phases; (c) Specific heat of austenite, bainite and martensite phases; (d) Latent heat of bainite and martensite phases.
Jmmp 02 00034 g0a1

References

  1. Firrao, D.; Matteis, P.; Scavino, G.; Ubertalli, G.; Ienco, M.G.; Pinasco, M.R.; Stagno, E.; Gerosa, R.; Rivolta, B.; Silvestri, A. Relationships between tensile and fracture mechanics properties and fatigue properties of large plastic mould steel blocks. Mater. Sci. Eng. A 2007, 468, 193–200. [Google Scholar] [CrossRef]
  2. Wegman, D.D.; Wanner, E.A.; Rehrer, W.P.; Widge, S. Heat, Corrosion, and Wear Resistant Steel Alloy and Article. U.S. Patent 4,929,419, 29 May 1990. [Google Scholar]
  3. Mordike, B.L.; Ebert, T. Magnesium: Properties—Applications—Potential. Mater. Sci. Eng. A 2001, 302, 37–45. [Google Scholar] [CrossRef]
  4. Sinha, A.K.; Division, B.P. Defects and Distortion in Heat-Treated Parts. In ASM Handbook; ASM International: Almere, The Netherlands, 1991; pp. 601–619. [Google Scholar]
  5. Loucif, A.; Shahriari, D.; Zhang, C.; Jahazi, M.; Lapierre-Boire, L.P.; Tremblay, R. Macrosegregation of Alloying Elements in Hot Top of Large Size High Strength Steel Ingot. Mater. Sci. Forum 2016, 879, 1176–1181. [Google Scholar] [CrossRef]
  6. Lait, J.E.; Samarasekera, I.V. Novel solidification studies. In Proceedings of the Weinberg International Symposium on Solidification Processing, Hamilton, ON, Canada, 27–29 August 1990; pp. 171–252. [Google Scholar]
  7. Agrawal, K.; Brimacombe, J.K. Mathematical model of heat flow and austenite-pearlite transformation in eutectoid carbon steel rods for wire. Metall. Trans. B 1981, 12, 121–133. [Google Scholar] [CrossRef]
  8. Biswas, S.J.; Chen, S.J.; Satyanarayana, A. Optimal temperature tracking for accelerated cooling processes in hot rolling of steel. Dyn. Control 1997, 7, 327–340. [Google Scholar] [CrossRef]
  9. Woodard, P.R.; Chandrasekar, S.; Yang, H.T.Y. Analysis of temperature and microstructure in the quenching of steel cylinders. Metall. Mater. Trans. B 1999, 30, 815–822. [Google Scholar] [CrossRef]
  10. Chentouf, S.M.; Jahazi, M.; Lapierre-Boire, L.P.; Godin, S. Characteristics of Austenite Transformation during Post Forge Cooling of Large-Size High Strength Steel Ingots. Metallogr. Microstruct. Anal. 2014, 3, 281–297. [Google Scholar] [CrossRef]
  11. Johnson, W.A.; Mehl, R.F. Reaction kinetics in processes of nucleation and growth. Trans. Metall. Soc. 1939, 135, 135–416. [Google Scholar]
  12. Koistinen, D.; Marburger, R. A general equation prescribing the extent of the austenite-martensite transformation in pure iron-carbon alloys and plain carbon steels. Acta Mater. 1959, 7, 59–60. [Google Scholar] [CrossRef]
  13. Denis, S.; Sjöstrom, S.; Simon, A. Coupled temperature, stress, phase transformation calculation model Numerical illustration of internal stresses evolution during cooling of an eutectoid carbon steel cylinder. Metall. Trans. A 1987, 18, 1203–1212. [Google Scholar] [CrossRef]
  14. Forge NxT 1.1. Available online: www.transvalor.com (accessed on 21 March 2018).
  15. Guo, L.; Roelofs, H.; Lembke, M.I.; Bhadeshia, H.K.D. Modelling of recalescence effect on austenite decomposition. Mater. Sci. Technol. 2017, 33, 1258–1267. [Google Scholar] [CrossRef]
  16. JMatPro. Practical Software for Materials Properties. Available online: www.sentesoftware.co.uk (accessed on 21 March 2018).
  17. Song, D.L.; Gu, J.F.; Pan, J.S.; Hu, M.J. Numerical simulation of quenching of large sized blocks of 718 steel used for plastic dies. Mater. Sci. Technol. 2013, 20, 1567–1572. [Google Scholar] [CrossRef]
  18. Denis, S.; Archambault, P.; Aubry, C.; Mey, A.; Louin, J.C.; Simon, A. Modelling of phase transformation kinetics in steels and coupling with heat treatment residual stress predictions. J. Phys. 1999, 9, 323–332. [Google Scholar] [CrossRef]
  19. Kang, S.H.; Im, Y.T. Three-dimensional thermo-elastic–plastic finite element modeling of quenching process of plain-carbon steel in couple with phase transformation. Int. J. Mech. Sci. 2007, 49, 423–439. [Google Scholar] [CrossRef]
  20. ASTM E3-11. Standard Guide for Preparation of Metallographic Specimens; ASTM International: West Conshohocken, PA, USA, 2017. [Google Scholar]
  21. Rizzi, N.; Tschofen, J. Simulation Numérique de la Mise en Forme Multi-Matériaux, Application au Filage de γ-TiAl Sous Gaine; Matériaux: Tours, France, 2002. [Google Scholar]
  22. Cardinaux, D. Etude et Modelisation Numerique 3D par Élèments Finis D’un Procédé de Traitement Thermique de Tôles Embouties Après Chauffage par Induction: Application à un Renfort de Pied Central Automobile. Ph.D. Thesis, Ecole Nationale Supérieure des Mines de Paris, Paris, France, 2008. [Google Scholar]
  23. Xing, W.; Shi, D.; Sun, J.; Zhu, Z. Emissivity model of steel 430 during the growth of oxide layer at 800–1100 K and 1.5 μm. Infrared Phys. Technol. 2018, 88, 23–31. [Google Scholar] [CrossRef]
  24. Sadiq, H.; Wong, M.B.; Tashan, J.; Al-Mahaidi, R.; Zhao, R. Determination of steel emissivity for the temperature prediction of structural steel members in fire. J. Mater. Civ. Eng. 2013, 25, 167–173. [Google Scholar] [CrossRef]
  25. Bocchini, G.F.; Baggioli, A.; Gerosa, R.; Rivolta, B.; Silva, G. Cooling Rates of P/M Steels. Int. J. Powder Metall. 2004, 4, 57–65. [Google Scholar]
  26. Boniardi, M.; Guagliano, M.; Casaroli, A.; Andreotti, R.; Ballerini, F. Large Forgings: Microstructural Evolution and Residual Stresses Due to Quenching Treatments—A Combined Numerical and Experimental. Mater. Perform. Charact. 2014, 3, 118–136. [Google Scholar] [CrossRef]
  27. Huiping, L.; Guoqun, Z.; Lianfang, H.; Yue, M. High-speed data acquisition of the cooling curves and evaluation of heat transfer coefficient in quenching process. Measurement 2008, 41, 676–686. [Google Scholar]
  28. Aaronson, H.I.; Reynolds, W.T.J.; Shifiet, G.J.; Spanos, G. Bainite Viewed Three. Different Ways. Metall. Mater. Trans. A 1990, 21, 1343–1380. [Google Scholar] [CrossRef]
  29. Chadha, K.; Shahriari, D.; Jahazi, M. Constitutive Modelling of Ingot Breakdown Process of Low Alloy Steels. Int. J. Ital. Assoc. Metall. 2016, 4, 5–12. [Google Scholar]
  30. Talebi, S.H.; Ghasemi-Nanesa, H.; Jahazi, M.; Melkonyan, H. In Situ Study of Phase Transformations during Non-Isothermal Tempering of Bainitic and Martensitic Microstructures. Metals 2017, 7, 346. [Google Scholar] [CrossRef]
  31. Hong, S.Y.; Bhadeshia, H.K.D. Austenite Grain Size and the Martensite-Start Temperature. Scr. Mater. 2009, 60, 493–495. [Google Scholar]
  32. Umemoto, M.; Komatsubara, N.; Tamura, I. Effect of austenite grain size on the hardenability of eutectoid steel. Tetsu-to-Hagané 1980, 66, 400–409. [Google Scholar] [CrossRef]
  33. Seok, J.L.; June, S.P.; Young, K.L. Effect of austenite grain size on the transformation kinetics of upper and lower bainite in a low-alloy steel. Scr. Mater. 2008, 59, 87–90. [Google Scholar]
  34. Matsuzaki, A.; Bhadeshia, H.K.D.H. Effect of Austenite Grain Size and Bainite Morphology on Overall Kinetics of Bainite Transformation in Steels. J. Mater. Sci. Technol. 1999, 15, 518–522. [Google Scholar] [CrossRef]
  35. Bhadeshia, H.K.D.H. Bainite in steels. Encyclopedia of materials. Sci. Technol. 2001, 500, 5203–5206. [Google Scholar]
  36. Wang, J.; Han, Y.; Hua, H.; Wang, X.; Jiang, C. Grain size effect on the martensitic transformation of Ni50Mn25Ga17Cu8 high-temperature shape memory alloy. Intermetallics 2015, 61, 42–46. [Google Scholar] [CrossRef]
  37. Hu, F.; Hodgson, P.D.; Wu, K.M. Acceleration of the super bainite transformation through a coarse austenite grain size. Mater. Lett. 2014, 122, 240–243. [Google Scholar] [CrossRef]
  38. ASTM E975-13. Standard Practice for X-ray Determination of Retained Austenite in Steel with Near Random Crystallographic Orientation; ASTM International: West Conshohocken, PA, USA, 2013. [Google Scholar]
Figure 1. Influence of carbon content on transformation temperatures and the bainitic transformation nose on the TTT diagram: (a) 0.35%C; (b) 0.5%C.
Jmmp 02 00034 g001
Figure 2. Influence of grain size on the bainitic transformation nose on the TTT diagram: (a) 130 μm; (b) 350 μm.
Jmmp 02 00034 g002
Figure 3. Geometry of the large-sized ingot and the symmetrical sets used in the FE simulation of the quenching process. Distributions of the transformed phases are displayed in the section A-A.
Jmmp 02 00034 g003
Figure 4. One-eighth model discretization with multiple materials in which cross section A-A indicates five zones with respect to the outer and symmetry planes.
Jmmp 02 00034 g004
Figure 5. Distribution of phased transformed in the section A-A (1/8 model) after quenching process under various simulation conditions (A: uniform grain size and uniform %C, B: uniform grain size and variable %C). (a) Contour of martensite and bainite distributions under the condition of A; (b) Contour of martensite and bainite distributions under the condition of B; (c) Contour of retained austenite distribution under the conditions of A & B.
Jmmp 02 00034 g005
Figure 6. Effect of carbon concentration on the predicted phase distribution along the depth of the block after water-quenching process. Dashed line condition (A); Solid line condition (B).
Jmmp 02 00034 g006
Figure 7. Distribution of phased transformed in section A-A (1/8 model) after the quenching process for simulation condition C (variable grain size and uniform %C). (a) Contour of martensite and bainite distributions; (b) Contour of retained austenite distribution.
Jmmp 02 00034 g007
Figure 8. Effect of carbon content on the predicted phase distribution along the depth of the block after water-quenching process. Dashed line condition (A); Solid line condition (C).
Jmmp 02 00034 g008
Figure 9. Distribution of phased transformed in section A-A (1/8 model) after the quenching process for simulation condition D (variable grain size and %C). (a) Contour of martensite and bainite distributions; (b) Contour of retained austenite distribution.
Jmmp 02 00034 g009
Figure 10. Effect of variable grain size and carbon concentration on the predicted phase distribution along the depth of the block after water-quenching process. Dashed line condition (A); Solid line condition (D).
Jmmp 02 00034 g010
Figure 11. Calculated martensite distribution for condition (D).
Jmmp 02 00034 g011
Figure 12. Calculated bainite distribution of condition (D).
Jmmp 02 00034 g012
Figure 13. Calculated retained austenite distribution of condition (D).
Jmmp 02 00034 g013
Figure 14. Thermal expansion versus temperature for different cooling rates. Samples were cooled from 900 °C to room temperature at the rates of 0.015 and 3 °C/s: (a) Strain (∆d/d0); (b) First derivative of the thermal expansion.
Jmmp 02 00034 g014
Figure 15. Comparison between the calculated bainite volume fraction and measured data on the forged block: Bainite volume fraction at 0.015 °C/s.
Jmmp 02 00034 g015
Figure 16. Comparison between the calculated bainite volume fraction and measured data on the forged block: Martensite volume fraction at 3 °C/s.
Jmmp 02 00034 g016
Figure 17. SEM images of the obtained microstructure after cooling: (a) Martensite at 3 °C/s; (b) Bainite at 0.015 °C/s.
Jmmp 02 00034 g017
Figure 18. X-ray diffraction for two cooling rates, 0.015 and 3 °C/s.
Jmmp 02 00034 g018
Table 1. Chemical composition of the studied steel (wt. %).
CMnSiNiCrMoCu
0.350.990.410.51.860.530.16
Table 2. Designation of material condition and their corresponding parameters employed in the simulation.
Material ConditionDesignation
Uniform grain size and %CA
Uniform grain size and variable %CB
Variable grain size and uniform %CC
Variable grain size and %CD
Table 3. The initial austenite grain size and carbon concentration specified for different zones corresponding to the simulation condition.
Zone12345
AGrain size ( μ m ) 133133133133133
Carbon (wt. %)0.350.350.350.350.35
BGrain size ( μ m ) 133133133133133
Carbon (wt. %)0.30.350.380.420.55
CGrain size ( μ m ) 133205300330360
Carbon (wt. %)0.350.350.350.350.35
DGrain size ( μ m ) 133205300330360
Carbon (wt. %)0.30.350.380.420.55
Table 4. Comparison between the volume fractions of retained austenite ( γ R ) .
Cooling Rate (°C/s) γ R —Simulation (%) γ R —Experimental (%)
0.0152018
30.0060.0035

