1. Introduction
Selective laser melting (SLM) is an additive manufacturing process that uses metal powder to build full-density parts in a layer-by-layer fashion. Currently, the technology is commercially distributed by a few manufacturers around the world, with a selection of alloys available, including titanium, stainless steel, aluminum, cobalt–chrome and nickel-based alloys [
1,
2,
3].
Since SLM uses a bed filled with a fine metal powder layered over a substrate, this process has become associated with the powder bed fusion (PBF) process. It includes common printing techniques such as direct metal laser sintering (DMLS), electron beam melting (EBM), and selective laser sintering (SLS). Although these printing techniques share some similarities, were developed by diverse organizations/companies during different time periods and have relatively different printing strategies (raster) and modes of operation [
4]. Most of the initial research and development (R&D) was undertaken 35 years ago, with the first commercial equipment launched in the 1990’s, consequentially bringing more awareness in the research community and fomenting more studies in the field that helped to improve the technology over the years [
5,
6].
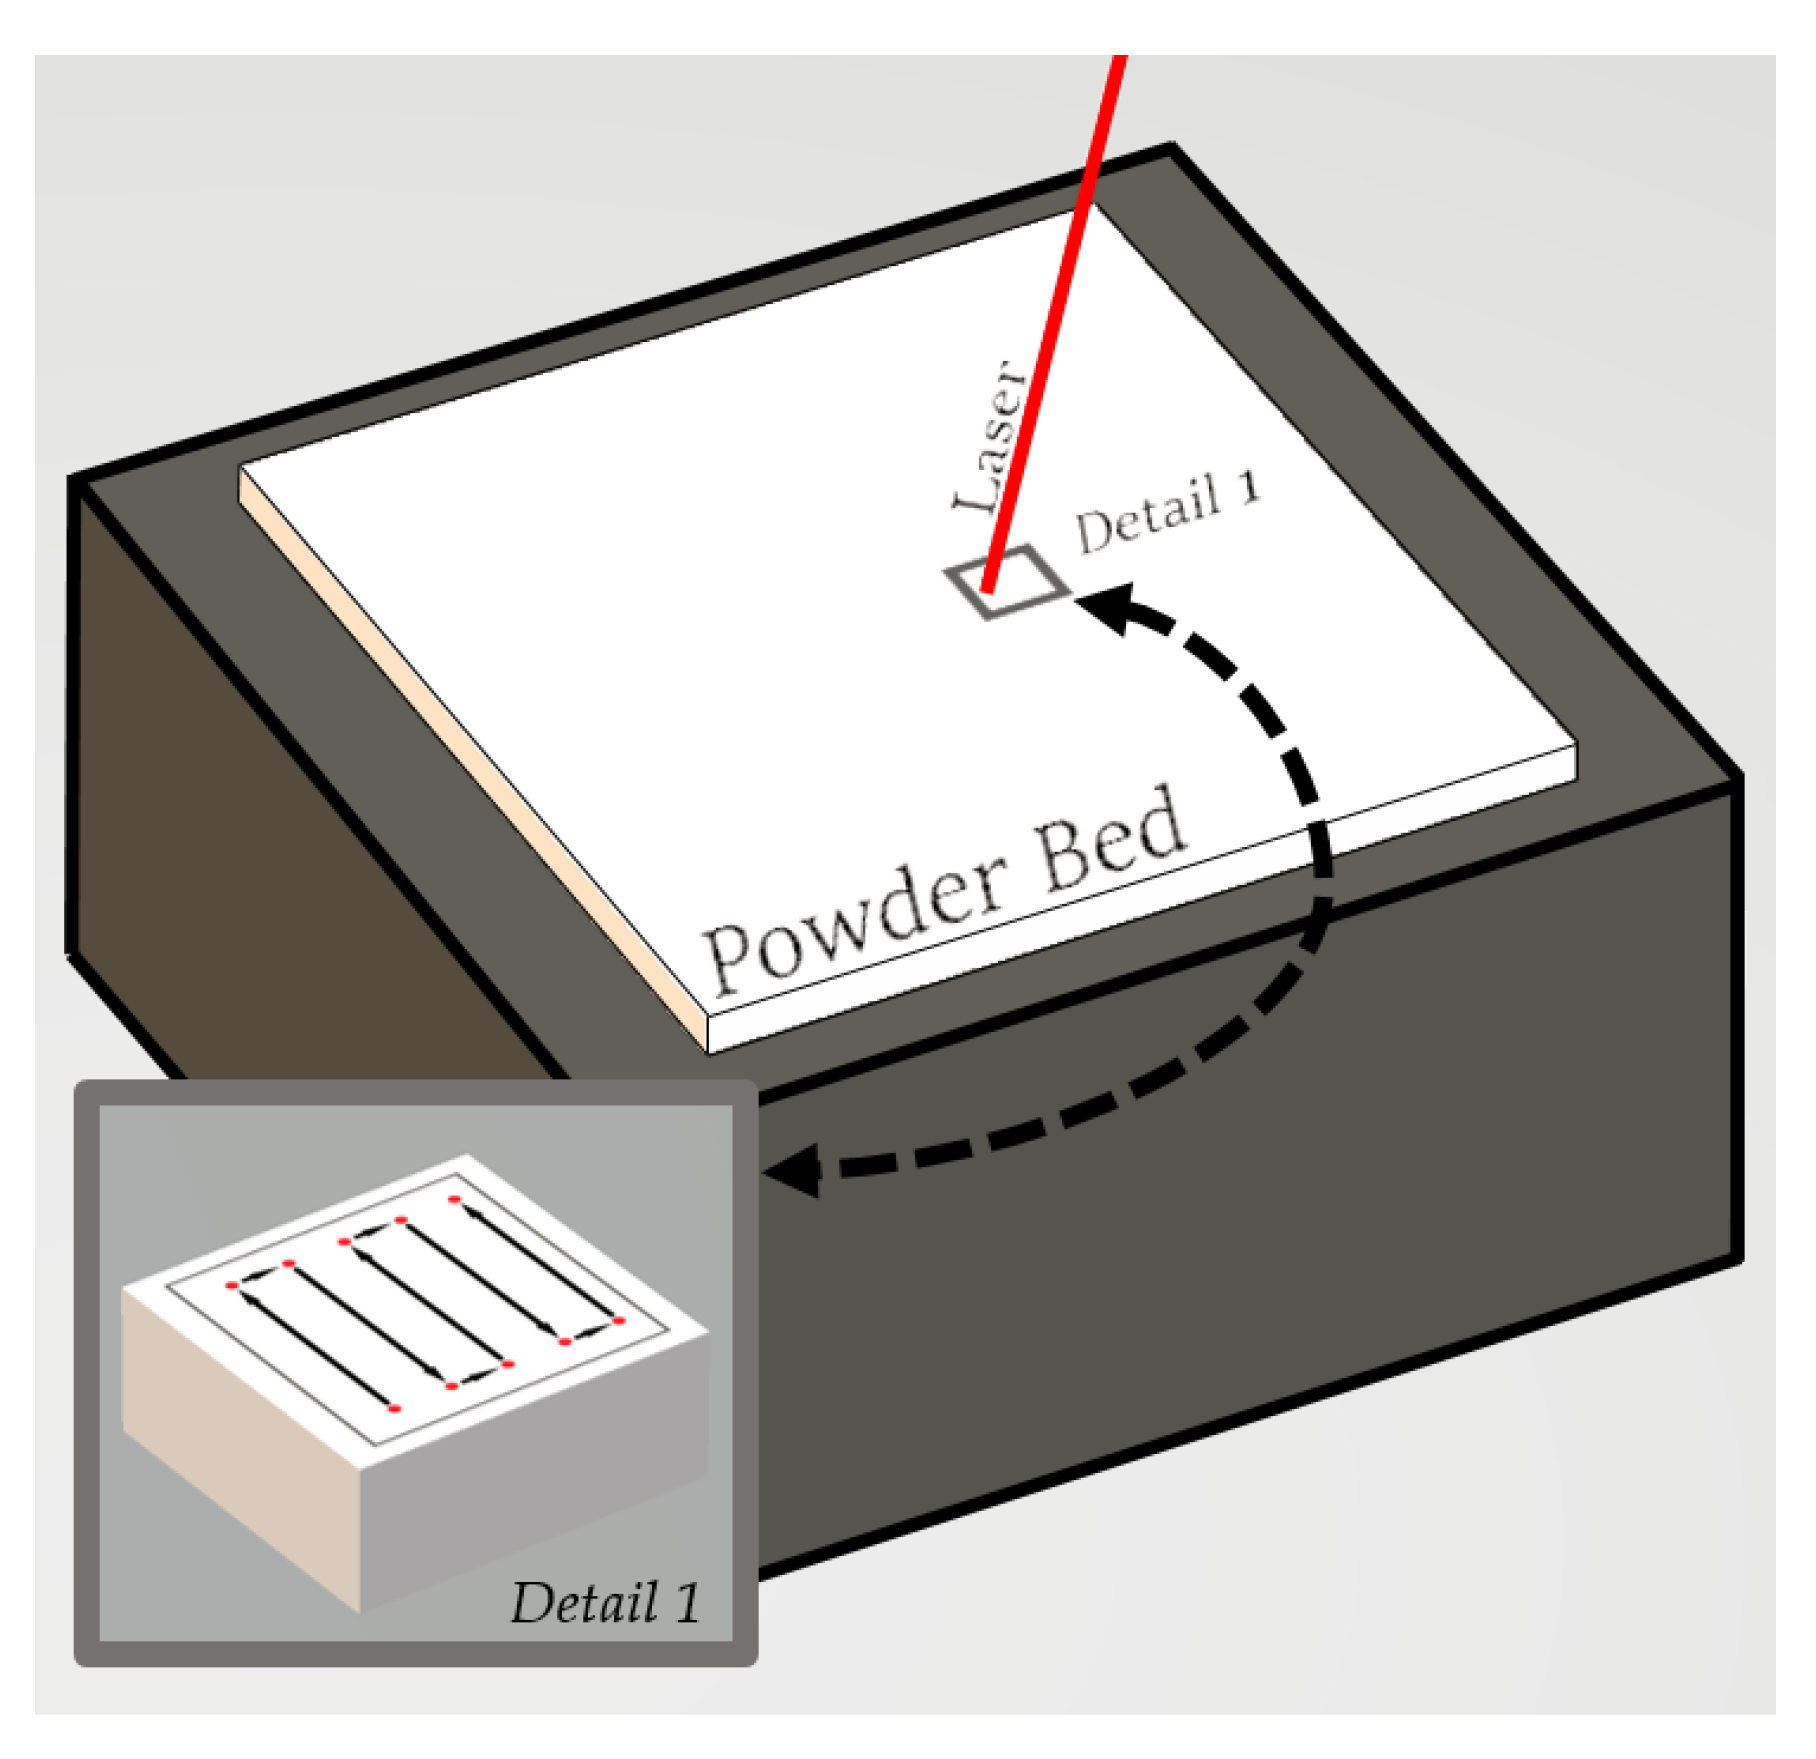
Figure 1 shows a simple schematic of the process, with highlighted detail showing laser scanning inside a region.
The introduction of SLM into the market opened a new field of advanced studies on the process, largely involving numerical and experimental research. Process and environment parameters are known to play an important role in determining the final mechanical properties of the parts produced by SLM, as several authors have demonstrated [
7]. Experimental studies consist of investigating mechanical properties, microstructures, the effect of parameters (sensibility), and several other aspects of the material. These studies have been performed since the commercialization of this technology first began, and there have been many important research findings that helped to improve the process overall. However, in the last 10 years, due to the advancement of computational capability and the development of dedicated finite element method software in the field, numerical analysis studies have increased substantially [
8]. There is considerable research involving multi-coupled aspects of the process; yet, the majority of studies maintain single-mode analysis to reduce computational cost and model complexity. Multi-coupled models tend to show high non-linearity and undesired deformation, leading to increased time to perform simulations and consequently high computational cost. The models used most often are thermal, kinetic, fluid dynamics (molten pool), discrete element methods (DEM), as well as the subsequent coupling of one or more type of analysis [
4].
Recent progress has been achieved in the development of new alloys for PBF processes. Biomedical and aerospace applications are the most explored fields, which devote specific microstructure and material properties that match the requirements of its use [
9,
10]. Most of this work is entirely done by studying the impacts of laser energy density upon the final material properties and analyzing the discontinuities, such as cracks, delamination, balling effect, heat affected zone (HAZ) and residual stresses. The laser energy density is defined as a relation between laser power input
P (W), the scan speed
v (mm/s), the layer thickness
t (mm), and the hatch distance
s (mm). Equation (1) shows the relation below:
An experimental study using pure titanium (CP-Ti) showed that when applying a fixed laser energy density (120 J/mm³) is enough to produce 99.5% of relative density, however the high density is largely affected by the laser power and hatching distance combinations [
9]. On the same study, when comparing a cast to SLM-built titanium alloys, the SLM-built sample displayed considerably better performance for wear resistance, yield strength and Vickers micro-hardness. The porous titanium alloys production by SLM proved to be effectively in biomedical applications, and their properties can be tailored in order to resemble human bones for better osseointegration [
9]. EBM-built parts are as well explored in biomedical application, especially to produce lattice materials from topology optimization analysis. Different EBM-built material samples with up to 70% porosity displayed acceptable mechanical properties for specific applications [
10].
Microstructure studies are developed as well in order to correlate the mechanical properties with grain size and material phase. Liu et al. [
11,
12] analyzed the microstructure and mechanical properties of
β-type Ti-24Nb-4Zr-8Sn produced by EBM and SLM processes and the gradient in microstructure from AlSi10Mg samples produced by SLM. Titanium samples from SLM exhibited a single
β-phase, while EBM-built samples consisted of
α +
β phases, meaning that faster cooling rates from SLM process induced the formation of
β dendrites leading to low Young’s modulus when compared with EBM-built parts. It is noticed how the laser/electron beam spot influenced the heat-affected zone as well, with EBM displaying high HAZ due the larger electron beam spot (~200 µm versus ~40 µm from SLM) [
11]. AlSi10Mg samples produced by SLM using 30 µm thickness and 1500 mm/s of scanning speed experienced cooling rates in the order of 1.44 × 10⁶ K/s on the top of the powder bed and around 1 × 10³ K/s on the bottom [
12]. The high cooling rates presented in the melt pool were responsible for the gradient microstructure found, meaning that the grains in the surface are finer than on the core, resulting in larger wear resistance and hardness [
12].
The numerical simulation of PBF processes has improved the understanding of the parameter effects in several outcomes. Denlinger et al. [
13] conducted a thermal modeling experiment of Inconel 718 with an in-situ temperature setup to acquire temperature distributions. The model predicted the temperature distribution with an error of 11% during the acquisition period and showed that conductivity in powdered media should be accounted for in PBF analyses. Huang et al. [
14] also performed a similar study using TiAl6V4, with results indicating that laser power plays a more fundamental role in thermal behavior compared with other parameters such as scan speed and hatch distance. However, shorter hatch distances and tracks can decrease the temperature gradient while at the same time increasing the maximum temperature achieved. Shaw and Dai [
15] developed coupled thermo-mechanical models for multi-material behavior and analyzed residual stresses; Cheng et al. [
16] investigated residual stresses and the deformation of a multi-layer model using different scanning strategies; and finally, Vastola et al. [
17] conducted a parameter analysis on the final residual stresses state when performing a single track using TiAl6V4.
Liu et al. [
18] have conducted the study of SLM-built lattice materials under compressive testing and cyclic load-unloading condition with different strains. A FEM model built in Comsol was then employed to visualize the local stress concentration for each lattice configuration. Results obtained in this study have shown that the energy absorption for all cases is directly attributed to the difference between stress distributions and the local stress concentrations [
18]. Loh et al. [
19] conducted a parametric study, building a FE model able to predict melt-pool geometry on a SLM process using aluminum 6061. Among the findings presented, the high laser power and low scanning speed are responsible for increased melt penetration and width; similarly, when using low laser power and high scanning speed the phenomena were also observed, although the latter is more energy efficient [
19].
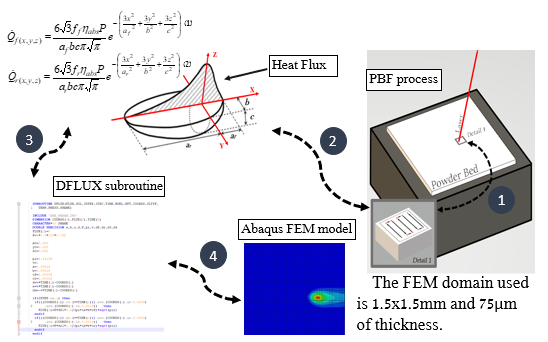
Based on a comprehensive literature study, the proposed model’s main objective is to demonstrate the high capability of FEM, utilizing for that a low computational cost parametric thermal model able to predict temperature distributions when scanning a single layer and track of the powder bed. Some of the aspects of the discrete method are implemented, although only in the thermal conductivity implementation method. We start with the laser power model using a double-ellipsoidal Gaussian profile as the heat flux input into the FEM model. Next, the material is defined, considering the state (solid, liquid, powder) and the temperature dependency. Special attention is devoted to the thermal conductivity of the powder and for that, an effective thermal conductivity is compiled to determine the variance in all conditions (packing density and powder diameter). Important commitment is given to the phase change and emissivity of powder as well. Finally, the model is assembled for all conditions and solved, leading to the results and analysis sessions. The powder diameter and the packing density are the focuses here, in order to determine the impact on the temperature profile during three sets of power input sources.
2. Packing Density
The contact between the powder particles is an important factor when analyzing the effective thermal conductivity of the powder bed. The size of the powder particles, their distribution, and their shape affect the contact area between the particles, which influences effective thermal conductivity [
20]. Kovalev and Gusarov [
20,
21] have studied the effects of monodispersed and polydispersed powder beds and the different packing densities on the particle thermal conductivity using FEM packed spheres (DEM modeling). They obtained satisfactory results when comparing with the analytical solution based on Hertz contact theory [
22].
The packing density (relative density) of the powder bed directly affects powder porosity, one of the main parameters of effective thermal conductivity. The following are important prior observations about the powder that are considered in this study.
General principal assumptions:
The relative density was calculated assuming a perfect monodispersed spherical powder;
The powder bed was modeled as a whole, meaning that our model represents the total volume occupied by the powder bed, not the individual powder particles;
Contact between particles was considered to be in the elastic zone, with no plastic deformation;
External loads were neglected, and only gravitational forces were accounted for.
2.1. Packing Structures
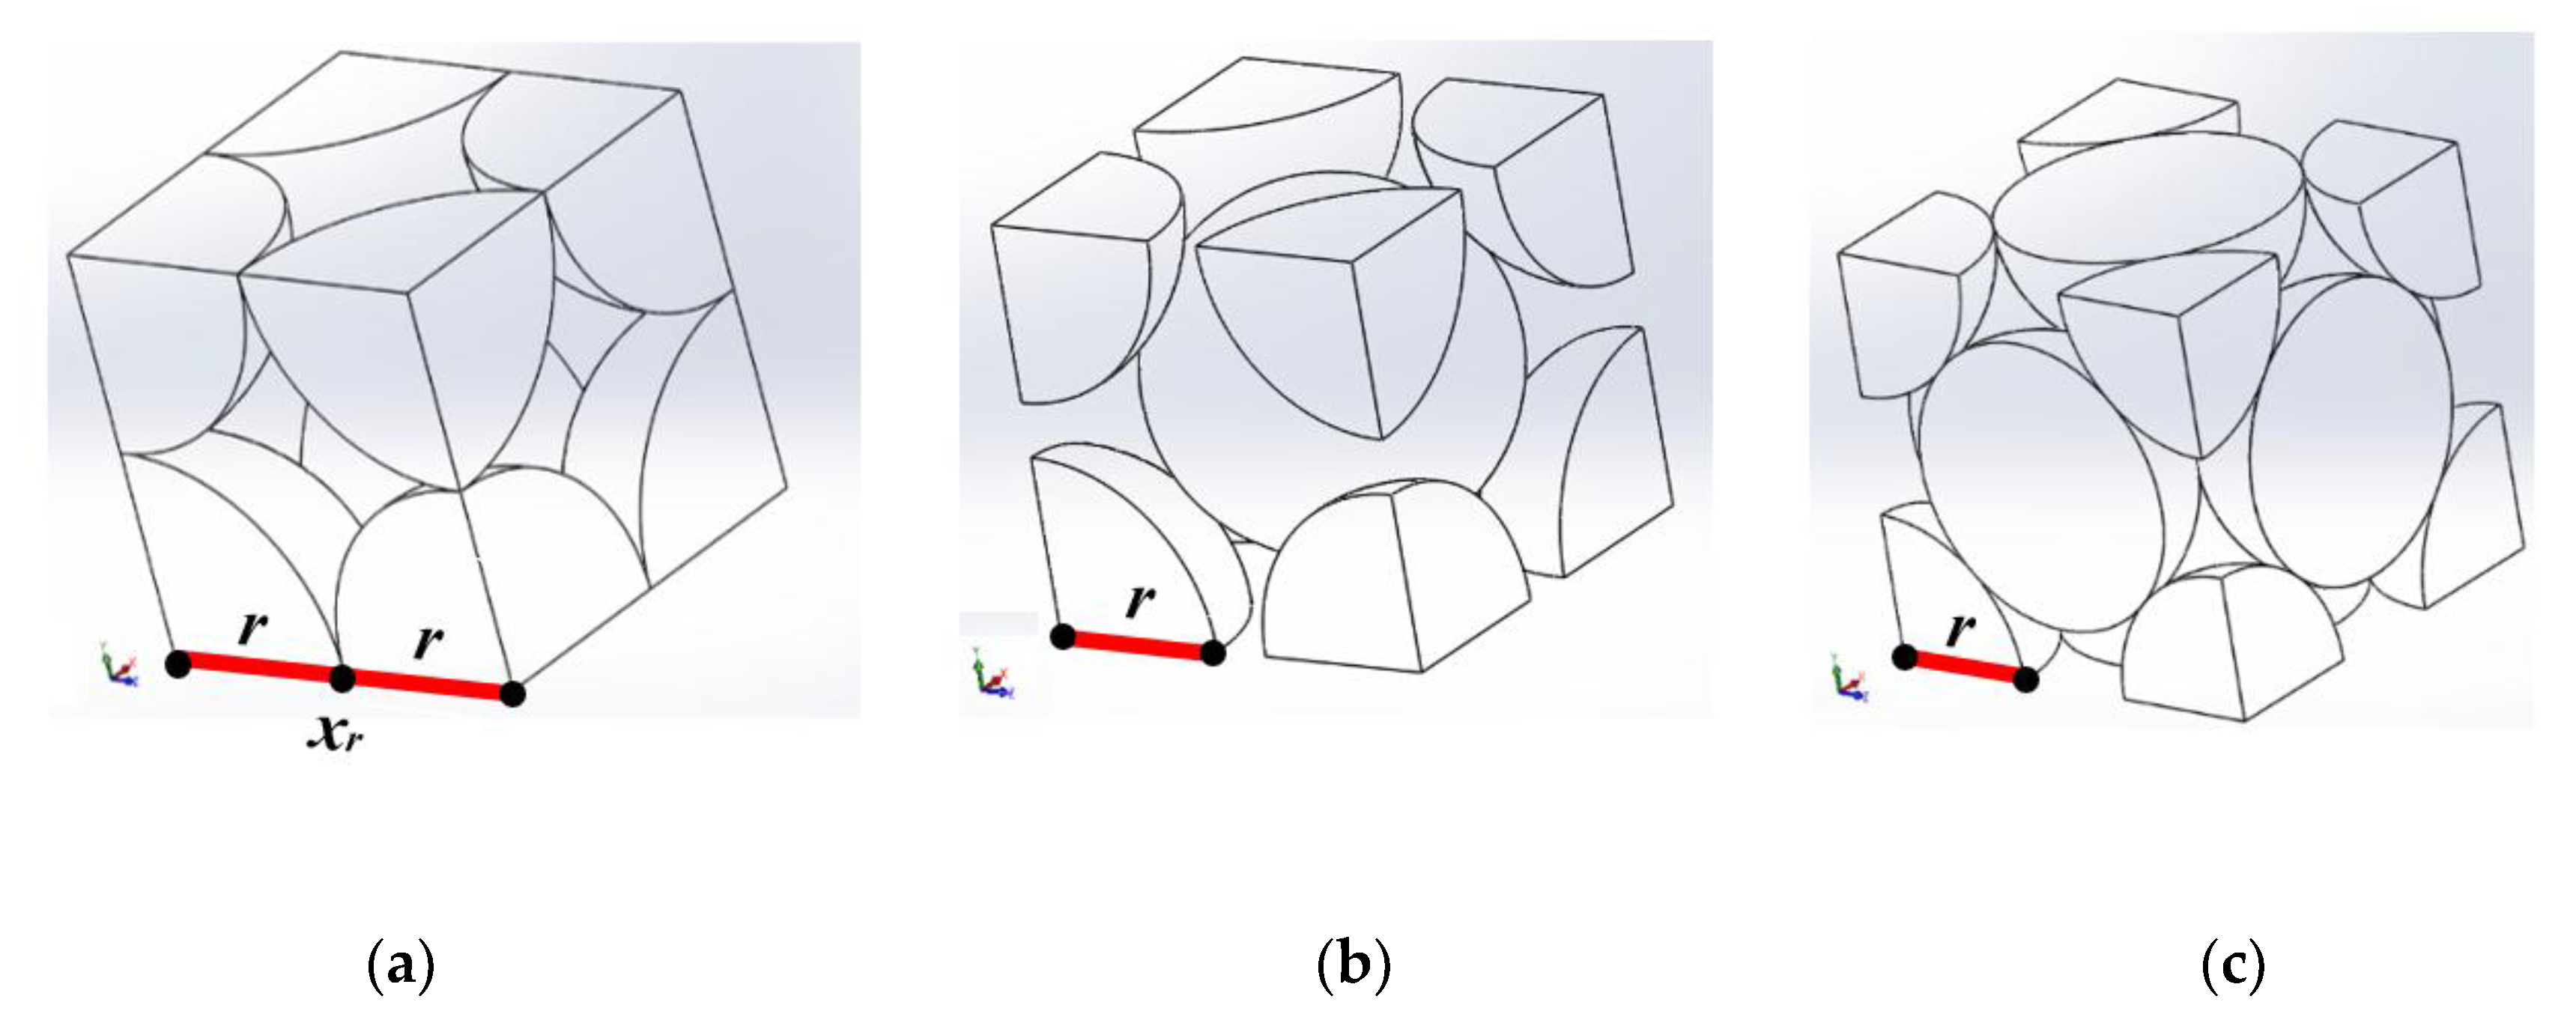
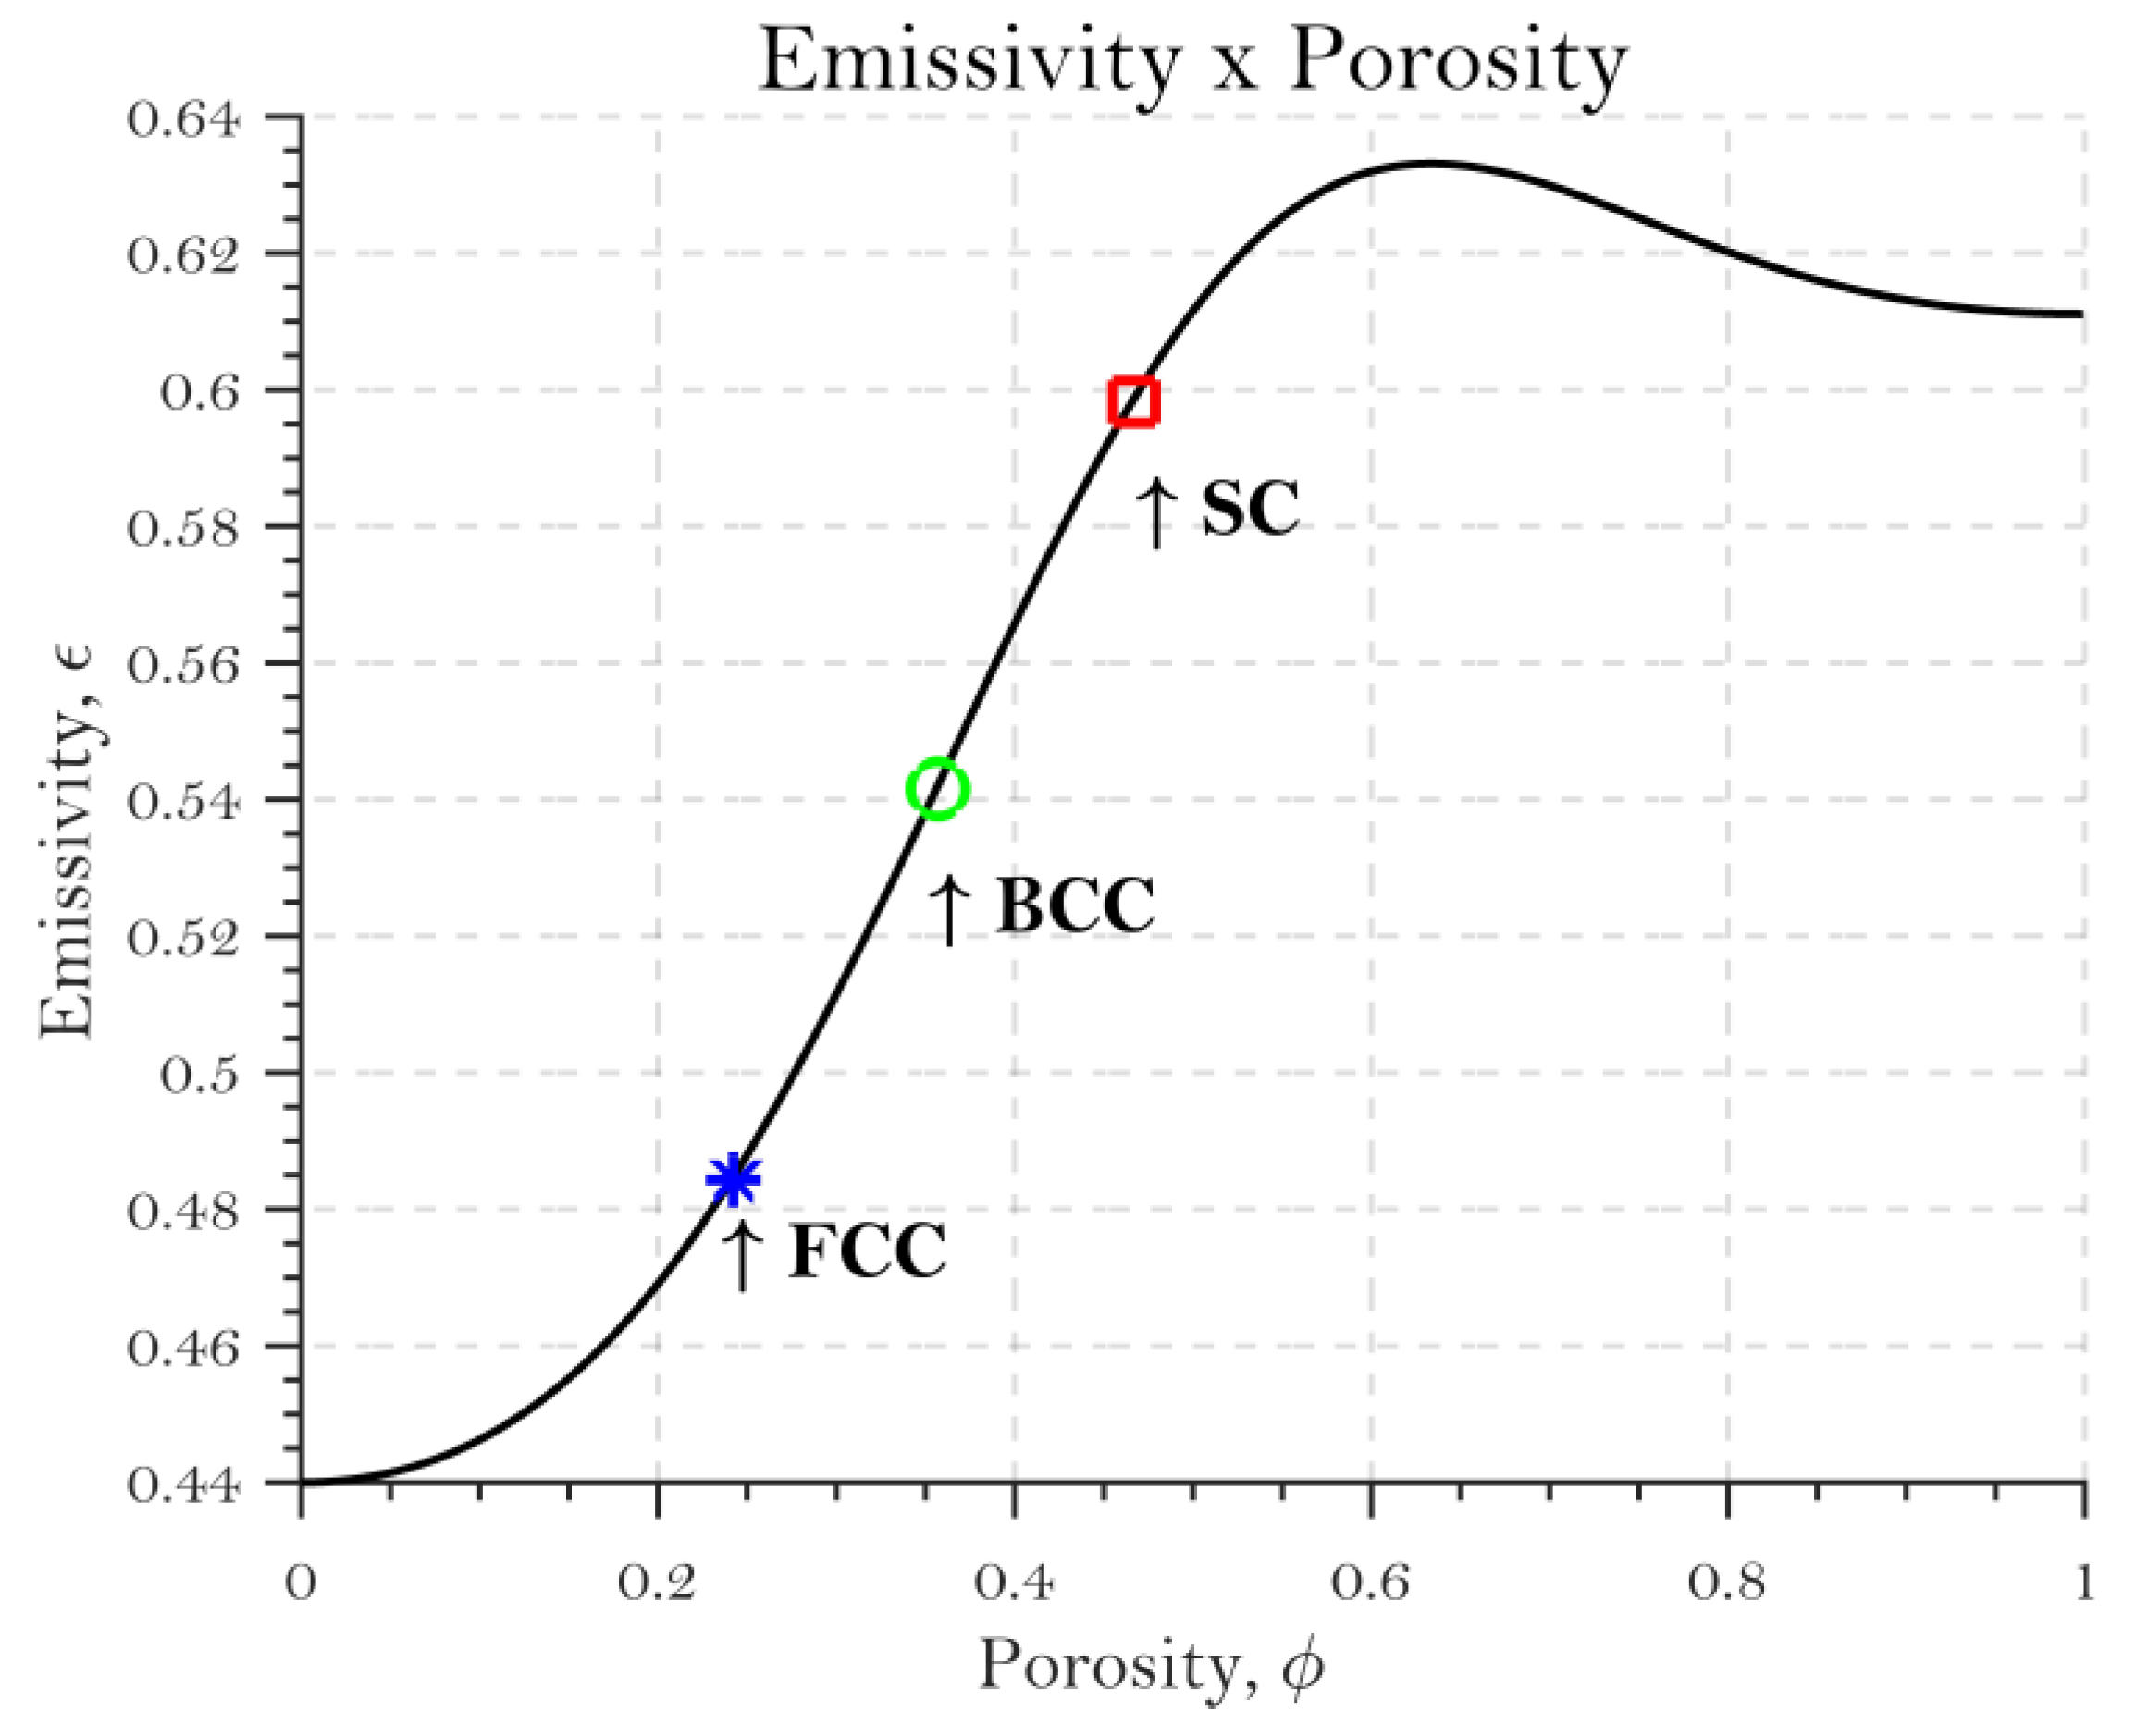
Three different packing structures were analyzed. The simple cubic (SC), mostly known as a cubic structure, is a packing structure with a relative density of 0.523 and represents the least dense packing structure in this study. The body-centered cubic (BCC) packing structure has an intermediate relative density of 0.68. The face-centered cubic (FCC) packing structure, mostly known as a close-packed structure, has a relative density of 0.74.
Although there are several other packing possibilities described in the literature, such as diamond-like (relative density of 0.34) and hexagonal close-packed (relative density of 0.74048), it was not the objective of this study to include those structures, since the results of the included packing structures can be extrapolated. In this case, the relative density is described by the atomic packing factor, which is calculated using the following equation:
where
is the number of particles per unit cell (cube in this case),
is the volume of each corresponding particle, and
is the volume of the unit cell. The
Figure 2 below shows the packing structure of SC, BCC and FCC respectively.
For instance, the SC structure in
Figure 2b has eight 1/8 of a particle at each corner, giving a total of 1 particle per unit cell. Each particle, a sphere, has a volume of 4
πr³/3, and the volume of the unit cell (cube) is represented by (2
r)³. These parameters yield the following relative density:
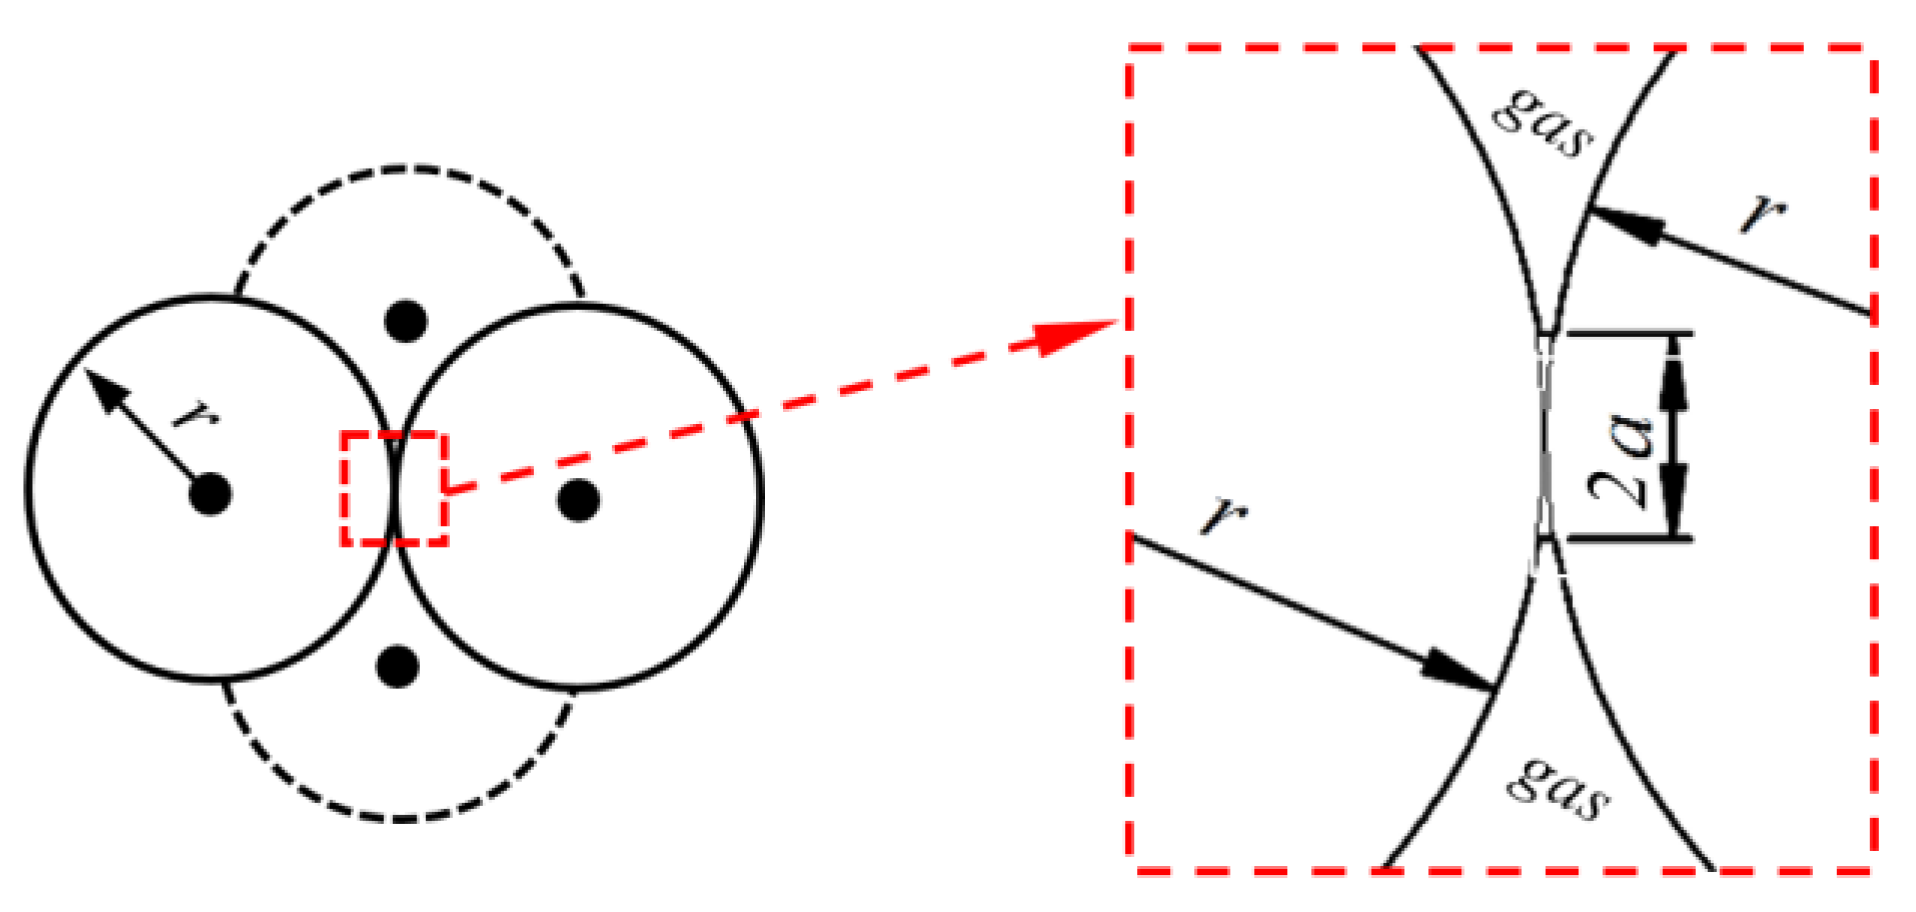
2.2. Contact Area and Porosity of the Powder Bed
The contact of two adjacent spherical particles is essential when calculating thermal conductivity, since heat exchange occurs primarily through conduction [
23]. The respective radius of contact is calculated by the Hertz theory applied for contact interaction of solid bodies [
22]. This contact area is very small (
Figure 3), especially in the present study, since no plasticity is considered and the only force acting among particles is gravity.
An equation derived from Dul’nev and Zarichnyak’s model is applied to define the porosity, as later Abyzov et al., Kovalev and Gusarov have successfully applied in their models to calculate the effective thermal conductivity [
20,
22,
24,
25]. Porosity,
φ, is expressed as function of coordination number,
N, as follows:
where the mean coordination number of a given particle,
N, is defined as the number of its neighbor’s particles that have their respective centers at a distance that corresponds exactly to the diameter of the original particle when studying monodispersed spheres. The correlation in Equation (5) is the mathematical representation of
N, while
M is the total number of particles in the domain and
is the number of contacts of a given j-particle. The mean coordination numbers for FCC, BCC, and SC packing structures are 12, 8, and 6, respectively, resulting in porosities of 0.2424, 0.3571, and 0.467, respectively. In previous work, the effects of powder packing in the bed were not analyzed, and a general porosity value of 0.400 was adopted [
4]. The equation for loading applied by a roller/scraper (
) and the material properties constant (
E*) is defined by Hertz elastic contact theory [
22].
where
a is the contact radius,
E is Young’s modulus and ν is the Poisson’s ratio. Combining load Equation (6) with Equation (7) and isolating for contact radius, we obtain the following:
In this study, besides the three packing densities, three different powder diameters are analyzed: 20, 60, and 100 μm. The normal contact load between the particles in the SLM process is difficult to account for analytically, and a proper compaction model by roller/scraper should be implemented. It was not the objective of this work to develop such a formulation, and hence only gravitational loads were the forces considered to be acting in the powder bed [
20].
The roller or scraper, when distributing a new layer of powder, can increase the load between the particles in the powder bed. However, no specific data or studies were found that associated the effect of the roller/scraper with packing structure or contact loading. We assume that as soon as the roller or scraper finished distributing a new layer, the additional load due to powder compaction ceased to exist. For this reason, in this study we assume that roller/scraper impact in the powder is only related to the particle packing structure, not to the actual compaction of powder through the powder bed.
4. Thermal Modeling of Selective Laser Melting (SLM) Heat Source
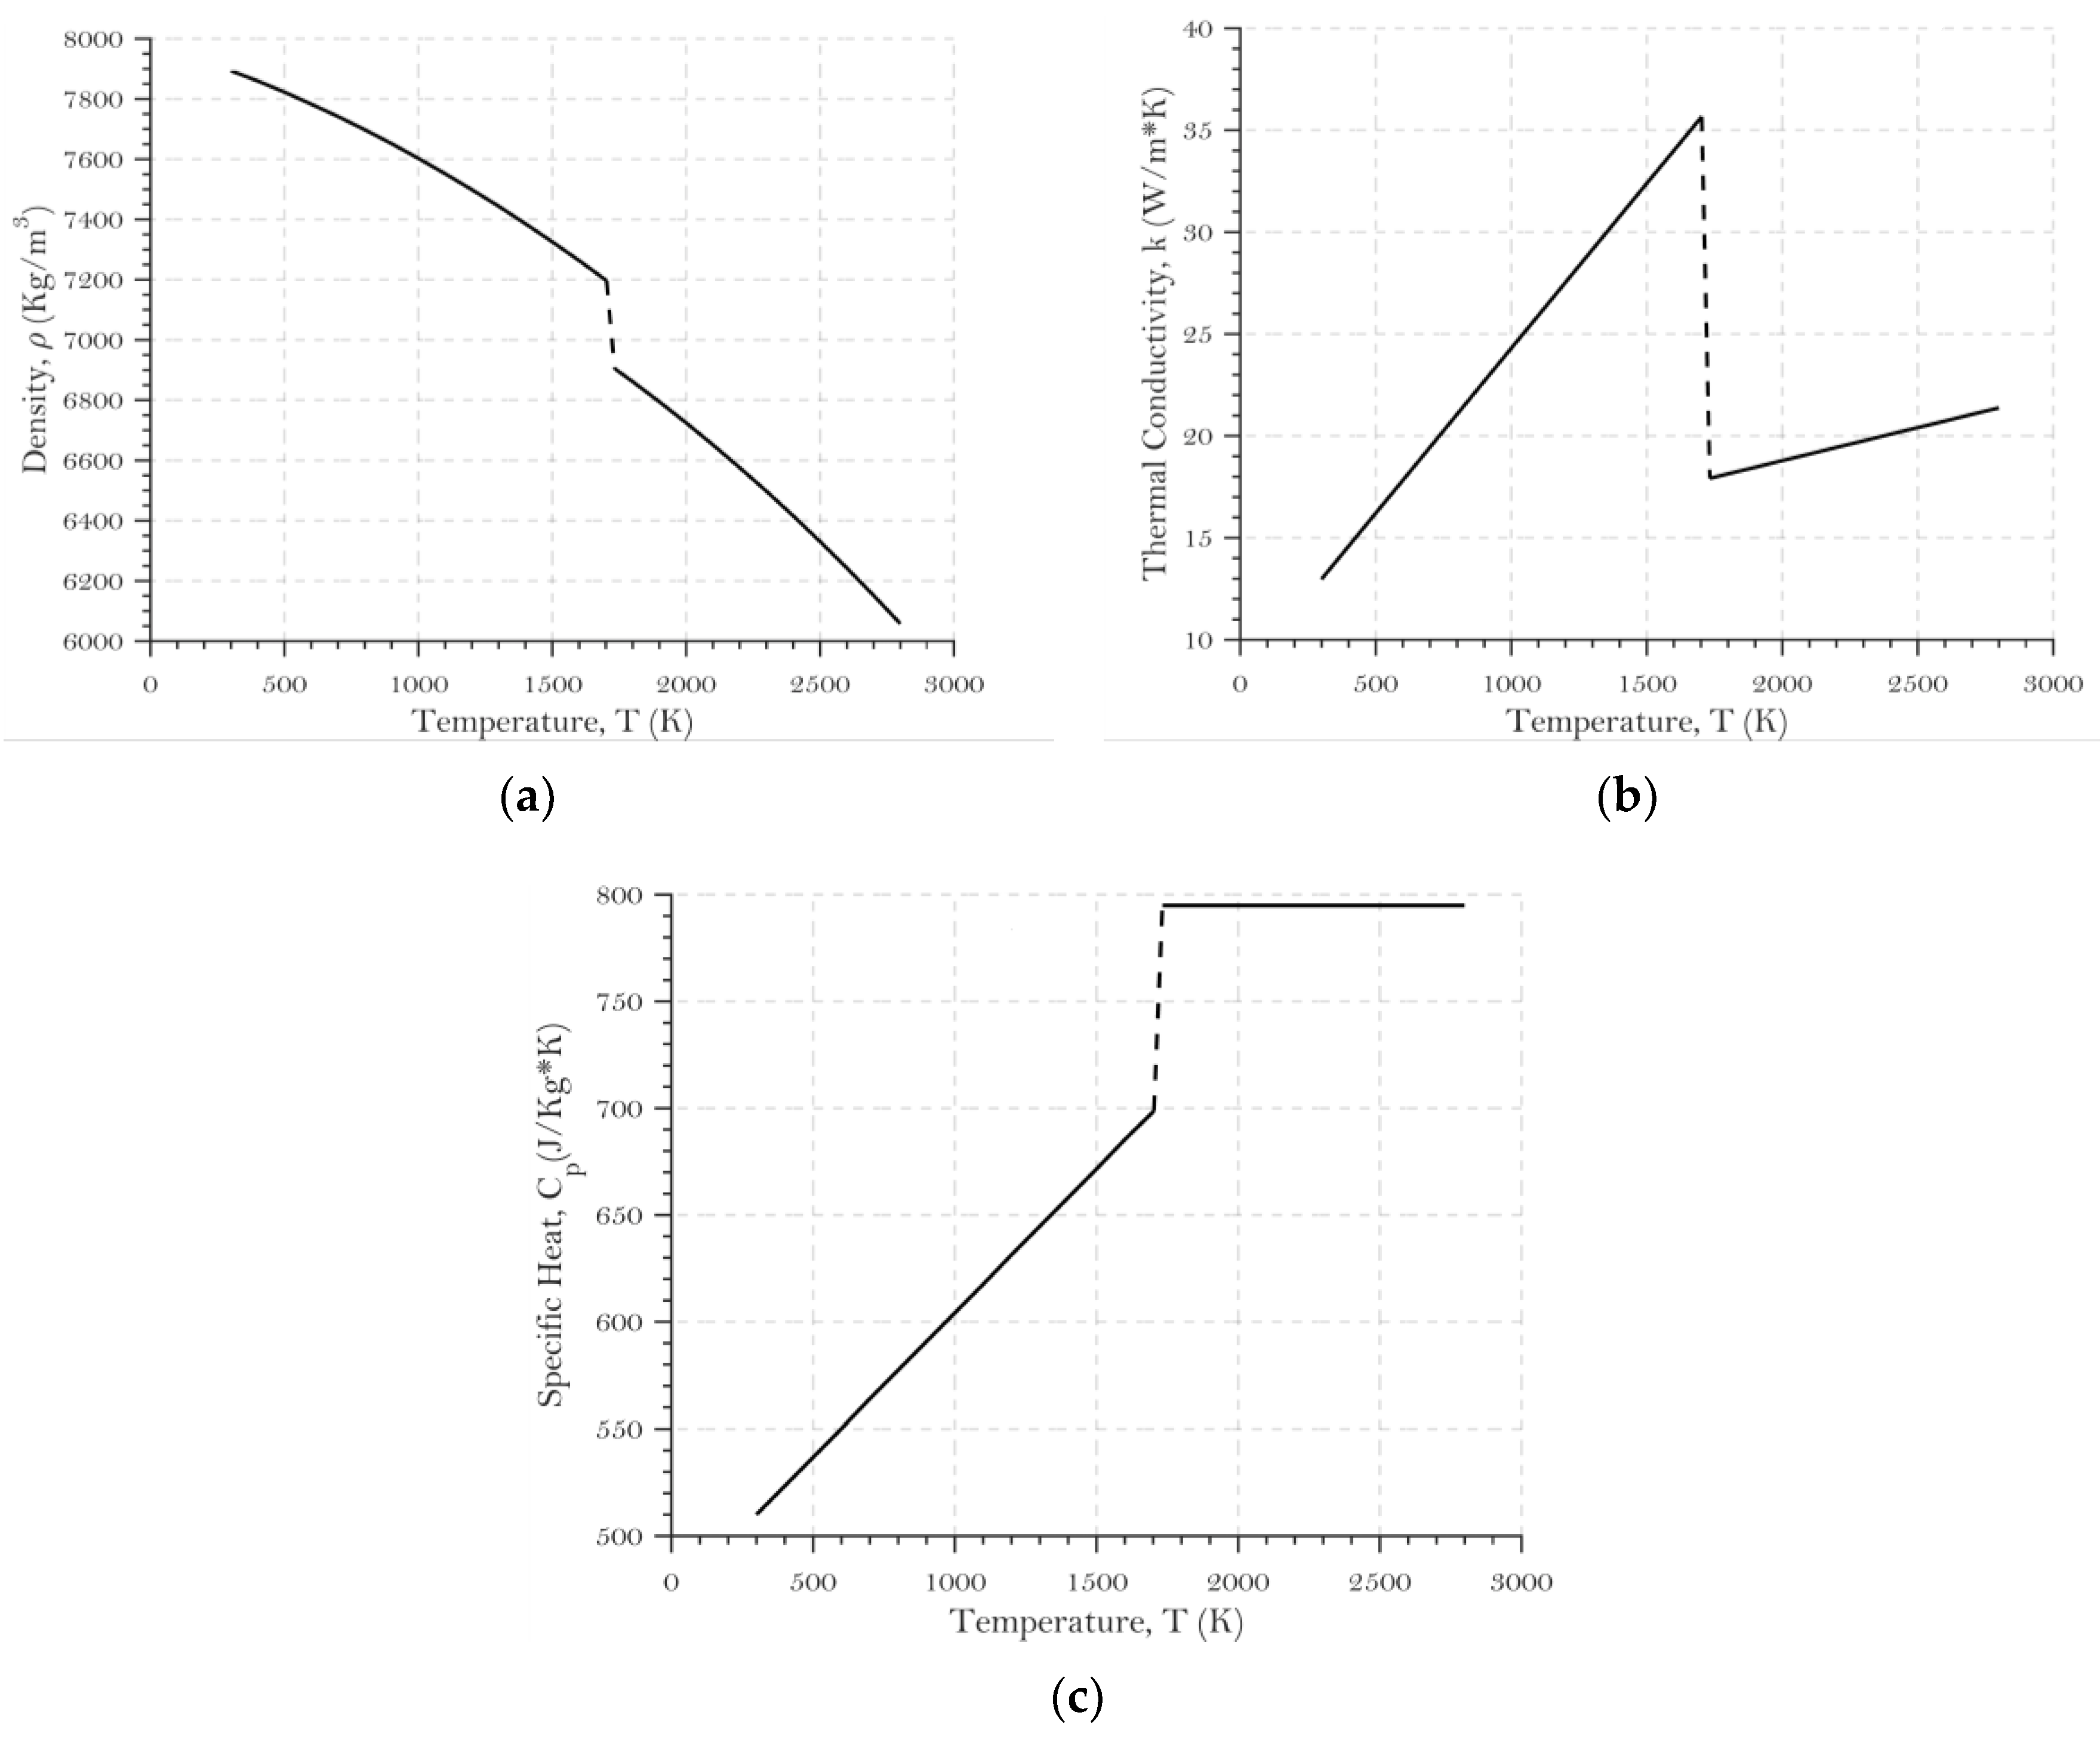
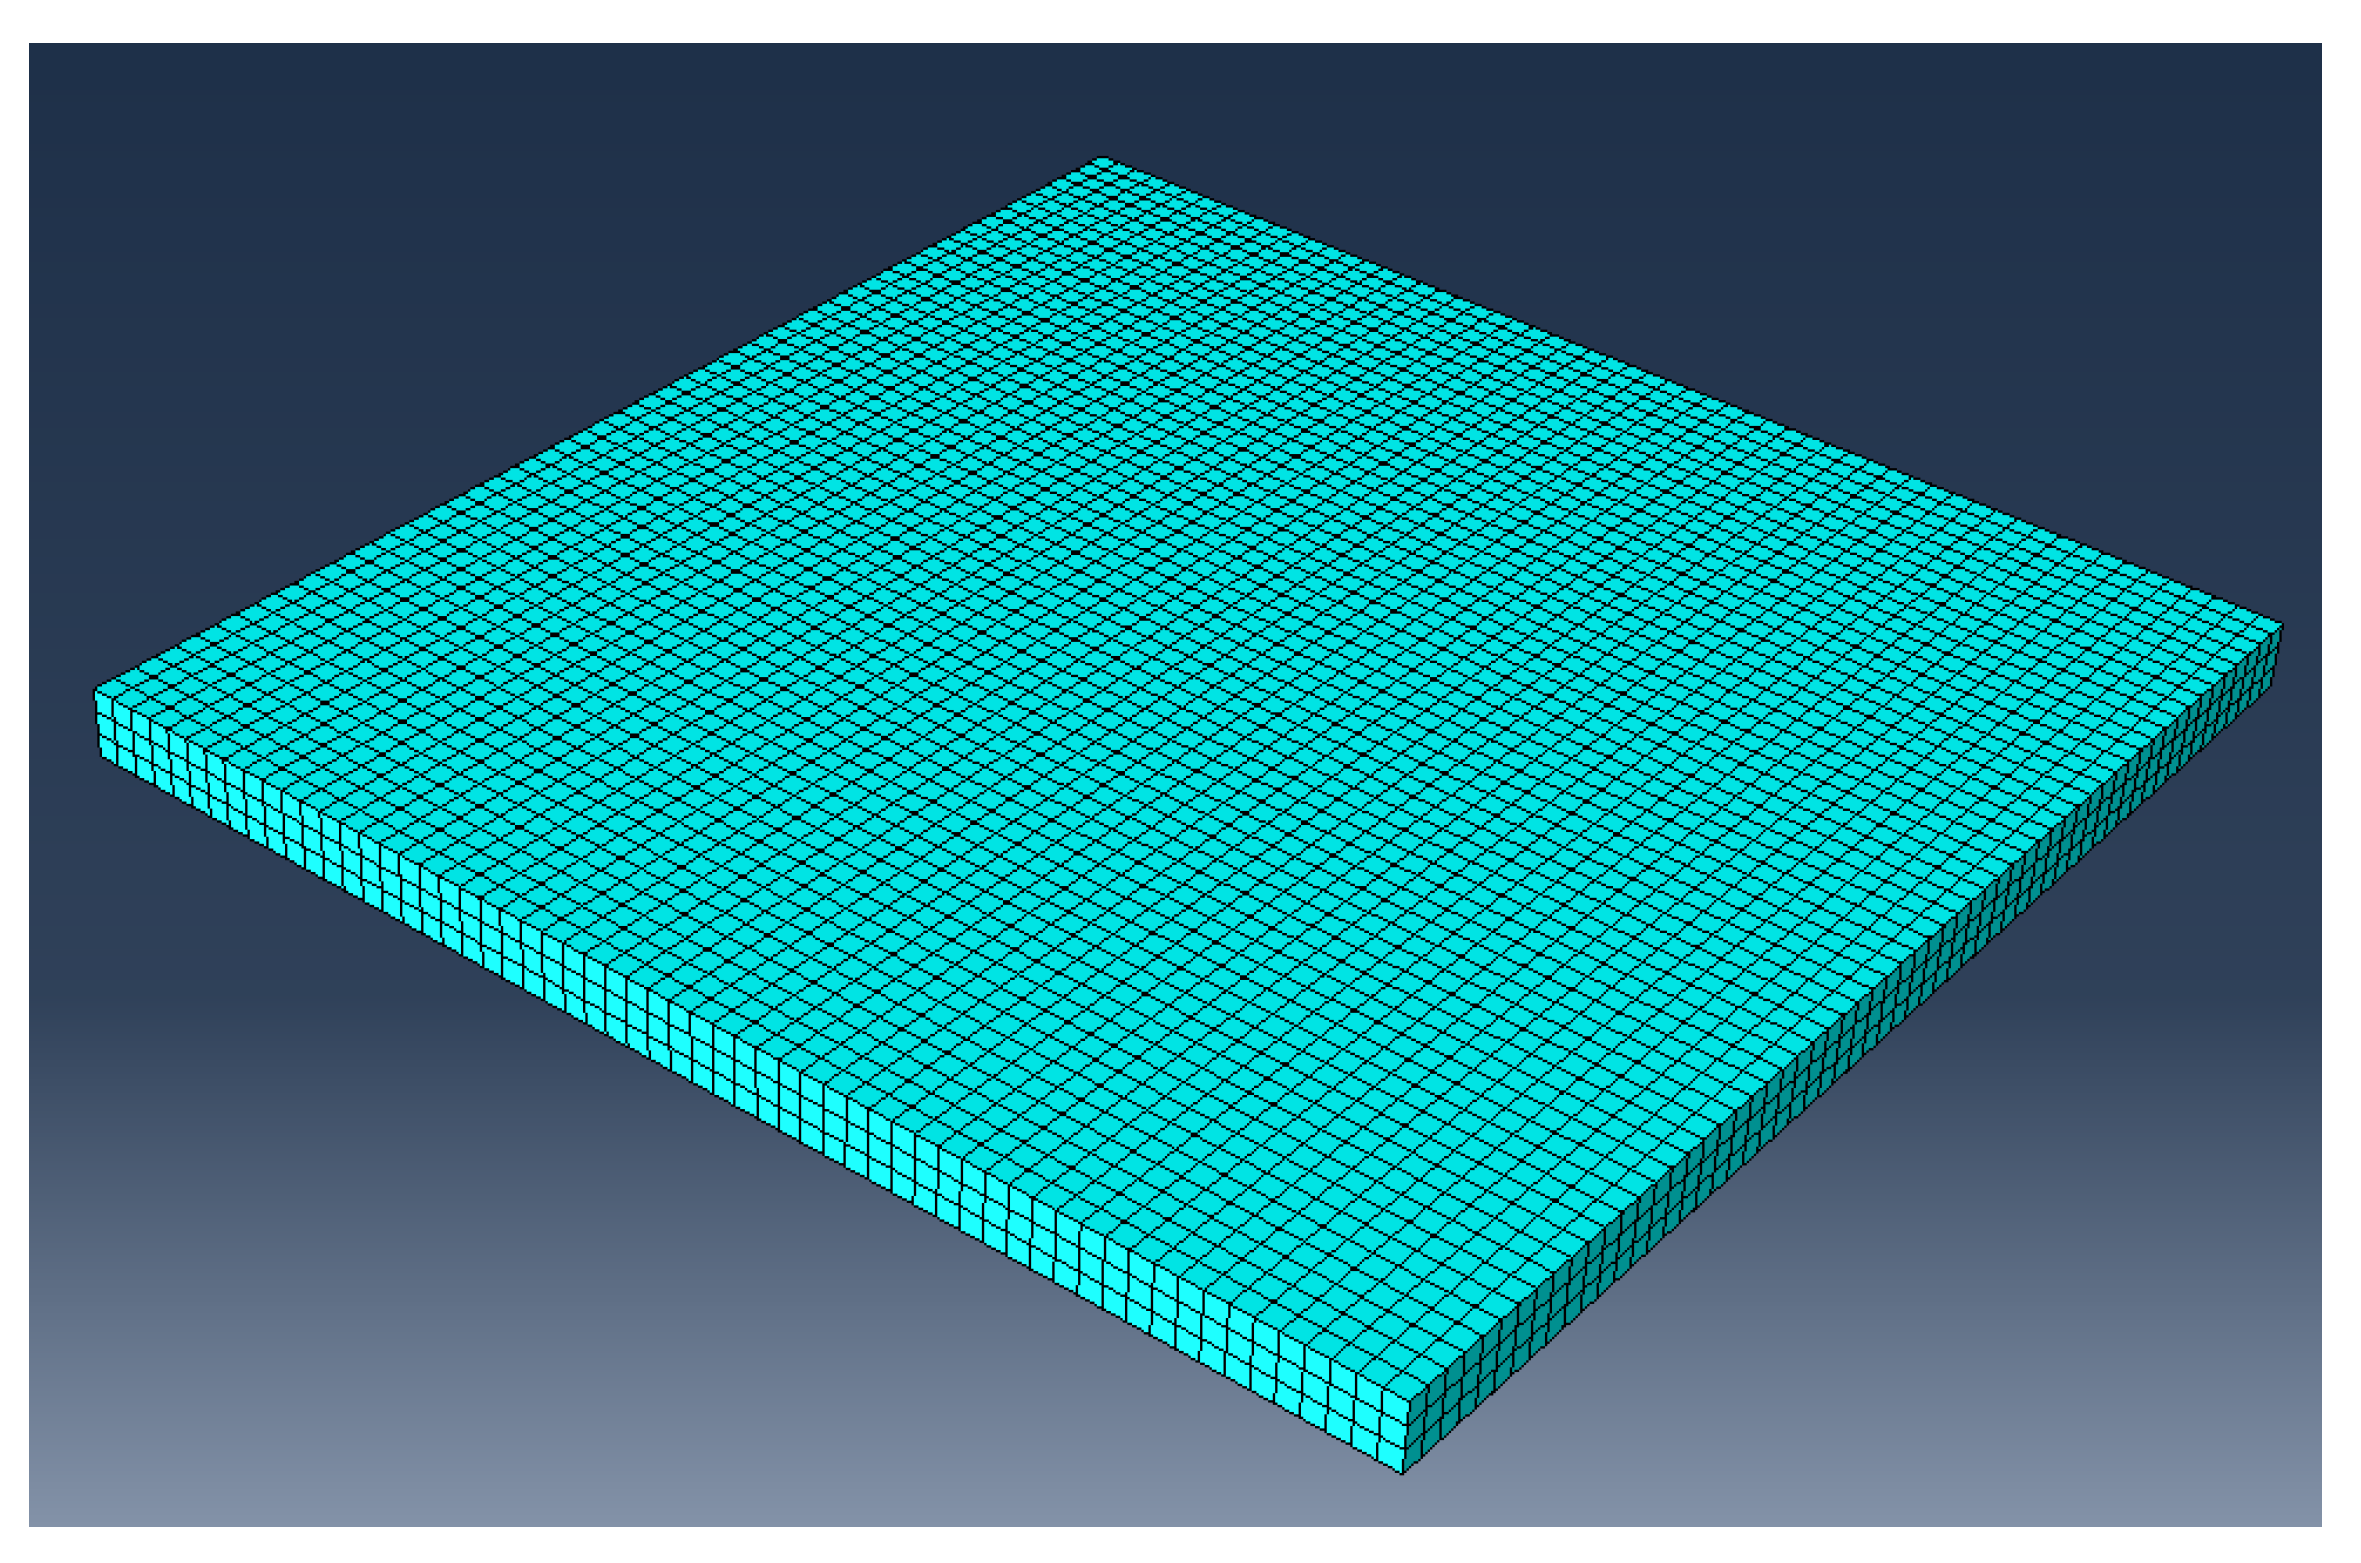
The thermal model was defined to handle materials in different phases (liquid, solid, and powder states) as well to account for their variation at different temperatures. A three-dimensional model was established using a 25 μm DC3D8 hexahedron element with a total domain of 1500 μm × 1500 μm × 75 μm (1.5 mm × 1.5 mm × 0.075 mm), as shown at
Figure 5. A small domain was justifiable given the small laser spot diameter of 50 μm used in the model and the very low thermal conductivity present on the bed.
The material was modeled as temperature and state dependent, allowing for more accurate representation of temperature distributions. Some additional considerations maintained low computational time and cost.
Principal assumptions of the FEM model:
Thermo-fluid effects were not considered, so the Marangoni effect and fluid flow in the melt pool were not accounted for;
Material vaporization is not accounted for, although the phenomena can take place at high temperatures. The impact of vaporization, however, would not affect the temperature distributions in this study [
27];
A single track of the laser was observed and the influence of the hatch distance was neglected to focus on the effect of packing structure and particle diameter on the temperature distributions;
Only average powder (particle) diameter was considered when calculating the effective thermal conductivity of the powdered state.
ABAQUS software was used to perform the analysis since its subroutines allow the modeling of a moving heat source and can track the material state. The subroutines DFLUX and FILM were implemented in this study to account for Gaussian heat flux and convection/radiation, respectively. The solution given is the temperature distribution of the process, described as
T(
x,
y,
z,
t). The problem is described by the three-dimensional heat conduction Equation (9) with the respective manufacturing and chamber environmental boundary conditions:
where
and
are the density and specific heat with temperature-dependent (
T) values, respectively,
is the heat flux, and
r represents the three-dimensional Cartesian coordinates of the model. Besides the conduction that is happening between the particles of powder, there are heat losses due to thermal convection and radiation. Both of these phenomena are factored into the model as boundary conditions, taking into account powder emissivity, the type of inert gas, and the initial temperature inside the chamber [
13]. These heat losses are represented by Equations (12) and (13), as follows:
where
is the convective heat transfer coefficient,
is the emissivity of the powder surface,
is the Stefan Boltzmann constant, and
T and
T₀ are the surface and ambient temperatures, respectively [
13]. To reduce computational cost, the convective and radiation heat transfers were modeled as a combined boundary condition. The main reason is that radiation is a highly nonlinear heat-transfer condition, which increases computational costs and time [
28]. In an experimental study by Vinokurov, the following equation combining radiation and convection was demonstrated to have less than a 5% loss in accuracy [
29]:
In the following section, the calculation of the properly powder emissivity, , will be introduced. The implementation of the combined coefficient of radiation and convection is done via user-defined subroutine FILM.
A high-powered laser is used to consolidate the powder in SLM systems; usually it uses a fiber laser from 100 to 1000 W [
1]. The laser, defined as a moving heat source, was modeled into the DFLUX subroutine and was formulated based on Goldak double-ellipsoidal heat source equations [
30]. This model has been used in several studies in this field and has proved to be in accordance with the melt pool profile induced in the powder bed [
31,
32].
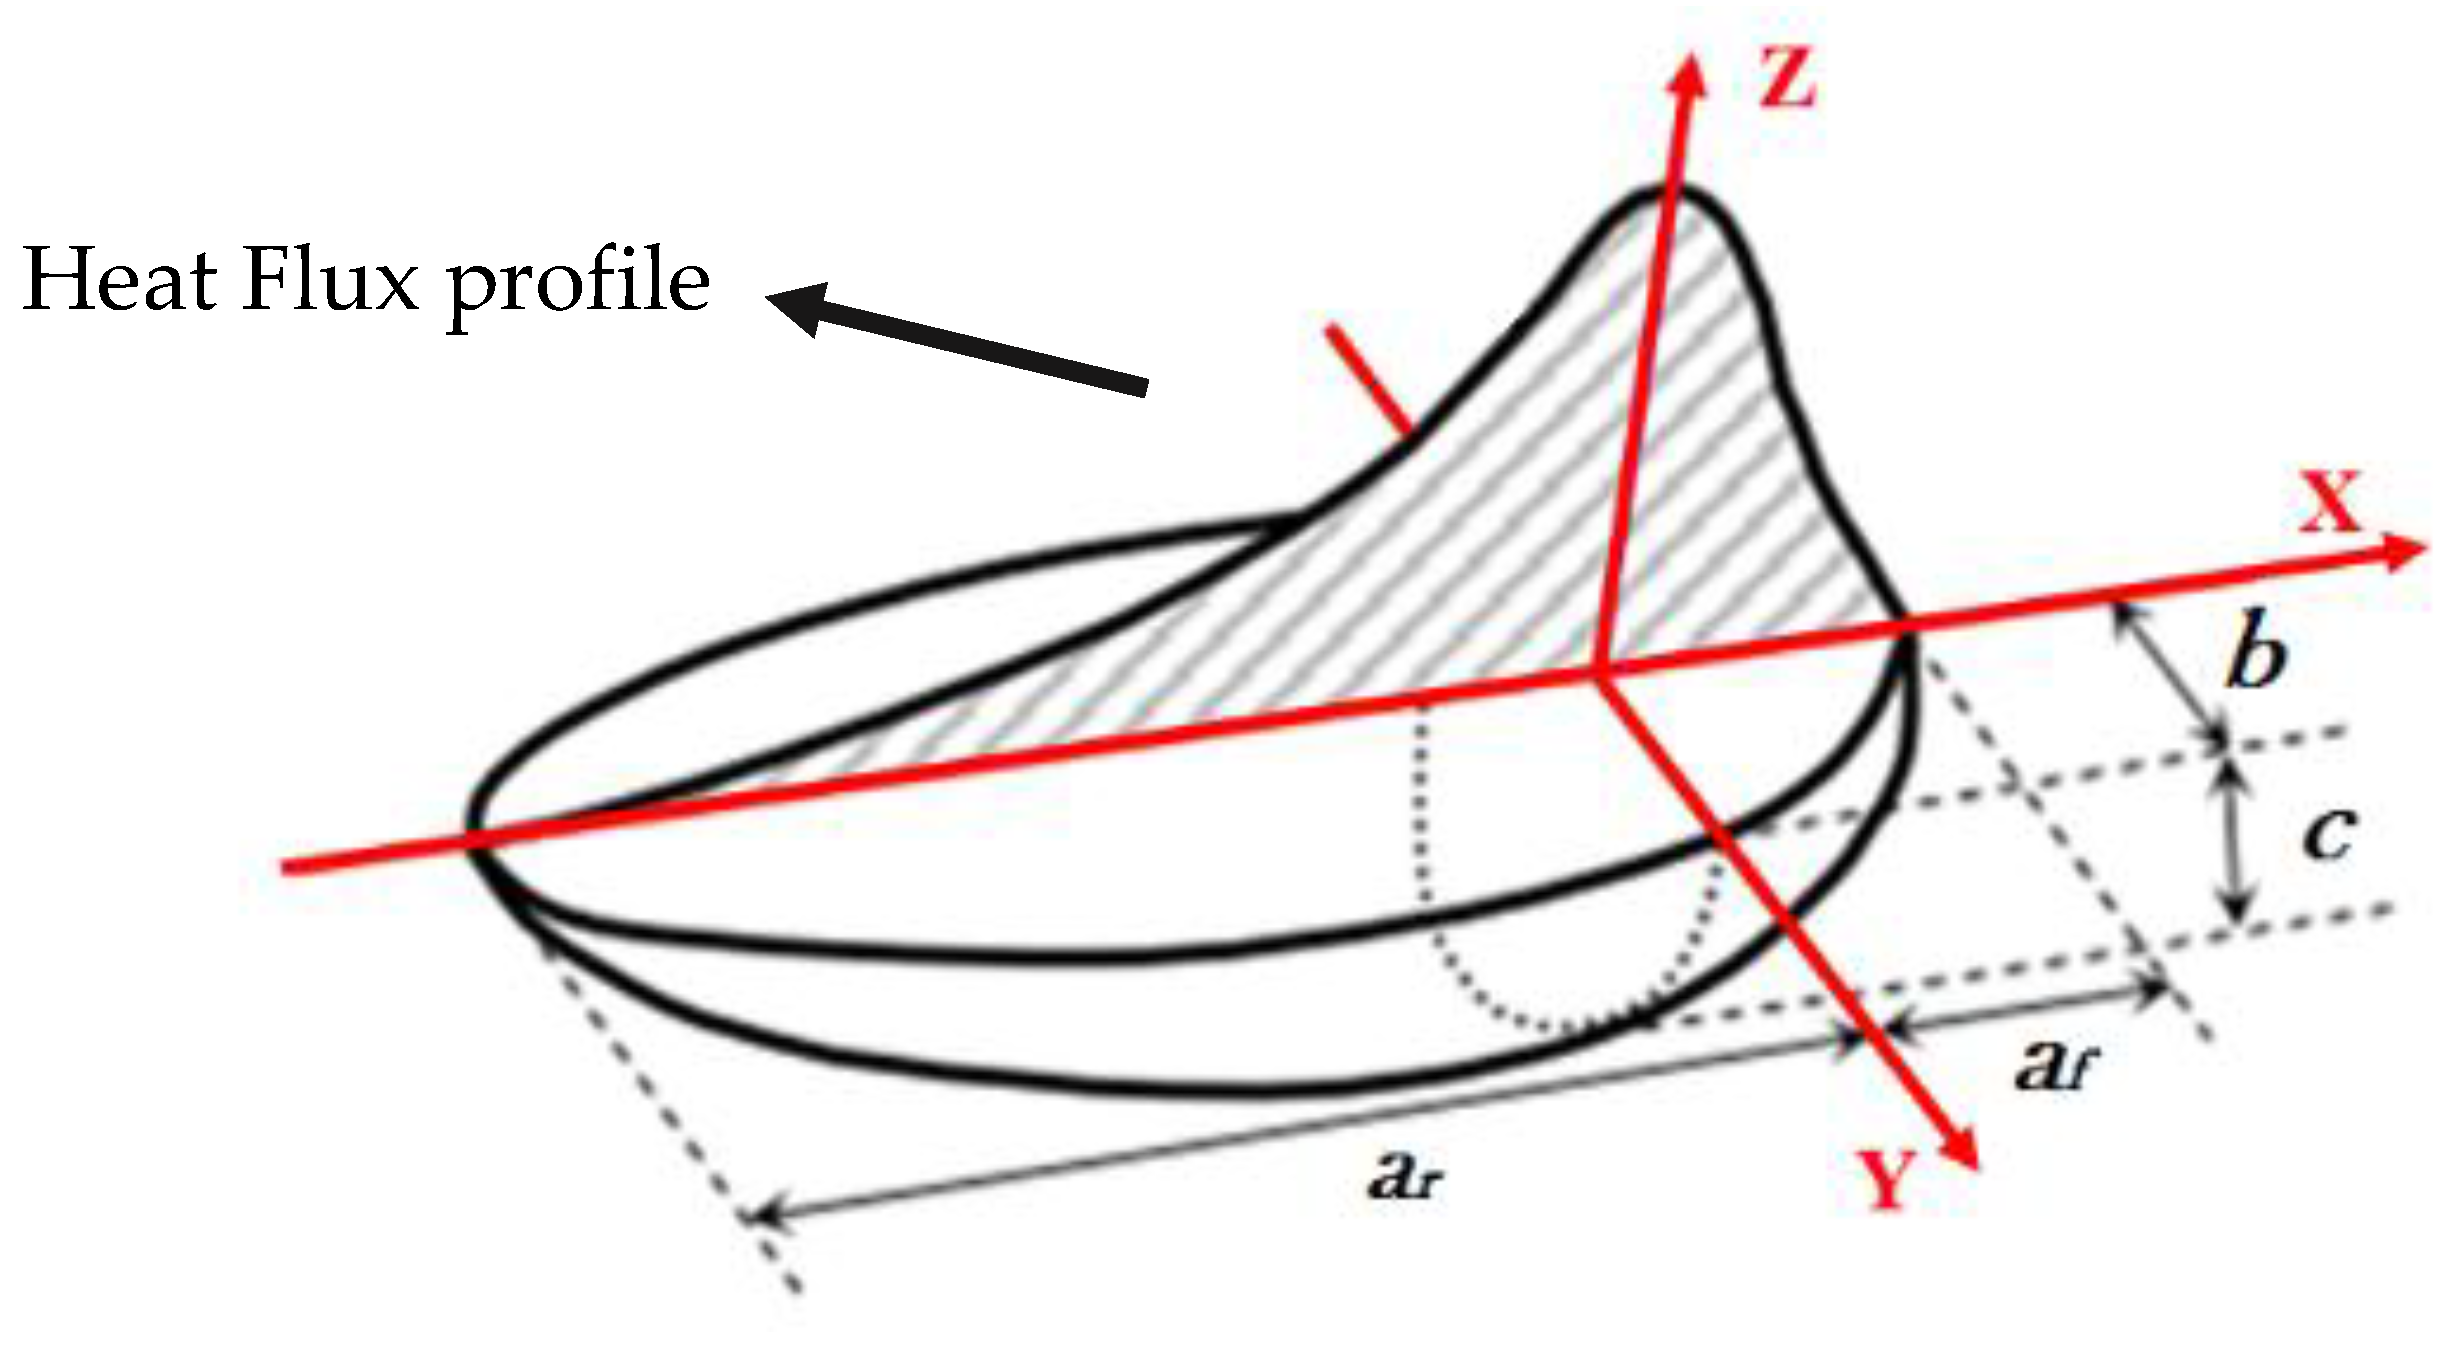
Figure 6 and Equations (15) and (16) show the double-ellipsoidal heat source model.
The heat flux
is represented as two functions, one for the front part of the flux and another for the rear part. These terms yield the correct representation of the comet shape formed by the laser moving through the powder bed. In
Figure 6, the heat source moves in the
X-axis, scanning the bed with steady speed. The front ellipsoid has
parameter, and the rear has
, both expressed in metres. The parameter
corresponds to the front heat fraction, and the rear heat fraction is represented by
, both 0.6 and 1.4 respectively [
30]. Parameters
b and
c are used to determine the width and the depth of the profile, respectively,
is the powder absorption coefficient, and finally
x,
y, and
z are the coordinates from the model.
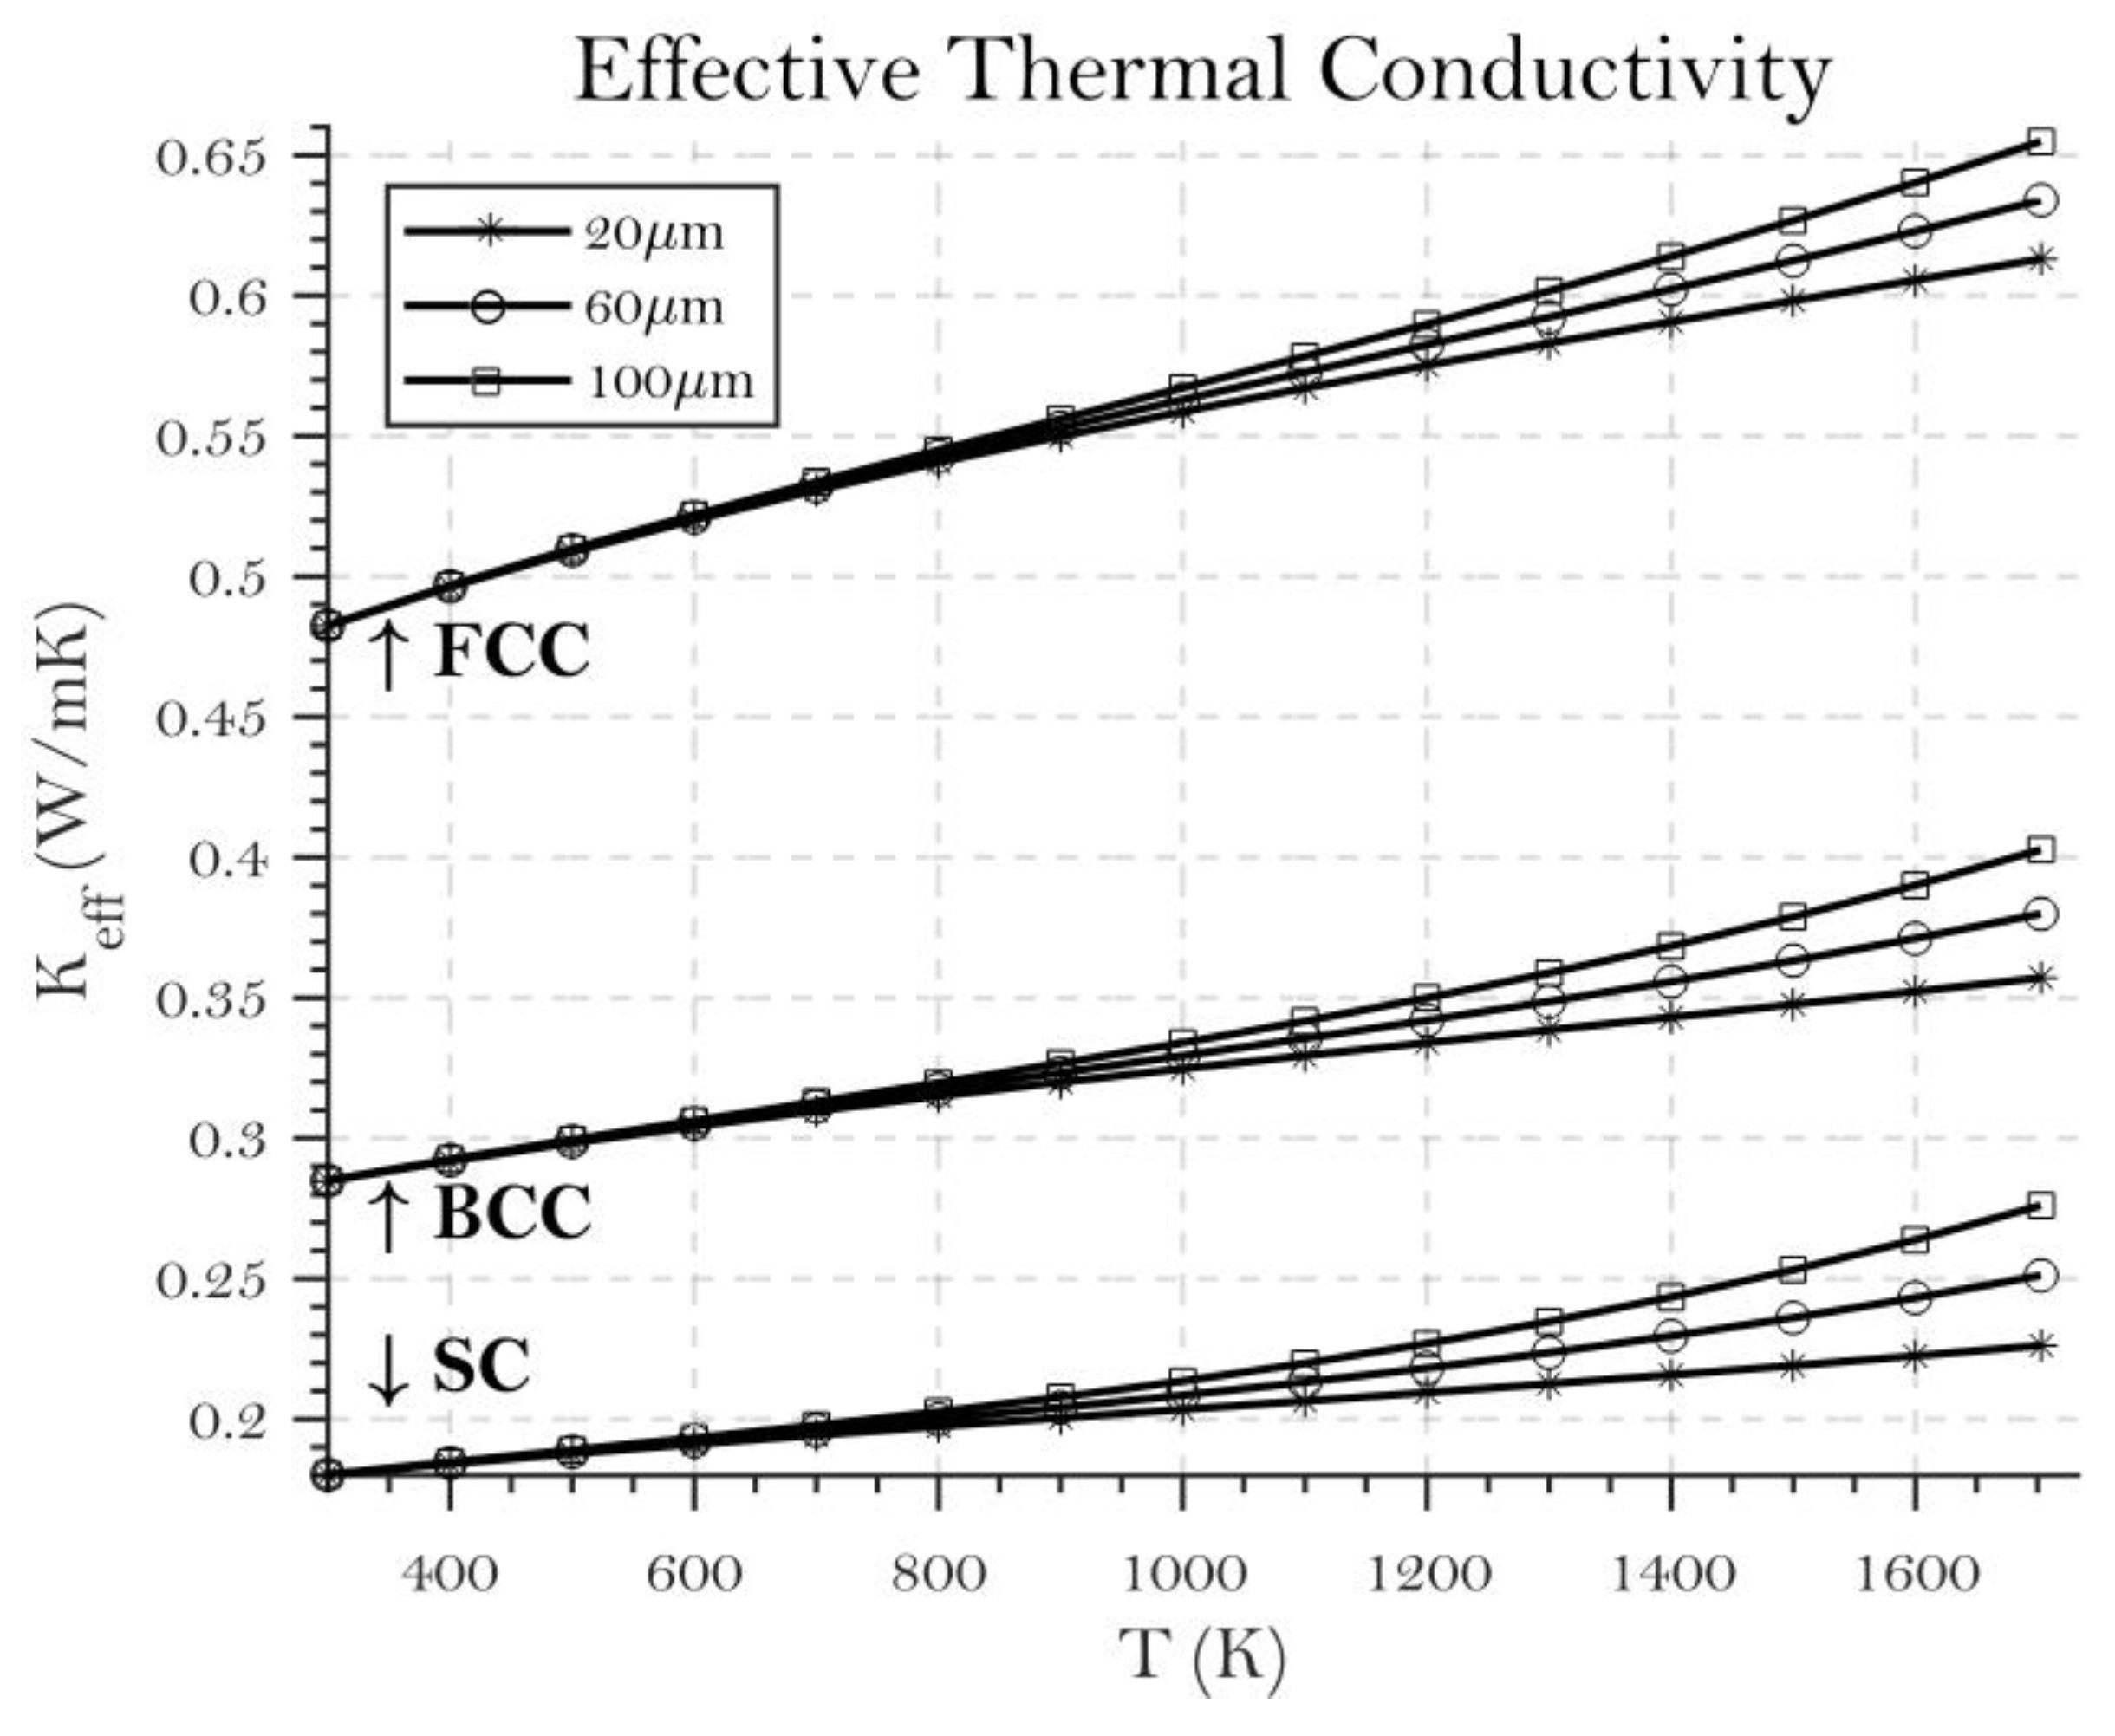
6. Effective Thermal Conductivity of Powders
The definition of effective thermal conductivity of powders addresses four of the main thermal transport phenomena that occur in the powder bed: thermal conductivity of contact between particles,
; thermal radiation,
; gas thermal conductivity,
; and thermal conductivity of an individual particle of SS304L,
[
23,
34]. Wakao and Kagei [
34] developed this definition for powder packed beds, and it was applied in several studies, including Sih and Barlow [
23], as previously mentioned. Below is the full equation, with all four main terms already expanded followed by
Figure 8 with the compiled results for SS-304L at temperatures of 300 K to
:
The thermal radiation term is highly influenced by powder diameter, temperature and emissivity of the powder bed. On the other hand, thermal conductivity owing to the contact between particles will vary according to the contact ratio and the initial solid thermal conductivity, since the value of the fractional contact area, Λ, is less than 3 × 10⁻⁴. The term B is a deformation parameter, and it varies according to porosity. Notice that the compilation of the effective thermal conductivity of the powder will generate nine different curves, since we have three packing densities affecting, respectively, the porosity and emissivity, and the powder diameter affecting the fractional contact area.
It is evident (
Figure 8) that powder diameter does not significantly affect the value of
for temperatures between 300 and 800 K. However, for higher temperatures, owing to the radiation term, there is a perceptible difference. For example, for FCC there is ~7%
increase when using a powder with a diameter of 100 μm instead of 20 μm. The margin increases to 22% when doing the same comparison with SC, owing to the higher emissivity of SC compared with that of FCC. When comparing the different packing densities, the increase in
is even greater, more than 2.5 times that between SC and FCC for instance.
8. Results and Discussion
The numerical analysis was conducted for three-laser input, combined with three packing densities and three different powder diameters, resulting in 27 compiled result models. It was used a single processor for each simulation and there were two tokens available for ABAQUS, giving two parallel simulations running at the same time. The processor was an Intel Core i7-6700 3.4GHz that was able to run all the compilations in 14 h, averaging approximately 30 min for each simulation.
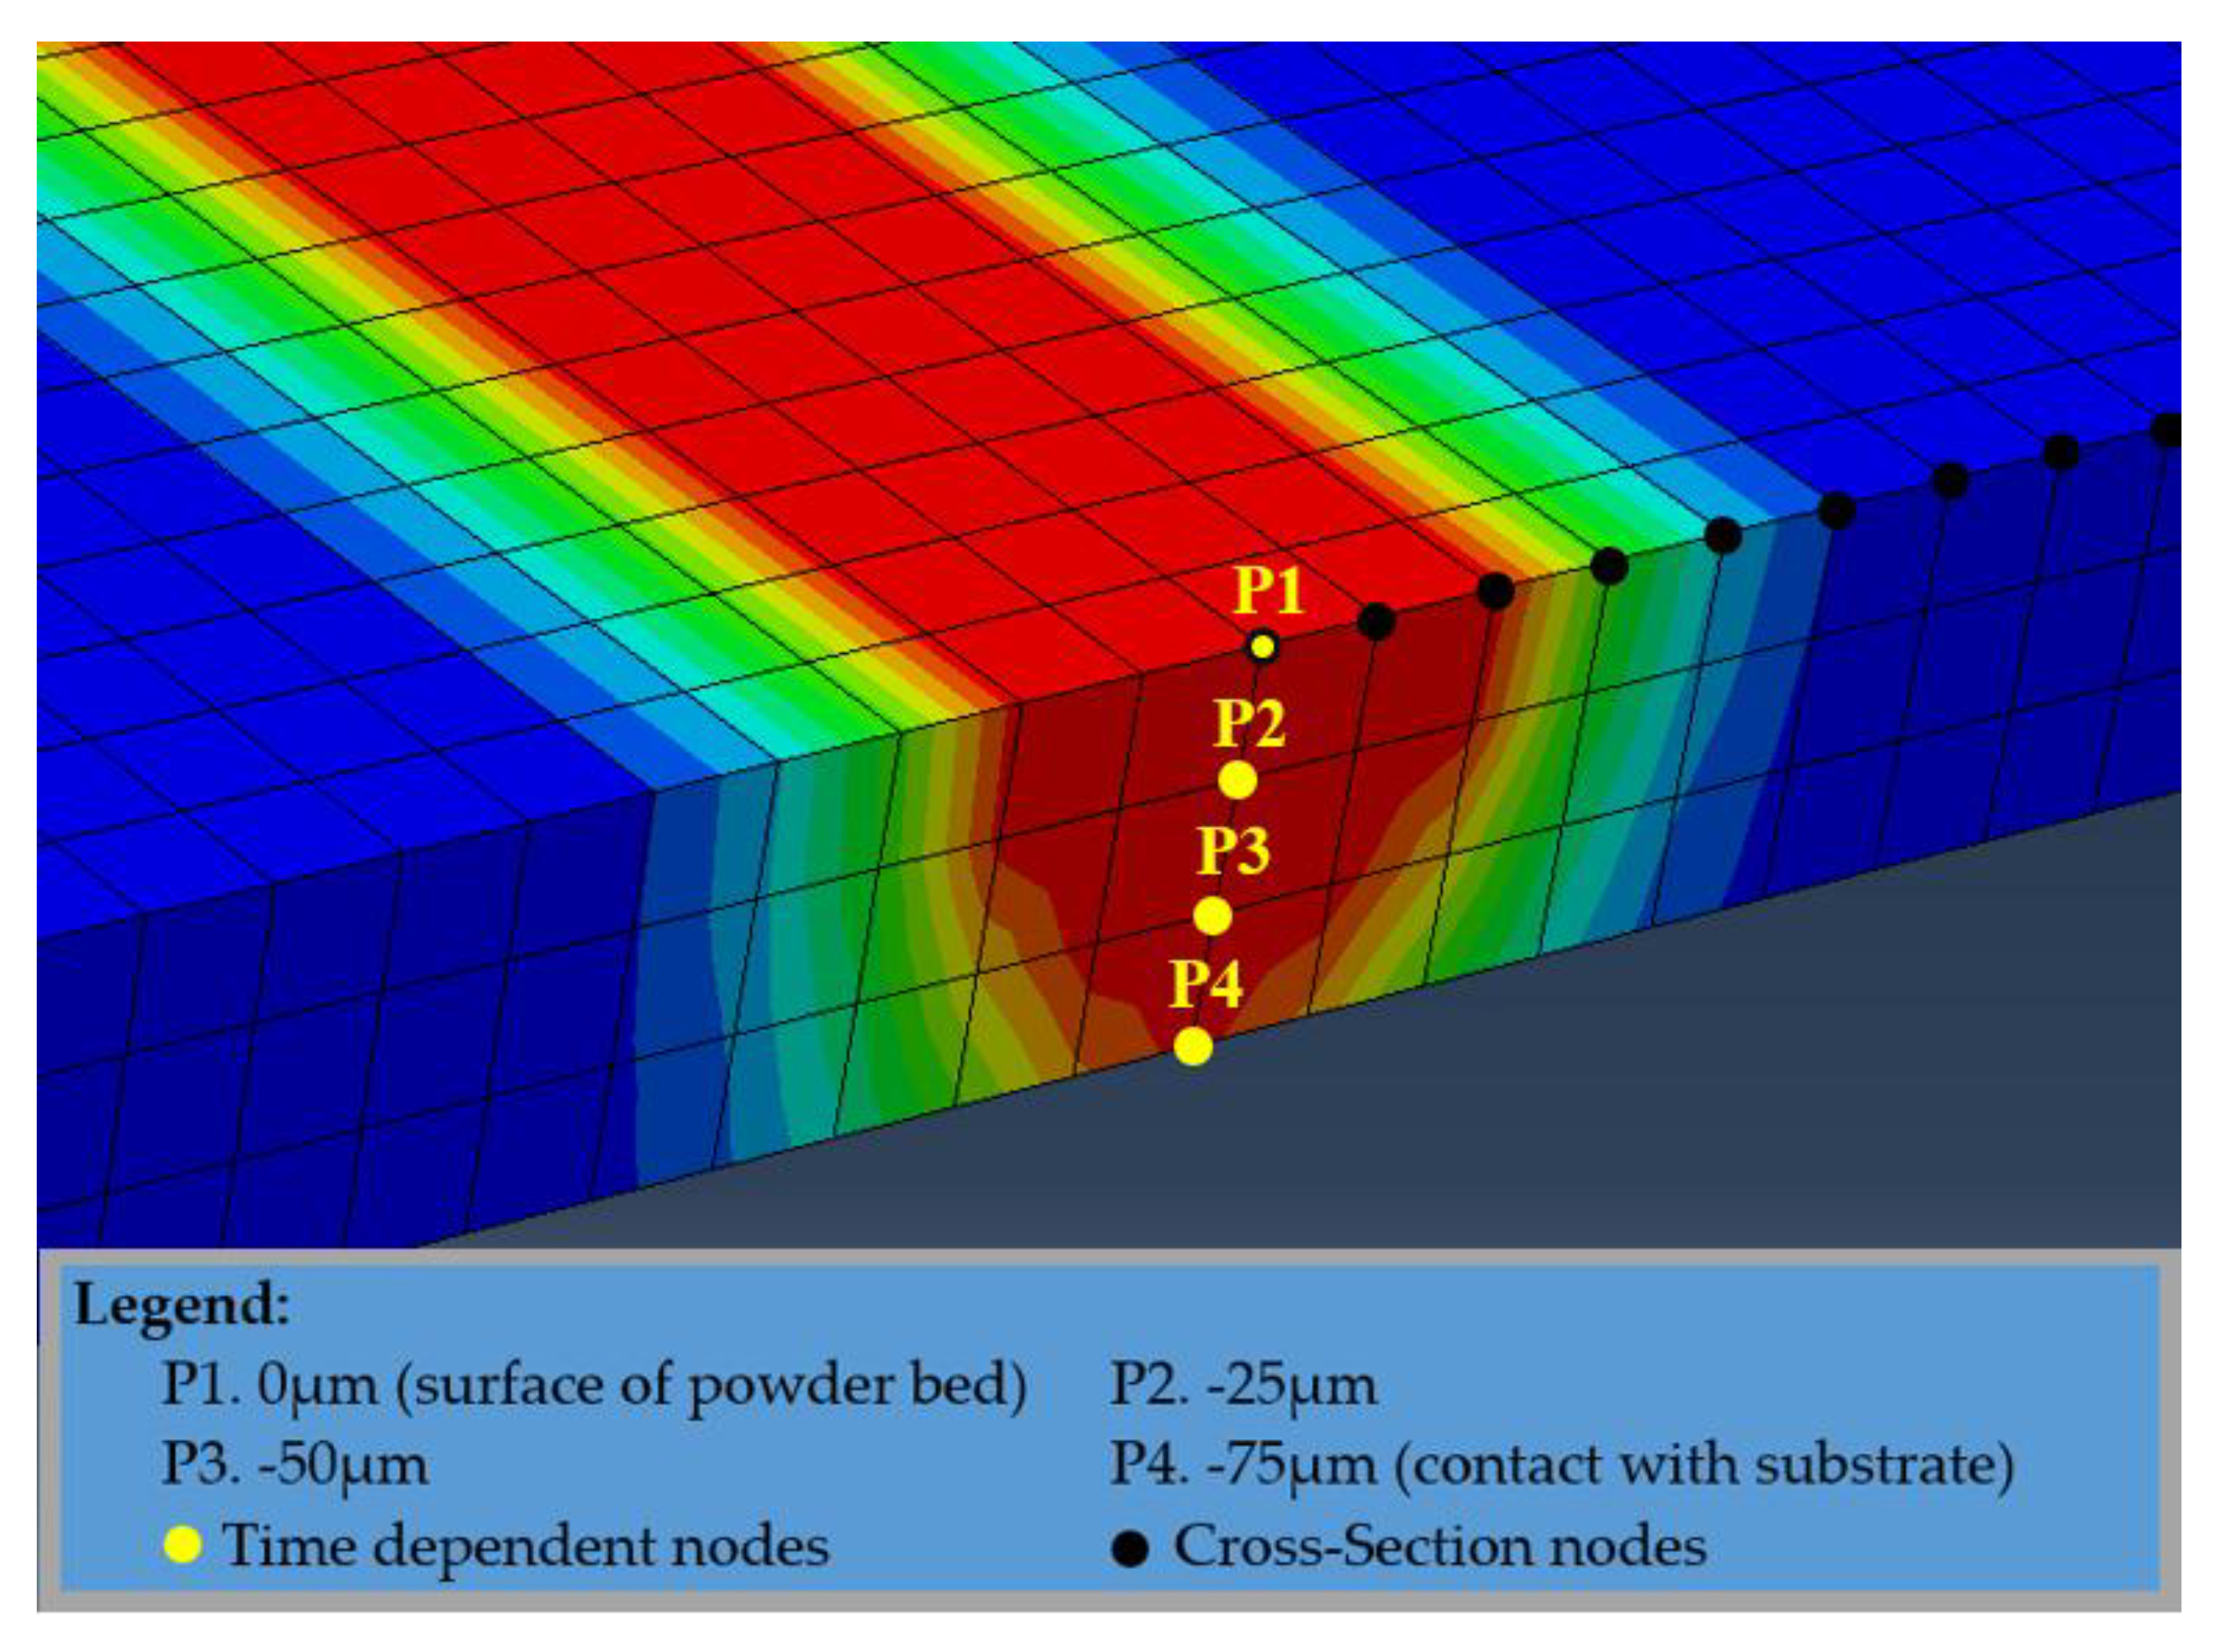
The temperature distribution was acquired in a central node located in the middle of the powder bed, as shown in
Figure 9. Also shown in
Figure 9 are the acquisition points for the time-dependent temperature measurements (total time = 1.5 ms) and the acquisition points for the cross-section measurements that were only done for half the cross-section; since the Gaussian model uses a symmetric formulation, the model has an intrinsic symmetry.
The contact powder and substrate are neglected; however, the preheat temperature from the substrate was entered as a boundary condition, with a predefined temperature of 643 K [
1,
2,
3]. Previously as-produced layers are not modeled in this study, nevertheless this fact does not impact on the value of the effective thermal conductivity of the powder by itself. The only impact perceivable is at the bottom temperature of the new layer, which could achieve higher temperatures than the initial substrate temperature [
37]. We have found that different powder diameters at the same packing density have no impact on the final temperature distributions of the model. However, between the three different packing densities the temperature differs.
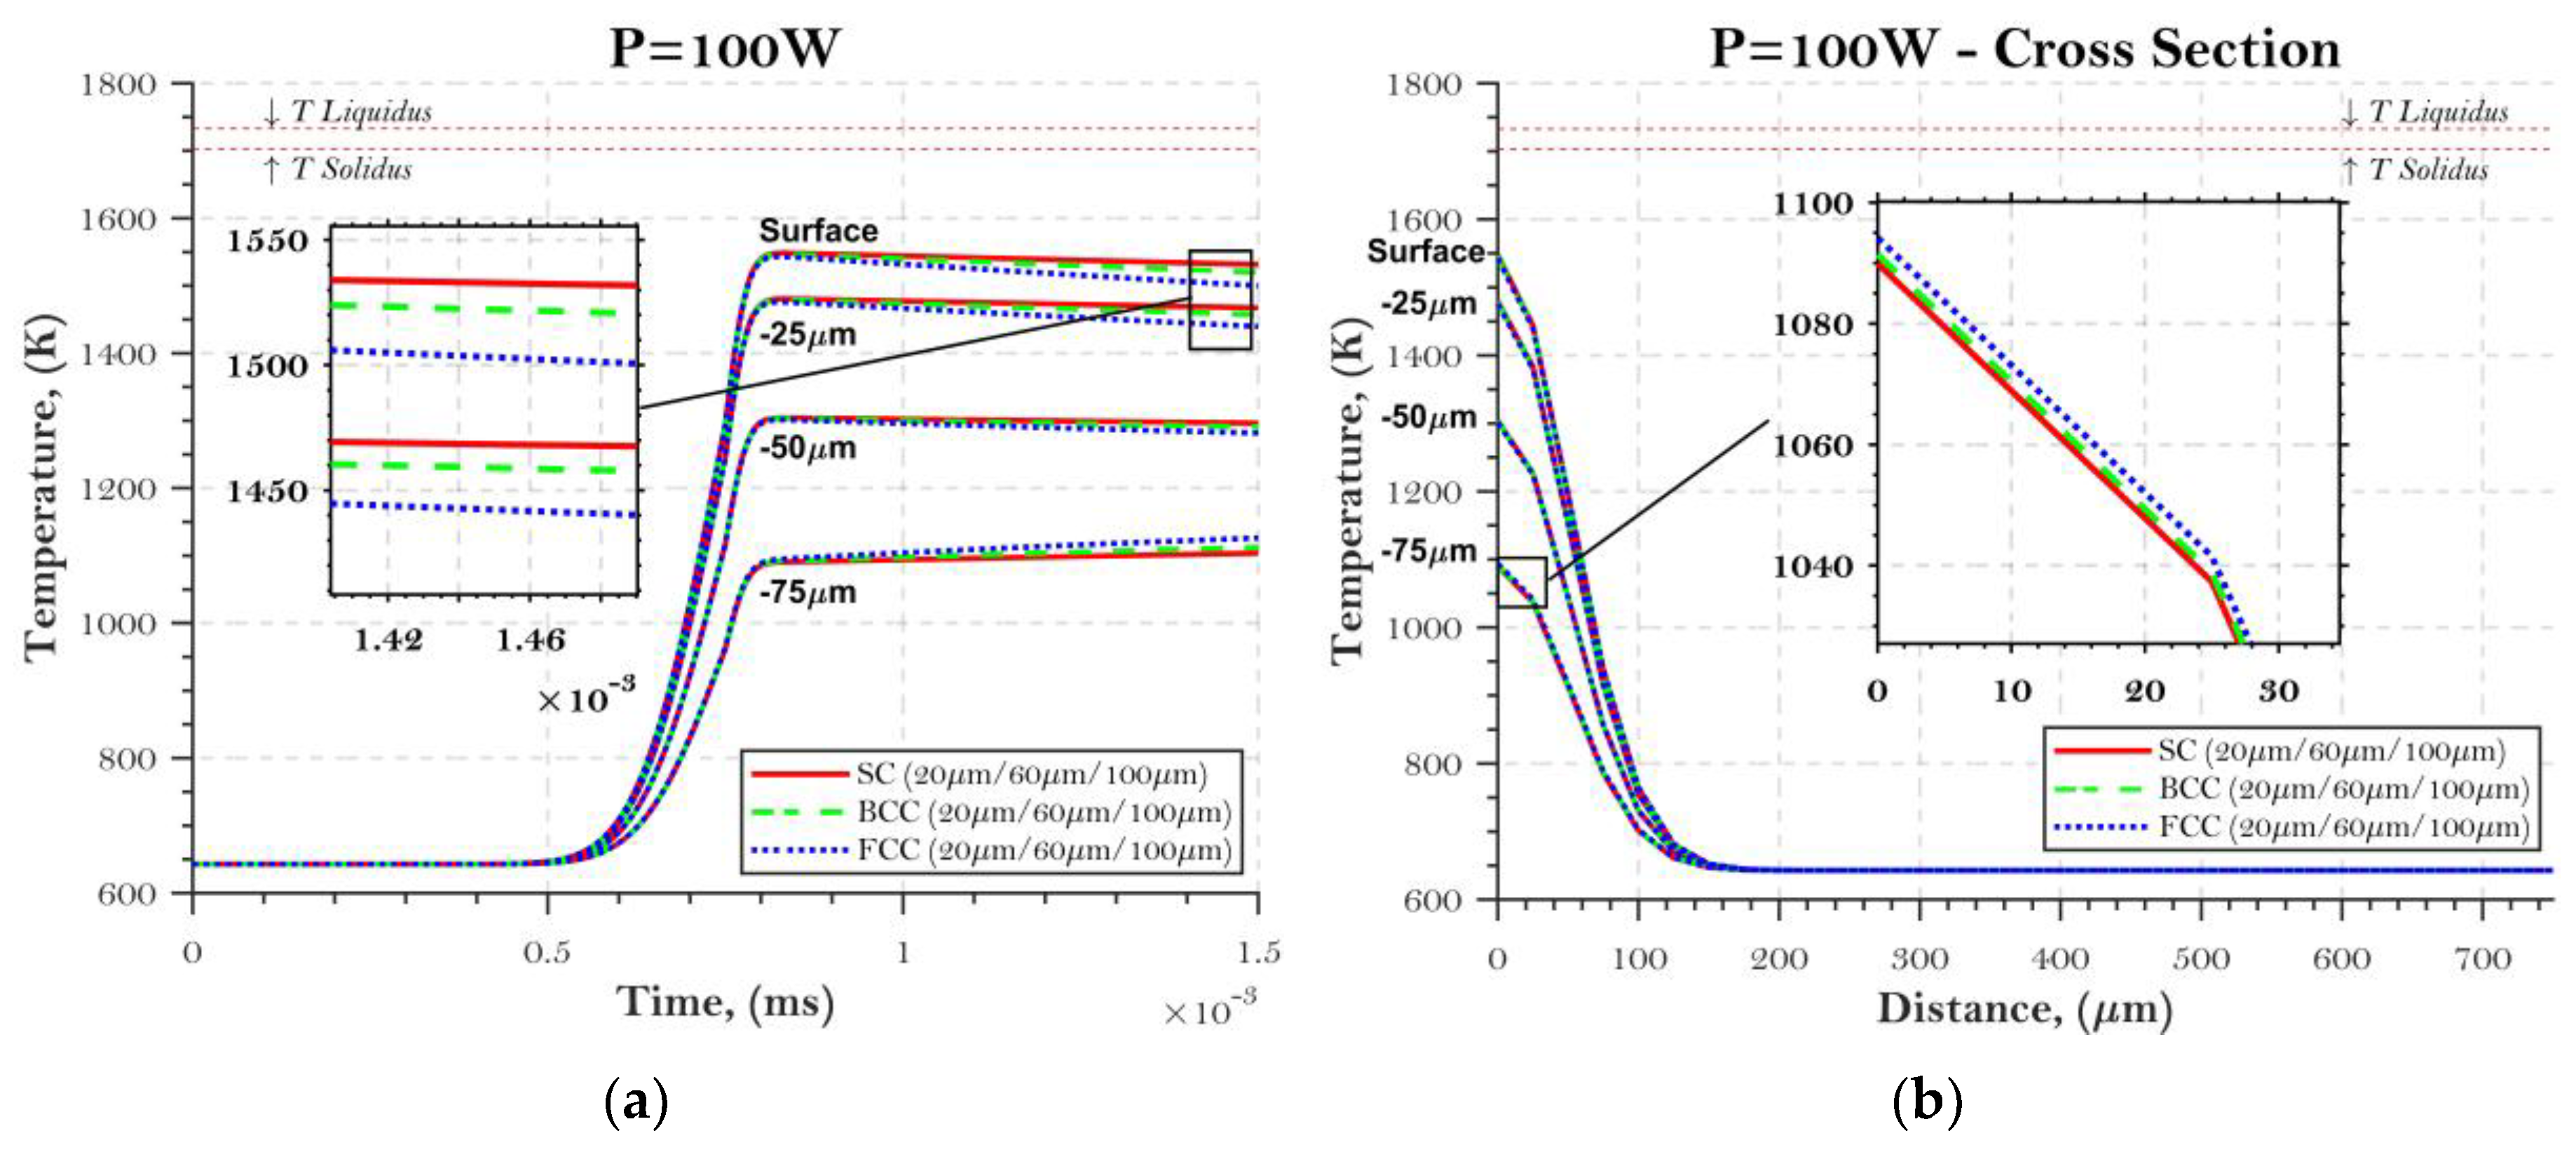
When using a power input of 100 W (
P = 100 W;
Figure 10) with the current configurations of the parameters mentioned, the maximum temperature achieved was ~1575 K at the surface, not enough to reach the melting point of the alloy used. However, it is essential to consider that powder can still melt to a certain degree owing to necking between the small particles. The only concern here is at the bottom (−75 µm), which temperatures only achieved 1100 K.
On the same temperature distribution plot, the temperature increases at the same rate for all the packing densities. However, as soon as the temperature reached the maximum value and the laser scan moved forward, the temperature loss differed from each of the configurations. On the second plot in the same graph, SC loses less heat than BCC and FCC. Since SC has the smallest effective thermal conductivity among all the packing densities, less heat is exchanged. The biggest difference is 45 K (or 3%), between SC and FCC, which occurs at the surface of the powder bed.
Another notable finding from the first analysis is that the rate of change was very small after the temperature reached its maximum. This occurred because the domain was still in the powder state and thus had low thermal conductivity overall.
The cross-section plot in
Figure 10 shows how the temperature spreads through the powder bed when
t = 0.75 ms (maximum temperature achieved), with a heat-affected zone of ~160 µm from the center of the powder bed. This behavior was observed for all plots (
P = 200 and 400 W). The second plot shows in detail that the different packing densities had no significant impact on the temperature profile. Another distinguishable feature from the cross-section plot is the effect of mesh size on the outcomes, which is evident as the sudden temperature rate change at exactly 25 µm, meaning that the mesh was not ideally capturing all the temperature changes. However, it is important to mention that a change in the mesh size in this model can increase the simulation time up to four times.
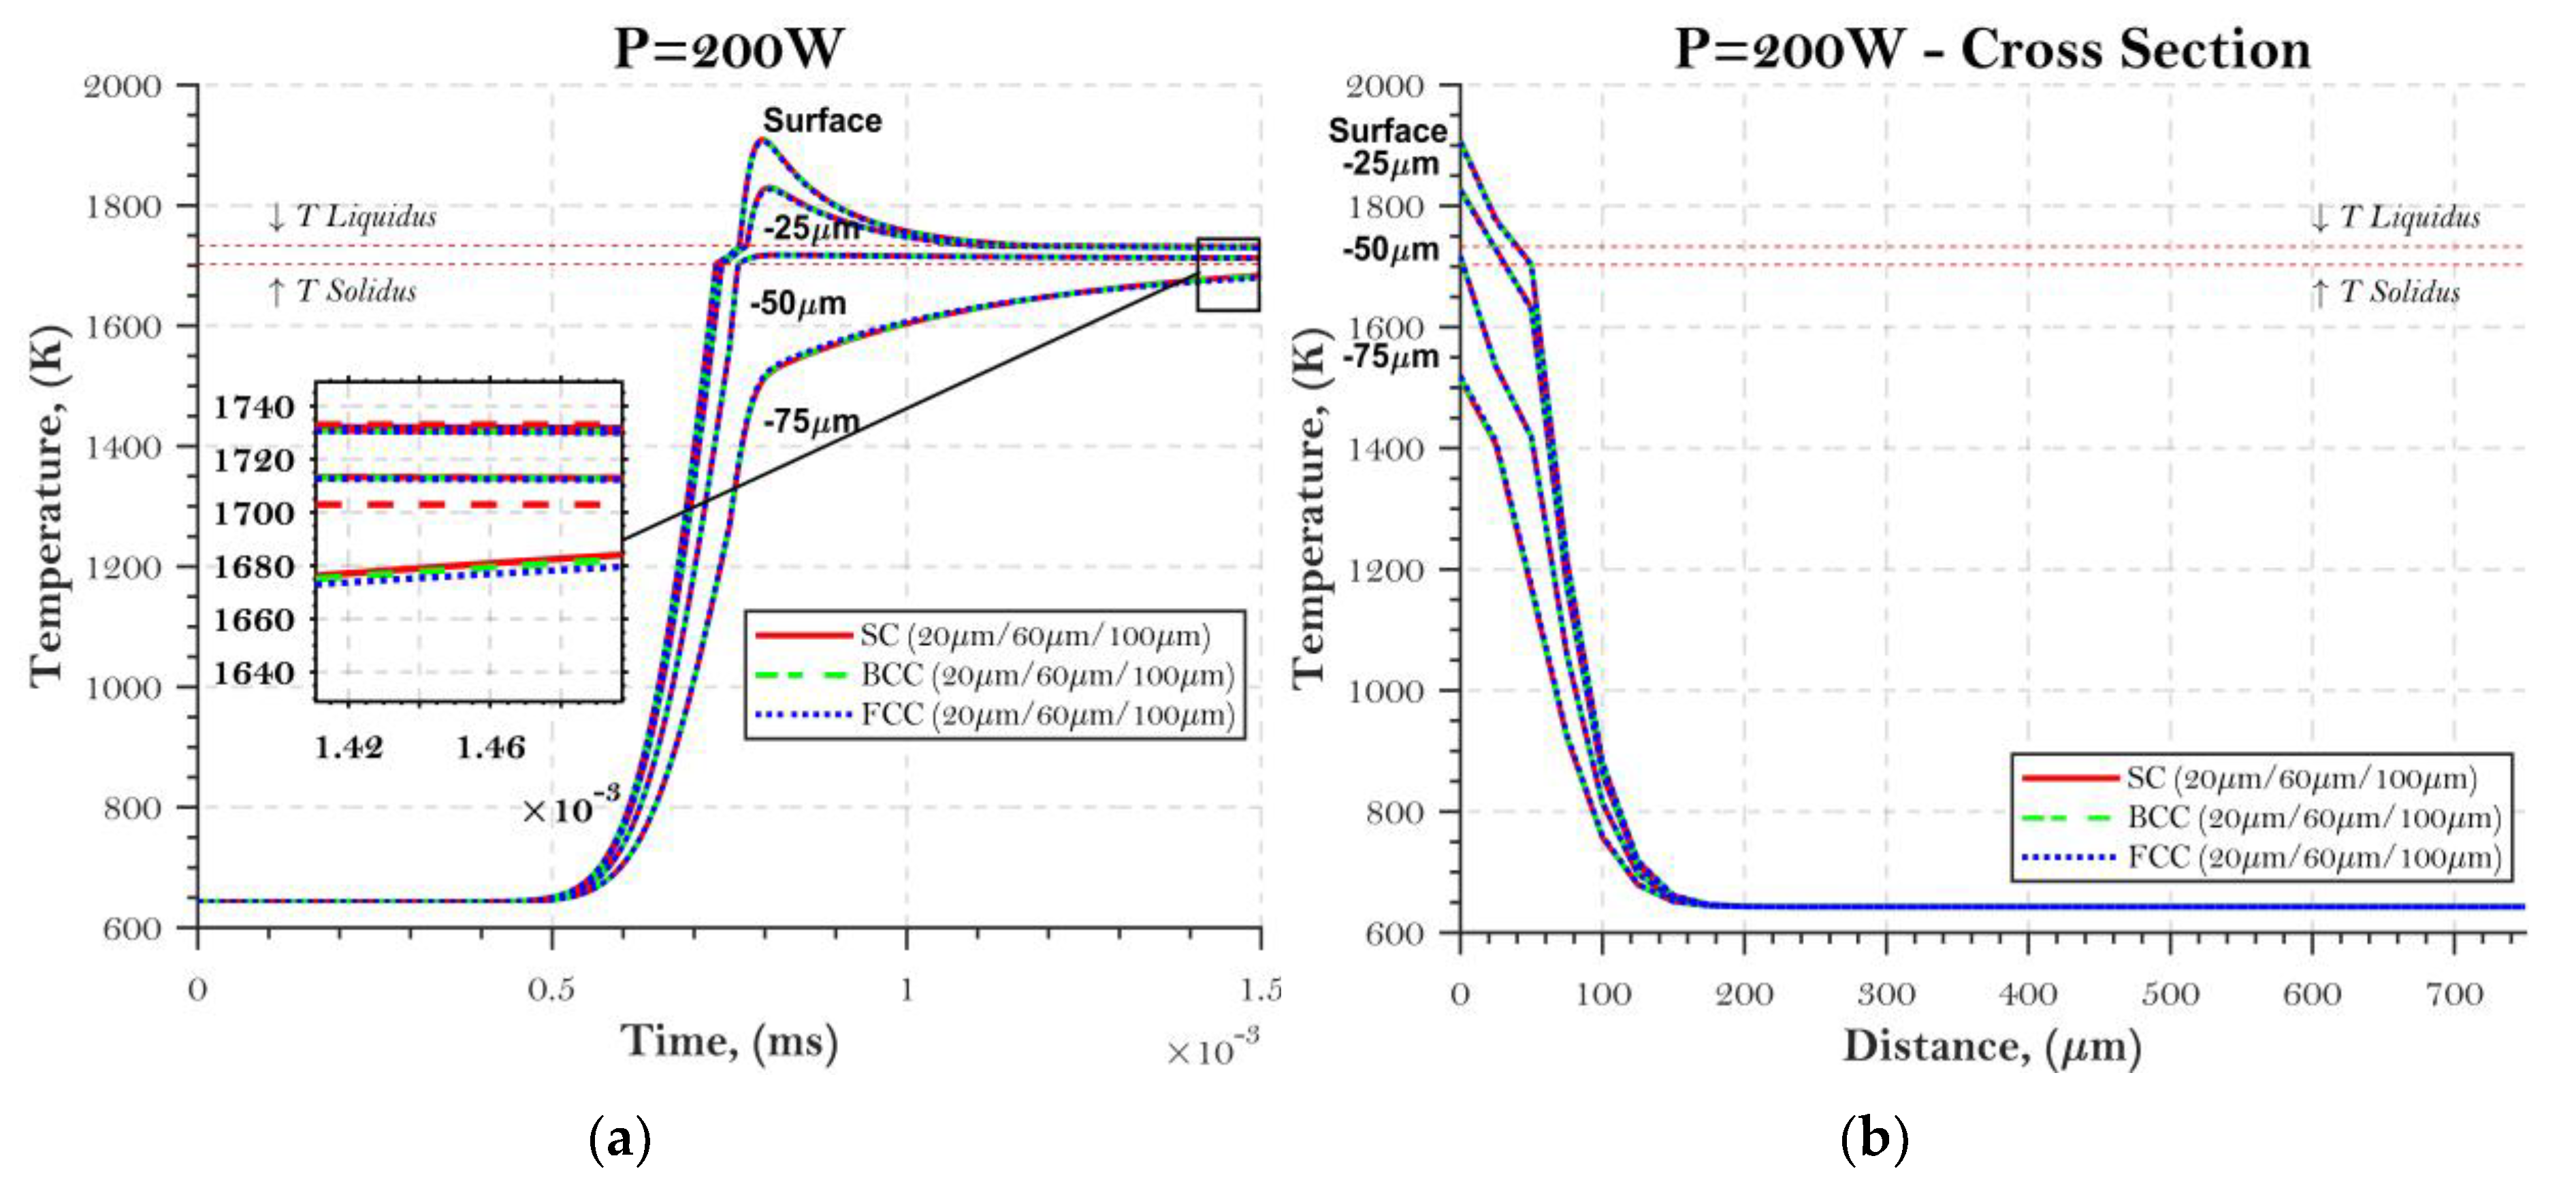
For
P = 200 W in
Figure 11, the melting point was reached for the surface of the powder bed at –25 and –50 µm. However, the bottom of the powder bed reached only up to 1525 K, whereas the surface reached 1900 K. This led to a high exchange of heat after the laser had passed through, and it is evident how the bottom point (–75 µm) still increased from 1525 to 1675 K in less than 0.7 ms. The packing densities here do not display an apparent temperature difference, since they only have 4 K between SC and FCC on the bottom node, as shown in the second plot. As confirmation of the role of powder diameter in temperature distribution,
Table 2 presents the five last increments corresponding to the three powder diameters under SC packing density. There are only fluctuations of temperature, with no significant changes, which explains the overlap of all the temperature distributions at different powder diameters. In fact, researchers studying the effects of individual powder particle interactions using DEM models found significant effects of powder diameter on temperature distributions [
20], but this parameter was not within the scope of the present study.
It is important to notice that the effective thermal conductivity, although not validated experimentally, followed the same trend observed by Alkahari et al [
38]. In their study, the thermal conductivity of SS-316L was measured using a laser flash technique. They found a tendency for superior thermal conductivity of 100 µm particles compared with 20 µm particles, the same tendency that happens when increasing packing density.
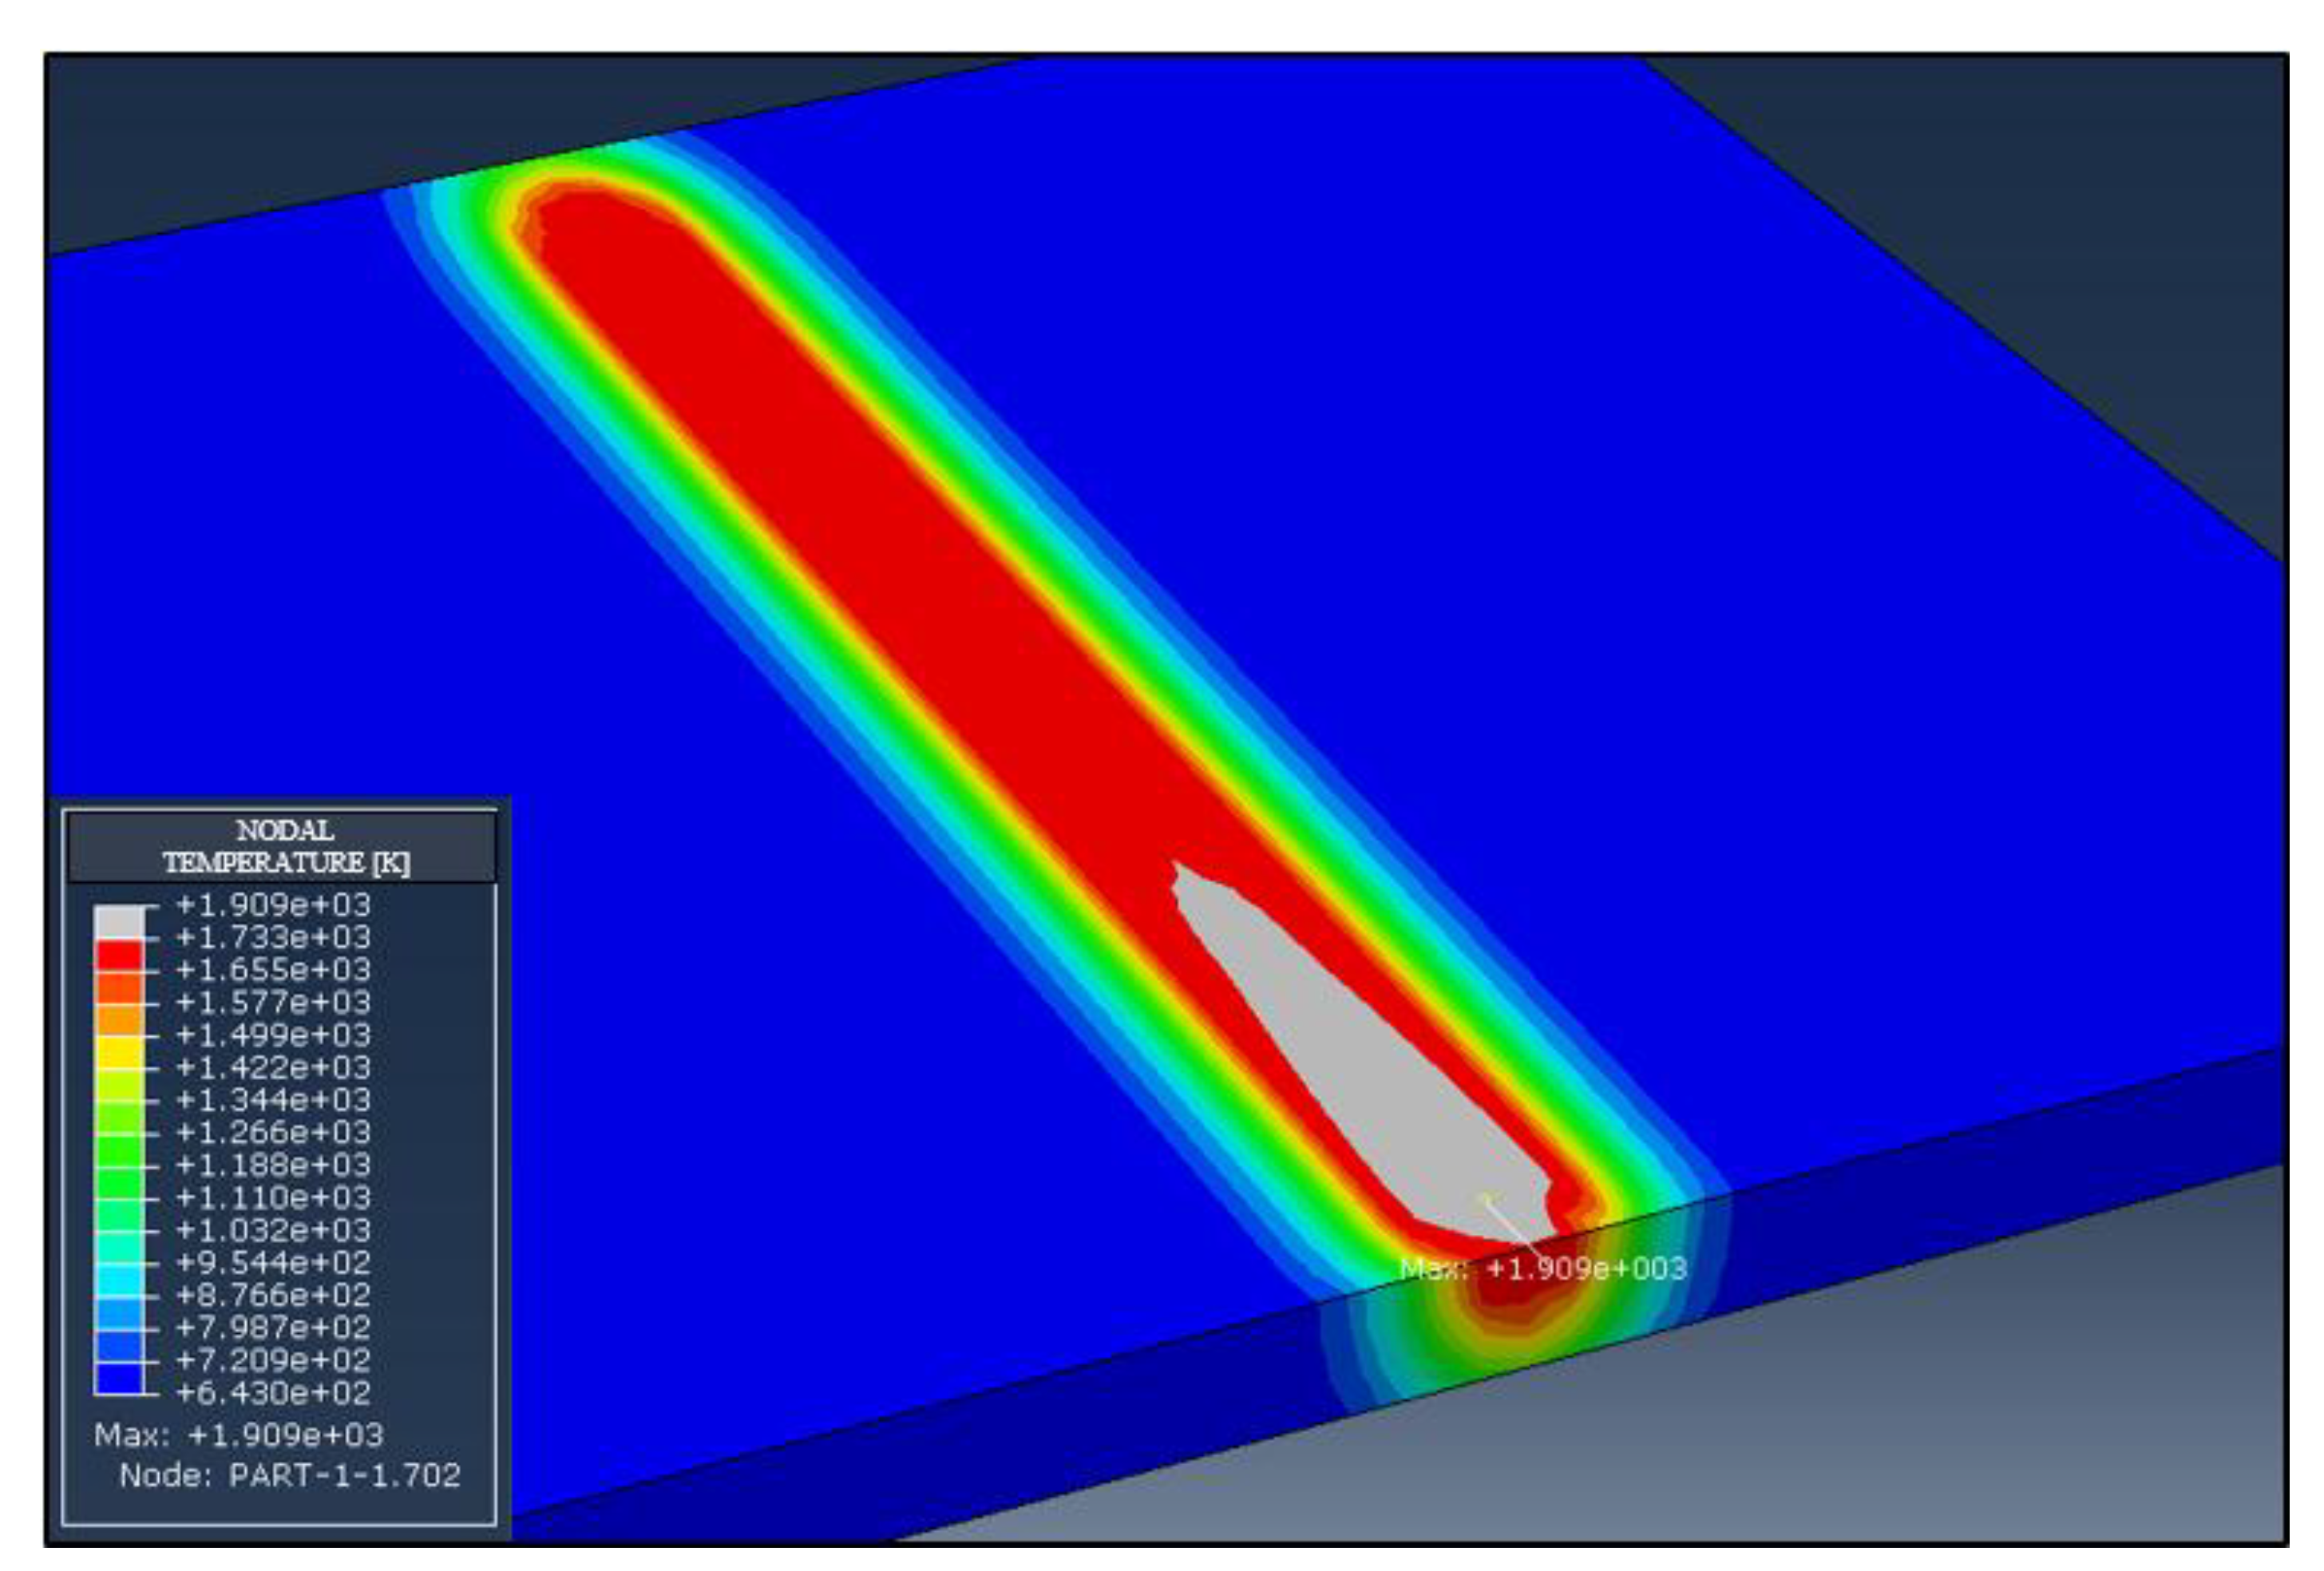
The melt pool at
P = 200 W is shown in
Figure 12. The maximum temperature field to be shown was set up at 1733 K, so the whole grey region in the temperature field corresponds to the melt pool. It has a width of ~75 µm and a length of 425 µm.
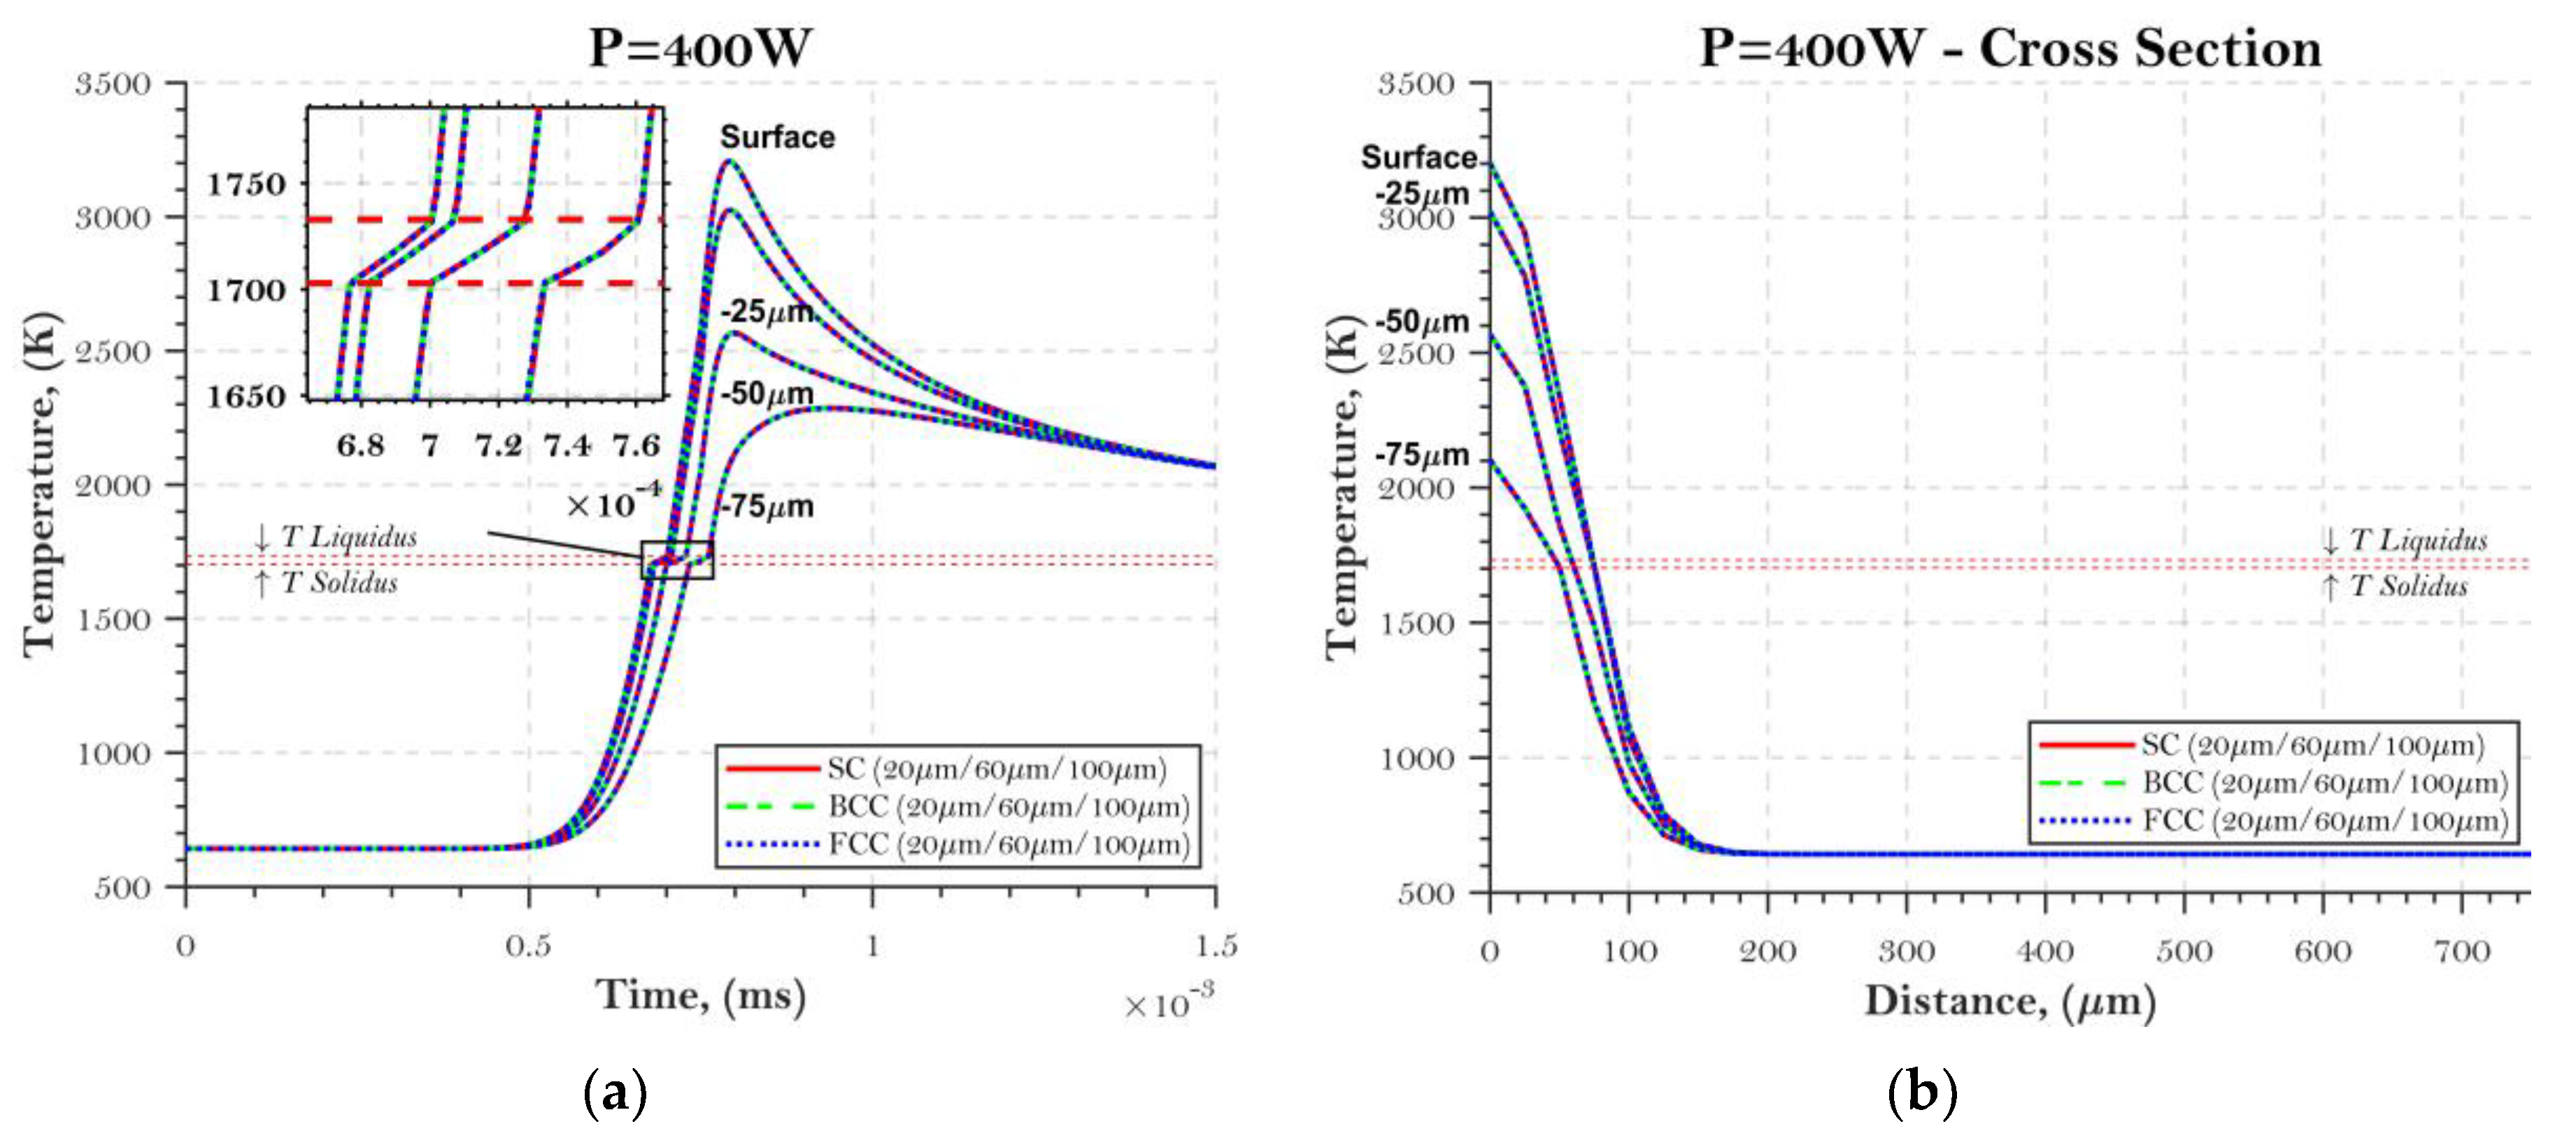
The last power input (
P = 400 W) is the only one in which the entire depth of the powder bed layer reached the melting point. However, the maximum temperature achieved at the surface was around 3250 K, which is an undesirable condition that can lead to evaporation of the metal [
27]. The bottom reached around 2100 K, which will most likely induce the melting of the substrate or increase the heat-affected area of the same. It is noteworthy that a gradient of around 1150 K between the top and bottom layers was induced, whereas at
P = 100 W the gradient was 475 K and at
P = 200 W the gradient was 375 K. This fact alone is extremely important when analyzing residual stresses during SLM. The higher the temperature gradient and the respective cooling rates induced by the process, the higher the residual stresses.
In the second plot of
Figure 13, the melting point area between solidus and liquidus temperature (broken red line) is highlighted. The rate of temperature change in this interval proves that the model is capable of interpreting the different property states and the phase change caused by the latent heat of fusion, even when using a small-time increment.
Furthermore, the results show a very close behavior with the experimental studies using SS304L found in the literature. Abd-Elghany and Bourel performed the closest testing to our set-up. They conducted tensile specimen printing using a machine with 100 W and 30/50/70 µm layer thickness, concluding that higher layer thickness produced specimens with low density and poor mechanical properties [
39]. This can be used as a reference to our set-up of
P = 100 W and layer thickness of 75 µm, in which the laser input was not enough to bring the temperature to the melting point, thus consolidation between powder particles was poor.
9. Conclusions
In this research, we proposed a parametric low-cost FEM thermal model capable of measuring temperature distributions through a powder bed, and consequently the temperature gradient, of a single layer and tracking the laser scanning using the SLM process. Although packing density and powder diameter affected the final value of effective thermal conductivity of the powder bed, the only considerable effects in the temperature distribution were observed for lower power input (P = 100 W) and only for different packing densities. The powder diameter did not have a major impact on the model because of the minor effective thermal conductivity change that occurred regardless of particle diameter and the fact that the model was based on the total volume occupied by the particles as a whole, and thus the individual particle interactions were neglected.
The results demonstrate that proper compaction and density distribution of the powder bed is important for keeping the cooling rates and temperature distributions within a desirable range. However, these impacts are only perceivable outside the melt pool zone. On the other hand, by looking to the power input, we observed that 400 W induced very high temperatures at the surface and all the way through the layer thickness, increasing the rate of material vaporization. The vaporization phenomena is primarily associated with mass loss and metal particle ejection. This effect by itself brought a temperature gradient of around 1150 K through the entire layer, which is the main cause of warping and residual stresses. For P = 200 W, the temperature reached the melting point but did not go much higher, which represents a desirable condition, given the lower temperature gradient achieved (375 K). Finally, for P = 100 W, the temperature did not reach the melting point at all, which could influence the consolidation of the particles and the final porosity of the built part.
Future research is necessary to validate the model experimentally using different powder diameters and proper measurement of the powder bed porosity.


