Dynamic Process Behavior in Laser Chemical Micro Machining of Metals


1
BIAS—Bremer Institut für Angewandte Strahltechnik, Klagenfurter Straße 5, 28359 Bremen, Germany
2
Wagenbrett GmbH & Co. KG, Sonneberger Straße 12, 28329 Bremen, Germany
*
Author to whom correspondence should be addressed.
J. Manuf. Mater. Process. 2018, 2(3), 54; https://doi.org/10.3390/jmmp2030054
Submission received: 18 July 2018
/
Revised: 9 August 2018
/
Accepted: 11 August 2018
/
Published: 14 August 2018
Abstract
:Laser chemical machining (LCM) is a non-conventional processing method that enables a smooth and precise micro structuring of metallic surfaces. However, a high-quality removal is limited to a laser power window of some 100 mW. This is due to the high sensibility to removal disturbances, such as the deposition of metallic salts and oxides. In this work, the dynamic process behavior around the transition from a disturbance-free to a disturbed removal is investigated for the laser chemical machining of titanium (3.7024) and stainless steel (AISI 304) in different phosphoric acid solutions. Therefore, the removal cavities are recorded using confocal scanning microscopy and characterized regarding width, depth and quality in dependence of the laser power, feed velocity and electrolyte concentration. While the removal characteristics within the disturbance-free regime are found to be material-independent, the disturbed regime is strongly dependent on the tendency of the material to gas bubble adherence. Additional CCD records of the interaction zone reveal that the transition to the disturbed regime is accompanied by significant light reflections and thereby indicate the influence of adhering gas bubbles on disturbing the removal process. Moreover, typical removal disturbances are presented and discussed with regard to the responsible mechanisms for their occurrence.
1. Introduction
The ever-increasing demand for miniaturized components and devices requires the qualification of novel manufacturing methods that fulfill high expectations of flexible and individualized production [1]. Among other non-conventional processes, laser chemical machining (LCM) presents a promising method towards a gentle and precise micro machining of especially metallic parts [2]. It unifies the advantages of laser machining with its precise and localized energy deposition [3] and the electrochemical machining with its smooth processing without affecting the material microstructure [4].
The laser irradiation in laser chemical machining is used as a localized and selective heat source that can induce suitable thermal impact for the activation of heterogeneous chemical reaction on the surface of a metallic workpiece, which is immersed in a continuously pumped electrolyte environment. The locally induced temperature gradients result in the change of the electrochemical Nernst potential. As a result, a thermobattery can be generated, enabling a current flow within the metal between the center of the incident laser light and its periphery. Despite the low generated electromotive forces (some 0.1 V for a temperature rise of 100 K), the electric field strengths are very high due to the small battery dimensions [2]. Thus, self-passivating metals lose their natural passivation property, allowing an electrochemical etching of the base material [5]. This material dissolution occurs under the formation of hydrogen and water soluble metallic salts [2], as has been observed for different self-passivating metals, e.g., stainless steel, titanium alloys [6] and tool steels (Cr–Co alloys) [7]. Within suitable process windows, a gentle removal occurs without significant heat affected zones or a recast formation [8]. Moreover, the LCM process enables a flexible micro machining, especially for structure dimensions <200 µm. Stephen et al. have shown the suitability of the process for cutting and drilling of thin metallic foils. Micro grippers and springs usually used in micro surgery were manufactured from 200-µm Nitinol foils. The resulting removal quality was found to be the main advantage of the LCM process [9]. In comparison, the short pulsed laser machining results in micro-cracks and distortion effects [8]. In addition, LCM can be used for the fabrication of micro tools for forming applications. In [10], micro die cavities with dimensions < (300 × 300 × 60) µm3 were machined from a cobalt–chromium alloy by LCM and compared to micro milling. Despite lower removal rates, LCM results in smoother removal, higher shape accuracy (deviations <3%) and smaller edge radii (<12 µm). Moreover, Robert et al. have used stainless steel (1.4310) micro molds, which were laser chemically machined, for the structuring of monocrystalline diamond by an ultrasonic-assisted friction polishing [11]. Another application presents the surface finishing of metallic surfaces, as is shown by Eckert et al. [12].
Within LCM, the resulting system, which is consisting of solid materials, chemical reaction products, liquid and partially gaseous electrolytes, is highly dynamic. Silva et al. have demonstrated how the chemical dissolution reaction can be accelerated and intensified, when electrochemical machining is assisted by a coupled laser beam. Due to the localized laser assistance, the resulting removal rates in different materials, such as titanium and stainless steel, could be enhanced by up to 50% [13]. Moreover, Mora et al. have shown that the high dynamics during LCM can be used for patterned structuring of stainless steel within a phosphoric acid ambient based on periodic geometrical changes within single removal paths [14]. This patterning was explained as the result of a permanent change of the electrochemical potential in the boundary layer between the workpiece surface and electrolyte [15]. However, the increase in laser power and/or feed velocity enhances the dynamic behavior in LCM and has a direct influence on the resulting removal quality. As demonstrated in previous works [16,17] a disturbance-free removal is limited to a process window of only some 100 mW. Once the removal is disturbed, the removal cross section changes from a bell-like shape to a W-like one. Energy dispersive X-ray analysis has shown that those disturbances are related to the deposition of metallic salts (phosphor/sulphur peaks) and oxides (oxygen peaks) layers [18]. Up to now, the occurrence of LCM removal disturbances is assumed to be the consequence of formed gas bubbles that are caused by thermochemical influence and electrolyte boiling [16,17]. However, interlinked evidence between experiments and models is still missing. This would help gain a profound understanding of the removal mechanisms.
In this work, the dynamic behavior of LCM around the transition from a disturbance-free to a disturbed removal was investigated systematically. Therefore, titanium (3.7024) and stainless steel (AISI 304) were machined in phosphoric acid solutions of different concentrations under variations of laser power and feed velocity. The removal cavities were recorded using confocal scanning microscopy and characterized regarding the removal width, depth and quality. In addition, CCD snapshots of the interaction zone were recorded. These revealed that the transition to the disturbed regime was accompanied by significant light reflections, which presented a direct indication for the influence of adhering gas bubbles on the occurrence of removal disturbances. Moreover, the removal characteristics were categorized and discussed in dependence of the laser power, feed velocity and electrolyte concentration within the disturbance-free and disturbed removal regimes.
2. Methodology
2.1. Experimental
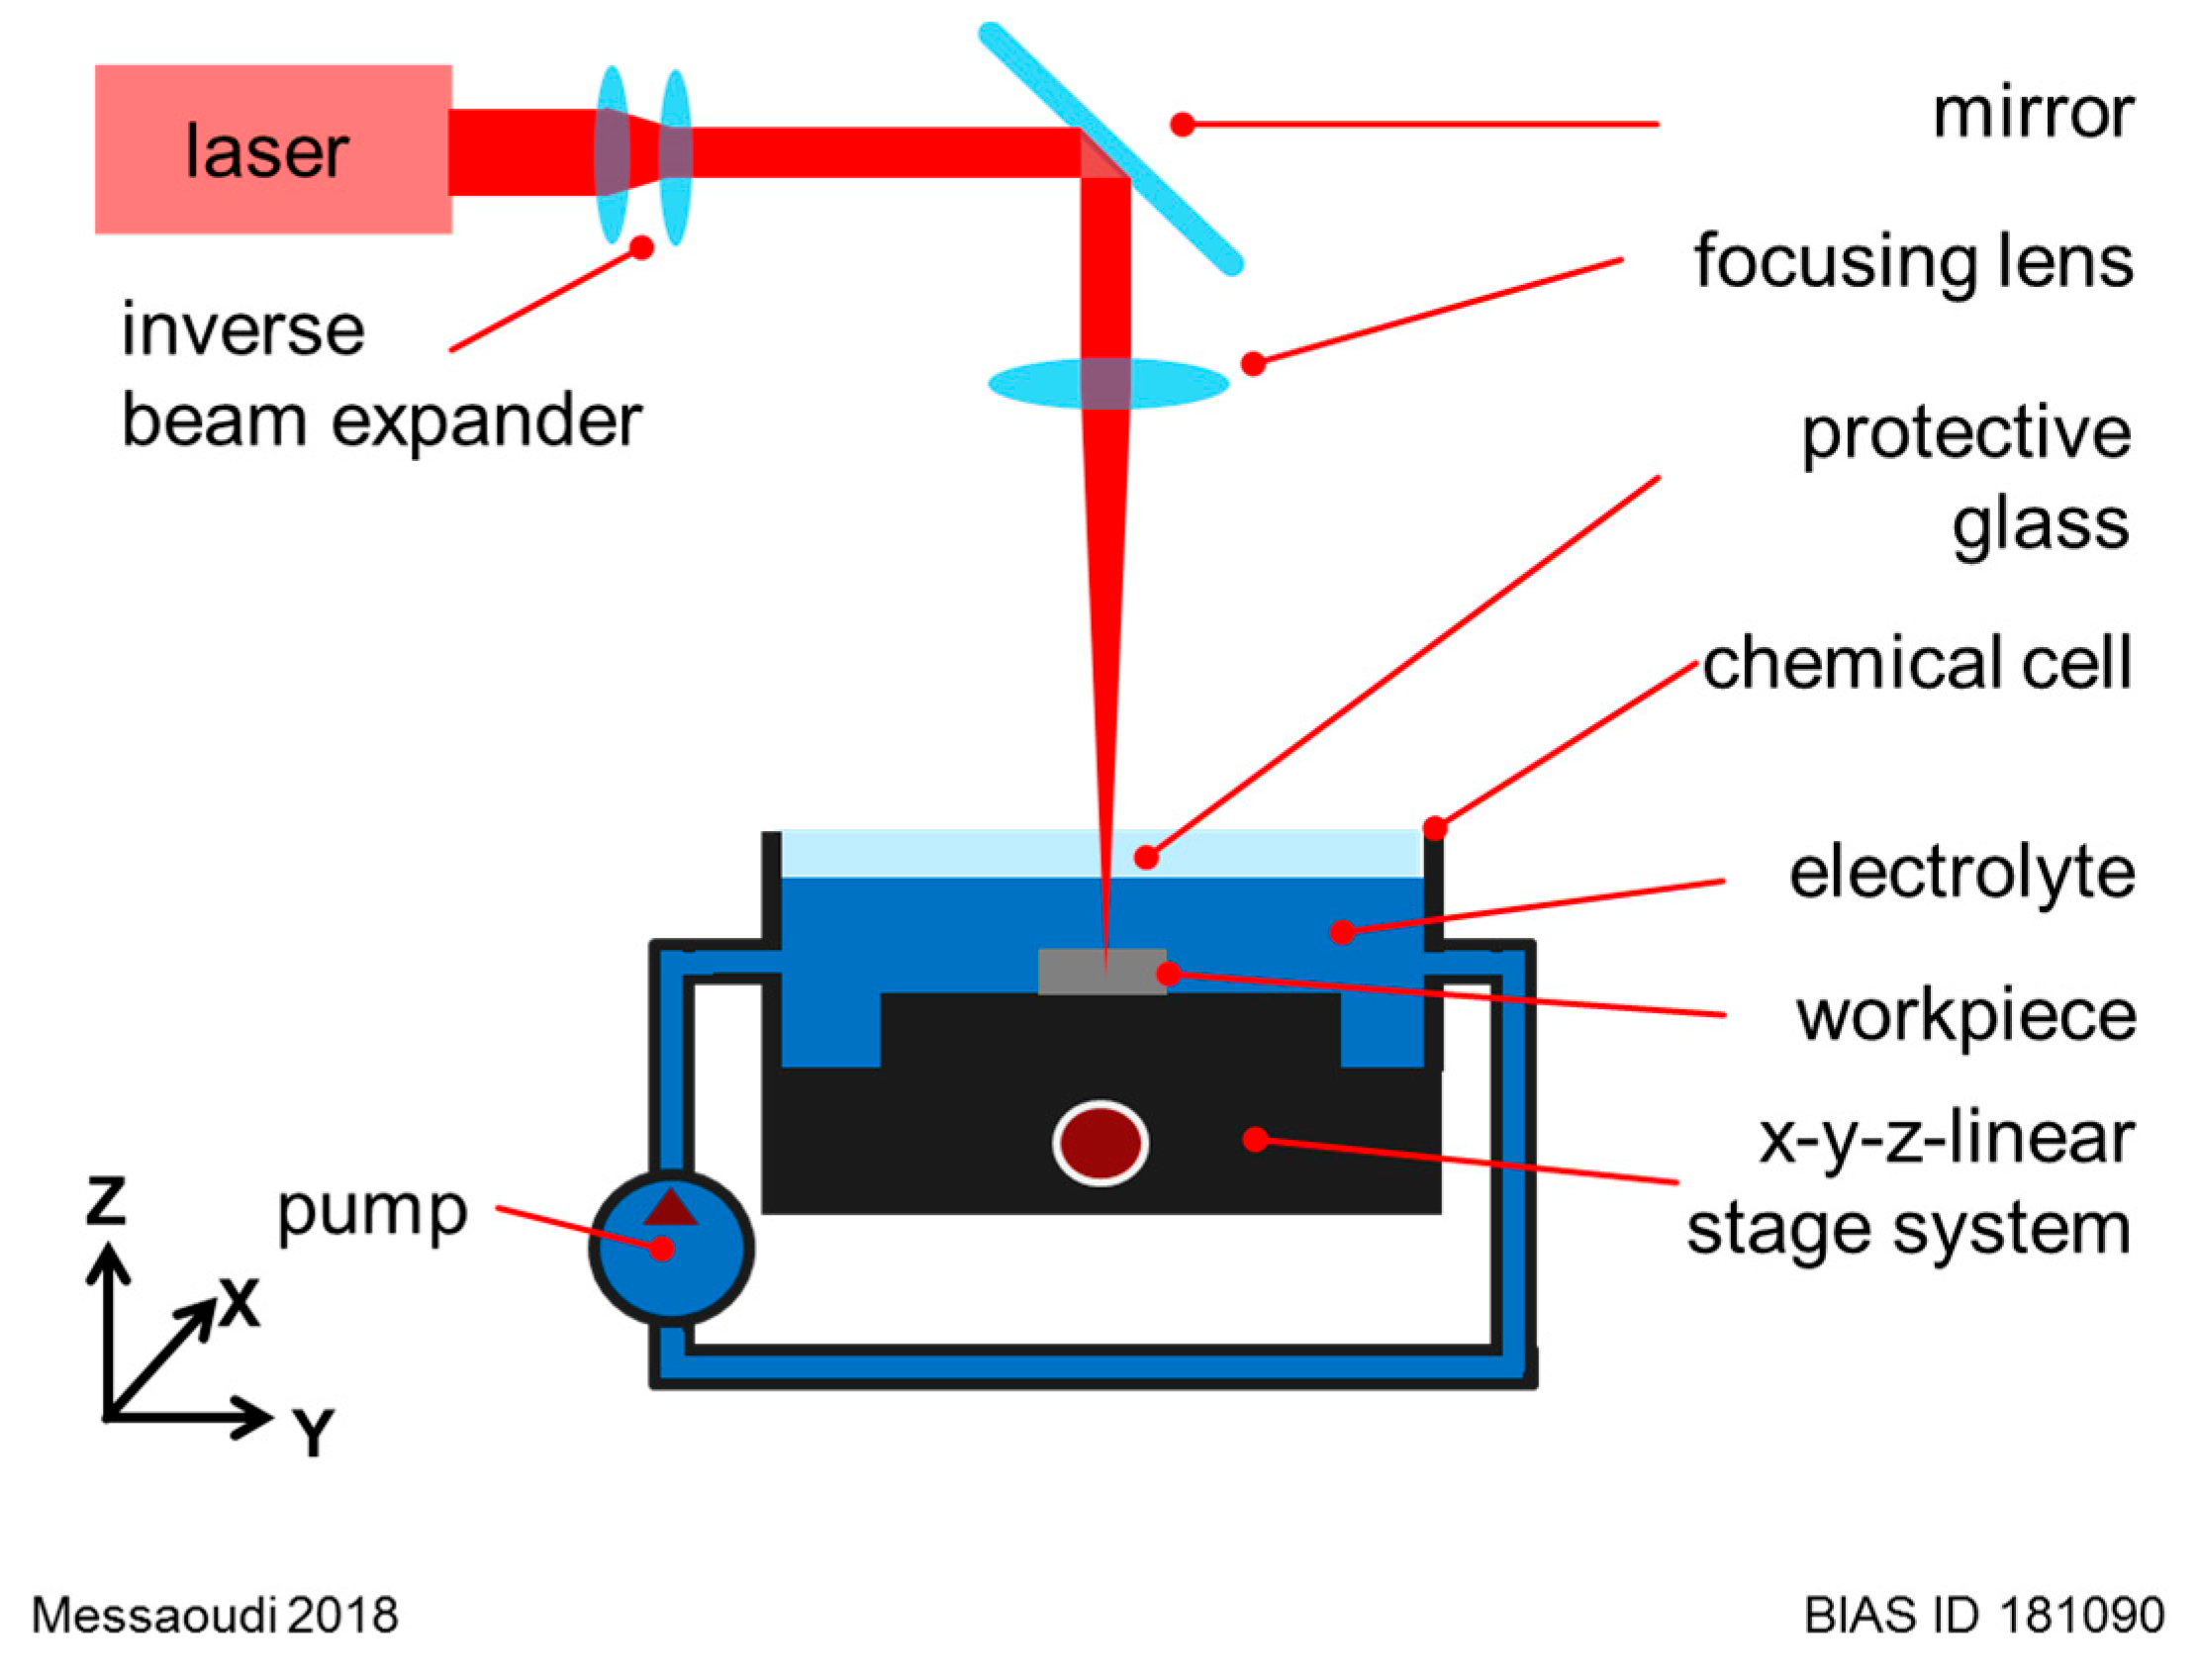
As a laser source, a continuous wave (cw) fiber laser JK400 (from JK Lasers, Rugby, UK) was used. Its TEM00-laser radiation of 1080 nm was focused by an f-theta optic (a focal length of 163 mm). Within the performed investigations, a laser spot diameter of 30.5 µm was applied. As sample materials, rolled titanium (3.7024) and stainless steel (AISI 304) with a thickness of 0.8 mm were used. The metallic workpieces were placed in a closed liquid-phase etching chamber, in which phosphoric acid (H3PO4) solutions of three different concentrations were pumped as a cross-jet through a (25 × 2) mm2 cross-section with a velocity vflow of 2 m/s. The electrolyte layer between the workpiece and protective glass had a height of 2 mm. Laser power measurements have revealed that the propagation through this layer resulted in an average reduction of 2% in laser power. Thus, the electrolyte had a transmission coefficient τE of 98% of the propagating laser light. During experimental investigations, x- and y-linear stages ensured the movement of the chamber, including the workpiece, with feed velocities up to 200 µm/s. A schematic illustration of the used setup is depicted in Figure 1.
The LCM process was based on single passes of 1 mm in length over the workpiece surface. These single passes were repeated twice for every parameter combinations of laser power, feed velocity and electrolyte concentration. Thereby, it should be noticed that titanium was machined at three different electrolyte concentrations (2.5, 5 and 7.5 mol/L H3PO4), while stainless steel was machined only in a 5-molar H3PO4 solution. The main laser parameters, as well as the electrolyte properties, are listed in Table 1.
2.2. Definition of the Removal Geometry
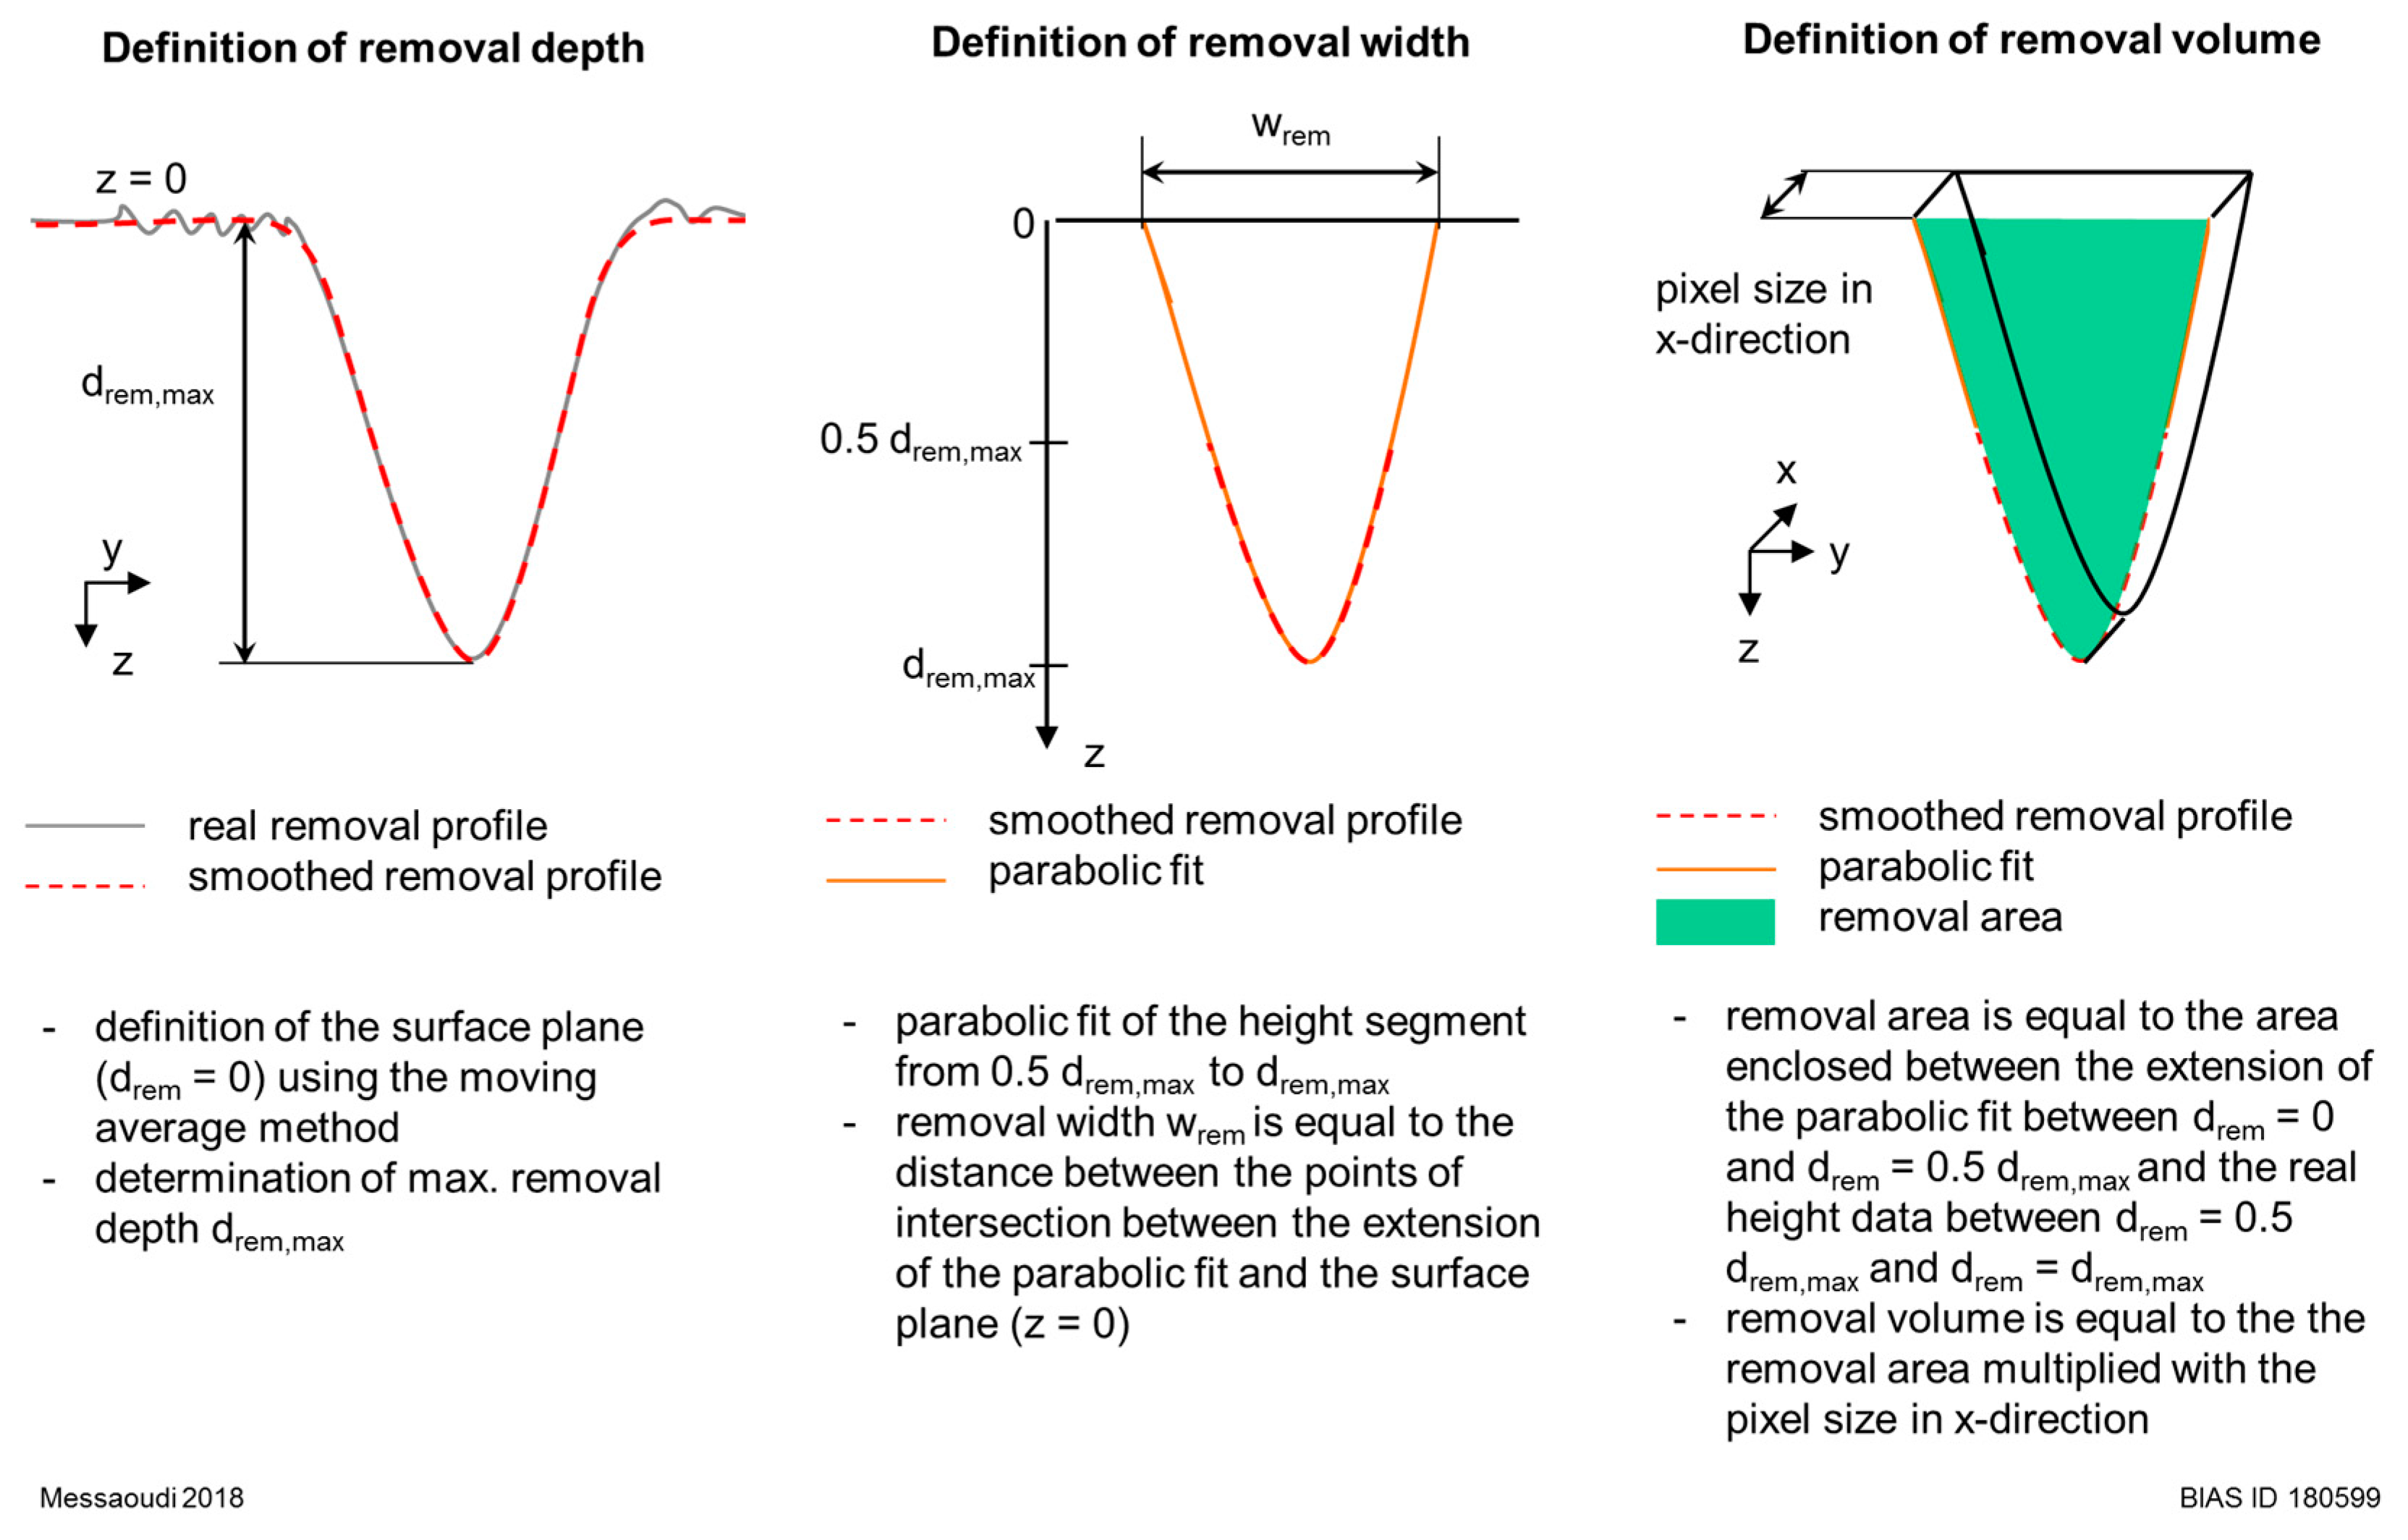
The removal cavities were recorded using a laser confocal scanning microscope (Keyence-VHX970) using a 50X-objective (1 pixel = 0.278 µm). The applied microscopic images consisted of n × m pixels2 with n = 768 and m = 2828 being the pixel number in the y- and x-directions, respectively. To ensure a uniform evaluation of the removal, characteristics regarding the depth, width and volume from the microscopic height data were analyzed. As the scan direction was defined to be along the x-axis, the image was segmented along this axis in m 2D removal profiles. Each 2D height profile was analyzed following the steps illustrated in Figure 2. In the first step, the real height data were smoothed using the moving average method based on a low-pass filter with coefficients equal to the reciprocal of the span. In the second step, the zero-line (z = 0) was defined by averaging the height values at the image corners (using 15% of the pixels). Thus, the maximum removal depth drem,max could be determined.
Afterwards, the height data covering the range between 0.5 drem,max and drem,max were extracted and underwent a parabolic fit. The distance between the intersection points of the extension of this parabolic fit and the zero-line determined the removal width wrem that was considered for later correlations. Finally, the removal area was defined to comprise the area of the real removal data enclosed between 0.5 drem,max and drem,max, as well as the area enclosed by the parabolic fit at the height range between 0 and 0.5 drem,max. To define the removal volume within one pixel, the determined removal area (for one 2D profile) was multiplied by the pixel size in the x-direction (0.278 µm), whereby a constant removal along one pixel was assumed. This procedure was performed for all 2D profiles along the x-axis in a for-loop. Hence, the average geometrical values and the standard deviations of complete images were calculated and summarized in excel files.
2.3. Categorization of the Removal Quality
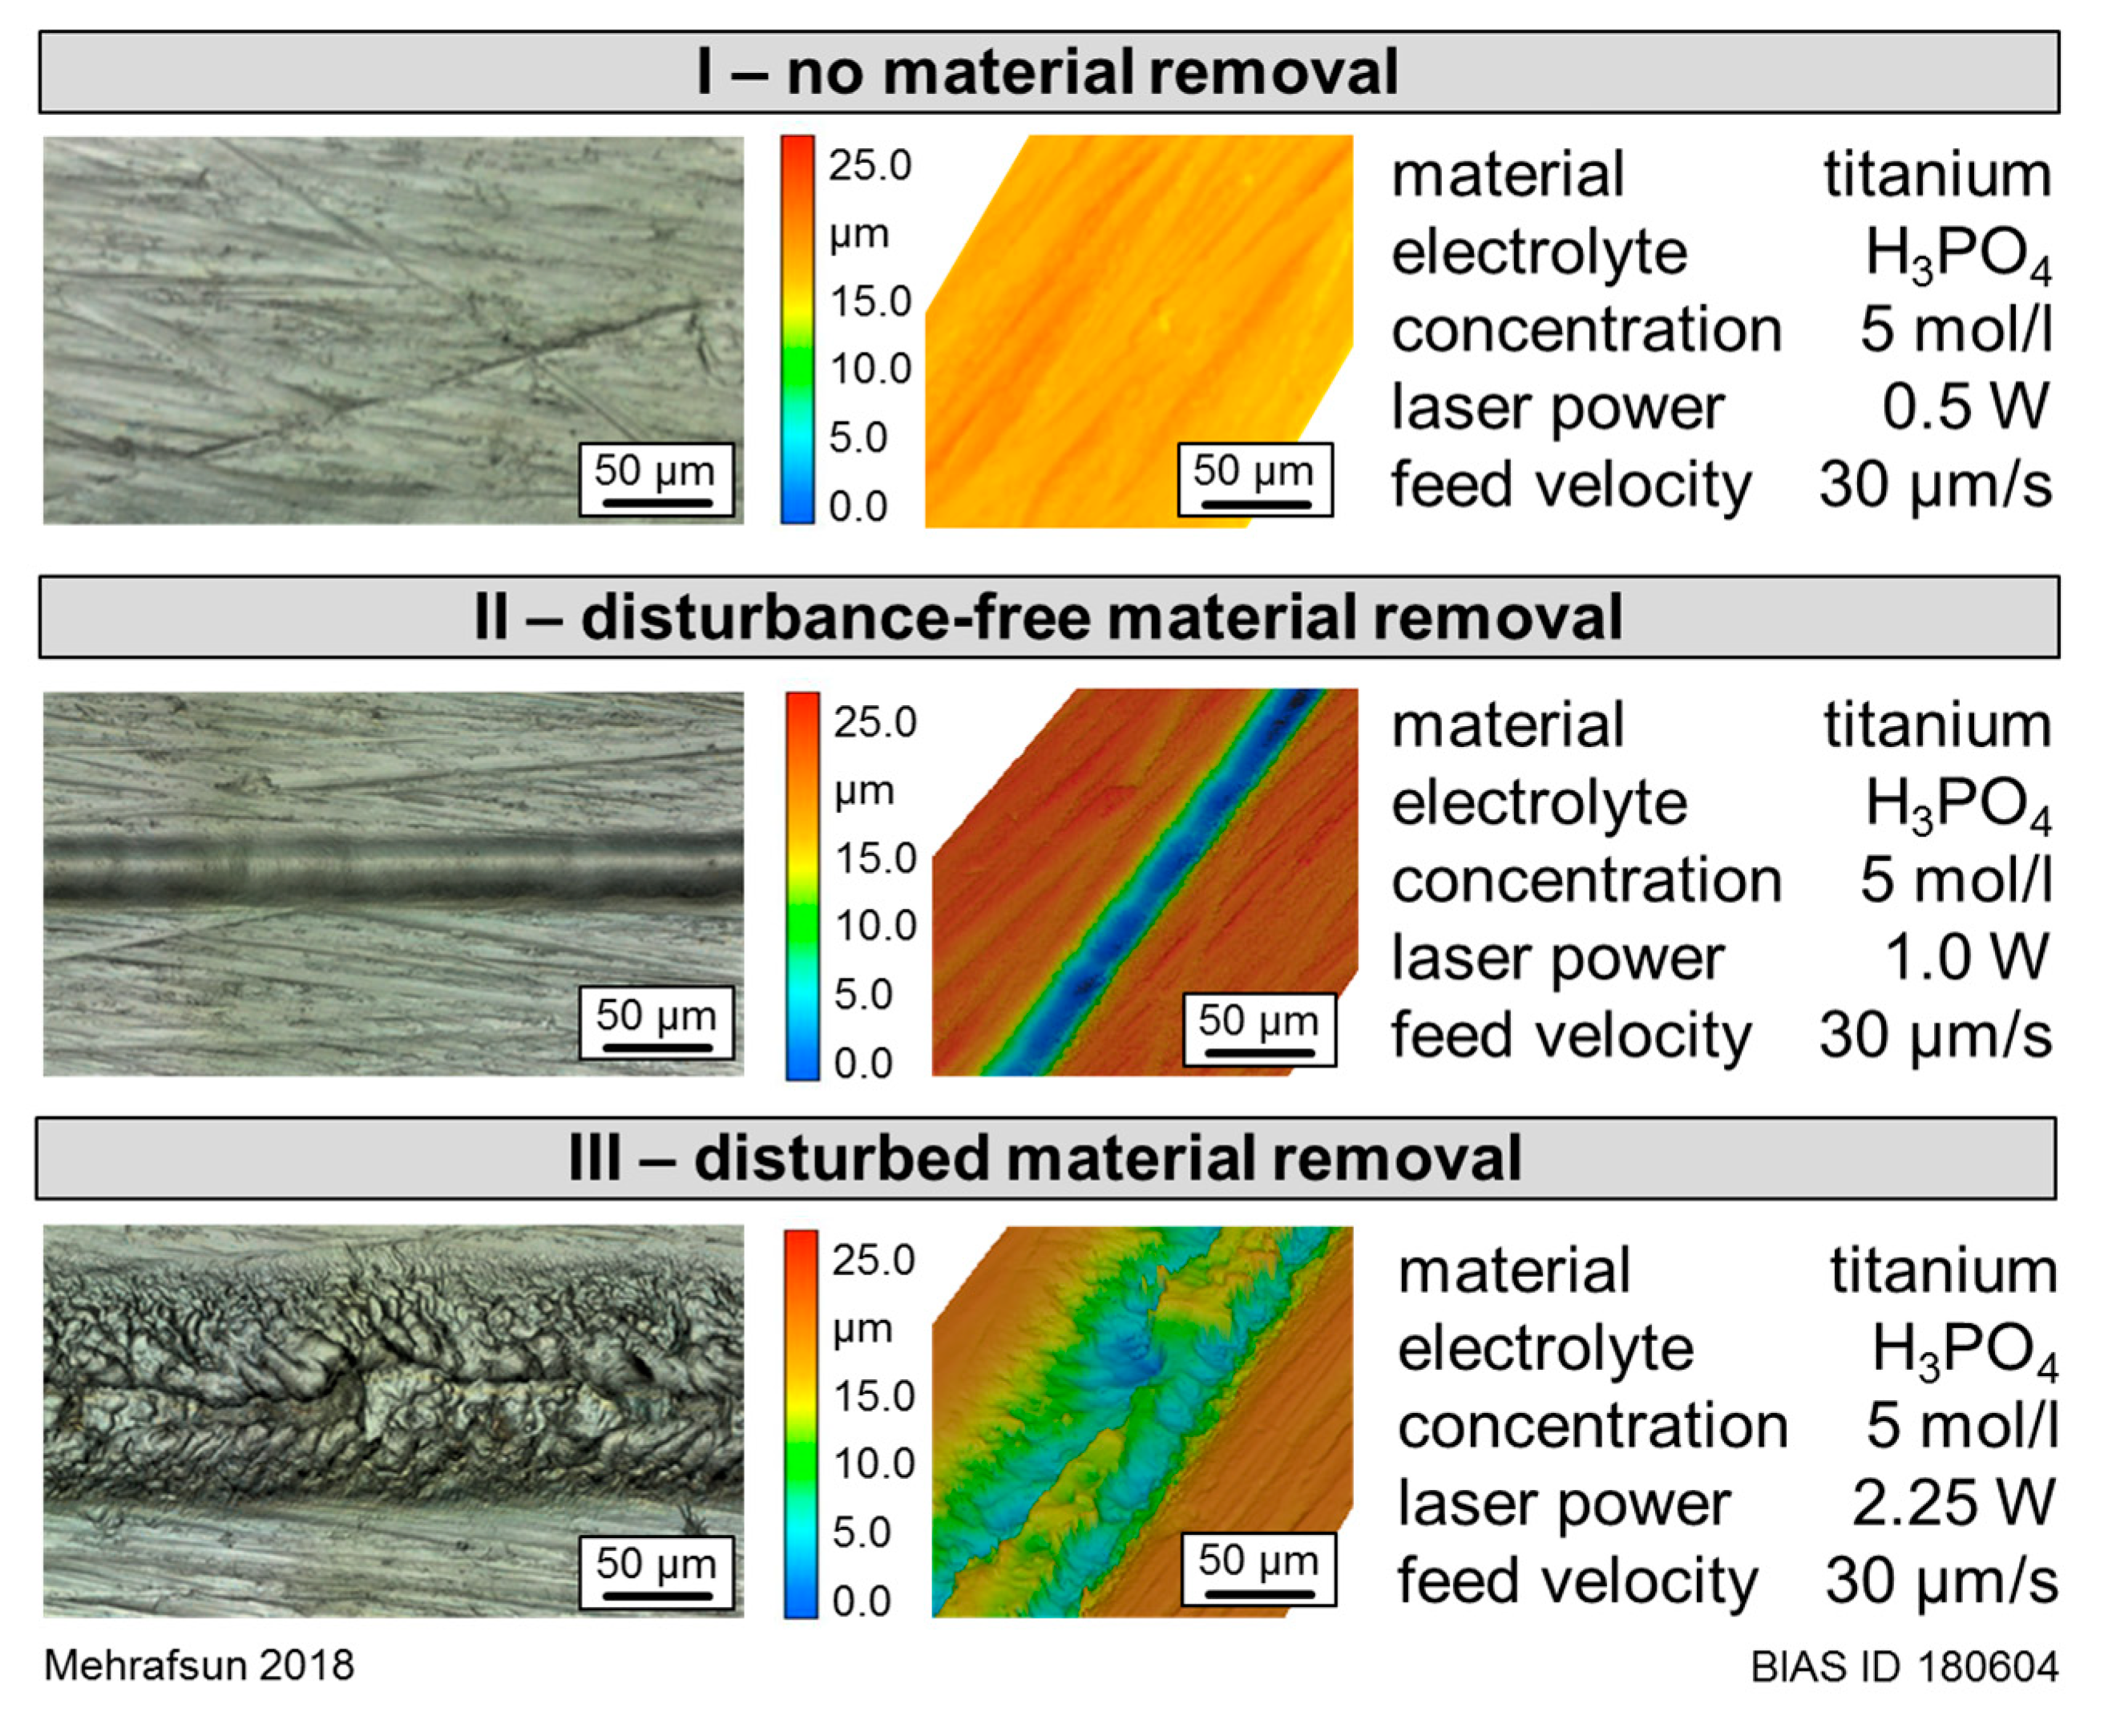
As shown in previous works [6,13], the quality and type of a laser chemically removed cavity are strongly dependent on the selected process parameters, mainly the laser power PL and feed velocity vfeed. For a categorization of the removal quality, the resulting removal cavities, recorded by the confocal scanning microscope, were divided into three categories, depending on the 2D removal profile:
- category I: no material removal;
- category II: a disturbance-free removal characterized with a bell-like profile;
- category III: a disturbed material removal characterized with a non-bell-like profile, such as a W-like one.
Figure 3 shows examples of the possible cavities and their classification into categories. Thereby, it has to be mentioned that the appearance and the imprint degree can vary within the removal lines as well as the categories. In particular, the cavities of category III are subject to a certain variance.
3. Results
3.1. Influence of the Material on the Removal Characteristics
3.1.1. Resulting Process Windows
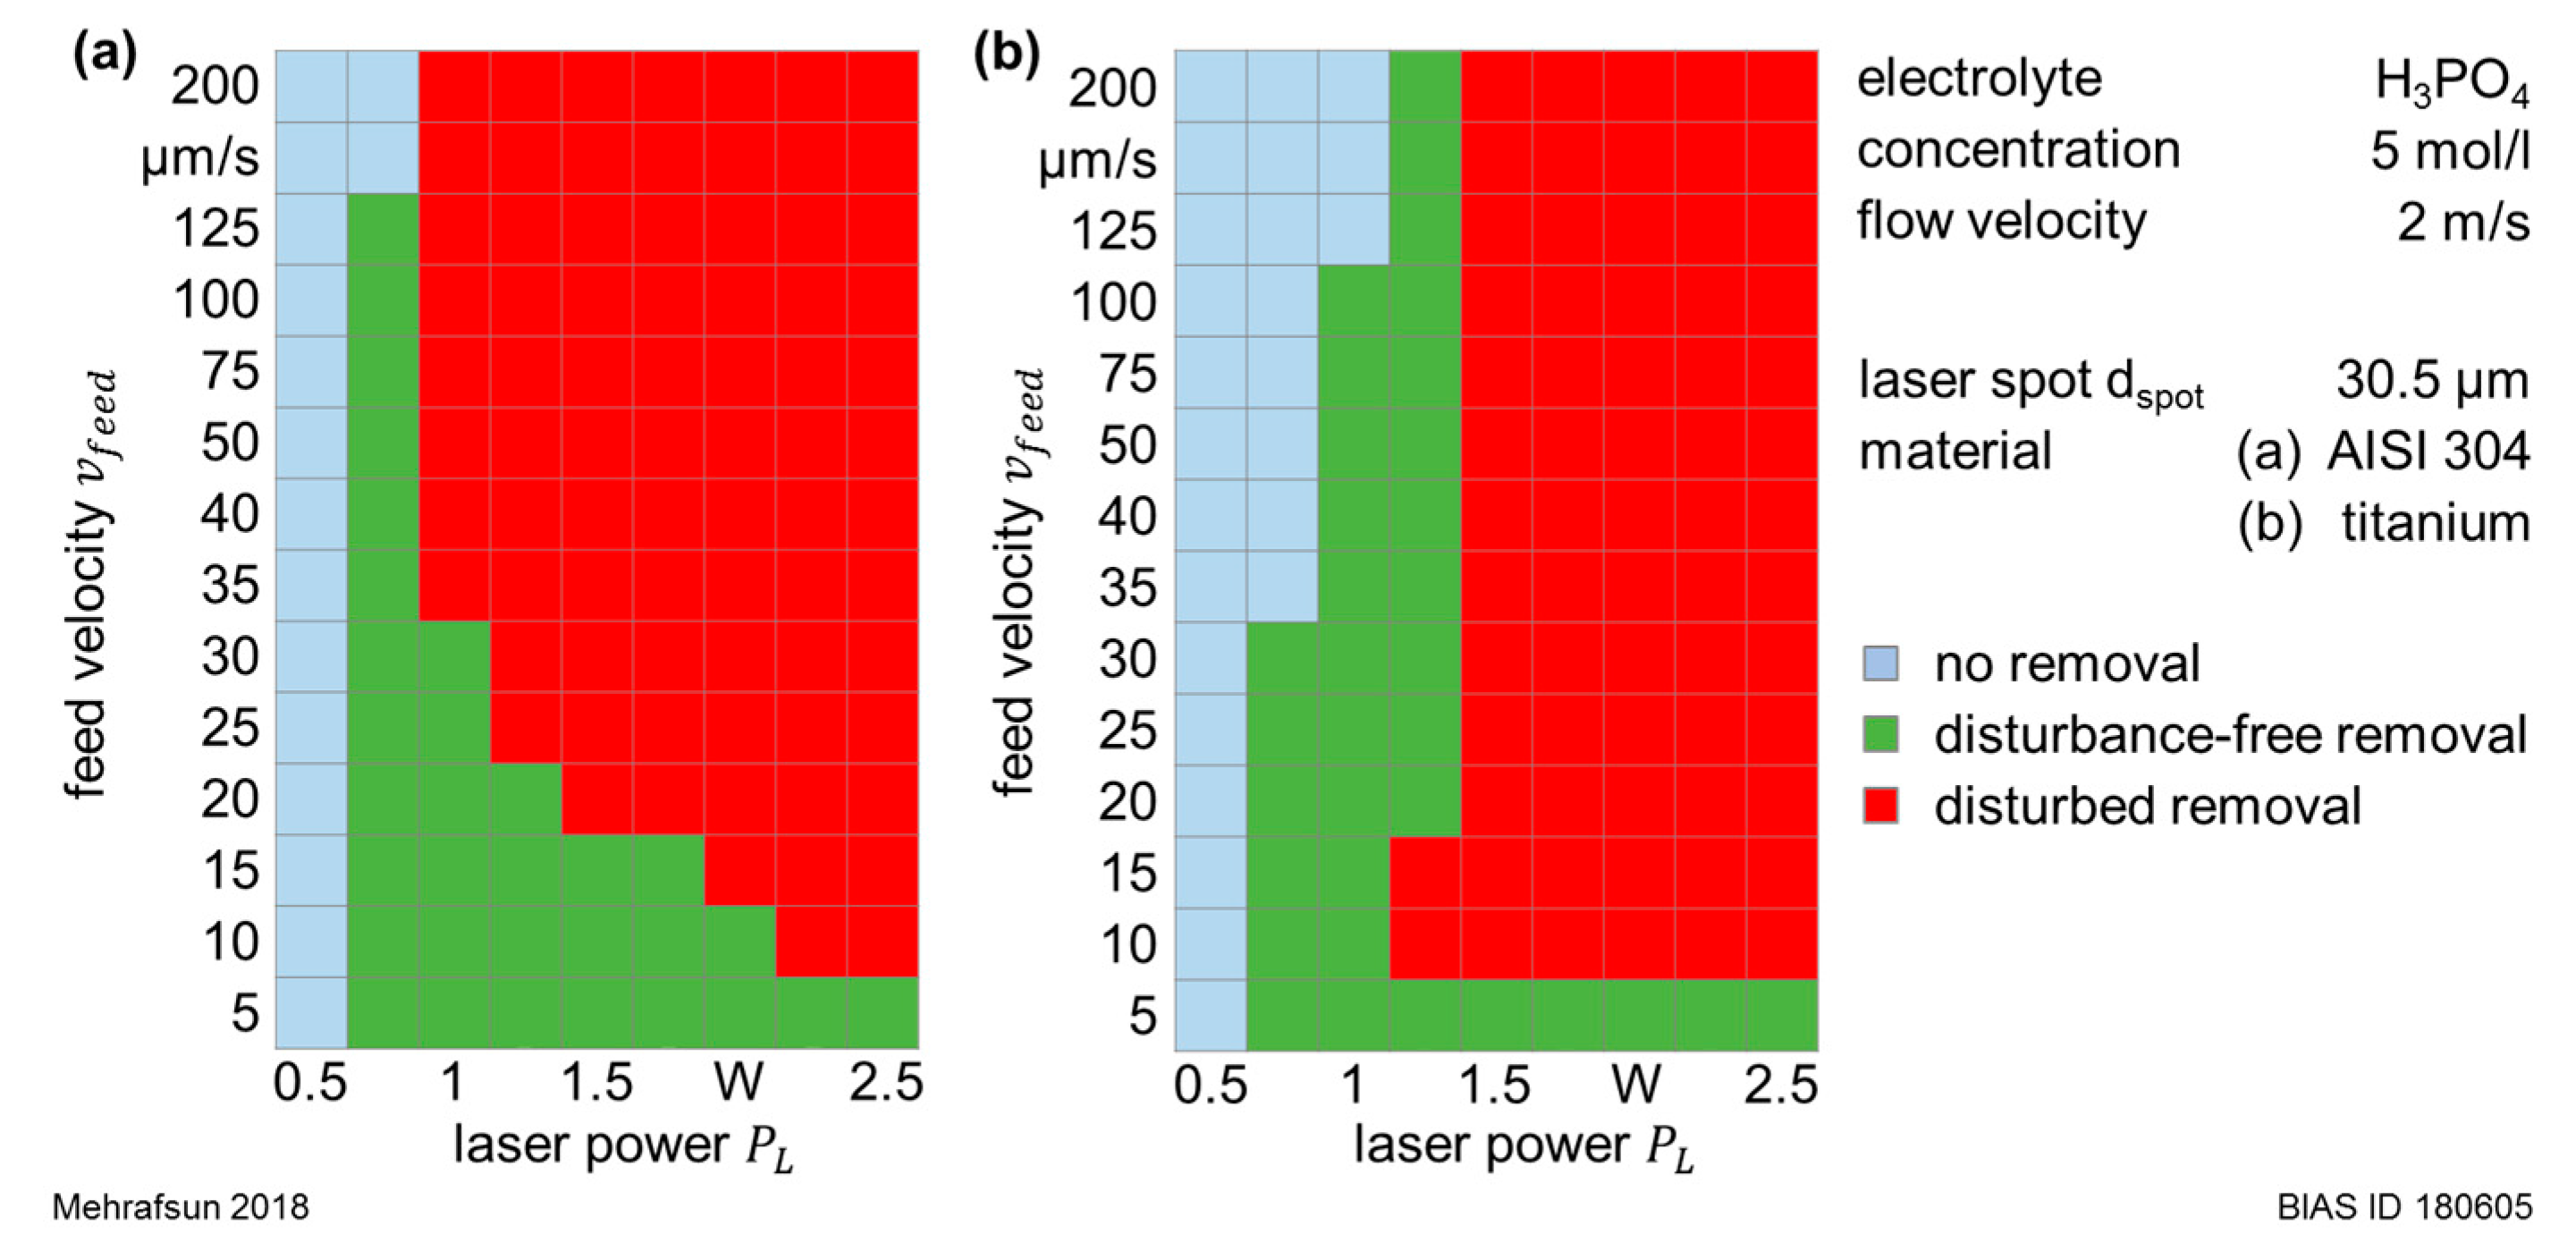
Based on the defined categorization, Figure 4 illustrates the experimentally determined removal regimes in stainless steel (Figure 4a) and titanium (Figure 4b) in dependence of the laser power PL and feed velocity vfeed. Thereby, the green-marked combinations represented the cavities characterized with a bell-like removal profile and indicated a disturbance-free LCM-process. In contrast, the material removal within the red-marked combinations was labeled by a certain disturbance (a non-bell-like profile).
As seen in Figure 4, a laser chemical removal was observed in both materials starting at PL = 0.75 W. At this laser power, a disturbance-free material removal was obtained up to a feed velocity vfeed of 125 µm/s in stainless steel and up to 30 µm/s in titanium. A further increase of laser power PL resulted in different behaviors for the two materials. In stainless steel, the range of velocities for a disturbance-free removal decreased continuously with the increasing laser power. In contrast, in titanium, a bell-shaped removal profile was also obtained at higher feed velocities at 1 W (up to vfeed = 100 µm/s) and 1.25 W (up to vfeed = 200 µm/s). For a laser power PL ≥1.5 W, removal disturbances were observed for most combinations, except with a feed velocity of 5 µm/s.
3.1.2. Influence of Laser Power on Removal Characteristics
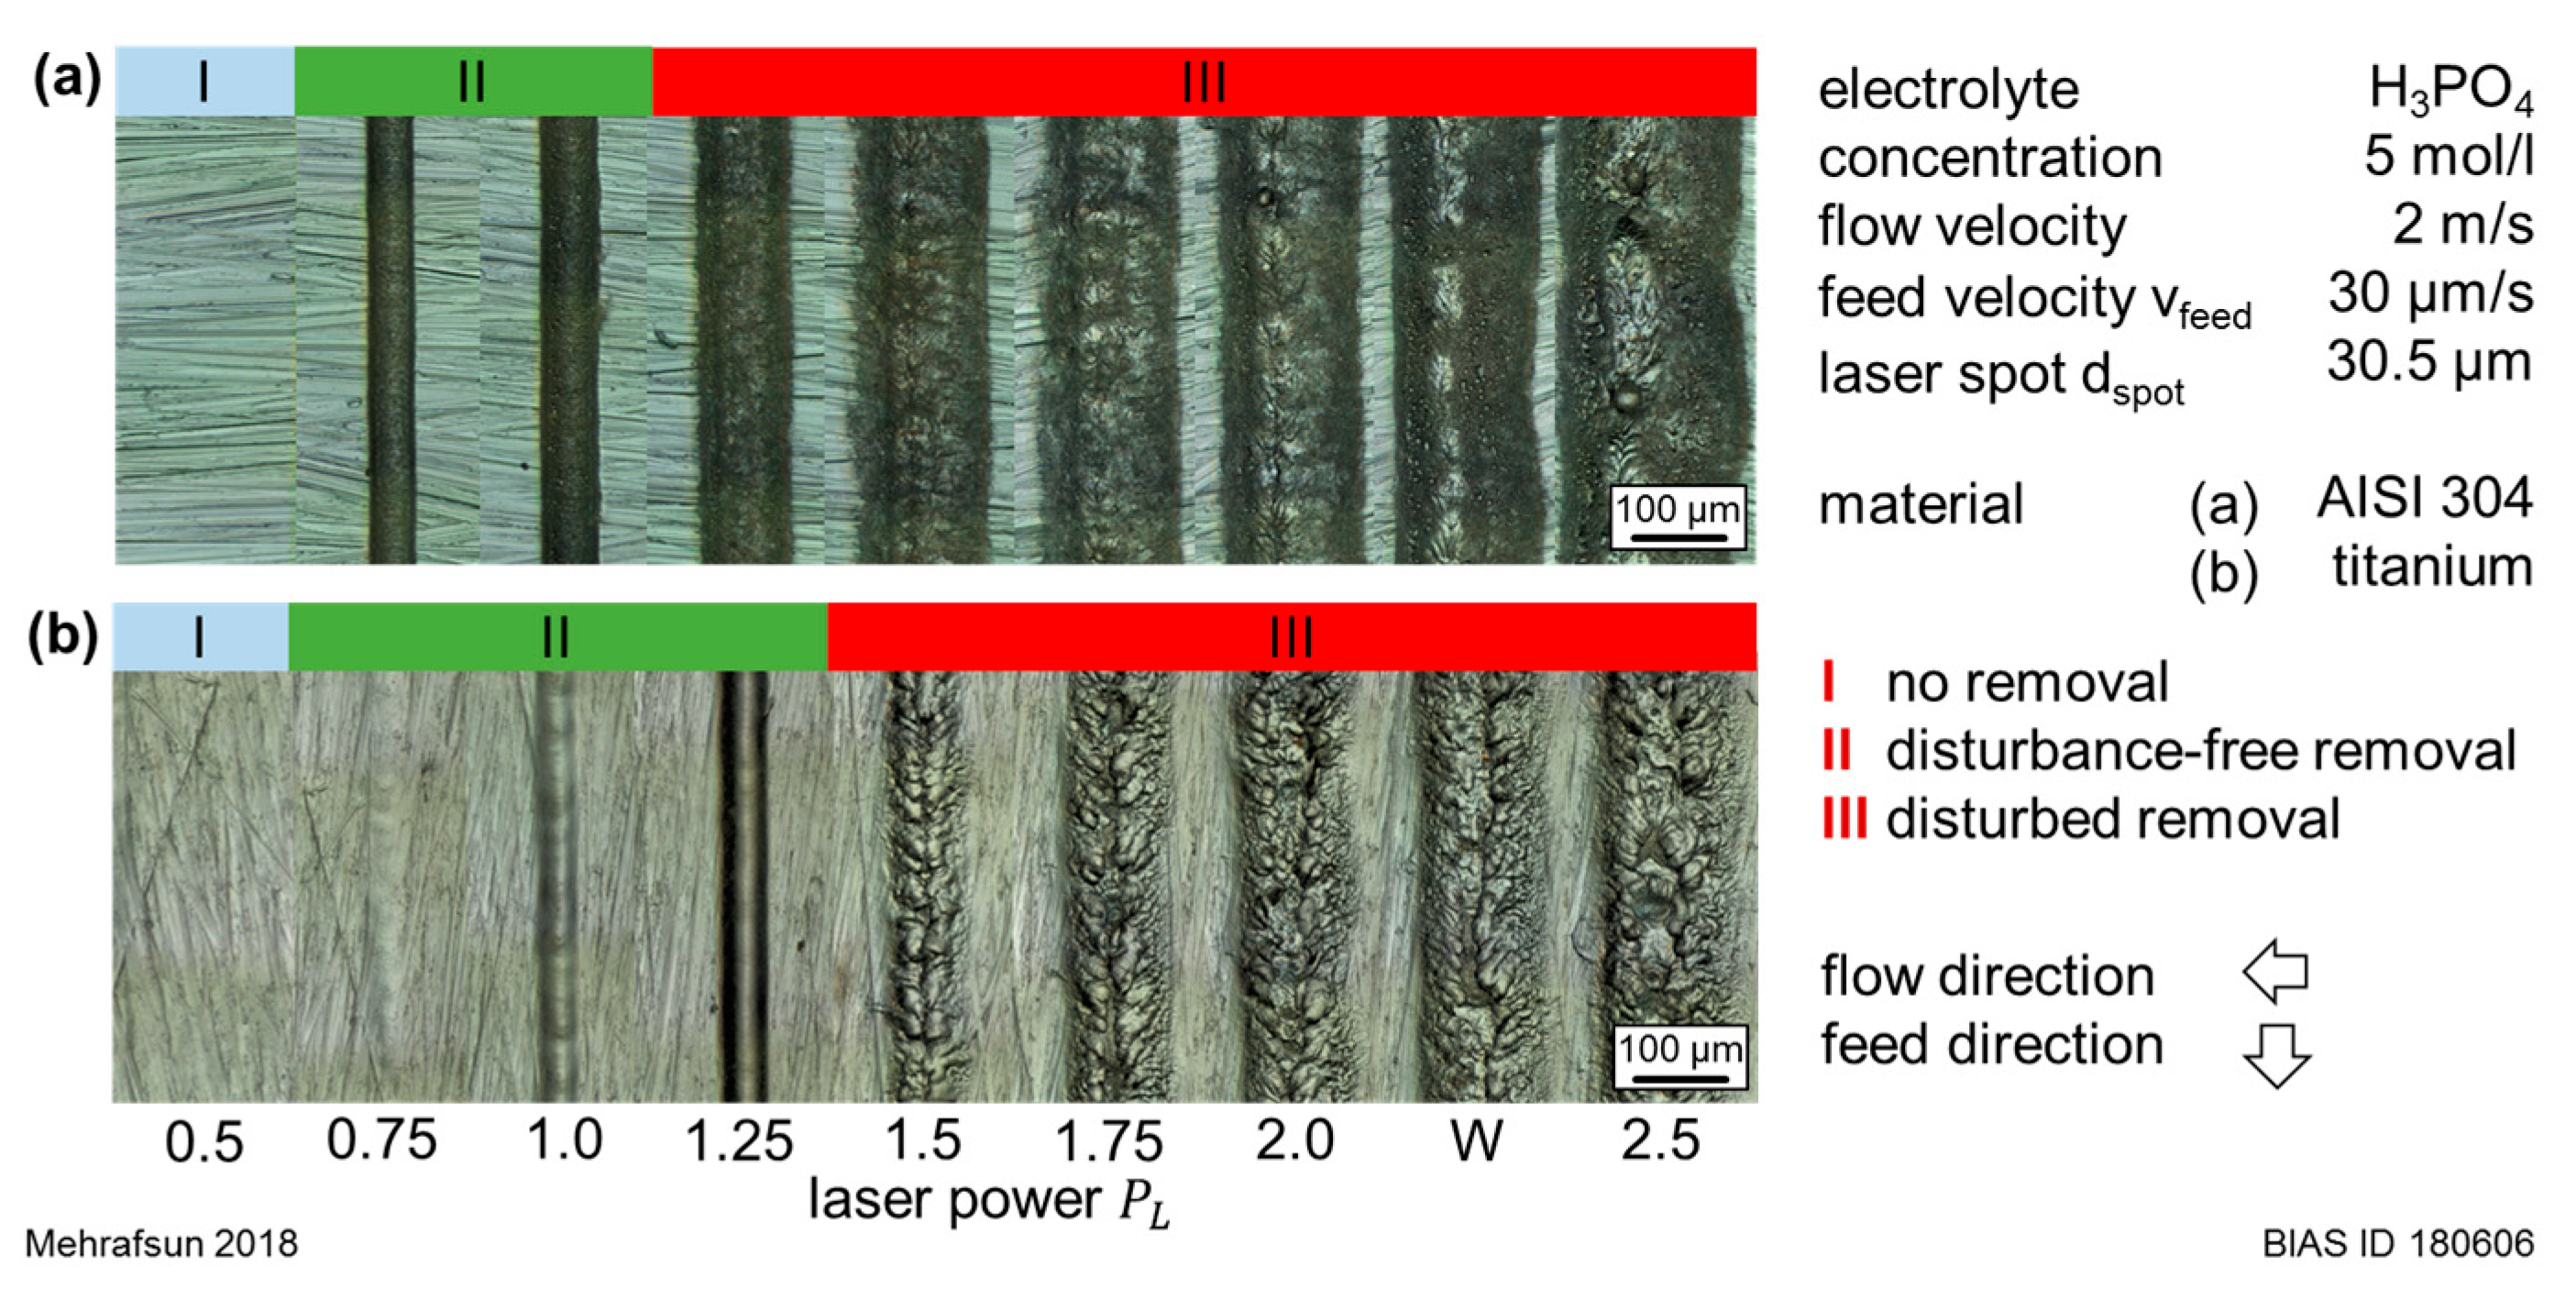
Figure 5 shows the resulting cavities in dependence on the applied laser power during the LCM of stainless steel (Figure 5a) and titanium (Figure 5b) exemplarily with a feed velocity of 30 µm/s. It can be observed that the cavities were more pronounced in stainless steel than in titanium.
Further, the transition from a disturbance-free to a disturbed material removal began at a slightly higher laser power in titanium compared to stainless steel. In addition, the LCM-removal in stainless steel took place over larger areas. This was reflected in broader removal lines compared with those in titanium, especially within the disturbed removal regime (category III).
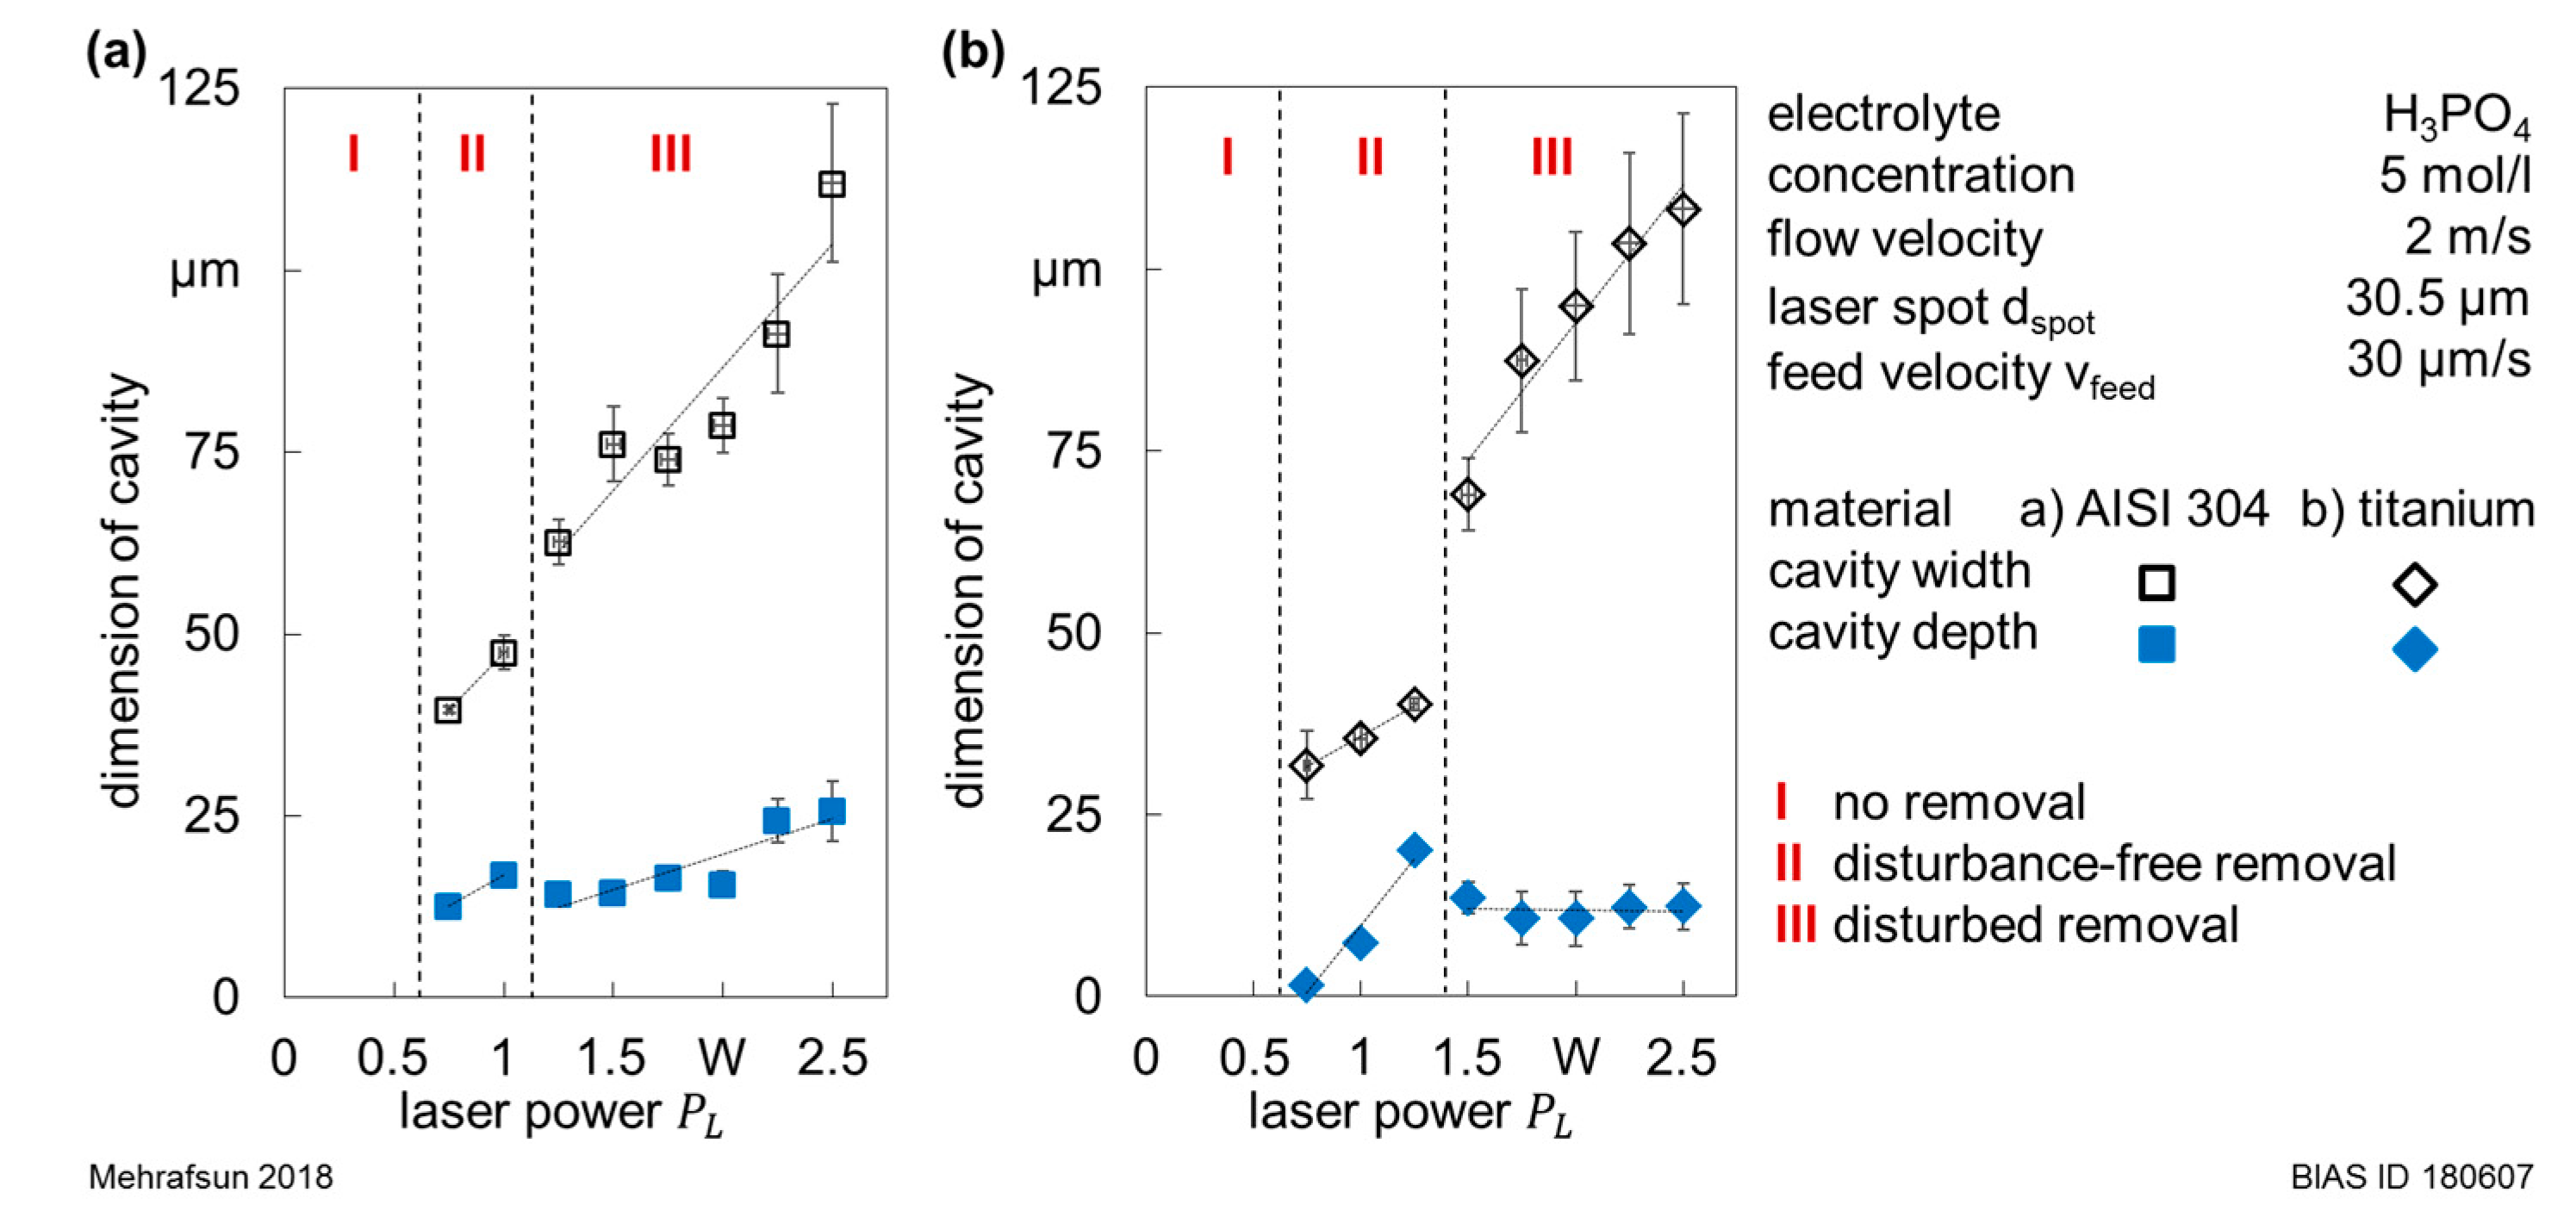
The quantitative characterizations of the resulting removal width wrem and depth drem with vfeed = 30 µm/s in stainless steel, as well as in titanium, are illustrated in Figure 6. For both materials, linear increases in removal depth and width were observed in the removal regime II with increased laser power PL. Within this regime, the removal was homogeneous and showed low standard deviations. The transition to the disturbed regime (category III) was labeled by a sudden reduction in the removal depth and an increase in the removal width. By further increasing the laser power, the removal irregularities were reflected within the higher standard deviations. In general, the obtained geometrical values confirmed the optical impression of a more pronounced removal in stainless steel (Figure 5). For LCM of titanium, the transition to a disturbed removal began at a laser power PL of 1.5 W. On the one hand, the removal width wrem increased from 40.2 µm ± 0.8 µm (at PL = 1.25 W) to 69 µm ± 5 µm (at PL = 1.5 W). On the other hand, the removal depth drem decreased from 20.2 µm ± 1.2 µm (at PL = 1.25 W) to 13.6 µm ± 2.2 µm (at PL = 1.5 W). In contrast, the transition from a disturbance-free (at PL = 1 W) to a disturbed (at PL = 1.25 W) material removal turned out softer in stainless steel.
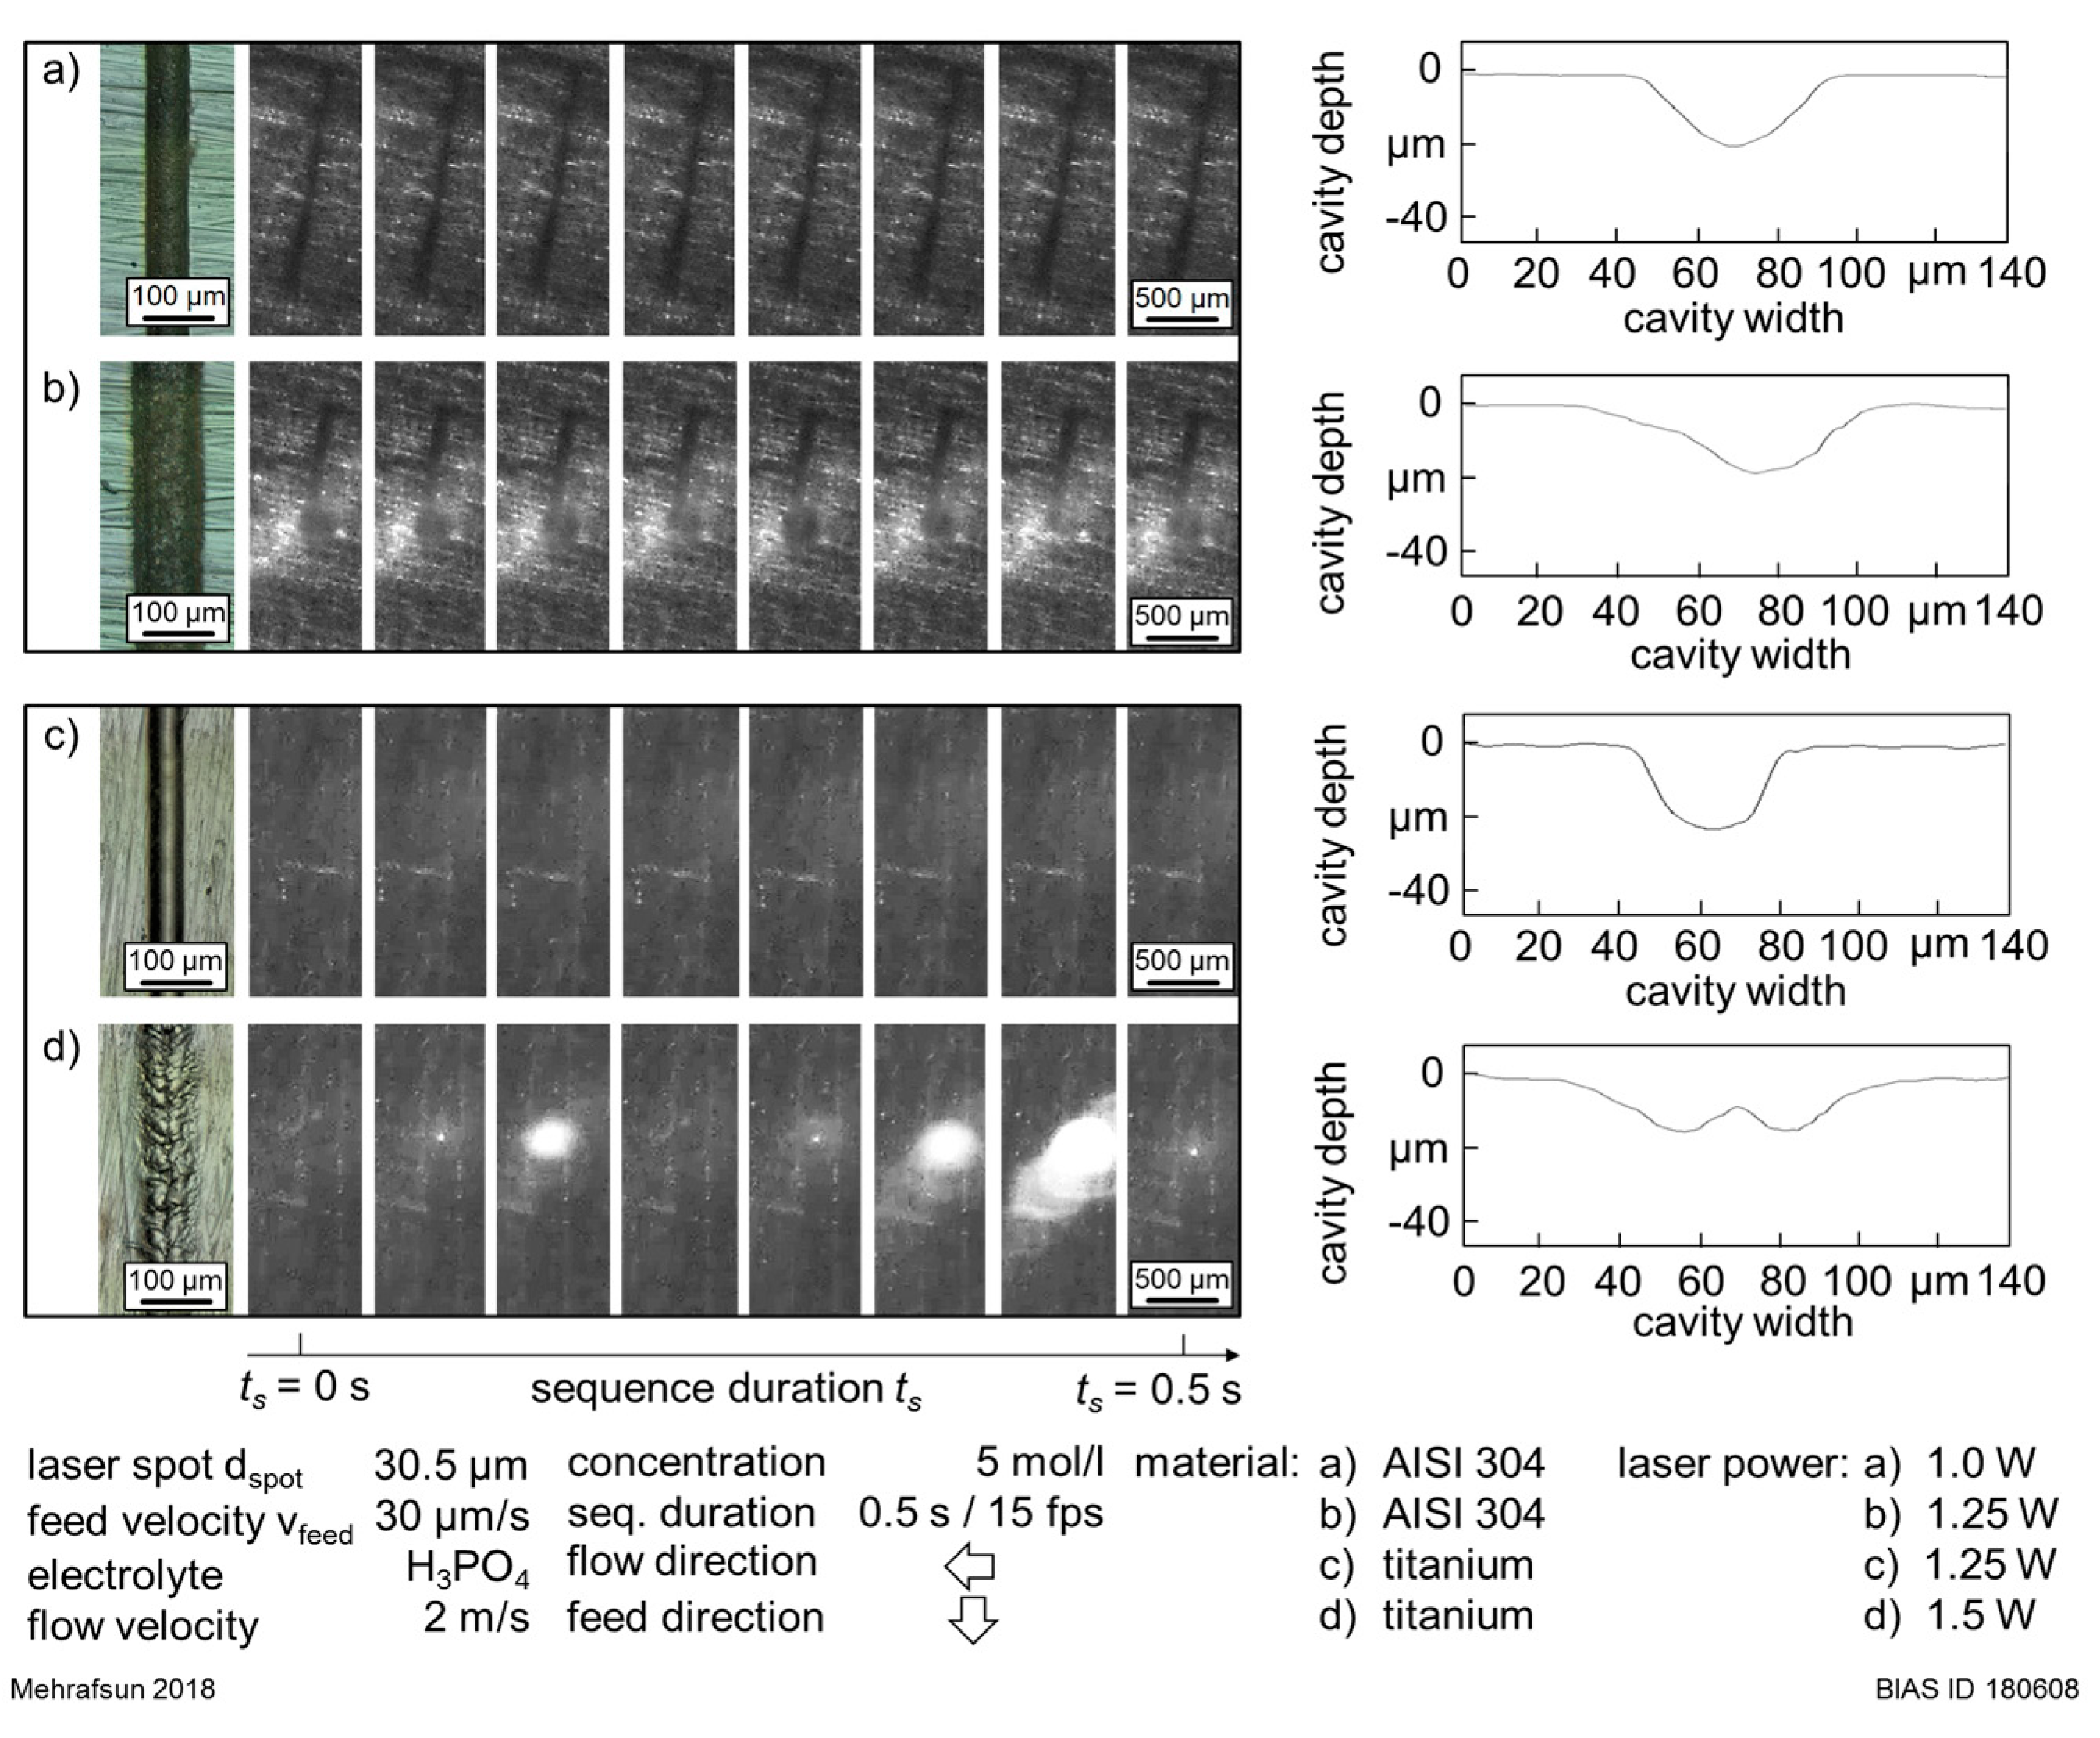
To investigate in more detail the transition behavior to a disturbed material removal with respect to the laser power PL, the interaction zone was recorded (a record duration of 0.5 s) during the LCM of both materials. Figure 7 shows the resulting CCD snapshots as well as the corresponding microscopic images and their characteristic 2D removal profiles. It can be seen that the transition to a disturbed removal in titanium was characterized by a change of the removal profile from a bell-like to a W-like one, while in stainless steel by a widening and flattening of the removal geometry. Moreover, the snapshots in Figure 7b,d revealed that the interaction zone was labeled by an enhanced gas bubble activity. Alternating adhering and rising gas bubbles resulted in significant fluctuating light reflections, which were found to be much stronger in titanium than in stainless steel.
3.1.3. Influence of Feed Velocity on Removal Characteristics
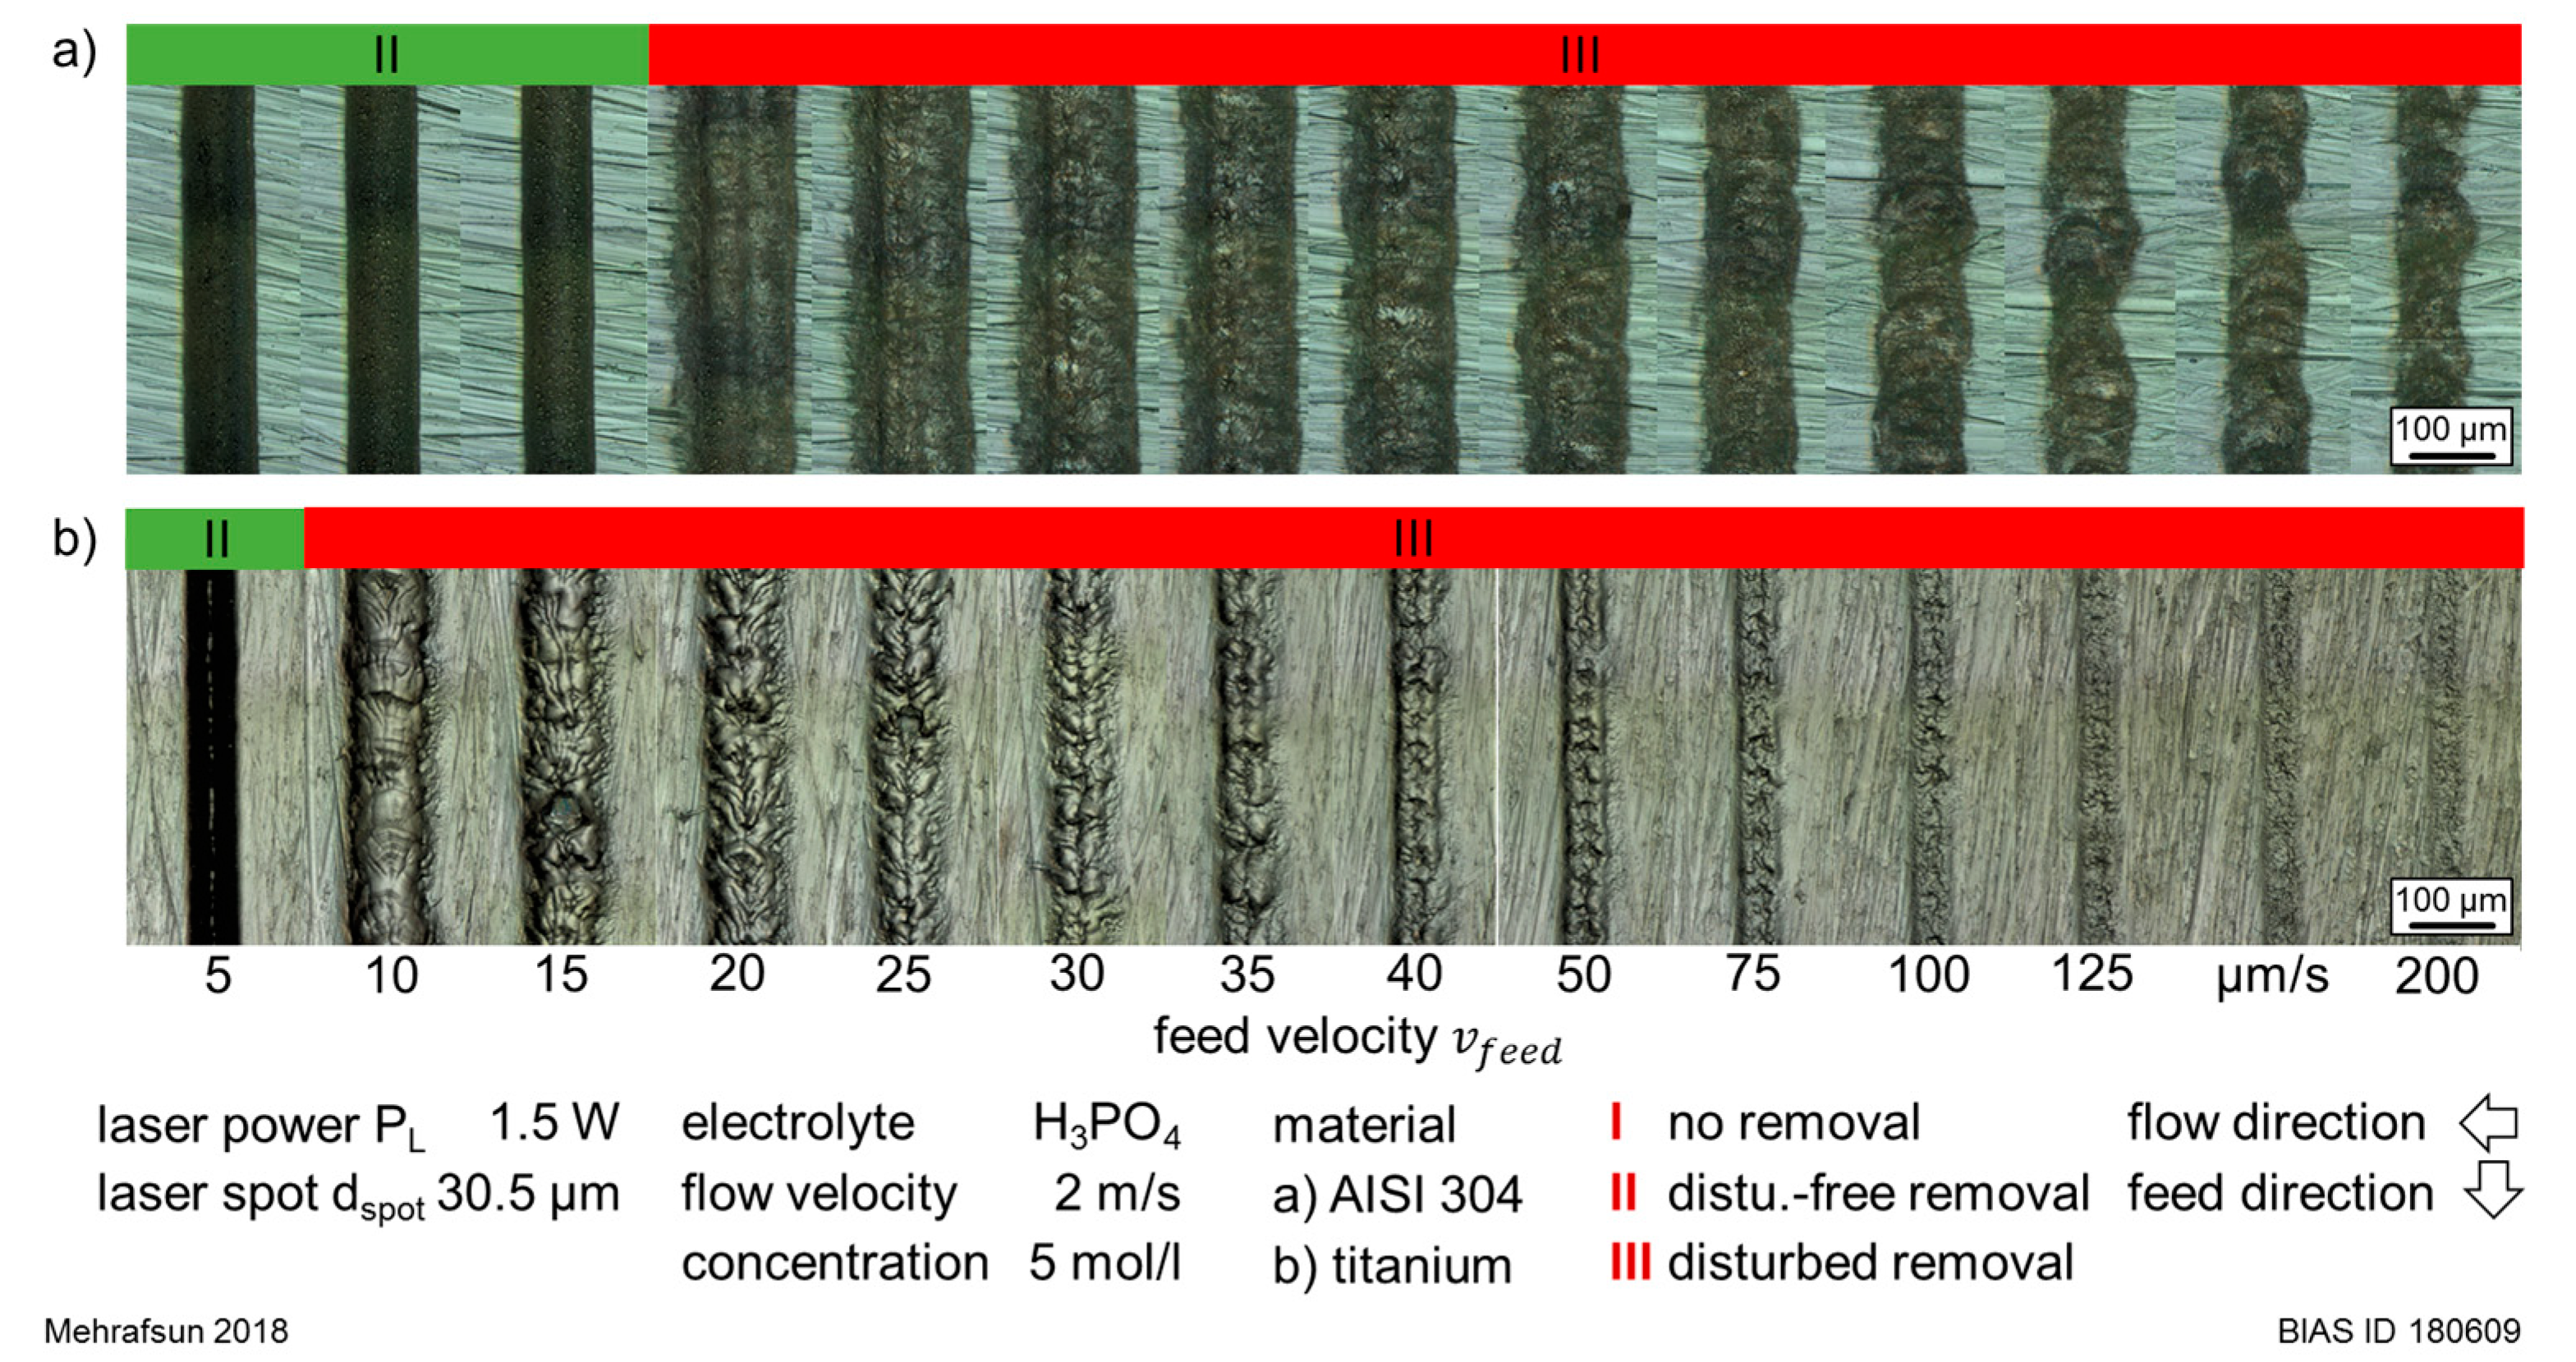
Figure 8 shows exemplarily the resulting LCM cavities realized in titanium and stainless steel in dependence of the feed velocity vfeed at PL = 1.5 W. At this laser power, the removal remained nearly disturbance-free at low feed velocities, despite an assumed high thermal impact. However, the removal quality diminished with the increasing feed velocity. The transition from a disturbance-free (green marks) to a disturbed removal (red marks) took place by increasing the feed velocity from 15 µm/s to 20 µm/s in stainless steel, while it occurred at vfeed = 10 µm/s in titanium.
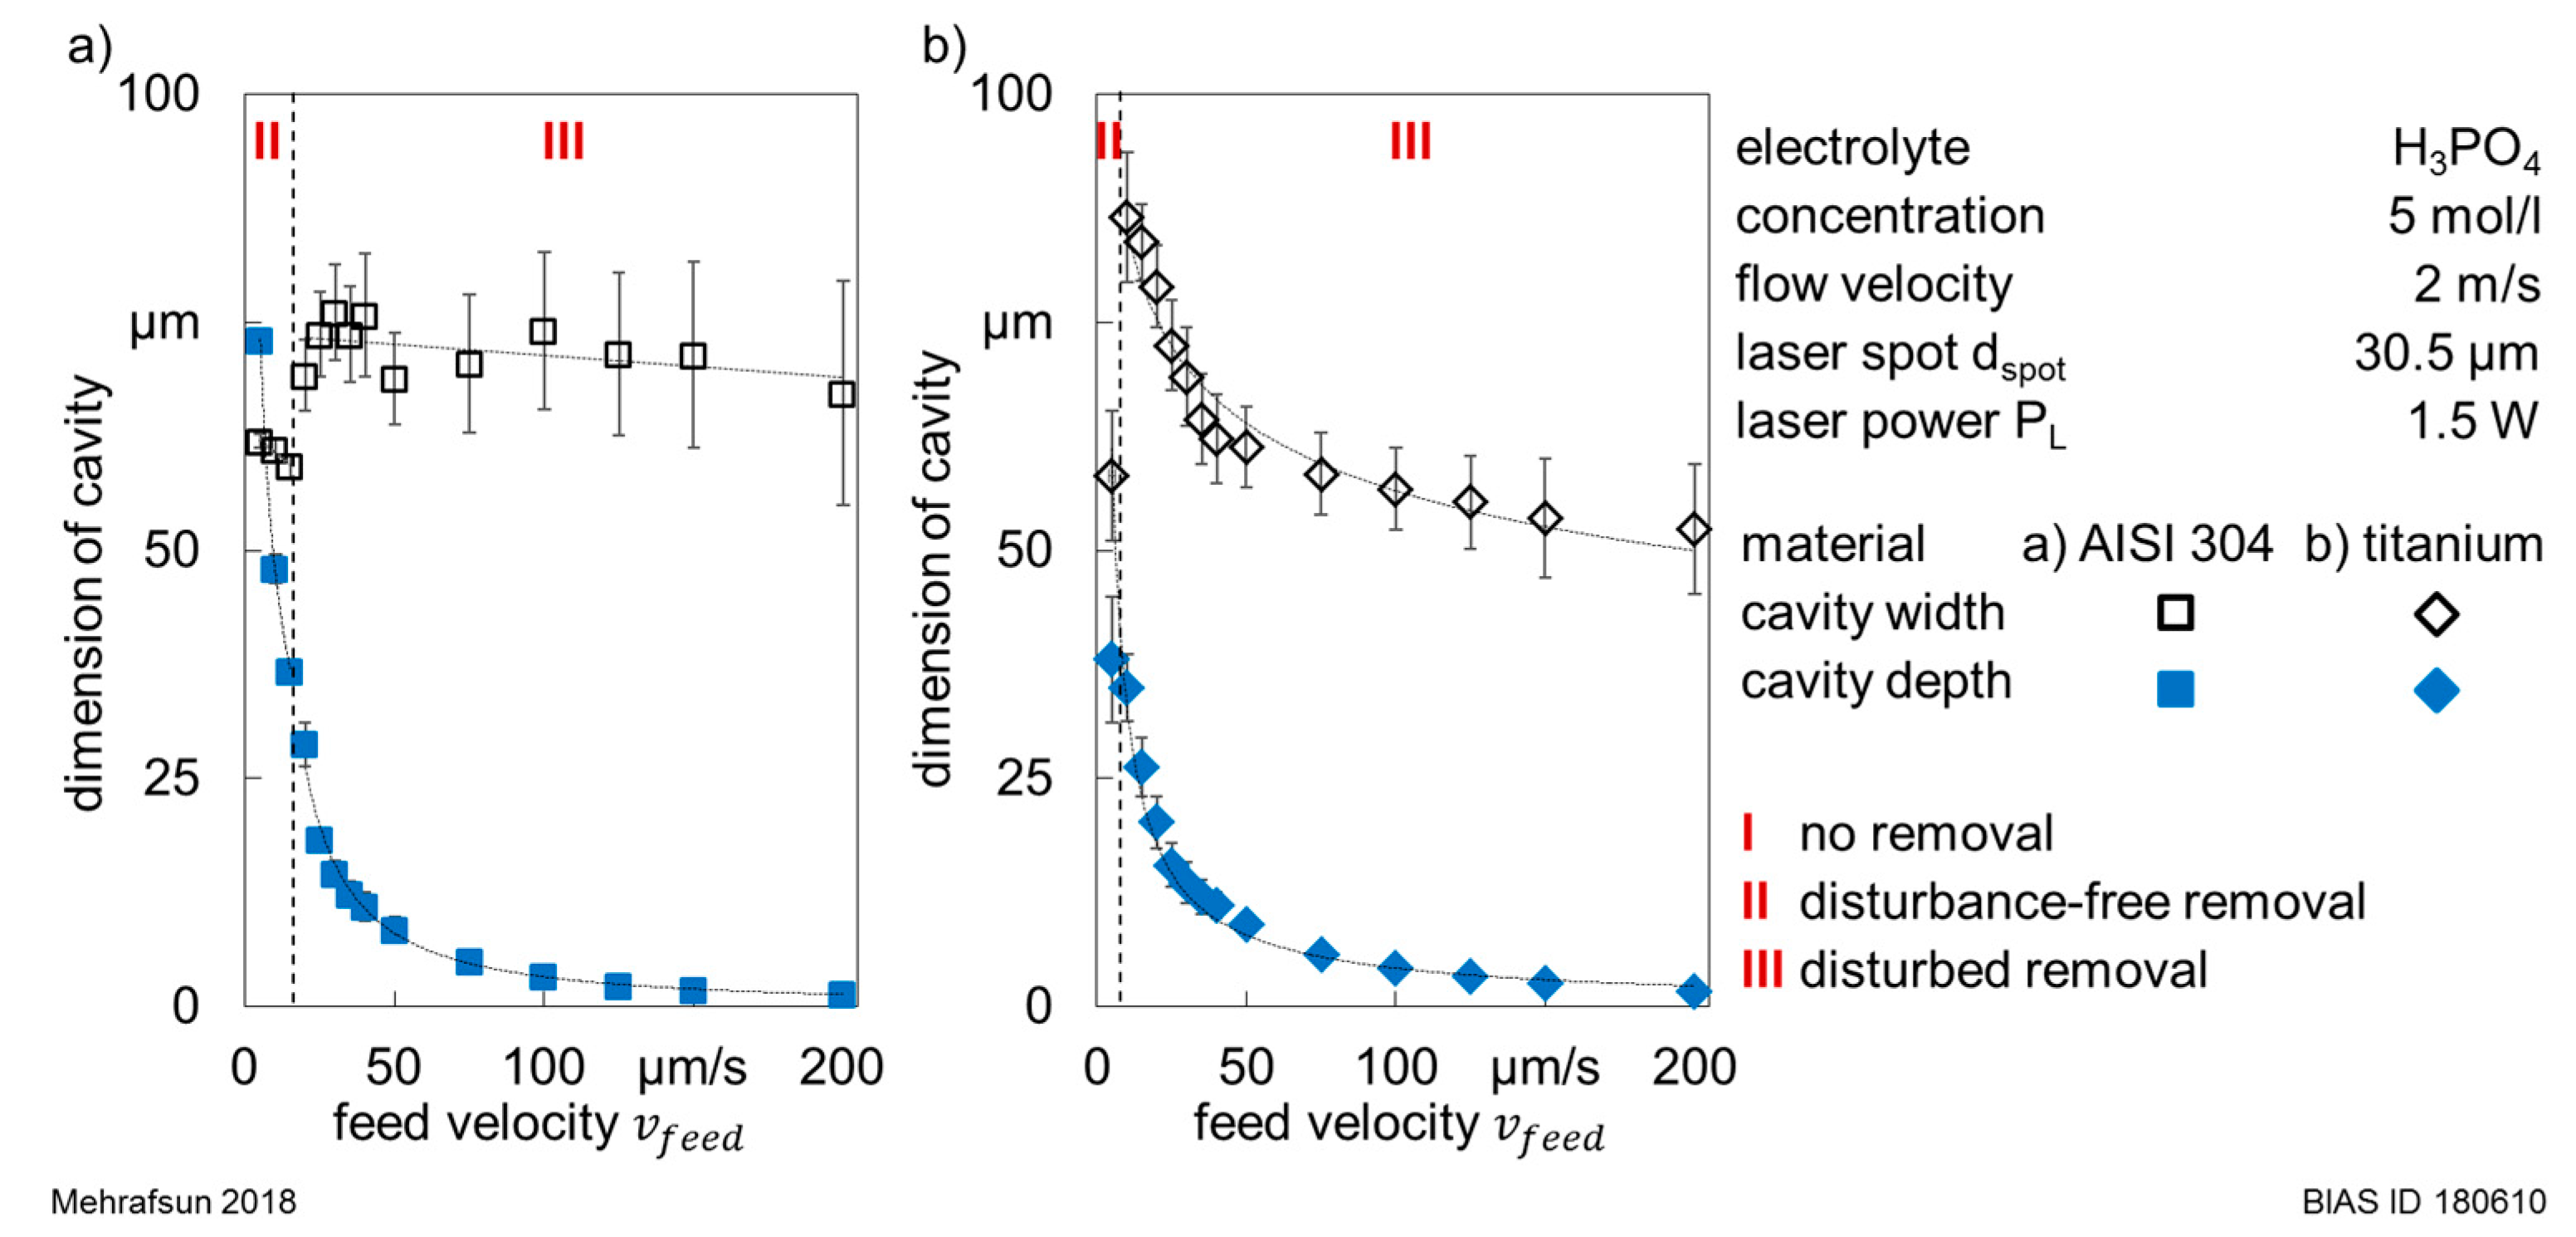
The quantitative results of the removal width wrem and depth drem in both materials at PL = 1.5 W are illustrated in Figure 9. It can be clearly seen that the removal depth decreased exponentially with the feed velocity. Thereby, the maximum removal depth drem of 38.1 µm ± 6.9 µm in titanium at a feed velocity of 5 µm/s was significantly smaller than the depth drem of 73 µm ± 1.1 µm obtained in stainless steel. In addition, the removal width showed a significant jump at the transition to disturbed removal. With further increasing feed velocity, the removal width remained nearly constant in stainless steel, while it decreased continuously in titanium. However, in both materials, the removal width was characterized by higher standard deviations within the disturbed removal regime.
Moreover, CCD records of the interaction zone in both materials were analyzed at the transition from a disturbance-free to a disturbed material removal with increased feed velocity vfeed. As seen in Figure 10, the transition to a disturbed removal was characterized by a change of the removal profile from a bell-like one to a widened and flattened profile in both materials. Similar to the observations in Section 3.1.2, the transition to the disturbed removal regime was accompanied by fluctuating light reflections, which were related to the presence of gas bubbles. It has to be noticed that two different behaviors were observed. Figure 10d shows that the gas bubble activity in titanium was intense and the adherence of gas bubbles was nearly permanent. Thus, strong and fluctuating light reflections were observed. In contrast, Figure 10b shows a lower gas bubble activity in stainless steel. Moreover, the presence of a growing single gas bubble was observed, as marked in orange in Figure 10b. The growth of this gas bubble could be related to its ascent phase from the interaction zone.
3.2. Influence of Electrolyte Concentration on Removal Characteristics
3.2.1. Resulting Process Windows
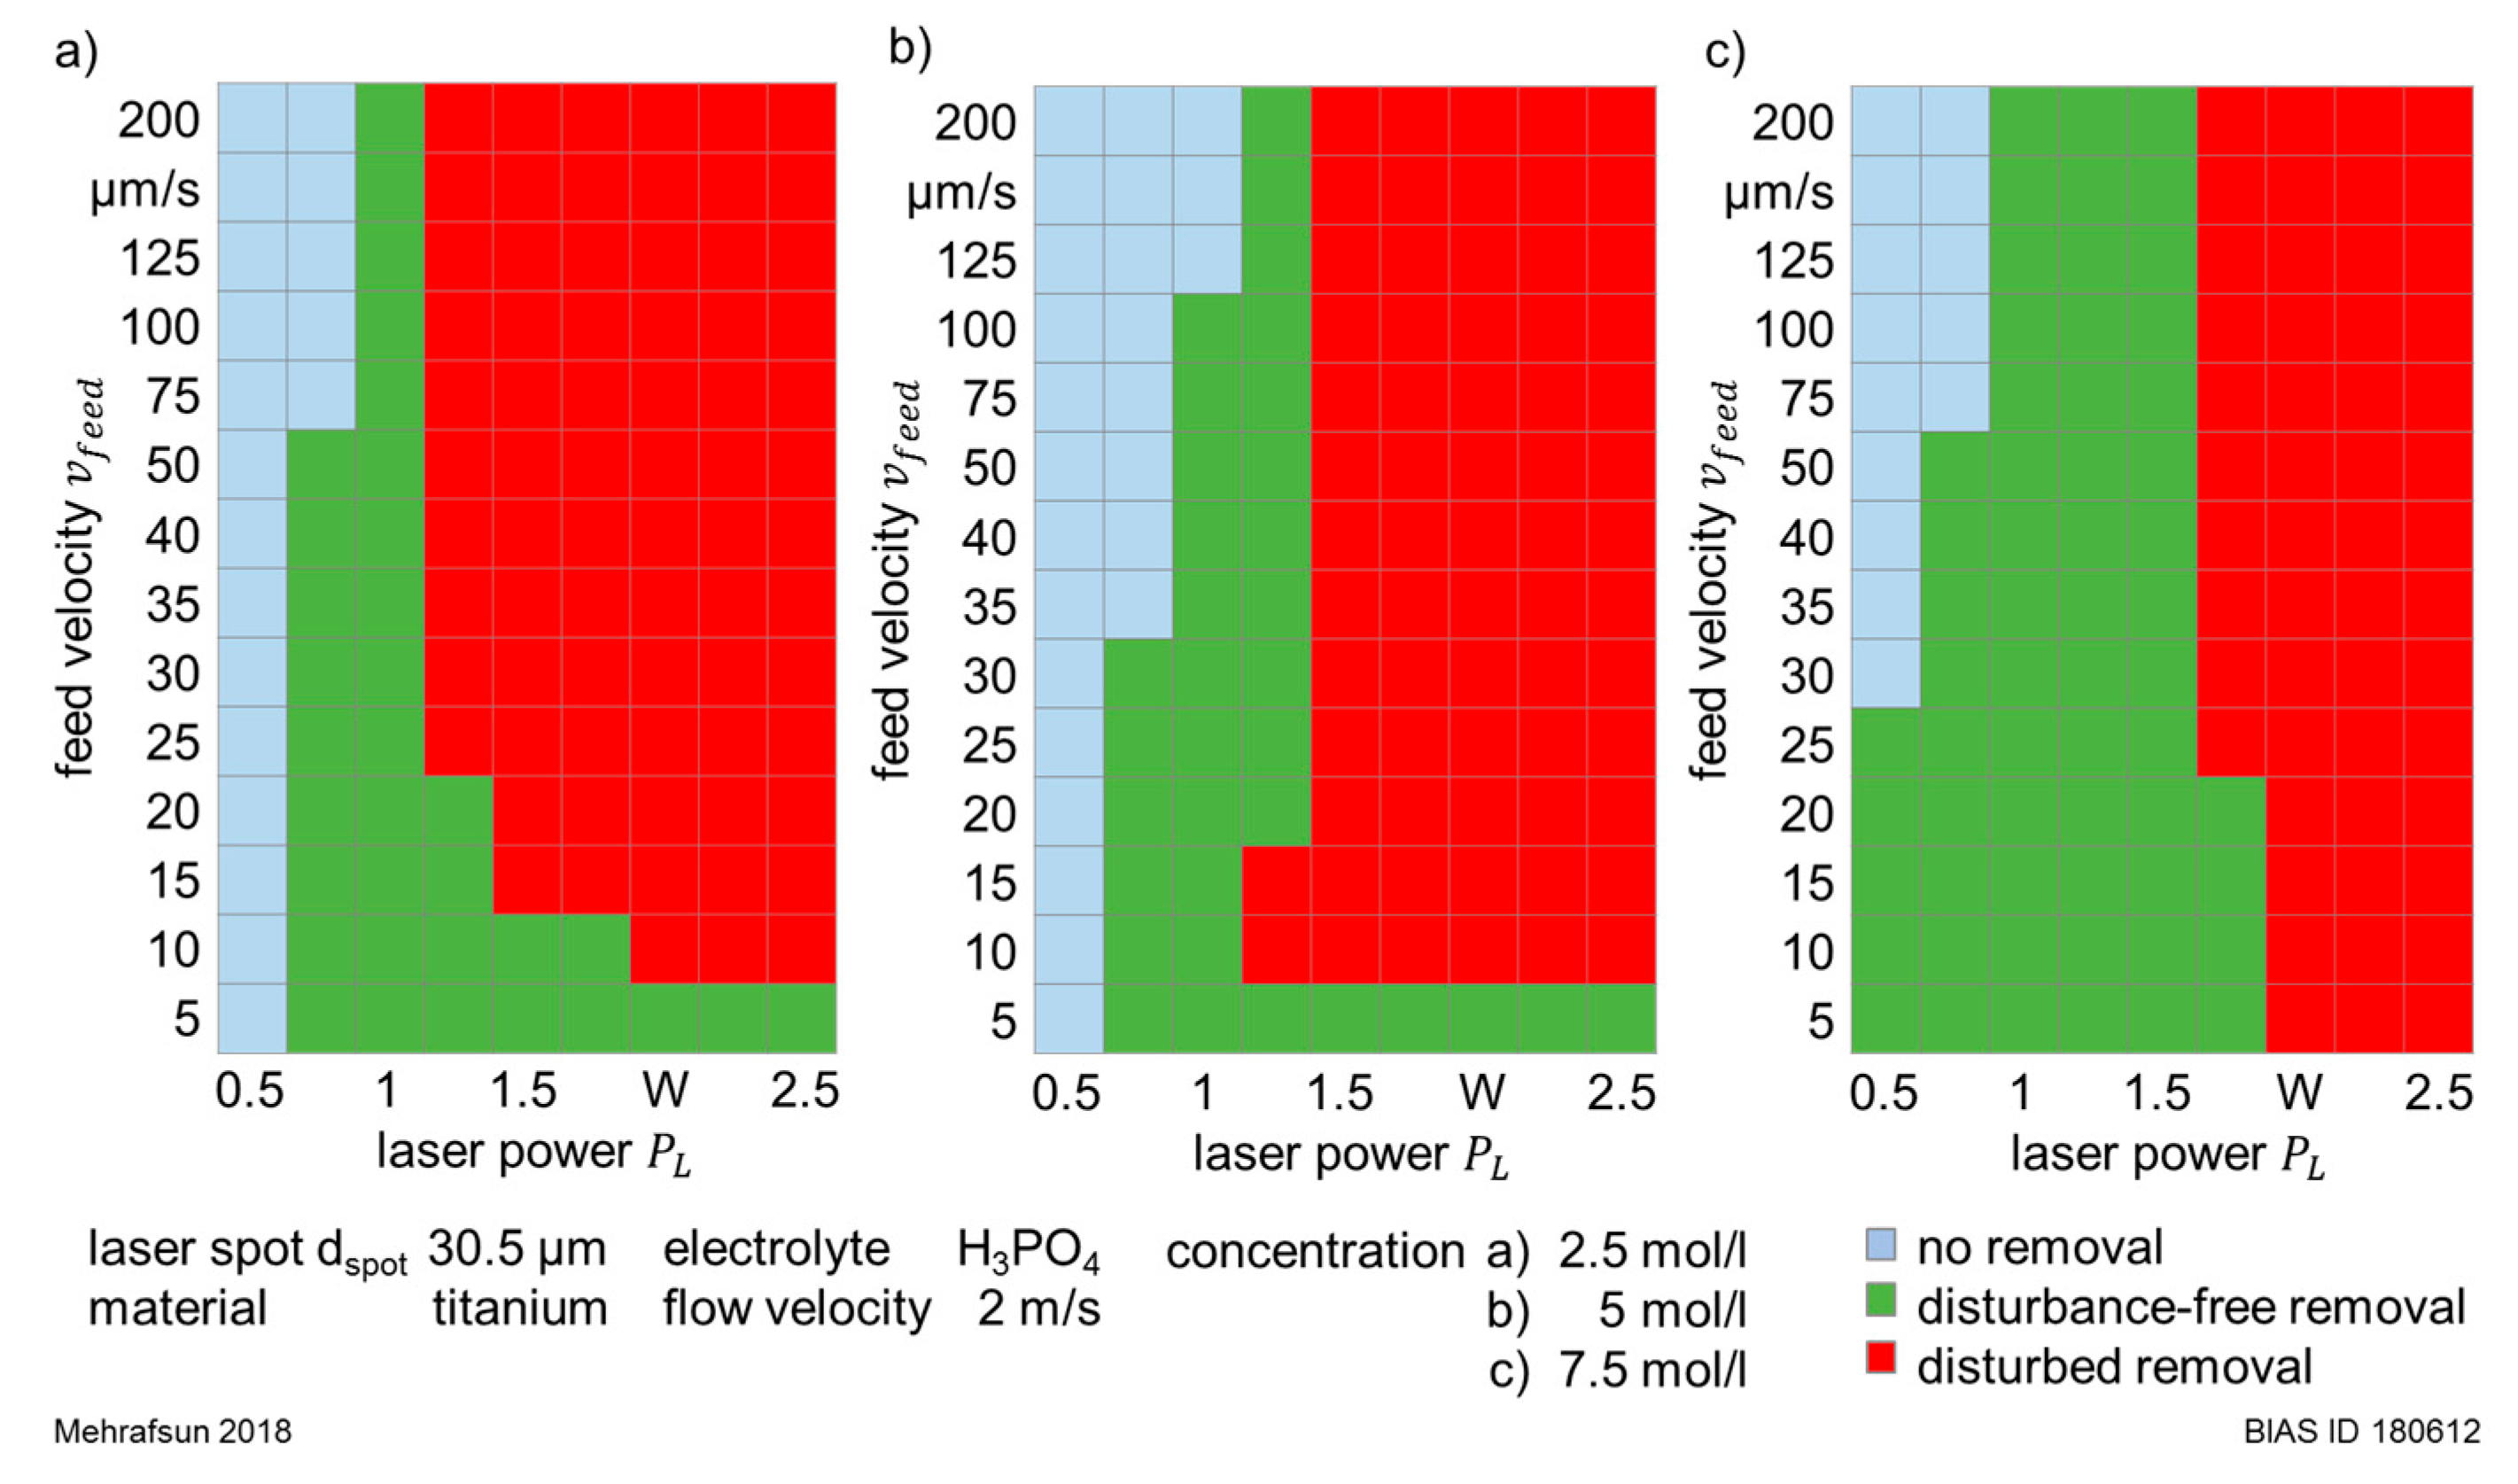
Figure 11 shows the experimentally determined LCM removal regimes resulting from the machining of titanium in phosphoric acid solutions with different concentrations of 2.5, 5 and 7.5 mol/L in dependence of laser power PL and feed velocity vfeed. Following the definition that a disturbance-free machining was characterized by a bell-like removal profile, it can be stated that the corresponding process window was the largest with an electrolyte concentration of 7.5 mol/L (see Figure 11c). Here, the disturbance-free removal was achieved, with few exceptions, with laser powers between 0.5 W and 1.5 W. In comparison, with the concentrations of 2.5 mol/L (Figure 11a) and 5 mol/L (Figure 11b), a disturbance-free removal was mainly achieved with laser powers PL between 0.75 W and 1.25 W. However, as already shown in Section 3.1.3, the removal tended to diminish or to get disturbed with an increasing feed velocity vfeed.
3.2.2. Influence of Laser Power on Removal Characteristics
As shown in Figure 11, the occurrence of removal disturbances was shifted to slightly higher laser powers with increasing electrolyte concentrations. Figure 12 shows exemplarily the evolution of removal depth and width in titanium, depending on the electrolyte concentration with increasing laser power at a feed velocity of 30 µm/s. It can be seen that the transition to the disturbed removal regime was, on the one hand, characterized by a sudden reduction in cavity depth drem, which remained nearly unchanged with further increase in laser power PL. However, the removal profiles showed significant irregularity (higher standard deviations). On the other hand, the cavity width wrem was subject to a sudden increase, which was characterized by an enhanced standard deviation with further increase in laser power. The corresponding microscopic images of these removal cavities can be seen in Figure S1.
It can be seen that the transition to the disturbed removal regime was, on the one hand, characterized by a sudden reduction in cavity depth drem, which remained nearly unchanged with further increase in laser power PL. However, the removal profiles showed significant irregularity (higher standard deviations). On the other hand, the cavity width wrem was also subject to a sudden increase, which was characterized by an enhanced standard deviation with further increase in laser power. The corresponding microscopic images of these removal cavities can be seen in Figure S1.
Similar to the previous observations, the CCD snapshots of the interaction zone revealed that the transition to the disturbed regime was accompanied by strong reflections for 2.5- and 5-molar H3PO4 solutions (see Figure S2 in Supplementary Materials), which were subject to a high frequency and indicated a strong gas bubble activity. For the 7.5-molar H3PO4 solution (Figure S2-below), however, the formation and growth of a single gas bubble without any accompanied reflections have been observed.
3.2.3. Influence of Feed Velocity on Removal Characteristics
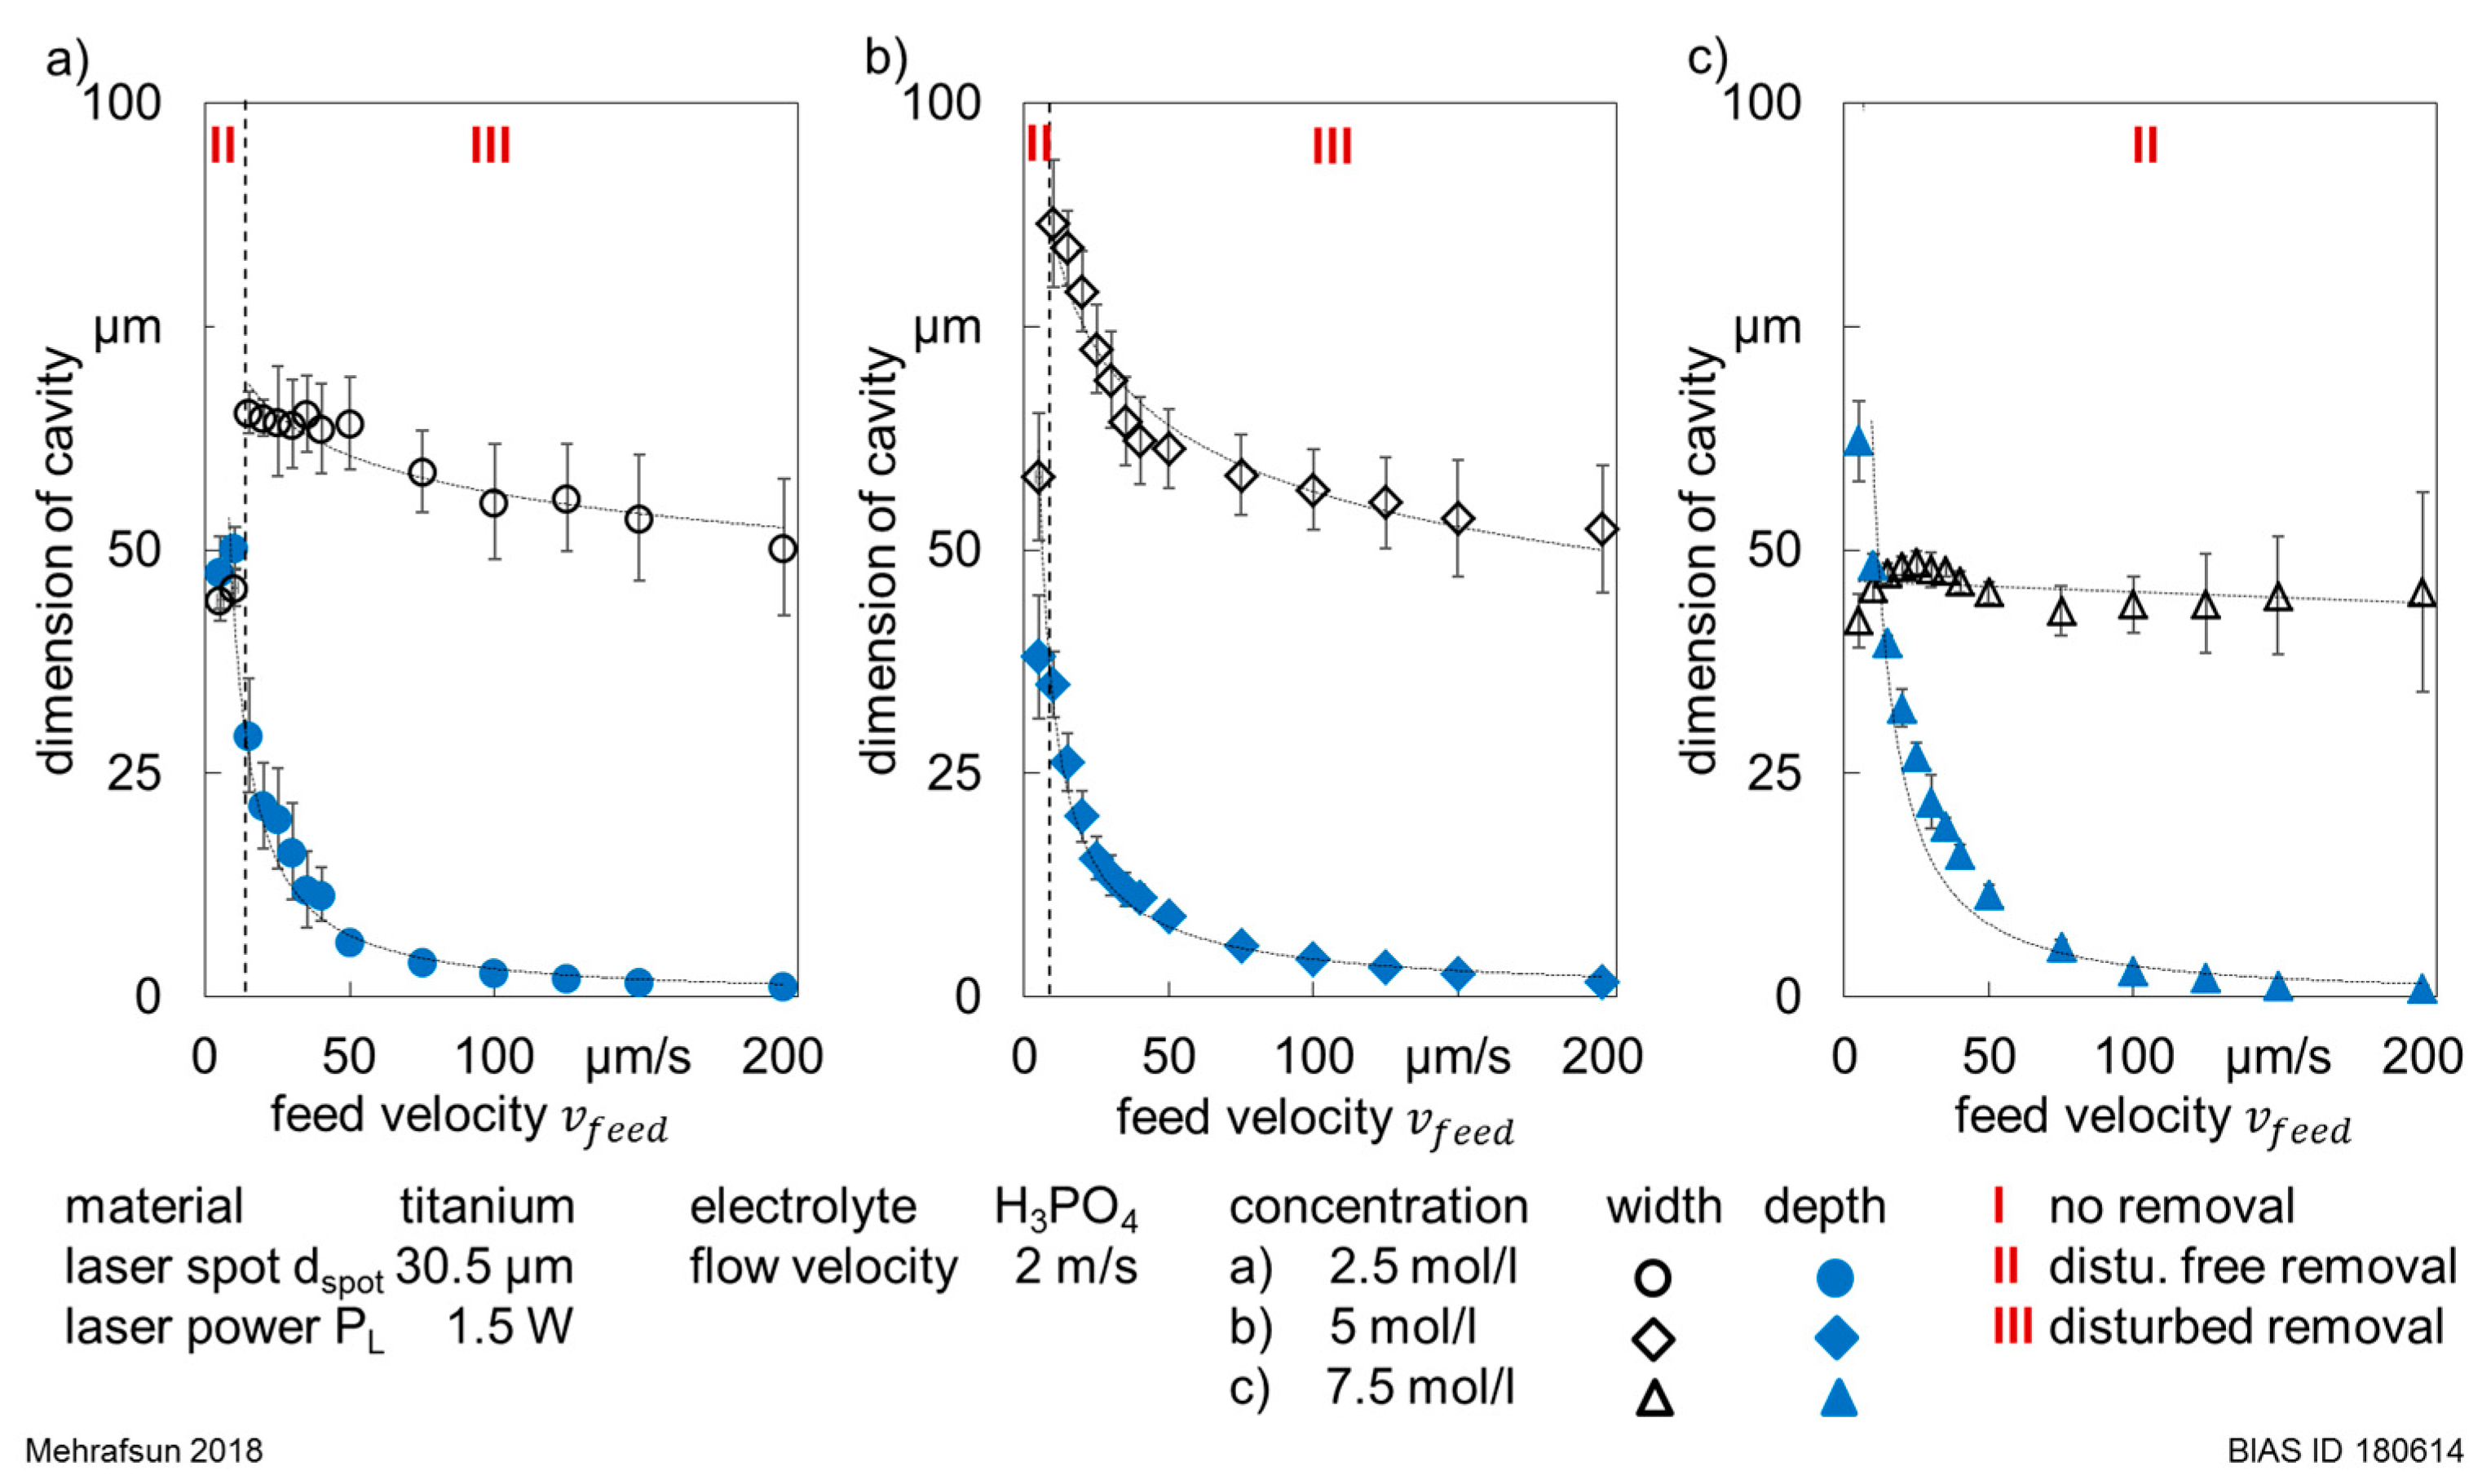
Figure 13 shows the evolution of removal depth and width in titanium with increasing feed velocity at a laser power of 1.5 W with different electrolyte concentrations. Similar to the results in Section 3.1.3, the removal depth decreased exponentially with increasing feed velocity, while the removal width was firstly subject to a significant increase within the transition range and secondly was decreasing continuously with further increased feed velocity. This was observed with the concentrations of 2.5 and 5 mol/L. In contrast, no disturbances were observed with the 7.5-molar phosphoric acid (at PL = 1.5 W). This was reflected on nearly constant removal width of about 45.8 µm ± 3 µm. When comparing the different concentrations, it became clear that the removal in the 5-molar acidic solution resulted in the widest and flattest cavities. At a feed velocity of 5 µm/s, the removal depth drem amounted to 47.5 µm ± 4 µm, 38.1 µm ± 6.9 µm and 62.2 µm ± 4.5 µm, with 2.5, 5 and 7.5-molar solutions, respectively. Moreover, the removal width wrem amounted to 58.2 µm ± 17.1 µm with the concentration of 5 mol/L, while 44.4 µm ± 2.3 µm with 2.5 mol/L and 42.1 µm ± 3 µm with the 7.5-mol/L H3PO4 solution.
3.3. Laser-Induced Electrolyte Boiling
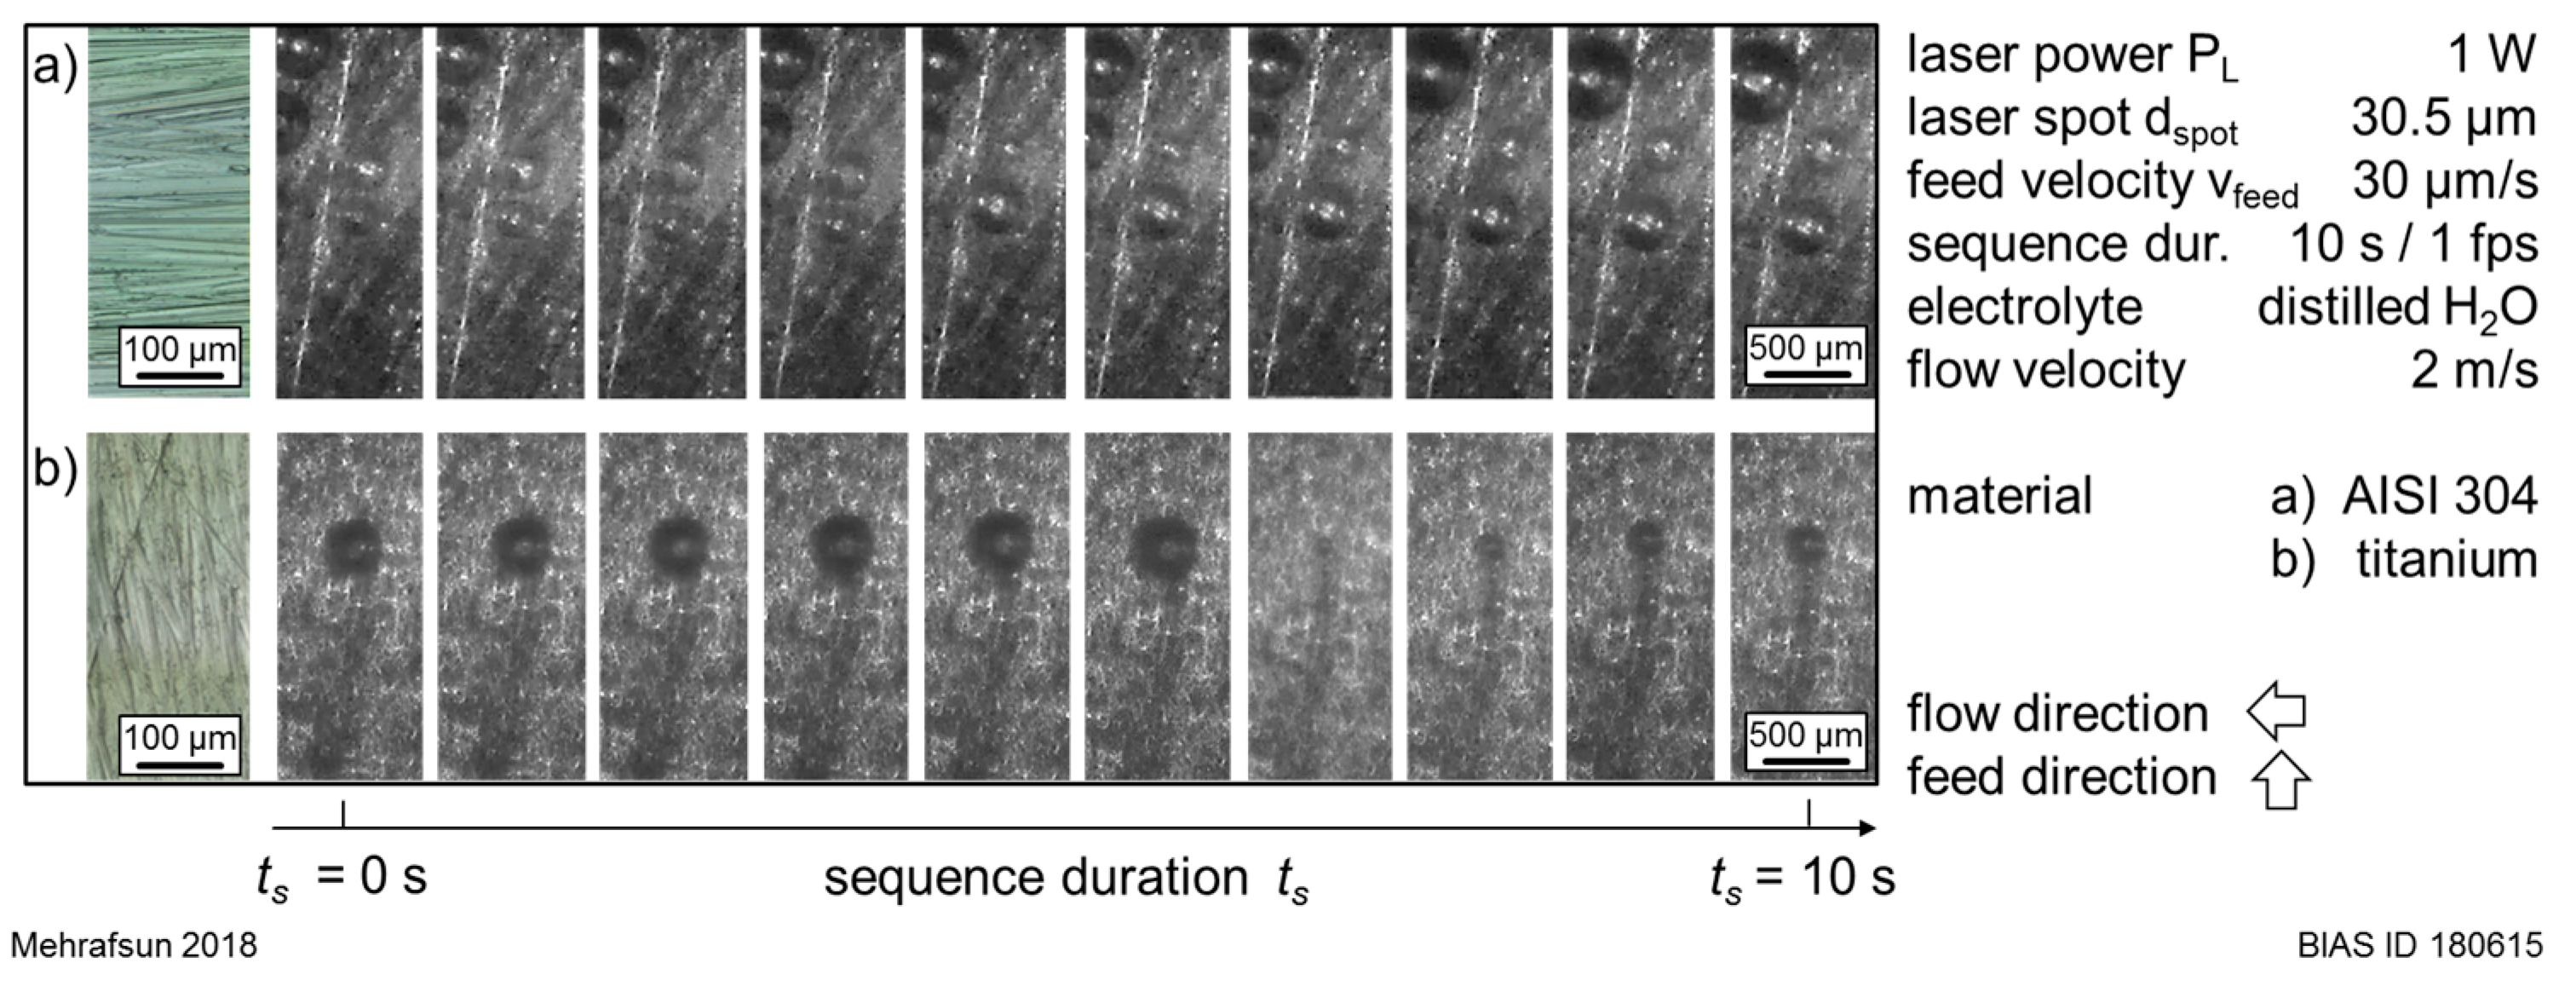
To prove that the resulting LCM was purely chemical, titanium and stainless steel were subject to a laser irradiation in distilled water. Figure 14 shows a sequence of CCD snapshots (total duration of 10 s with a frame rate of 1 fps), which represented the interaction zone in both materials in distilled water at a laser power PL of 1 W and a feed velocity vfeed of 30 µm/s.
For all laser powers ≤2.5 W, no material dissolution was observed in distilled water. Thus, related hydrogen gas bubble formation due to the chemical material dissolving reaction could be excluded. However, the formation, growth and rise of gas bubbles were observed in both materials. Their presence indicated that electrolyte boiling was taking place.
4. Discussion
4.1. Disturbance of Material Removal by Gas Formation
The laser irradiation in the LCM process is used for a localized heating of the metallic surface. Certain suitable thermal impact an anodic material dissolution at the workpiece surface, which is immersed in an electrolyte environment, can be activated and thus an electrochemical etching can take place. Therefore, a characteristic threshold temperature should be achieved. As shown in [17], the removal rate is increasing continuously within a laser power window of some 100 mW. This regime is referred to as the disturbance-free regime. With a further increase in laser power, the thermal impact is increasing, as well as the risk of electrolyte boiling, which is about 100 °C for aqueous electrolyte solutions. With occurring electrolyte boiling, the gas bubble formation and activity are enhanced [8]. In addition, the formed hydrogen during the dissolution reaction represents a second source of gas bubble formation, which also increases with increased removal rates [16]. This gas bubble formation is presumed to be an initiation factor for removal disturbances.
As the quantitative analysis of the LCM of titanium and stainless steel shows the transition from a disturbance-free removal (regime II) to a disturbed removal (regime III) was labeled by a sudden decrease in removal depth as well as in homogeneity (increased standard deviations). Simultaneously, a clear rise in removal width was observed. To better understand the cause of the occurring disturbances, the interaction zone was recorded at the defined transition regimes. The CCD snapshots depicted in Figure 7 and Figure 10 showed that the sudden change in removal width and depth was accompanied by significant light reflections. These highly frequent reflections could be directly related to an enhanced gas bubble activity and indicated the competition between adhering and rising gas bubbles, which is characteristic of a starting film boiling regime [19].
Hence, the CCD records provided an experimental evidence of the involvement of adhering gas bubbles, caused by thermochemical reactions and electrolyte boiling, in the occurrence of material removal disturbances. In Figure 15, some typically obtained removal geometries were depicted. In addition, schematic illustrations of the supposed mechanisms explaining their occurrence were given. For the disturbance-free regime (Figure 15a), reaction-related gas bubbles were supposed to be the dominant bubble type during the LCM process. Due to their small size (sub-micron range), these gas bubbles had no significant influence on the incident laser irradiation and thereby on the removal. The phenomenon above is in accordance with other electrochemical processes, in which reaction-gas bubbles (hydrogen formation) do not affect the removal quality at suitable parameter combinations [20]. Once a gas bubble with a size of some 10 µm is adhering to the interaction zone, the incident laser beam will be significantly affected. The formation of these bubbles could be related to electrolyte boiling due to high heat impact at the workpiece surface [17] or to the agglomeration of smaller bubbles during their scent at certain conditions, depending on the density and the viscosity of the electrolyte and on the surface tension [21]. The influence on the resulting removal geometry in dependence of the bubble size is shown in Figure 15b,c. If the diameter of the adhering gas bubble was similar to the laser spot diameter at the workpiece surface (Figure 15b), it could be assumed that the gas bubble shielded the workpiece surface against the electrolyte, resulting in a reduced material dissolution reaction [16]. As demonstrated in [18], this was due to deposited metallic salts and oxides that could not be transferred out of the cavity. However, the thermal impact due to the laser–workpiece interaction resulted in a lateral heat conduction towards the periphery, which explained partially the W-like removal profile. In contrast, if the gas bubble diameter was larger than the laser spot (Figure 15c), light deflection was supposed to be more significant. The adhering bubble could act like a scattering center and deflect a part of the incoming laser beam to its periphery (the light deflection effect) [22]. In combination with the heat conduction, this could explain the significant broadening in removal cavity observed during the disturbed regime. Another possible removal geometry is shown in Figure 15d. The removal revealed a periodic behavior consisting of cavities that were formed in the increasing angle with respect to the feed direction. For this case, we suggest that light total reflection is the dominating mechanism due to the transition from the optically dense medium (liquid electrolyte) into the optically thinner medium (gaseous volume of gas bubble). This geometry will be discussed in more detail in the following section.
Similar to previous investigations [23], low feed velocities were found to result in disturbance-free material removal, despite high laser powers. This observation is mainly related to the interaction time between laser irradiation, workpiece surface and electrolyte that is defined by the feed velocity vfeed. Based on a Green-function based thermal modelling it was shown that the induced surface temperature fields depend only on the laser power for the applied feed velocity range (vfeed < 1000 µm/s) and can be considered as constant for all feed velocities [24]. Thus, it is assumed that the long interaction time enables the repeated and successive formation, adherence, growth and ascent of gas bubbles, despite occurring electrolyte boiling. This would favor the removing and/or pushing of adhering gas bubbles away from the interaction zone by the electrolyte stream. Hence, a nearly continuous contact between electrolyte and workpiece surface could be ensured. As a result, the chemical reaction dissolves all irregularities caused by temporary gas bubble shielding [16]. However, the clarification of the dominating mechanisms at low feed velocities is a subject for future work. Hence, high-speed Schlieren records could be helpful.
4.2. Influence of Material
The LCM of titanium and stainless steel showed some typical features that were material independent. Within the disturbance-free regime, the removal profile showed a bell-like shape. The geometric properties—depth and width—were linearly increasing with the laser power until reaching the transition threshold, which was characterized by a sudden increase in removal width and a decrease in removal depth.
In comparison, the removal behavior was found to be dependent on the material within the disturbed regime. In titanium, the removal profile changed to a W-like one, in which the maximum depth was shifted from the center. This effect intensified with increasing laser power. Similar results were demonstrated for the case of static irradiation of titanium in a 5-molar phosphoric acid and can be explained by the adherence of boiling related gas bubbles [17]. On the one hand, these gas bubbles interrupted the dissolution reaction at the interaction zone because of the deposition of metal salts and oxides. On the other hand, they caused a broadening of the removal zone due to lateral heat transfer and possible light deflection towards the periphery (see Figure 15b,c).
In contrast, stainless steel showed a different behavior within the disturbed removal regime. The maximum cavity depth drem,max remained closely located to center position x = 0 up to higher laser powers of 2 W and gave a possible explanation for the higher removal depths in stainless steel compared to titanium. However, the different removal characteristics were supposed to be related to a lower influence of electrolyte boiling at the surface of stainless steel. In comparison with titanium, the gas bubble activity in stainless steel is lower, as was observed experimentally via high-speed shadowgraphs during the laser irradiation in the phosphoric acid ambient [25]. On the one hand, this can be traced back to smaller size of formed gas bubbles in stainless steel due to the higher atomic number of iron (zFe < zTi) [26]. On the other hand, the adhesive Van-der-Waals forces considering equal bubble size are lower in stainless steel than in titanium due to the lower related atom radius (rFe < rTi) [27]. Both lower gas bubble sizes and Van-der-Waals forces justify the reduced shielding effect in stainless steel.
4.3. Influence of Electrolyte Concentration
As demonstrated in [28], the influence of the electrolyte concentration on the absorption of laser light is negligible, which is linearly dependent and mainly dominated by the propagation length through the electrolyte. Within the used chemical cell, the transmission coefficient of the phosphoric acid, independent of the concentration, amounted to about 98%. Thus, the electrolyte concentration had no influence on the thermal impact during the LCM process. Despite this fact, the process windows for a disturbance-free removal differed in concentrations. As the CCD snapshots in Figure S2 (in Supplementary Materials) showed the occurrence of removal disturbances was characterized by strong and fluctuating reflections for the 2.5- and 5-molar electrolytes. These indicated an enhanced gas bubble activity and the beginning of the film boiling regime. In contrast, with the 7.5-molar H3PO4 solution, no reflections have been observed. Moreover, only one single bubble, which was bigger than those observed with the lower concentrations, was formed. As depicted in Figure 16, the CCD snapshots of the interaction zone showed the growth of a single bubble at a laser power of 1.75 W.
The resulting removal geometry (Figure 16b) was characterized by a periodic behavior, in which the removal followed an increasing angle with respect to the feed direction. As explained in Figure 15d, total reflection was supposed to be the dominating factor. With a growing bubble the angle of the total reflection was increasing. Because of non-occurring W-like removal profile and the missing reflections in CCD records, it became clear that the perpendicular electrolyte streaming direction (with regard to the feed direction) was able to push the bubble out of the laser center, as illustrated schematically in Figure 16c. The obtained periodic structures indicated that the gas bubble rose up when a critical size was achieved. After that, a new gas bubble can be formed and can grow again. The schematic illustration in Figure 16c summarizes the involved mechanisms. It shows the path of the laser beam (red colored) due to the total reflection as well as the growth of the gas bubble and its pushing by the electrolyte streaming (blue colored).
Considering the influence of the electrolyte concentration on the removal width and depth, it can be stated that the electrolyte concentration has a subordinate role in determining the removal characteristics compared with the laser power and feed velocity.
In general, the induced temperature distribution as a consequence of the applied laser powers determines the interaction area and thereby the removal width. In contrast, the removal evolution into the material, represented by the removal depth, is mainly determined by the feed velocity. However, the process window for a disturbance-free removal becomes larger with increased concentration. This is related to the electrolyte viscosity, which increases with the concentration and results in the formation of smaller gas bubbles [29]. The smaller the gas bubbles are, the longer they need to agglomerate to a bigger one. This could explain the shift of gas bubble adherence to higher laser powers. However, this is still to be investigated more in detail, especially when considering the influence of the electrolyte streaming, such as the flow direction and rate.
5. Conclusions
LCM is subject to a dynamic process behavior that is intensified with increasing both laser power and feed velocity. With unsuitable parameters, removal disturbances can occur. These are characterized by broadened cavities with reduced removal depth. As demonstrated by the CCD snapshots, the transition to the disturbed regime strongly related to enhanced gas bubble activity. From the correlation with the LCM-removal of titanium and stainless steel in phosphoric acid solutions, following points can be drawn:
- The occurrence of removal disturbances was caused by adhering gas bubbles. On the one hand, these bubbles inhibited the material dissolution reaction and supported a simultaneous deposition of metallic salts and oxides. Moreover, the gas bubbles influenced the location and amount of laser energy by deflection and total reflection and led to a broadening or a dislocation of the removal area.
- Due to the lower tendency of gas bubble adherence, the LCM of stainless steel was much more pronounced and less affected by disturbances compared with titanium.
- The disturbance-free removal took place over a larger process window when the electrolyte concentration was increased. Here, the interrelation between viscosity, electrochemical potential and the electrolyte hydrodynamics was supposed to determine the bubble adherence behavior and the chemical reactivity. However, this is still to be investigated more in detail.
Supplementary Materials
The following are available online at https://www.mdpi.com/2504-4494/2/3/54/s1, Figure S1: Confocal micrographs of the resulting cavities in titanium and the corresponding categories machined with a feed velocity of 30 µm/s and phosphoric acid as an electrolyte at concentrations of (a) 2.5 mol/l; (b) 5 mol/L and (c) 7.5 mol/L; Figure S2: CCD snapshots of the LCM interaction zone at the transition from a disturbance-free to a disturbed removal as well as the corresponding removal profiles obtained in titanium in a phosphoric acid as an electrolyte with concentrations of 2.5 mol/L; 5 mol/L and 7.5 mol/L.
Author Contributions
Conceptualization, S.M. and H.M.; investigation, S.M.; data analysis, H.M.; writing of the original manuscript and draft preparation, S.M. and H.M.
Funding
This research was funded by German Research Foundation (Deutsche Forschungsgemeinschaft) within the Collaborative Research Center (SFB 747) at the University of Bremen; subproject A5 “Laserkontur” (grant number 26068470) and T5 “Tec-Pro” (grant number 269441331).
Acknowledgments
The authors would like to thank Steffen Fleischhacker for his support within experimental investigations, and thank Fabian Thiemicke, Sushant Panhale and Helge Kügler for their support in the Matlab-based data processing.
Conflicts of Interest
The authors declare no conflicts of interest.
References
- Hsu, T.-R. Miniaturisation—A paradigm shift in advanced manufacturing and education. In Proceedings of the IEEE/ASME International Conference on Advanced Manufacturing Technologies and Education in the 21st Century, Chia-Yi, Taiwan, 10–15 August 2002. [Google Scholar]
- Bauerle, D. Laser Processing and Chemistry, 2nd ed.; Springer: Berlin/Heidelberg, Germany, 2011. [Google Scholar] [CrossRef]
- Wulfsberg, J.P.; Hilpert, S.E.; Ostendorf, A.; Samm, K. Fundamentals of Laser Assisted Micro Forming. In Proceeding of the 1st Colloquium od DFG Priority Program Process Scaling 2003; Vollertsen, F., Hollmann, F., Eds.; BIAS Verlag: Bremen, Germany, 2003; pp. 89–98. ISBN 3-933762-14-6. [Google Scholar]
- Li, L.; Achara, C. Chemical assisted laser machining for the minimization of recast and heat-affected zone. CIRP Ann. 2004, 53, 175–178. [Google Scholar] [CrossRef]
- Stephen, A.; Vollertsen, F. Mechanisms and Processing Limits in Laser Thermochemical Machining. CIRP Ann. 2010, 59, 251–254. [Google Scholar] [CrossRef]
- Nowak, R.; Metev, S. Thermochemical Laser Etching of Stainless Steel and Titanium in Liquids. Appl. Phys. A 1996, 63, 133–138. [Google Scholar] [CrossRef]
- Messaoudi, H.; Hauser, O.; Matson, A.; Mehrafsun, S.; Vollertsen, F. Fertigungsqualität laserchemisch hergestellter Mikroumformwerkzeuge. In Proceedings of the Fachbeiträge 8. Kolloquium Mikroproduktion, Bremen, Germany, 27–28 November 2017; Vollertsen, F., Hopmann, C., Schulze, V., Wulfsberg, J., Eds.; BIAS Verlag: Bremen, Germany, 2017; pp. 171–178, ISBN 978-3-933762-56-6. [Google Scholar]
- Mehrafsun, S.; Stephen, A.; Vollertsen, F. Comparison of laser-thermal and laser-chemical machining. In Proceedings of the 3rd International Conference on nano Manufacturing (nanoMan2012), Tokyo, Japan, 25–27 July 2012; Fang, F., Kuriyagawa, T., Eds.; Wako: Saitama, Japan, 2012; pp. 251–254. [Google Scholar]
- Stephen, A.; Lilienkamp, T.; Metev, S.; Sepold, G. Laser-Assisted Micro-machining of Large-Area 3D Metallic Microparts. In Proceedings of the 1st International Conference of the European Society for Precision Engineering and Nanotechnology, Bremen, Germany, 31 May–4 June 1999; McKeown, P., Corbett, J., Eds.; Shaker Verlag: Aachen, Germany, 1999; pp. 20–23. [Google Scholar]
- Messaoudi, H.; Böhmermann, F.; Mikulewitsch, M.; von Freyberg, A.; Fischer, A.; Riemer, O.; Vollertsen, F. Chances and Limitations in the Application of Laser Chemical Machining for the Manufacture of Micro Forming Dies. In Proceedings of the 5th International Conference on New Forming Technology (ICNFT 2018), Bremen, Germany, 19–21 September 2018; pp. 1–8, in press. [Google Scholar]
- Robert, C.; Messaoudi, H.; Riemer, O.; Brinksmeier, E.; Vollertsen, F. Modifikation der Oberflächenfeingestalt monokristalliner Diamanten. In Proceedings of the Fachbeiträge 8. Kolloquium Mikroproduktion, Bremen, Germany, 27–28 November 2017; Vollertsen, F., Hopmann, C., Schulze, V., Wulfsberg, J., Eds.; BIAS Verlag: Bremen, Germany, 2017; pp. 187–194, ISBN 978-3-933762-56-6. [Google Scholar]
- Eckert, S.; Köhnsen, A.; Vollertsen, F. Surface finish using laser-thermochemical machining. In Lasers in Manufacturing (LIM 2017); Available online: https://www.wlt.de/lim/Proceedings2017/Data/PDF/Contribution195_final.pdf (accessed on 18 July 2018).
- De Silva, A.K.M.; Pajak, P.T.; McGeough, J.A.; Harrison, D.K. Thermal effects in laser assisted jet electrochemical machining. CIRP Ann. Manuf. Technol. 2011, 60, 243–246. [Google Scholar] [CrossRef]
- Mora, A.; Haase, M.; Rabbow, T.J. Discrete Model for laser driven etching and microstructuring of metallic surfaces. Phys. Rev. E 2005, 72, 060101. [Google Scholar] [CrossRef] [PubMed]
- Rabbow, T.J.; Plath, P.J.; Mora, A.; Haase, M. Selforganized Structure Formation in Organized Microstructuring by Laser-Jet-Etching. Int. J. Bifurc. Chaos 2017, 27, 1750001. [Google Scholar] [CrossRef]
- Mehrafsun, S.; Vollertsen, F. Disturbance of material removal in laser-chemical machining by emerging gas. Ann. CIRP 2013, 62, 195–198. [Google Scholar] [CrossRef]
- Messaoudi, H.; Eckert, S.; Vollertsen, F. Thermal Analysis of Laser Chemical Machining: Part I: Static Irradiation. Mater. Sci. Appl. 2017, 8, 685–707. [Google Scholar] [CrossRef]
- Eckert, S.; Messaoudi, H.; Mehrafsun, S.; Vollersten, F. Laser-thermochemical induced micro-structures on titanium. J. Mater. Sci. Surf. Eng. 2017, 5, 685–691. [Google Scholar] [CrossRef]
- Faghri, A.; Zhang, Y.; Howell, J.R. Advanced Heat and Mass Transfer; Global Digital Press: Columbia, MO, USA, 2010; pp. 665–734. [Google Scholar]
- Buhlert, M. Elektropolieren und Elektrostrukturieren von Edelstahl, Messing und Aluminium: Untersuchung des Transpassiven Abtragsprozesses Einschließlich Unerwünschter Nebeneffekte; Fortschrittberichte VDI, Reihe 2(553); VDI Verlag GmbH: Düsseldorf, Germany, 2000. [Google Scholar]
- Buhlert, M. Removal Process. In Electropolishing, 1st ed.; Eugen, G., Leuze Verlag, K.G., Eds.; Leuze Verlag: Bad Saulgau, Germany, 2015; pp. 13–48. [Google Scholar]
- Lazic, V.; Jovicevic, S.; Carpanese, M. Laser induced bubbles inside liquids: Transient optical properties and effects on beam propagation. Appl. Phys. Lett. 2012, 101, 054101. [Google Scholar] [CrossRef]
- Mehrafsun, S.; Zhang, P.; Vollertsen, F.; Goch, G. Laser-chemical Precision Machining of Micro Forming Tools at low Laser Powers, Laser-based Micro- and Nanopackaging and Assembly VI. Proc. SPIE 2012, 8244, 82440K. [Google Scholar]
- Messaoudi, H.; Panhale, S.D.; Thiemicke, F. Influence of the electrolyte streaming on thermal impact and removal characteristics during laser chemical machining of metals. To be published.
- Mehrafsun, S.; Messaoudi, H.; Vollertsen, F. Influence of material and surface roughness on gas bubble formation and adhesion in laser-chemical machining. In Proceedings of the 5th International Conference on Nanomanufacturing (nanoMan 2016), Macau, China, 15–17 August 2016; pp. 1–8. [Google Scholar]
- Qiang, H.; Chen, J.; Han, B.; Shen, Z.-H.; Lu, J.; Ni, X.-W. Study of underwater laser propulsion using different target materials. Opt. Express 2014, 22, 17532–17545. [Google Scholar] [CrossRef] [PubMed]
- Bobe, U. Die Reinigbarkeit technischer Oberflachen im immergierten System. Ph.D. Thesis, Technische Universitat München, München, Germany, 2008. [Google Scholar]
- Messaoudi, H.; Mehrafsun, S.; Vollertsen, F. Influence of the etchant on material removal geometry in laser chemical machining. In Proceedings of the 4th International Conference on Nanomanufacturing (nanoMan 2014), Bremen, Germany, 8–10 July 2014; Fang, F., Brinksmeier, E., Riemer, O., Eds.; Institut für Werkstofftechnik: Bremen, Germany, 2014. [Google Scholar]
- Schnurmann, R. Größe von Gasblasen in Flüssigkeiten. Colloid Polym. Sci. 1937, 80, 148–151. [Google Scholar] [CrossRef]
Figure 1.
Schematic illustration of the main steps used to determine the removal cavity characteristics: removal depth drem, width wrem and volume Vrem.
Figure 1.
Schematic illustration of the main steps used to determine the removal cavity characteristics: removal depth drem, width wrem and volume Vrem.

Figure 2.
Schematic illustration of the main steps used to determine the removal cavity characteristics: removal depth drem, width wrem and volume Vrem.
Figure 2.
Schematic illustration of the main steps used to determine the removal cavity characteristics: removal depth drem, width wrem and volume Vrem.

Figure 3.
Examples of the different resulting cavities and their related categories.

Figure 4.
Experimentally determined LCM removal regimes for (a) stainless steel and (b) titanium in a 5-mol/L phosphoric acid solution.
Figure 4.
Experimentally determined LCM removal regimes for (a) stainless steel and (b) titanium in a 5-mol/L phosphoric acid solution.

Figure 5.
Confocal micrographs of the resulting LCM cavities in (a) stainless steel and (b) titanium at a feed velocity vfeed of 30 µm/s in dependence of the applied laser power.
Figure 5.
Confocal micrographs of the resulting LCM cavities in (a) stainless steel and (b) titanium at a feed velocity vfeed of 30 µm/s in dependence of the applied laser power.

Figure 6.
Width and depth of the resulting LCM cavities in (a) stainless steel and (b) titanium at a feed velocity vfeed of 30 µm/s in dependence of the applied laser power.
Figure 6.
Width and depth of the resulting LCM cavities in (a) stainless steel and (b) titanium at a feed velocity vfeed of 30 µm/s in dependence of the applied laser power.

Figure 7.
CCD snapshots of the LCM interaction zone at the transition from a disturbance-free to a disturbed removal as well as the corresponding removal profiles obtained in (a,b) stainless steel and (c,d) titanium in a 5-molar phosphoric acid solution depending on the laser power at vfeed = 30 µm/s.

Figure 8.
Confocal micrographs of the resulting LCM cavities in (a) stainless steel and (b) titanium at a laser power PL of 1.5 W in dependence of the used feed velocity.
Figure 8.
Confocal micrographs of the resulting LCM cavities in (a) stainless steel and (b) titanium at a laser power PL of 1.5 W in dependence of the used feed velocity.

Figure 9.
Width and depth of the resulting LCM cavities in (a) stainless steel and (b) titanium at a laser power PL of 1.5 W in dependence of the used feed velocity.
Figure 9.
Width and depth of the resulting LCM cavities in (a) stainless steel and (b) titanium at a laser power PL of 1.5 W in dependence of the used feed velocity.

Figure 10.
CCD snapshots of the LCM interaction zone at the transition from a disturbance-free to a disturbed removal as well as the corresponding removal profiles obtained in (a,b) stainless steel and (c,d) titanium in a 5-molar phosphoric acid solution depending on the feed velocity at PL = 1.5 W.

Figure 11.
Experimentally determined LCM removal regimes in titanium machined in phosphoric acid solutions with concentrations of (a) 2.5 mol/L; (b) 5 mol/L; and (c) 7.5 mol/L.
Figure 11.
Experimentally determined LCM removal regimes in titanium machined in phosphoric acid solutions with concentrations of (a) 2.5 mol/L; (b) 5 mol/L; and (c) 7.5 mol/L.

Figure 12.
Width and depth of the resulting LCM cavities in titanium at a feed velocity vfeed of 30 µm/s in dependence of the applied laser power obtained at the different H3PO4 solutions with concentrations of (a) 2.5 mol/L; (b) 5 mol/L; and (c) 7.5 mol/L.
Figure 12.
Width and depth of the resulting LCM cavities in titanium at a feed velocity vfeed of 30 µm/s in dependence of the applied laser power obtained at the different H3PO4 solutions with concentrations of (a) 2.5 mol/L; (b) 5 mol/L; and (c) 7.5 mol/L.

Figure 13.
Width and depth of the resulting LCM cavities in titanium at a feed velocity PL of 1.5 W in dependence of the applied laser power obtained at the different H3PO4 solutions with concentrations of (a) 2.5 mol/L; (b) 5 mol/L and (c) 7.5 mol/L.
Figure 13.
Width and depth of the resulting LCM cavities in titanium at a feed velocity PL of 1.5 W in dependence of the applied laser power obtained at the different H3PO4 solutions with concentrations of (a) 2.5 mol/L; (b) 5 mol/L and (c) 7.5 mol/L.

Figure 14.
CCD snapshots of the laser irradiation of (a) stainless steel and (b) titanium in distilled water at a laser power of 1 W and a feed velocity of 30 µm/s (gas bubble formation was observed).
Figure 14.
CCD snapshots of the laser irradiation of (a) stainless steel and (b) titanium in distilled water at a laser power of 1 W and a feed velocity of 30 µm/s (gas bubble formation was observed).

Figure 15.
Characteristic removal profiles of the possible resulting LCM removal cavities (above) as well as schematic illustrations of the supposed dominating mechanisms (below) showing (a) a disturbance-free removal and (b–d) a disturbed removal.
Figure 15.
Characteristic removal profiles of the possible resulting LCM removal cavities (above) as well as schematic illustrations of the supposed dominating mechanisms (below) showing (a) a disturbance-free removal and (b–d) a disturbed removal.

Figure 16.
Removal disturbances due to total reflection of laser light by adhering and growing gas bubble; (a) CCD snapshots of gas bubble formation and growing during LCM of titanium in a 7.5-molar H3PO4 solution at a laser power of 1.75 W and a feed velocity of 50 µm/s; (b) SEM image of the resulting removal geometry as well as (c) a schematic illustration of the corresponding mechanisms.


Table 1.
List of process parameters used for experimental investigation.
| Parameter | Unit | Value | |
|---|---|---|---|
| laser beam (continuous wave) | wavelength λ | nm | 1080 |
| focus spot diameter dspot | µm | 30.5 | |
| focal position Δz | µm | 0 | |
| feed velocity vfeed | µm/s | 10 … 200 | |
| laser power PL | W | 0.5 … 2.5 | |
| phosphoric acid (H3PO4) | concentration | mol/L | 2.5, 5, 7.5 |
| boiling temperature TBoiling | °C | 104 | |
| layer height | mm | 2 | |
| transmission coefficient τE | - | 0.98 | |
| flow speed vflow | m/s | 2 |
© 2018 by the authors. Licensee MDPI, Basel, Switzerland. This article is an open access article distributed under the terms and conditions of the Creative Commons Attribution (CC BY) license (http://creativecommons.org/licenses/by/4.0/).
Share and Cite
MDPI and ACS Style
Mehrafsun, S.; Messaoudi, H. Dynamic Process Behavior in Laser Chemical Micro Machining of Metals. J. Manuf. Mater. Process. 2018, 2, 54. https://doi.org/10.3390/jmmp2030054
AMA Style
Mehrafsun S, Messaoudi H. Dynamic Process Behavior in Laser Chemical Micro Machining of Metals. Journal of Manufacturing and Materials Processing. 2018; 2(3):54. https://doi.org/10.3390/jmmp2030054
Chicago/Turabian StyleMehrafsun, Salar, and Hamza Messaoudi. 2018. "Dynamic Process Behavior in Laser Chemical Micro Machining of Metals" Journal of Manufacturing and Materials Processing 2, no. 3: 54. https://doi.org/10.3390/jmmp2030054