
Creep Behavior of Resin Matrix and Basalt Fiber Reinforced Polymer (BFRP) Plate at Elevated Temperatures


1
School of Civil and Transportation Engineering, Guangdong University of Technology, Guangzhou 510006, China
2
School of Civil Engineering, Harbin Institute of Technology, Harbin 150090, China
3
Key Lab of Structures Dynamic Behavior and Control, Harbin Institute of Technology, Harbin 150090, China
4
Department of Architectural Engineering & Design, University of Engineering & Technology, Main G.T Road, Lahore 54890, Pakistan
*
Author to whom correspondence should be addressed.
J. Compos. Sci. 2017, 1(1), 3; https://doi.org/10.3390/jcs1010003
Submission received: 16 April 2017
/
Revised: 19 May 2017
/
Accepted: 22 May 2017
/
Published: 24 May 2017
Abstract
:Pre-stressed fiber reinforced polymer (FRP) has great application potential in structural strengthening. However, the elevated temperature resistance of FRPs is always a key concern due to the poor thermal stability of its resin matrix. In this study, the effects of temperature on the creep behavior of the resin matrix and basalt fiber reinforced polymer (BFRP) was experimentally investigated. The tensile stresses were set at 2.6 MPa for the resin matrix and 522 MPa (35% of its ultimate tensile strength (fu)) for BFRP, and the exposure temperatures were 25 °C, 80 °C, 120 °C, and 160 °C. The short-term strain of the resin matrix and BFRP exposed to different exposure temperatures was measured. The variation of the thermal property and interlaminar shear strength (ILSS) of the BFRP were studied. The results indicated that molecular chain disruption and post-cure coexisted. The resin matrix is sensitive to the exposure temperatures, and a remarkable increase of the strain was observed when the exposure temperature exceeded its glass transition temperature (107.5 °C). The resin matrix fractured within 50 seconds when it was exposed to 160 °C. BFRP showed excellent temperature resistance even though the exposure temperature exceeded its glass transition temperature (123.7 °C). Sustained loading led to stress transferring to the basalt fiber in BFRP specimens, especially at elevated temperatures. Stress redistribution caused interfacial damage, and ILSS decreased by 0.5%, 13.6%, and 14.6% for 80 °C, 120 °C, and 160 °C exposure from its original value of 73.5 MPa. Dynamic mechanical thermal analysis (DMTA) was used to explain the post-curing and interface damage of BFRP.
1. Introduction
Fiber reinforced polymers (FRPs) are well-accepted materials for the repair and rehabilitation of concrete and steel structures. The rapidly growing use of FRPs for strengthening, retrofitting, and even as structural members for new construction can be attributed to the advantages of these materials, i.e., light weight, high specific strength and specific stiffness, corrosion resistance, and low maintenance cost [1,2]. It is expected that FRP composites will expand their usage in the near future [3]. As found by Wu et al. [4], applying FRP as a pre-stressed member in structures is more effective than normal reinforcement. However, in most civil engineering applications, FRPs are very likely to be subjected to relatively high in-service temperatures, which could result in the deterioration of mechanical performance and threaten structural safety [5].
With respect to the effects of elevated temperature on FRP composites, the glass transition temperature (Tg) of the composite is usually a threshold value for their application [6]. However, Tg can be easily reached on structural surfaces directly exposed to sunlight in a typical summer climate or under fire conditions [7,8]. The creep phenomena of FRP have an important role in the reliability and durability of structural elements [9]. Numerous studies have been performed to investigate the creep behavior combined with environmental attacks on FRPs or FRP-reinforced concrete structures [4].
Burke et al. [10] studied the effects of sustained loads and elevated temperatures on FRP-strengthened concrete systems. The exposure temperatures were set at 100 °C and 200 °C. The mid-span tensile strain was sustained between 40% and 60% of ultimate tensile strength until failure occurred. The results indicated that the structure is able to maintain its structural effectiveness for periods of hours, even when the exposure temperatures considerably exceed Tg of the epoxy adhesives. Dutta [11] studied the creep rupture of a glass fiber reinforced polymer (GFRP) composite at 25 °C, 50 °C, and 80 °C, with stress applied in the range of 60%–80% of the 25 °C failures stress. There is a significant loss in the failure time of the specimens when subjected to 50 °C and 80 °C, and an empirical model was developed to predict the time-to-failure. Amiri et al. [12] and Goertzen [13] tested the creep behavior of flax fiber and carbon fiber reinforced polymer (CFRP) composites at elevated temperatures (25 °C to 70 °C), and predicted the long-term creep behavior for composites.
In addition to GFRP and CFRP, creep behavior of basalt fiber reinforced polymer (BFRP) have also been the focus of research. Basalt fibers are spun at high temperatures from selected melted basalt rocks, and basalt fibers do not require additives in their production process, making it cost-effective [14]. Basalt fibers are characterized by an amorphous structure, and have a structure in the so-called short-distance order, which applies to the closest adjacent atoms (e.g., in Si–O–Si chains) and no periodicity occurs over longer distances [15]. It is known that the basalt fibers have better tensile strength than E-glass fibers and higher failure strain than carbon fibers. The basic properties of basalt and E-glass fibers are shown in Table 1 [2,16]. In addition, they have high chemical and thermal stability [14]. Shi et al. [17] examined the creep behavior of BFRP tendons, and their stress levels were determined to be 0.8fu, 0.78fu, 0.75fu, and 0.7fu. As found, BFRP specimens can sustain a stress level of 0.7fu without fracture within 1000 h. Wang et al. [18] studied the creep behavior of BFRP tendons with sustained stress to the tensile strength at 50%, 60%, 65%, 68%, and 70%. Residual tensile strength was predicted based on a linear fitting.
FRP composites are compounded using soft fibers and matrices. Generally, fibers show excellent temperature resistance compared with resin matrices [19]. Most matrices have poor heat-resistant properties, and show significant creep deformation at elevated temperatures, which often lead to oxidation and failure in high-temperature environments [20]. Berardi [9] demonstrated that the stress migrates from the matrix towards the fibers in the creep process, especially at elevated temperatures, and the creep behavior of the matrices cannot be neglected for elevated temperature applications. The creep behavior of polyimides is usually described with nonlinear viscoelastic constitutive models. Haik et al. [21] studied the creep behavior of thixotropic epoxy, and the exposure temperatures were set at 25 °C, 40 °C, and 60 °C. An elastic-viscoelastic constitutive model was used for predicting the creep behavior at shorter time periods and lower temperatures. Crochon et al. [22] studied creep responses of polymers and polymeric composites, and the power-law model was used to model the transient and steady-state creep responses of polyimide.
As mentioned above, the creep behavior of FRPs and matrices at elevated temperatures have been studied, but the exposure temperatures were set below the glass transition temperature of the composites. Basalt fiber-based FRP composites are a newly-developed inorganic material, and the creep behavior of BFRP composites is still limited. According to the study [17], a stress level of 0.6 fu with a duration of 3 h is the most appropriate pretension process for BFRP composites at room temperature. If the duration is too short or the level is too low, then the uneven fibers cannot be fully straightened. Considering that the resin matrix will soften at a high temperature, and from results based on the literature [4], 0.35fu was selected in this study.
In this paper, the creep behavior of bisphenol-A epoxy resin and BFRP plates at elevated temperatures are experimentally studied, and the exposure temperatures are higher than the glass transition temperature of the materials. The residual mechanical properties of the specimens were evaluated. This study demonstrated that the post-curing and molecular chain breakage coexisted for the specimens exposed to elevated temperatures and sustained loading conditions. The fibers were unevenly distributed in the BFRP specimens, and the interface between the fiber and resin matrix was damaged due to stress redistribution. Dynamic mechanical thermal analysis (DMTA) was employed to gain insight into the viscoelastic characterization and interface damage of the specimens.
2. Materials and Methods
2.1. Raw Materials
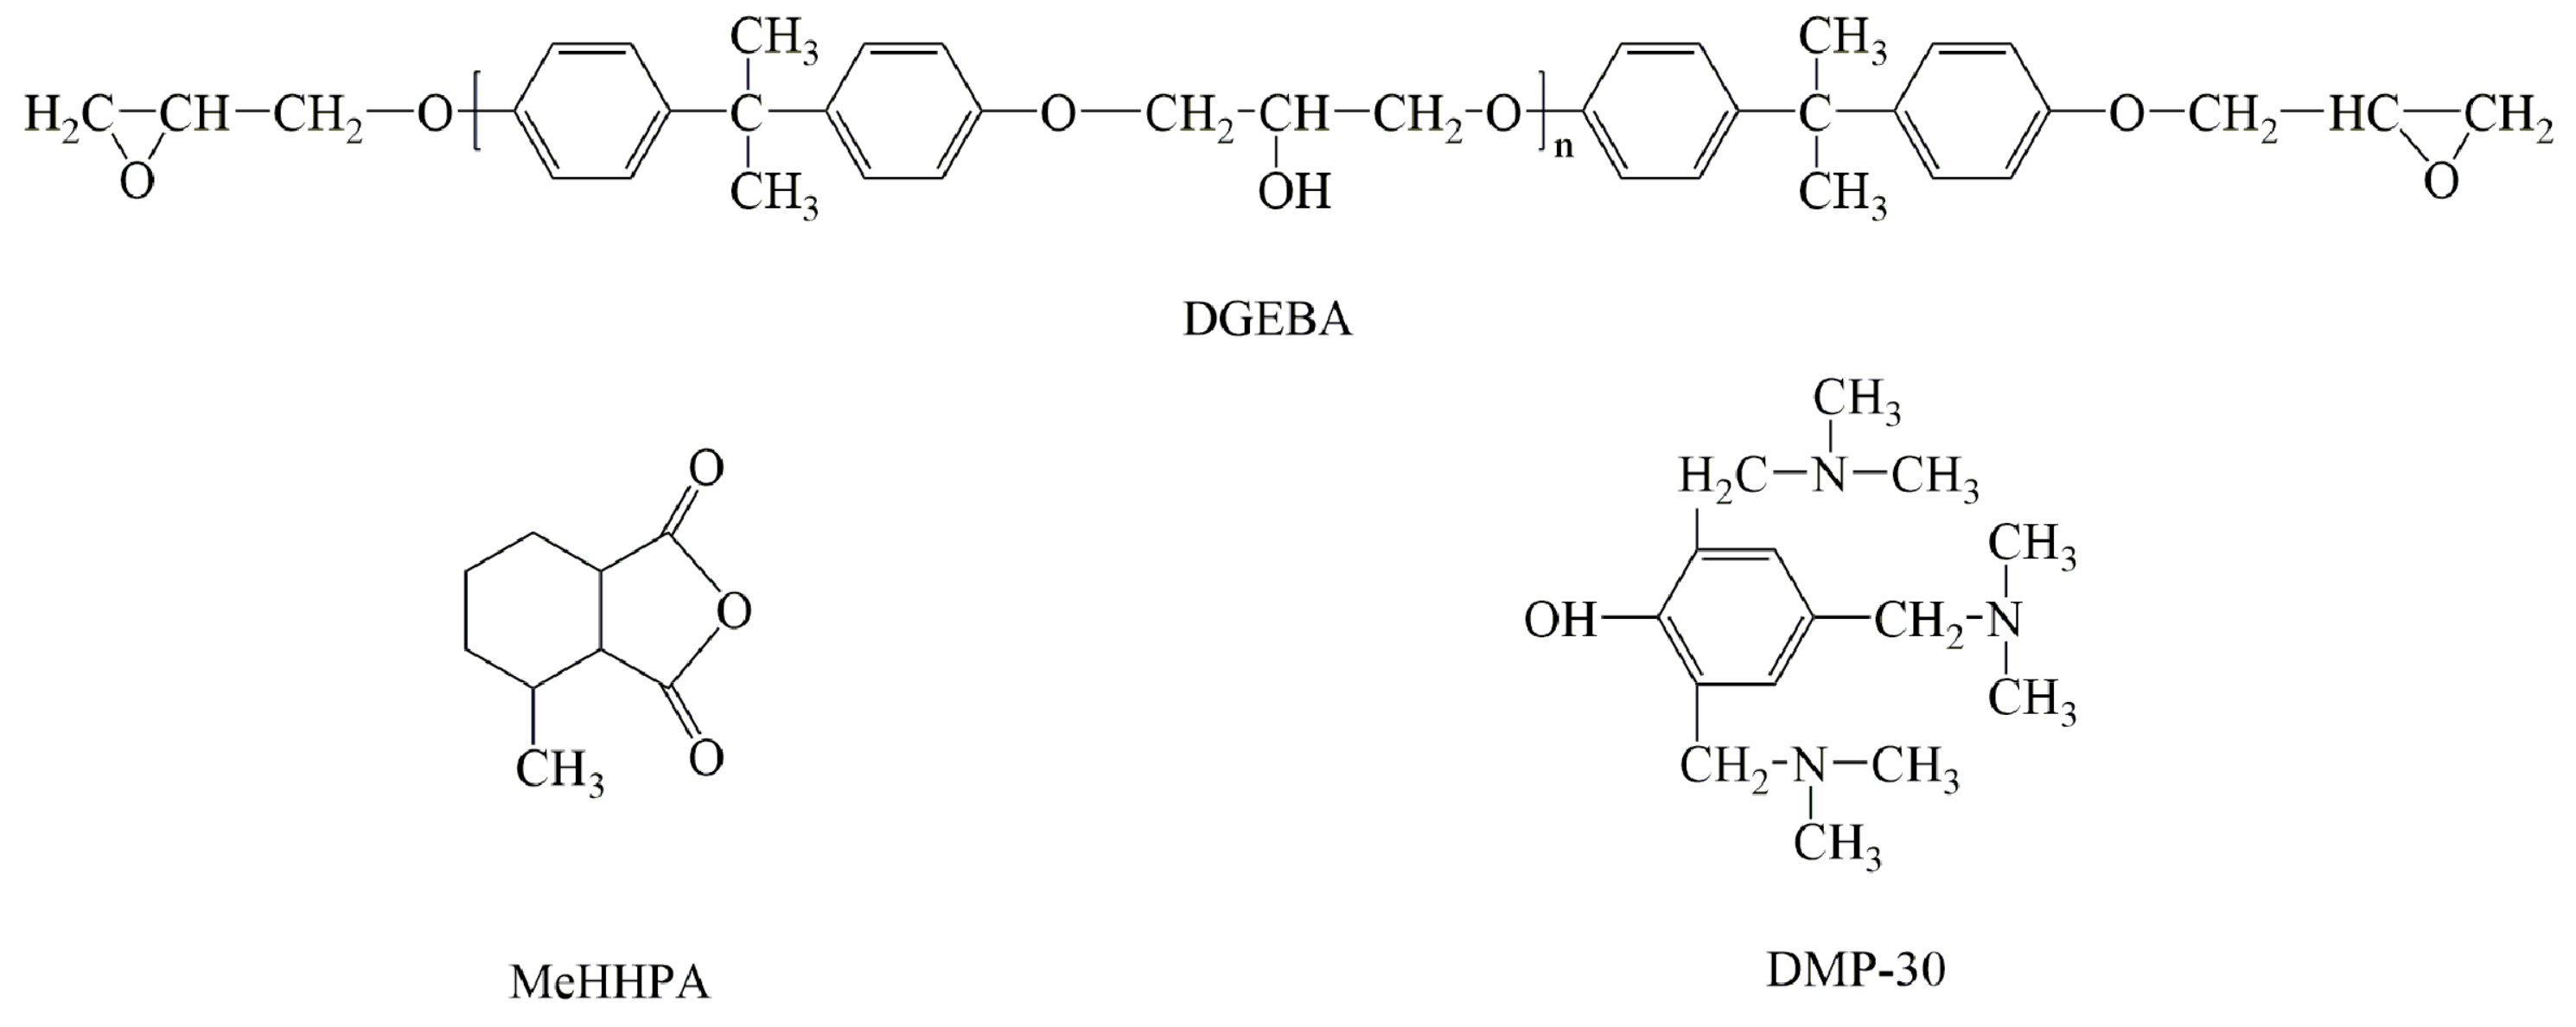
The resin matrix was an epoxy polymer based on bisphenol-A (similar to EPON 828, provided by Xing Chen Synthetic Material Co., Ltd., Wuxi, China) and an anhydride curing agent (MeHHPA, provided by Qing Yang Chemistry Co., Ltd., Jiaxing, China). The chemical structures of the compounds used in this study are presented in Figure 1. The mass ratio of EPON 828/MeHHPA was 100:80. The mixed homogeneity resin matrix (~150 g) was put in an ultrasonic cleaner for 10 min to remove the bubbles and the temperature of the water in the ultrasonic cleaner was set at 35 °C; then the resin matrix was poured into a processed aluminum mold, as shown in Figure 2. Before pouring the resin matrix into the mold, a release agent (~1.5 g, HD-915, provided by Shang Hai Chemical Co., Ltd., Shanghai, China) was spread evenly with a cotton swab over the surface of the mold. The curing condition was set at 150 °C for 2 h. After removing the screws at both ends (seen in Figure 2) of the mold after the temperature cooled to 25 °C, the resin matrix was obtained. The tensile strength, tensile modulus, and elongation at break were 62.5 MPa, 3.1 GPa, and 2.0%, respectively. The tensile test was performed based on ASTM D 638–99 [23]. Five specimens were used, and the average was reported. The glass transition temperature of the resin matrix is 107.5 °C (determined by the storage modulus with DMTA, as mentioned in Section 2.3).
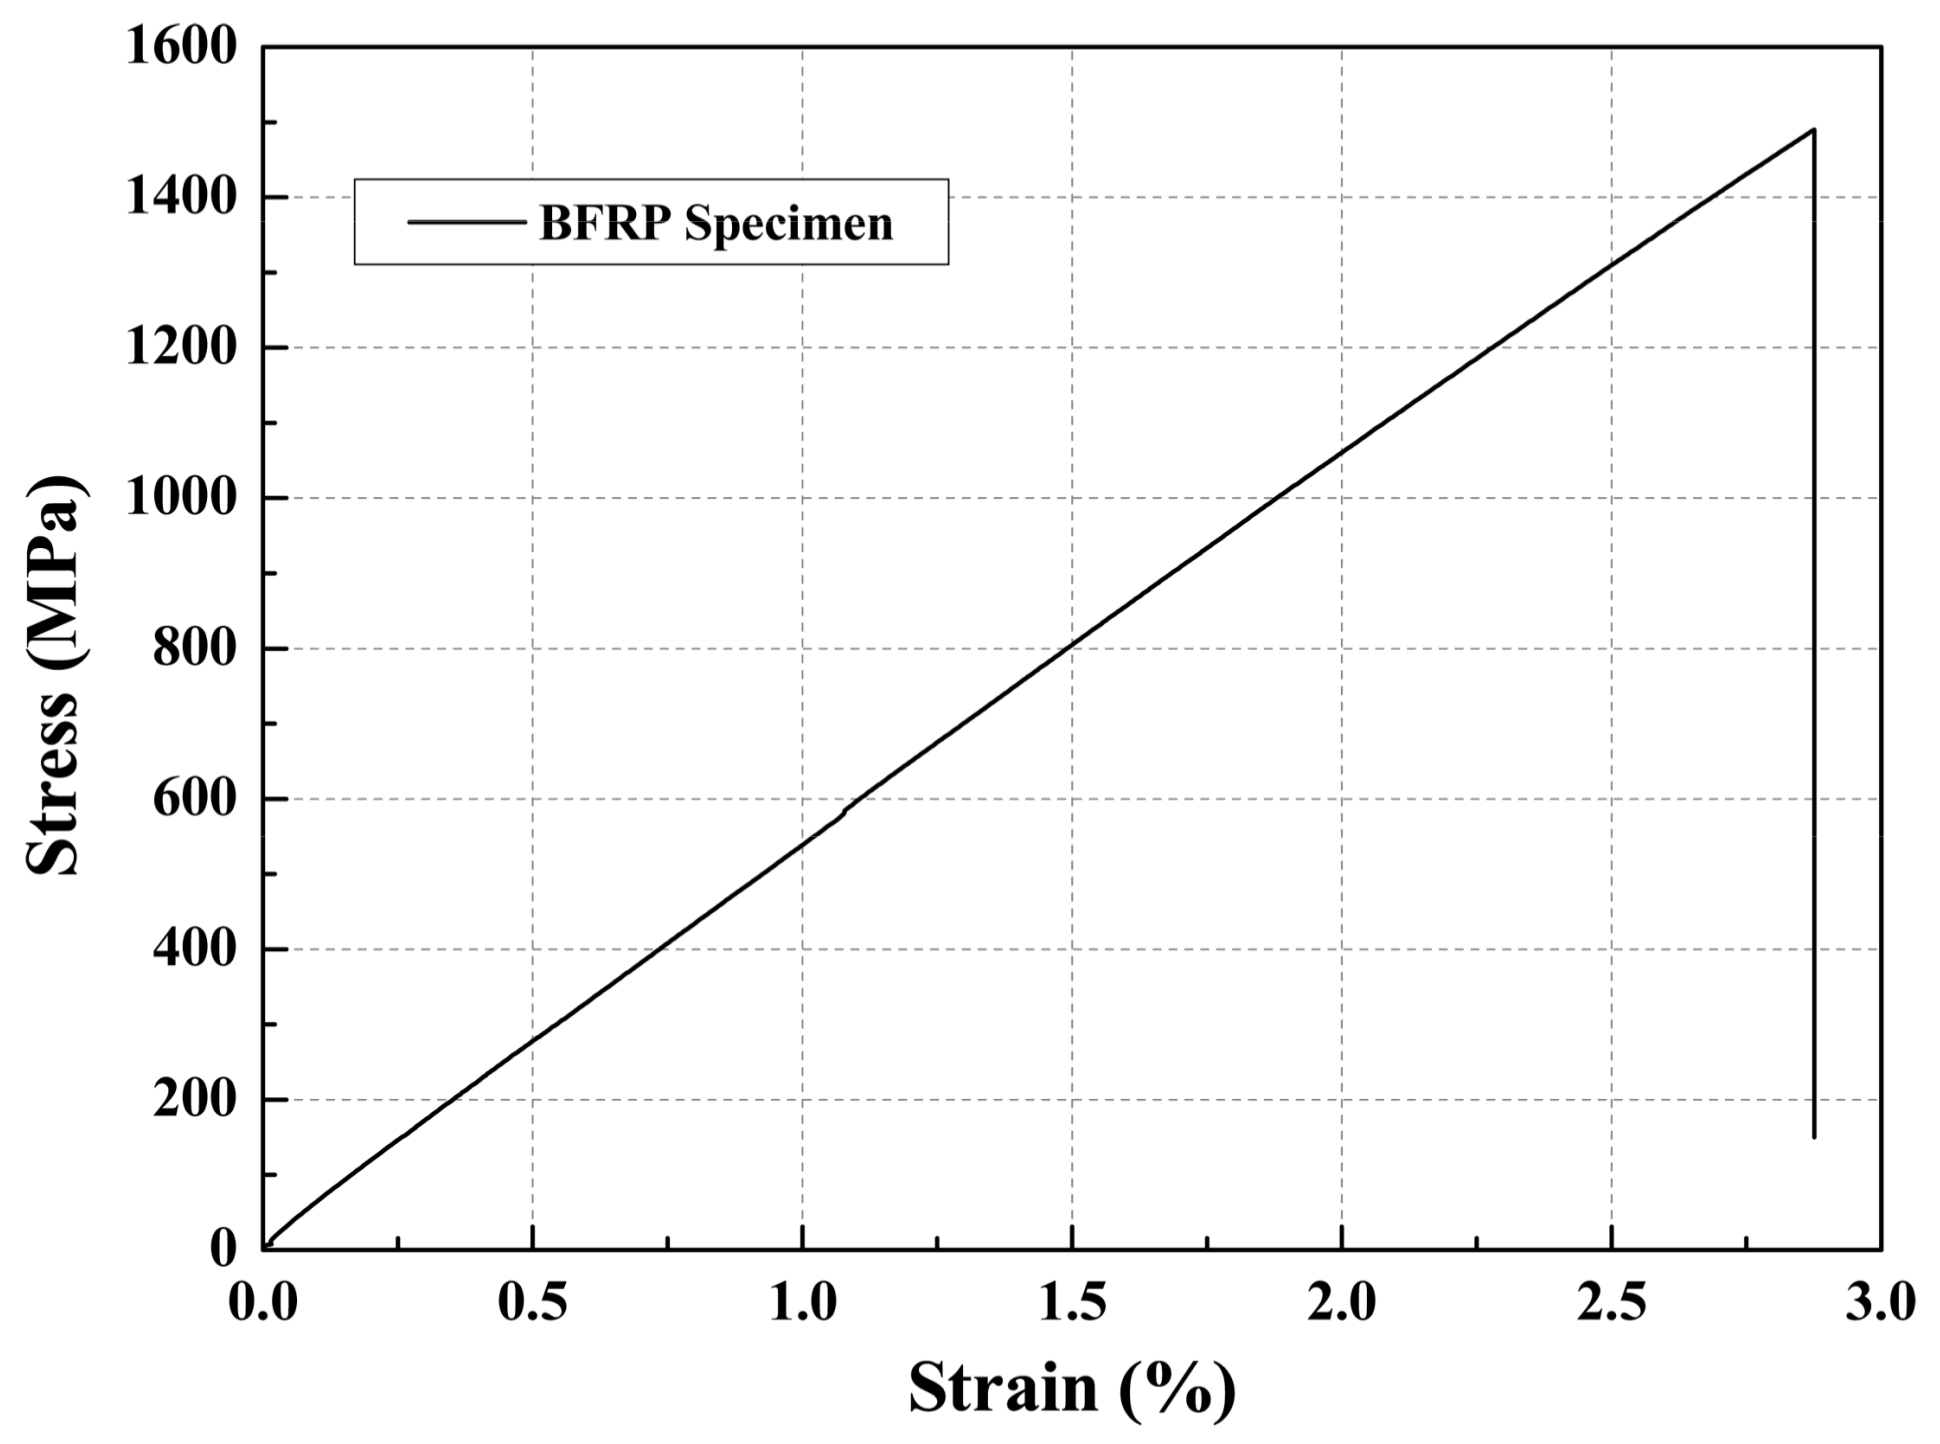
BFRP specimens used in this study were produced using a pultrusion process at the Laboratory for FRP Composites and Structures (LFCS), Harbin Institute of Technology (Harbin, China). The pultrusion machine was manufactured by the Nanjing Loyalty Composite Equipment Manufacture Company (mode NLL-5TL, Nanjing, China). The pull-through speed was set at 30 cm/min. The molding temperatures in the three zones were 120 °C, 160 °C, and 190 °C. The widths and thicknesses of the plates were 15 mm and 1.3 mm, respectively. The fiber volume fraction of the pultruded plates was determined to be 70.7%, using the theoretical value. The continuous and untwisted basalt fiber roving (12 k) were provided by the TuoXin Aerospace Basalt Industrial Co., Ltd., Chengdu, China. Scanning electron microscopy was used to measure the diameter of the basalt fiber from the polished cross-sections of the BFRP specimens. Twenty fibers were tested, and the average diameter of the basalt fibers was 15.5 μm. Based on a single-fiber tensile test, the tensile strength, modulus, and elongation at break were 2.7 GPa, 85.4 GPa, and 3.7%, respectively [24]. The tensile test of BFRP specimens was performed based on ASTM D 3039 [25]. The tensile strength, tensile modulus, and elongation at break were 1492 ± 31 MPa, 53.7 ± 1.9 GPa, and 2.8% ± 0.11%, respectively. Nine specimens were used, and the average was reported. A typical stress-strain curve of BFRP specimens is shown in Figure 3. The glass transition temperature of the BFRP specimen was 123.7 °C (determined by the storage modulus with DMTA, as mentioned in Section 2.3).
2.2. Test Setup and Test Procedure
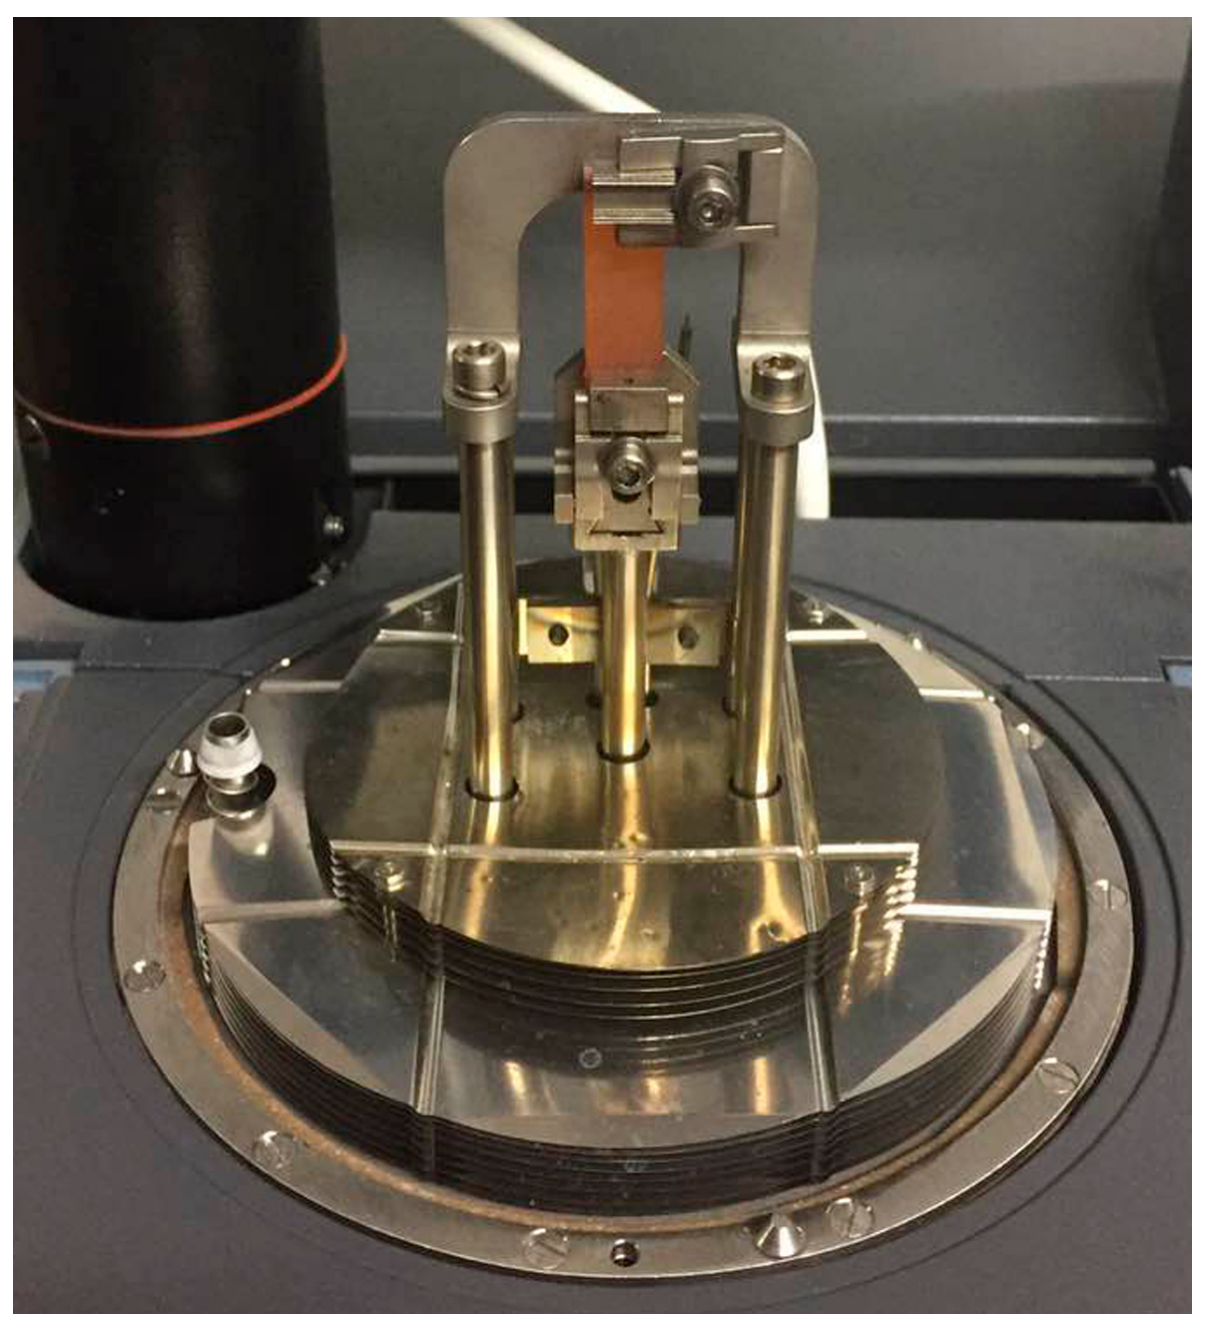
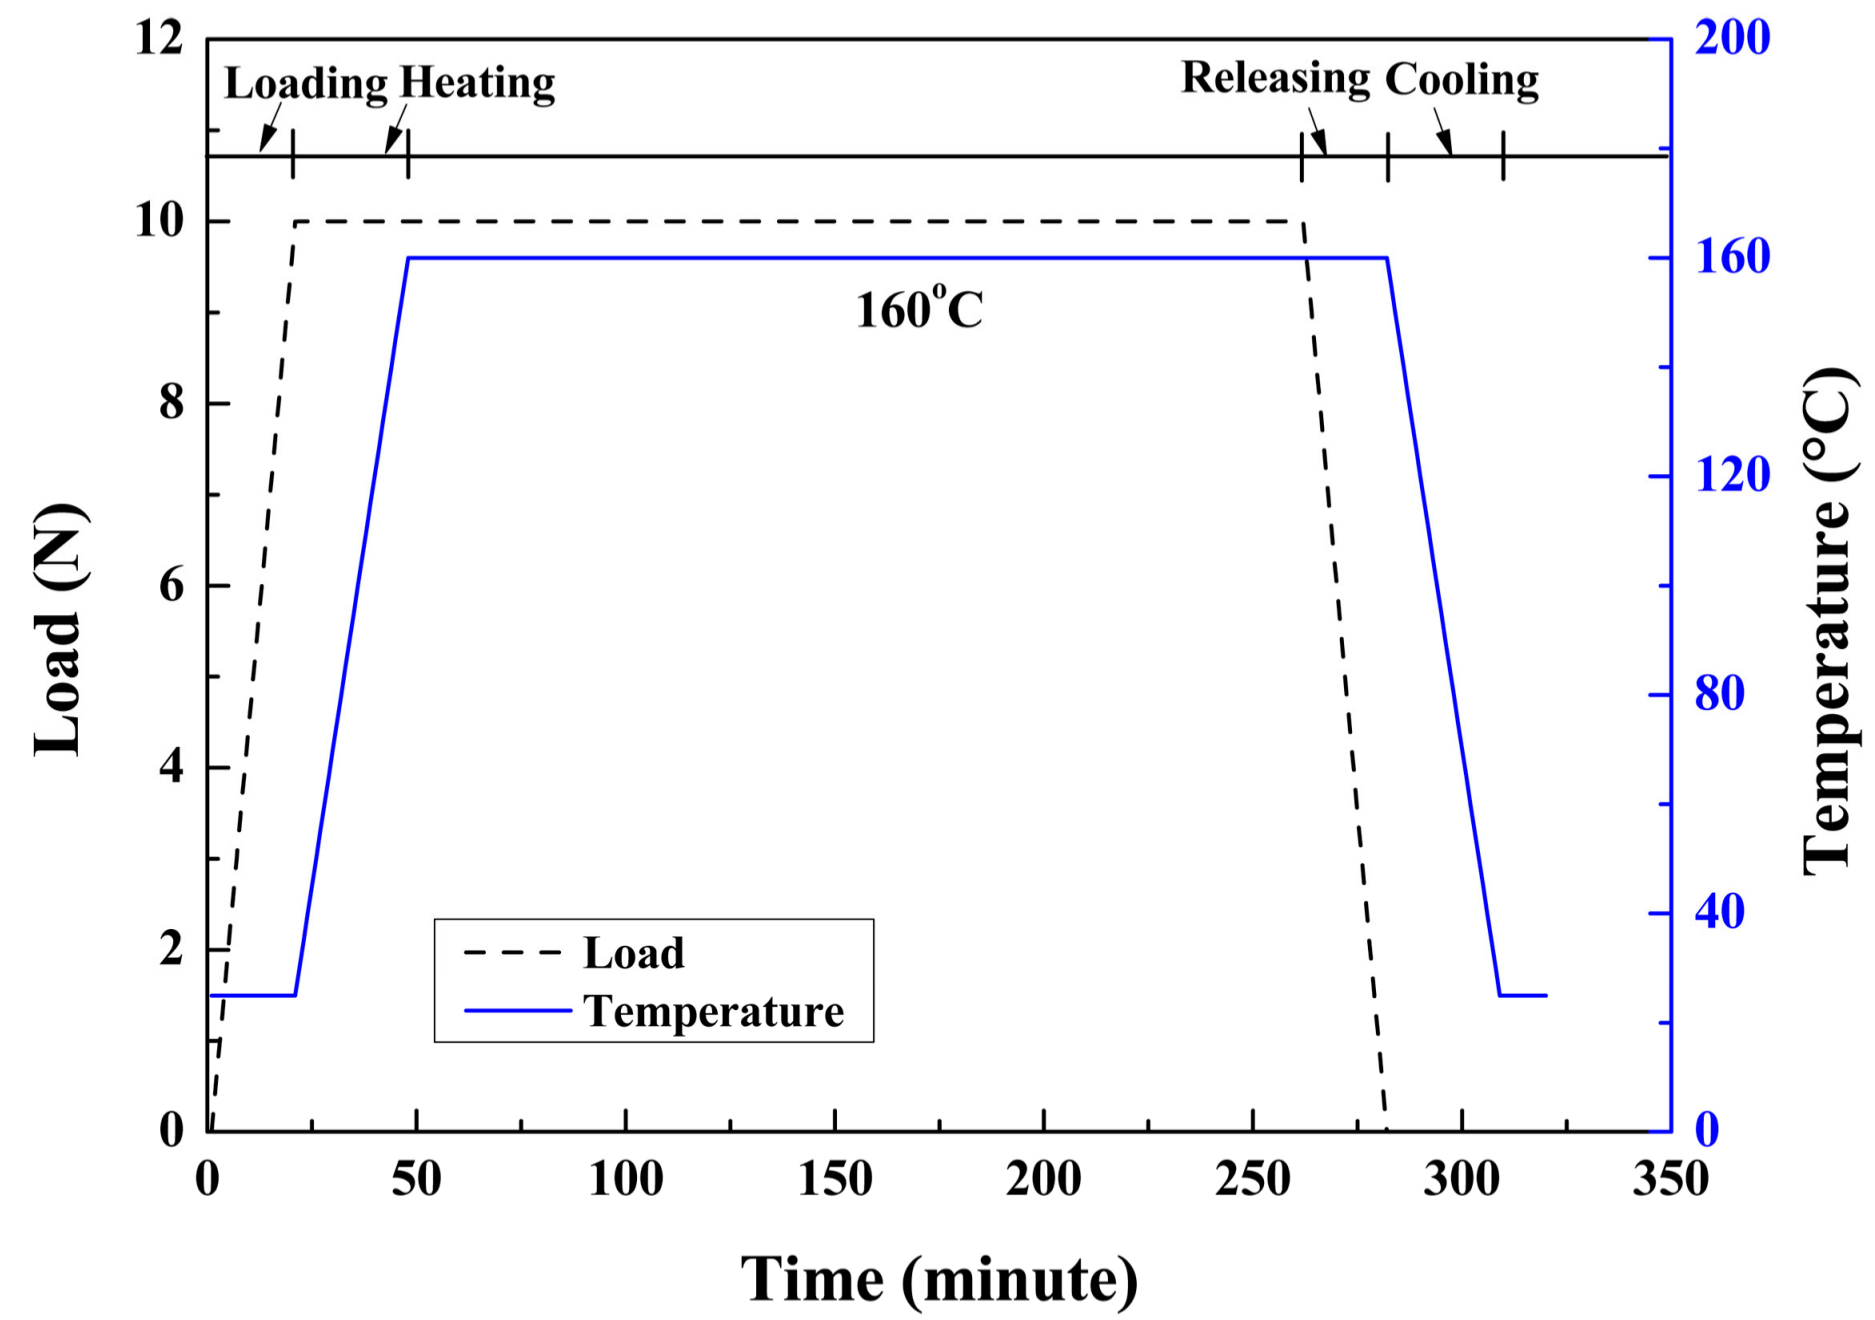
The creep test of the resin matrix was carried out by a dynamic mechanical analyzer (DMA Q 800, TA Instruments, New Castle, DE, USA) with a film tension fixture, as shown in Figure 4. The specimens were cut into pieces 30 mm × 3.5 mm × 1.1 mm by a cutting machine (Secotom-15, Struers, Ballerup, Denmark). The constant load was set at 10 kN. The loading speed of the specimens were controlled by 0.5 N/min. The temperature was raised at a heating rate of 5 °C/min after the load was increased to 10 N. The temperatures were set at 25 °C, 80 °C, 120 °C, and 160 °C. The specimens were exposed to the constant temperature and load condition for 4 h. After that, the load was released to 0 N at a rate of 0.5 N/min. As an example, the loading procedure and elevated temperature history for the specimens tested at 160 °C are shown in Figure 5.
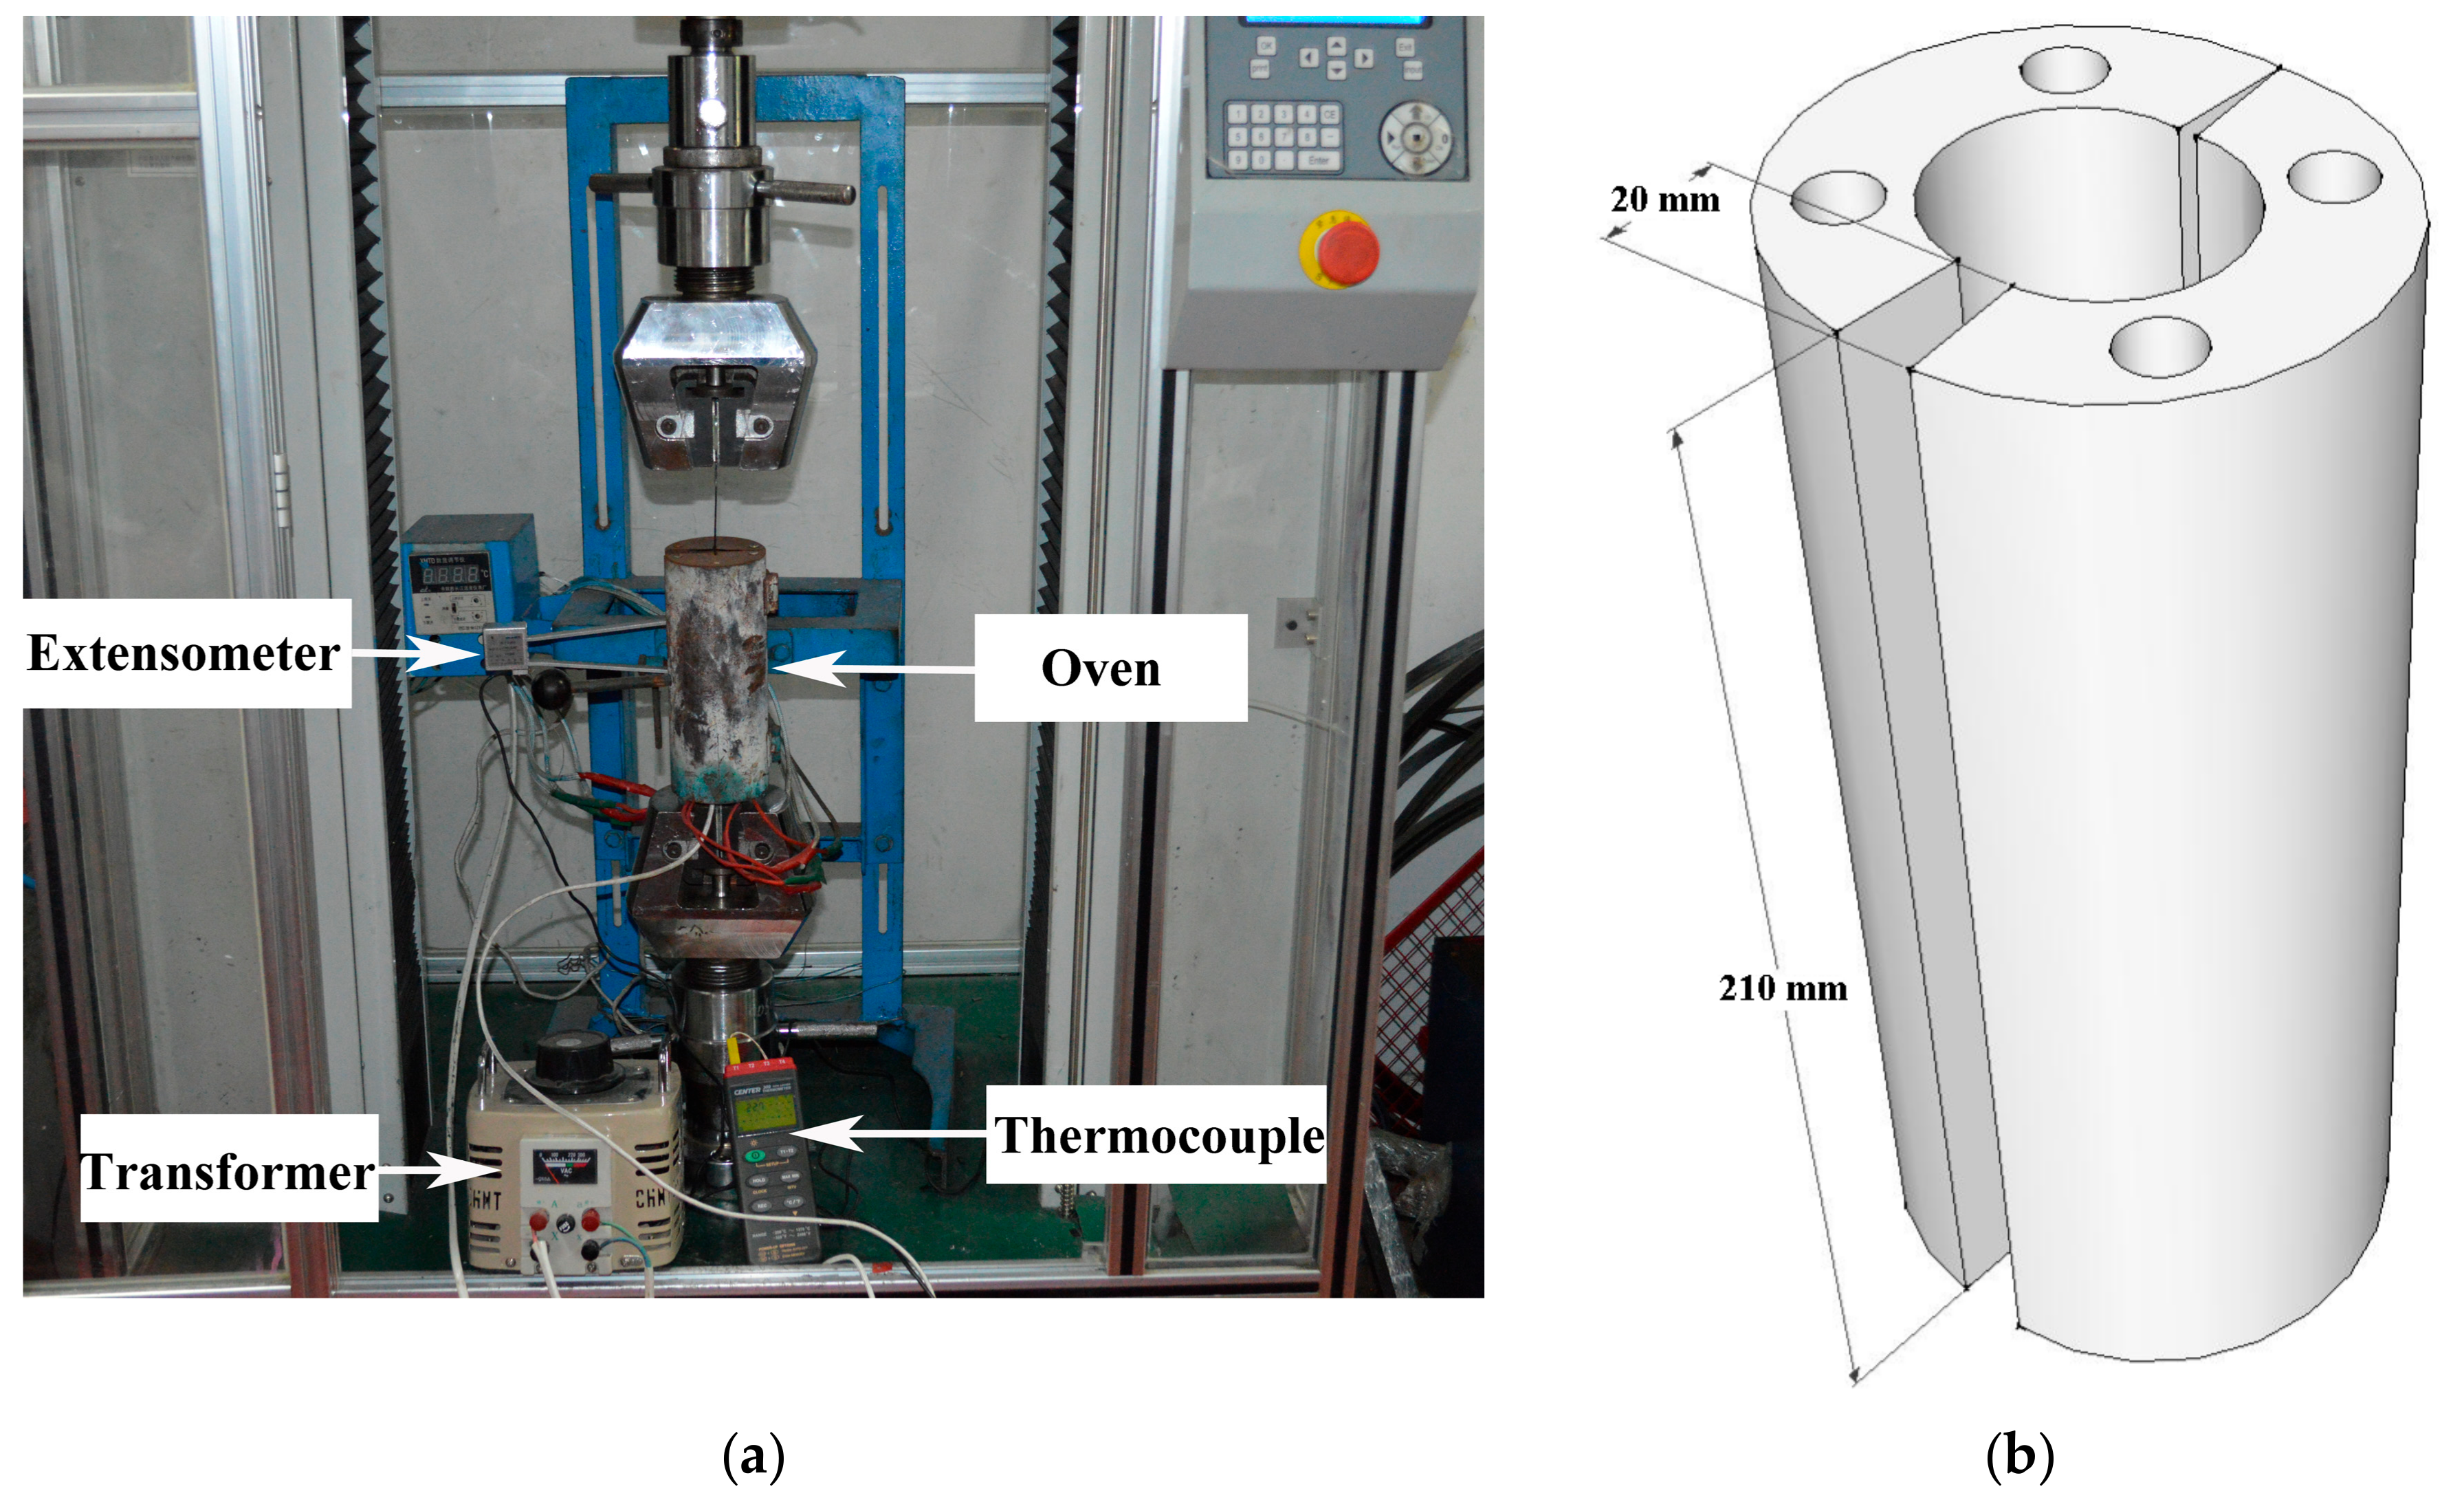
Regarding the BFRP specimens, the constant load was designed to be 35% fu, the typical dimensions of the BFRP specimens were 400 mm × 15 mm × 1.3 mm, and an aluminum sheet was used as an anchorage system at both sides (as shown in Figure 6). The load was controlled by an electronic universal testing machine (WDW-100D model, Hengyi Company, Shanghai, China) equipped with a 100 kN load cell. The loading speed of the BFRP specimens were controlled at 5 mm/min. The temperature was raised at a heating rate of 5 °C/min after the load was increased to 35% fu. The testing temperature was controlled with an electrically-heated kiln, as shown in Figure 7a. The length of the oven was 210 mm, the outer diameter of the steel rod was 80 mm, and the internal diameter was 30 mm. Four heater rods with diameters of 12 mm were put in the middle part of the steel, as shown in Figure 7b. The heating rate was controlled by controlling the voltage using a transformer (Figure 7a). The temperatures were set at 25 °C, 80 °C, 120 °C, and 160 °C. The specimens were exposed to the constant temperature and load condition for 4 h. After that, the load was released to 0 N at 5 mm/min. The loading procedure and elevated temperature history can be found in Figure 5.
The longitudinal strain of the BFRP specimens was measured with a strain gauge during the test. The strain gauges (Measurement type BA 350-3 AA) and the adhesive (Type H-610) were provided by ZhongHang Electronic Measuring Instruments Co., Ltd. (Shaanxi, China). Due to the expansion of the specimens at elevated temperatures, the strain gauge fell off at 160 °C, and the strain was tested by an extensometer (seen in Figure 7).
2.3. Dynamic Mechanical Thermal Analysis (DMTA)
After the temperature was cooled to 25 °C, the dynamic mechanical thermal property of the specimens was measured by TA Instruments (DMA, Q 800). A film tension fixture was used for the resin matrix at 1 Hz, and the amplitude was set at 12 μm. The testing temperature ranged from 25 °C to 200 °C with a heating rate of 3 °C/min.
Single cantilever mode was used for BFRP at 1 Hz, and the amplitude was set at 25 μm. The BFRP specimens were cut into pieces with dimensions of 35 mm × 15 mm × 1.4 mm. The testing temperature ranged from 25 °C to 240 °C with a heating rate of 5 °C/min.
2.4. Interlaminar Shear Strength (ILSS) Test
The residual interlaminar shear strength (ILSS) test was performed on the BFRP specimens (after unloading and when the temperature cooled to 25 °C) at 25 °C according to ASTM D 2344/D 2344 M-00 [26]. The mechanical tests were performed by an electronic universal testing machine, the same as the load control device. The dimensions of the specimens were 8.4 mm × 2.8 mm × 1.4 mm. ILSS was measured at the crosshead speed of 1 mm/min under displacement control. Five specimens were used for each test, and the averages are reported.
2.5. Cross-Section Observation
A polishing machine (Tegramin-20, Struers, Ballerup, Denmark) was used to observe the interface between the basalt fiber and matrix. BFRP specimens were fixed in a mold (the length was 40 mm, and the internal diameter is 20 mm). The epoxy resin (the same as the tested one) was poured into the mold. After curing at room temperature, the resin matrix was exposed to 80 °C for 3 h as a post-curing procedure. Then, the specimens were polished on the polishing machine. The first step was set for 10 min, and the following three steps were set for 5 min. An optical microscope (HXD-2000 TMC/LC, Tai Ming Optical Instrument Co., Ltd., Shanghai, China) was used to observe the morphology of the cross-sections of the BFRP specimens.
3. Results and Discussion
3.1. Creep Behavior of the Resin Matrix
According to the loading and elevated temperature procedures, the deformation of the resin matrix can be divided into four stages: loading, heating, sustained, and unloading periods [1]. The time-dependent creep strains at different time intervals are shown in Figure 8. During the loading stage (stage 1), the four temperatures have the same tendency: strain developed in a linear relationship with time. For the elevated temperature stage (stage 2), the creep strain values increased with increasing temperature as the exposure temperature remained below the glass transition temperature (Tg) of the resin matrix. However, the creep strain values increased sharply after a certain temperature, and there is a large deviation in the cases of 120 °C and 160 °C exposure. In the initial stage, all specimens exhibited limited strain behavior, which can be attributed to the cross-linking greatly restricting the movement of the polymer networks. At high temperatures, the networks were thermally activated and became soft, allowing a larger deformation [27]. With rising temperature, the deformation of the specimens increased dramatically and rupture finally occurred at 143 °C. This can be attributed to chain scission processes or the formation and growth of micro-cracks, cavities, or other flaws while in this stressed/elongated state [28]. For the specimens exposed to 25 °C and 80 °C (less than Tg), the deformation increased slowly. It was also seen that the strain still rose significantly for the specimens exposed to 120 °C, even though the temperature stopped increasing (stage 3). During the sustained loading and temperature period, defect evolution and chain scission processes continued to develop [5]. With respect to the unloading stage (stage 4), the specimens showed a linear decreasing trend and the residual strain can be found as the difference. The higher the exposure temperatures, the higher the residual strain, and the residual strains were 0.002%, 0.20%, and 9.92% for the specimens exposed to 25 °C, 80 °C, and 160 °C, respectively. This trend neatly illustrates that elevated temperatures increase the irrecoverable deformation of the resin matrix [7].
For most materials, other than those which are perfectly linearly elastic and perfectly brittle, failure is likely a nonlinear process, however it is defined [29]. For polymers, composites, and adhesives, it is suggested that the amount of nonlinearity is both a function of the stress level and the time scale [17]. Indeed, various nonlinear theories are in agreement with this observation [30]. That is, for high stress levels, nonlinear-creep processes occur even over a very short time scale, while for low stress levels, nonlinearities may only be detectable after a very long time. More details of the creep behavior are shown in Table 2.
During the second stage, the strain increased by 37 με, 4642 με, and 135,100 με for the resin matrix exposed to 25 °C, 80 °C, 120 °C, respectively, and the exposure time at the knee point increased as the temperature increased, which can be attributed to the resin matrix softening at elevated temperatures [31]. The increase of the strain from high to low followed the sequence: 120 °C exposure specimens > 80 °C exposure specimens > 25 °C exposure specimens. After the completion of stress redistribution in the specimens, the strain increased gradually with respect to time [32]. The strain increment is also listed in Table 2. As was found, the strain increment is much higher as compared to the ones exposed to 25 °C. Temperature increases the elongation of the resin matrix [17].
3.2. Creep Behavior of BFRP
The strain variation of BFRP at exposure temperatures and sustained loading situations are shown in Figure 9. Similar to the epoxy resin, the strain is fast-growing at the initial stage, and then exhibits slow growth with time at all exposure temperatures. This can be explained by the viscoelastic theory of FRP composites due to their composition of linear elastic fibers and viscous resin matrix [9], and the stress redistribution occurring in BFRP under the effects of both elevated temperatures and constant load conditions [17]. At the initial stage, the strain increased by 92 με for the specimens at 25 °C, and as the temperature increased to 80 °C, 120 °C, and 160 °C, the strain increased gradually by 150 με, 852 με, and 1034 με, respectively. Creep of the polymers occurs because of viscoelastic deformation, and the deformation increases with increasing temperature [31]. Sustained loading leads to micro-defect evolution and accelerates the relaxation in the material system [32].
The strain increasing and exposure time at the knee point of BFRP specimens are listed in Table 3. At the initial stage, the strain increased by 92 με, 150 με, 852 με and 1034 με for the specimens exposed to 25 °C, 80 °C, 120 °C and 160 °C, respectively. With the increase of the exposure temperatures, the difference of the increasing strain becomes more significant. Regarding the strain increment under different exposure temperatures, the higher the exposure temperature, the higher strain increment can be found. Under 35% fu, the exposure time at the knee point increased as the exposure temperature increased. Due to the unevenness of each bundle of fibers, the fibers in BFRP specimens maintain different stress levels. This difference in stress among each fiber will cause the non-uniform fibers to fracture, and the released load will be transferred by the resin to the surrounded fibers [17]. After the completion of stress redistribution in BFRP specimens, the strain increases gradually with time. Due to viscoelastic characteristics of the resin matrix, elevated temperatures and sustained loading accelerated the resin matrix softening and fiber fracture [9]. Thus, exposure time at the knee point increased.
3.3. Thermomechanical Properties of the Resin Matrix
The cross-linking density (ρ) can be calculated from the equilibrium storage modulus in the rubbery region over the α-relaxation temperature, according to the rubber elasticity theory [33], and is expressed as follows:
where, G′ is the rubbery storage modulus at Tg + 30 °C (MPa), Φ the front factor (generally equal to 1), R the gas constant (8.314 J mol−1·K−1), and T the absolute temperature at Tg + 30 °C (K).
The results of ρ of the matrix and BFRP exposed to elevated temperatures under various load levels are shown in Table 4. For the matrix without loading conditions, the cross-linking density of the specimens exposed to 80 °C and 120 °C gradually decreased by 3.8% and 4.5% from the original value of 5.78 × 10⁻³ mol/cm3. With respect to the 160 °C condition, the cross-linking density returned to the initial value for unknown reasons.
For the specimens exposed to elevated temperatures under loading conditions, at 25 °C, the cross-linking density of the specimens decreased by 8.0% compared with specimens without loading at 25 °C. This can be attributed to the evolution of flaws in the stressed state [28] or the chain scission of the matrix occurring under the combined effects of sustained loading and elevated temperatures [9]. Oxidation is limited on the surface of the epoxy resin, which can be attributed to the formation of carbonyl groups from the hydroxyl groups [34]. Compared with the specimens exposed to 25 °C, the cross-linking density increased by 3.6% and 8.8% for the matrix specimens exposed to 120 °C and 160 °C, respectively. This can be attributed to the molecular motion increasing as the temperature increases, and thus post-curing is beneficial to the epoxy resin [32]. The increasing molecular motion leads to post-curing rather than oxidation and chain scission. The results of ρ for the specimens exposed to 120 °C increased from 5.32 × 10⁻³ mol/cm3 to 5.79 × 10⁻³ mol/cm3, indicating that sustained loading and elevated temperature is beneficial to the cross-linking reaction. With respect to BFRP specimens, a similar trend can be found.
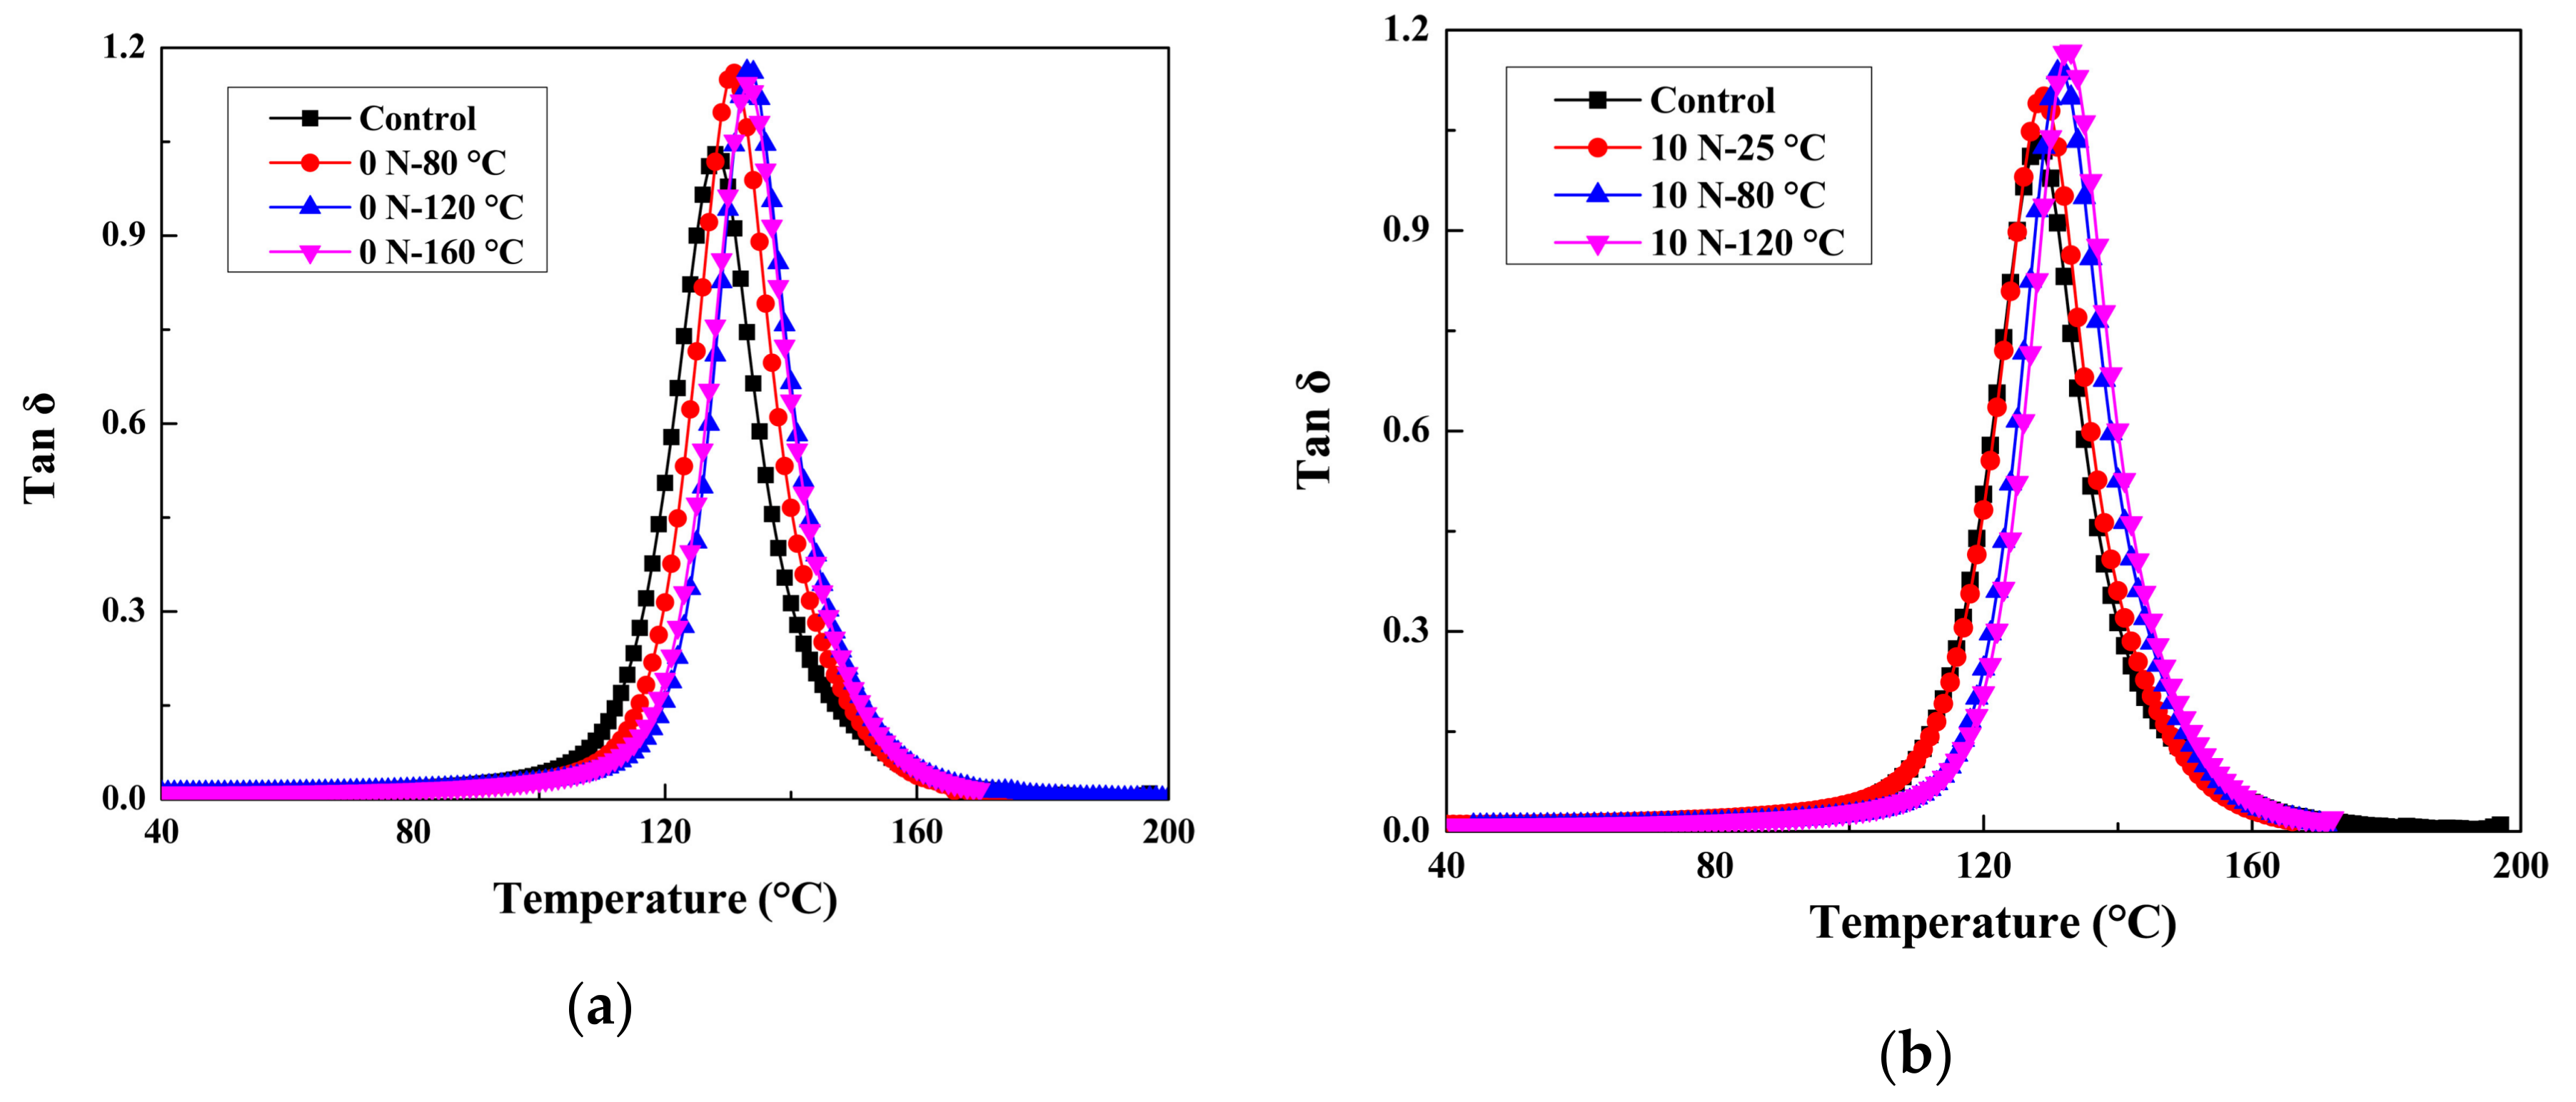
Tan δ is very important for determining the damping behavior of the resin matrix [2]. Figure 10a summarizes the tan δ curves of the resin matrix specimens without loading. The area under the loss curve reflects the energy dissipation capabilities of the material. The breadth of tan δ is related to the distribution of the local collective dynamics [2]. As the exposure temperature increased, the tan δ curve’s peaks shifted to the right, and the peak of tan δ increased gradually from 1.03 to 1.16 and 1.16 as the exposure temperature increased from 25 °C to 80 °C and 120 °C. As the exposure temperature increased to 160 °C, the tan delta decreased to 1.14.
Tan δ curves of the resin matrix after exposure at elevated temperatures and loading conditions are shown in Figure 10b. The peaks of tan δ shifted to the right gradually as the exposure temperatures increased from 25 °C to 120 °C, and the corresponding height increased from 1.10 to 1.14 and 1.17, respectively. The increases of the peak value of tan δ demonstrated that sustained load is beneficial to post-curing compared to the specimens without loading.
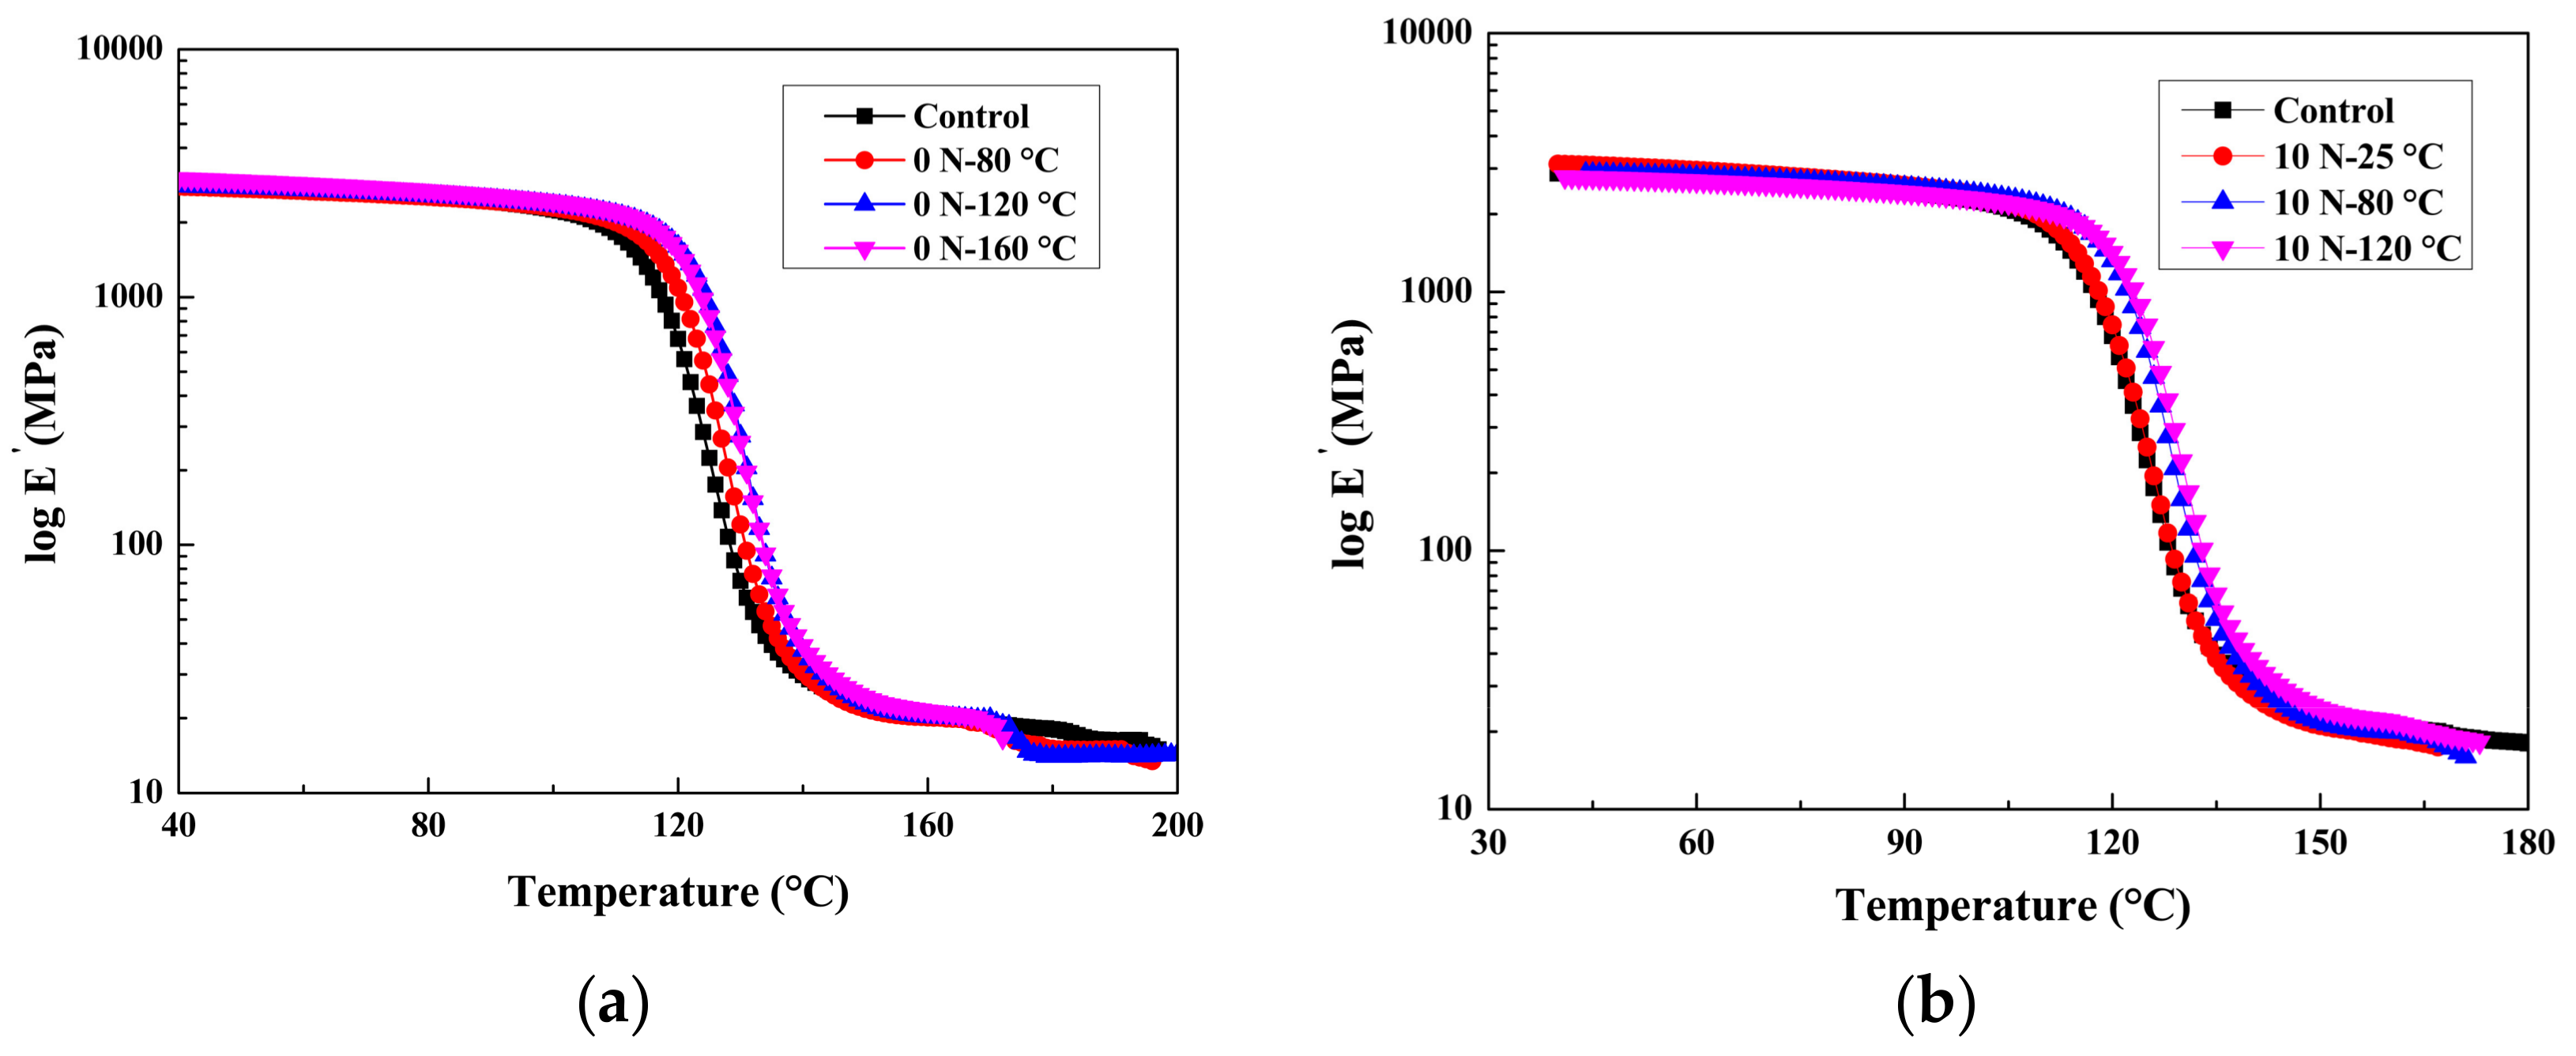
The variations of the storage modulus for the resin matrix specimens as a function of temperature are shown in Figure 11a. On comparing the storage modulus of the matrix specimens without loading, it was found that the storage modulus increased as the exposure temperatures increased. The specimens exposed to 120 °C increased the storage modulus by about 5.3%, and the specimens exposed to 160 °C decreased by about 7.7% compared with the specimens exposed to 80 °C. The curves of the storage modulus shifted to the right gradually as the exposure temperature increased; the result of the post-curing. Figure 11b shows the storage modulus variations of the resin matrix specimens under loading conditions. As the specimens in glassy state, the specimens exposed to 25 °C and 25 °C showed no obvious differences. This increase in the storage modulus was due to the post-curing even in loading conditions, and the resin specimens showed a better post-curing.
3.4. Thermomechanical Properties of BFRP
The cross-linking density (ρ) of the BFRP specimens is calculated with Equation (1). The variation of ρ of the resin in the BFRP specimens exposed to elevated temperatures and sustained loads are calculated and summarized.
As shown in Table 4, similar to the epoxy resin, the cross-linking density gradually decreased as the exposure temperatures increased from 25 °C to 160 °C for the specimens without loading. Sustained load and elevated temperatures brought a further decrease of ρ, as shown in Table 4. The cross-linking density (ρ) gradually decreased as the exposure temperatures increased from 80 °C to 160 °C for the loading conditions. The higher the exposure temperatures, the greater the decrease of ρ was observed. The chain scission occurred followed by post-curing at such temperatures [35].
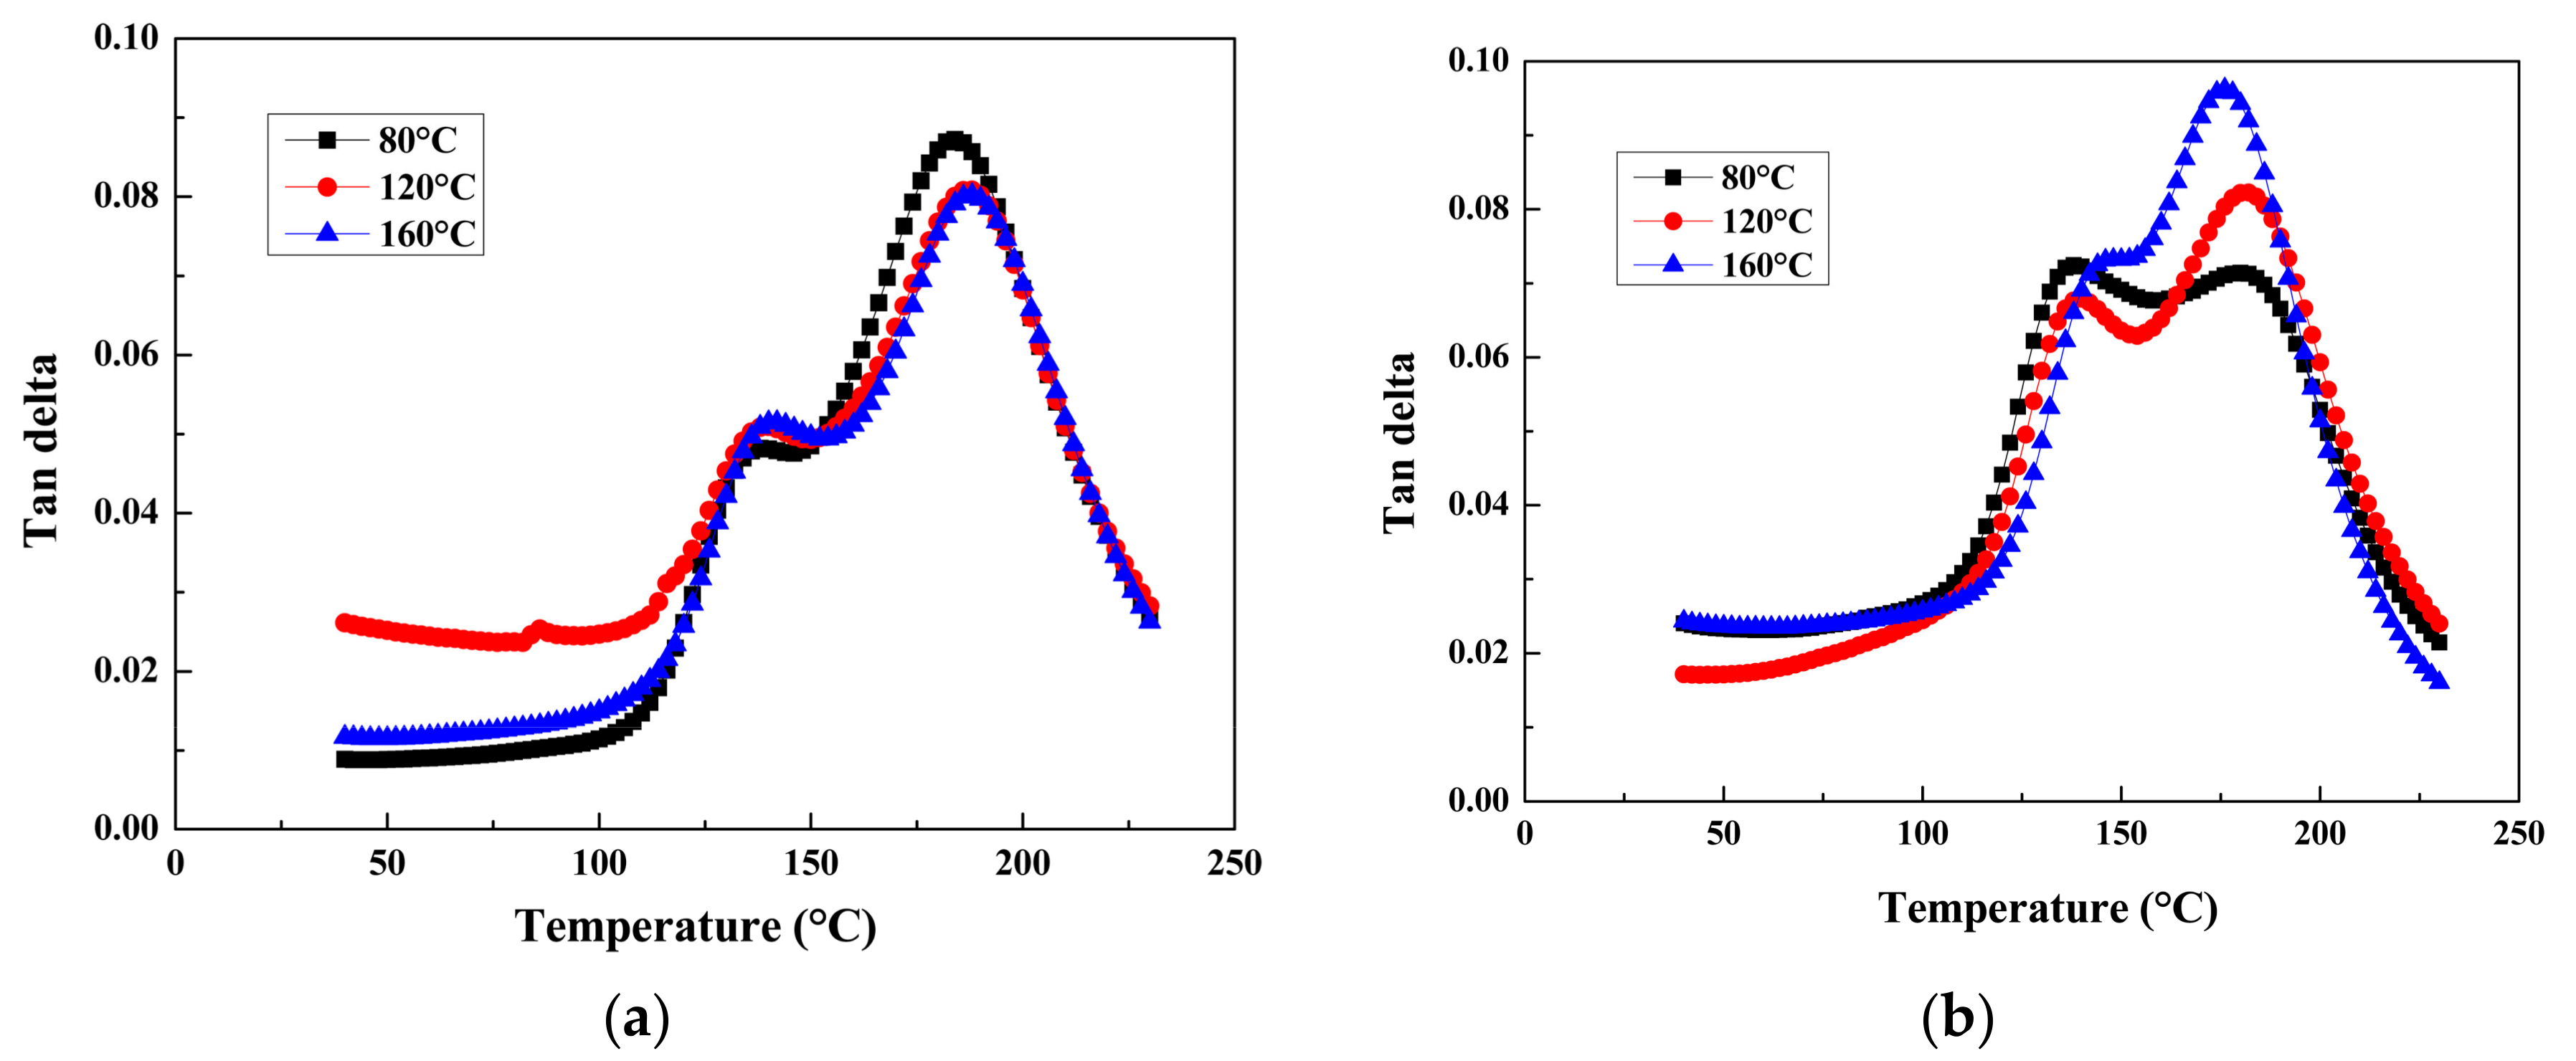
When two materials are combined together to form a new composite, the properties of the composite are governed not only by the properties of the individual components but also by the interface between them [36]. The interface effects and adhesion degree are very important for determining the damping behavior of composites. Figure 12 plots the tan δ curves for the BFRP at various temperatures. As shown, a shoulder can be found from the BFRP specimens. The shoulder obtained from tan δ of the BFRP specimen is assigned to the sizing agent in the interface zone between the basalt fibers and resin matrix. The curves of tan δ shifted to the left as the temperature increased, and the height increased from 0.07247 to 0.08232 and 0.09626 as the exposure temperature increased from 80 °C to 160 °C. Elevated temperature exposure leads to the oxidation of methylene, which may form voids in the specimens, and introduce cracks and/or delamination of the plates [7]. For a weak interface, more energy is dissipated during the test. The higher the damping, the weaker the interfacial adhesion [37]. It is evident that the elevated temperatures and stress cause the interface damage.
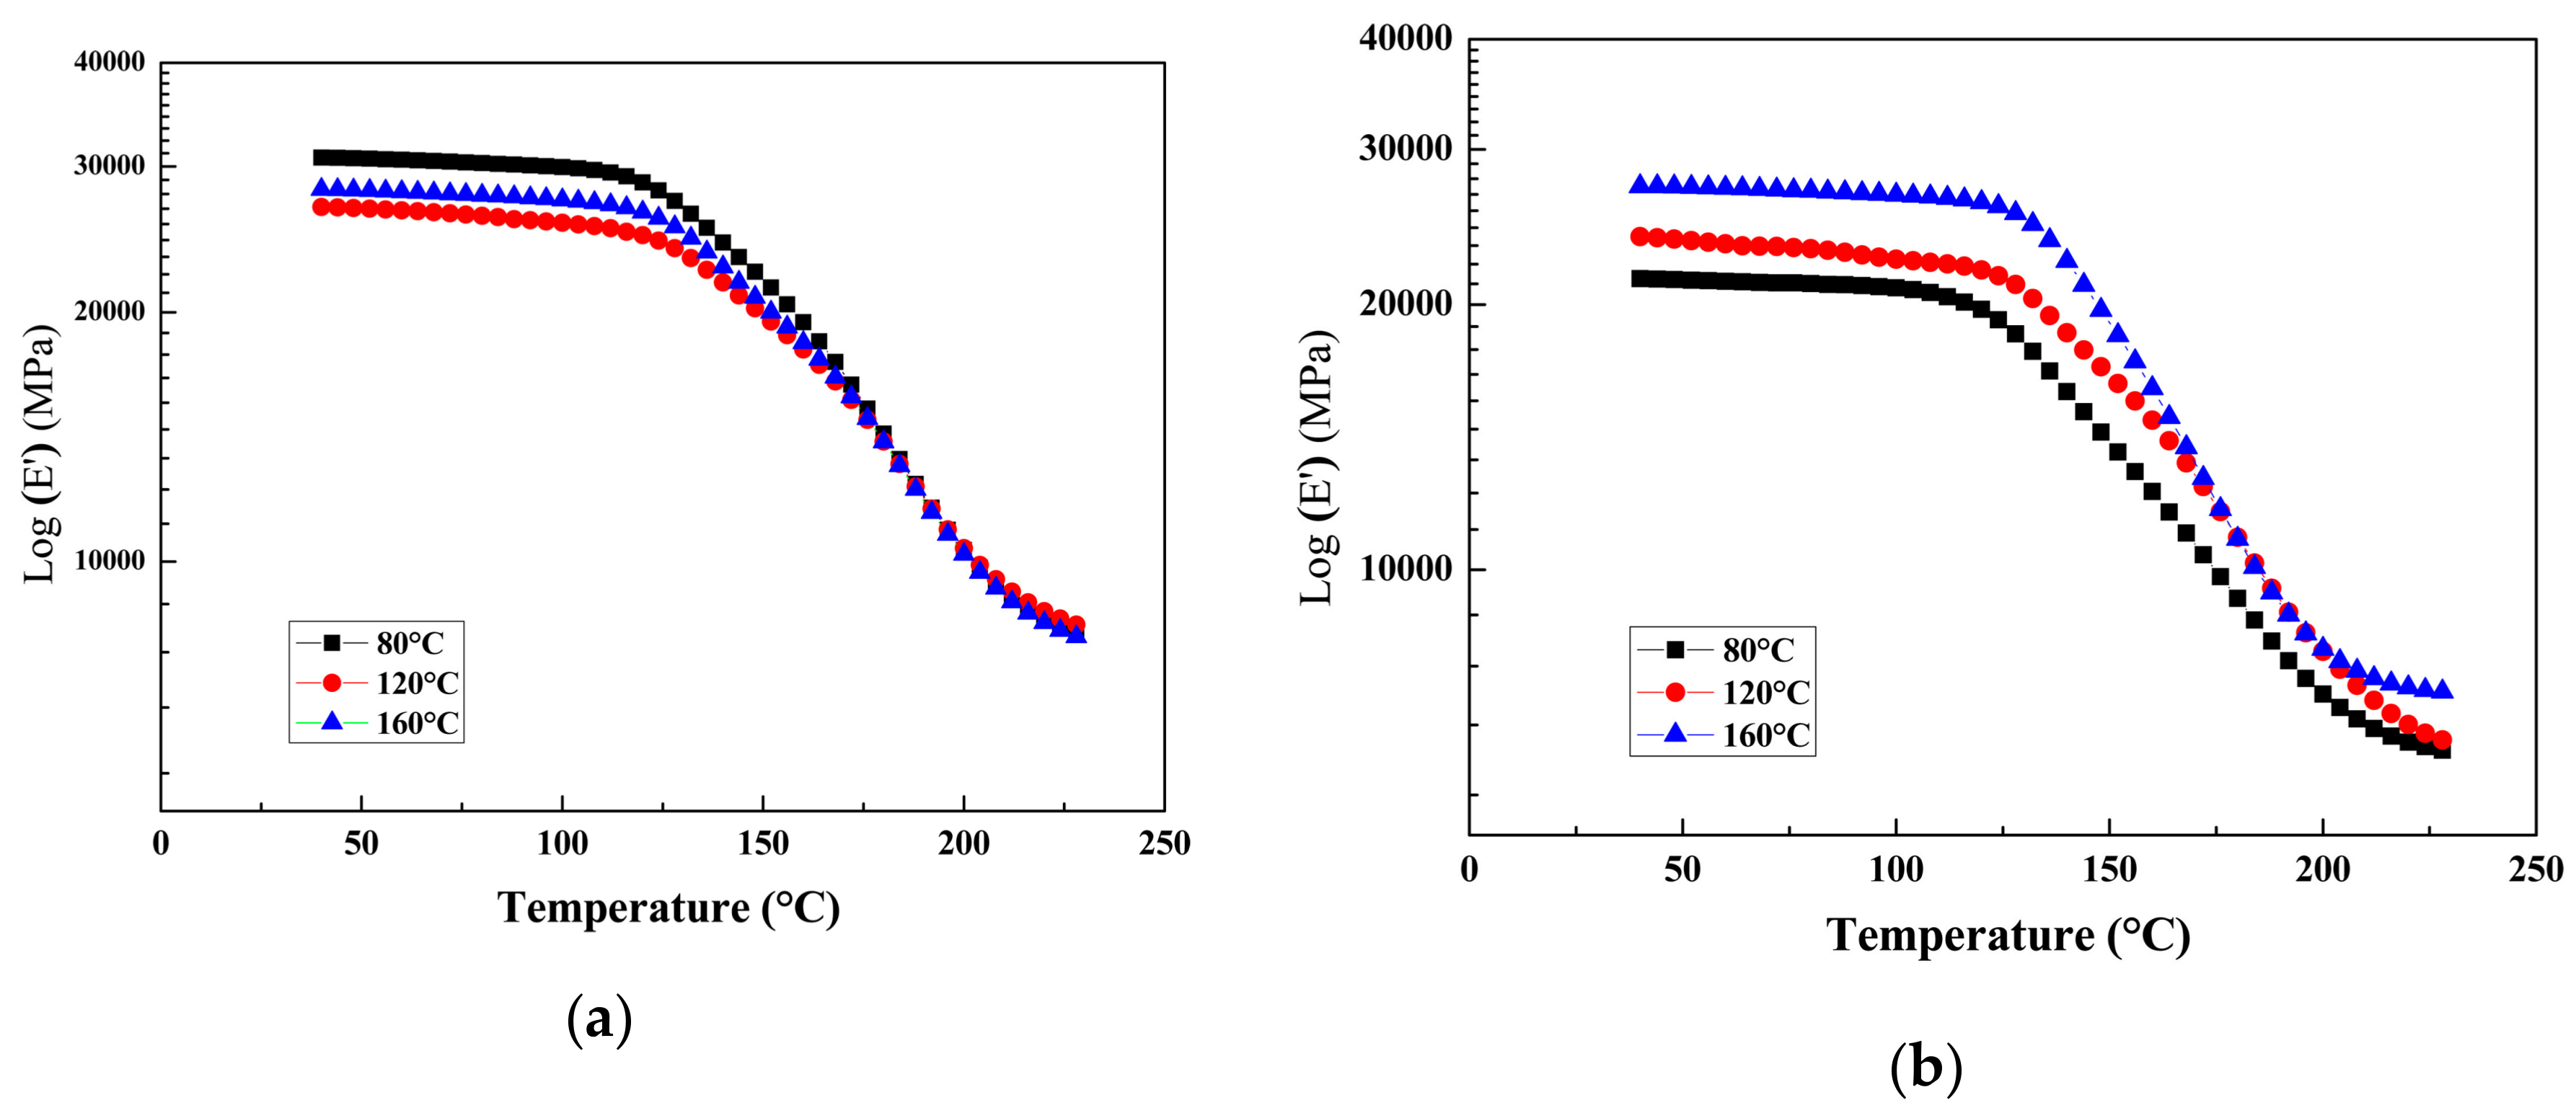
The variations of the storage modulus for BFRP specimens as a function of temperature are shown in Figure 13. As shown, the storage modulus decreased to 21,399 MPa, 23,866 MPa, and 27,243 MPa from the initial value of 32,700 MPa. This decrease in the storage modulus can be attributed to the deteriorated interfacial adhesion between the fibers and the resin matrix [38] as well as the destroyed interfacial adhesion between the fibers and the matrix [7]. The results indicate that the sustained stress and elevated temperature leading to the interface damage is more evident than the post-cure.
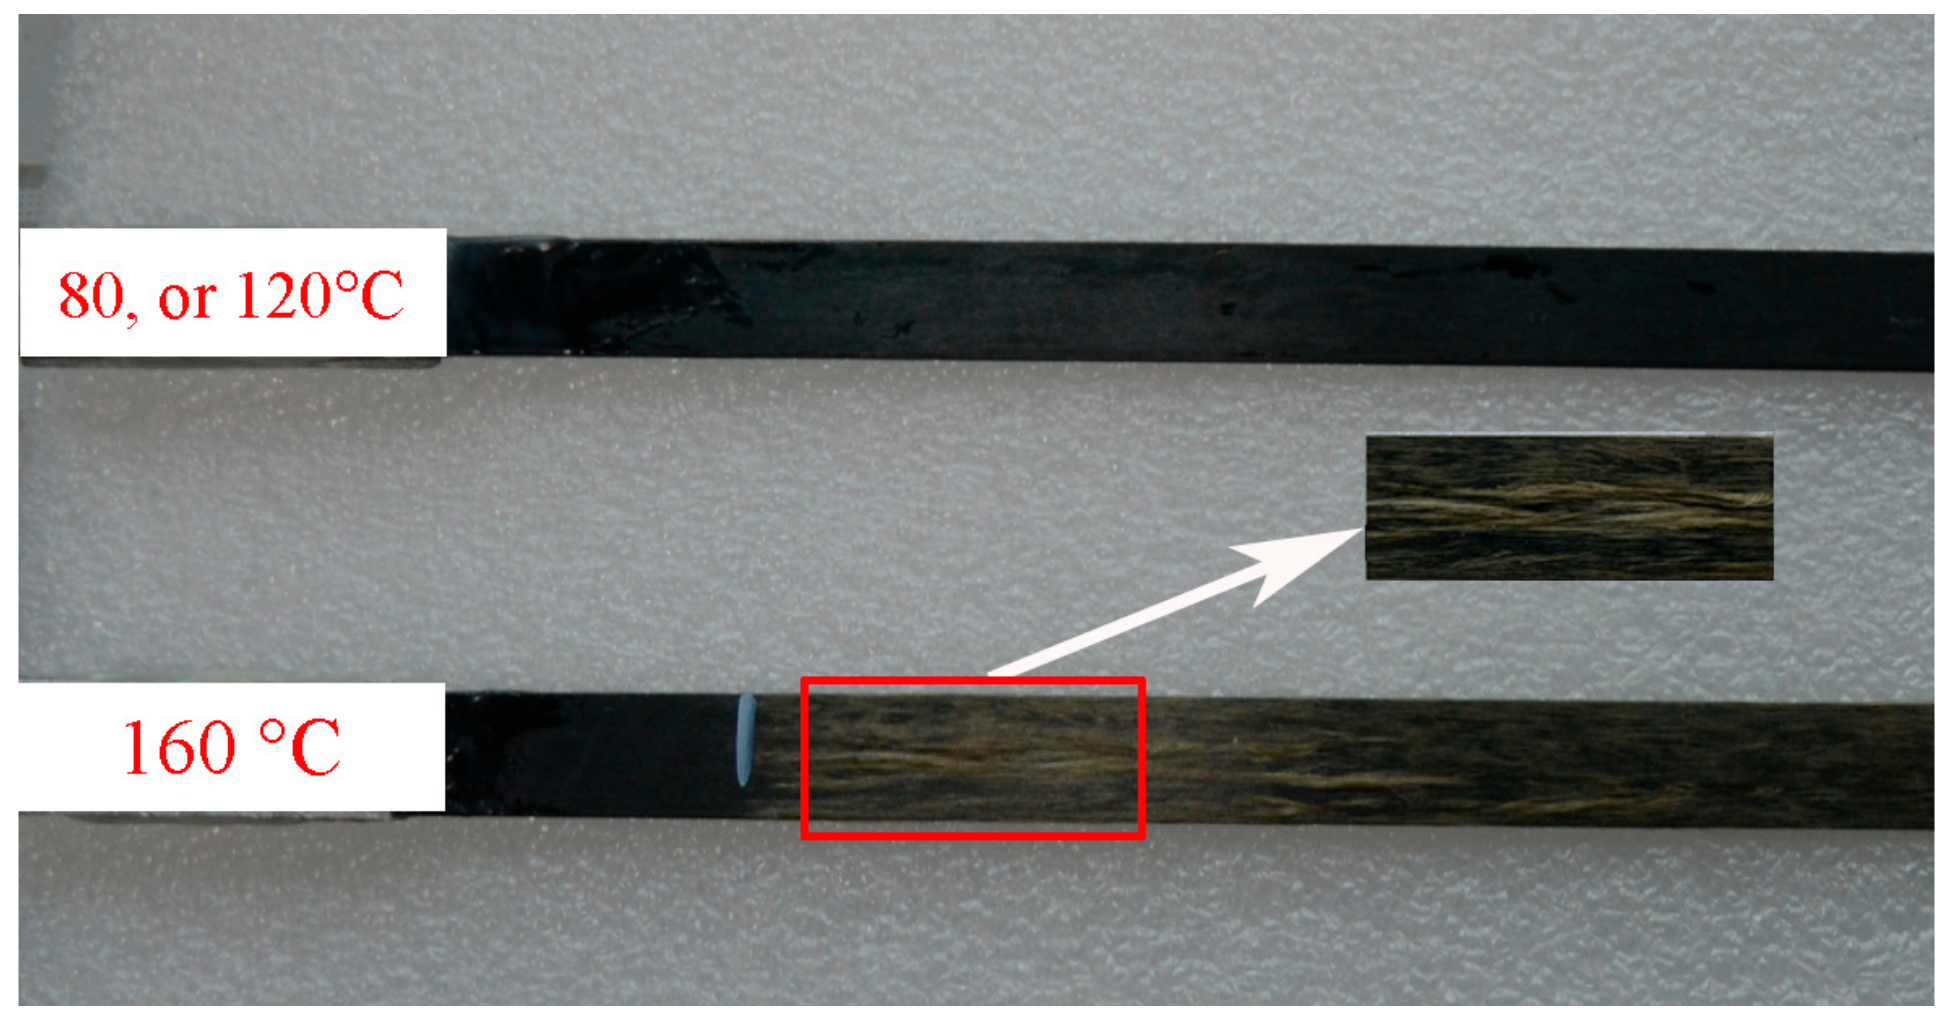
Figure 14 shows the morphology of BFRP specimens after exposure. The surface morphology of the specimens exposed to 80 °C or 120 °C showed no obvious change compared with the control specimen, but the fiber bulged out of the surface for the specimens exposed to 160 °C. Once a crack begins to form at a flaw, the polymer chains in that range reorient in response to both the applied load and the reduced cross-sectional area or the stress concentration at that point due to the flaw [38]. That is, the chains align in the direction of the applied force to better carry the load. Cracking will occur and can be observed from outside; a spontaneous fiber fracture will induce debonding along the fiber-matrix interface and/or matrix cracking [39].
ILSS degradation was performed on BFRP specimens after exposure at elevated temperatures and constant loading conditions. As shown, ILSS decreased as exposure temperatures increased. For the condition without loading, ILSS decreased by 0.5%, 13.6%, and 14.6% for 80 °C, 120 °C, and 160 °C exposure from its original value of 73.5 MPa, respectively. With respect to the 35% fu condition, ILSS decreased by 0.4%, 16.1%, and 20.8% gradually from the original value. It must also be noted that the exposure temperature and sustained stress causes irreversible degradation in the form of fiber-matrix interfacial debonding [17]. The low molecular weight of the sizing agent is expected to plasticize the surrounding resin, resulting in the shoulder of the tan δ curve [7]. The deterioration of ILSS may be due to those reasons.
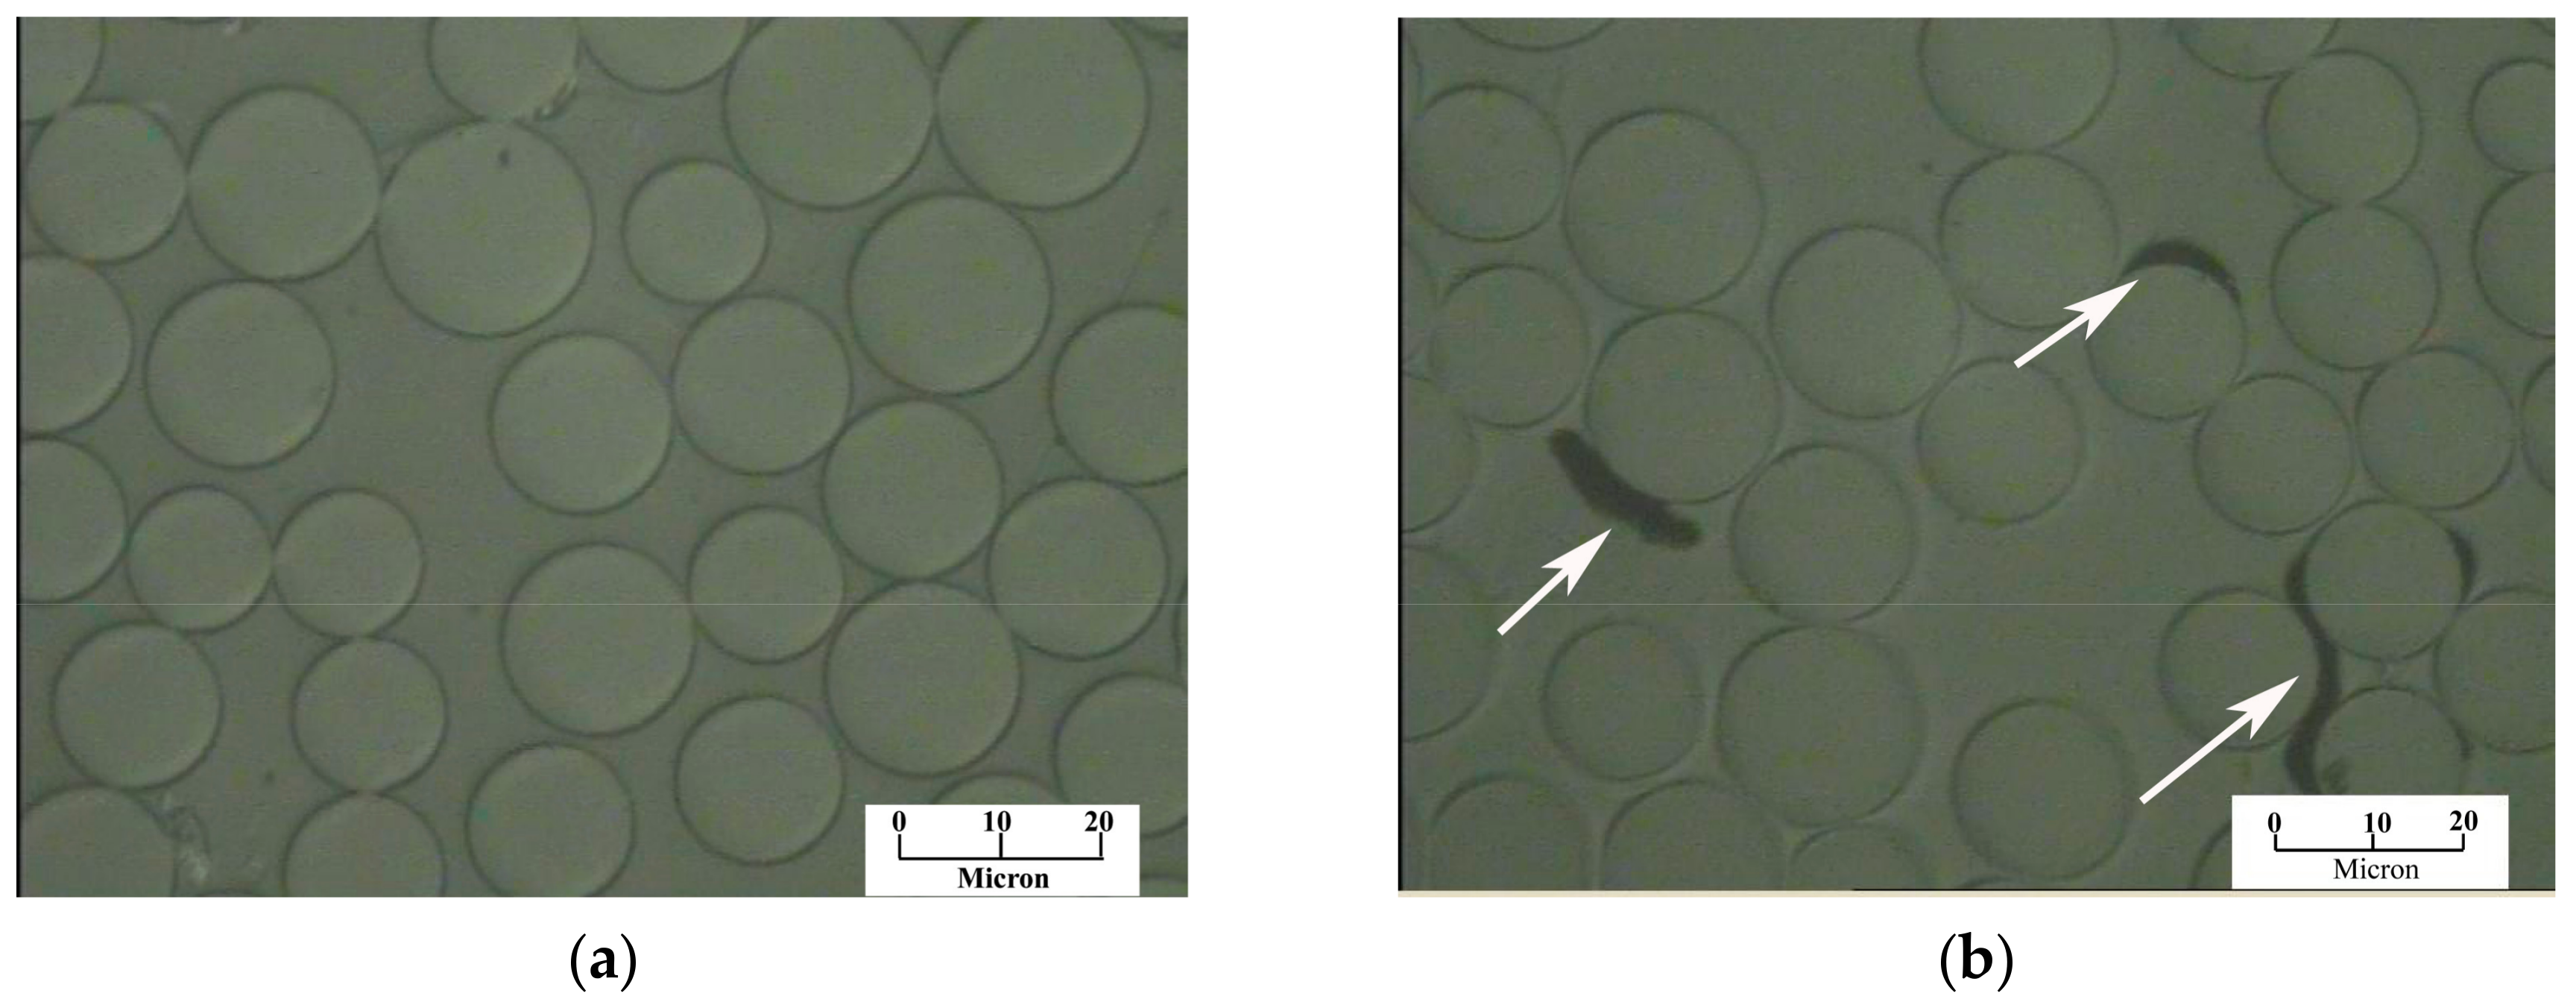
Figure 15 shows the cross-section obtained by a microscope of the exposed BFRP specimens at 160 °C. No obvious change was found for the specimens in the core part. As the temperature increased, the resin matrix softened, and internal stress released the fiber out the restraint of the epoxy resin. This phenomenon indicates that the destruction is from the surface to the inside, gradually accompanied with the internal stress release [18].
3.5. Interface Performance Analysis
The higher the damping, the weaker the interfacial adhesion [37]. A method for measuring the quality of the interfacial adhesion in reinforced rubber through energy dissipation measurements is based upon the following relationship [40]:
where tan δin is the internal energy dissipation from the interface, tan δs is the effective loss tangent for a composite without consideration of the interface, and V represents the volume fraction. Subscripts m, c, and f refer to fiber, composite, and matrix, respectively. , where b and h are the width and thickness of the specimen. M is the mass of the specimen, and k is stiffness coefficient. All parameters are listed in Table 5.
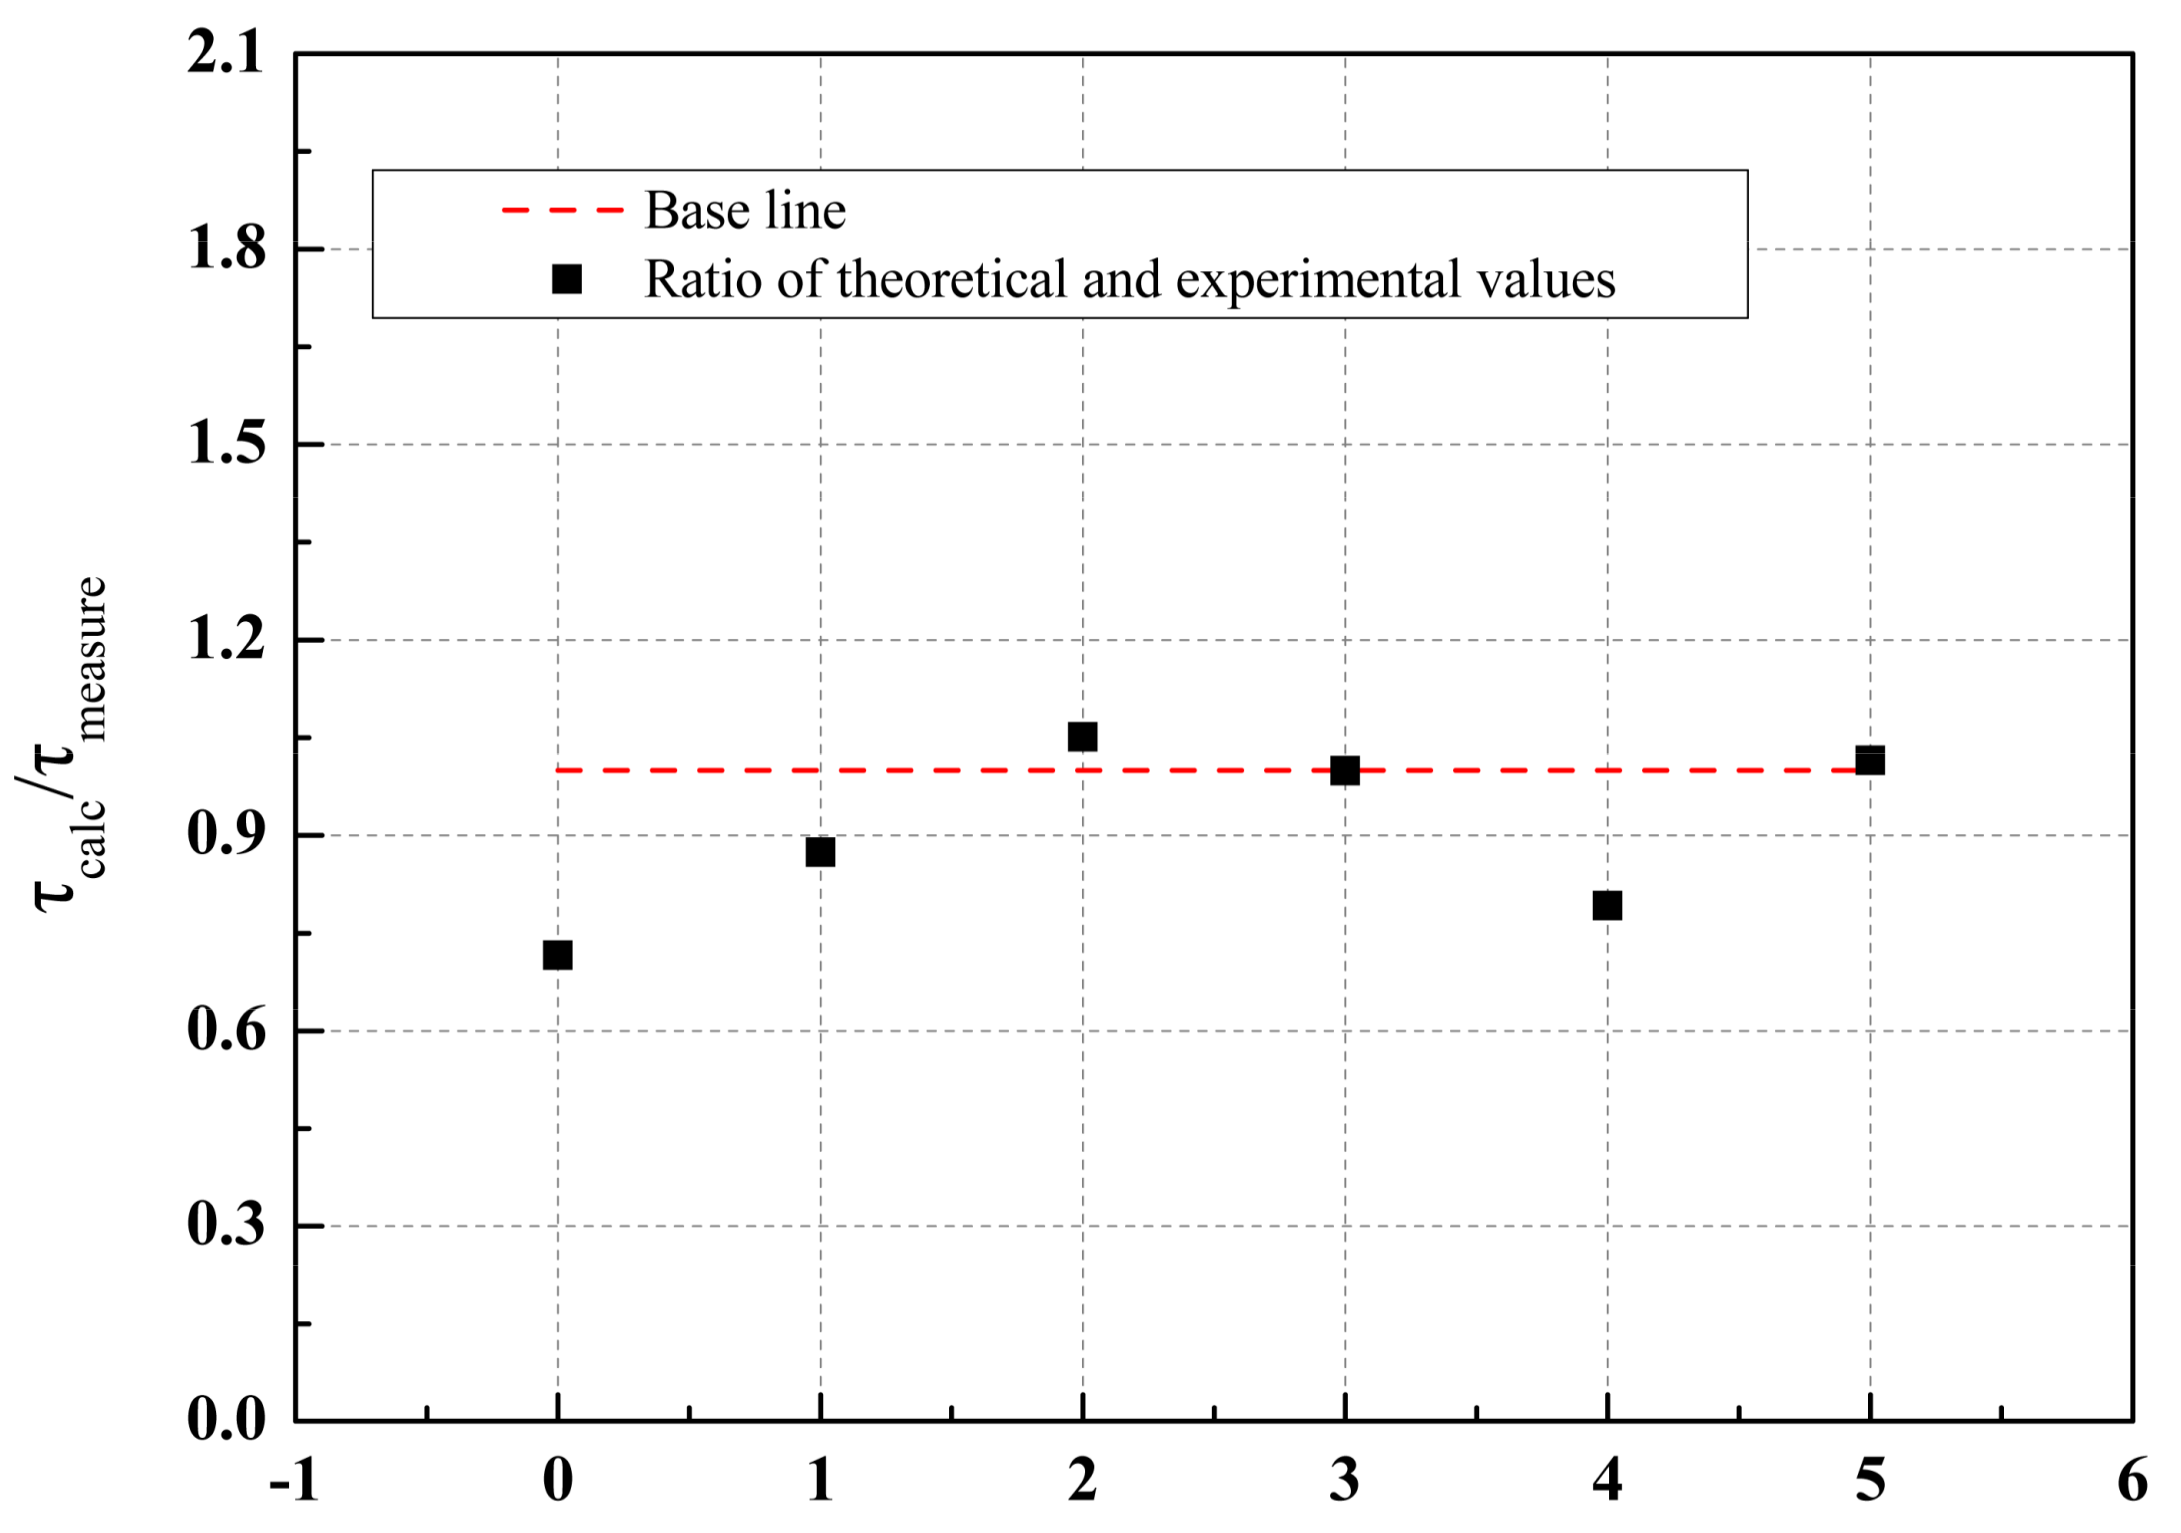
This comparison is graphically illustrated in Figure 16. Compared with the test results and theoretical results, a similar trend can be found for the specimens under loading conditions. As internal flaws develop for the specimens at elevated temperatures without loading [35], the theoretical value is higher than the experimental value.
4. Conclusions
The creep behavior of BFRP and resin matrix at elevated temperatures and the residual properties of the specimens were examined in the present paper. The conclusions drawn from the experimental results and discussion are as follows.
- (1)
- At elevated temperatures, the creep deformation is much larger than that at 25 °C. With combined loading and high temperature, when the strain reached the ultimate strain of 16%, the specimen would be subject to rupture failure. The creep behavior of the matrices performs completely differently for the cases of 80 °C and 120 °C; the first increased with time, first, and then gradually decreased, while the second increased continuously, due to the temperature before and after the glass transition temperature.
- (2)
- As the exposure temperatures exceeded the glass transition temperature of the BFRP specimens, the resin matrix attained sufficient mobility to transfer the stress to the fiber. Due to the unevenness of each bundle of fibers, the interior stress released, and irreversible damage occurred, which led to the interface between the fiber and resin matrix being damaged. Interlaminar shear strength (ILSS) degradation can be evaluated based on the tan delta of the resin matrix and the BFRP specimens.
- (3)
- Molecular chain scission and post-cure are independent processes. Sustained load is beneficial to post-curing for the epoxy resin, even though irreversible damage occurred between the basalt fiber and the epoxy resin.
Acknowledgments
This work was financially supported by NSFC with Grant Nos. 51478145.
Author Contributions
Zhongyu Lu designed and performed the experiments; and Guijun Xian conducted the analytical study and data analysis. All authors wrote the paper.
Conflicts of Interest
The authors declare no conflict of interest.
References
- Terrasi, G.; Meier, U.; Affolter, C. Long-Term Bending Creep Behavior of Thin-Walled CFRP Tendon Pr etensioned Spun Concrete Poles. Polymers 2014, 6, 2065–2081. [Google Scholar] [CrossRef]
- Lu, Z.; Xian, G.; Li, H. Effects of elevated temperatures on the mechanical properties of basalt fibers and BFRP plates. Constr. Build. Mater. 2016, 127, 1029–1036. [Google Scholar] [CrossRef]
- Wu, G.; Wang, X.; Wu, Z.S.; Dong, Z.Q.; Zhang, G.C. Durability of basalt fibers and composites in corrosive environments. J. Compos. Mater. 2015, 49, 873–887. [Google Scholar] [CrossRef]
- Wu, G.; Shi, J.; Seracino, R.; Wu, Z.S.; Zhu, H. Bond Behavior between Basalt Fiber–Reinforced Polymer Sheet and Concrete Substrate under the Coupled Effects of Freeze-Thaw Cycling and Sustained Load. J. Compos. Constr. 2013, 17, 530–542. [Google Scholar]
- Adelzadeh, M.; Hajiloo, H.; Green, M. Numerical Study of FRP Reinforced Concrete Slabs at Elevated Temperature. Polymers 2014, 6, 408–422. [Google Scholar] [CrossRef]
- Gao, W.Y.; Dai, J.-G.; Teng, J.G. Simple Method for Predicting Temperatures in Insulated, FRP-Strengthened RC Members Exposed to a Standard Fire. J. Compos. Constr. 2015, 19, 04015013. [Google Scholar] [CrossRef]
- Lu, Z.; Xian, G.; Li, H. Effects of exposure to elevated temperatures and subsequent immersion in water or alkaline solution on the mechanical properties of pultruded BFRP plates. Compos. B Eng. 2015, 77, 421–430. [Google Scholar] [CrossRef]
- Bellakehal, H.; Zaidi, A.; Masmoudi, R.; Bouhicha, M. Behavior of FRP Bars-Reinforced Concrete Slabs under Temperature and Sustained Load Effects. Polymers 2014, 6, 873–889. [Google Scholar] [CrossRef]
- Ascione, L.; Berardi, V.P.; D’aponte, A. Creep phenomena in FRP materials. Mech. Res. Commun. 2012, 43, 15–21. [Google Scholar] [CrossRef]
- Burke, P.J.; Bisby, L.A.; Green, M.F. Effects of elevated temperature on near surface mounted and externally bonded FRP strengthening systems for concrete. Cem. Concr. Compos. 2013, 35, 190–199. [Google Scholar] [CrossRef]
- Dutta, P.K.; Hui, D. Creep rupture of a GFRP composite at elevated temperatures. Comput. Struct. 2000, 76, 153–161. [Google Scholar] [CrossRef]
- Amiri, A.; Yu, A.; Webster, D.; Ulven, C. Bio-Based Resin Reinforced with Flax Fiber as Thermorheologically Complex Materials. Polymers 2016, 8, 153. [Google Scholar] [CrossRef]
- Goertzen, W.K.; Kessler, M.R. Creep behavior of carbon fiber/epoxy matrix composites. Mater. Sci. Eng. A 2006, 421, 217–225. [Google Scholar] [CrossRef]
- Wei, B.; Cao, H.; Song, S. Environmental resistance and mechanical performance of basalt and glass fibers. Mater. Sci. Eng. A 2010, 527, 4708–4715. [Google Scholar] [CrossRef]
- Greco, A.; Maffezzoli, A.; Casciaro, G.; Caretto, F. Mechanical properties of basalt fibers and their adhesion to polypropylene matrices. Compos. B Eng. 2014, 67, 233–238. [Google Scholar] [CrossRef]
- Morozov, N.N.; Bakunov, V.S.; Morozov, E.N.; Aslanova, L.G.; Granovskii, P.A.; Prokshin, V.V.; Zemlyanitsyn, A.A. Materials Based on Basalts from the European North of Russia. Glass Ceram. 2001, 58, 100–104. [Google Scholar] [CrossRef]
- Shi, J.Z.; Wang, X.; Wu, Z.S.; Zhu, Z.G. Creep behavior enhancement of a basalt fiber-reinforced polymer tendon. Constr. Build. Mater. 2015, 94, 750–757. [Google Scholar] [CrossRef]
- Wang, X.; Shi, J.Z.; Liu, J.X.; Yang, L.; Wu, Z.S. Creep behavior of basalt fiber reinforced polymer tendons for prestressing application. Mater. Des. 2014, 59, 558–564. [Google Scholar] [CrossRef]
- Lu, Z.Y.; Xian, G.J.; Li, H. Experimental Study on the Mechanical Properties of Basalt Fibres and Pultruded BFRP Plates at Elevated Temperatures. Polym. Polym. Compos. 2015, 23, 277–283. [Google Scholar]
- Song, R.; Muliana, A.H.; Palazotto, A. An empirical approach to evaluate creep responses in polymers and polymeric composites and determination of design stresses. Compos. Struct. 2016, 148, 207–223. [Google Scholar] [CrossRef]
- Al-Haik, M.; Vaghar, M.R.; Garmestani, H.; Shahawy, M. Viscoplastic analysis of structural polymer composites using stress relaxation and creep data. Compos. B Eng. 2001, 32, 165–170. [Google Scholar] [CrossRef]
- Crochon, T.; Li, C.; Lévesque, M. On time–temperature-dependent viscoelastic behavior of an amorphous polyimide. Mech. Time-Depend. Mater. 2015, 19, 305–324. [Google Scholar] [CrossRef]
- American Society for Testing and Materials. Standard Test Method for Tensile Properties of Plastics; ASTM International: West Conshohocken, PA, USA, 2000; pp. 1–13. [Google Scholar]
- Lu, Z.; Xian, G. Resistance of basalt fibers to elevated temperatures and water or alkaline solution immersion. Polym. Compos. 2016. [Google Scholar] [CrossRef]
- American Society for Testing and Materials. Standard Test Method for Tensile Properties of Polymer Matrix Composite Materials; ASTM International: West Conshohocken, PA, USA, 2000; pp. 1–10. [Google Scholar]
- American Society for Testing and Materials. Standard Test Method for Short-Beam Strength of Polymer Matrix Composite Materials and Their Laminates; ASTM International: West Conshohocken, PA, USA, 2006; pp. 1–8. [Google Scholar]
- Li, Y.; Kessler, M.R. Creep-resistant behavior of self-reinforcing liquid crystalline epoxy resins. Polymer 2014, 55, 2021–2027. [Google Scholar] [CrossRef]
- Browning, C.E. The mechanisms of elevated temperature property losses in high performance structural epoxy resin matrix materials after exposures to high humidity environments. Polym. Eng. Sci. 1978, 18, 16–24. [Google Scholar] [CrossRef]
- Jia, Y.; Peng, K.; Gong, X.-L.; Zhang, Z. Creep and recovery of polypropylene/carbon nanotube composites. Int. J. Plast. 2011, 27, 1239–1251. [Google Scholar] [CrossRef]
- Daver, F.; Kajtaz, M.; Brandt, M.; Shanks, R.A. Creep and Recovery Behaviour of Polyolefin-Rubber Nanocomposites Developed for Additive Manufacturing. Polymers 2016, 8, 437. [Google Scholar] [CrossRef]
- Bledzki, A.K.; Faruk, O. Creep and impact properties of wood fibre–polypropylene composites: Influence of temperature and moisture content. Compos. Sci. Technol. 2004, 64, 693–700. [Google Scholar] [CrossRef]
- Findley, W.N.; Lai, J.S.; Onaran, K. Creep and Relaxation of Nonlinear Viscoelastic Materials; North-Holland Publishiong Company: New York, NY, USA, 2013; pp. 11–17. [Google Scholar]
- Iijima, T.; Yoshioka, N.; Tomoi, M. Effect of cross-link density on modification of epoxy resins with reactive acrylic elastomers. Eur. Polym. J. 1992, 28, 573–581. [Google Scholar] [CrossRef]
- Yang, Y.M.; Xian, G.J.; Li, H.; Sui, L.L. Thermal aging of an anhydride-cured epoxy resin. Polym. Degrad. Stable 2015, 118, 111–119. [Google Scholar] [CrossRef]
- Lu, Z.Y.; Xian, G.J.; Li, H. Effects of thermal aging on the water uptake behavior of pultruded BFRP plates. Polym. Degrad. Stable 2014, 110, 216–224. [Google Scholar] [CrossRef]
- Goyanes, S.N.; König, P.G.; Marconi, J.D. Dynamic mechanical analysis of particulate-filled epoxy resin. J. Appl. Polym. Sci. 2003, 88, 883–892. [Google Scholar] [CrossRef]
- Dong, S.; Gauvin, R. Application of dynamic mechanical analysis for the study of the interfacial region in carbon fiber/epoxy composite materials. Polym. Compos. 1993, 14, 414–420. [Google Scholar] [CrossRef]
- Venkateshwaran, N.; Perumal, A.E.; Arunsundaranayagam, D. Fiber surface treatment and its effect on mechanical and visco-elastic behaviour of banana/epoxy composite. Mater. Des. 2013, 47, 151–159. [Google Scholar] [CrossRef]
- Sirivedin, S.; Fenner, D.N.; Nath, R.B.; Galiotis, C. Matrix crack propagation criteria for model short-carbon fibre/epoxy composites. Compos. Sci. Technol. 2000, 60, 2835–2847. [Google Scholar] [CrossRef]
- Gu, W. Interfacial Adhesion Evaluation of Uniaxial Fiber-Reinforced-Polymer Composites by Vibration Damping of Cantilever Beam; Virginia Polytechnic Institute and State University: Blacksburg, VA, USA, 1997; pp. 23–24. [Google Scholar]
Figure 1.
Chemical structures of the resin matrix system.

Figure 2.
Drawing draft of the mold for the resin matrix.
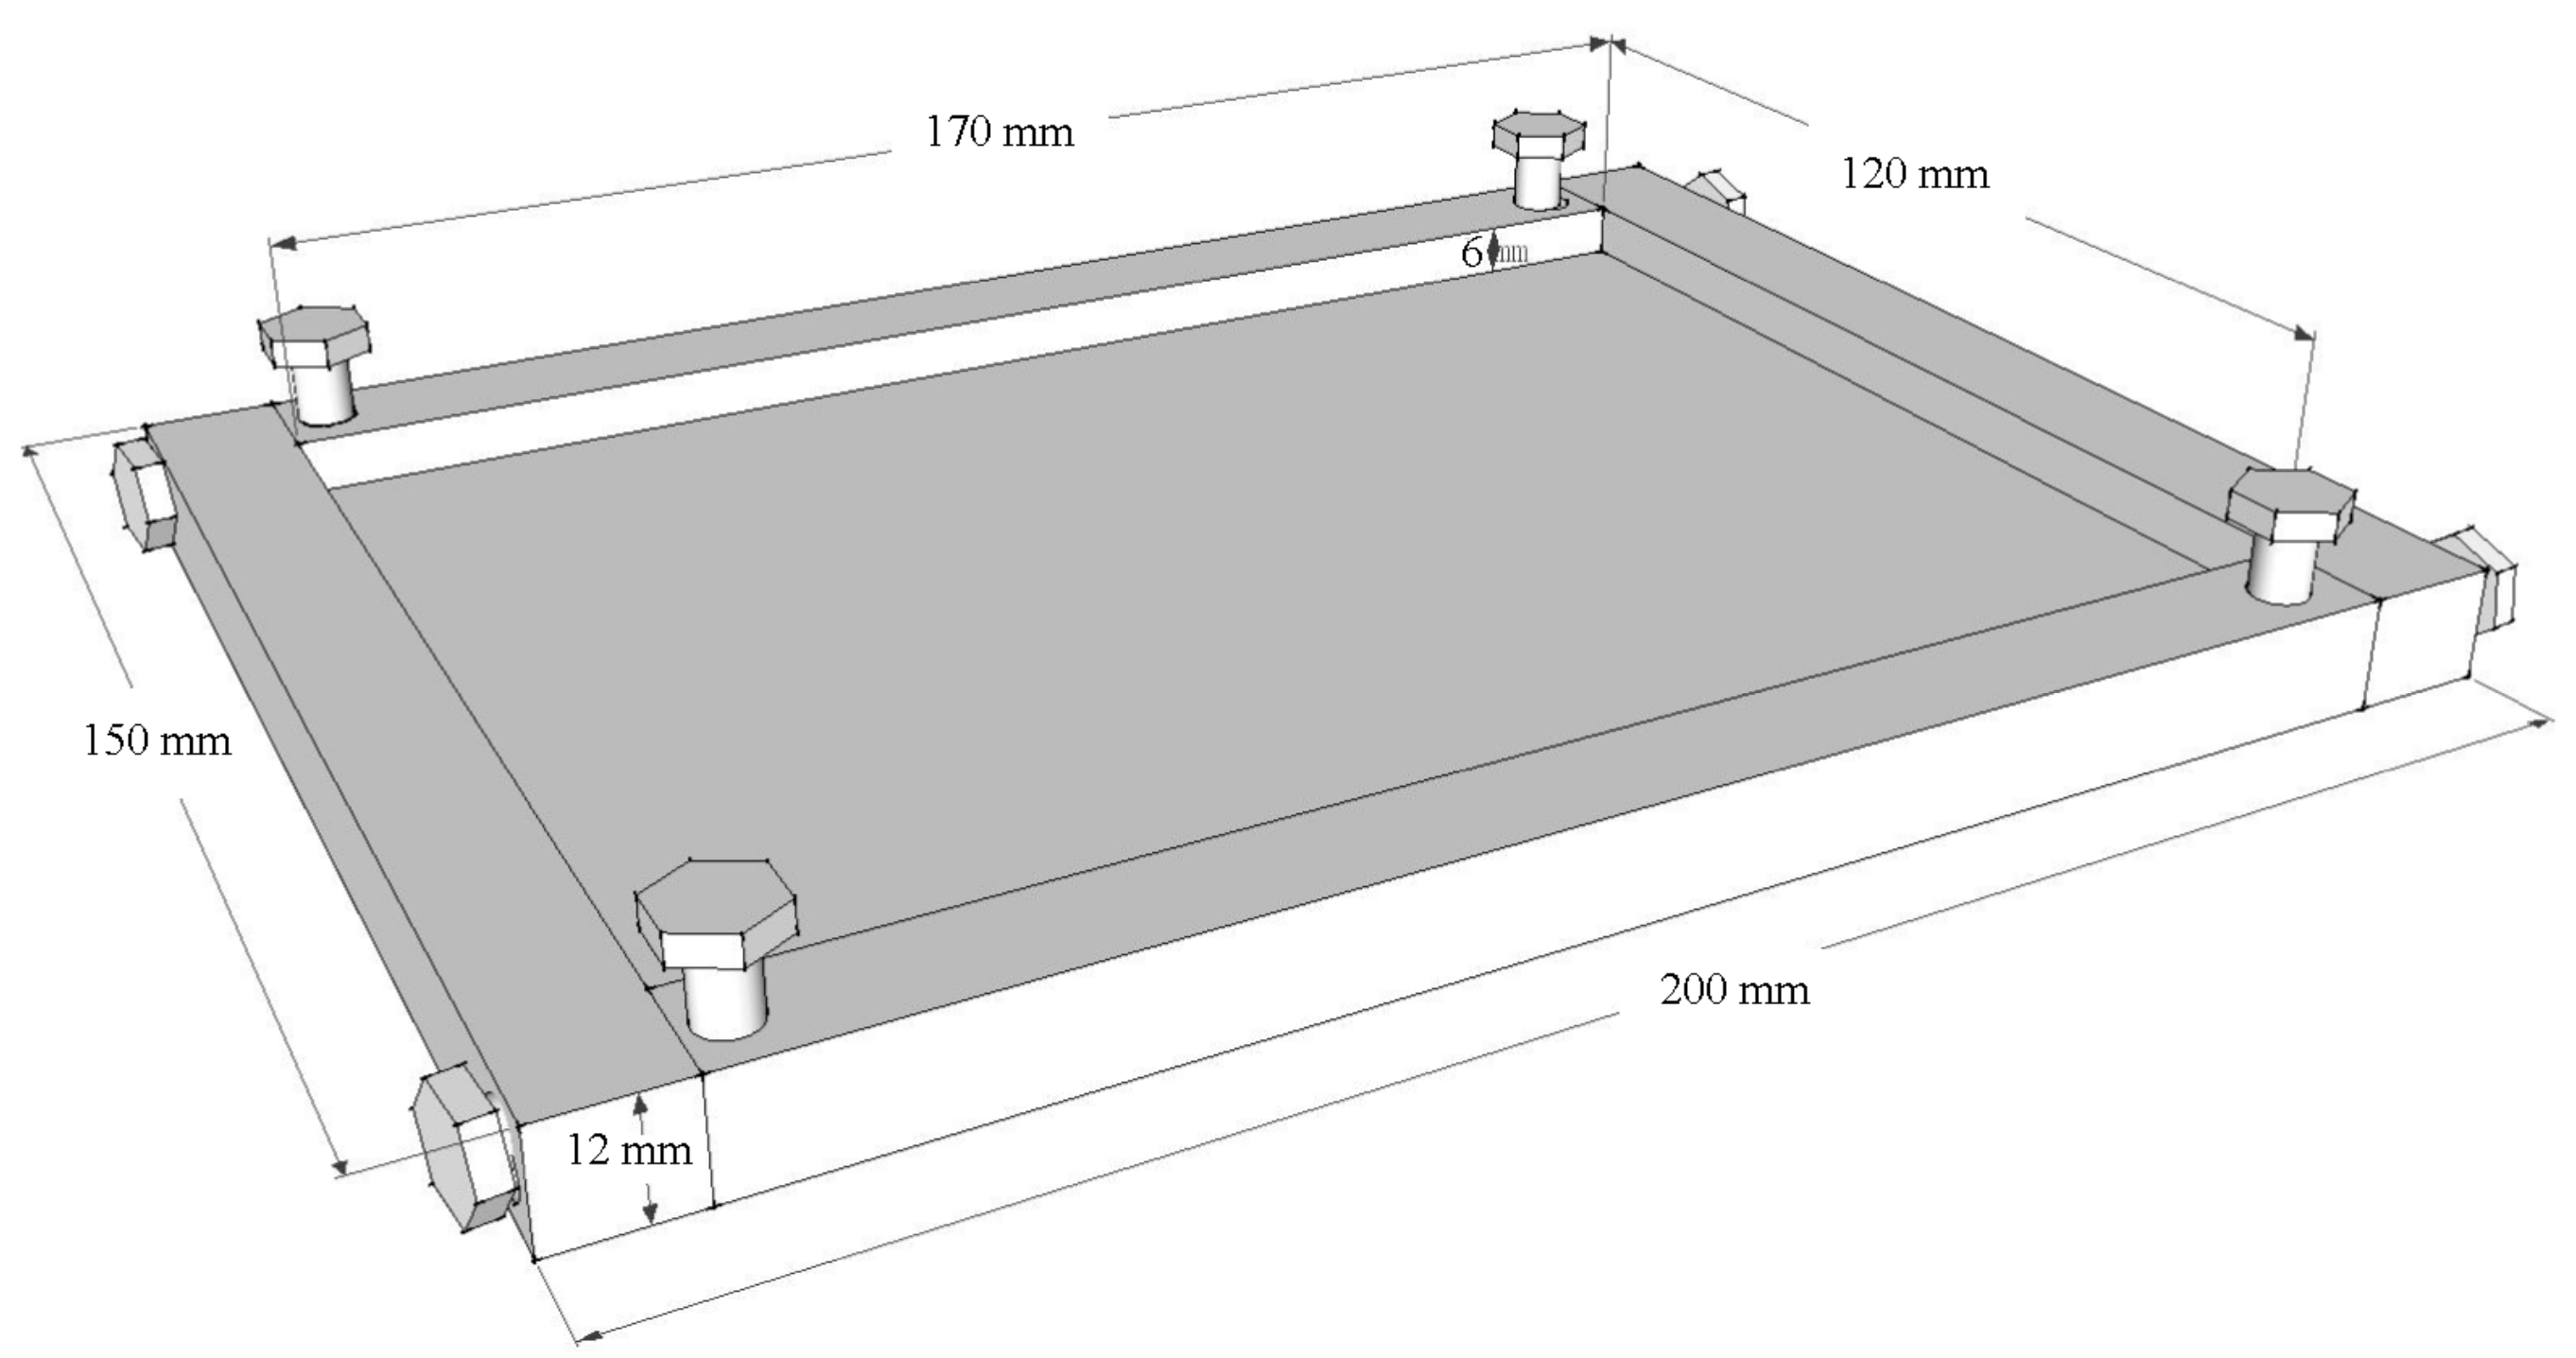
Figure 3.
Typical stress-strain curve of basalt fiber reinforced polymer (BFRP) specimens.

Figure 4.
Test setup for the resin matrix.

Figure 5.
Loading and temperature history for the specimens tested at 160 °C.

Figure 6.
BFRP specimens for the creep tests.
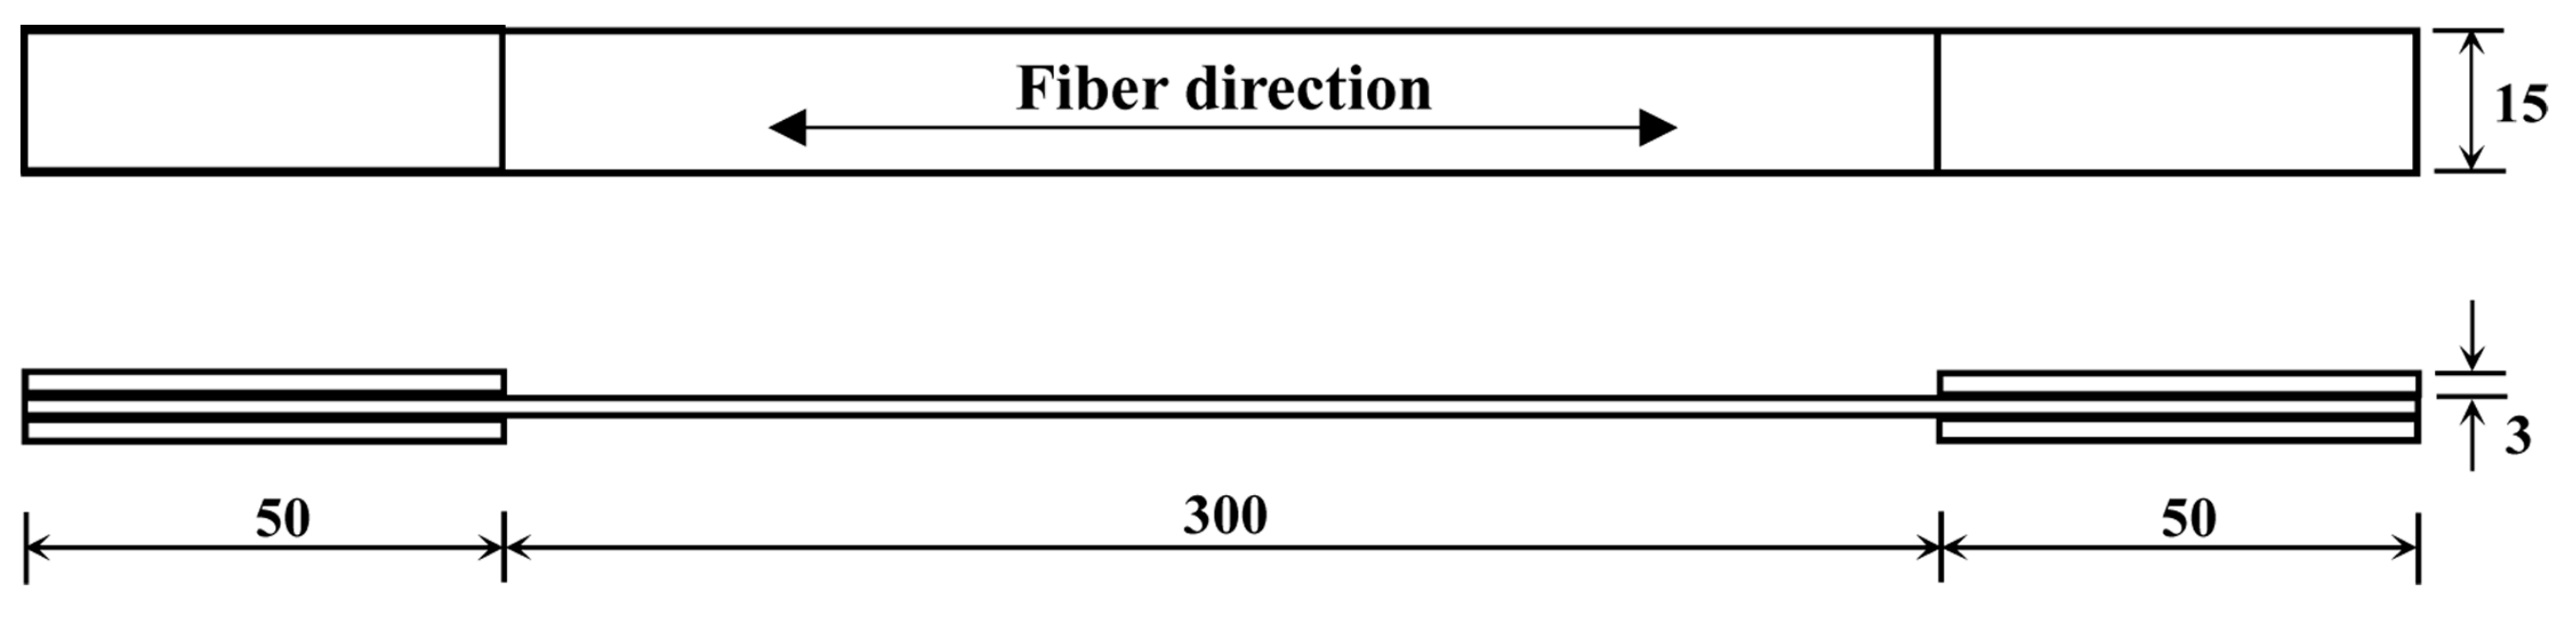
Figure 7.
Test setup for the BFRP specimens: (a) temperatures and load controller; and (b) oven.

Figure 8.
Strain curves of the epoxy resin at various exposure temperatures.
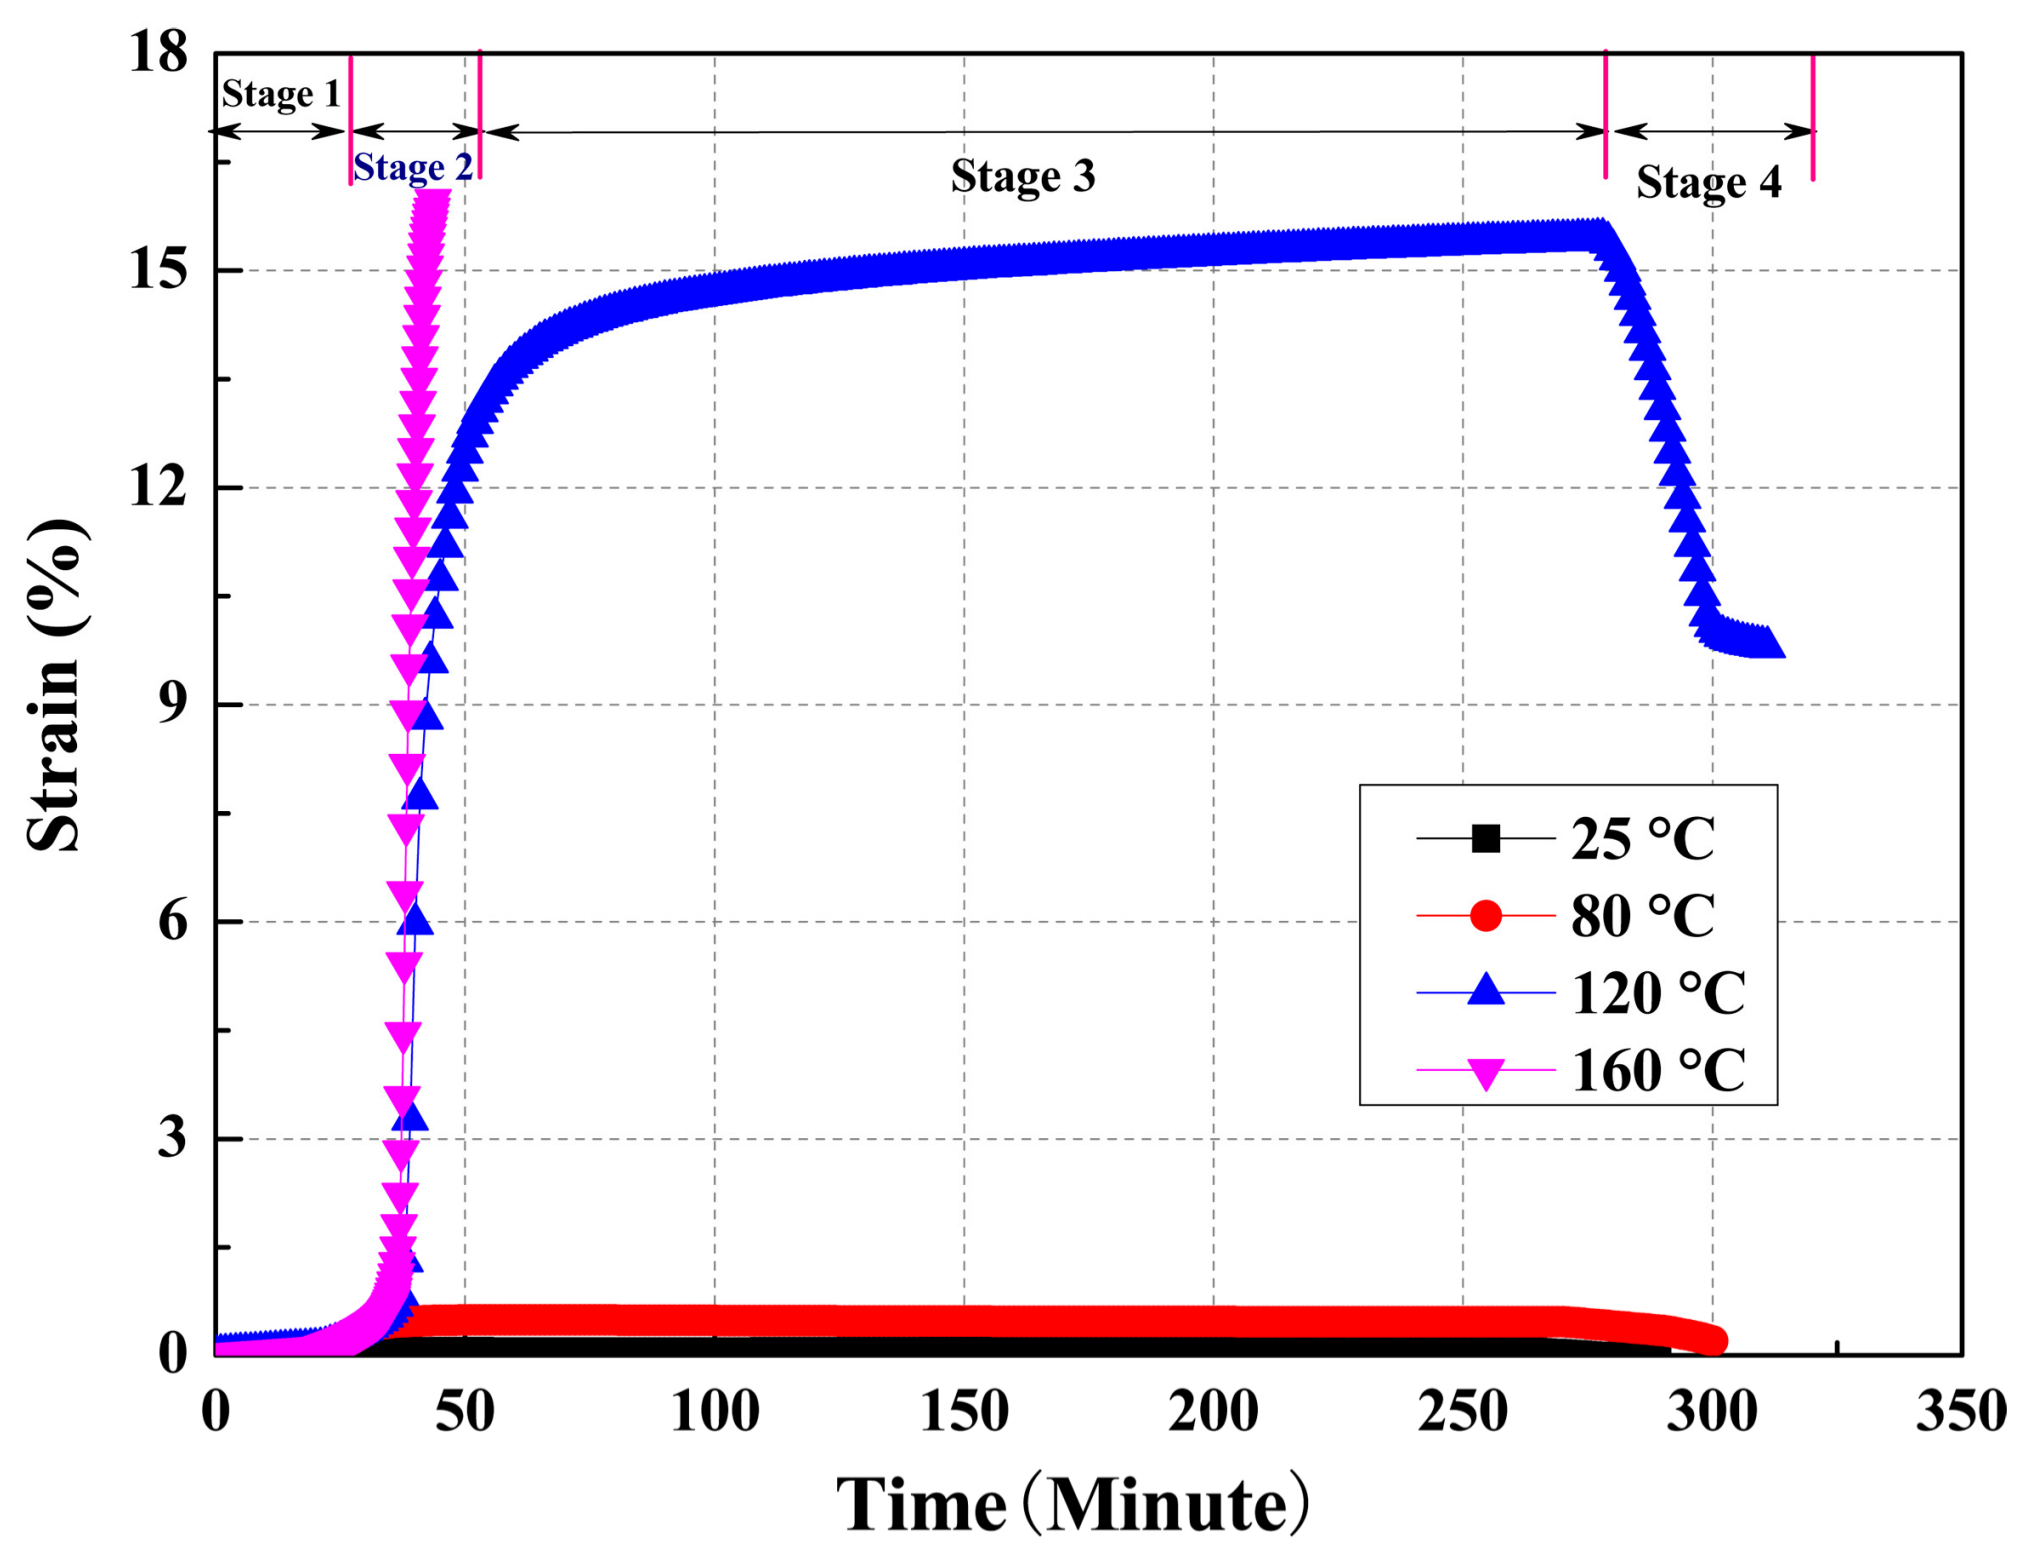
Figure 9.
The change of the strain for BFRP at various exposure temperatures.
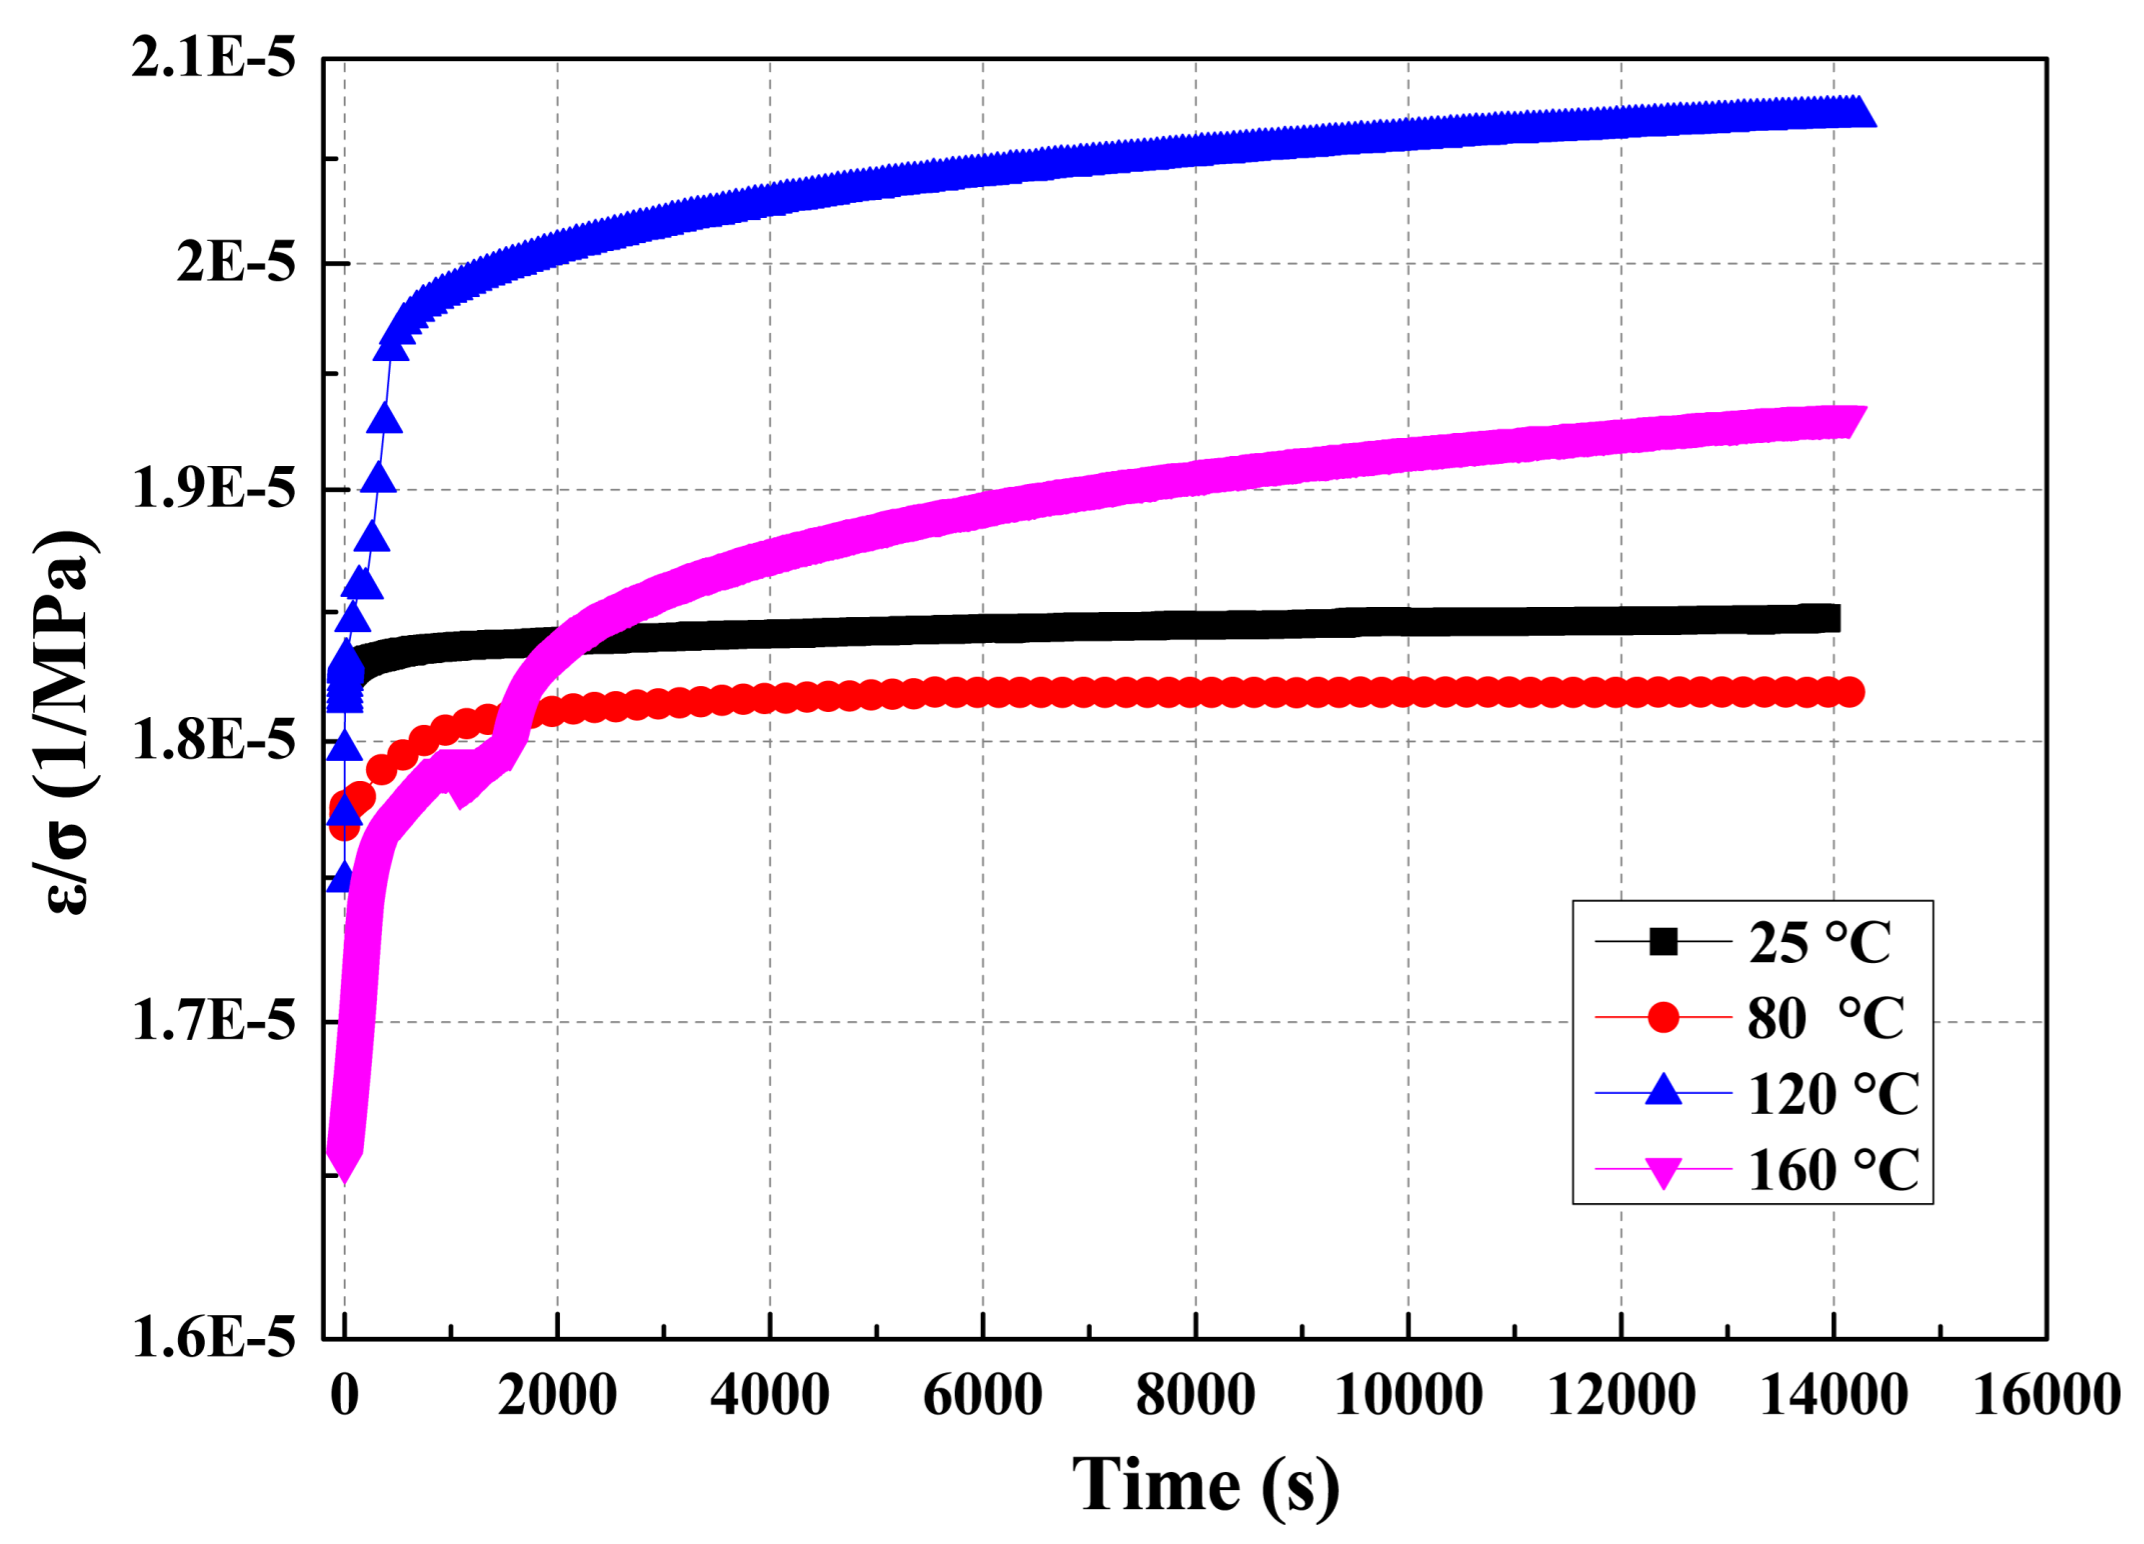
Figure 10.
Tan delta curves of the specimens: (a) specimens without loading; and (b) loaded specimens.
Figure 10.
Tan delta curves of the specimens: (a) specimens without loading; and (b) loaded specimens.

Figure 11.
Storage modulus curves of the matrix specimens: (a) specimens without loading; and (b) loaded specimens.
Figure 11.
Storage modulus curves of the matrix specimens: (a) specimens without loading; and (b) loaded specimens.

Figure 12.
Tan delta curves of BFRP at various temperatures: (a) without loading; and (b) 35% fu.

Figure 13.
Storage modulus curves of BFRP at various temperatures: (a) without loading; and (b) 35% fu.
Figure 13.
Storage modulus curves of BFRP at various temperatures: (a) without loading; and (b) 35% fu.

Figure 14.
The morphology of the BFRP specimens after exposure.

Figure 15.
Typical cracks formed in BFRP specimens observed on the polished cross-section: (a) 80 °C or 120 °C exposure; and (b) 160 °C exposure.
Figure 15.
Typical cracks formed in BFRP specimens observed on the polished cross-section: (a) 80 °C or 120 °C exposure; and (b) 160 °C exposure.

Figure 16.
Comparison between the test results and the calculation results.


Table 1.
Mechanical properties of basalt and E-glass fibers.
| Fibers | Diameter (μm) | Tensile Strength (GPa) | Tensile Modulus (GPa) | Elongation at Break (%) | Service Temperature |
|---|---|---|---|---|---|
| Basalt | 6~21 | 3.0~4.8 | 79.3~93.1 | 3.1 | 270 °C~700 °C |
| E-glass | 6~21 | 3.1~3.8 | 72.5~75.5 | 4.7 | −50 °C~380 °C |
Table 2.
Characteristics of the epoxy resin from the creep test.
| Temperatures | με (t = 0) | Με (t = 4 h) | Increasing before Stable Increase | Exposure Time at the Knee Point (s) | Strain Increment (με) |
|---|---|---|---|---|---|
| 25 °C | 499 | 679 | 37 | 0 | 180 |
| 80 °C | 485 | 3625 | 4642 | 1740 | 1017 |
| 120 °C | 491 | 154,300 | 135,100 | 2880 | 153,908 |
| 160 °C | 490 | - | - | - | - |
Table 3.
Characteristics of the BFPR specimen from the creep test.
| Temperatures | με (t = 0) | Με (t = 4 h) | Increasing before Stable Increase | Exposure Time at the Knee Point (s) | Strain Increment (με) |
|---|---|---|---|---|---|
| 25 °C | 9477 | 9608 | 92 | 1244 | 131 |
| 80 °C | 9197 | 9457 | 150 | 1349 | 260 |
| 120 °C | 9094 | 10,772 | 852 | 1337 | 1678 |
| 160 °C | 8566 | 10,041 | 1034 | 2072 | 1475 |
Table 4.
Variation of the cross-linking density (mol/cm3) of the specimens.
| Specimens | Load Levels | 25 °C | 80 °C | 120 °C | 160 °C |
|---|---|---|---|---|---|
| Epoxy resin | 0 N | 5.78 × 10⁻³ | 5.56 × 10⁻³ | 5.53 × 10⁻³ | 5.78 × 10⁻³ |
| 10 N | 5.32 × 10⁻³ | 5.51 × 10⁻³ | 5.79 × 10⁻³ | - | |
| BFRP | 0 N | 0.88 | 0.69 | 0.68 | 0.66 |
| 9500 N | 0.88 | 0.52 | 0.56 | 0.61 |
Table 5.
Parameters and calculation results of interlaminar shear strength (ILSS).
| Status | Temperature | tan δc | tan δm | Em (GPa) | Ec (GPa) | τmeasure (Mpa) | τcalc (Mpa) |
|---|---|---|---|---|---|---|---|
| Without loading | 80 °C | 0.0872 | 1.16 | 2.79 | 56.5 | 73.10 | 57.93 |
| 120 °C | 0.0809 | 1.163 | 2.80 | 57.6 | 63.54 | 63.48 | |
| 160 °C | 0.0802 | 1.143 | 3.00 | 56.4 | 62.74 | 65.94 | |
| Loading | 80 °C | 0.0725 | 1.137 | 2.86 | 56.28 | 73.21 | 74.32 |
| 120 °C | 0.0919 | 1.168 | 2.80 | 58.03 | 61.68 | 53.91 | |
| 160 °C | 0.0963 | - | - | 53.06 | 58.24 | 41.71 |
© 2017 by the authors. Licensee MDPI, Basel, Switzerland. This article is an open access article distributed under the terms and conditions of the Creative Commons Attribution (CC BY) license (http://creativecommons.org/licenses/by/4.0/).
Share and Cite
MDPI and ACS Style
Lu, Z.; Xian, G.; Rashid, K. Creep Behavior of Resin Matrix and Basalt Fiber Reinforced Polymer (BFRP) Plate at Elevated Temperatures. J. Compos. Sci. 2017, 1, 3. https://doi.org/10.3390/jcs1010003
AMA Style
Lu Z, Xian G, Rashid K. Creep Behavior of Resin Matrix and Basalt Fiber Reinforced Polymer (BFRP) Plate at Elevated Temperatures. Journal of Composites Science. 2017; 1(1):3. https://doi.org/10.3390/jcs1010003
Chicago/Turabian StyleLu, Zhongyu, Guijun Xian, and Khuram Rashid. 2017. "Creep Behavior of Resin Matrix and Basalt Fiber Reinforced Polymer (BFRP) Plate at Elevated Temperatures" Journal of Composites Science 1, no. 1: 3. https://doi.org/10.3390/jcs1010003