Manufacturing and Mechanical Properties of Graphene Coated Glass Fabric and Epoxy Composites


1
Centre for Future Materials, University of Southern Queensland, Toowoomba, QLD 4350, Australia
2
Department of Aerospace Engineering, Khalifa University of Science and Technology, Abu Dhabi 127788, United Arab Emirates
J. Compos. Sci. 2018, 2(2), 17; https://doi.org/10.3390/jcs2020017
Submission received: 6 March 2018
/
Revised: 16 March 2018
/
Accepted: 18 March 2018
/
Published: 21 March 2018
(This article belongs to the Special Issue Manufacturing, Characterisation and Properties of Advanced Nanocomposites)
Abstract
:The processing characteristics and mechanical properties of glass fabric reinforcements coated with graphene nanoparticles were investigated. Graphene was coated onto either one or both sides of a plain weave glass fabric. The coated fabrics were investigated to measure key process characterization parameters used for vacuum assisted resin transfer molding (VARTM) process which are, reinforcement compaction response, in-plane, and transverse permeability. It was found that graphene coated glass reinforcements were stiffer than the pure glass reinforcements which will have direct influence on final fiber volume fraction obtained during VARTM processing. The permeability measurement results show that the graphene coated reinforcements filled relatively slower compared with the pure glass samples. Composite samples were then tested for flexural and low velocity impact. The initial results show that the flexural modulus did not change as the wt % of graphene increases. However, a decrease in flexural strength with increasing wt % of graphene was observed. It was also observed that the coating of graphene on glass reinforcements caused delamination between plies and resisted localized damage under low velocity impact as compared to pure glass samples.
1. Introduction
Graphene is the basic structural unit of some carbon allotropes including graphite, carbon nanotubes, and fullerenes with promising mechanical, electrical, optical, thermal and magnetic properties [1,2,3,4]. Recent progress has shown that graphene-based materials can have a profound impact on electronic and optoelectronic devices, chemical sensors, nanocomposites and energy storage [5,6,7,8,9]. The addition of exfoliated graphite nanoplatelets to the polymer matrix has been shown to produce nanocomposites that are multifunctional and significantly improve many of the mechanical properties [10,11,12,13,14,15]. However, the use of exfoliated graphite nanoplatelets as a secondary reinforcement in glass fiber composite laminates has not been studied extensively. The stiffness, toughness, and wear performance of the composites are extensively determined by the size, shape, volume content, and especially the dispersion homogeneity of the particles. Nanostructure materials provide opportunities to explore new fracture behavior and functionality beyond those found in conventional materials. Ávila et al. [16] showed that failure mechanisms of laminated composites can be influenced by nanostructures formed by nanoparticles dispersed into epoxy systems. According to them, the presence of nanoclay into fiber glass/epoxy composites lead to a more intense formation of delaminated areas after a low-velocity impact test. This phenomenon was attributed to interlaminar shear forces caused by the intercalated nanostructures inside the epoxy system. Furthermore, the energy absorption of these laminates increased by 48% with dispersion of 5 wt % of nanoclays.
Vacuum Assisted Resin Transfer Molding (VARTM) has proven to be a robust, low-cost technique for the manufacture of composite structures. Recent studies on the effects of nanoparticles on resin infiltration during manufacture of composites by VARTM have focused primarily on carbon nanotubes, carbon nanofibers [17] and nanoclay [18]. Little information has been published on VARTM processing effects using graphite nanoplatlets. There are two primary methods used to introduce nanoparticles into composite materials. One method involves dispersing the nanoparticles in the resin [19,20,21,22,23]. However, the high surface area and aspect ratio of the nanoparticles can result in an increase in resin viscosity [17]. Furthermore, during resin infiltration, aggregation of the nanoparticles can occur within the fiber tows. A second technique is to coat the nanoparticles directly onto the fibers [24,25,26] which eliminates the problems observed with the first technique.
In this study the effects of exfoliated graphite nanoplatelets on the processing characteristics and mechanical properties of glass fabric composites fabricated by the VARTM process were investigated. It is anticipated that the addition of the nanoplatelets will improve the out-of-plane properties of the composite including the interlaminar strength and fracture toughness and damage due to impact [19,27,28]. The large surface area of exfoliated graphite nanoplatelets is one of the most attractive characteristics of this kind of nanoparticles, which facilitates creating a large interface area in a nanocomposite.
In this investigation, exfoliated graphite dispersions will be coated onto the surface of glass fabric reinforcements. The compaction characteristics and permeabilities of the nanoparticle coated glass fabrics will be measured to determine the impact of nanoparticles on the processability under VARTM conditions. Composite structures containing nanoplatelets will be subjected to mechanical tests to study the influence of nanoplatelets on mechanical performance and fracture behavior under impact loading.
2. Experimental Section
2.1. Materials
An 800 g/m2 plain weave glass fabric supplied by Owens Corning was used as reinforcement material. A two part toughened epoxy system, Applied Polymeric SC-15 epoxy resin and SC-15 amine hardener with an ambient mixed viscosity of 0.30 Pa.s was used as a matrix. Hydraulic oil with similar viscosity as the resin system was used for permeability experiments. The nano-reinforcement was exfoliated graphite nanoplatelets. The diameter of the nanoplatelet was approximately 5–6 μm and the thickness was approximately 7–8 nm.
2.2. Graphene Coating Process
As a first step, the exfoliated graphite nanoplatelets were further processed to break the agglomerations to form graphene. A solution of approximately 5% graphite by weight mixed in 2-isopropanol was prepared. The solution was mixed using both a mechanical stirring device and a sonicator, Figure 1a. The 2-isopropanol and graphite mixture was stirred for 30 min followed by sonication at 35 W power for 2 h with on/off pulses. The glass fabric was cut to the desired dimensions and weighed accordingly. The measured amounts of graphene in 2-isopropanol solution was then brushed onto the glass fabric until it was evenly distributed as shown in Figure 1b. The coated fabrics were placed beneath a fume hood for 24 h until the 2-isoproponal was evaporated. Samples were prepared with 0.5 wt % and 1.0 wt % graphene coated on one surface of the glass fabric and with 0.5 wt % coated on both sides of the glass fabric. Samples were also prepared by coating the surface of the glass fabric with 2-proponal to assess the effect of the solvent on processing and overall properties. These samples are referred to as 0 wt % graphene. The results were also compared to “As Received” pure glass samples.
2.3. Compaction Characterization
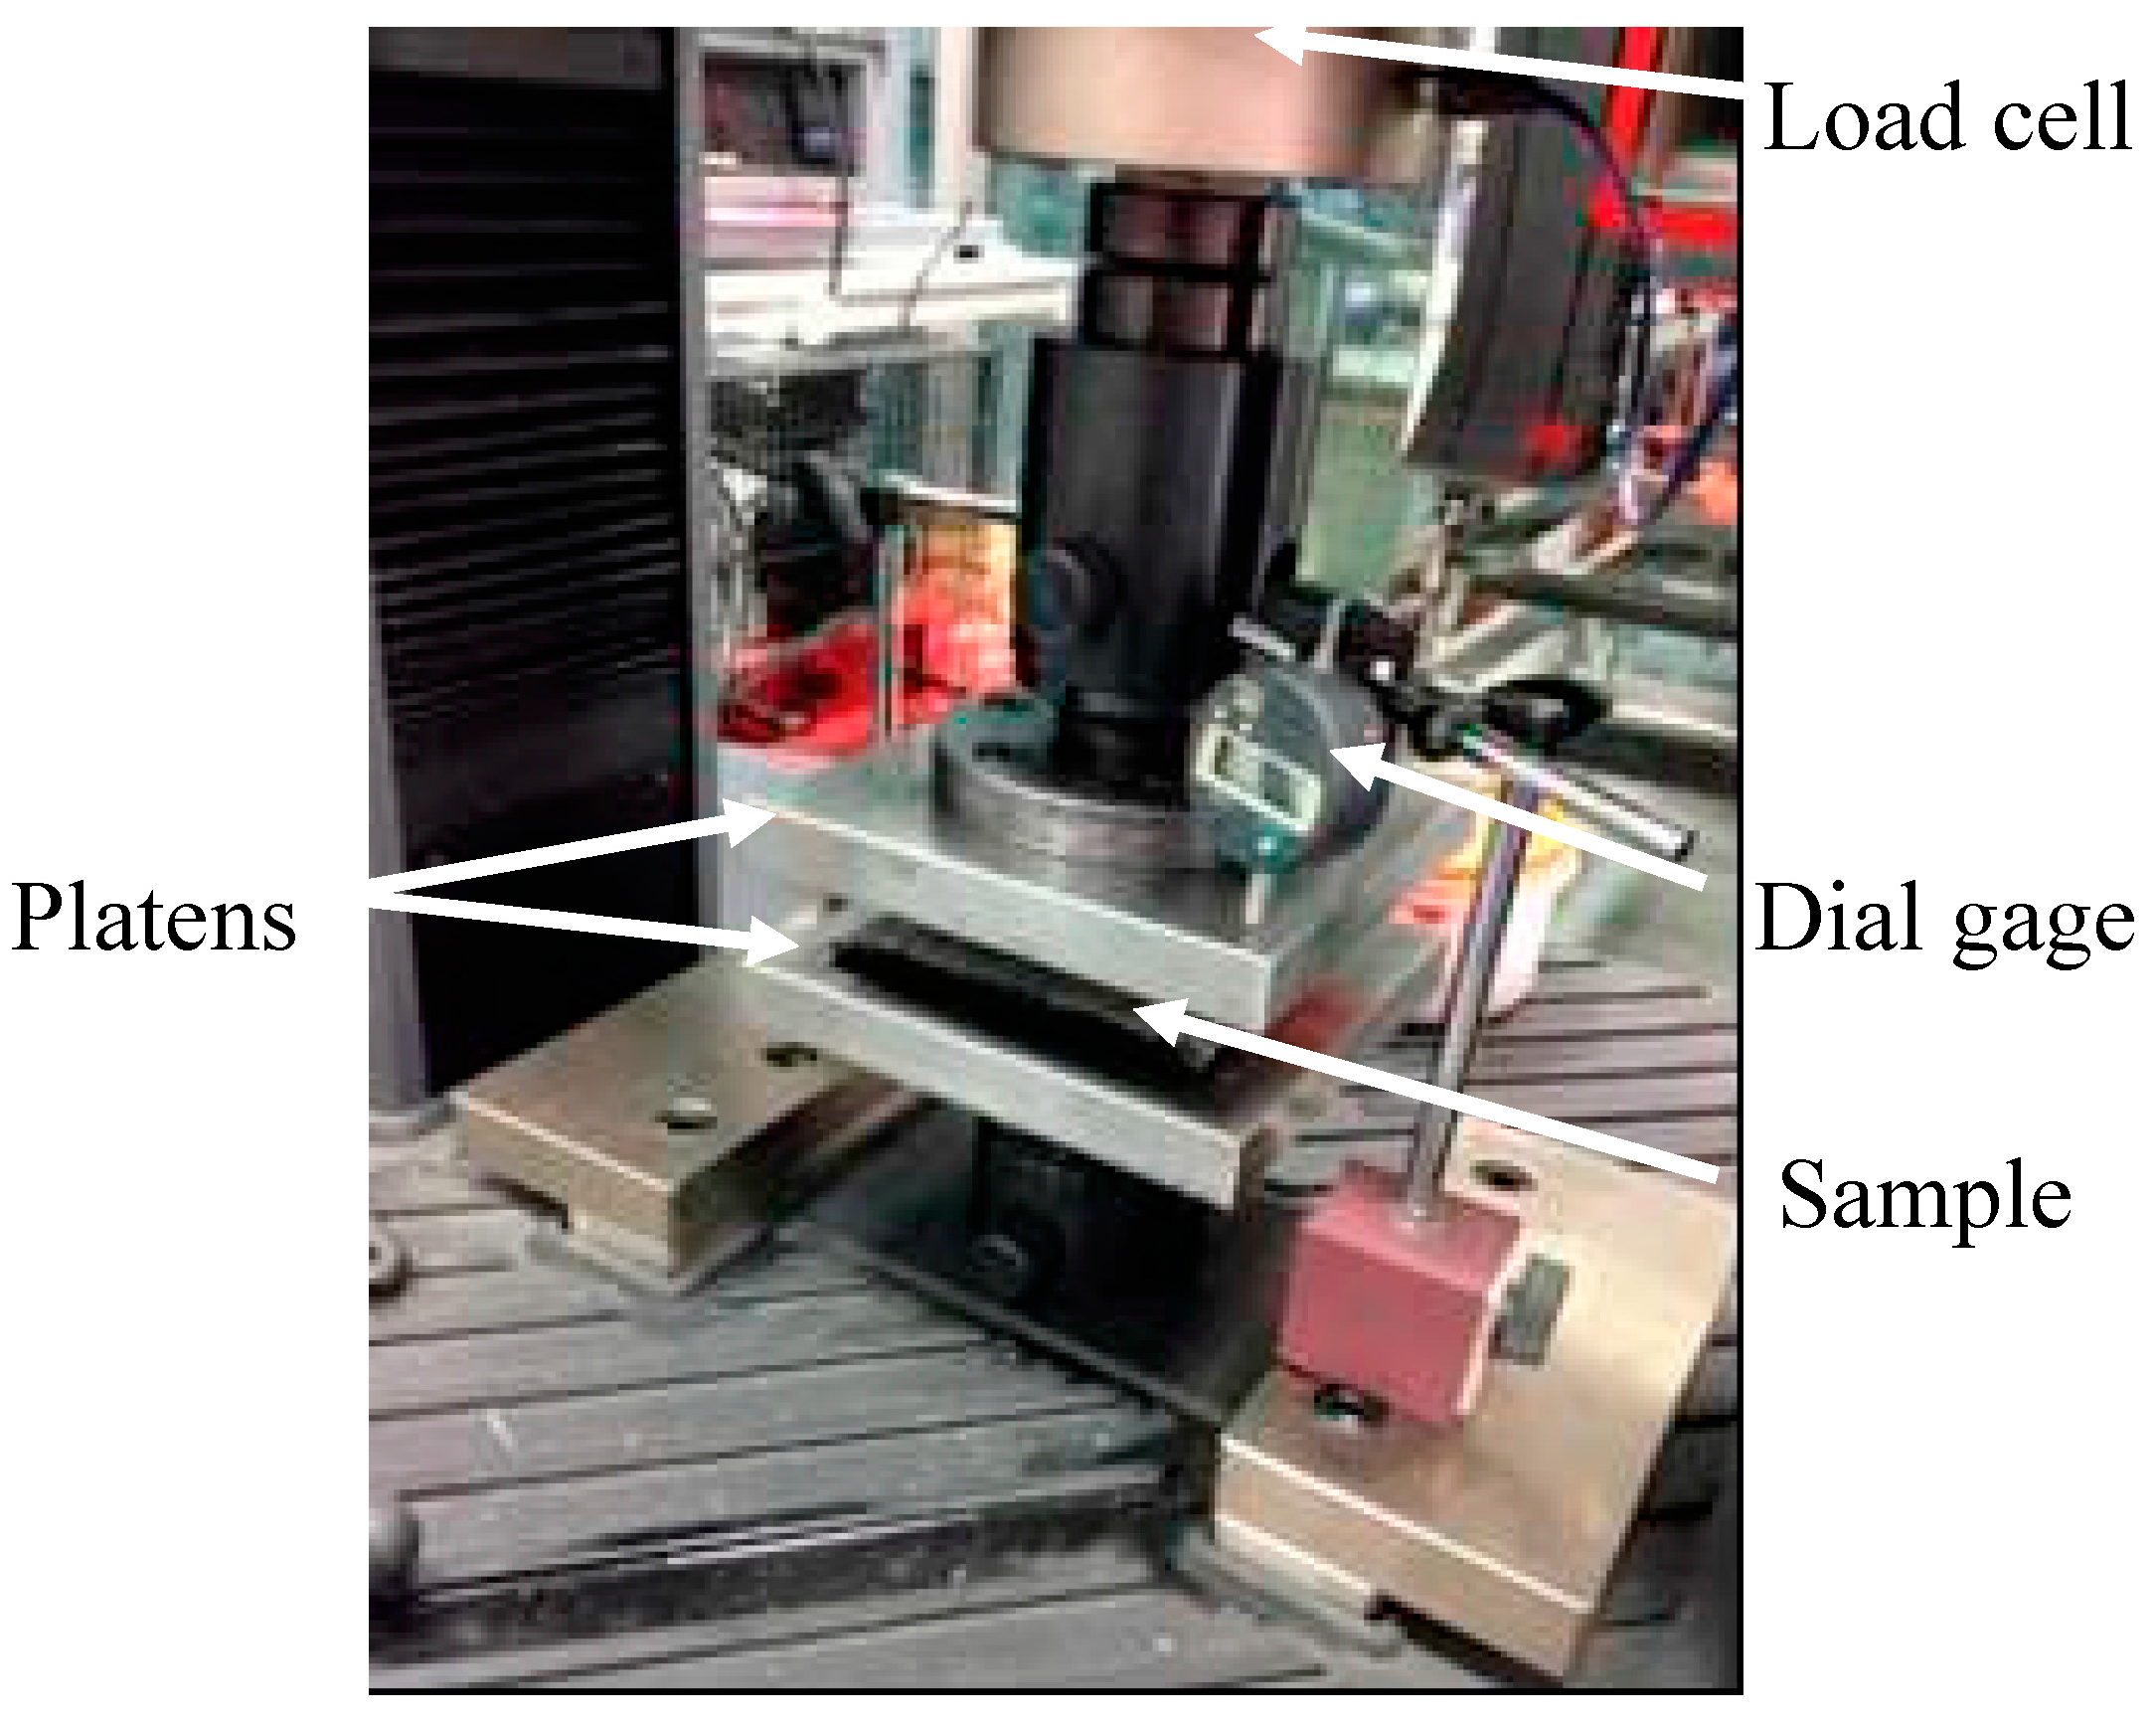
To assess the process-ability of the coated fabrics under VARTM pressure, the coated reinforcements were subjected to compaction experiments conducted under dry conditions to measure the compaction response of the glass preforms. The compaction test fixture is composed of two flat steel plates used to compact the samples. The upper and lower platen has dimensions of 15 cm × 15 cm. A laser displacement sensor (L-Gage, Banner, LG10, Minneapolis, MN, USA) and a digital dial indicator were used to monitor the crosshead displacement and thus the thickness of the sample being tested. A photo of the compaction test setup is shown in Figure 2. The fixture was mounted between upper and lower platens of an MTS Insight Material Testing Machine attached with 100 kN load cell. The output data of the L-Gage sensor was gathered using LabVIEW data acquisition software (National Instruments, Austin, TX, USA). Before using the L-Gage sensor, it must be calibrated by defining the minimum and maximum distance limits or distance range.
In compaction characterization experiments, a compressive load was applied up to a set high load limit and then releasing this load down to a set low load limit. The test cycle was decomposed into two cycles: Loading and Unloading. Both cycles were performed with a constant crosshead speed of 0.5 mm/min. The user inputs to the test program were: high load limit, low load limit, crosshead speed, and data acquisition frequency. The MTS machine load cell was calibrated first. After the calibration, the cross head with upper plate attached was lowered all the way down until it touched the bottom plate. At this point, the extension reading of the machine was zeroed. The dial indicator was also placed on the crosshead and zeroed at this position. Then, the crosshead was raised and the sample to be tested was placed on the bottom plate. The crosshead was manually and slowly lowered until the upper plate touched the sample and a minimal initial load (approximately 10 N) was attained. This indicates the initial thickness of the preform. Glass preform specimens were compacted to 101.5 kPa which corresponds to the maximum VARTM compaction pressure. Once the maximum load limit was reached, the crosshead begins unloading the specimen until the load drops to zero.
2.4. Permeability Characterization
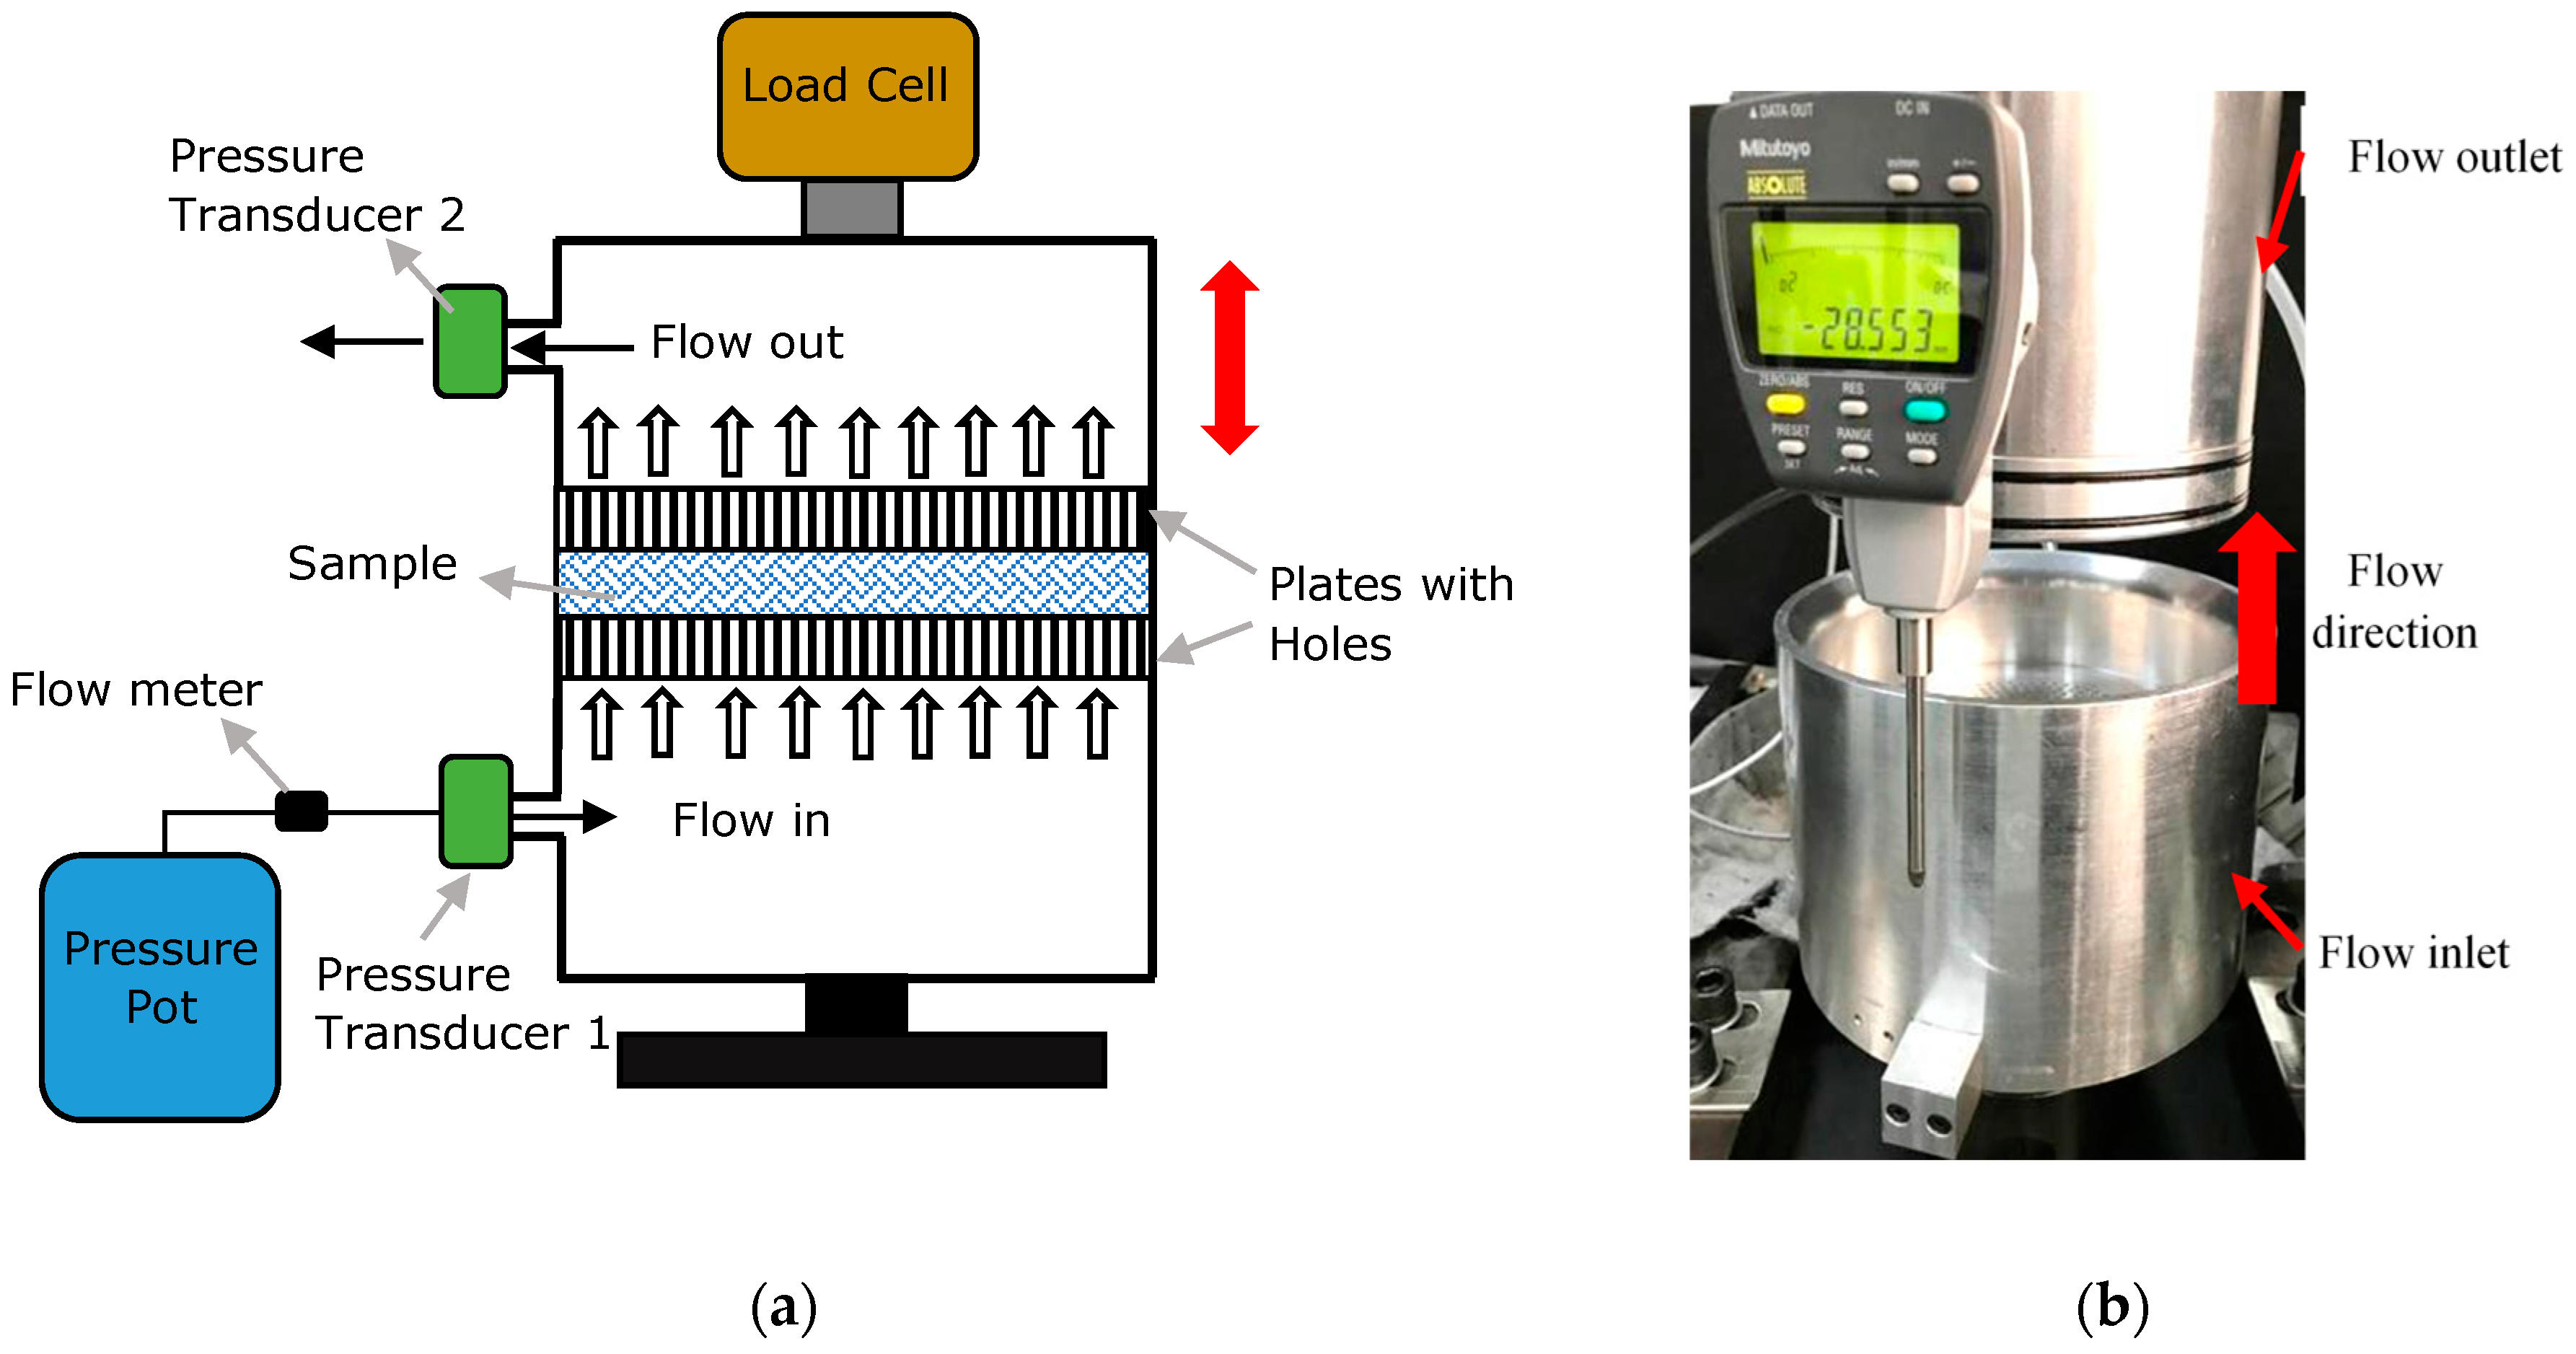
Separate fixtures were used to measure the in-plane (K11 and K22) and the transverse (K33) permeabilities. The transverse or through-thickness permeability test fixture was designed to establish one-dimensional saturated flow of fluid through the preform and is shown in Figure 3. This fixture was designed to accommodate 100 mm diameter preform specimens. The fluid was injected through the thickness of the specimen by rigid distribution plates mounted in the plunger and in the bottom of the cavity. The plates were machined with 2 mm holes drilled in round patterns. A single linear voltage differential transducer (LVDT) was used to measure the thickness of the preform specimen. Two pressure transducers were located at the inlet and outlet to measure the pressure gradient in the transverse direction.
The preform specimens were placed inside the cavities of permeability fixtures. Once the crosshead was lowered to the desired starting thickness or fiber volume fraction level, the test fluid was injected into the mold cavity under 1 bar pressure. A mass balance was used to measure the flow rate of the test fluid at the outlet. Once steady-state flow conditions were established, the inlet and outlet pressures were measured. At each fiber volume fraction, the difference between inlet and outlet pressures over a range of different flow rates was measured and the data was used to construct a curve of volumetric flow rate versus the pressure drop. Measuring the slope of the curve gives the average permeability for the preform at the specified fiber volume fraction.
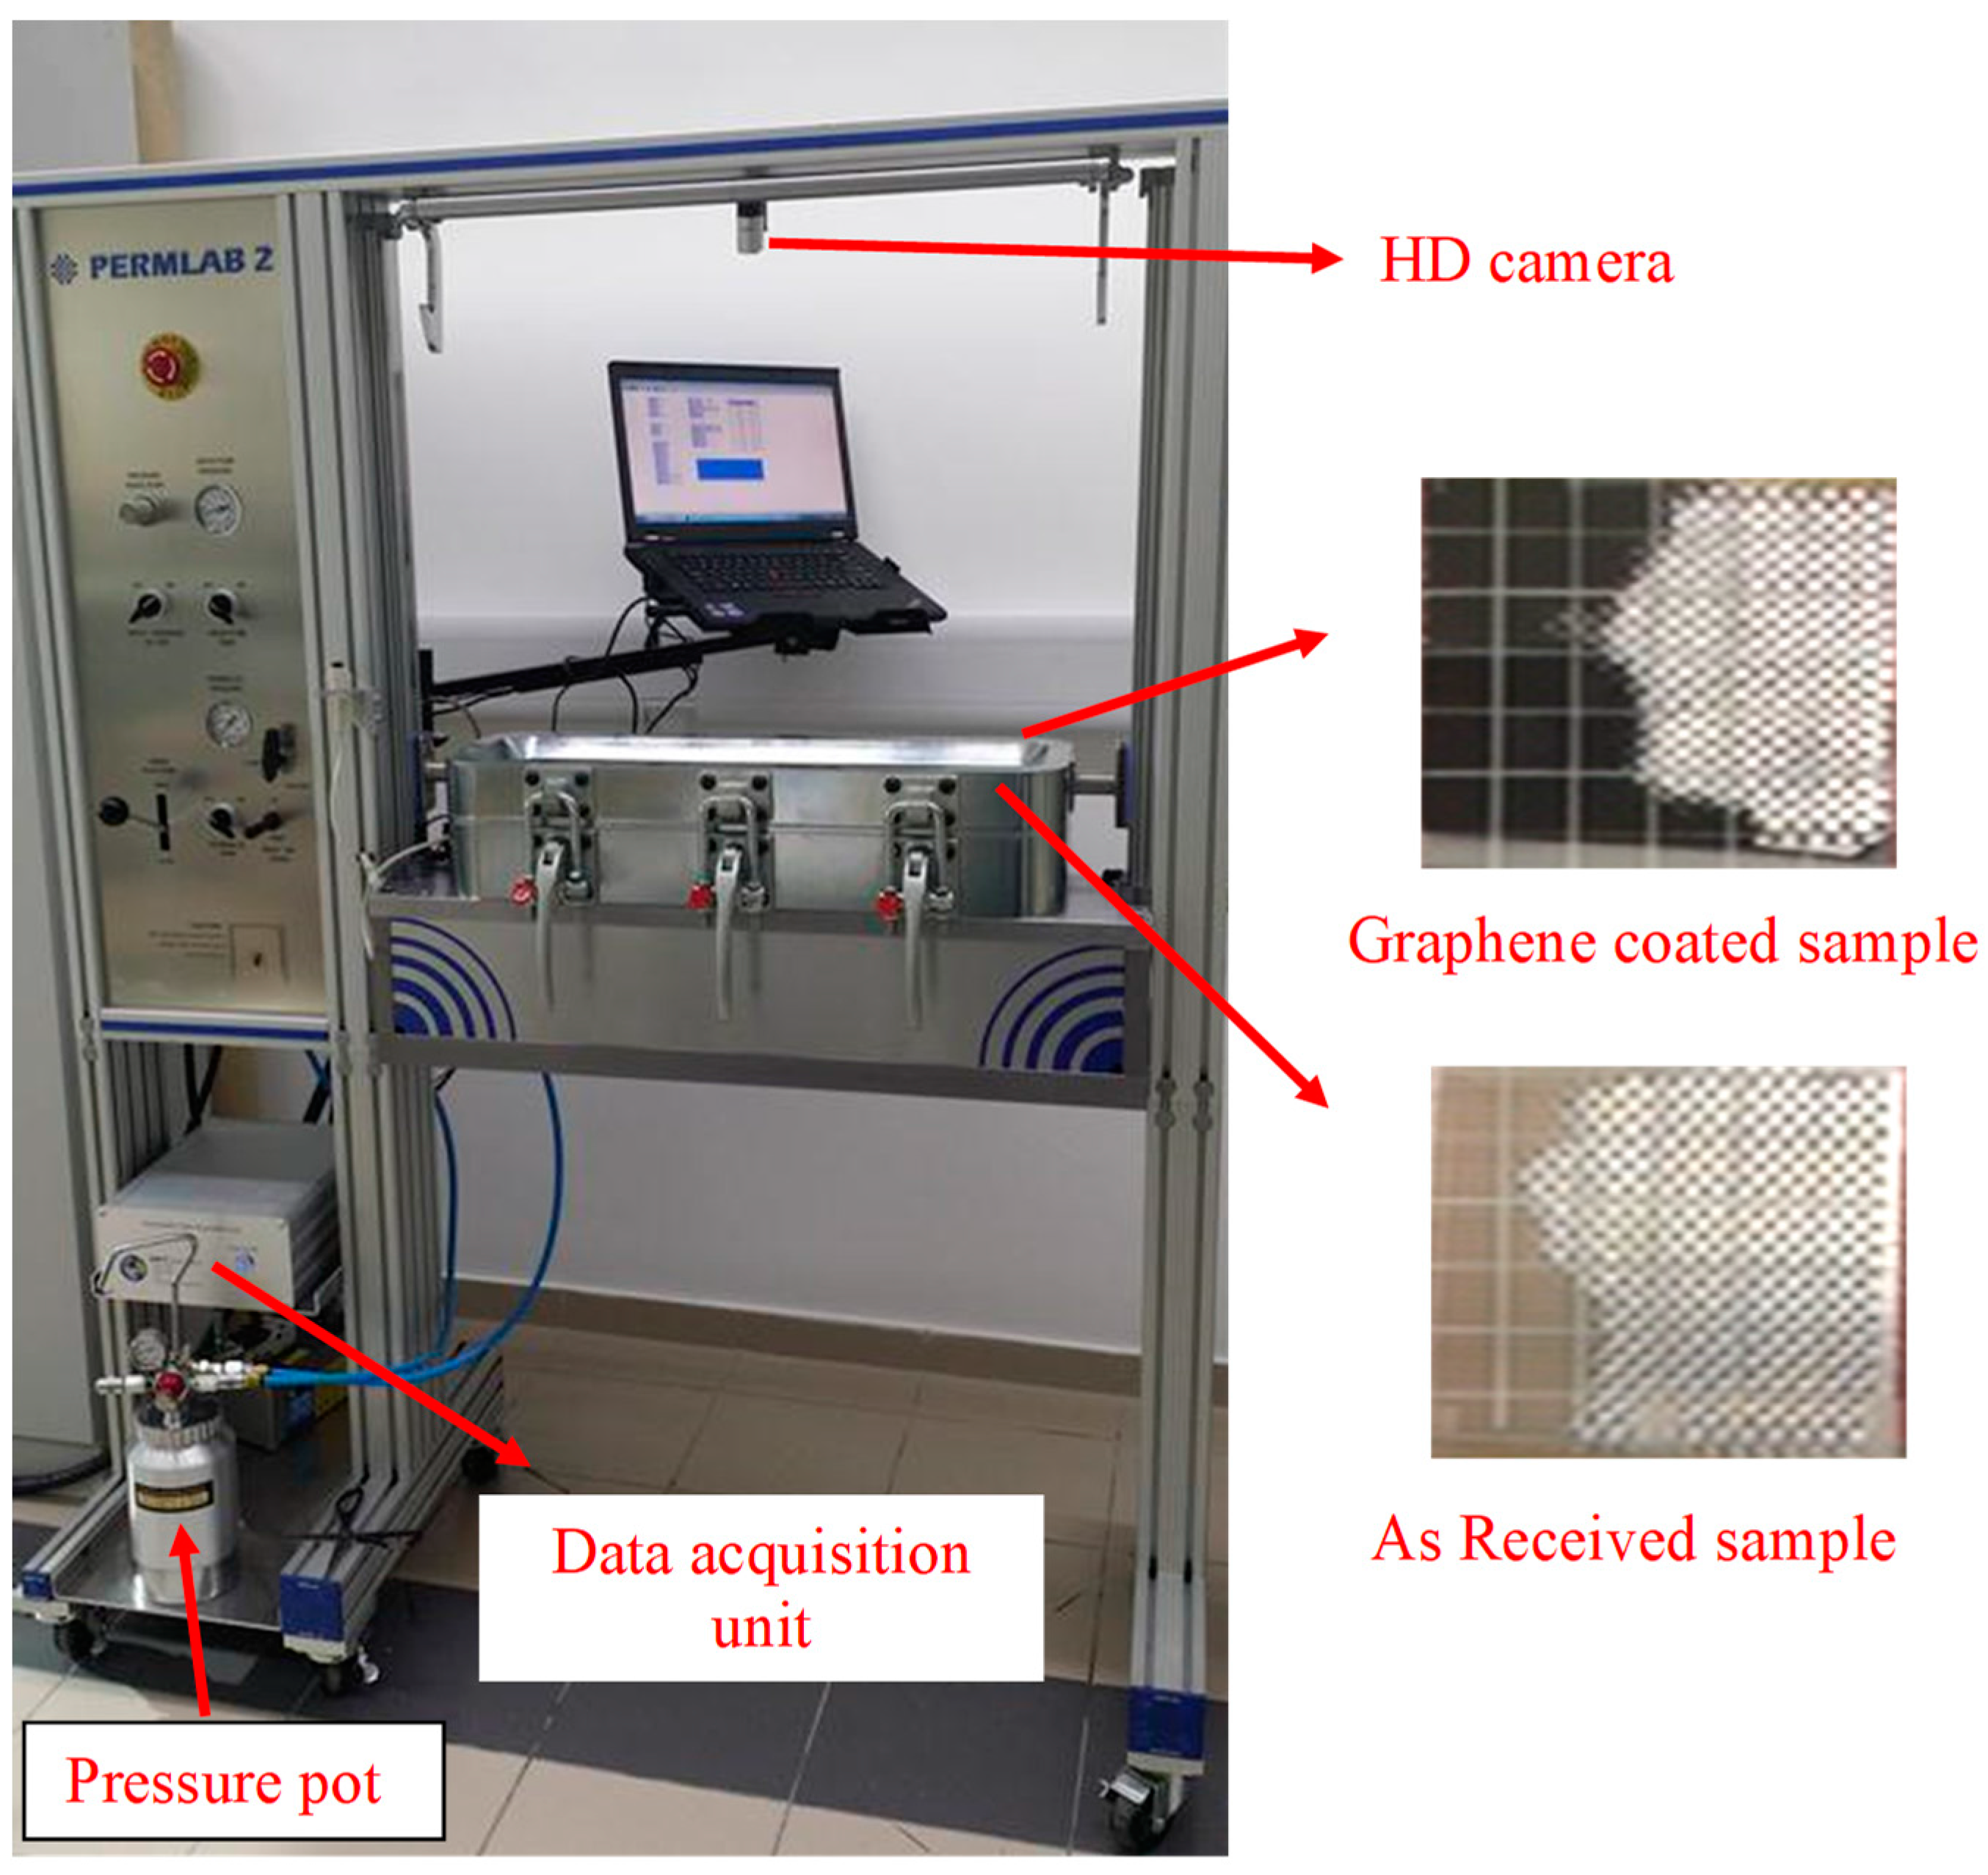
The in-plane permeabilities of the graphene coated glass fabrics could not be measured using a one-dimensional flow of fluid through a saturated preform due to possible washout of the nanoparticles observed during the measurements. Hence, a transient or advancing front measurement technique was used, where the flow front positions are recorded as a function of time. The permeability fixture shown in Figure 4 was used to obtain the measurements and includes a clear glass plate as top platen and a rigid steel bottom plate with inlet and outlet holes. Mounted above the glass mold was an HD camera which was used to observe the resin flow along the top surface of the preform, as can be seen in Figure 4.
Permeability tests were done at each principal in-plane direction i.e., K11 and K22 by cutting the glass fabric in two principal directions. In-plane permeability tests were performed for samples having different wt % of graphene coatings. Four layers of 400 mm × 100 mm representing 3 mm cavity thickness of glass fabric samples were placed on the tool. A constant injection pressure of 1 bar was used to inject the test fluid inside the mold cavity and flow front positions were monitored throughout the mold filling period.
2.5. Composite Manufacture
The coated glass fabric preforms with dimensions 400 mm × 100 mm with 4 layers thick were infused using two part epoxy resin by the VARTM process. The specimens were fabricated on a glass mold with a line injection port and a line vacuum port. Two layers of resin distribution medium was used. After the materials were placed, the mold was sealed using a vacuum bag and sealant tape. The mold was then infused under vacuum with a pressure of 1 atm. The panel was cured at room temperature for 24 h and post cured in an oven at 70 °C for 7 h. After the cure, test specimens were cut for mechanical testing.
2.6. Mechanical Properties
2.6.1. Flexural Testing
Four point flexural test specimens were prepared in accordance with ASTM D-6272. A third span loading configuration was used as shown in Figure 5. The tests were carried out on an MTS Insight 100 Material Testing Machine (Eden Prairie, MN, USA), with a laser extensometer to accurately measure the deflection. The test fixture had adjustable supports and loading bars that were 6.35 mm in diameter. The test specimens were carefully placed on the support bars to ensure that the loading was symmetric and that the sample was level. The loading rate was based on support span and specimen thickness in accordance with the ASTM standard. The coupons were 13 mm by 60.0 mm with an average thickness of 2.7 mm. The load span was taken as 1/3 of the support span and was according to 16:1 span-to-thickness ratio. The data was recorded at a sampling rate of 2.5 Hz. An average pre-load force of 20 N was applied to start consistently from the same load. The specimens were tested until failure. After testing, the data was analyzed and flexural modulus and strength were calculated. Following equations were used for calculating stress, strain and Young’s modulus,
where, is the maximum stress, ε is the strain, E is the flexural modulus, P is the load, b is the beam width, d is the thickness, D is the maximum deflection of the center of the beam, L is the support span, and m is the slope of the tangent.
2.6.2. Low Velocity Impact
Instrumented Drop-Weight Instron® Dynatup 9250HV impact machine setup was used to test the samples under low velocity impact (2.3–4.8 m/s) loading. The machine setup consists of an instrumented impactor (12 mm diameter) mounted on a crosshead with a provision for attachment of varying weights. The crosshead slides along stiff, smooth guide columns. The specimen is clamped at the base of the machine in a fixture that has circular support. Sample sizes of 10 cm × 10 cm were used for the test. Energy of impact was varied by varying the drop height. The mass was kept constant at 7 kg. The samples were subjected to impact at four different energy levels 20, 40, 60, and 80 J. Load vs. time curves were obtained and displacement and energies were computed.
2.6.3. Ultrasonic Non-Destructive Evaluation
The ultrasonic inspection of the laminate was carried out using a ultrasonic pulser receiver unit (Ultrapac II system with UTwinTM software by Mistras, Princeton Junction, NJ, USA). The scanning was done in pulse–echo immersion mode using a 10 MHz 6.35 mm point focus sensor. In ultrasonic inspection, using the pulse–echo immersion mode, the sample is placed in a water tank and the transducer is brought over the sample. As the ultrasound propagates through the water medium, part of it gets reflected back from the top surface of the sample which is called as front surface echo, while the rest of it passes through the material. The part of ultrasound that is propagating through the sample gets reflected back at the other end of the sample which is called as back surface echo. If there is any defect in the path of the travel of ultrasound, then it acts as reflector and a defect echo is obtained. Therefore, by collecting the information from the back surface echo of ultrasound from the entire surface area of the sample, we can obtain the mapping of the defect in the sample, which is referred to as C-scan. This is done by setting an electronic gate on the back surface echo and digitizing the signal. Such scanning will give the information of cumulative damage as projected onto a horizontal plane. It is possible to set multiple gates from the front surface echo to the back surface echo and collect the information at different interfaces. For the samples subjected to impact loading, scanning was carried out with the impacted surface facing the sensor. The digitized data is further analyzed by pseudo-coloring to get a colored map to differentiate a defective area from the good area.
3. Results and Discussion
3.1. Compaction
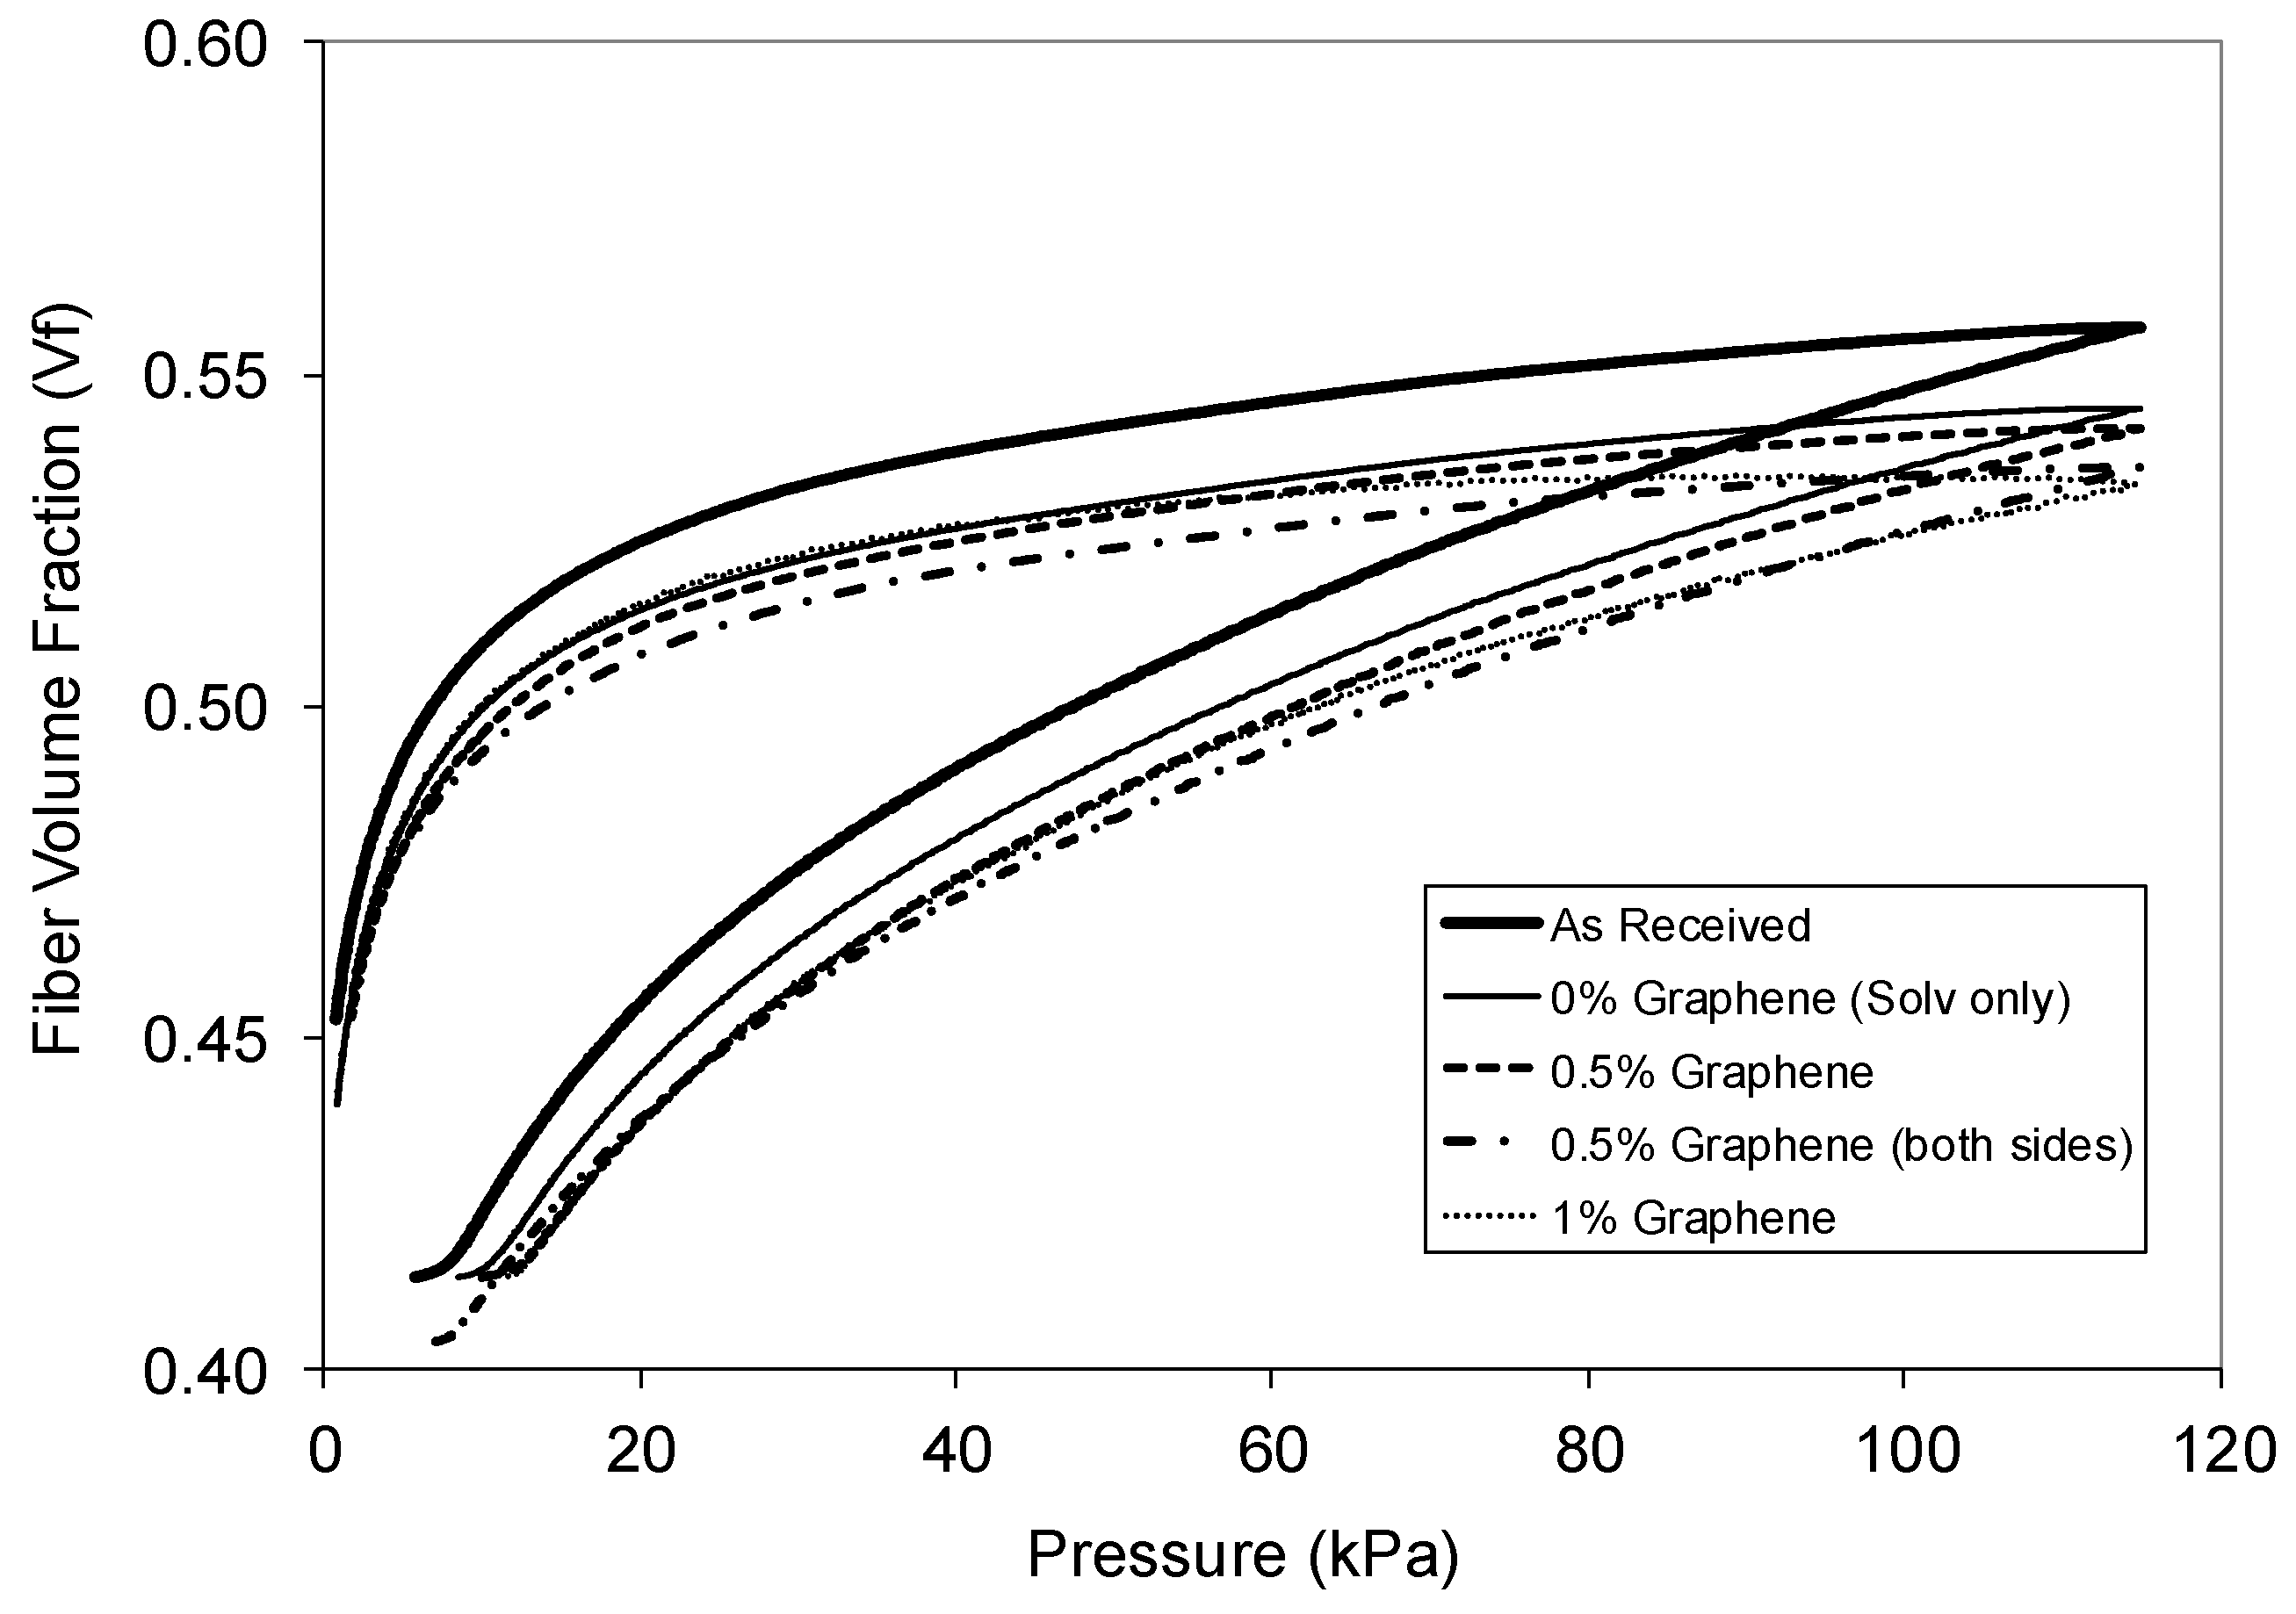
Figure 6 presents thickness change as a function of compaction pressure of the glass fiber reinforcements coated with different wt % of graphene. The figure presents both loading and unloading curves for all samples tested. The results were also compared with “As Received” glass reinforcement. The figure shows a clear trend of thickness variation at a set maximum pressure (corresponding to full vacuum condition). As graphene amount increases, the resistance to compaction of the glass reinforcement increases. It is suspected that the solvent affected the properties of the sizing present on glass fibers, causing it to become stiffer. In addition, the nanoparticles fill the voids between the glass tows and hence causing resistance to slipping of fibers under compaction loads. This implies that a glass fiber reinforcement coated with higher wt % of graphene will have higher resistance to compaction and hence the final product will be thick with low glass fiber volume content compared to a product manufactured using “As Received” glass reinforcements.
3.2. Permeability
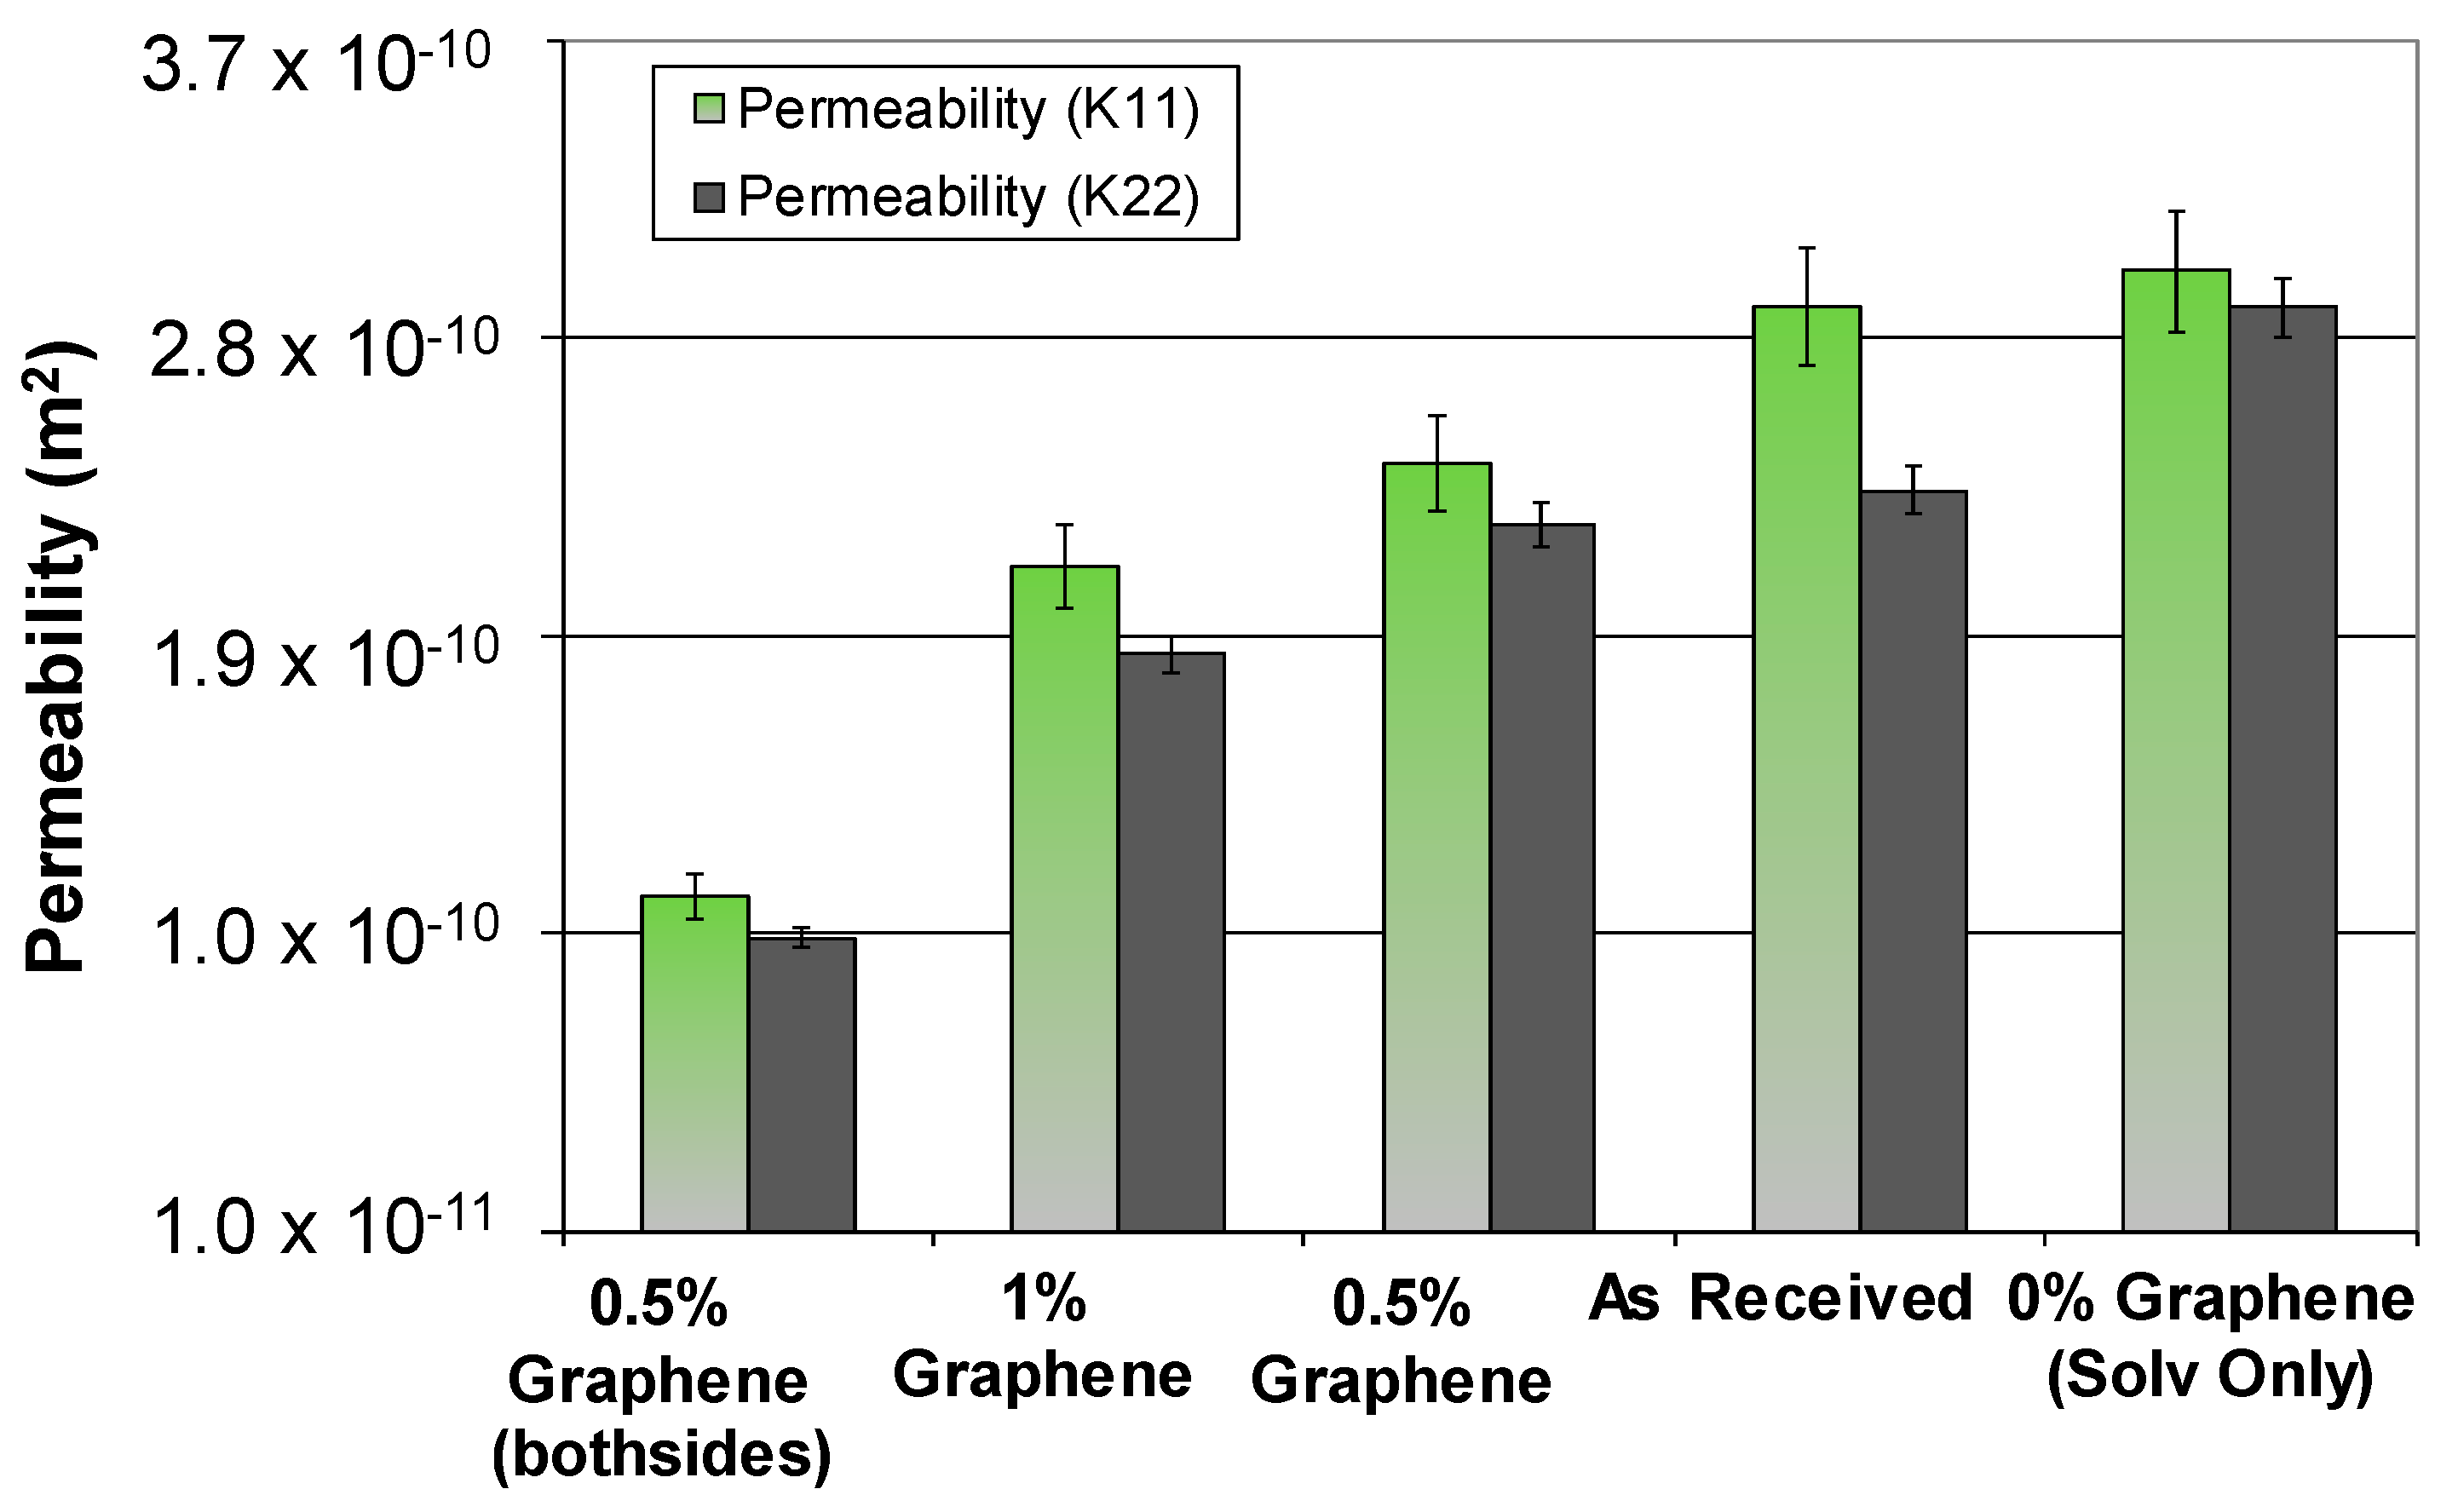
Permeability characterization tests were performed in three principal directions (K11, K22, and K33) directions. The transverse permeability (K33) test results for glass reinforcements coated with different wt % of graphene are presented in Figure 7. Three sets of tests were completed and the exponential equation was fit to the average data points. The transverse permeability values for glass fabric with graphene 0.5 wt % were very similar. The difference was found in the solvent treated samples and 1 wt % graphene coated samples, where the permeability was found to be higher and lower respectively. It is suspected that due to the use of solvent, the sizing on the glass fibers may have dissolved, as a result leaving behind channels for the fluid to flow through the thickness direction without much resistance. As oppose to samples coated with 1 wt % graphene, where excessive coating left open channels blocked for fluid to flow, resulting in lower permeability.
To measure the in-plane transient permeability (K11 and K22), the flow front positions for all graphene coated and “As Received” samples were continuously monitored and recorded using a video camera. The transient permeability was estimated using Darcy’s law [29]. Figure 8 presents in-plane permeability results based on flow front positions. The permeability decreases with increase in graphene content. This is mainly attributed to greater resistance offered by graphene inclusions blocking the channels for resin flow. Figure 9 shows optical microscopy images where the flow of graphene nanoparticles through the fiber bundles is evident. Figure 10 shows SEM micrographs of graphene coated glass composites at different magnifications. The resin flow path is shown out of the plane. The images show a good distribution of graphene nanoparticles in the composites structure. The circular cylinders are the glass fibers surrounded by irregular shaped grapheneplatelets. The nanoplatelets which are approximately 5 µm in diameter flow through the fiber bundles and tows of the reinforcement as the resin flow both in-plane and in transverse directions.
3.3. Mechanical Properties
3.3.1. Flexural Properties
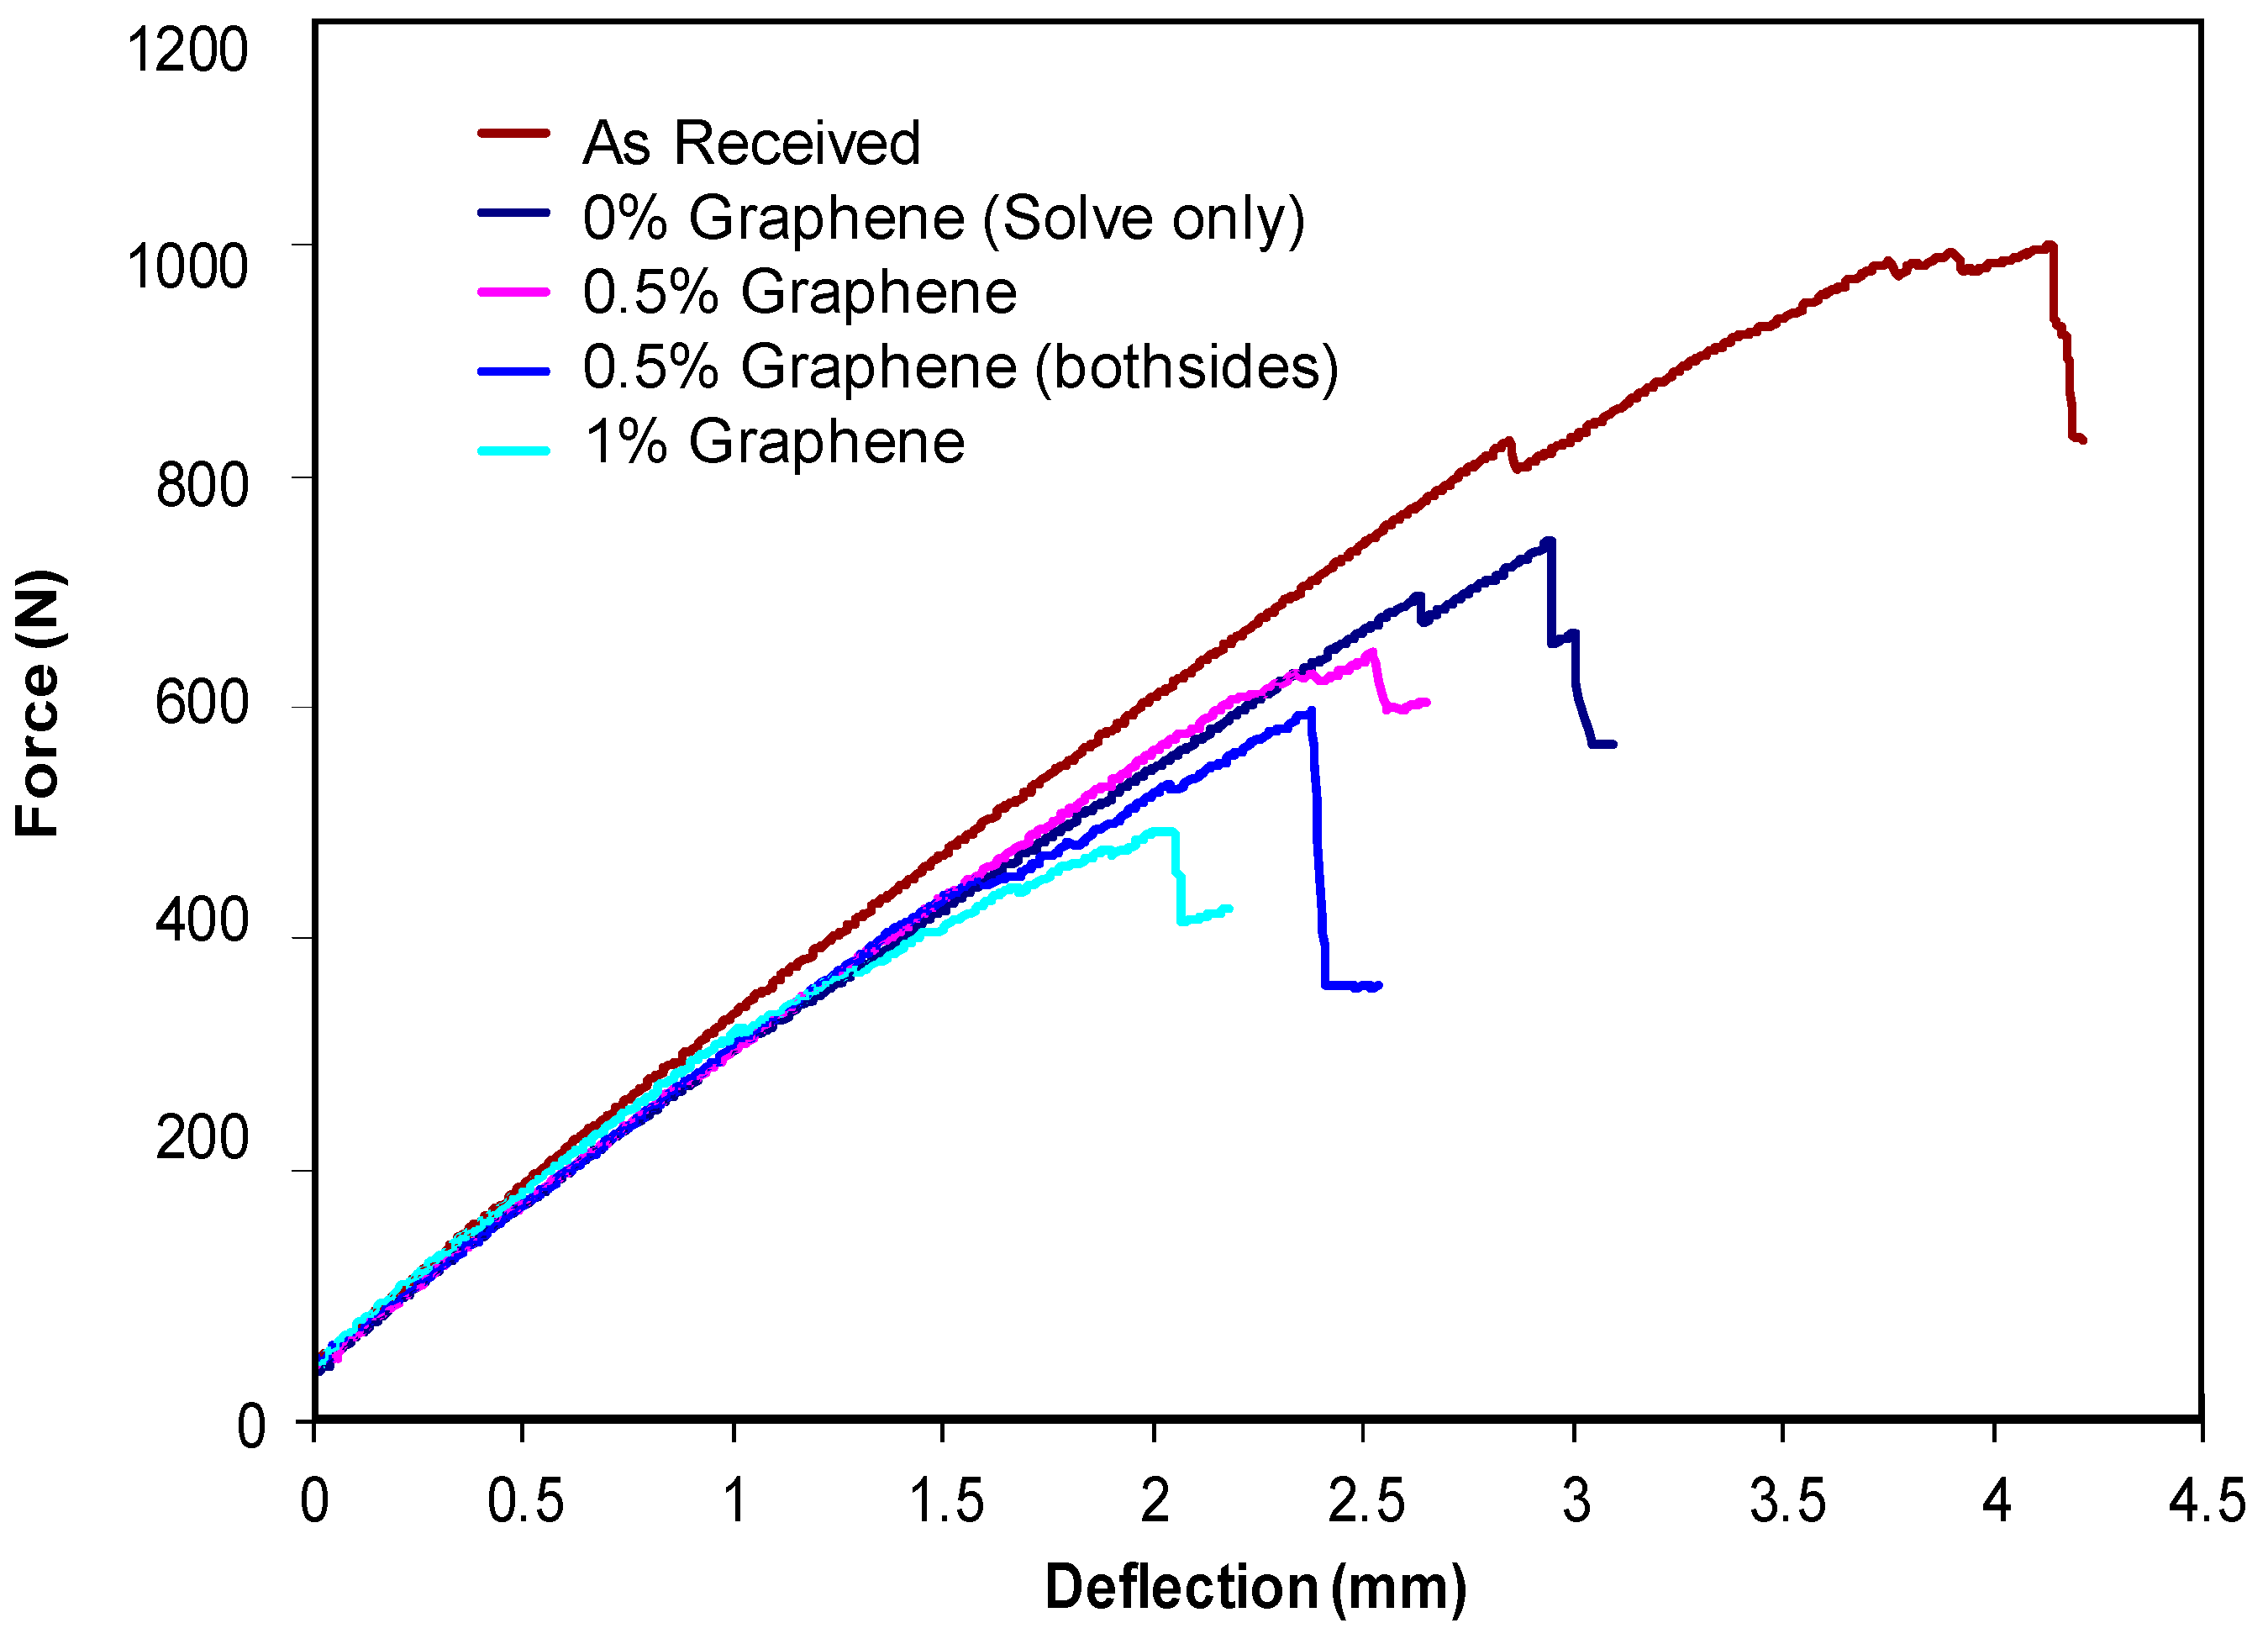
Six specimens were tested for each of the samples. For all tests, the force vs. displacement graph was recorded and then stress and strain were calculated using the specimen dimensions. The stress strain plots for each set of data are shown in Figure 11. Overall, the curves were mostly linear with similar slopes before failure. The flexural modulus was calculated from the slope of stress strain curve, and the flexural strength was determined at the maximum stress.
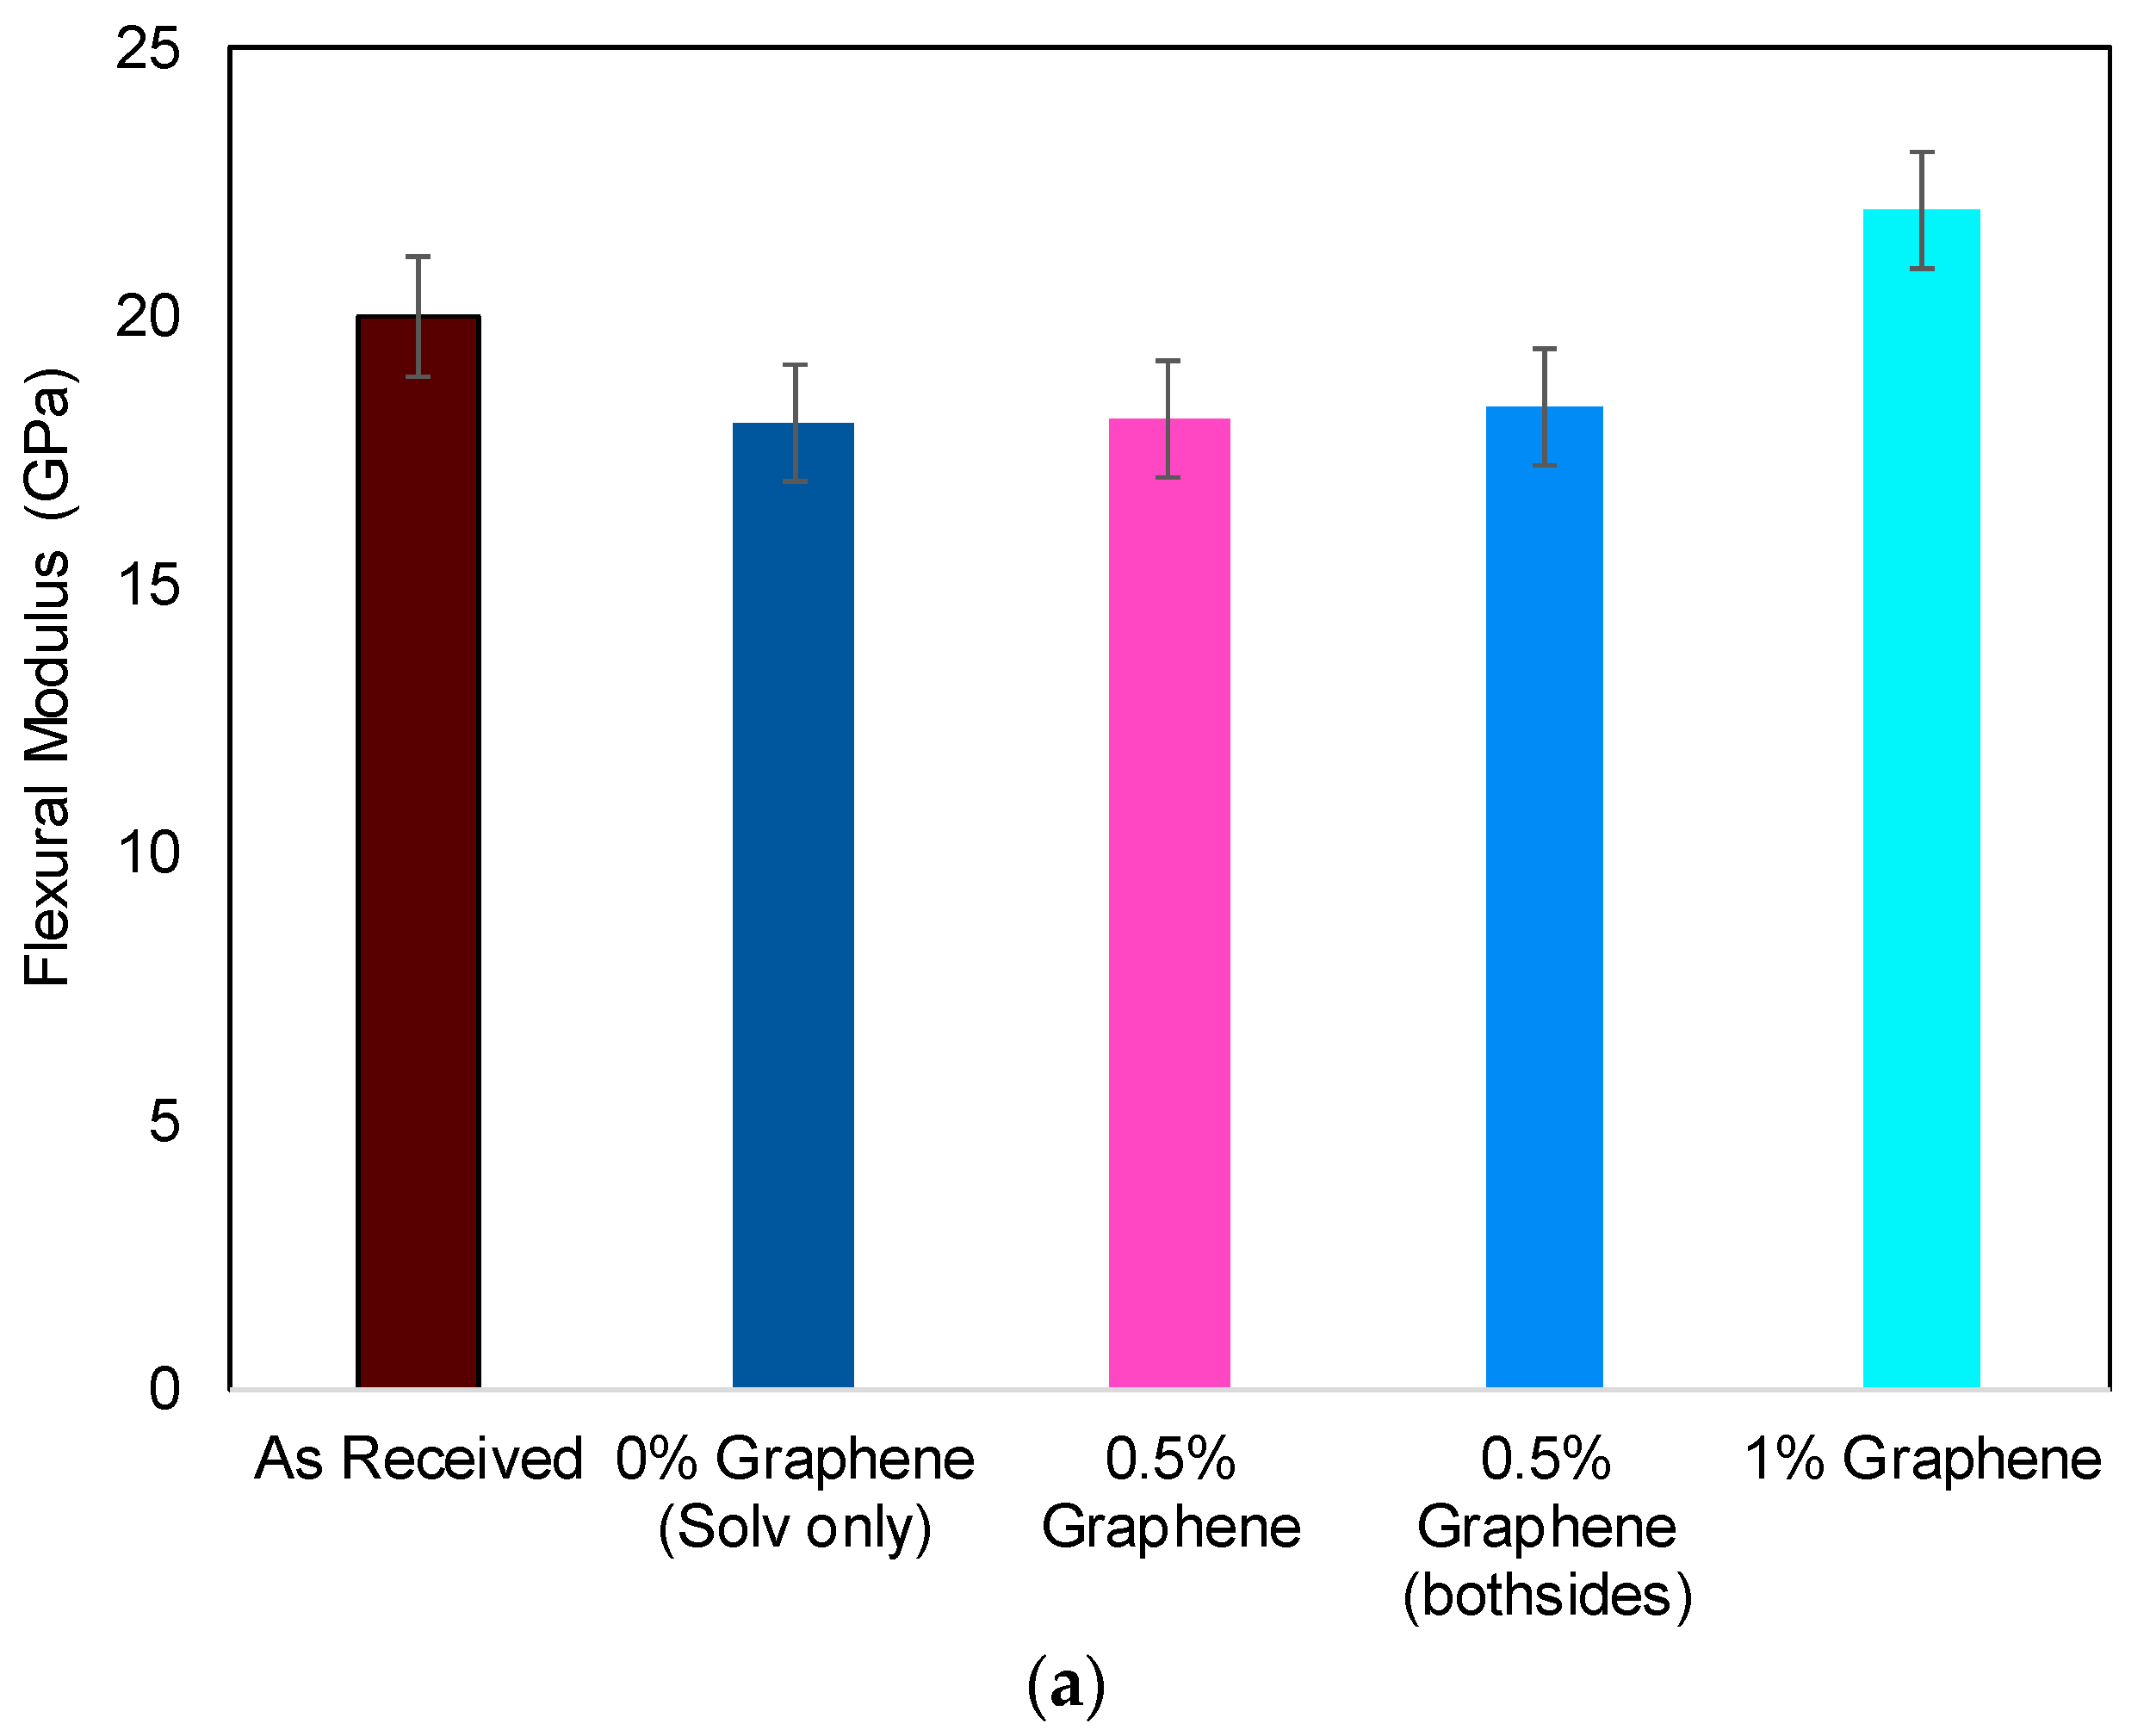
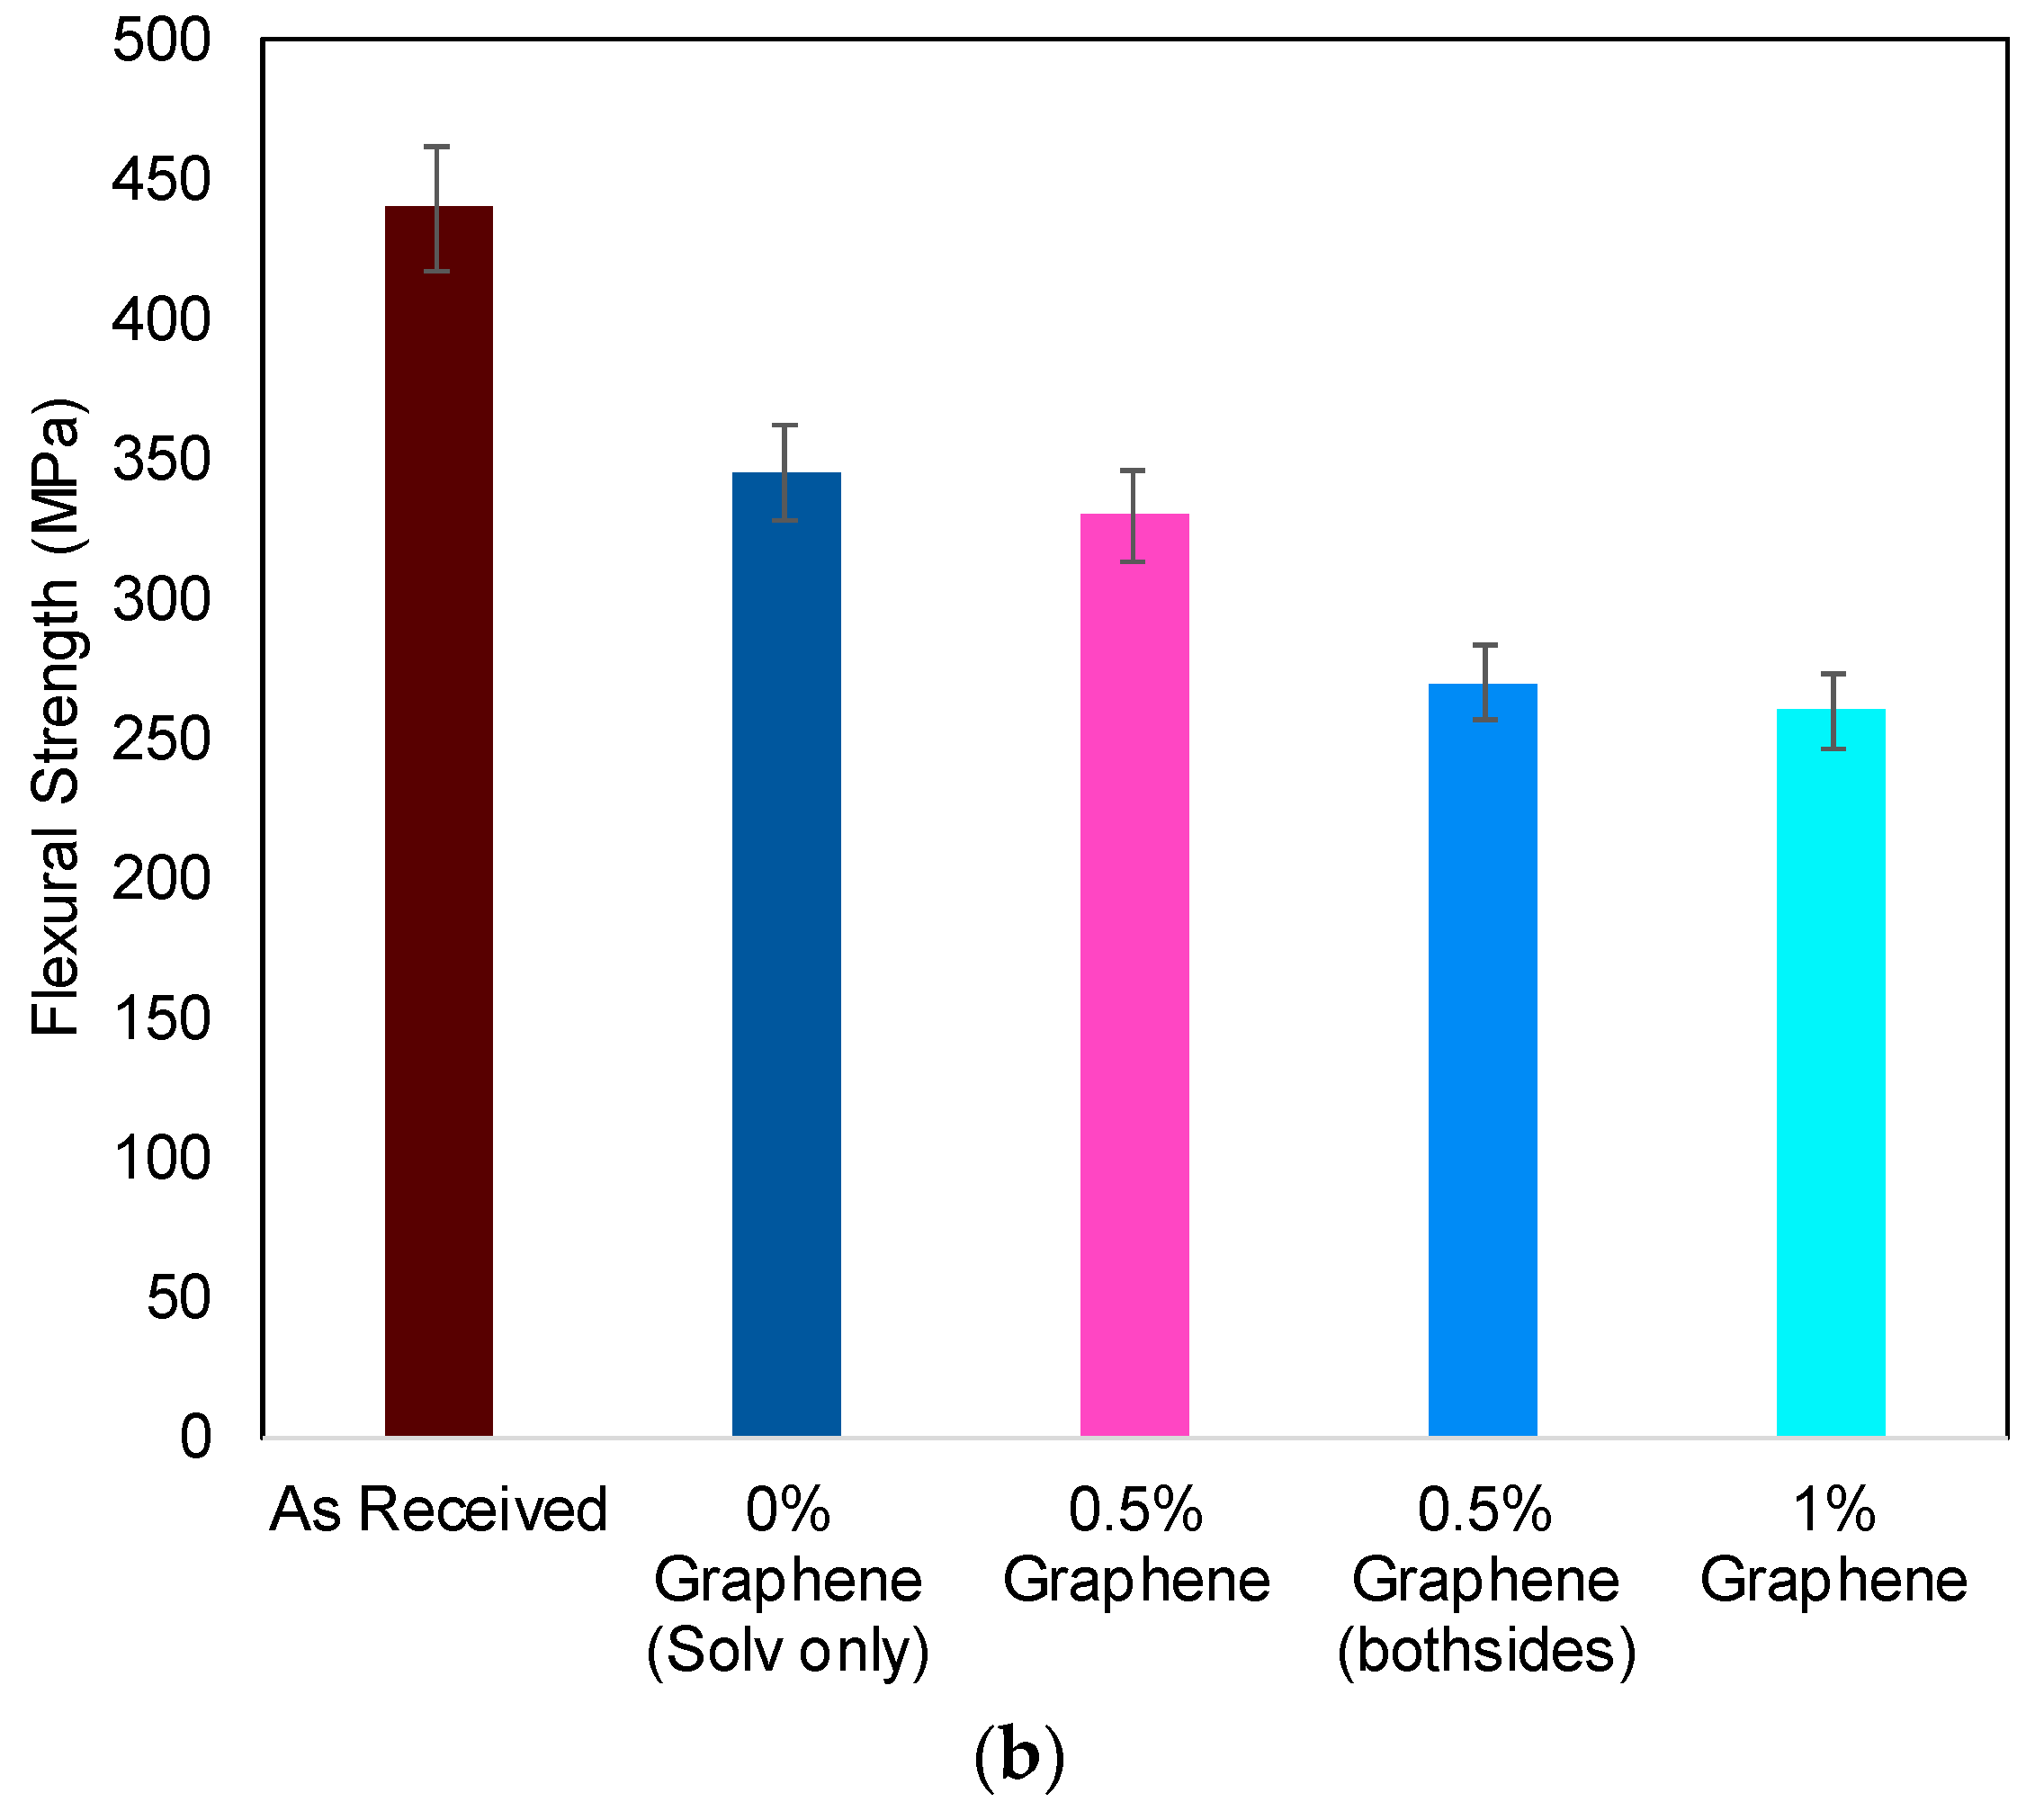
The plots in Figure 12a show the average flexural modulus and average flexural strength with error bars representing the range of the data for each set of experiments. The flexural modulus was highest with the 1% graphene amount while it remained almost constant for all other samples. The flexural strength decreased as the amount of graphene increased as shown in Figure 12b. The graphene used in this study was not functionalized, and it is anticipated that after treatment with resin compatible functional groups, the static and dynamic properties can be enhanced [12].
3.3.2. Low Velocity Impact
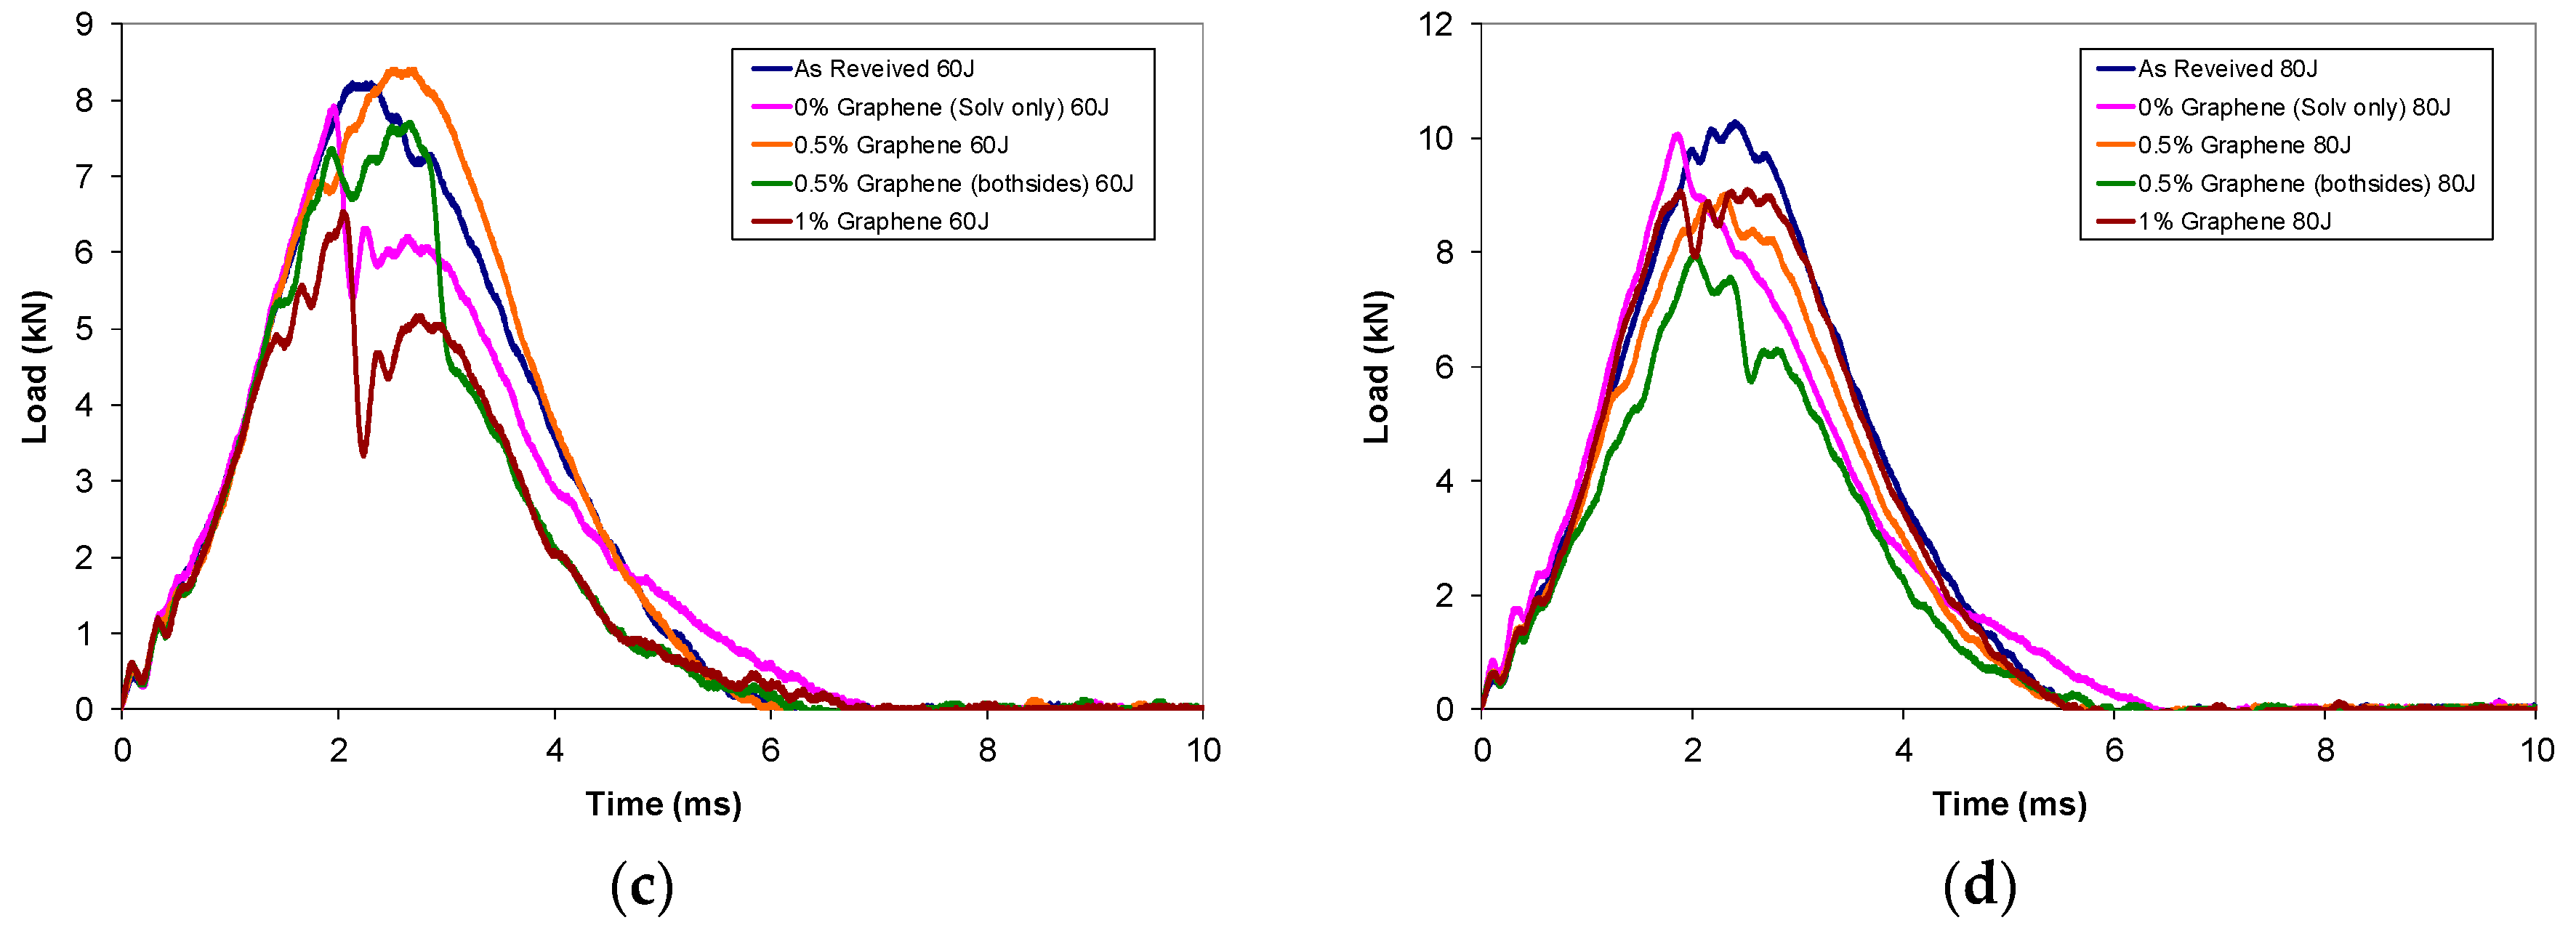
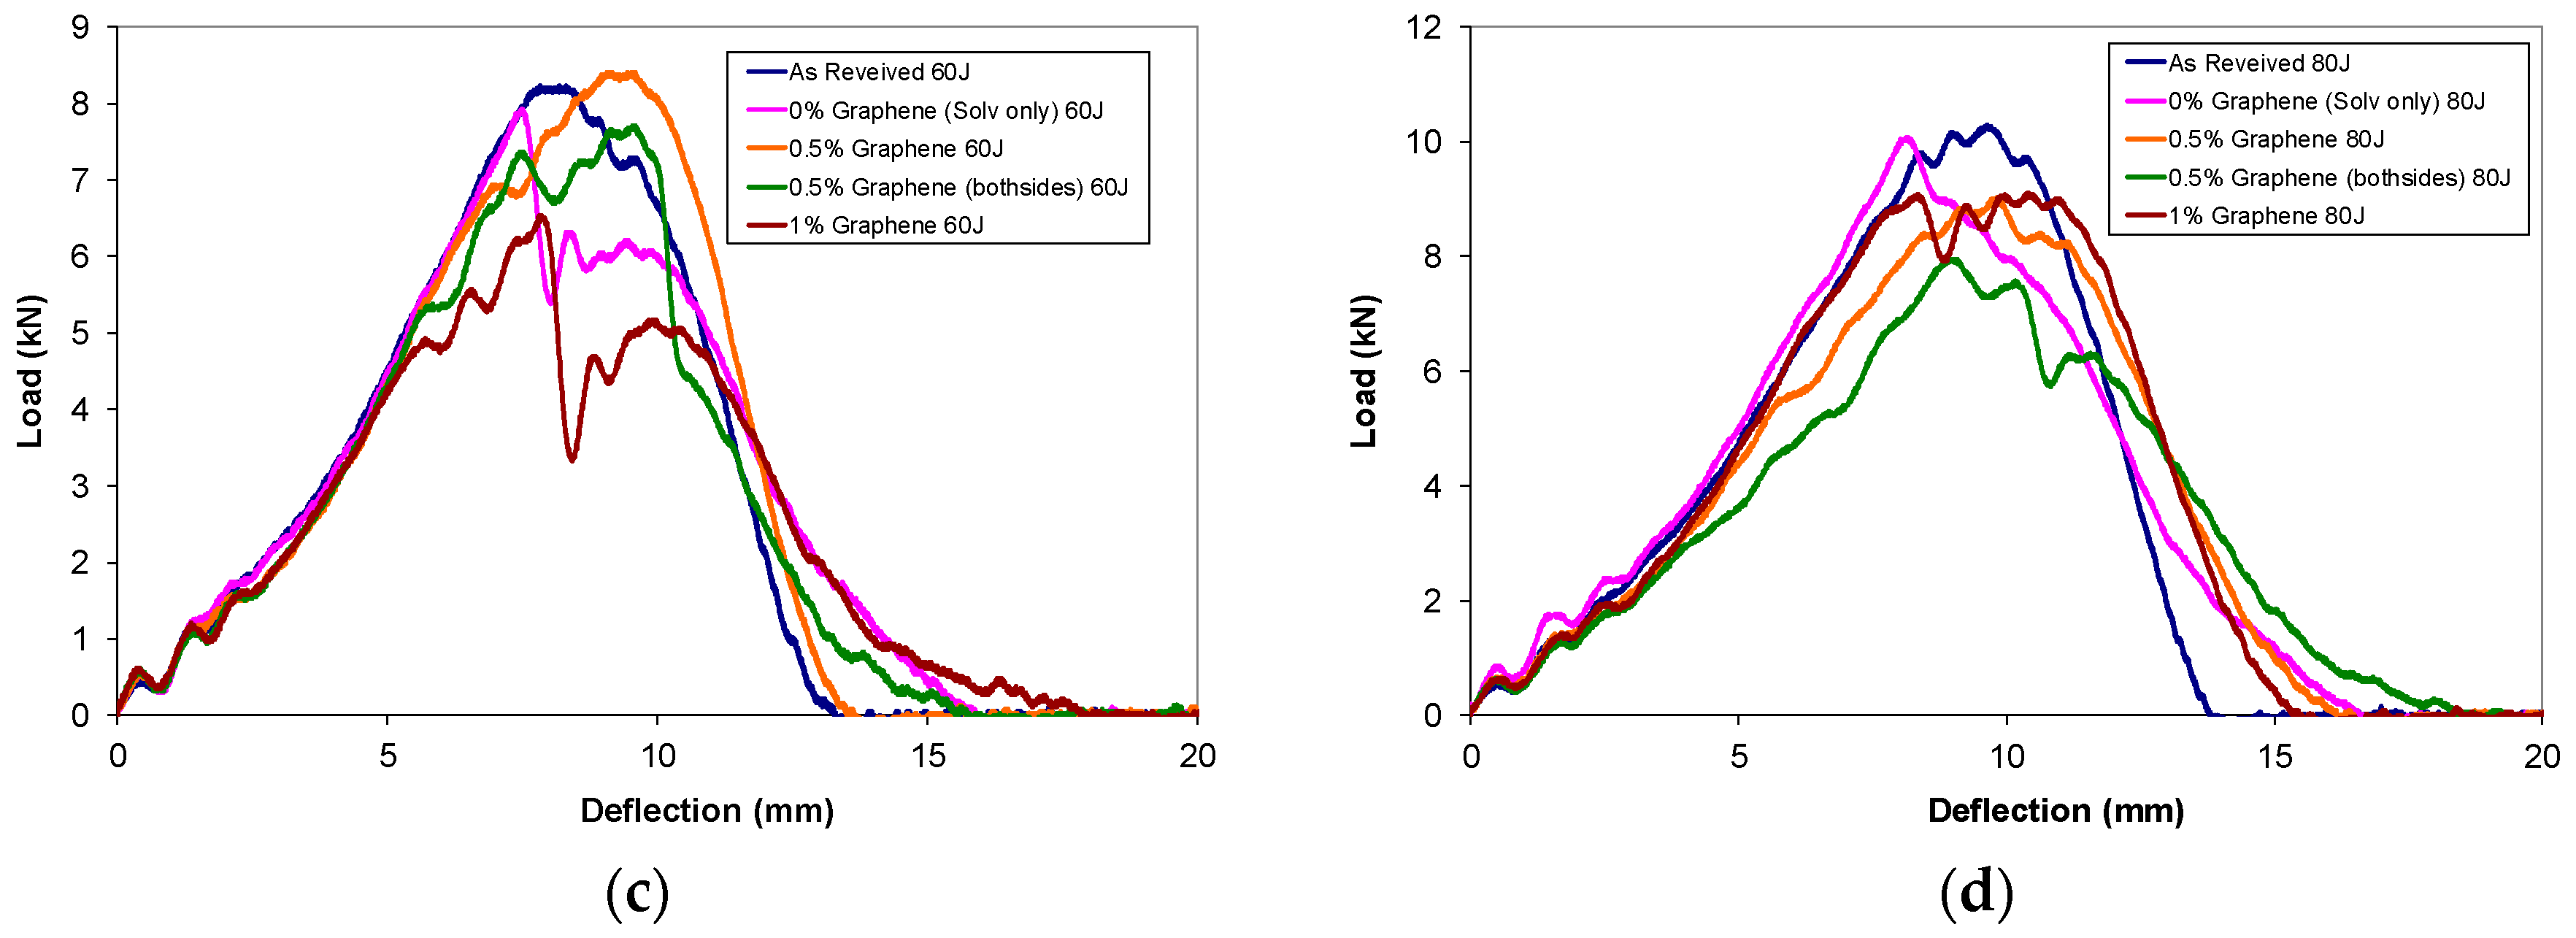
The data from the impact test system are presented in Figure 13 and Figure 14. The figures represent plots of load vs. time and load vs. deflection of different configurations of samples at 20, 40, 60 and 80 J energies. The slope of the load-time curve, which is designated as the contact stiffness, increases with the increasing amount of energy. The initial knee found in the load-time plot is due to the inertia effect of the impactor and the sample. Once the inertia of the impactor and samples matched, a relatively smooth load rise is seen. Data collection is triggered by means of velocity detector just before the drop weight impacts the sample. In the current study, the impact phenomenon is characterized in terms of peak load and absorbed energy. Table 1 gives values of the peak load and absorbed energy of all types of samples impacted at four energy levels. The absorbed energy is calculated as the difference of total energy at the end of the event, and the energy at peak load. Energy absorption in composites is mainly through two modes: elastic strain energy and through various damage modes. The composite laminates are brittle in nature and respond elastically until they reach the peak load. If the impact energy is higher than the energy absorbed until the peak load, the additional energy is taken up in the creation of damage with a small amount of energy lost in friction between the sample and the impactor. As the impact energy is increased, the laminate undergoes large deformation. The next failure that takes place will be the tensile failure of the back surface due to flexure.
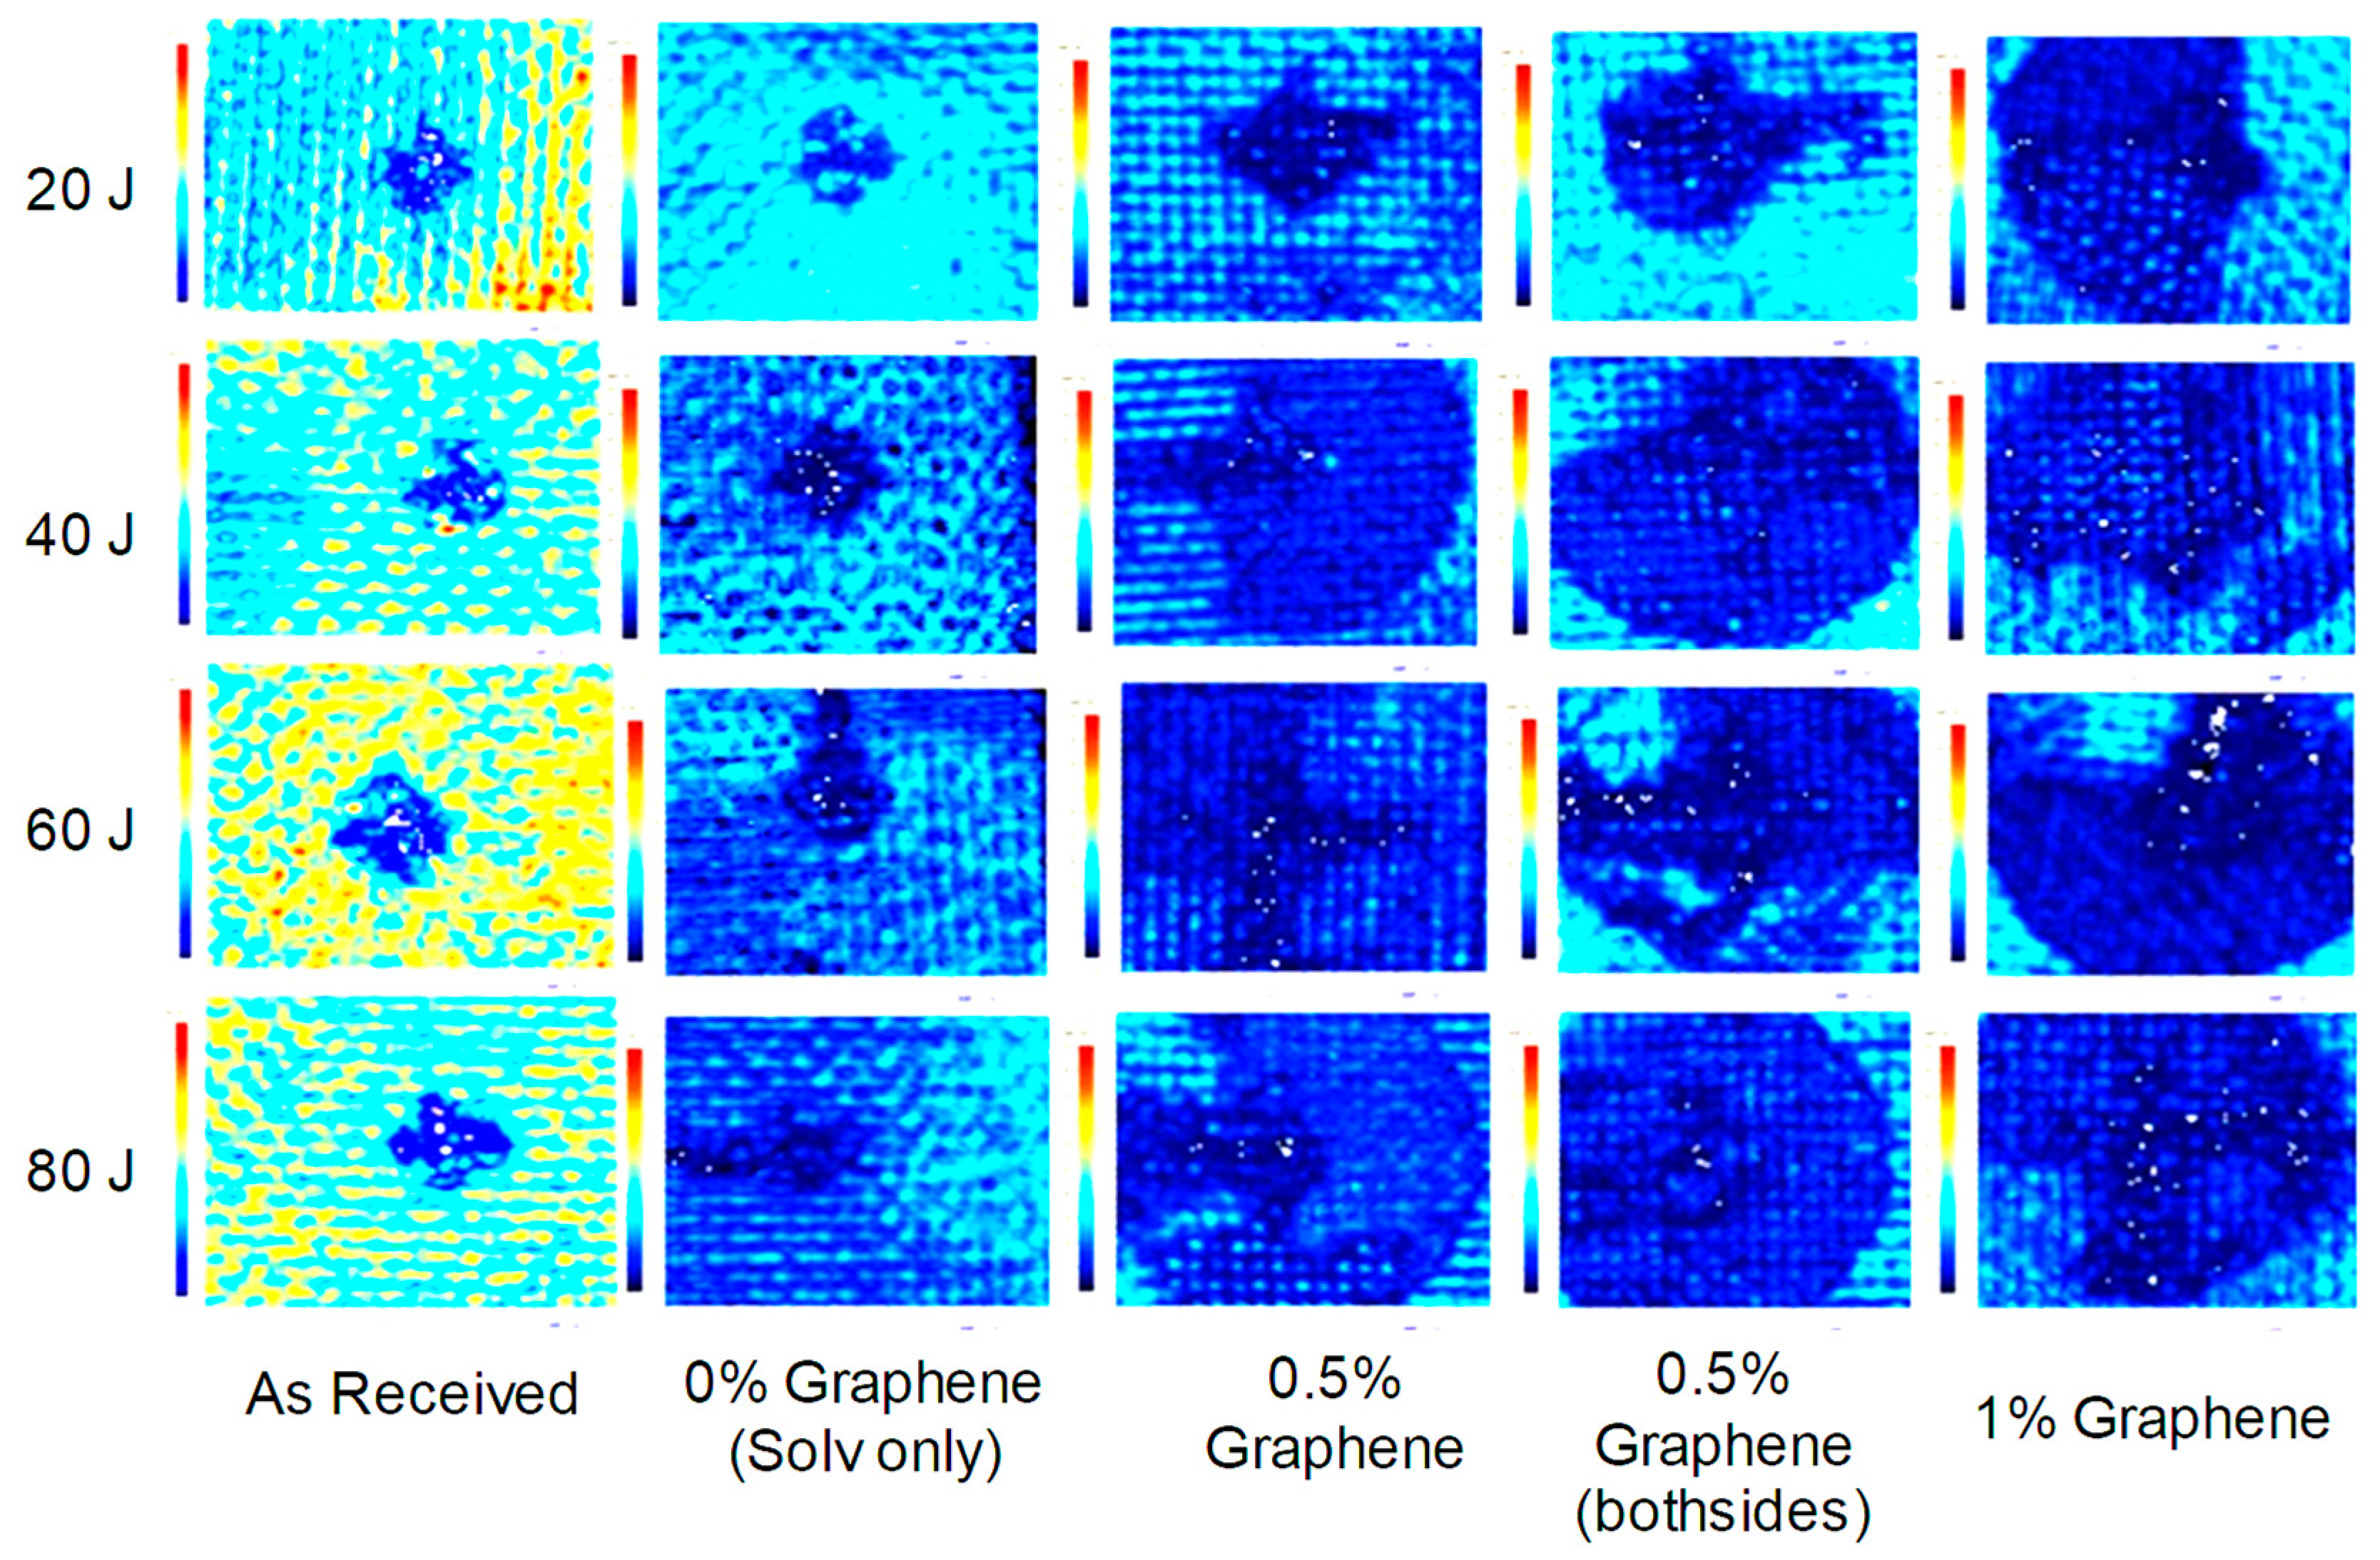
In Figure 13 and Figure 14, the sudden drop in force between 2 ms and 4 ms represents damage or delamination, mostly occurring in graphene coated samples. The damage in the “As Received” and 0% graphene is more localized and can be seen in the C-scan in Figure 15. The damage area was not clearly visible through naked eye for the graphene coated samples. The C-scan images showed that the damage area was in-between the plies due to delamination and this phenomena increased as the graphene concentration increased. It can be inferred that the inclusion of graphene into the samples resisted the propagation of cracks and through thickness penetration.
4. Conclusions
Graphene coating solutions were prepared by exfoliating graphite powder in a solvent using mechanical stirring and ultrasonication. Controllable amounts of graphene were successfully coated onto either one surface only or both surfaces of a glass fiber reinforcement using a brush coating technique. The solution coating was found viable method for introducing graphene in a reinforcing fabric for liquid composite molding process. The VARTM processing characteristics, such as compaction response and permeability of the coated fabrics were measured. The compaction response results show that as the graphene wt % increased, the resistance to compaction also increased. The transverse permeability of graphene coated samples did not change much except for the solvent treated samples, where the permeability was found to be higher due to possible removal or dissolution of the sizing in the solvent. The advancing front or transient permeability decreased with increase in graphene wt % which was mainly due to increase in resistance due to inclusions. Panels were manufactured for mechanical testing. The micrographs show that graphene dispersed well in the glass fabric with a very small amount of washout. The flexural modulus did not change much but the flexural strength decreased as the graphene wt % increased. The low velocity impact and C-scan results show that the addition of graphene in a structure will absorb and distribute the energy under impact loading and resist through thickness damage.
Author Contributions
Rehan Umer conducted all the experiments and data analysis including writing of the manuscript.
Conflicts of Interest
The author declares no conflict of interest.
References
- Potts, J.R.; Dreyer, D.R.; Bielawski, C.W.; Ruoff, R.S. Graphene-based polymer nanocomposites. Polymer 2011, 52, 5–25. [Google Scholar] [CrossRef]
- Spitalsky, Z.; Tasis, D.; Papagelis, K.; Galiotis, C. Carbon nanotube-polymer composites: Chemistry, processing, mechanical and electrical properties. Prog. Polym. Sci. 2010, 35, 357–401. [Google Scholar] [CrossRef]
- Kuilla, T.; Bhadra, S.; Yao, D.; Kim, N.H.; Bose, S.; Lee, J.H. Recent advances in graphene based polymer composites. Prog. Polym. Sci. 2010, 35, 1350–1375. [Google Scholar] [CrossRef]
- Xu, Y.; Hong, W.; Bai, H.; Li, C.; Shi, G. Preparation and characterization of graphene/poly(vinyl alcohol) nanocomposites. Carbon 2009, 47, 3538–3543. [Google Scholar] [CrossRef]
- Samad, Y.; Li, Y.; Alhassan, S.; Liao, K. Novel Graphene Foam Composite with Adjustable Sensitivity for Sensor Applications. ACS Appl. Mater. Interfaces 2015, 7, 9195–9202. [Google Scholar] [CrossRef] [PubMed]
- Ponnamma, D.; Guo, Q.; Krupa, I.; Al-Maadeed, M.A.S.A.; Varughese, K.T.V.; Thomas, S.; Sadasivuni, K.K. Graphene and graphitic derivative filled polymer composites as potential sensors. Phys. Chem. Chem. Phys. 2015, 17, 3954–3981. [Google Scholar] [CrossRef] [PubMed]
- Lee, X.; Yang, T.; Li, X.; Zhang, R.; Zhu, M.; Zhang, H.; Xie, D.; Wei, J.; Zhong, M.; Wang, K. Flexible graphene woven fabrics for touch sensing. Appl. Phys. Lett. 2013, 102, 163117. [Google Scholar] [CrossRef]
- Aguilera-Servin, J.; Miao, T.; Bockrath, M. Nanoscale pressure sensors realized from suspended graphene membrane devices. Appl. Phys. Lett. 2015, 106, 083103. [Google Scholar] [CrossRef]
- Zhu, S.; Ghatkesar, M.; Zhang, C.; Janssen, G. Graphene based piezoresistive pressure sensor. Appl. Phys. Lett. 2013, 102, 161904. [Google Scholar] [CrossRef]
- Kim, S.; Drzal, L.T. Thermal stability and dynamic mechanical behavior of exfoliated graphite nanoplatelets–LLDPE composites. Polym. Compos. 2009, 31, 755–761. [Google Scholar] [CrossRef]
- Jiang, X.; Drzal, L.T. Multifunctional high density polyethylene nanocomposites produced by incorporation of exfoliated graphite nanoplatelets 1: Morphology and mechanical properties”. Polym. Compos. 2010, 31, 1091–1098. [Google Scholar] [CrossRef]
- Biswas, S.; Fukushima, H.; Drzal, L.T. Mechanical and electrical property enhancement in exfoliated graphene nanoplatelet/liquid crystalline polymer nanocomposites. Compos. Part A 2011, 42, 371–375. [Google Scholar] [CrossRef]
- Stankovich, S.; Dikin, D.A.; Dommett, G.H.B.; Kohlhaas, K.M.; Zimney, E.J.; Stach, E.A.; Piner, R.D.; Nguyen, S.T.; Ruoff, R.S. Graphene-based composite materials. Nat. Lett. 2006, 442, 282–286. [Google Scholar] [CrossRef] [PubMed]
- Sun, L.; Gibson, R.F.; Gordaninejad, F.; Suhr, J. Energy absorption capability of nanocomposites: A review. Compos. Sci. Technol. 2009, 69, 2392–2409. [Google Scholar] [CrossRef]
- Singh, V.; Joung, D.; Zhai, L.; Das, S.; Khondaker, S.I.; Seal, S. Graphene based materials: Past, present and future. Prog. Mater. Sci. 2011, 56, 1178–1271. [Google Scholar] [CrossRef]
- Ávila, A.F.; Soares, M.I.; Neto, A.S. A Study on nanostructured laminated plates behavior under low-velocity impact loadings. Int. J. Impact Eng. 2007, 34, 28–41. [Google Scholar] [CrossRef]
- Fan, Z.; Hsiao, K.T.; Advani, S.G. Experimental investigation of dispersion during flow of multi-walled carbon nanotube/polymer suspension in fibrous porous media. Carbon 2004, 42, 871–876. [Google Scholar] [CrossRef]
- Lin, L.Y.; Lee, J.H.; Hong, C.E.; Yoo, G.H.; Advani, S.G. Preparation and characterization of layered silicate/glass fiber/epoxy hybrid nanocomposites via vacuum-assisted resin transfer molding (VARTM). Compos. Sci. Technol. 2006, 66, 2116–2125. [Google Scholar] [CrossRef]
- Zhou, Y.; Pervin, F.; Rangari, V.K.; Jeelani, S. Fabrication and evaluation of carbon nano fiber filled carbon/epoxy composite. Mater. Sci. Eng. A 2006, 426, 221–228. [Google Scholar] [CrossRef]
- Movva, S.; Zhou, G.; Guerra, D.; Lee, L.J. Effect of Carbon nano fibres on mold filling in a vacuum assisted resin transfer molding system. J. Compos. Mater. 2009, 43, 611–620. [Google Scholar] [CrossRef]
- Peila, R.; Seferis, J.C.; Karaki, T.; Parker, G. Effects of nanoclay on the thermal and rheological properties of a VARTM Epoxy Resin. J. Therm. Anal. Calorim. 2009, 96, 587–592. [Google Scholar] [CrossRef]
- Mahrholz, T.; Stängle, J.; Sinapius, M. Quantification of the reinforcement effect of silica nanoparticles in epoxy resins used in liquid composite molding processes. Compos. Part A 2009, 40, 235–243. [Google Scholar] [CrossRef]
- Umer, R.; Li, Y.; Dong, Y.; Haroosh, H.J.; Liao, K. The effect of graphene oxide (GO) nanoparticles on the processing of epoxy/glass fiber composites using resin infusion. Int. J. Adv. Manuf. Technol. 2015, 81, 2183–2192. [Google Scholar] [CrossRef]
- Ali, M.A.; Umer, R.; Khan, K.A.; Samad, Y.A.; Liao, K.; Cantwell, W.J. Graphene coated piezo-resistive fabrics for liquid composite molding process monitoring. Compos. Sci. Technol. 2017, 148, 106–114. [Google Scholar] [CrossRef]
- Wu, H.; Rook, B.; Drzal, L.T. Dispersion optimization of exfoliated graphite nanoplatelets in polyetherimide nanocomposites: Extrusion vs. precoating vs. solid state ball milling. Polym. Compos. 2009, 34, 426–432. [Google Scholar] [CrossRef]
- Maenosono, S.; Okubo, T.; Yamaguchi, Y. Overview of nanoparticle array formation by wet coating. J. Nanopart. Res. 2003, 5, 5–15. [Google Scholar] [CrossRef]
- Rachmadini, Y.; Tan, V.B.C.; Tay, T.E. Enhancement of Mechanical Properties of Composites through Incorporation of CNT in VARTM-A Review. J. Reinf. Plast. Compos. 2010, 29, 2782–2807. [Google Scholar] [CrossRef]
- Yavari, F.; Rafiee, M.A.; Rafiee, J.; Yu, Z.Z.; Koratkar, N. Dramatic increase in fatigue life in hierarchical graphene composites. ACS Appl. Mater. Interfaces 2010, 2, 2738–2743. [Google Scholar] [CrossRef] [PubMed]
- Simmons, C.T.; Darcy, H. Immortalised by his scientific legacy. Hydrogeol. J. 2008, 16, 1023–1038. [Google Scholar] [CrossRef]
Figure 1.
(a) Preparation of graphene solution through ultrasonication; (b) graphene coating process onto plain weave glass fabric.
Figure 1.
(a) Preparation of graphene solution through ultrasonication; (b) graphene coating process onto plain weave glass fabric.
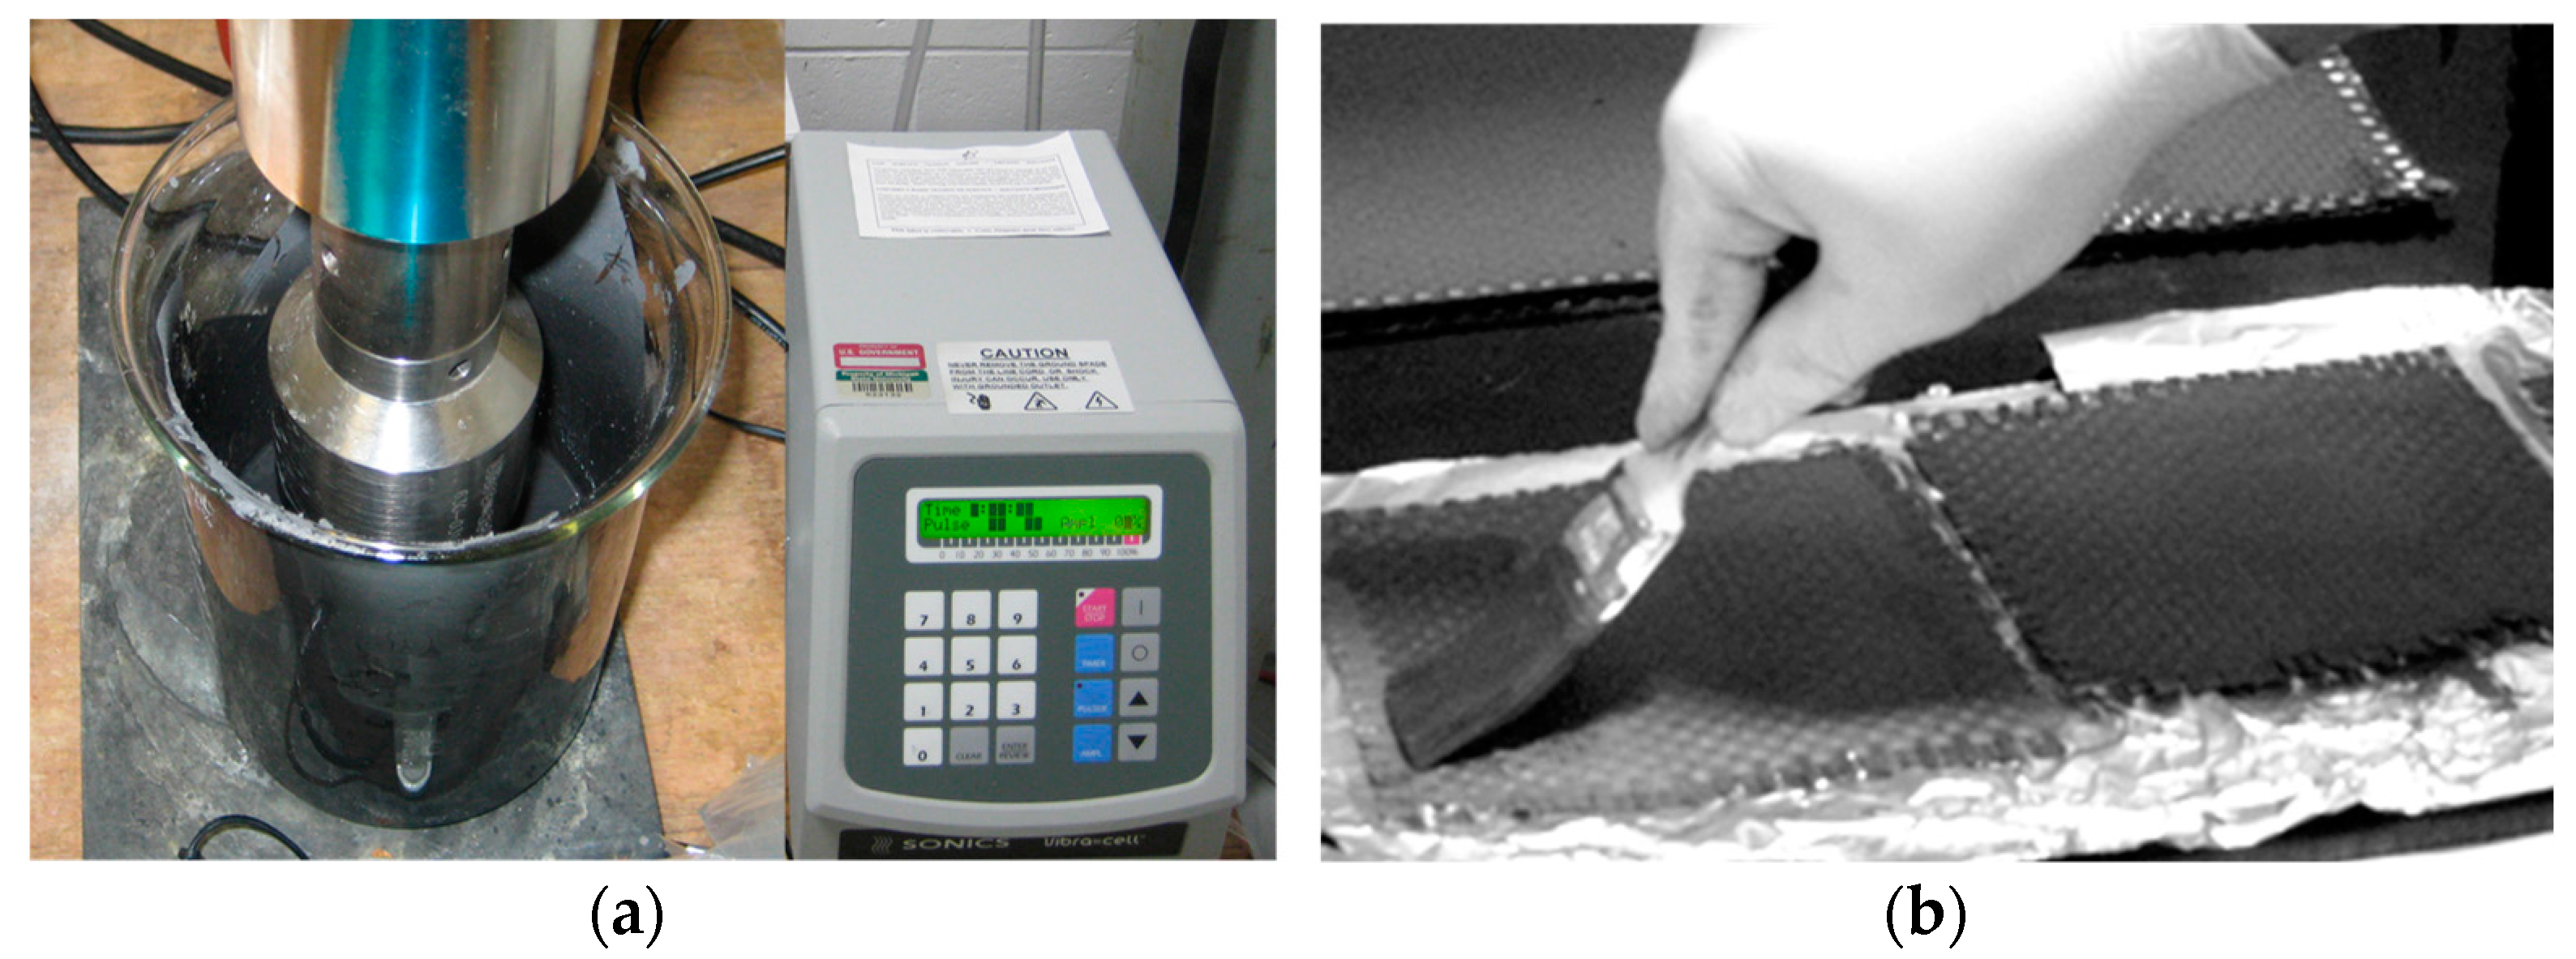
Figure 2.
Picture of the compaction test setup.

Figure 3.
(a) Schematic diagram of Transverse Permeability Fixture; and (b) photograph of the fixture.
Figure 3.
(a) Schematic diagram of Transverse Permeability Fixture; and (b) photograph of the fixture.

Figure 4.
In-plane permeability experimental setup.

Figure 5.
Four point flexural test (a) test fixture with sample; (b) schematic of the one third of the support span test setup according to ASTM D6272.
Figure 5.
Four point flexural test (a) test fixture with sample; (b) schematic of the one third of the support span test setup according to ASTM D6272.
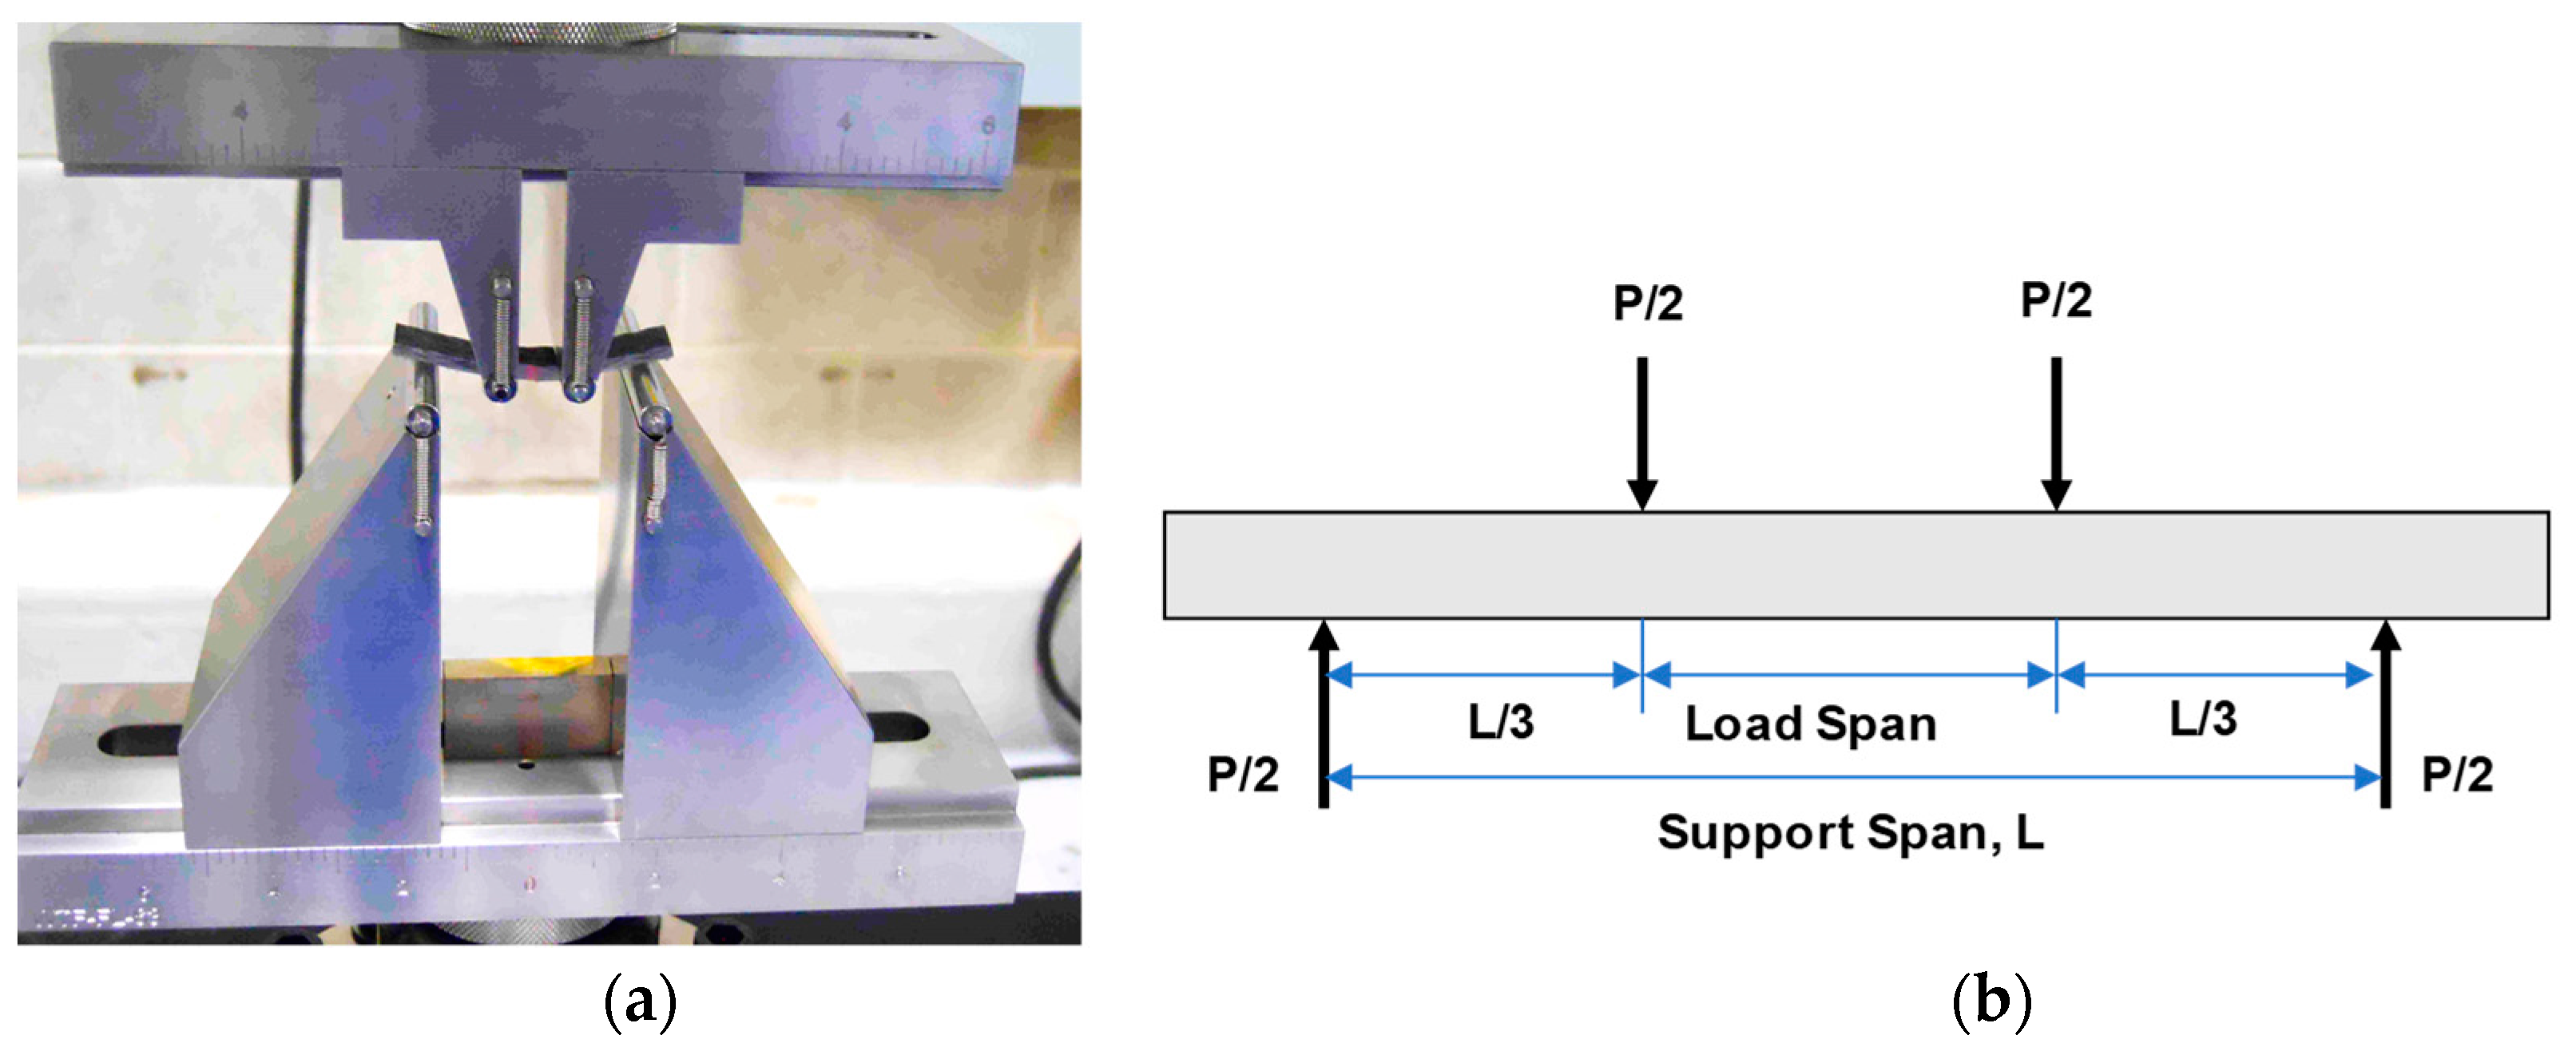
Figure 6.
Compaction response of different percentages of graphene coated glass fiber reinforcement.
Figure 6.
Compaction response of different percentages of graphene coated glass fiber reinforcement.

Figure 7.
Transverse permeability results of different percentages of graphene coated glass fiber reinforcement.
Figure 7.
Transverse permeability results of different percentages of graphene coated glass fiber reinforcement.
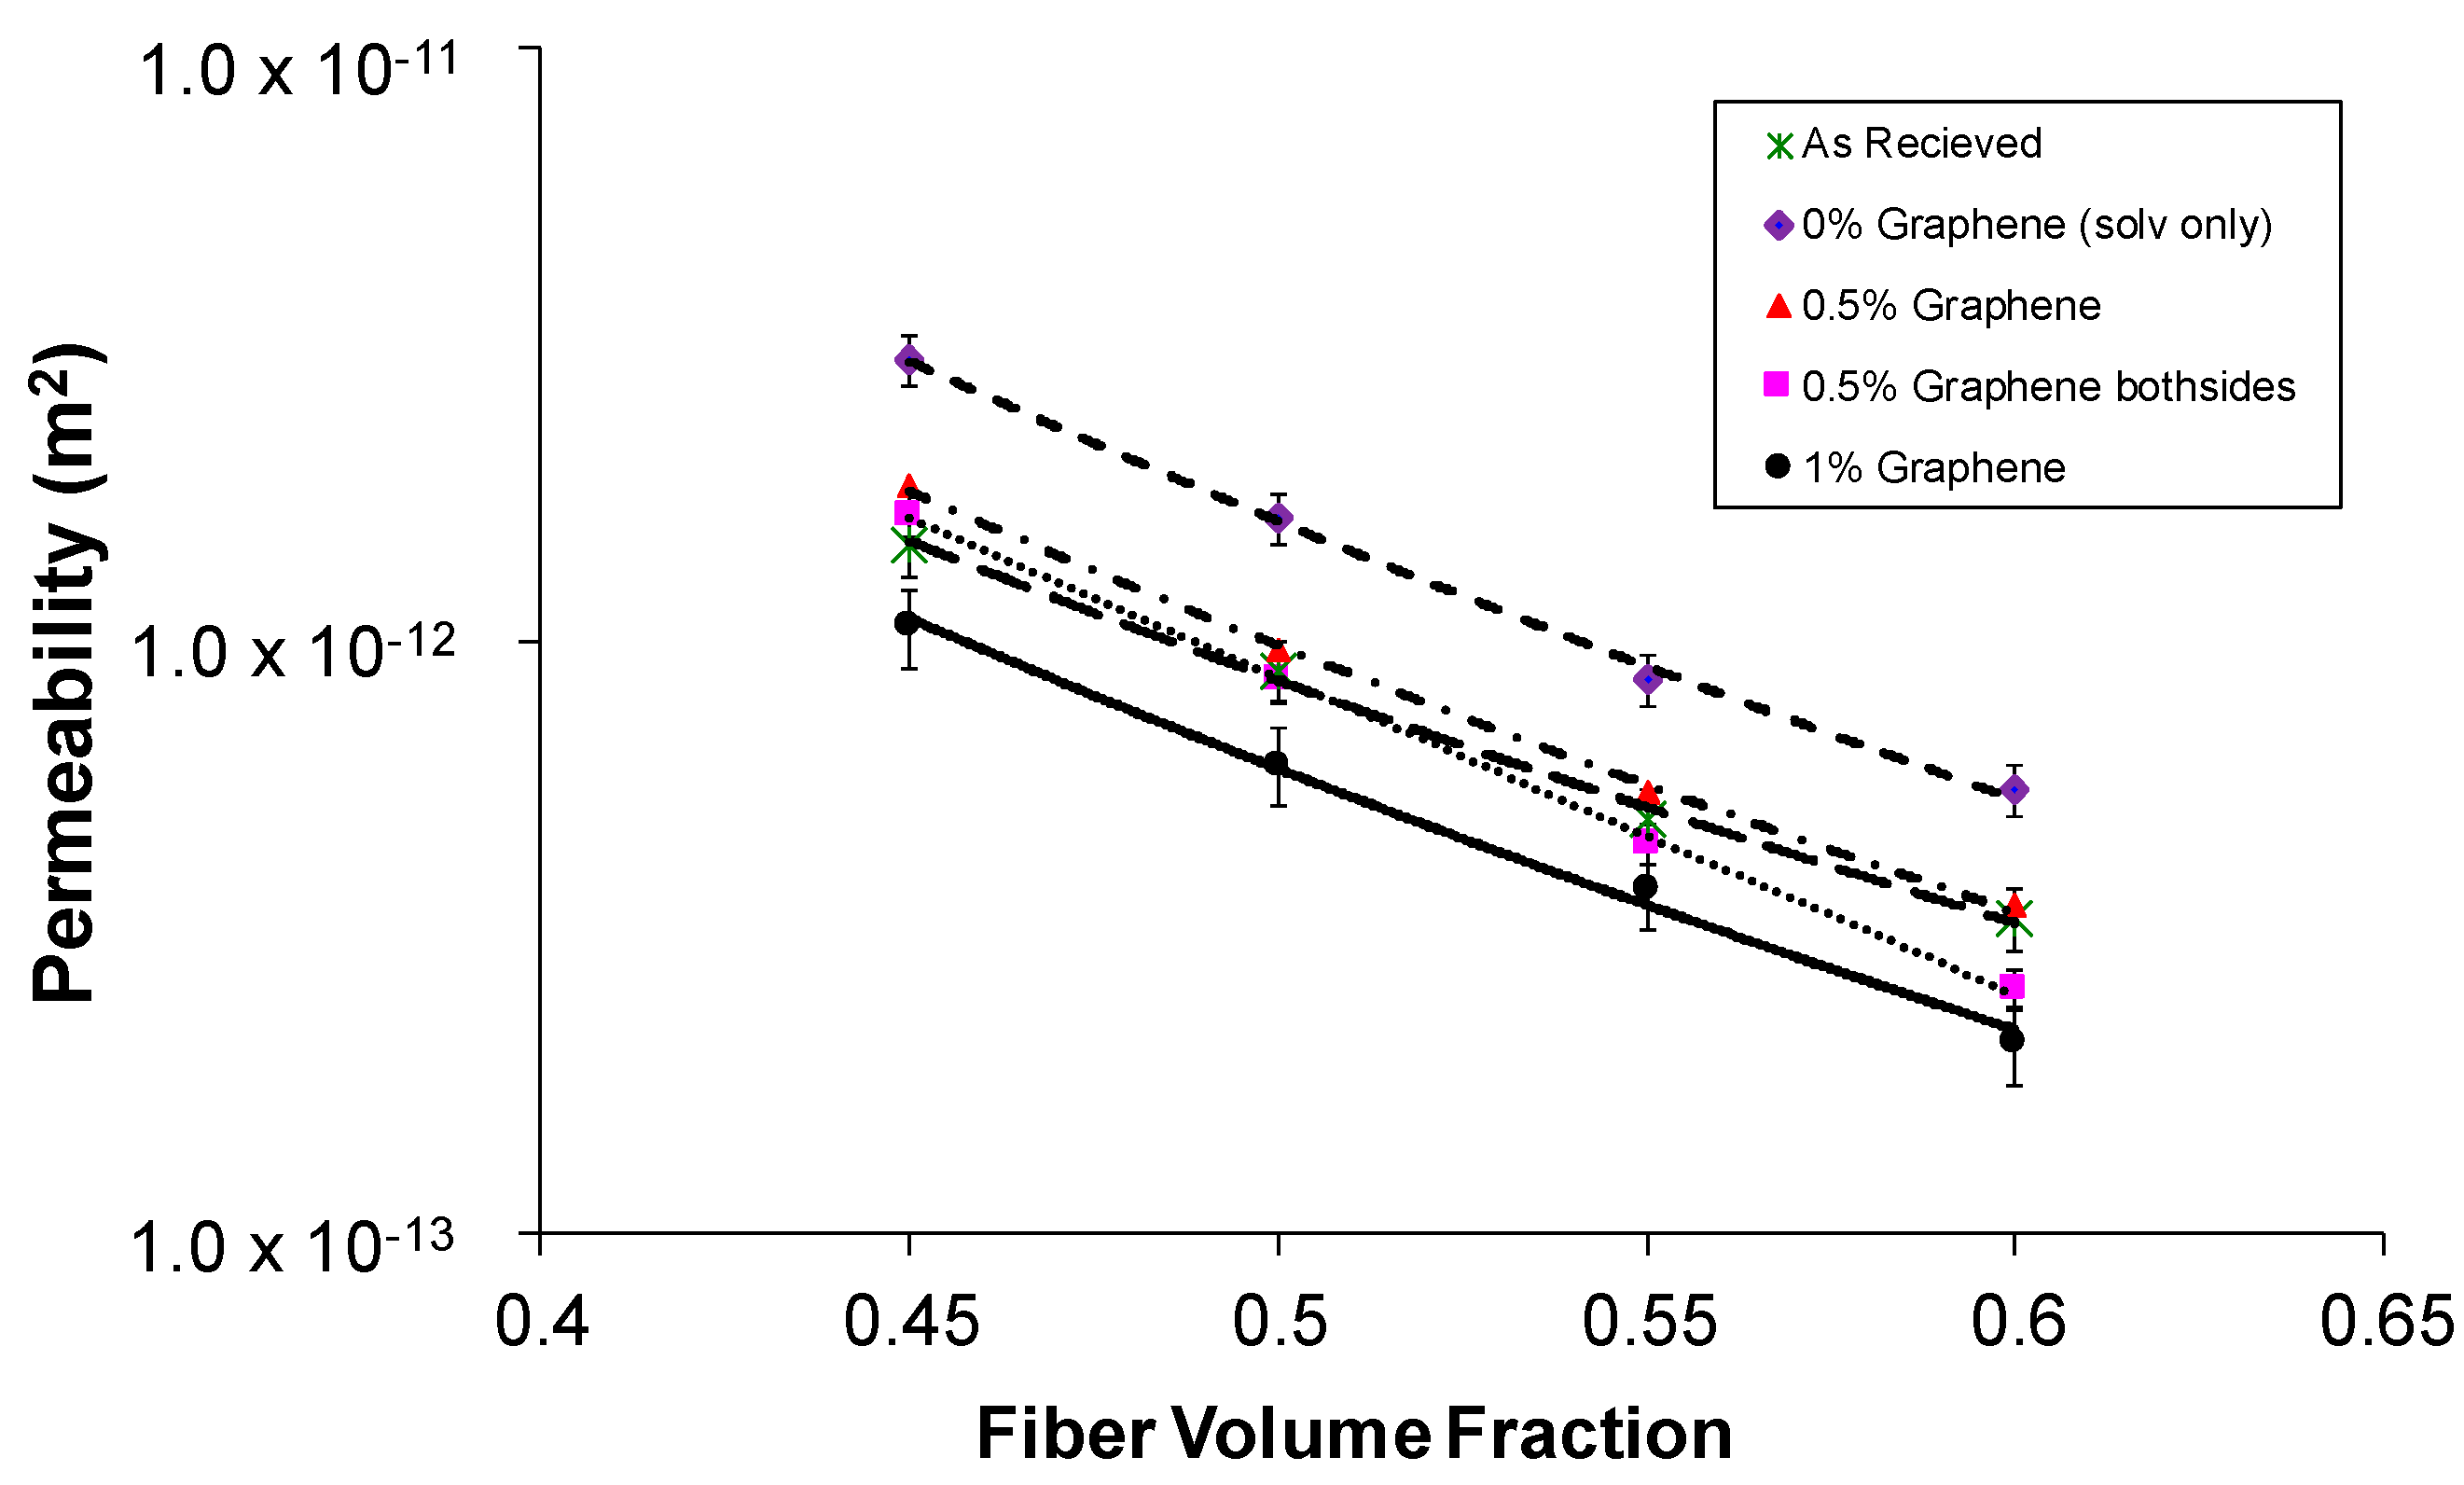
Figure 8.
Transient permeability results of different percentages of graphene coated glass fiber reinforcement.
Figure 8.
Transient permeability results of different percentages of graphene coated glass fiber reinforcement.

Figure 9.
Optical microscopy images of graphene coated glass fiber composites at two different magnifications. (a) low magnification; (b) high magnification.
Figure 9.
Optical microscopy images of graphene coated glass fiber composites at two different magnifications. (a) low magnification; (b) high magnification.
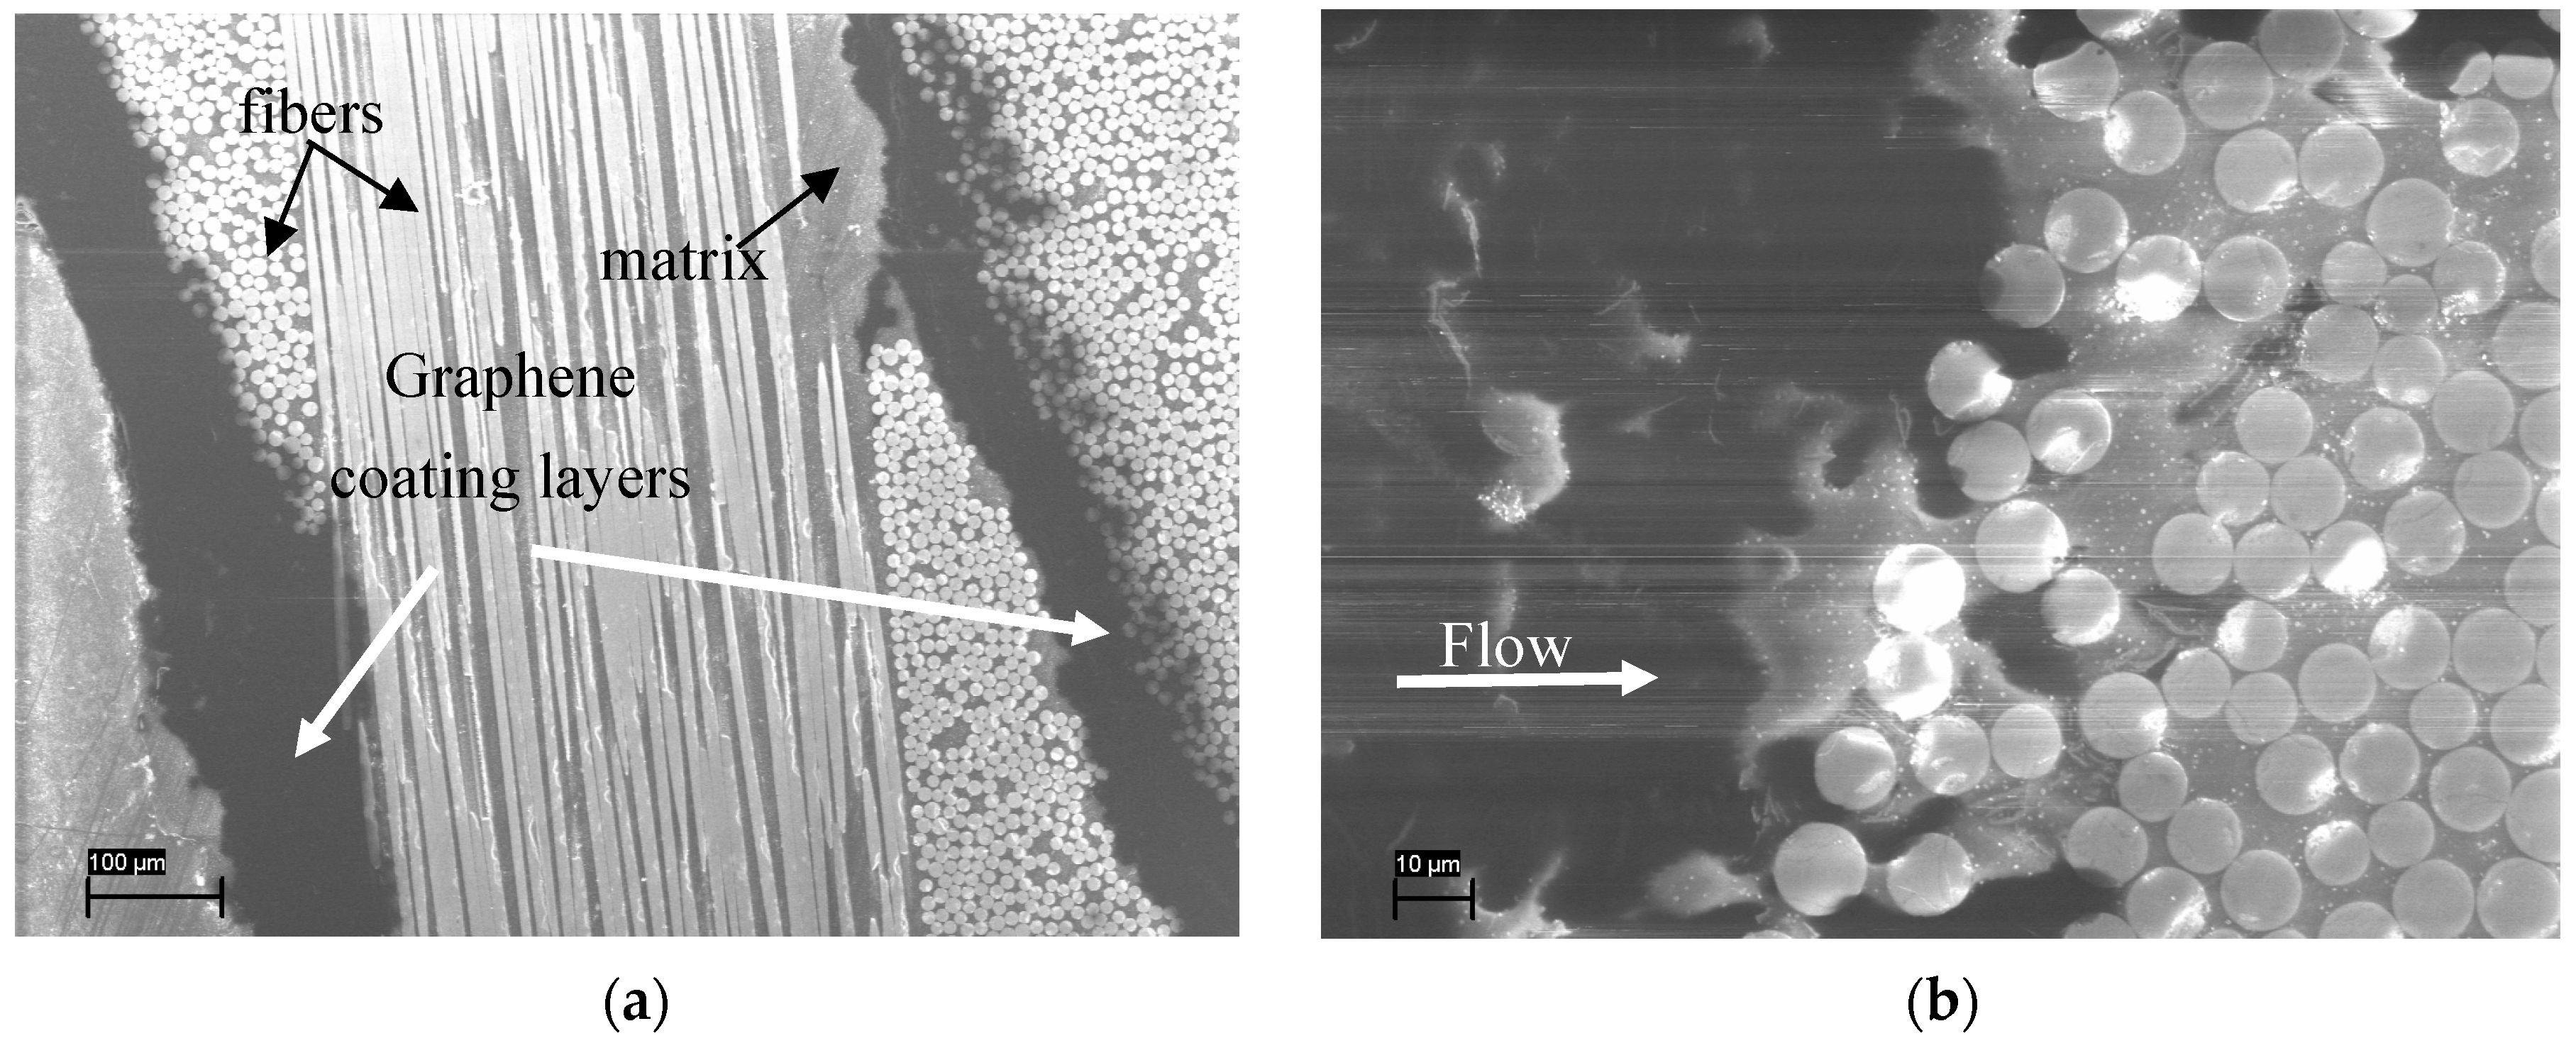
Figure 10.
SEM images of graphene coated glass fiber composites at two different magnifications. (a) low magnification; (b) high magnification.
Figure 10.
SEM images of graphene coated glass fiber composites at two different magnifications. (a) low magnification; (b) high magnification.
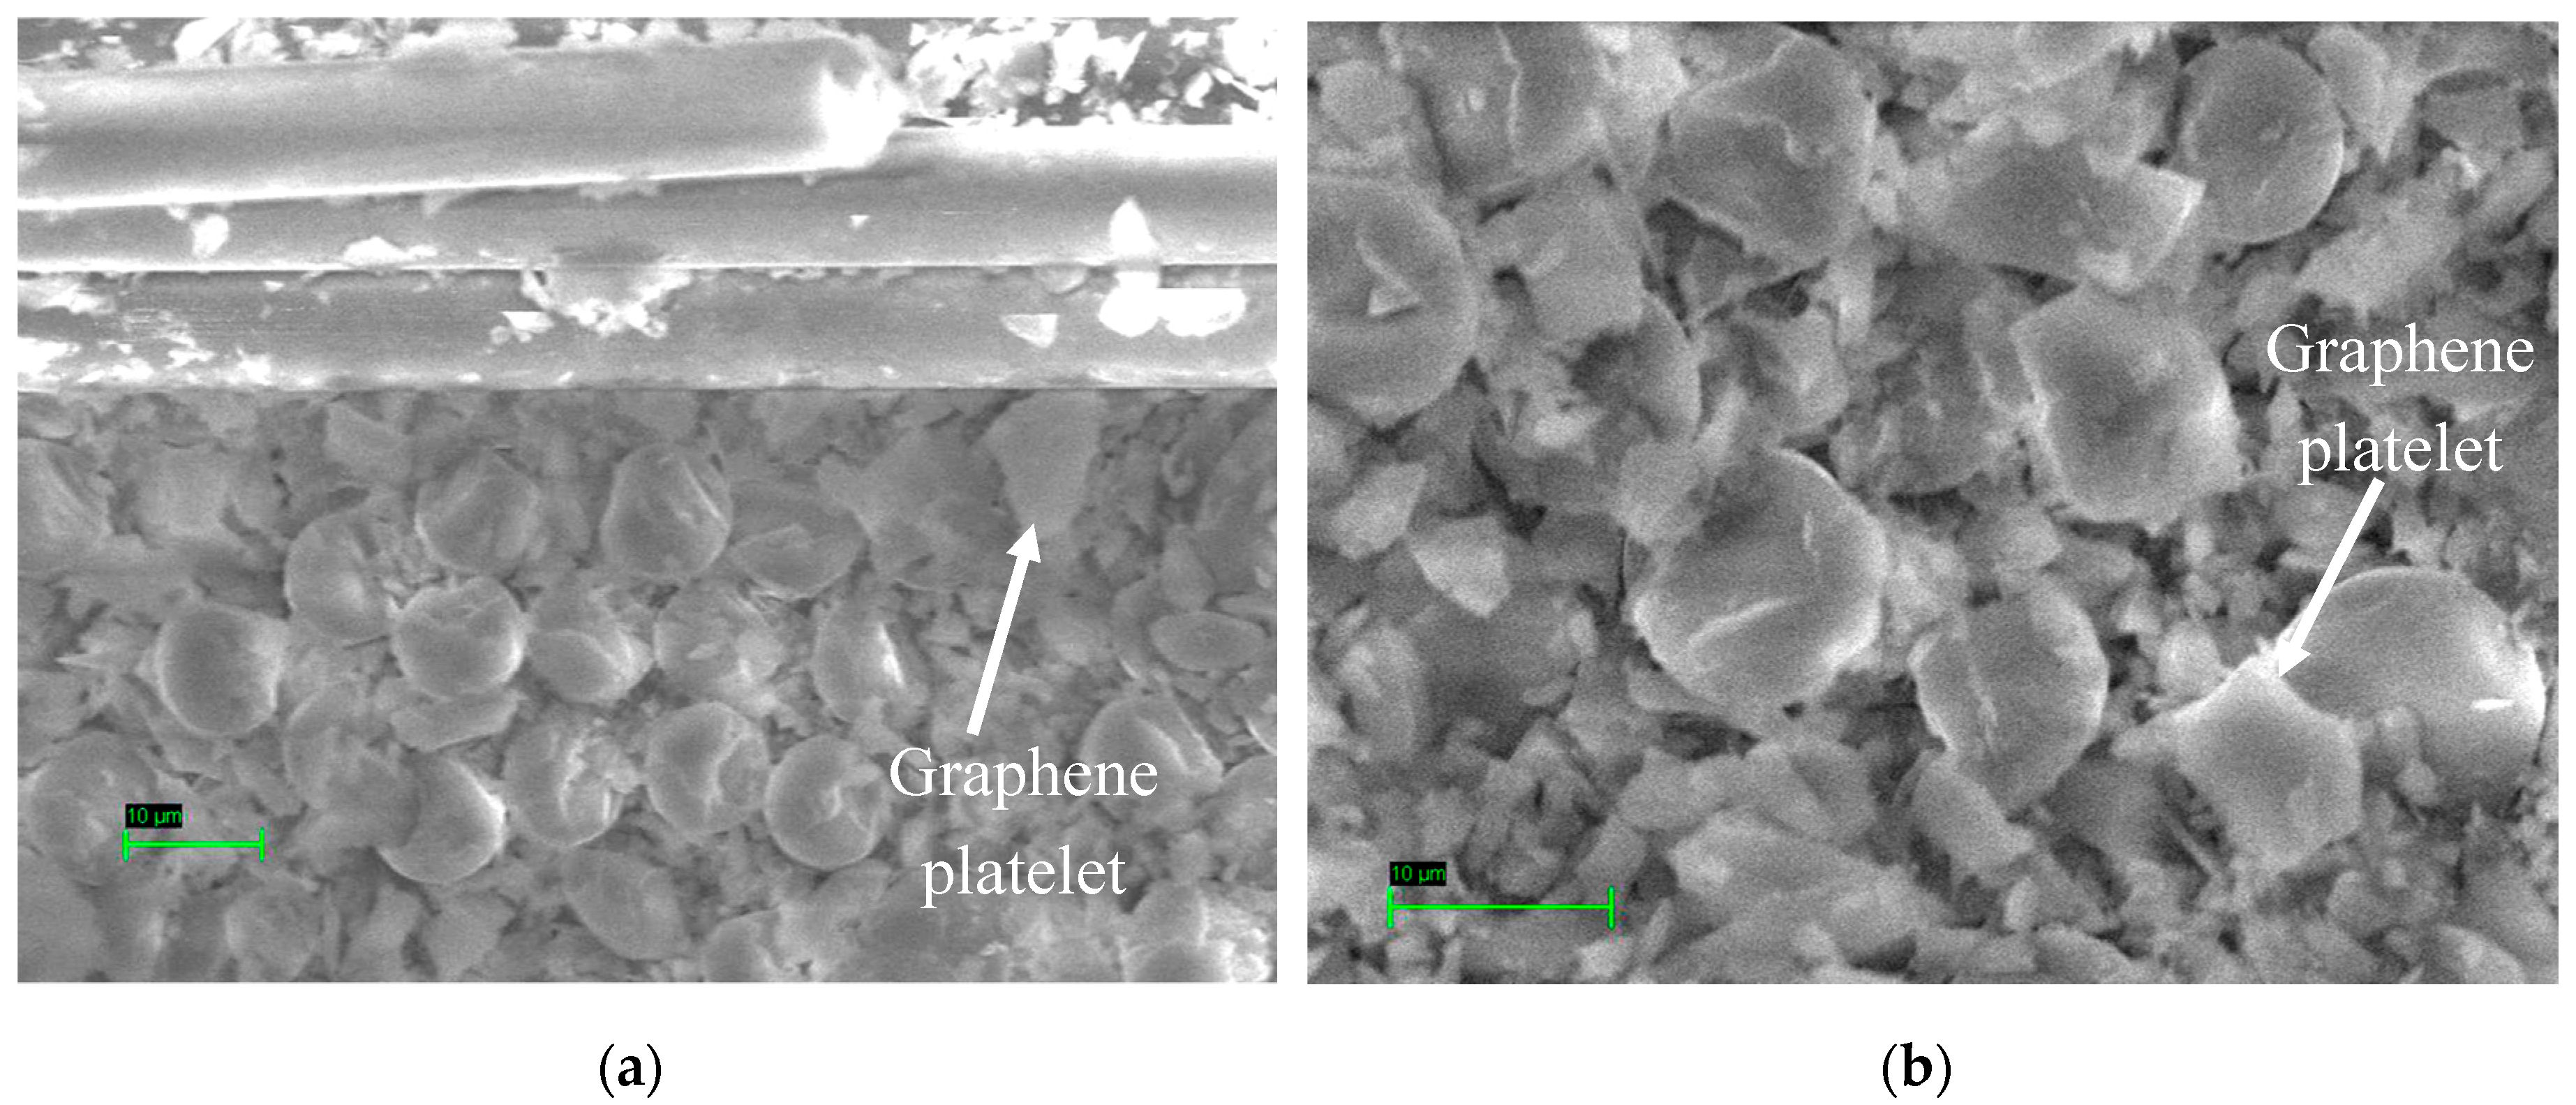
Figure 11.
Load vs. deflection curves for different percentages of graphene coated glass fiber composites.
Figure 11.
Load vs. deflection curves for different percentages of graphene coated glass fiber composites.

Figure 12.
Flexural properties of different percentages of graphene coated glass fiber composites (a) flexural Modulus; (b) flexural Strength.
Figure 12.
Flexural properties of different percentages of graphene coated glass fiber composites (a) flexural Modulus; (b) flexural Strength.


Figure 13.
Load vs. time of glass fiber composites under impact (a) 20 J, (b) 40 J, (c) 60 J, and (d) 80 J.
Figure 13.
Load vs. time of glass fiber composites under impact (a) 20 J, (b) 40 J, (c) 60 J, and (d) 80 J.
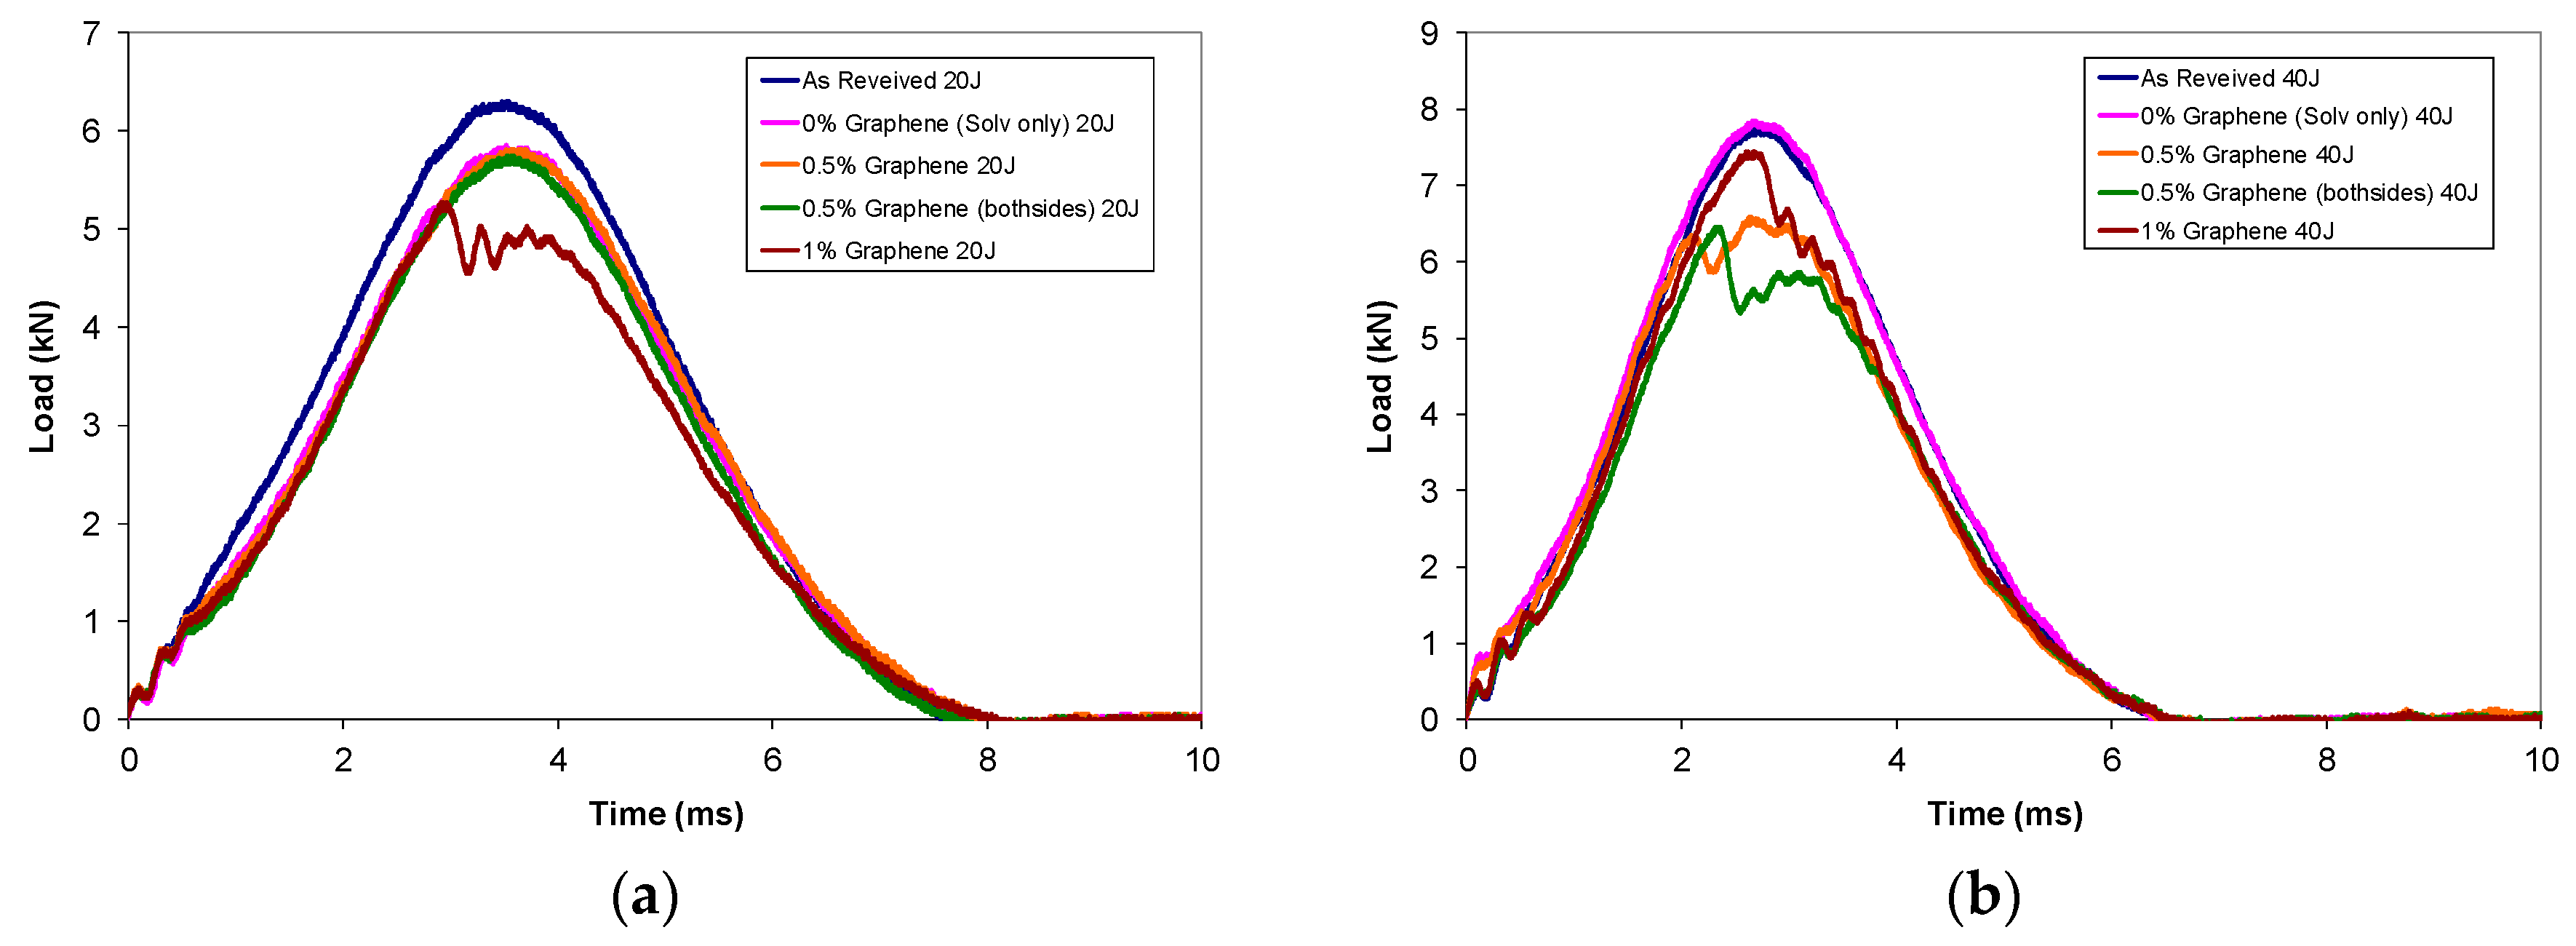

Figure 14.
Load vs. deflection of glass fiber composites under impact (a) 20 J, (b) 40 J, (c) 60 J, and (d) 80 J.
Figure 14.
Load vs. deflection of glass fiber composites under impact (a) 20 J, (b) 40 J, (c) 60 J, and (d) 80 J.
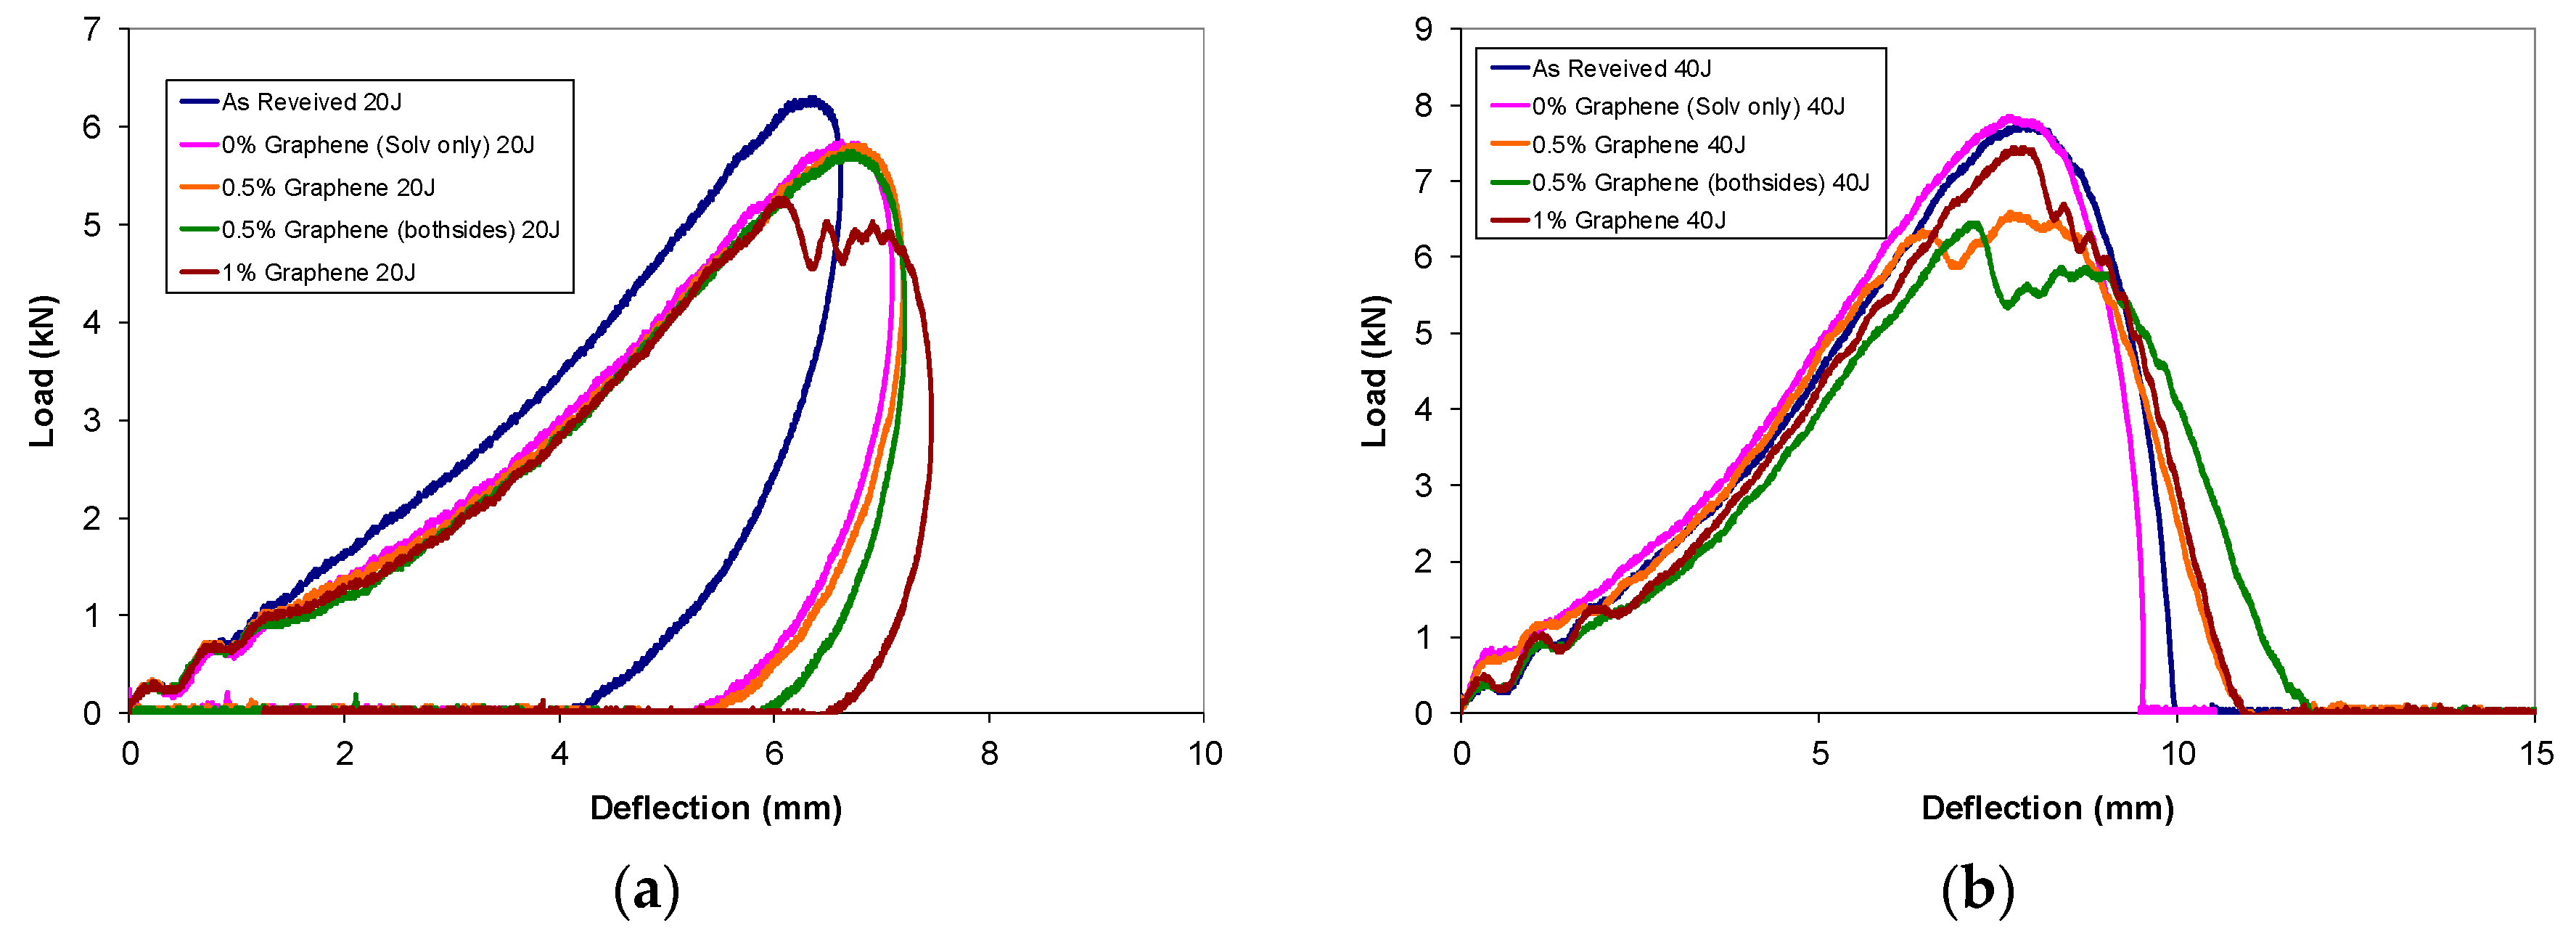

Figure 15.
Ultrasonic images of impacted graphene coated glass fiber composites at different energy levels.
Figure 15.
Ultrasonic images of impacted graphene coated glass fiber composites at different energy levels.


Table 1.
Peak load and absorbed energy.
| As Received | 0% Graphene | 0.5% Graphene | 0.5% Graphene Bothsides | 1% Graphene | |
|---|---|---|---|---|---|
| 20 J | |||||
| Peak Load (kN) | 6.3 | 5.86 | 5.81 | 5.75 | 5.27 |
| Absorbed energy (J) | 0.1 | 0.49 | 0.14 | 1.44 | 5.75 |
| 40 J | |||||
| Peak Load (kN) | 7.74 | 7.85 | 6.59 | 6.45 | 7.44 |
| Absorbed energy (J) | 12.05 | 11.71 | 13.57 | 18.7 | 14.21 |
| 60 J | |||||
| Peak Load (kN) | 8.23 | 7.92 | 8.4 | 7.71 | 6.53 |
| Absorbed energy (J) | 26.48 | 29.86 | 21.1 | 14.33 | 24.93 |
| 80 J | |||||
| Peak Load (kN) | 10.29 | 10.07 | 9.02 | 7.95 | 9.11 |
| Absorbed energy (J) | 24.12 | 39.02 | 29.1 | 33.55 | 23.79 |
© 2018 by the author. Licensee MDPI, Basel, Switzerland. This article is an open access article distributed under the terms and conditions of the Creative Commons Attribution (CC BY) license (http://creativecommons.org/licenses/by/4.0/).
Share and Cite
MDPI and ACS Style
Umer, R. Manufacturing and Mechanical Properties of Graphene Coated Glass Fabric and Epoxy Composites. J. Compos. Sci. 2018, 2, 17. https://doi.org/10.3390/jcs2020017
AMA Style
Umer R. Manufacturing and Mechanical Properties of Graphene Coated Glass Fabric and Epoxy Composites. Journal of Composites Science. 2018; 2(2):17. https://doi.org/10.3390/jcs2020017
Chicago/Turabian StyleUmer, Rehan. 2018. "Manufacturing and Mechanical Properties of Graphene Coated Glass Fabric and Epoxy Composites" Journal of Composites Science 2, no. 2: 17. https://doi.org/10.3390/jcs2020017