Capillary Characterization of Fibrous Reinforcement and Optimization of Injection Strategy in Resin Transfer Molding

Department of Mechanical Engineering, Research Center for High Performance Polymer and Composite Systems (CREPEC), École Polytechnique de Montréal, Montréal, QC H3T 1J4, Canada
*
Author to whom correspondence should be addressed.
J. Compos. Sci. 2018, 2(2), 19; https://doi.org/10.3390/jcs2020019
Submission received: 12 February 2018
/
Revised: 14 March 2018
/
Accepted: 21 March 2018
/
Published: 26 March 2018
(This article belongs to the Special Issue Advanced Composite Materials Applied to Structural Mechanics)
Abstract
:During composite manufacturing, minimizing the residual void content is a key issue to ensure optimal mechanical performance of final products. For injection processes such as Resin Transfer Molding (RTM), the impregnation velocity has a direct impact on void creation at the flow front by mechanical entrapment of air bubbles. Previous work proposed to study capillary imbibition in fibrous reinforcement to determine optimal filling conditions during practical manufacturing. The objective of this study is to investigate further this possibility. For that purpose, an improved experimental procedure is proposed to estimate the optimal impregnation velocity from capillary rise tests and understand its effect in parts of varying geometry. Capillary rise experiments were carried out with an enhanced experimental protocol, and a new post processing technique was evaluated to analyze the results. The position of the capillary flow front was then used to deduce the optimal impregnation velocity range based on the Lucas-Washburn flow model. A series of injections were also carried out with a laboratory scale RTM mold to study the influence of flow velocity on the residual void content. Results show that the prediction from capillary characterization is close to the optimal velocity value deduced from manufacturing experiments. The study also highlights the importance of void transport during processing and suggests that the injection strategy (i.e., flow rate history) and the mold configuration (i.e., divergent versus convergent flow) are important process parameters that may influence void content and cycle time.
1. Introduction
Liquid Composite Molding (LCM) processes such as Resin Transfer Molding (RTM) are increasingly used to manufacture high performance composites structures in a large number of industrial applications (aerospace, ground transport, etc.) [1,2,3]. This manufacturing method consists of injecting a thermosetting liquid resin in a rigid mold that contains a dry fibrous reinforcement. The saturation level resulting from this injection stage is critical to ensure adequate mechanical performance of the final product [4]. As a matter of fact, the presence of voids in fiber reinforced composites can reduce significantly the mechanical properties of the material [5,6,7].
Voids of different origins can be created during composite processing by resin injection. The first cause is mechanical entrapment of residual air during mold filling. The second reason is connected with the chemical reaction of polymerization, during which volatiles are created in some resin systems during cure. Several technological issues contribute also to void creation: leaks in the mold cavity, improper resin degassing, air entrapment in the injection system, use of non-compatible release agents, etc. The analyses presented in this investigation focus on void creation by mechanical entrapment during the injection stage.
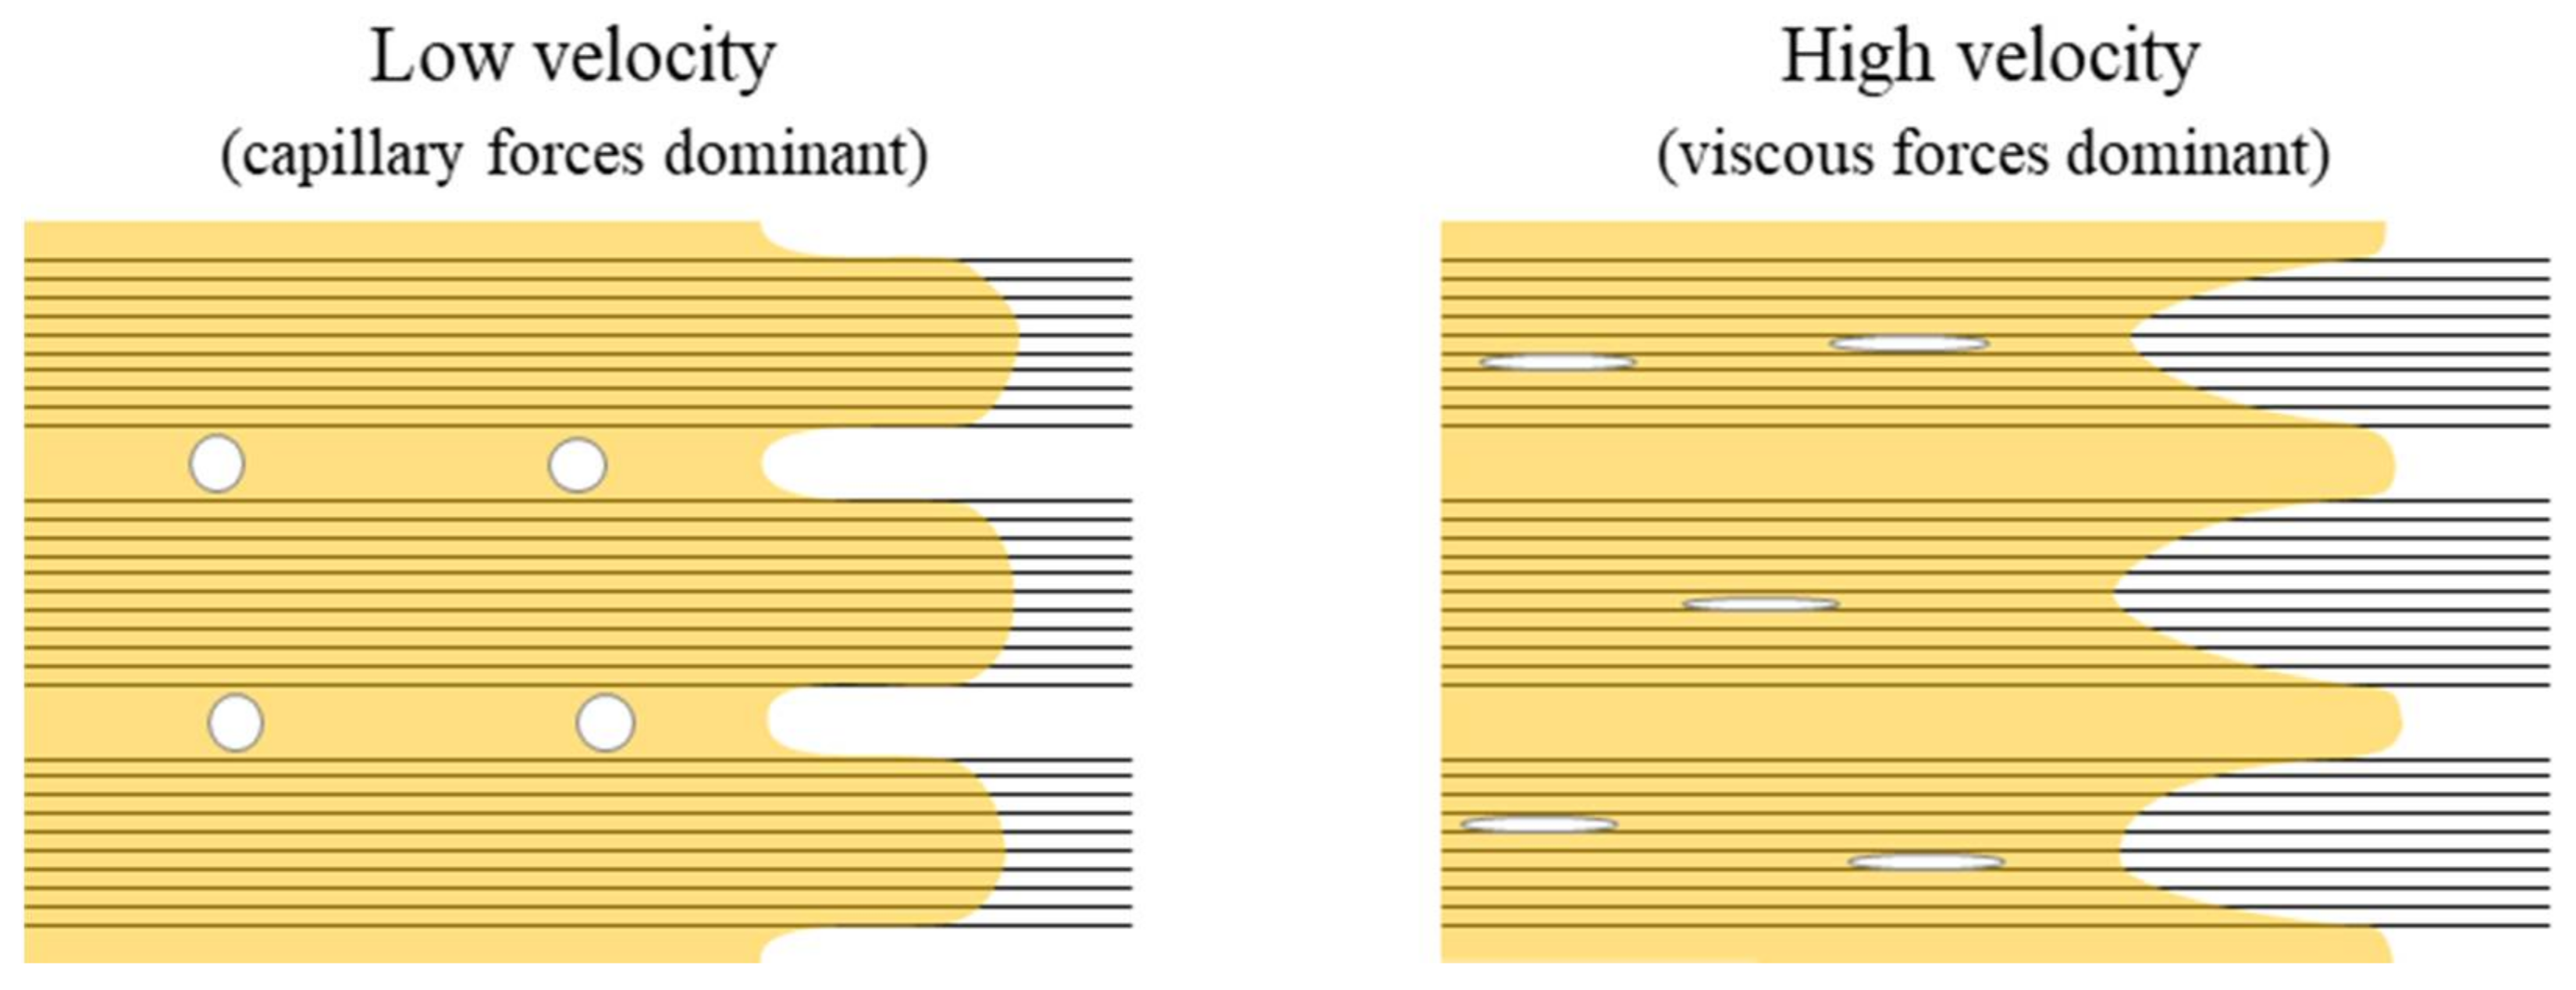
Engineering fabrics used as fibrous reinforcements generally possess a dual scale architecture in terms of porosity. Microscopic pores can be found between the filaments inside the fiber tows, while macroscopic pores stand between the tows. The pioneering work of Patel et al. [8,9] showed that the progression of the resin through such complex architectures generates uneven flow velocities that can create voids via entrapment of (residual) air bubbles at the flow front. As depicted schematically in Figure 1, the shape of the front depends on the impregnation velocity, which in turn causes the creation of different types of voids. At low injection velocity, the capillary action induces a leading flow front inside the fiber tows, and macroscopic voids are created in the open channels between the bundles. On the other hand, viscous forces between the bundles are dominant for high impregnation velocity, and the open channels are filled first. This configuration leads to the creation of microscopic voids inside the fiber bundles during the delayed impregnation of the tows. These phenomena have been the subject of several publications as summarized in a review paper by Park and Lee [10]. Experimental [11,12,13] and numerical studies [14,15] showed that the void content created at the flow front varies nearly logarithmically with the velocity and follows a V-shaped curve. As shown in Figure 2, this behavior indicates the existence of an optimal velocity that minimizes the overall void content in the final part.
Several approaches can be considered to minimize the void content, such as bleeding after mold filling or applying a consolidation pressure. However, these methods come at a cost and are not always adapted to large components or parts of complex geometry. Because of the stringent requirements for high performance composites encountered especially in aerospace applications, the development of practical strategies to produce composites of high impregnation quality represents an important industrial goal [16]. As proposed by Trochu et al. [4], control of the injected flow rate to ensure that the front velocity is close to the optimal conditions is an interesting approach to reach that goal. This strategy has been successfully applied in numerical studies [17], but it has not yet been tested by manufacturing complex parts with the recommended flow rate profile. Furthermore, this approach requires adequate characterization of the fiber/resin system to quantify the optimal injection speed that minimizes the residual void content. To evaluate this important parameter, the void content of test samples manufactured under varying conditions can be measured experimentally [13]. However, such a procedure is highly time consuming and is only valid for a given resin/reinforcement system. To speed up the characterization stage, an alternative approach based on capillary imbibition was proposed by Lebel et al. [18].
The capillary rise method has already been used to characterize the permeability, the architecture, and the capillary pressure at equilibrium in different types of granular porous materials. This approach has also been implemented to study the microscopic and macroscopic properties of fibrous reinforcements used in high performance composites [19,20,21,22]. In recent work, a new technique based on fluorescent Dye Penetration Inspection (DPI) has been devised to study capillary imbibition in fiber tows and dual scale fabrics [23,24]. This allowed gathering automatically and simultaneously the capillary front positions and the uptake fluid mass in time with a high degree of accuracy and repeatability. Moreover, comparison of the void content deduced from image analysis during capillary rise experiments with the porosity measured on rectangular composite panels suggested that capillary characterization can give a satisfactory estimate of the optimal flow front velocity [25].
The goal of this investigation is to develop further the capillary characterization method to predict the optimal injection velocity during RTM manufacturing. The paper is divided into two main sections. Following the approach proposed by Lebel et al. [18], an improved experimental and data processing procedure is first presented, and the new methodology is applied to study the wicking behavior of a glass fabric reinforcement with a reference fluid. The results are then modeled to predict the optimal injection velocity range during mold filling with typical RTM thermosetting resins. In the second part of the investigation, this prediction is tested by manufacturing composite sample parts at the recommended velocity. The specimens possess an irregular geometry to evaluate the potential benefits of adjusting the flow rate during the injection. The influence of the mold configuration (i.e., divergent versus convergent flows) is also evaluated.
2. Capillary Rise Experiments
2.1. Materials and Setup
The principle of capillary rise measurements consists of dipping a fabric sample in a probe liquid in order to study the wicking behavior of the porous medium. In the present work, a capillary rise experimental installation has been developed to record simultaneously the flow front position and the uptake fluid mass. The experimental setup is shown schematically in Figure 3a. The fabric sample is placed in a transparent rigid mold held vertically on a frame supported by a motorized linear stage (UTS100CC from Newport®, Irvine, CA, USA). The thickness of the mold is controlled by calibrated spacers to set precisely the fiber volume fraction of the sample, and the bottom part of the cavity possesses an opening that allows a direct contact between the reinforcement and the test fluid. The latter is contained in a standard rheometer capsule placed on a micro balance (CP225D from Sartorius®, Goettingen, Germany).This liquid container exhibits a high surface area with respect to the total fluid volume absorbed by the fibers, which allows minimizing buoyancy force variations during wicking as a result of a decrease in the liquid level. During the experiment, a constant displacement speed of 0.01 mm/s is first applied to the linear stage. The control software stops the motor once the fabric touches the liquid surface (which translates to a mass jump on the scale reading). Images of the imbibition are recorded by a 21 megapixels high definition digital camera (EOS 5D Mark II from Canon®, Tokyo, Japan), and the absorbed mass is measured with a resolution of 10 μg. The camera is remotely controlled, and each image capture of the capillary rise progression is taken at a specific rate of 1 image per 5 s. In order to follow the progression of the fluid, an inert fluorescent dye (UV-excited Pyrromethene 567A from Exciton®, Lockbourne, OH, USA) is mixed with the test liquid, and two 15 Watts UV-black light bulbs are placed near the fabric sample. The whole experimental installation is placed in a closed dark room in order to prevent external light sources, air streams, or vibrations from perturbing the mass and image acquisitions. All the equipment (motor, balance, and camera) are controlled with a computer placed inside the dark room but remotely controlled from outside to prevent any disturbance when launching the experiments.
The experiments presented in this work were conducted with a bidirectional non-crimp fiber fabric TG15N from JB Martin® (now Texonic®, Saint-Jean-sur-Richelieu, QC, Canada). This reinforcement is made of glass fiber bundles (warp: 735 tex, weft: 275 tex) bound together with a polyester stitching thread. The warp (respectively weft) direction contains 55% (respectively 45%) of the reinforcing fibers, and the overall surface density is 518 g/m2. The sample consisted of one fabric ply (25.4 × 230 mm2), and the mold cavity was set to 0.56 mm. This resulted in a fiber volume fraction of 36% for the tested sample. The test fluid was 99% pure hexadecane from Sigma-Aldrich®, St. Louis, MO, USA, which possesses perfect wetting behavior with the fabric material.
2.2. Image Processing
The images recorded during capillary rise tests were post-processed to detect the position of the flow front and characterize its temporal evolution. Detection of the flow front was carried out with a Matlab® program following three main stages:
- -
- conversion of colored pictures into gray levels;
- -
- conversion of gray levels into black and white;
- -
- edge detection to locate the flow front position.
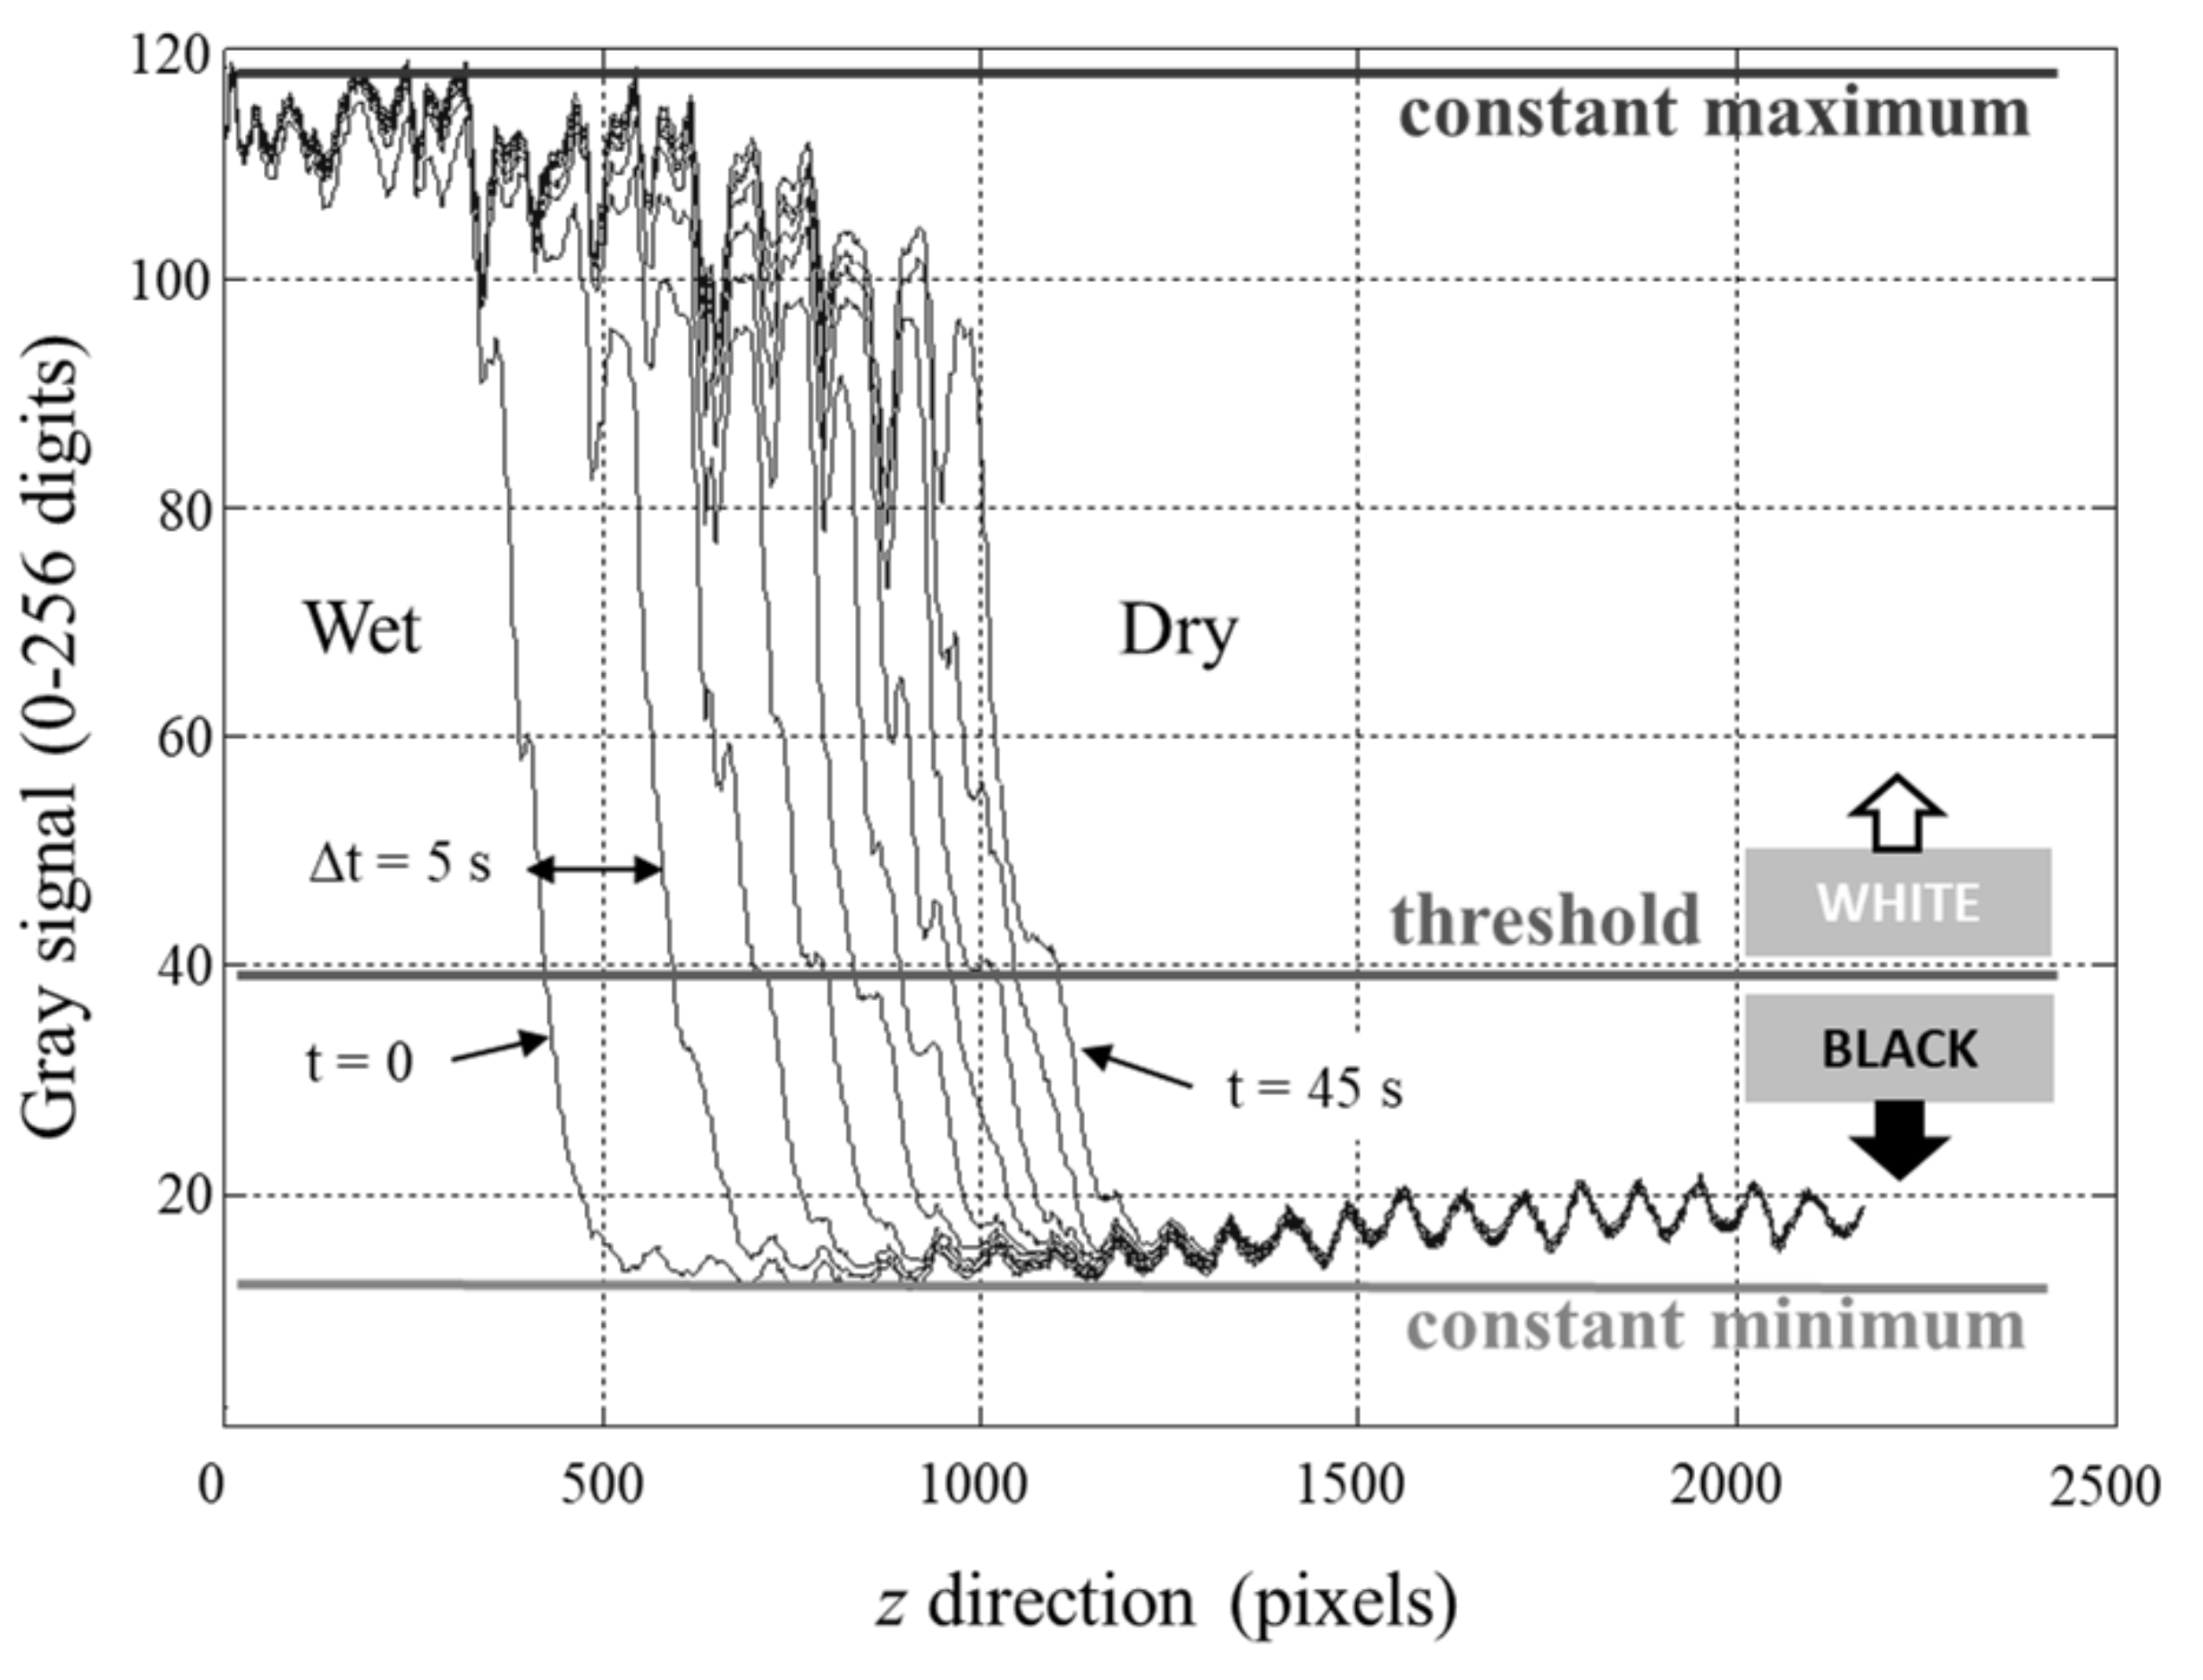
In previous work [23,24], conversion from gray levels to binary image was based on Otsu’s threshold algorithm [26], which calculates automatically a thresholding level from the image’s histogram. This resulted in a threshold value that varied during the progressive filling of the sample, which could in turn affect the detection of the flow front. Another source of error stemmed from the use of a semi-automatic camera with a variable shutter speed. To overcome these limitations, two modifications have been adopted in the present study. Firstly, in order to minimize the brightness variability between the images, the experimental setup was equipped with a new high resolution camera including a full frame captor and the possibility to control the brightness level in manual mode. These features allowed collecting more accurate image data and hence improving the quality of the images for post-processing. Secondly, a new conversion algorithm adapted to capillary images was devised. The gray signal was averaged in the x direction (see Figure 3b) and plotted against the z direction for every image captured during the capillary rise. The result for a typical experiment is reported in Figure 4, which plots a series of curves associated with different images (taken at intervals of 5 s). The wet part of the fabric sample is located on the left side of the curves, and the dry part on the right. Thanks to the camera settings, it is possible to see that the minimum and maximum values of the signal remain constant in time. The selected threshold between black and white pixels is expressed as a percentage of magnitude between the minimum and maximum values of the gray signal. In the present study, a threshold value of 25% was found to give a satisfactory detection of the flow front. This value was thus applied to every image of the capillary rise experiments. However, note that the optimal thresholding value is linked to the material tested, and that this parameter should be verified when characterizing a new type of fibrous reinforcement.
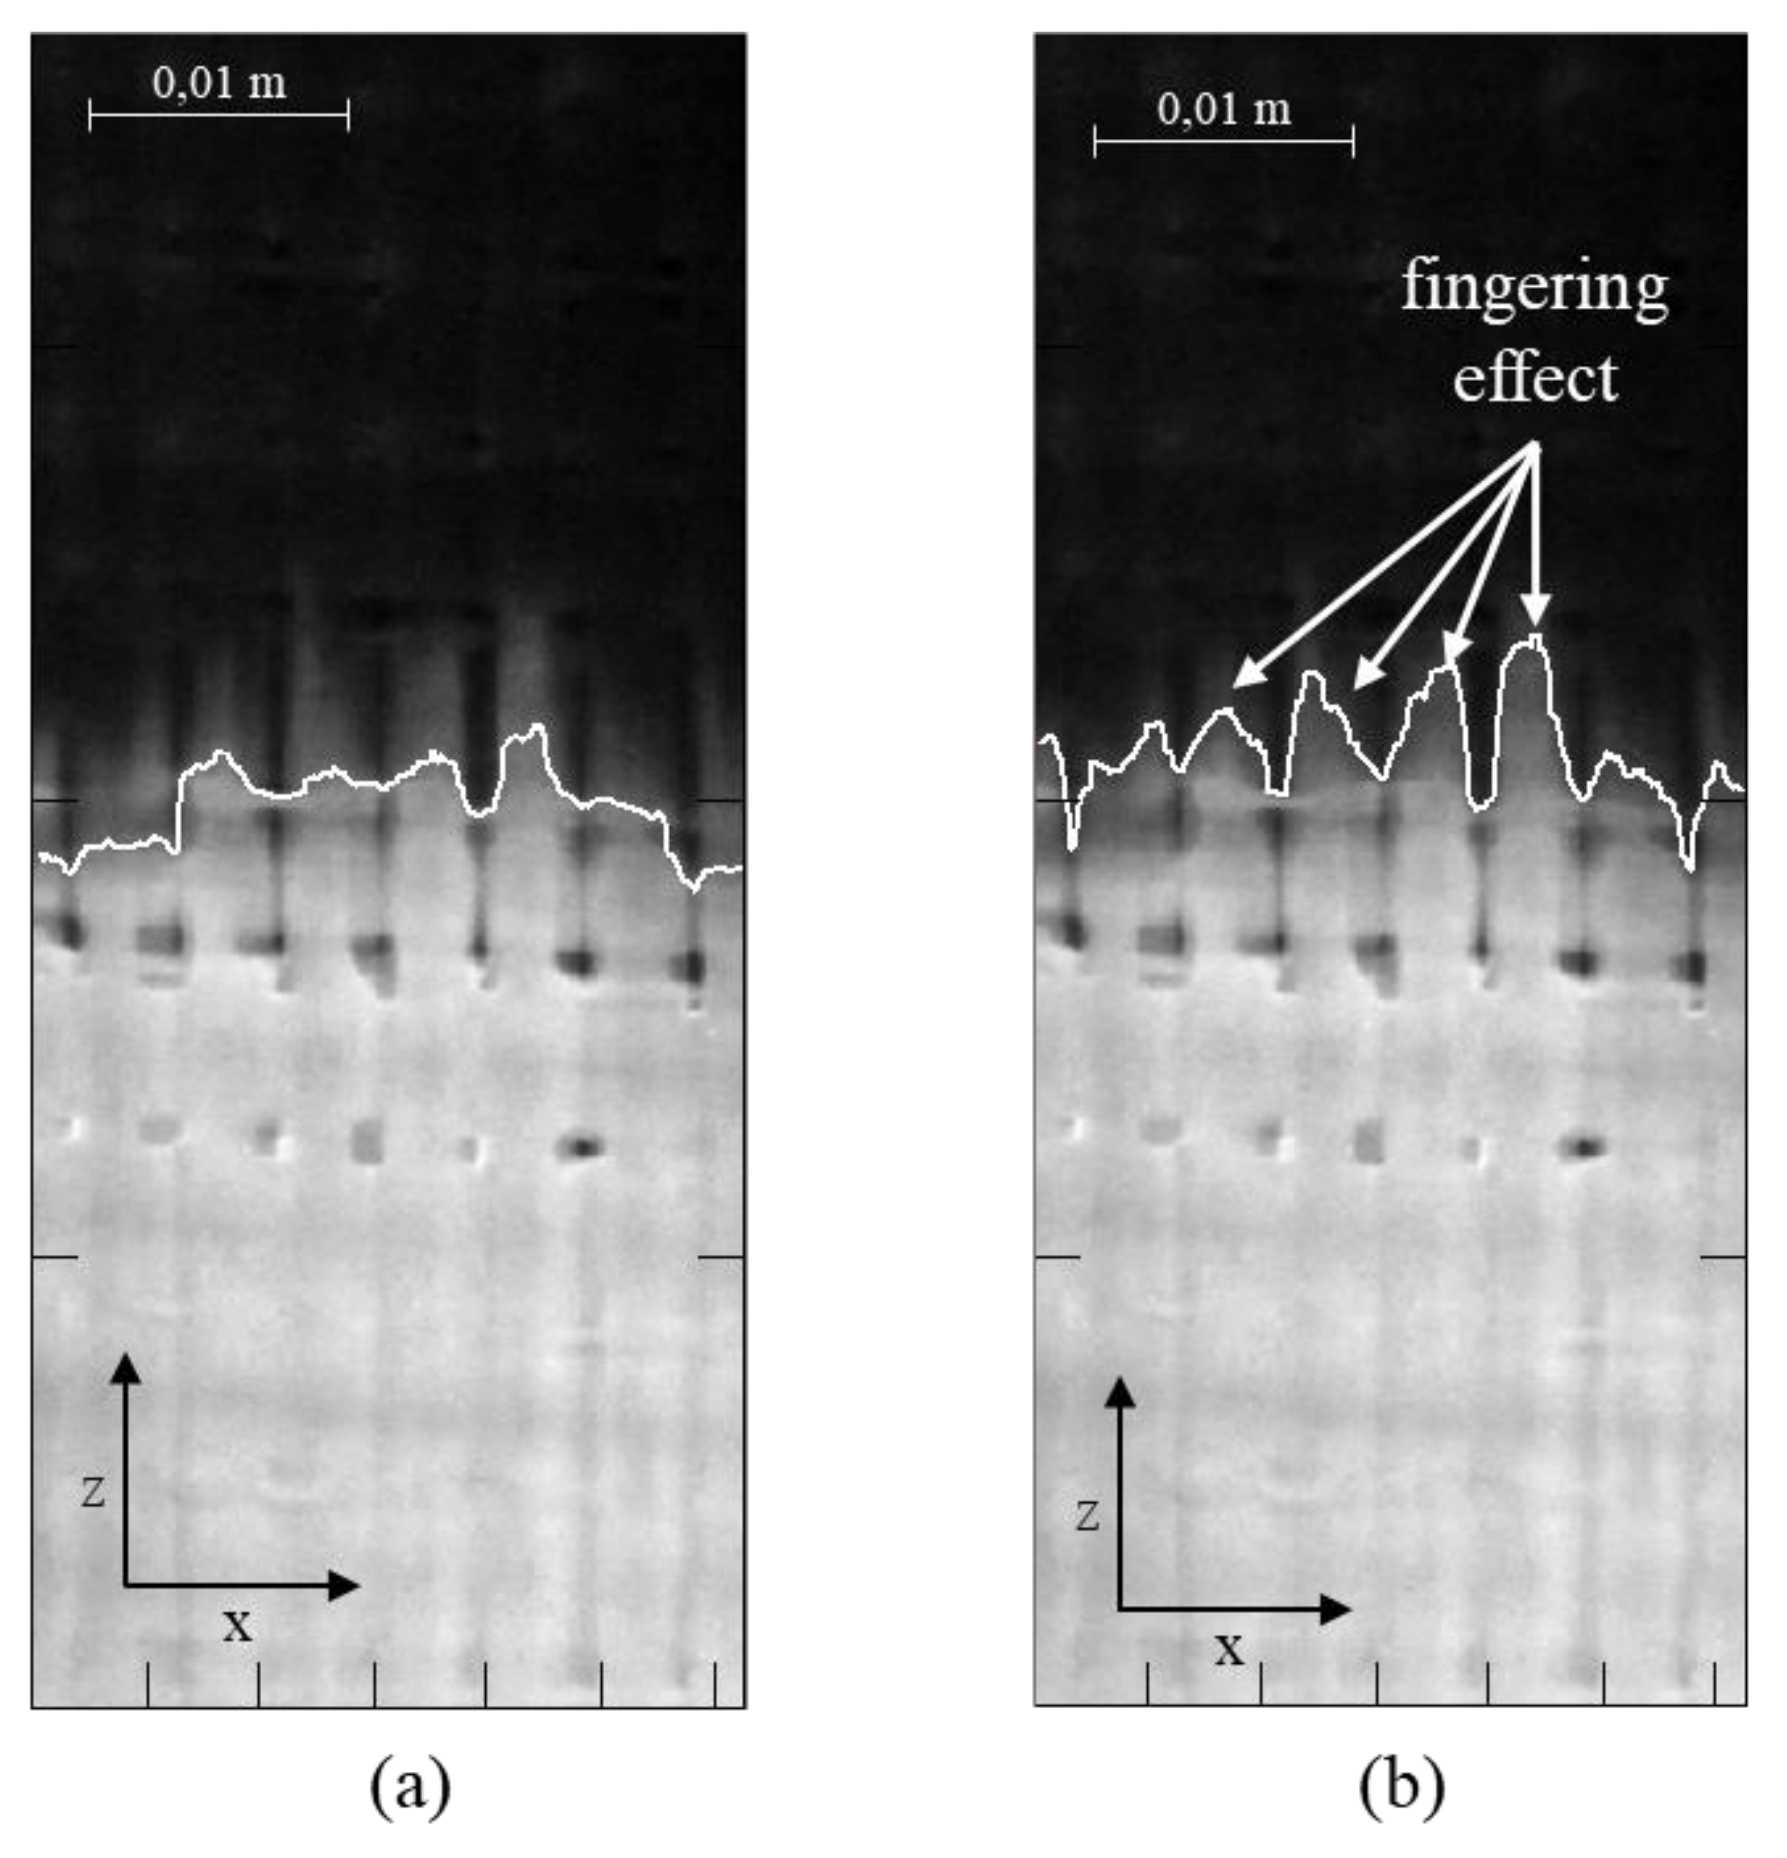
Figure 5 compares the flow front detected with the two approaches discussed above. As illustrated, using Otsu’s algorithm introduces a shift between the numerically detected and the real capillary front. This problem is corrected with the proposed experimental protocol, which allows a better definition of the flow front position. It is particularly interesting to note that the new method gives a fairly good representation of the “fingering” effect, which is an important phenomenon when the liquid fills a double scale fibrous reinforcement [27,28,29].
After detecting the flow front on the whole set of images, the averaged positions in the z-direction (see Figure 5) were finally converted from pixels to actual distance to reconstruct the evolution of the imbibition height during the capillary rise experiments. Results are reported in Figure 6 for three different tests in each fabric direction. Overall, the repeatability is quite satisfactory, which supports the robustness of the methodology. It can also be noted that the unbalanced architecture of the fabric induces different wicking behavior depending on the imbibition direction. Since the three different tests along the warp and weft directions are highly repeatable, a mean value of capillary height will be considered in the sequel.
2.3. Modeling of Capillary Rise
The progression of the fluid front during the capillary rise experiments was modeled using a simple approach based on the classical Lucas-Washburn law. The latter considers a Hagen-Poiseuille flow in which the effects of inertia and gravity can be neglected. Such assumption is considered valid when the capillary height is small compared to the equilibrium height, towards which the capillary front tends asymptotically for very long wicking time. Under such circumstances, the Lucas-Washburn imbibition model predicts a linear evolution of the squared capillary height [30]:
in which z is the capillary height, t is the imbibition time, and Bh is the Lucas-Wasburn (LW) slope, also referred to as a diffusion or capillary rate coefficient [31].
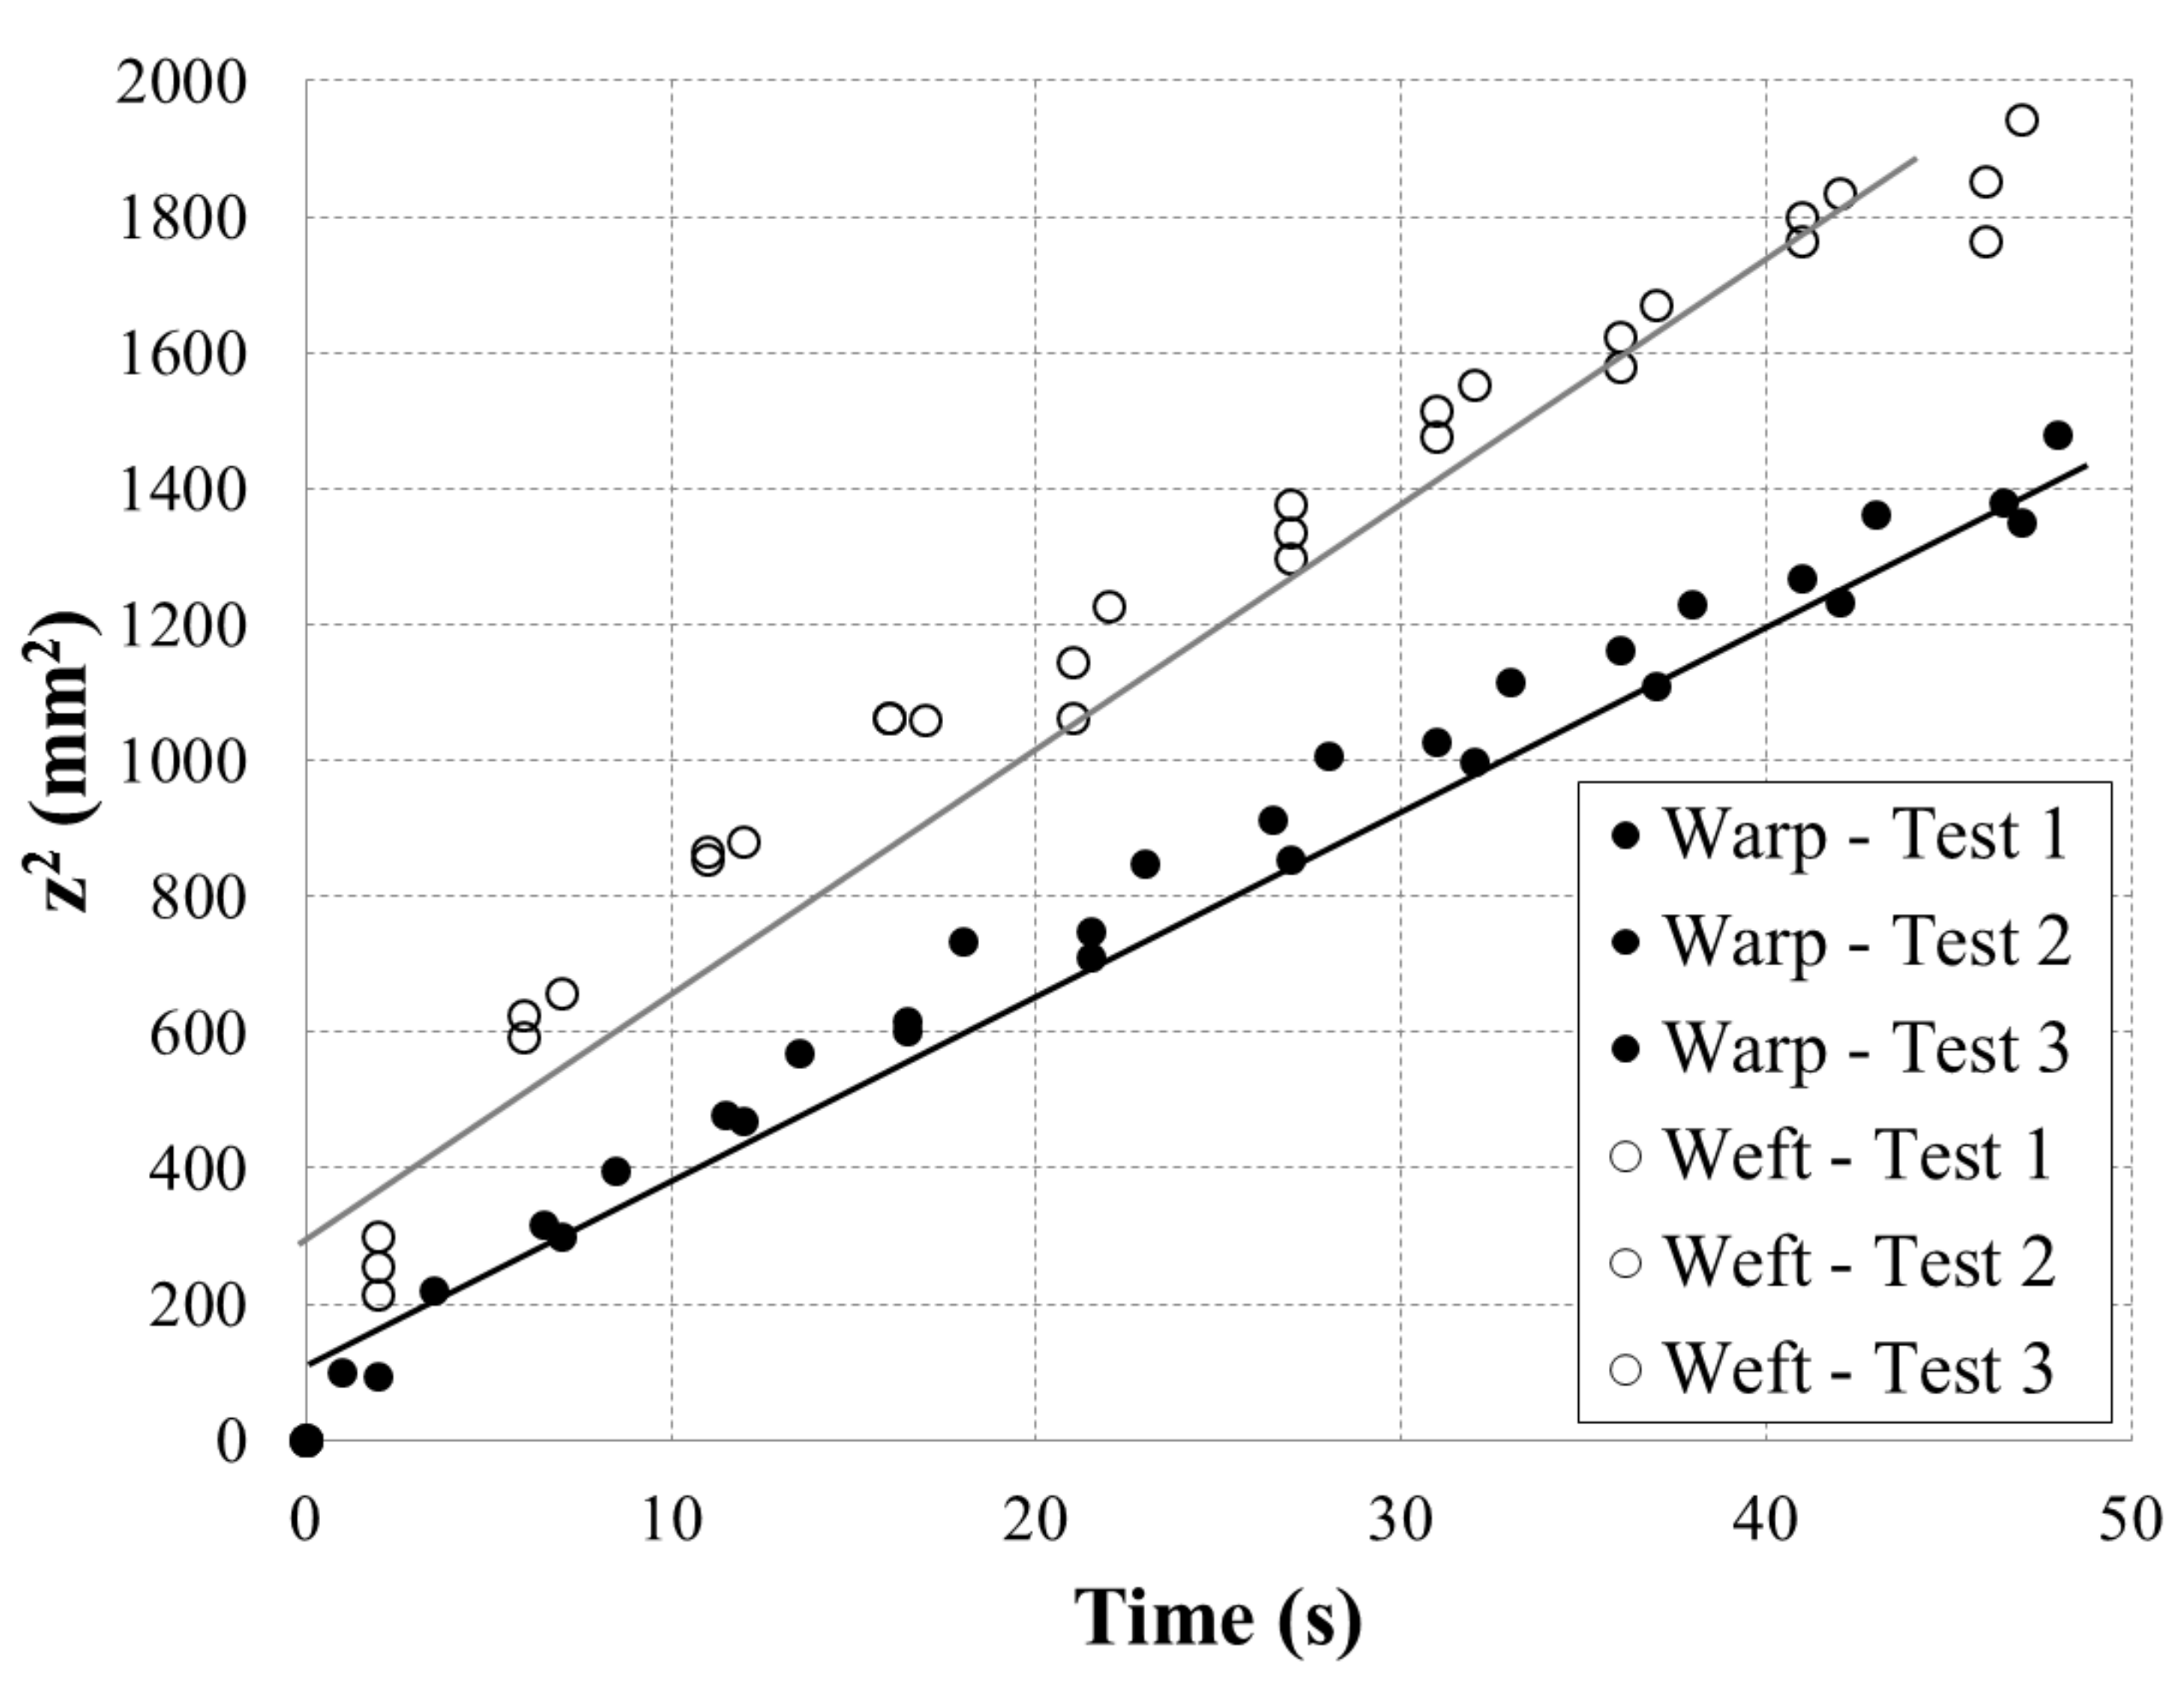
To verify the validity of the model, Figure 7 plots the squared height for the first 50 s of imbibition. Although the fitting is rather satisfactory, it can be noted that the experimental data do not exhibit a perfectly linear trend. As shown in Figure 8, this slight deviation from the expected behavior introduces a dependency of the LW slope on the imbibition period considered to perform the interpolation. It is then impossible to derive a unique value of the Bh parameter from the test data. Note that a similar observation was previously reported by Lebel el al. [24]. To tackle this issue, these authors proposed to separate the data in two categories (short-term versus medium-term wicking) and thus determined a range of LW coefficient. A different approach has been used in this work. The higher limit of the parameter Bh was determined from the shortest interpolation period possible (i.e., for t = 0–5 s) and corresponds to the initial value reported in Figure 8. On the other hand, the lower limit was obtained from the interval t = 0–50 s, which still provides an acceptable R2 coefficient of the linear regression.
2.4. Optimal Imbibition Velocity
Following the approach adopted in previous work [18,32], it is hypothesized that the optimal velocity can be evaluated as the imbibition velocity for which an elementary cell is filled up with liquid during a capillary test. The characteristic size Lc of the unit cell corresponds to the distance between two fiber bundles (see is Figure 9). This parameter depends on the flow direction and was measured by optical analysis in both warp and weft directions.
If tc denotes the characteristic time required to fill an elementary cell in a spontaneous capillary impregnation that follows the Lucas-Washburn behavior, then the optimal impregnation velocity may be defined as follows:
with
Combining Equations (2) and (3) finally gives a simple expression of the optimal velocity as a function of the characteristic length Lc (measured directly on the fabric) and the LW slope Bh (expressed as a range and determined from the capillary rise experiments):
The prediction of the optimal velocity is summarized in Table 1. Note that these values are only valid for the reference fluid used during the capillary experiments. The final step of the analyses consists of determining the optimal velocity for the thermosetting resin used during practical manufacturing. To do so, we consider the modified capillary number defined as
in which μ is the viscosity of the liquid, v the velocity of the flow front, γ the surface tension of the fluid, and θ the contact angle between the liquid and the fabric.
The evolution of the void content as a function of the capillary number exhibits a “V-shaped” curve [27,33] similar to Figure 2, so that a minimum void content is achieved for an optimum value of Ca*. Since the optimal Ca* should not depend on the fluid considered, the optimal velocity for the resin can be deduced from the results obtained with the test fluid (i.e., hexadecane) as follows:
Equation (6) was used to estimate the optimal velocity range for two types of resin: vinyl ester 411–350 from Derakane® and epoxy DER 383 from Dow®. The properties of the different fluids are summarized in Table 2, and the final results are presented in Table 3. For comparison purposes, previous results obtained by directly using the different resins to perform the capillary rise experiments are also included. As can be seen, the optimal velocity ranges in both warp and weft directions are consistent with past investigation. This gives additional validation to the prediction methodology based on the optimum modified capillary number deduced from capillary characterization with a probe fluid.
3. Impregnation in RTM Mold of Varying Geometry
3.1. Manufacturing
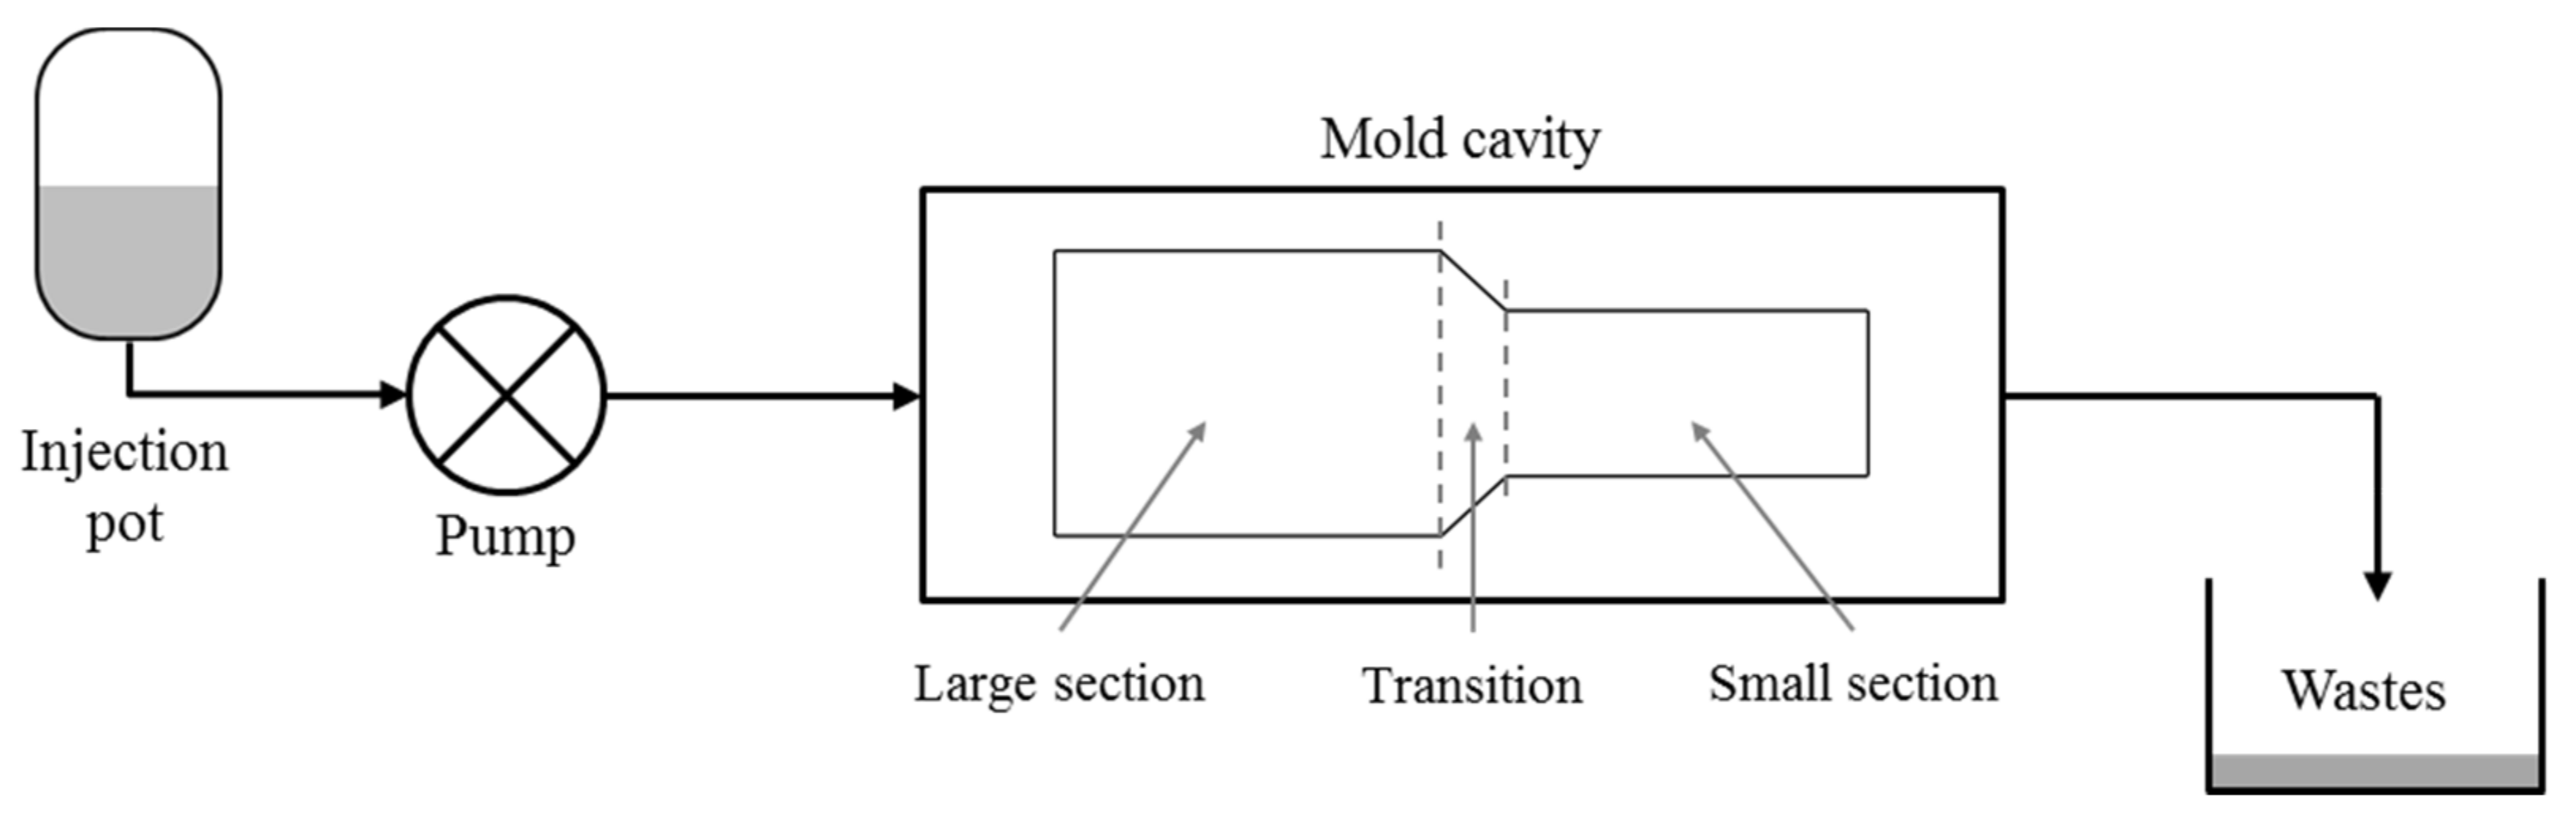
A laboratory scale RTM mold was devised to inject 2D plates of variable geometry at room temperature (see Figure 10). The mold cavity has a total length of 370 mm and is divided in two zones of different cross-sections: a large one (110 mm wide) and a small one (55 mm wide). These two sections are separated by a transition zone with a length of 30 mm. The objective of the variable geometry is to show the influence of the impregnation velocity on the final void content.
Manufacturing experiments were carried out with fibrous beds made of 6 layers of TG15N fabric oriented in the weft direction. A fiber volume content of Vf = 38% was thus obtained given the mold cavity thickness of 3.175 mm. Prior to injection, the resin (vinyl ester resin 411–350) was first mixed with 12% promoter Cobalt Naphteate (0.1 phr), 2–4-pentadione inhibitor (0.1 phr), and cumyl hydroperoxyde initiator Norox® CHM50 (1 phr). The resin system was then degassed for 15 min under vacuum and placed in an injection pot. The latter was connected to a metering pump (85 MHP5 from Stenner®), which was subsequently used to deliver the mixture to the mold cavity. The pump was set manually in order to ensure the desired constant flow rate. No bleeding or consolidation pressure was applied after mold filling. The injection was stopped when the resin started to exit the mold cavity into the waste pot, and the part was cured at room temperature under atmospheric pressure.
As described in Table 4, the manufacturing experiments were carried out with two different configurations (convergent and divergent) by reversing the mold cavity. Three injection strategies were tested for each configuration:
- Maintaining the optimal impregnation velocity throughout the plate (CSL and DLS tests).
- Maintaining the optimal impregnation velocity only in the small section (CS and DS tests).
- Maintaining the optimal impregnation velocity only in the large section (CL and DL tests).
The experiments were repeated two times in order to verify the reproducibility of the injections. A total of 12 plates were injected in the weft direction, in which the recommended optimal velocity range from the capillary tests lies between 0.0909 mm·s−1 and 0.258 mm·s−1 (see Table 3). The optimal velocity was taken as vopt = 0.175 mm·s−1, which lies in the middle of the recommended range. As reported in Table 4, the velocity varied from 0.5 vopt = 0.0875 mm·s−1 to 2 vopt = 0.35 mm·s−1 in the small and large sections for the convergent and divergent configurations.
3.2. Void Content Analysis
After demolding, several samples were cut in each section of the part following the pattern of Figure 11. The plate was divided into six stripes at distances x = 3, 8, 12, 22, 27, and 31 cm from the injection port. Two square samples (25.4 × 25.4 mm) were taken in each stripe and analyzed to determine their void content following the ASTM D2734 standard. A summary of the results is presented in Table 5. Since each injection was reproduced two times, the reported void contents represent averages of 4 samples except for the case DS (an operator error during the pyrolysis manipulations made the data unexploitable for one of the two plates).
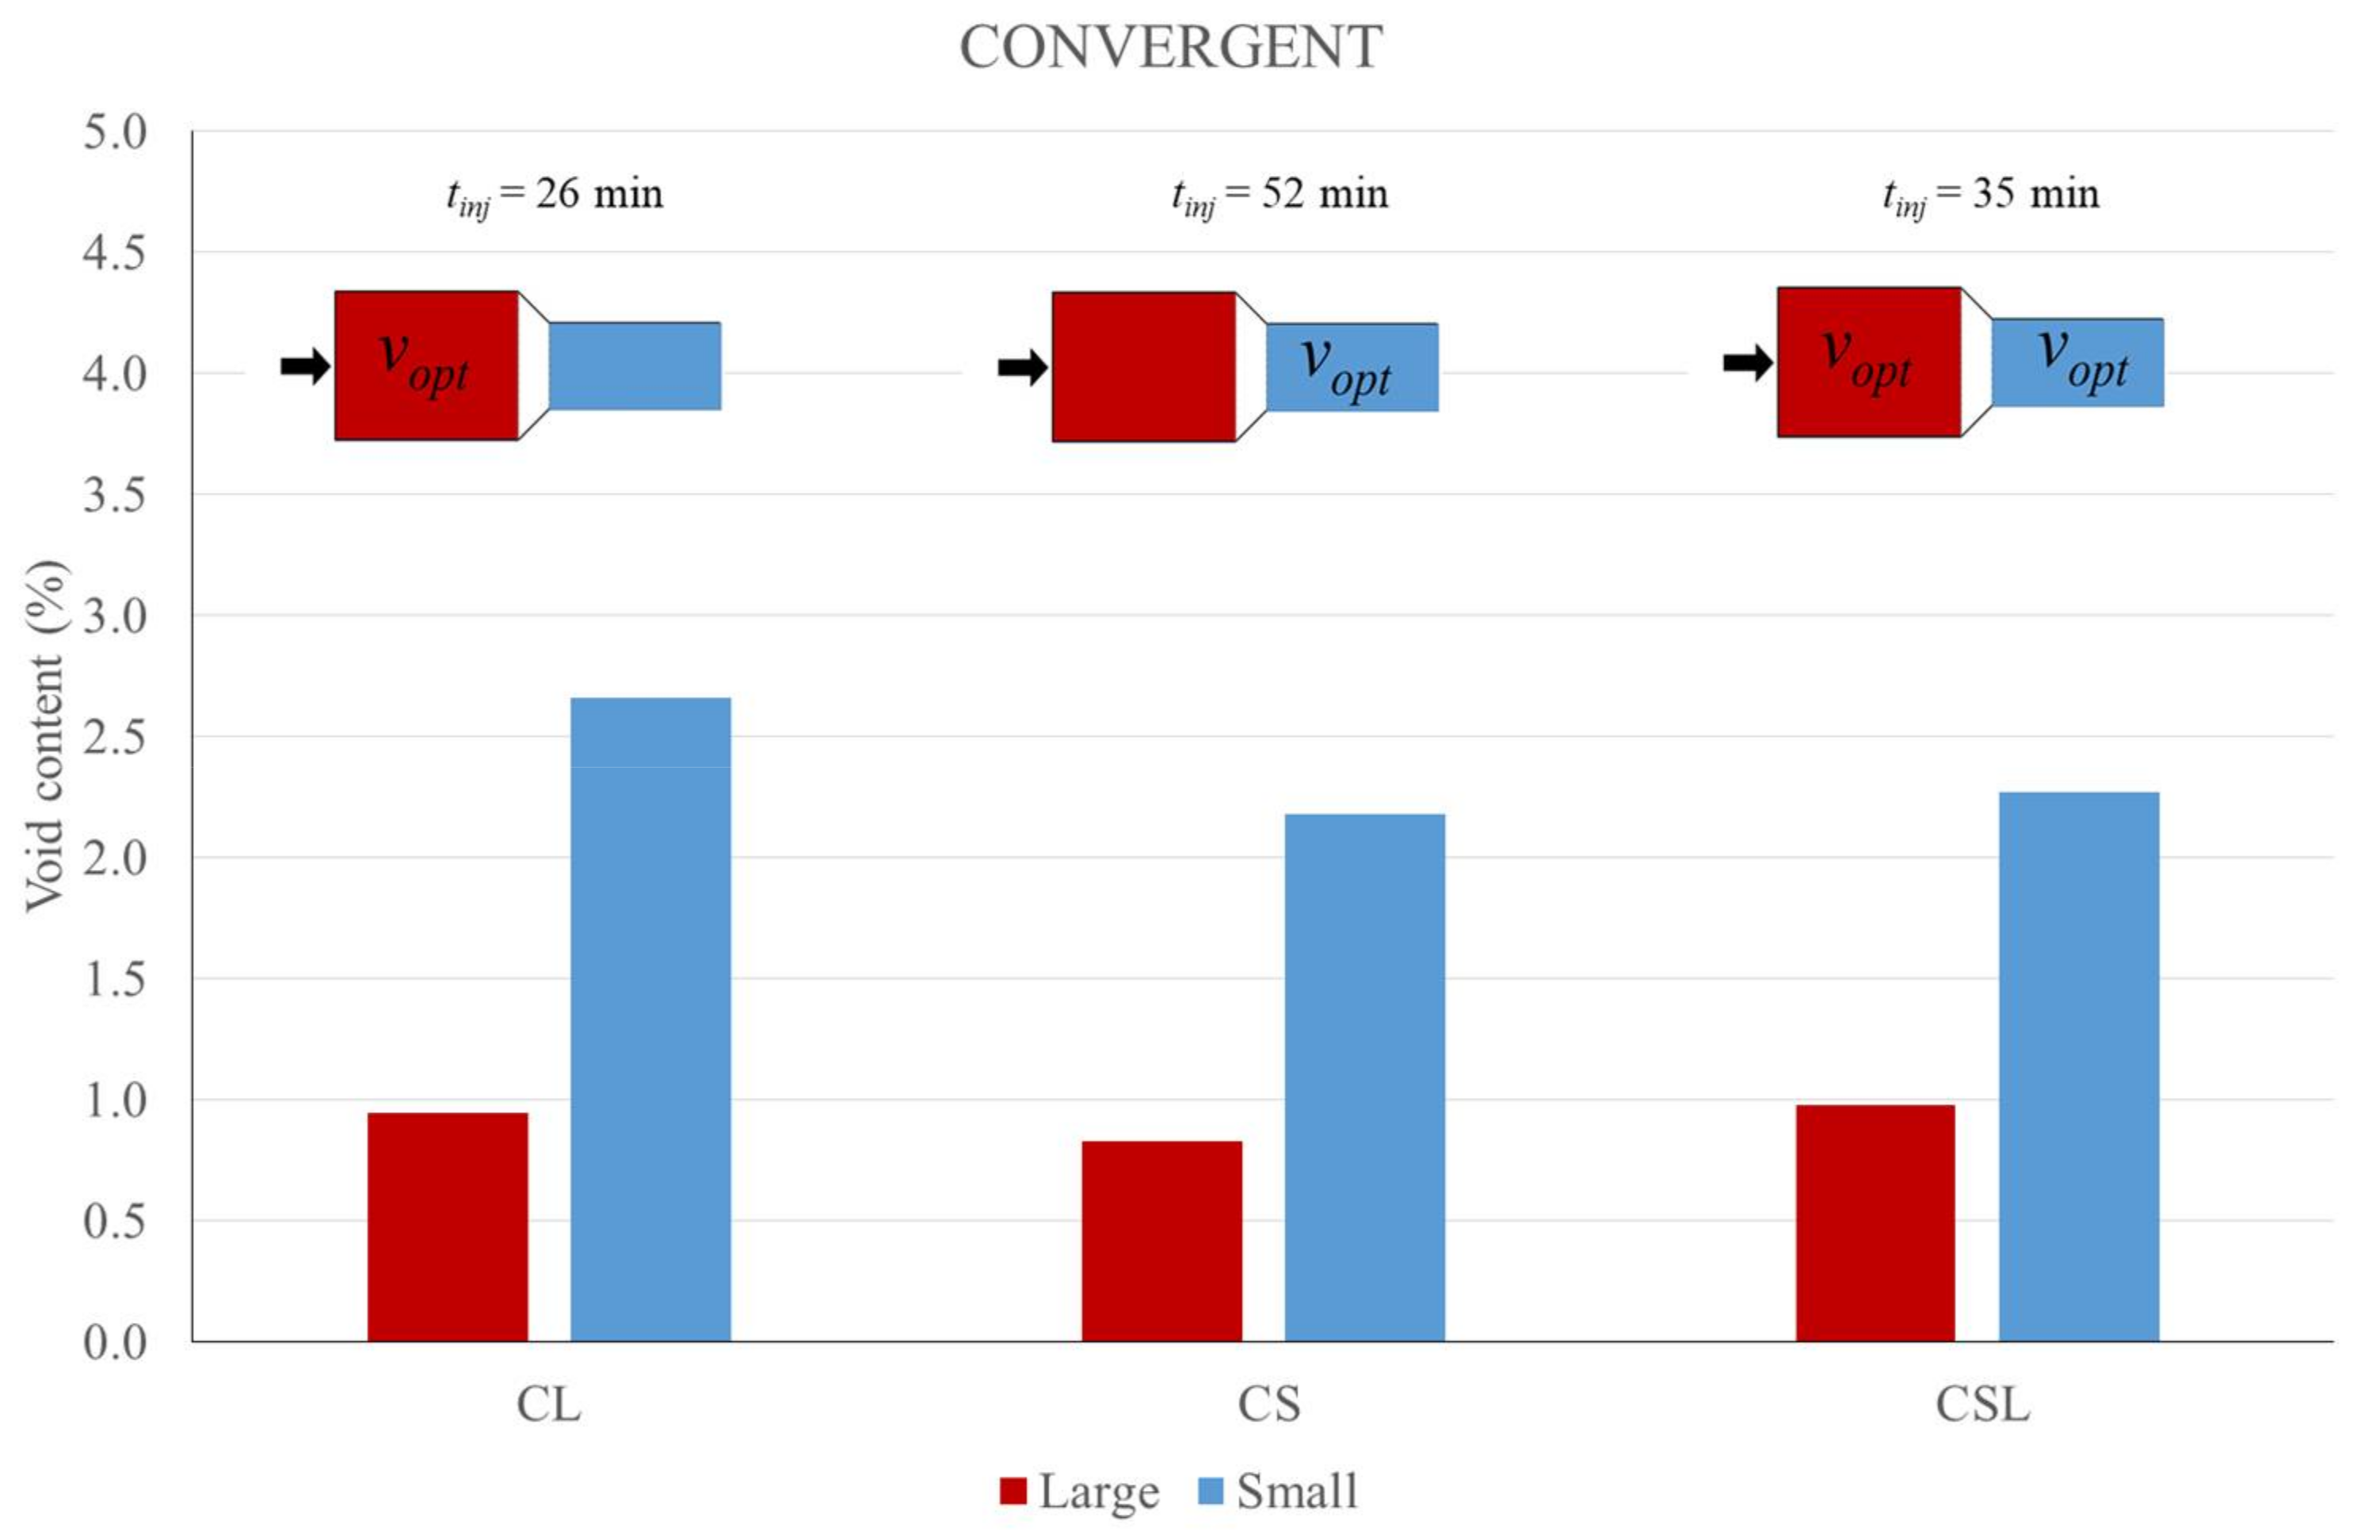
To analyze the influence of the mold configuration, void contents are first averaged in each section (large and small) of the composite plates. Results are reported in Figure 12 and Figure 13, along with the mold filling time for each experiment. In every case, the void content is higher in the second section of the plate, even if it should be lower because of the impregnation velocity. This shows that void transport is a significant phenomenon during mold filling. It can also be noted that the difference in void content between the two sections is more important in the convergent configuration. For example, when comparing the DSL and CSL specimens (which are the plates with an optimal velocity maintained throughout the whole injection), it appears that they both exhibit similar results in the first section, while in the divergent case a slightly lower void content is observed in the second large section. This higher void content in the second section for CSL can be explained by the void concentration. If the same amount of voids is present in a smaller space, then the void concentration is higher. Therefore, it seems that the divergent case represents a better option in RTM to get a more uniform void distribution. In order to minimize the maximum void content, the injection gate should be located in the mold so as to create a divergent flow.
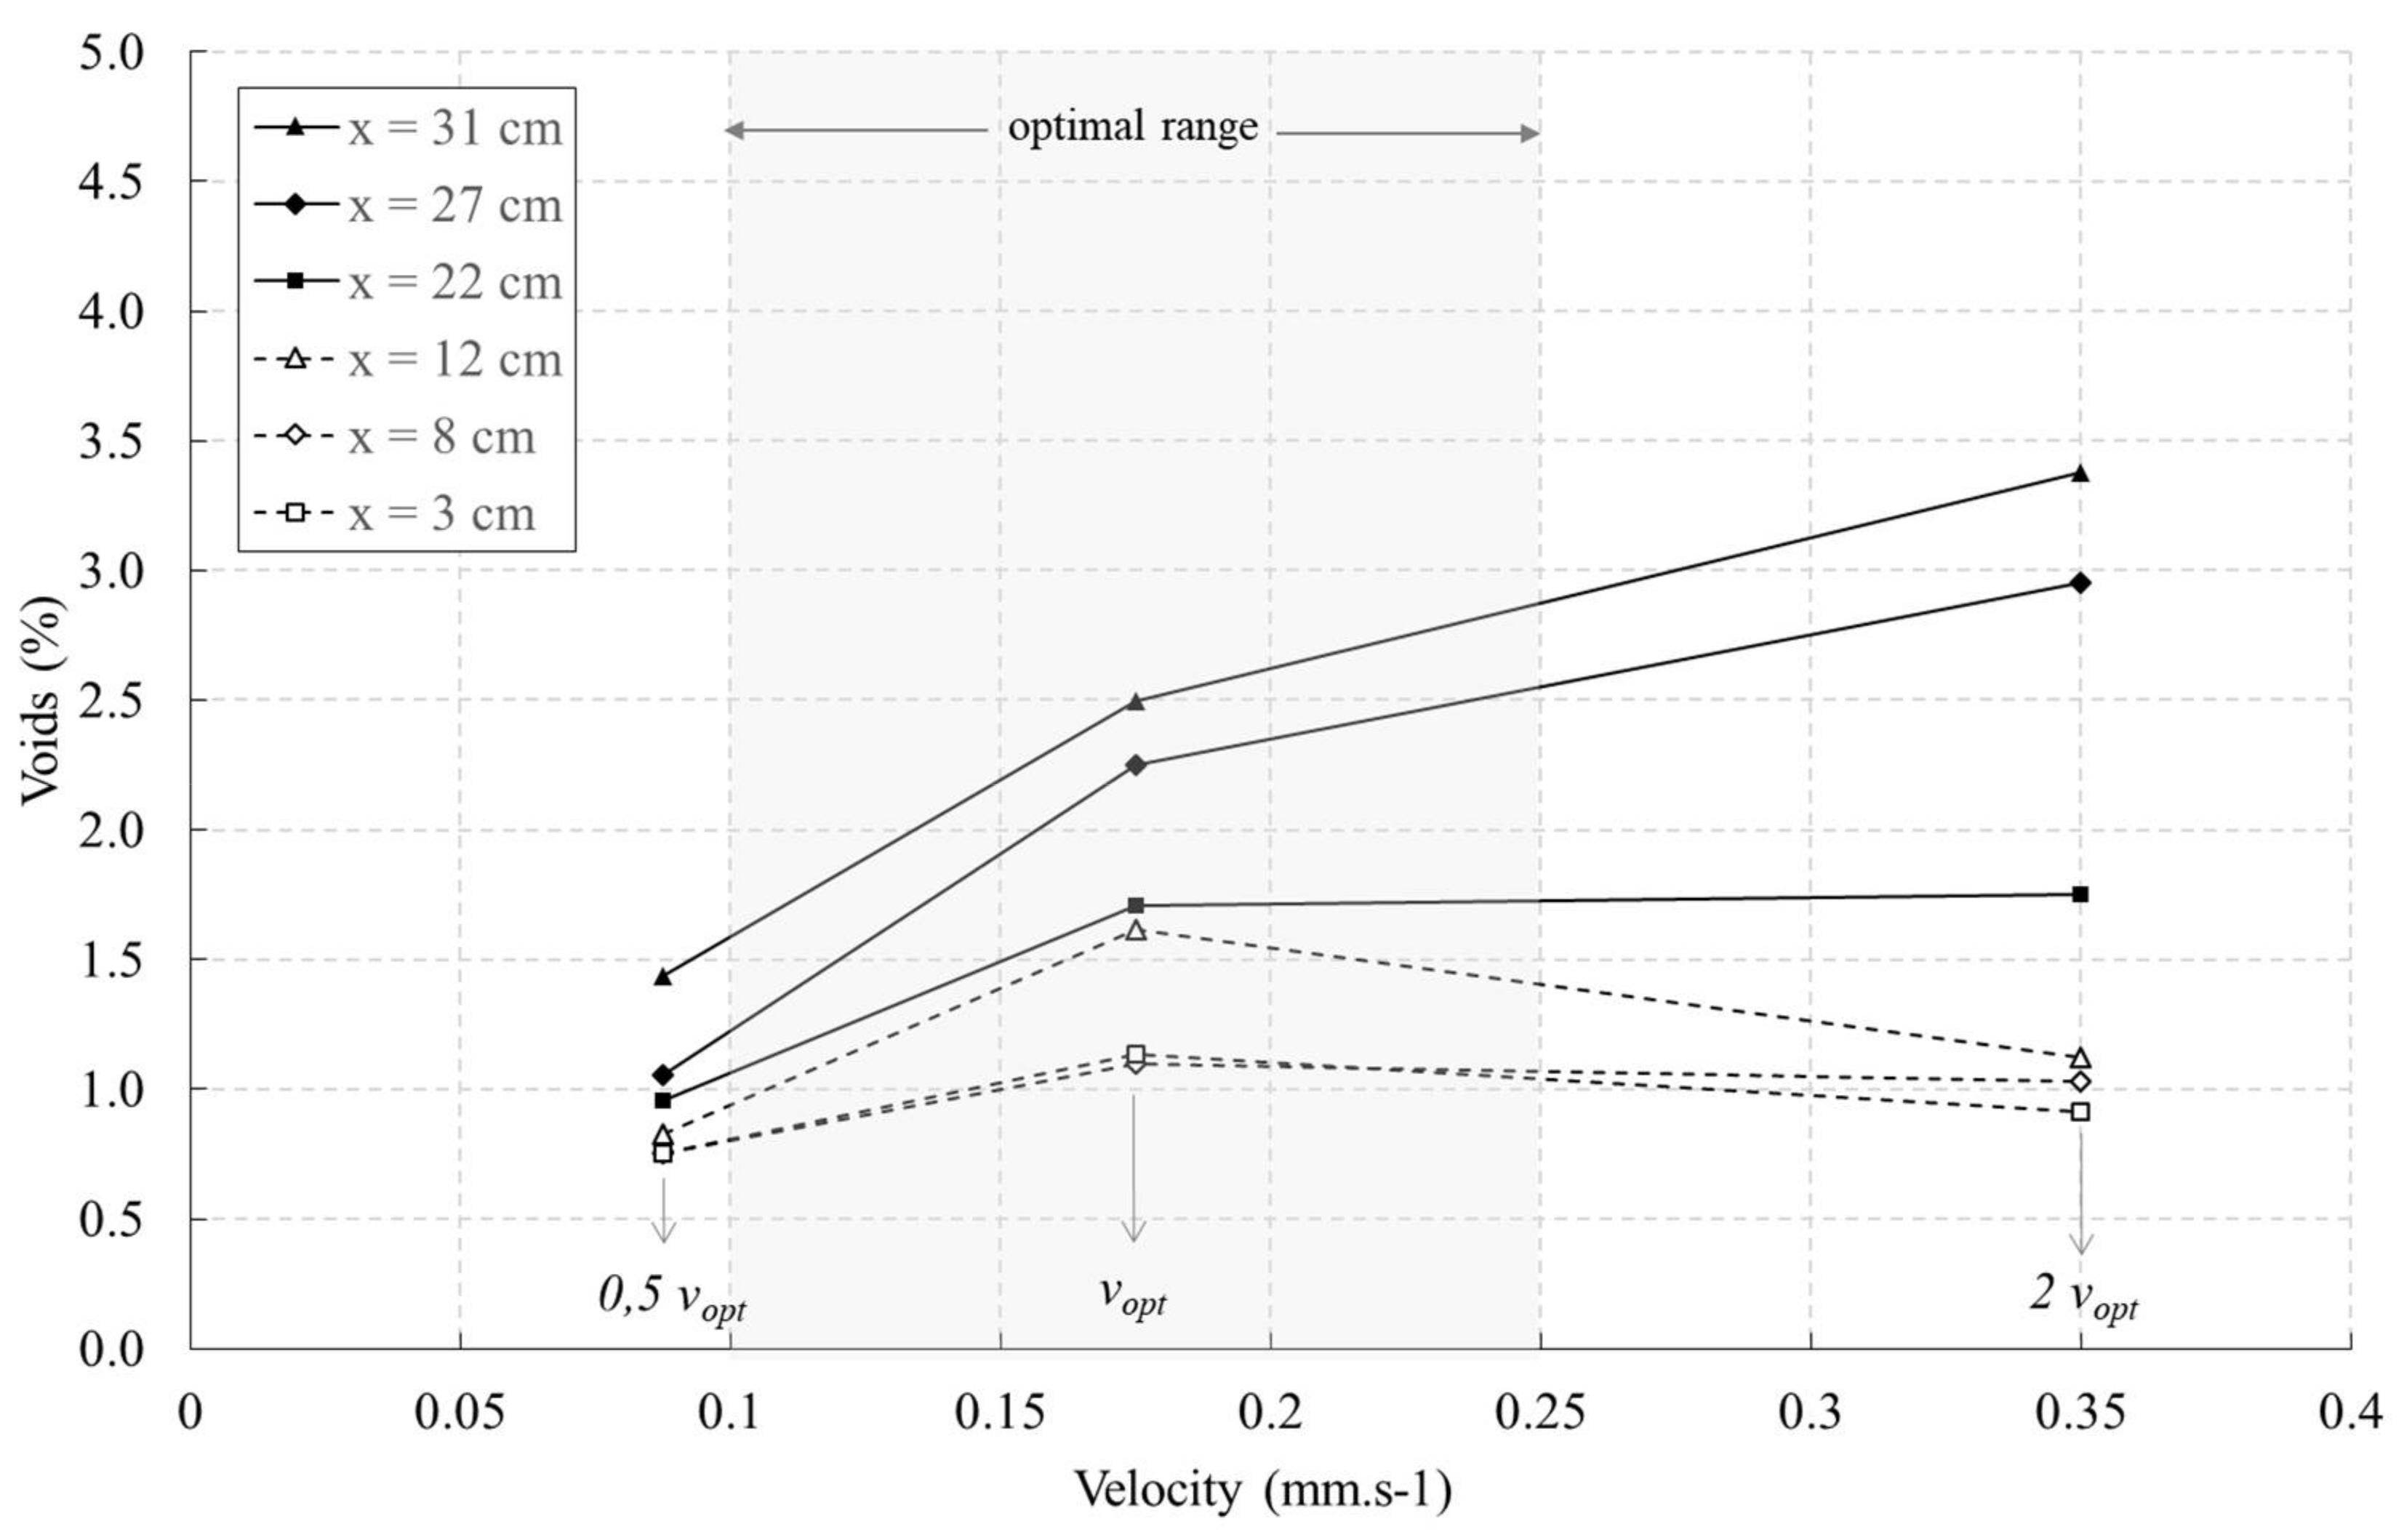
Figure 12 also shows that the DSL case with constant velocity does not give the best results in terms of void content. Indeed, lowering the injection speed in the second half of the part (DS case) minimizes the void content in both sections, although this results in a significantly longer injection time of 52 min versus 35 min for DSL. Consequently, it seems that the prediction of capillary rise experiments slightly overestimates the optimal velocity in real manufacturing. This conclusion is supported by Figure 14, which plots the void content as a function of the distance from the injection gate. As reported, minimum void content between 0.5% and 1.5% is attained for 0.5 vopt. Considering the manufacturing conditions used (atmospheric pressure inside the cavity and no consolidation pressure after filling), void content around 1% is quite satisfactory. This suggests that the lower bound of the predicted range gives a good approximation of the optimum velocity. However, additional experiments with different materials (resin and fabric) would be necessary to validate further this conclusion. Future investigation could also aim at improving the mathematical description of the capillary rise to circumvent the limitations of the Lucas-Washburn model discussed in Section 2.3.
Finally, another observation stems from Figure 14. In the first section of the parts (from x = 3 cm to x = 12 cm), the void content remains low and nearly constant. This indicates that because of void transport, the highest velocity of the optimal range could be used at the beginning of resin injection without compromising the final void content and quality of the part. This observation can be particularly interesting if accelerating the injection cycle is an important practical objective. For example, both DSL and DL cases create nearly the same void contents in the small and large sections. However, in terms of injection times, DL is the best case with 26 min of injection versus 35 min for DSL.
4. Conclusions
The capillary rise method was used to estimate an optimum velocity range that minimizes void content during RTM manufacturing. The experimental procedure based on a fluorescence technique was improved by following a new experimental protocol and using enhanced image processing techniques to follow the progression of the capillary front. Thanks to these experimental and numerical adjustments, a better estimation of the flow front position was notably obtained during the capillary rise experiment. The methodology was applied to characterize a typical glass fiber reinforcement with a reference fluid. The Lucas-Washburn model was used to describe the imbibition and estimate the optimal injection velocity. This approach allows one to calculate the equivalent optimal resin velocity from the modified capillary number without having to carry out direct capillary tests with resins. This simplifies considerably the experimental requirements, because tests with actual resins would be more complex to perform. A series of injections was then carried out in a laboratory scale RTM mold using the optimal velocity predicted a priori during capillary characterization. The manufacturing experiments were conducted with a cavity of varying cross-section to test the strategy of flow rate control and study the influence of the mold configuration (i.e., divergent versus convergent flows). Several observations and conclusions could be drawn from these experiments:
- -
- The capillary rise method gives a good approximation of the optimum velocity for practical manufacturing, which is close to the lower bound of the predicted range.
- -
- The transport of voids during mold filling tends to increase the porosity near the vents. In case of parts of complex geometry, it is recommended to inject in divergent mode in order to minimize the void content near the outlet.
- -
- It is not necessary to inject at the lowest impregnation velocity of the optimal range throughout the whole part. If overall filling time is a critical issue, the injection speed can be increased at the beginning of the filling without compromising the quality of the final part.
Acknowledgments
The authors would like to thank the National Science and Engineering Research Council (NSERC) of Canada and the Fonds Québécois pour la Recherche sur la Nature et les Technologies (FQRNT) and the Canada Research Chairs for their financial support. The contributions of Canada Foundation for Innovation (CFI) and of Safran to the research infrastructure are gratefully acknowledged.
Author Contributions
Christophe Ravey and François Trochu conceived and designed the experiments; Christophe Ravey performed the experiments; Christophe Ravey and Philippe Causse analyzed the data; all authors wrote the paper.
Conflicts of Interest
The authors declare no conflict of interest.
References
- Gay, D.; Hoa, S.V. Composite Materials: Design and Applications; CRC Press: Boca Raton, FL, USA, 2007. [Google Scholar]
- Chung, D.D.L. Composite Materials: Science and Applications; Springer: London, UK, 2010. [Google Scholar]
- Parnas, R.S. Liquid Composite Molding; Carl Hanser GmbH: München, Germany, 2000. [Google Scholar]
- Trochu, F.; Ruiz, E.; Achim, V.; Soukane, S. Advanced numerical simulation of liquid composite molding for process analysis and optimization. Compos. Part A Appl. Sci. Manuf. 2006, 37, 890–902. [Google Scholar] [CrossRef]
- Ghiorse, S. Effect of void content on the mechanical properties of carbon/epoxy laminates. SAMPE Q. 1993, 24, 54–59. [Google Scholar]
- Liu, L.; Zhang, B.-M.; Wang, D.-F.; Wu, Z.-J. Effects of cure cycles on void content and mechanical properties of composite laminates. Compos. Struct. 2006, 73, 303–309. [Google Scholar] [CrossRef]
- Varna, J.; Joffe, R.; Berglund, L.A.; Lundström, T.S. Effect of voids on failure mechanisms in RTM laminates. Compos. Sci. Technol. 1995, 53, 241–249. [Google Scholar] [CrossRef]
- Patel, N.; Rohatgi, V.; Lee, L.J. Micro scale flow behavior and void formation mechanism during impregnation through a unidirectional stitched fiberglass mat. Polym. Eng. Sci. 1995, 35, 837–851. [Google Scholar] [CrossRef]
- Patel, N.; Lee, L.J. Effects of fiber mat architecture on void formation and removal in liquid composite molding. Polym. Compos. 1995, 16, 386–399. [Google Scholar] [CrossRef]
- Park, C.H.; Lee, W.I. Modeling void formation and unsaturated flow in liquid composite molding processes: A survey and review. J. Reinf. Plast. Compos. 2011, 30, 957–977. [Google Scholar] [CrossRef]
- Chen, Y.T.; Davis, H.T.; Macosko, C.W. Wetting of fiber mats for composites manufacturing: I. Visualization experiments. AIChE J. 1995, 41, 2261–2273. [Google Scholar] [CrossRef]
- Rohatgi, V.; Patel, N.; Lee, L.J. Experimental Investigation of Flow-Induced Microvoids during Impregnation of Unidirectional Stitched Fiberglass Mat. Polym. Compos. 1996, 17, 161–170. [Google Scholar] [CrossRef]
- Leclerc, J.S.; Ruiz, E. Porosity reduction using optimized flow velocity in Resin Transfer Molding. Compos. Part A Appl. Sci. Manuf. 2008, 39, 1859–1868. [Google Scholar] [CrossRef]
- Park, C.H.; Lebel, A.; Saouab, A.; Bréard, J.; Lee, W.I. Modeling and simulation of voids and saturation in liquid composite molding processes. Compos. Part A Appl. Sci. Manuf. 2011, 42, 658–668. [Google Scholar] [CrossRef]
- DeValve, C.; Pitchumani, R. Simulation of void formation in liquid composite molding processes. Compos. Part A Appl. Sci. Manuf. 2013, 51, 22–32. [Google Scholar] [CrossRef]
- Achim, V.; Ruiz, E. Guiding selection for reduced process development time in RTM. Int. J. Mater. Form. 2009, 3, 1277–1286. [Google Scholar] [CrossRef]
- Ruiz, E.; Achim, V.; Soukane, S.; Trochu, F.; Bréard, J. Optimization of injection flow rate to minimize micro/macro-voids formation in resin transfer molded composites. Compos. Sci. Technol. 2006, 66, 475–486. [Google Scholar] [CrossRef]
- LeBel, F.; Fanaei, A.E.; Ruiz, É.; Trochu, F. Prediction of optimal flow front velocity to minimize void formation in dual scale fibrous reinforcements. Int. J. Mater. Form. 2014, 7, 93–116. [Google Scholar] [CrossRef]
- Amico, S.C.; Lekakou, C. Axial impregnation of a fiber bundle. Part 1: Capillary experiments. Polym. Compos. 2002, 23, 249–263. [Google Scholar] [CrossRef]
- Amico, S.C.; Lekakou, C. Axial impregnation of a fiber bundle. Part 2: Theoretical analysis. Polym. Compos. 2002, 23, 264–273. [Google Scholar] [CrossRef]
- Hsieh, Y.-L.; Yu, B. Liquid Wetting, Transport, and Retention Properties of Fibrous Assemblies: Part I: Water Wetting Properties of Woven Fabrics and Their Constituent Single Fibers. Text. Res. J. 1992, 62, 677–685. [Google Scholar] [CrossRef]
- Bayramli, E.; Powell, R.L. Experimental Investigation of the Axial Impregnation of Oriented Fiber Bundles by Capillary Forces; U.S. Army Laboratory Command: Springfield, VA, USA, 1992. [Google Scholar]
- LeBel, F.; Fanaei, A.E.; Ruiz, É.; Trochu, F. Experimental Characterization by Fluorescence of Capillary Flows in the Fiber Tows of Engineering Fabrics. Open J. Inorg. Non-Met. Mater. 2012, 2, 25–45. [Google Scholar] [CrossRef]
- LeBel, F.; Fanaei, A.E.; Ruiz, E.; Trochu, F. Experimental characterization by fluorescence of capillary flows in dual-scale engineering fabrics. Text. Res. J. 2013, 83, 1634–1659. [Google Scholar] [CrossRef]
- LeBel, F.; Ruiz, É.; Trochu, F. Void content analysis and processing issues to minimize defects in liquid composite molding. Polym. Compos. 2017. [Google Scholar] [CrossRef]
- Otsu, N. A threshold selection method from gray-level histograms. IEEE Trans. Syst. Man Cybern. 1979, 9, 62–66. [Google Scholar] [CrossRef]
- Labat, L.; Bréard, J.; Pillut-Lesavre, S.; Bouquet, G. Void fraction prevision in LCM parts. EPJ Appl. Phys. 2001, 16, 157–164. [Google Scholar] [CrossRef]
- Duan, Y.; Zuo, L.; Zhao, Y.; Zhang, Z.; Liang, Z. Effect of Fabric Structure on Deffects in Composites Manufactured by RTM. In Proceedings of the 16th International Conference on Composite Materials, Kyoto, Japan, 8–13 July 2007. [Google Scholar]
- Pearce, N.; Guild, F.; Summerscales, J. A study of the effects of convergent flow fronts on the properties of fibre reinforced composites produced by RTM. Compos. Part A Appl. Sci. Manuf. 1998, 29, 141–152. [Google Scholar] [CrossRef]
- Washburn, E.W. The dynamics of capillary flow. Phys. Rev. 1921, 17, 273. [Google Scholar] [CrossRef]
- Hamdaoui, M.; Fayala, F.; Nasrallah, S.B. Dynamics of capillary rise in yarns: Influence of fiber and liquid characteristics. J. Appl. Polym. Sci. 2007, 104, 3050–3056. [Google Scholar] [CrossRef]
- Ravey, C.; Ruiz, E.; Trochu, F. Determination of the optimal impregnation velocity in Resin Transfer Molding by capillary rise experiments and infrared thermography. Compos. Sci. Technol. 2014, 99, 96–102. [Google Scholar] [CrossRef]
- Patel, N.; Lee, L.J. Modeling of Void Formation and Removal in Liquid Composite Molding. Part II: Model Development and Implementation. Polym. Compos. 1996, 17, 104–114. [Google Scholar] [CrossRef]
Figure 1.
Illustration of impregnation mechanisms inducing void formation at the flow front.

Figure 2.
Influence of injection velocity on void formation during RTM manufacturing.
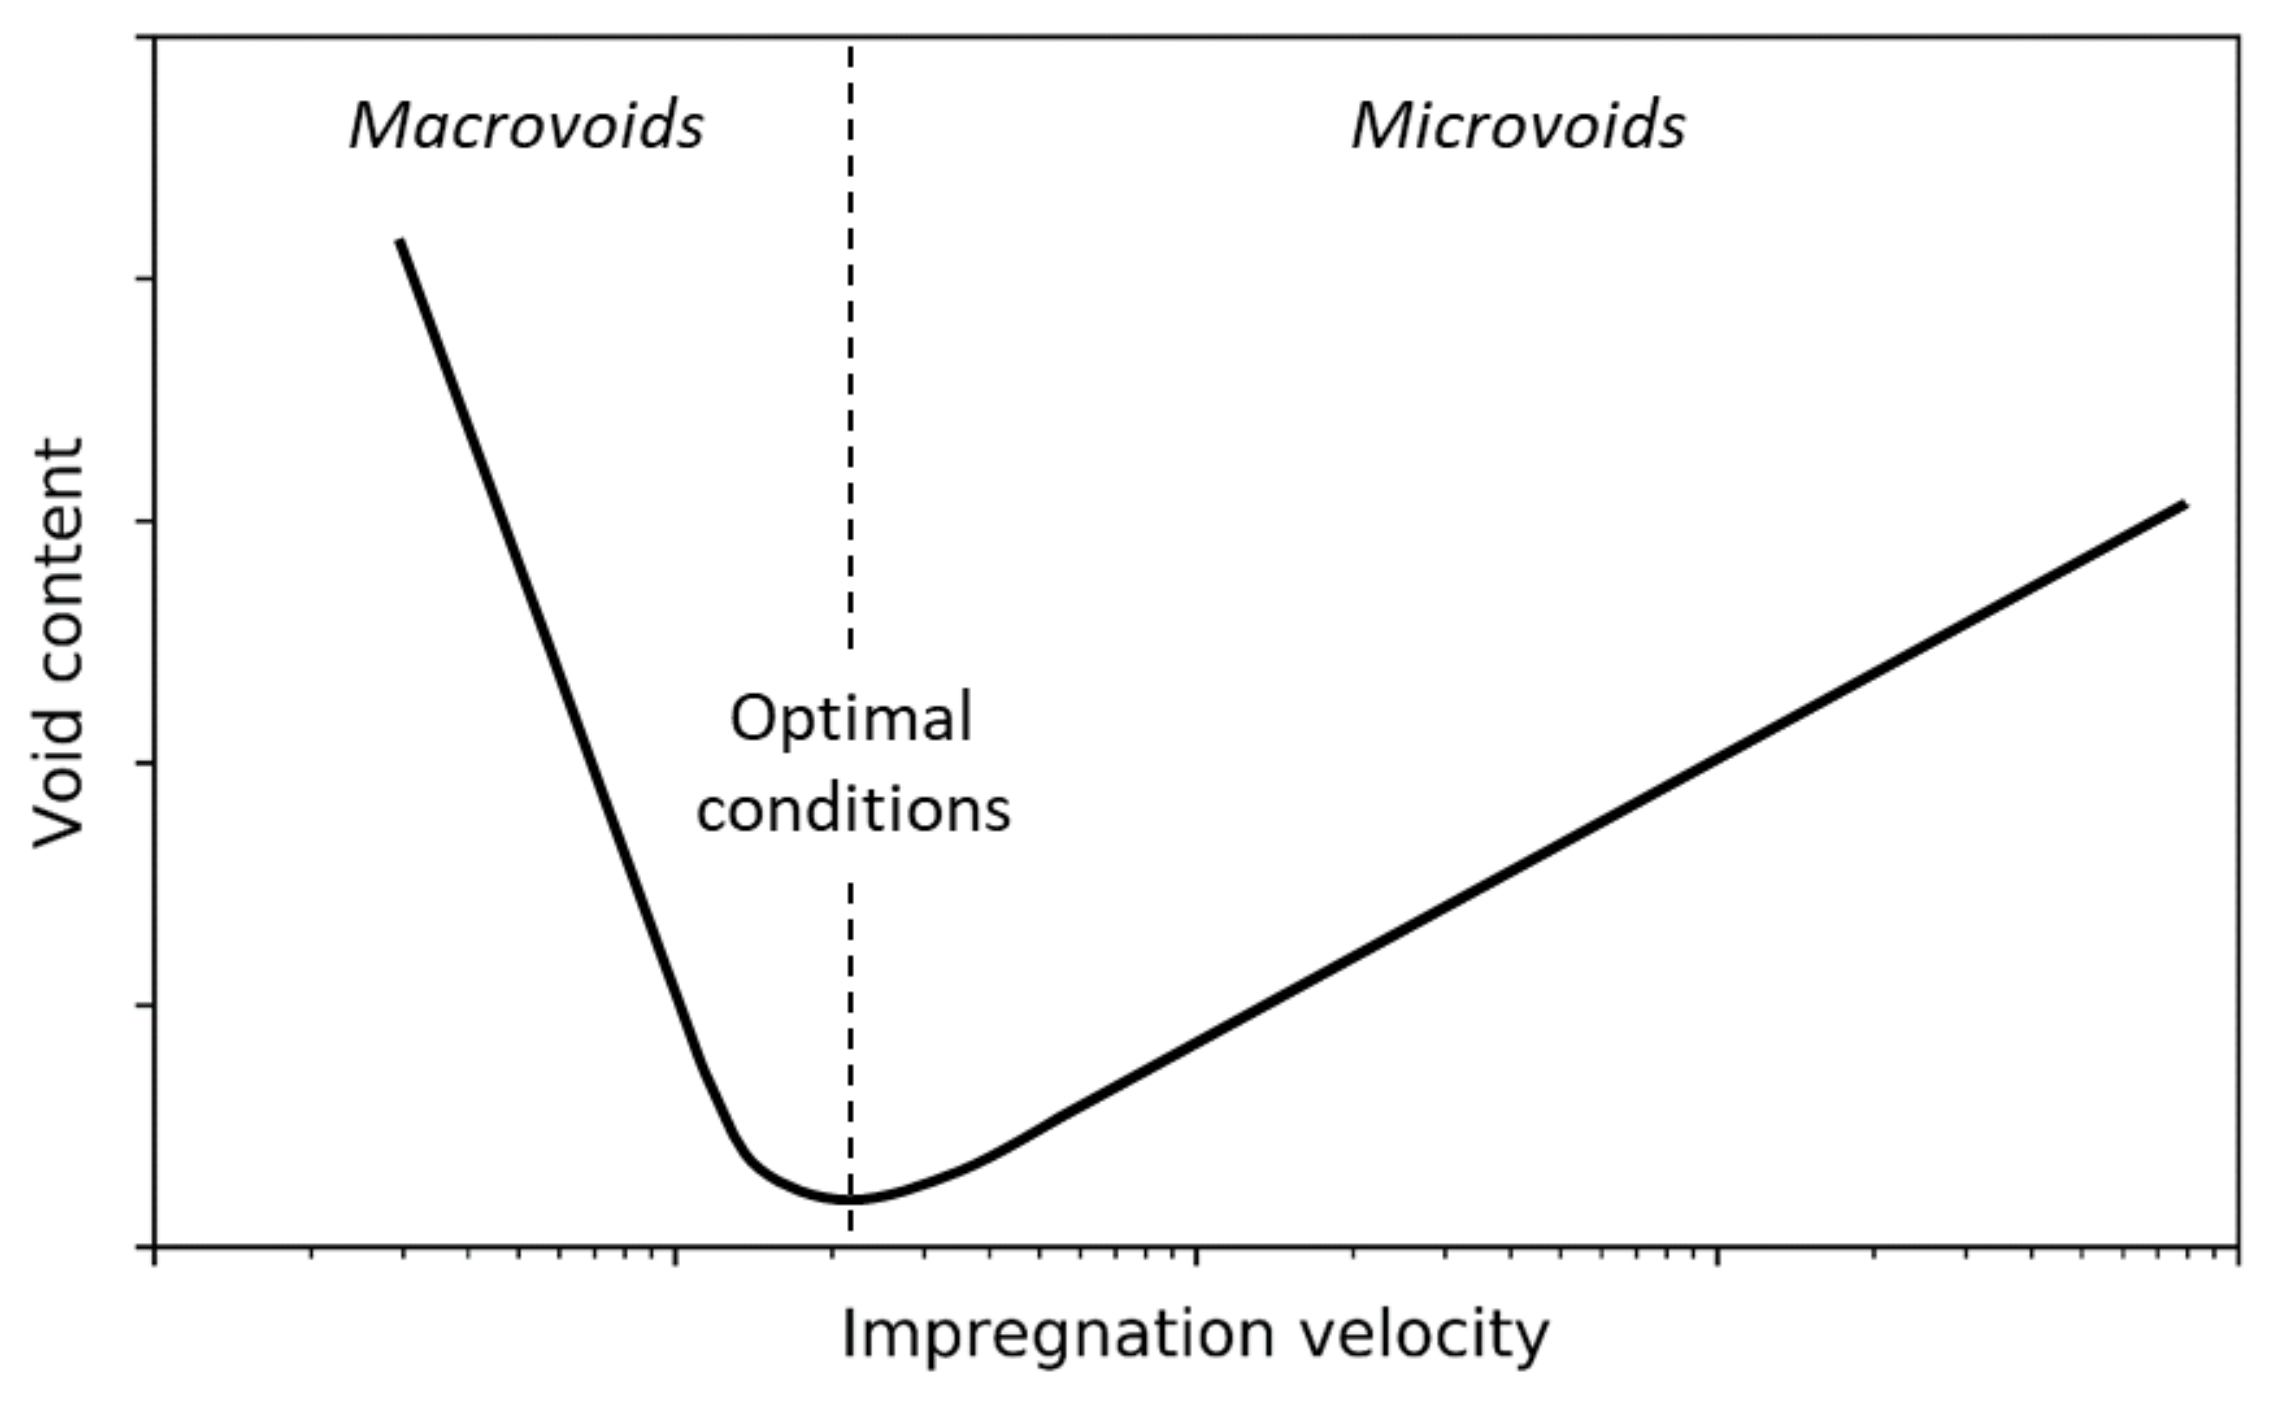
Figure 3.
(a) Experimental setup for capillary rise measurements; (b) example of captured image.
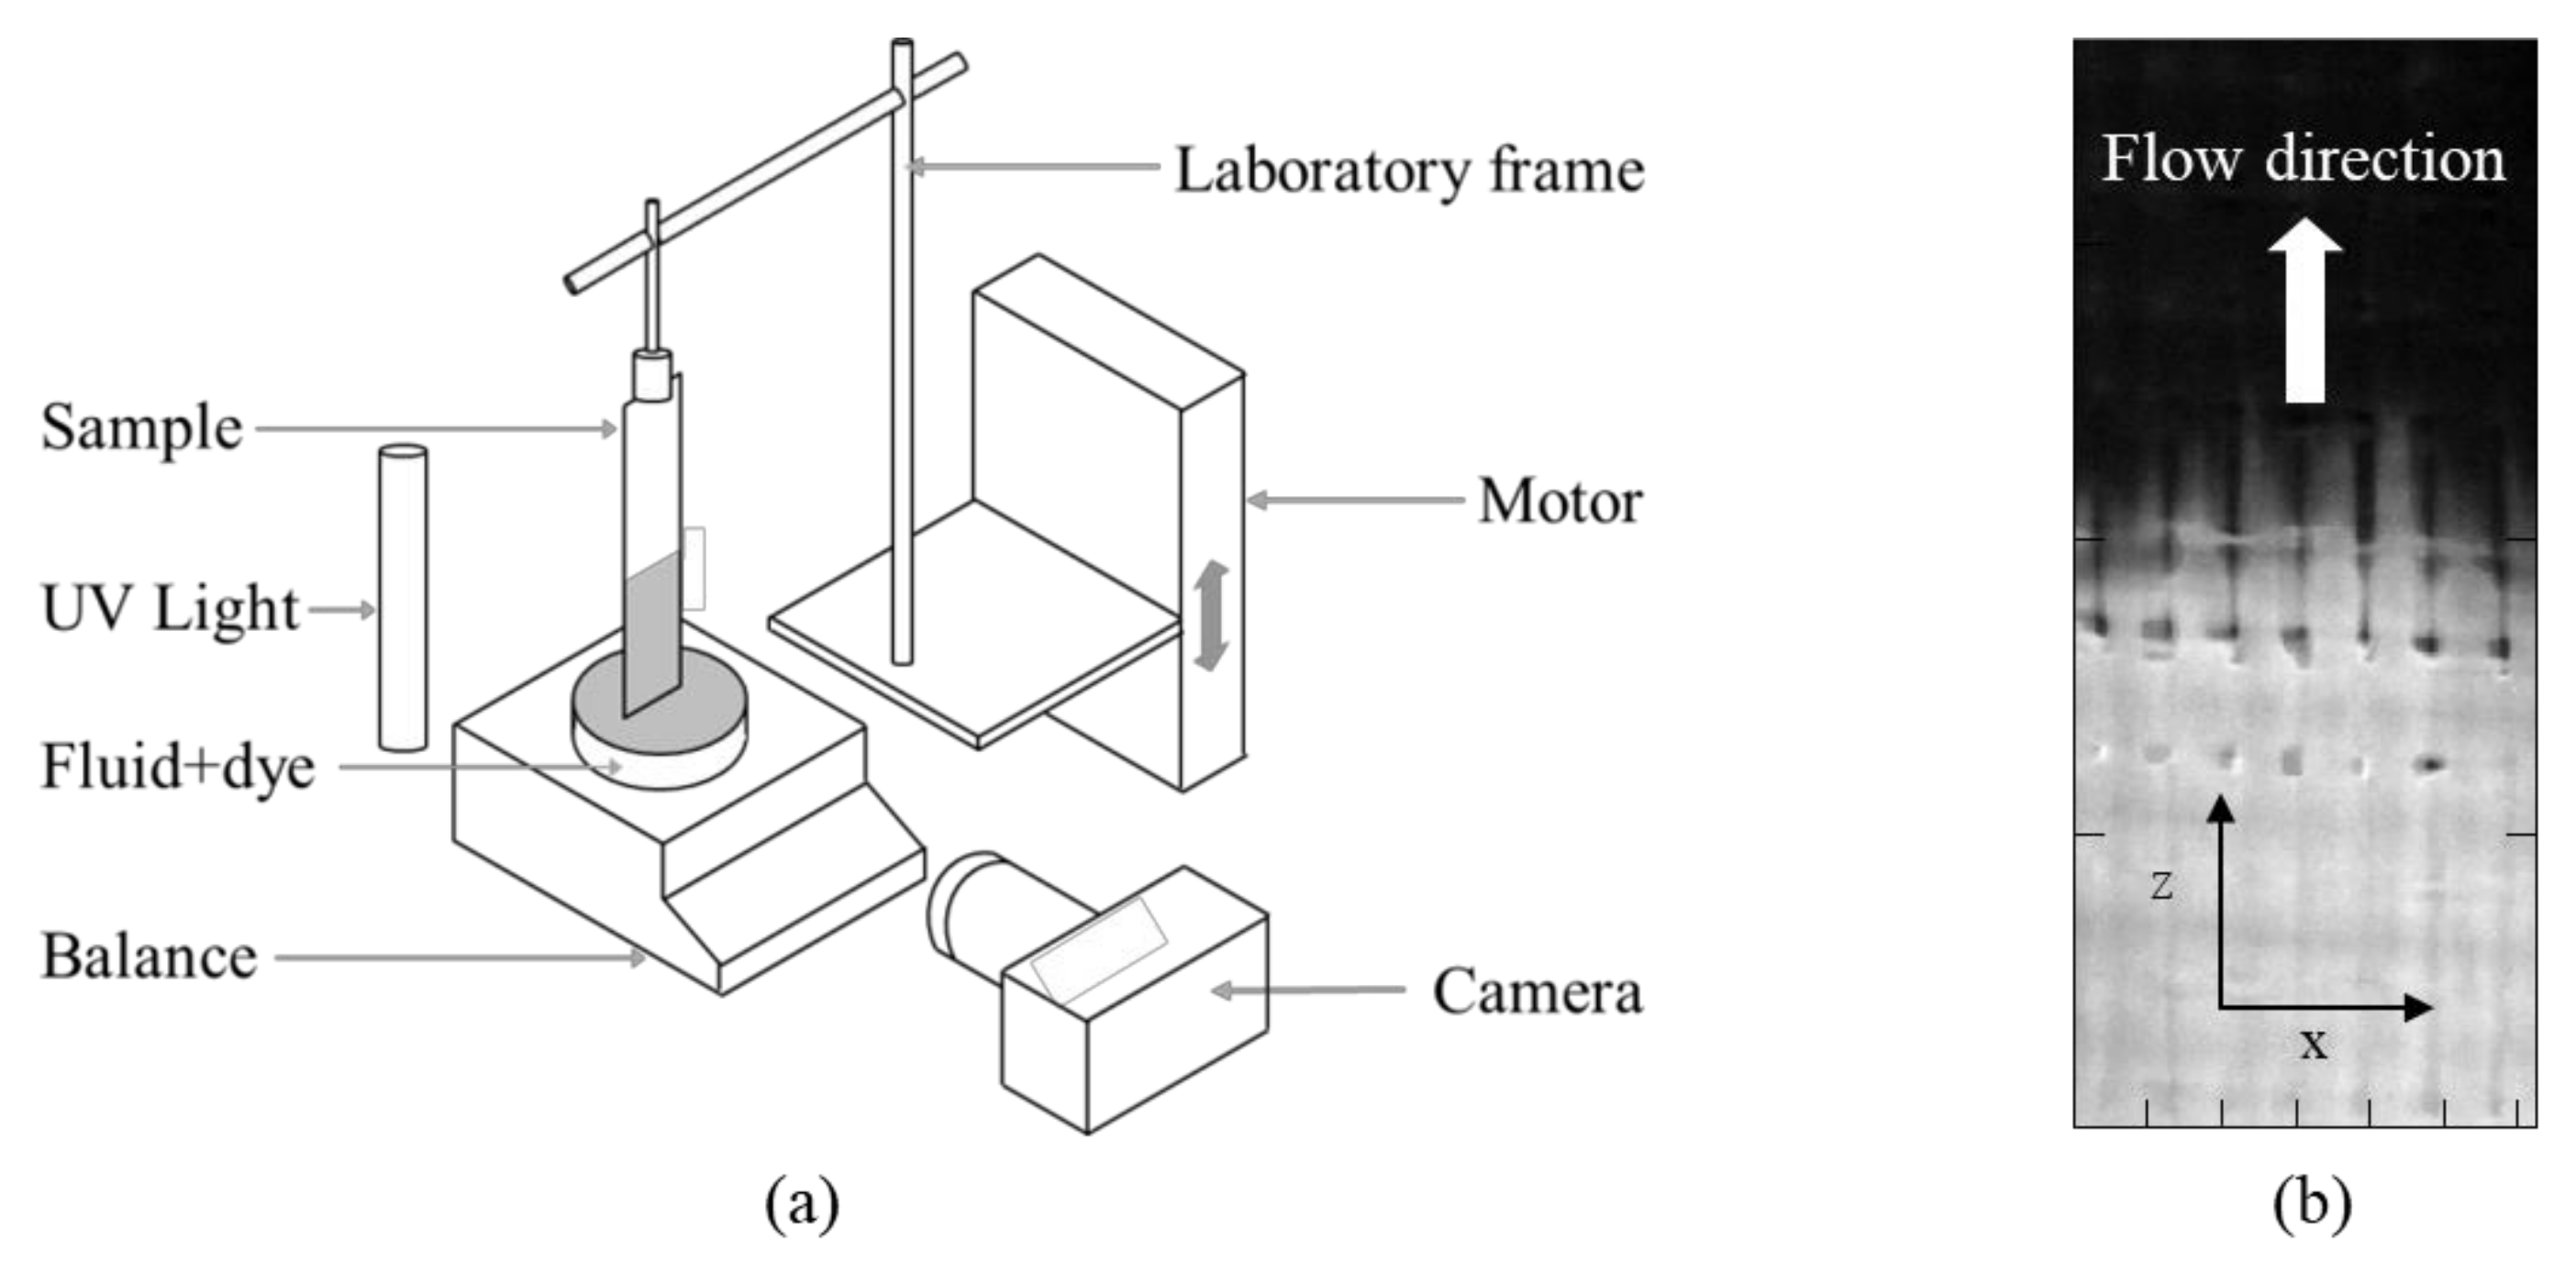
Figure 4.
Graphical analysis of the gray signal from capillary rise images and selection of the threshold value for black and white conversion.
Figure 4.
Graphical analysis of the gray signal from capillary rise images and selection of the threshold value for black and white conversion.

Figure 5.
Detection of the fluid front during capillary rise experiments: (a) with Otsu’ algorithm; (b) with the approach developed in this investigation.
Figure 5.
Detection of the fluid front during capillary rise experiments: (a) with Otsu’ algorithm; (b) with the approach developed in this investigation.

Figure 6.
Evolution of the imbibition height during repeated capillary rise experiments.
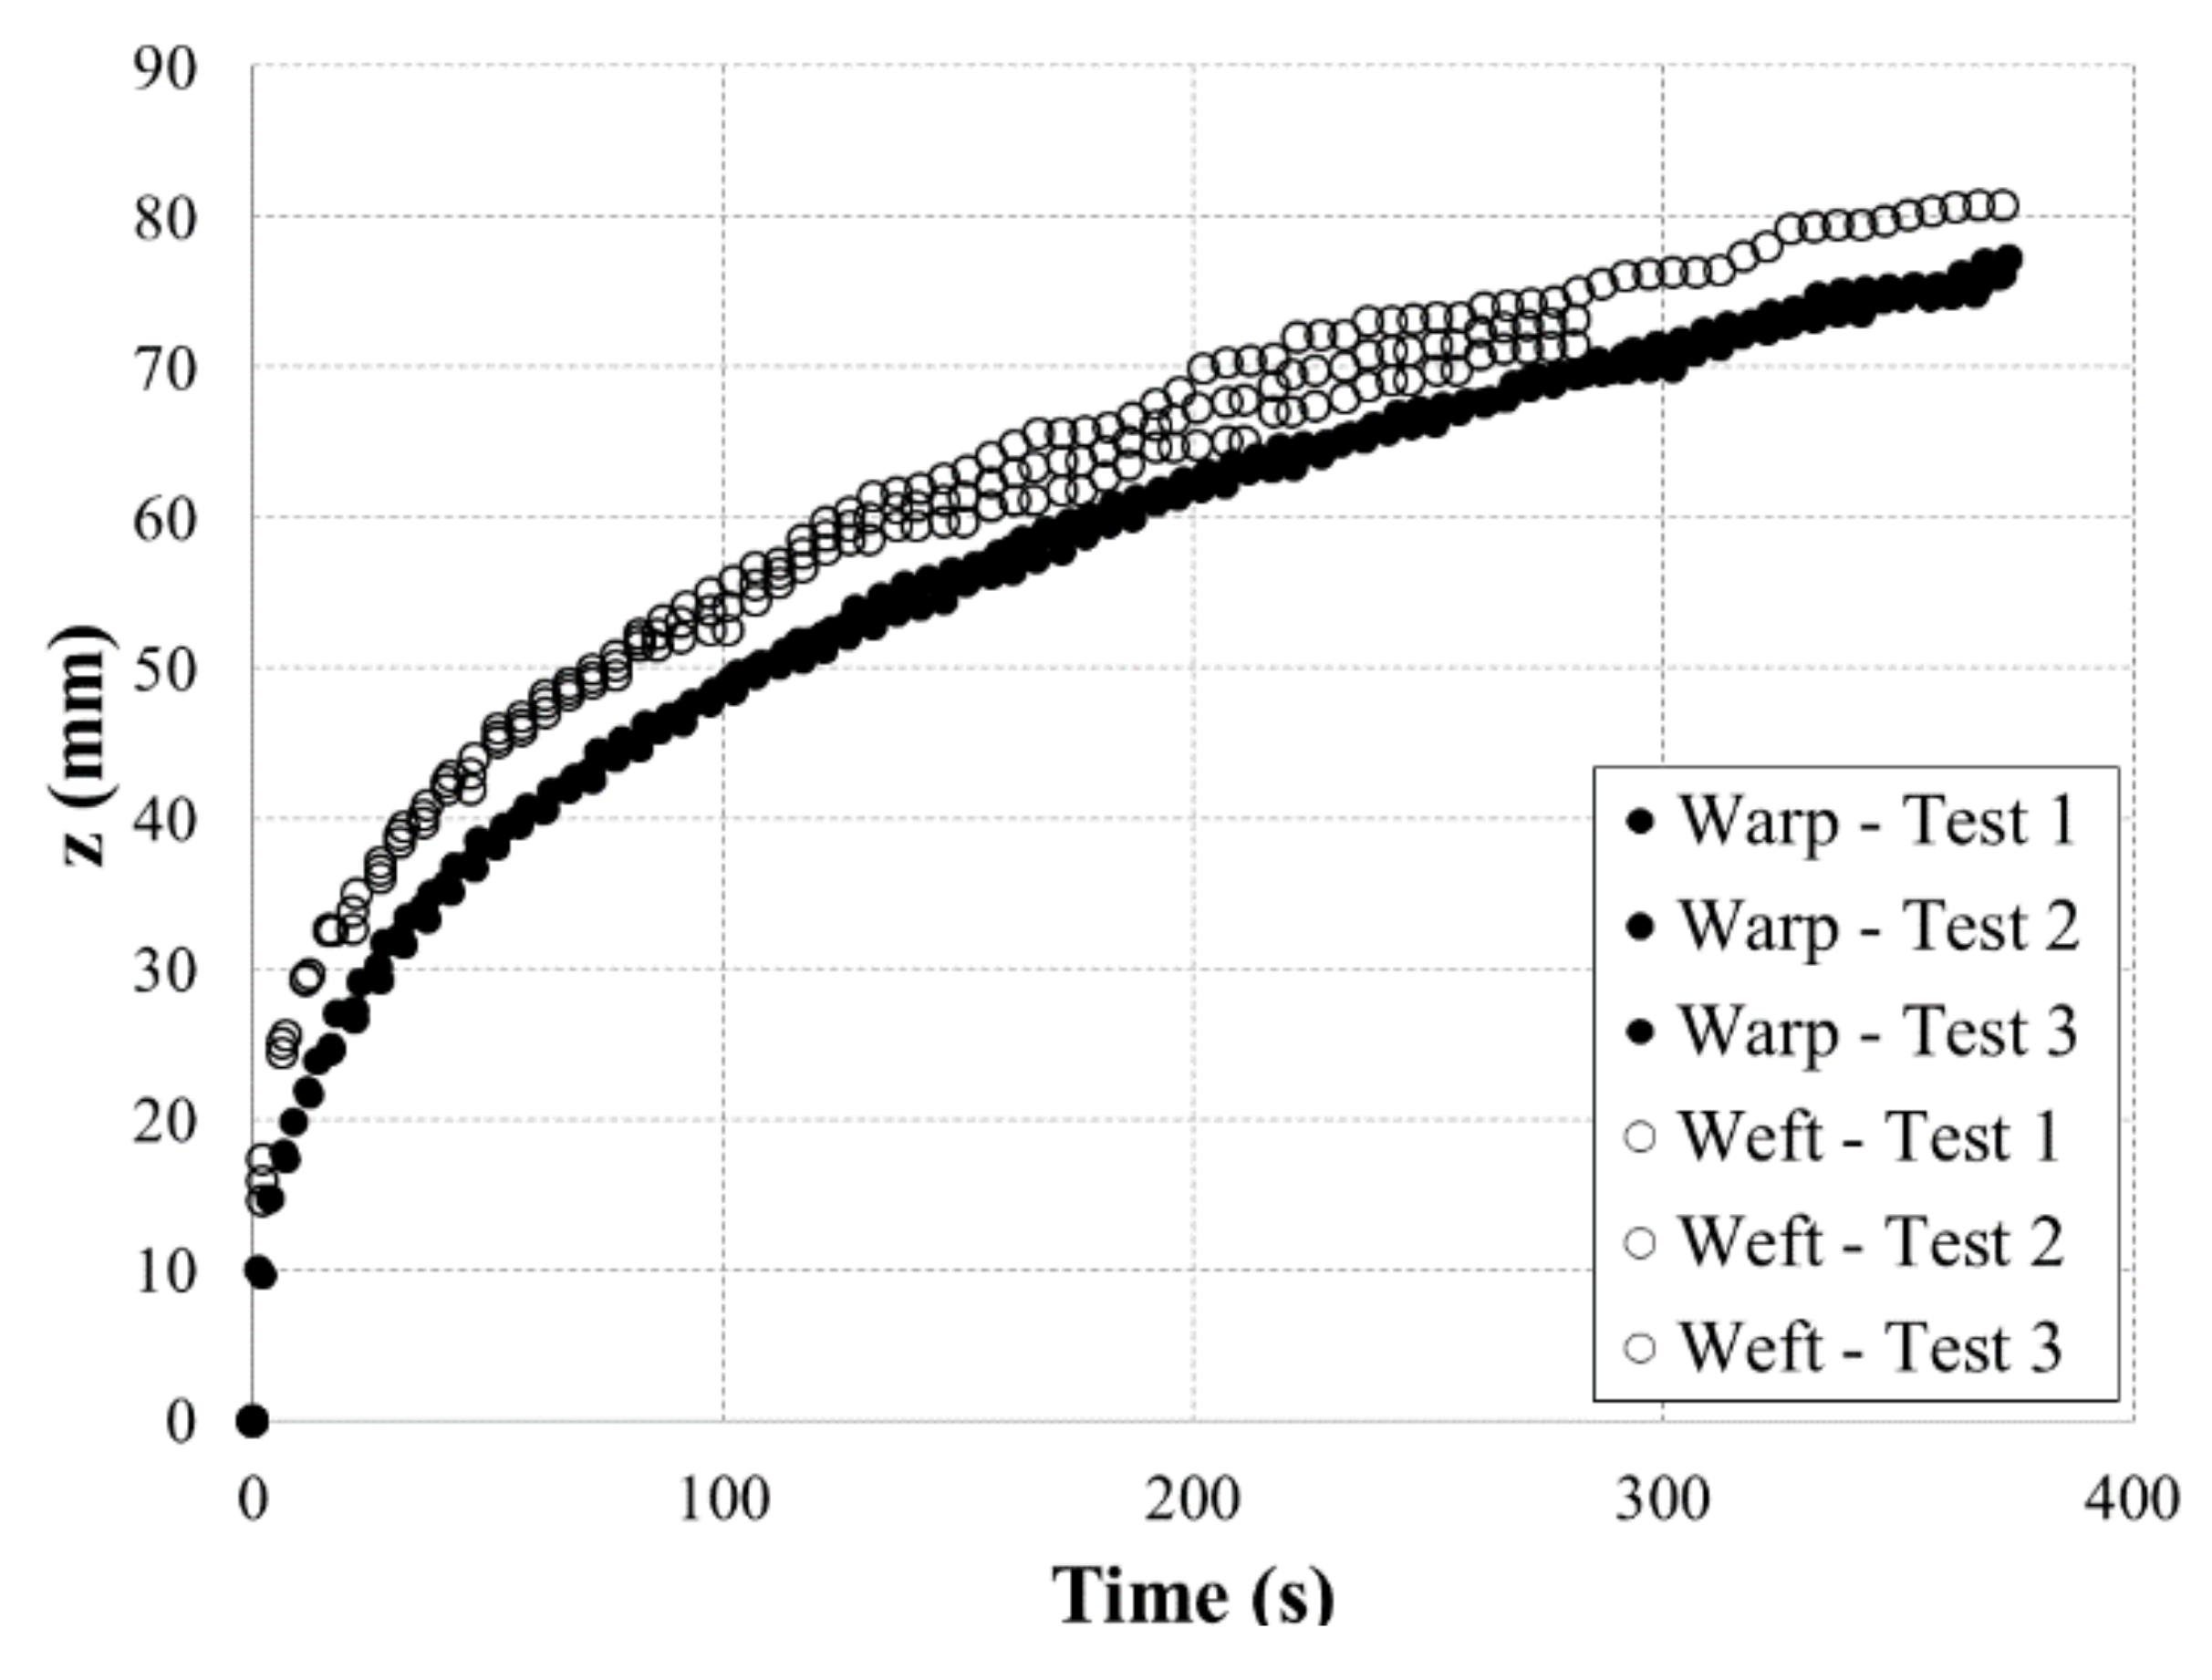
Figure 7.
Evolution of the squared height during capillary rise experiments and linear interpolation based on the Lucas-Washburn model.
Figure 7.
Evolution of the squared height during capillary rise experiments and linear interpolation based on the Lucas-Washburn model.

Figure 8.
Influence of the imbibition time on the estimation of the Lucas-Washburn slope by linear regression.
Figure 8.
Influence of the imbibition time on the estimation of the Lucas-Washburn slope by linear regression.
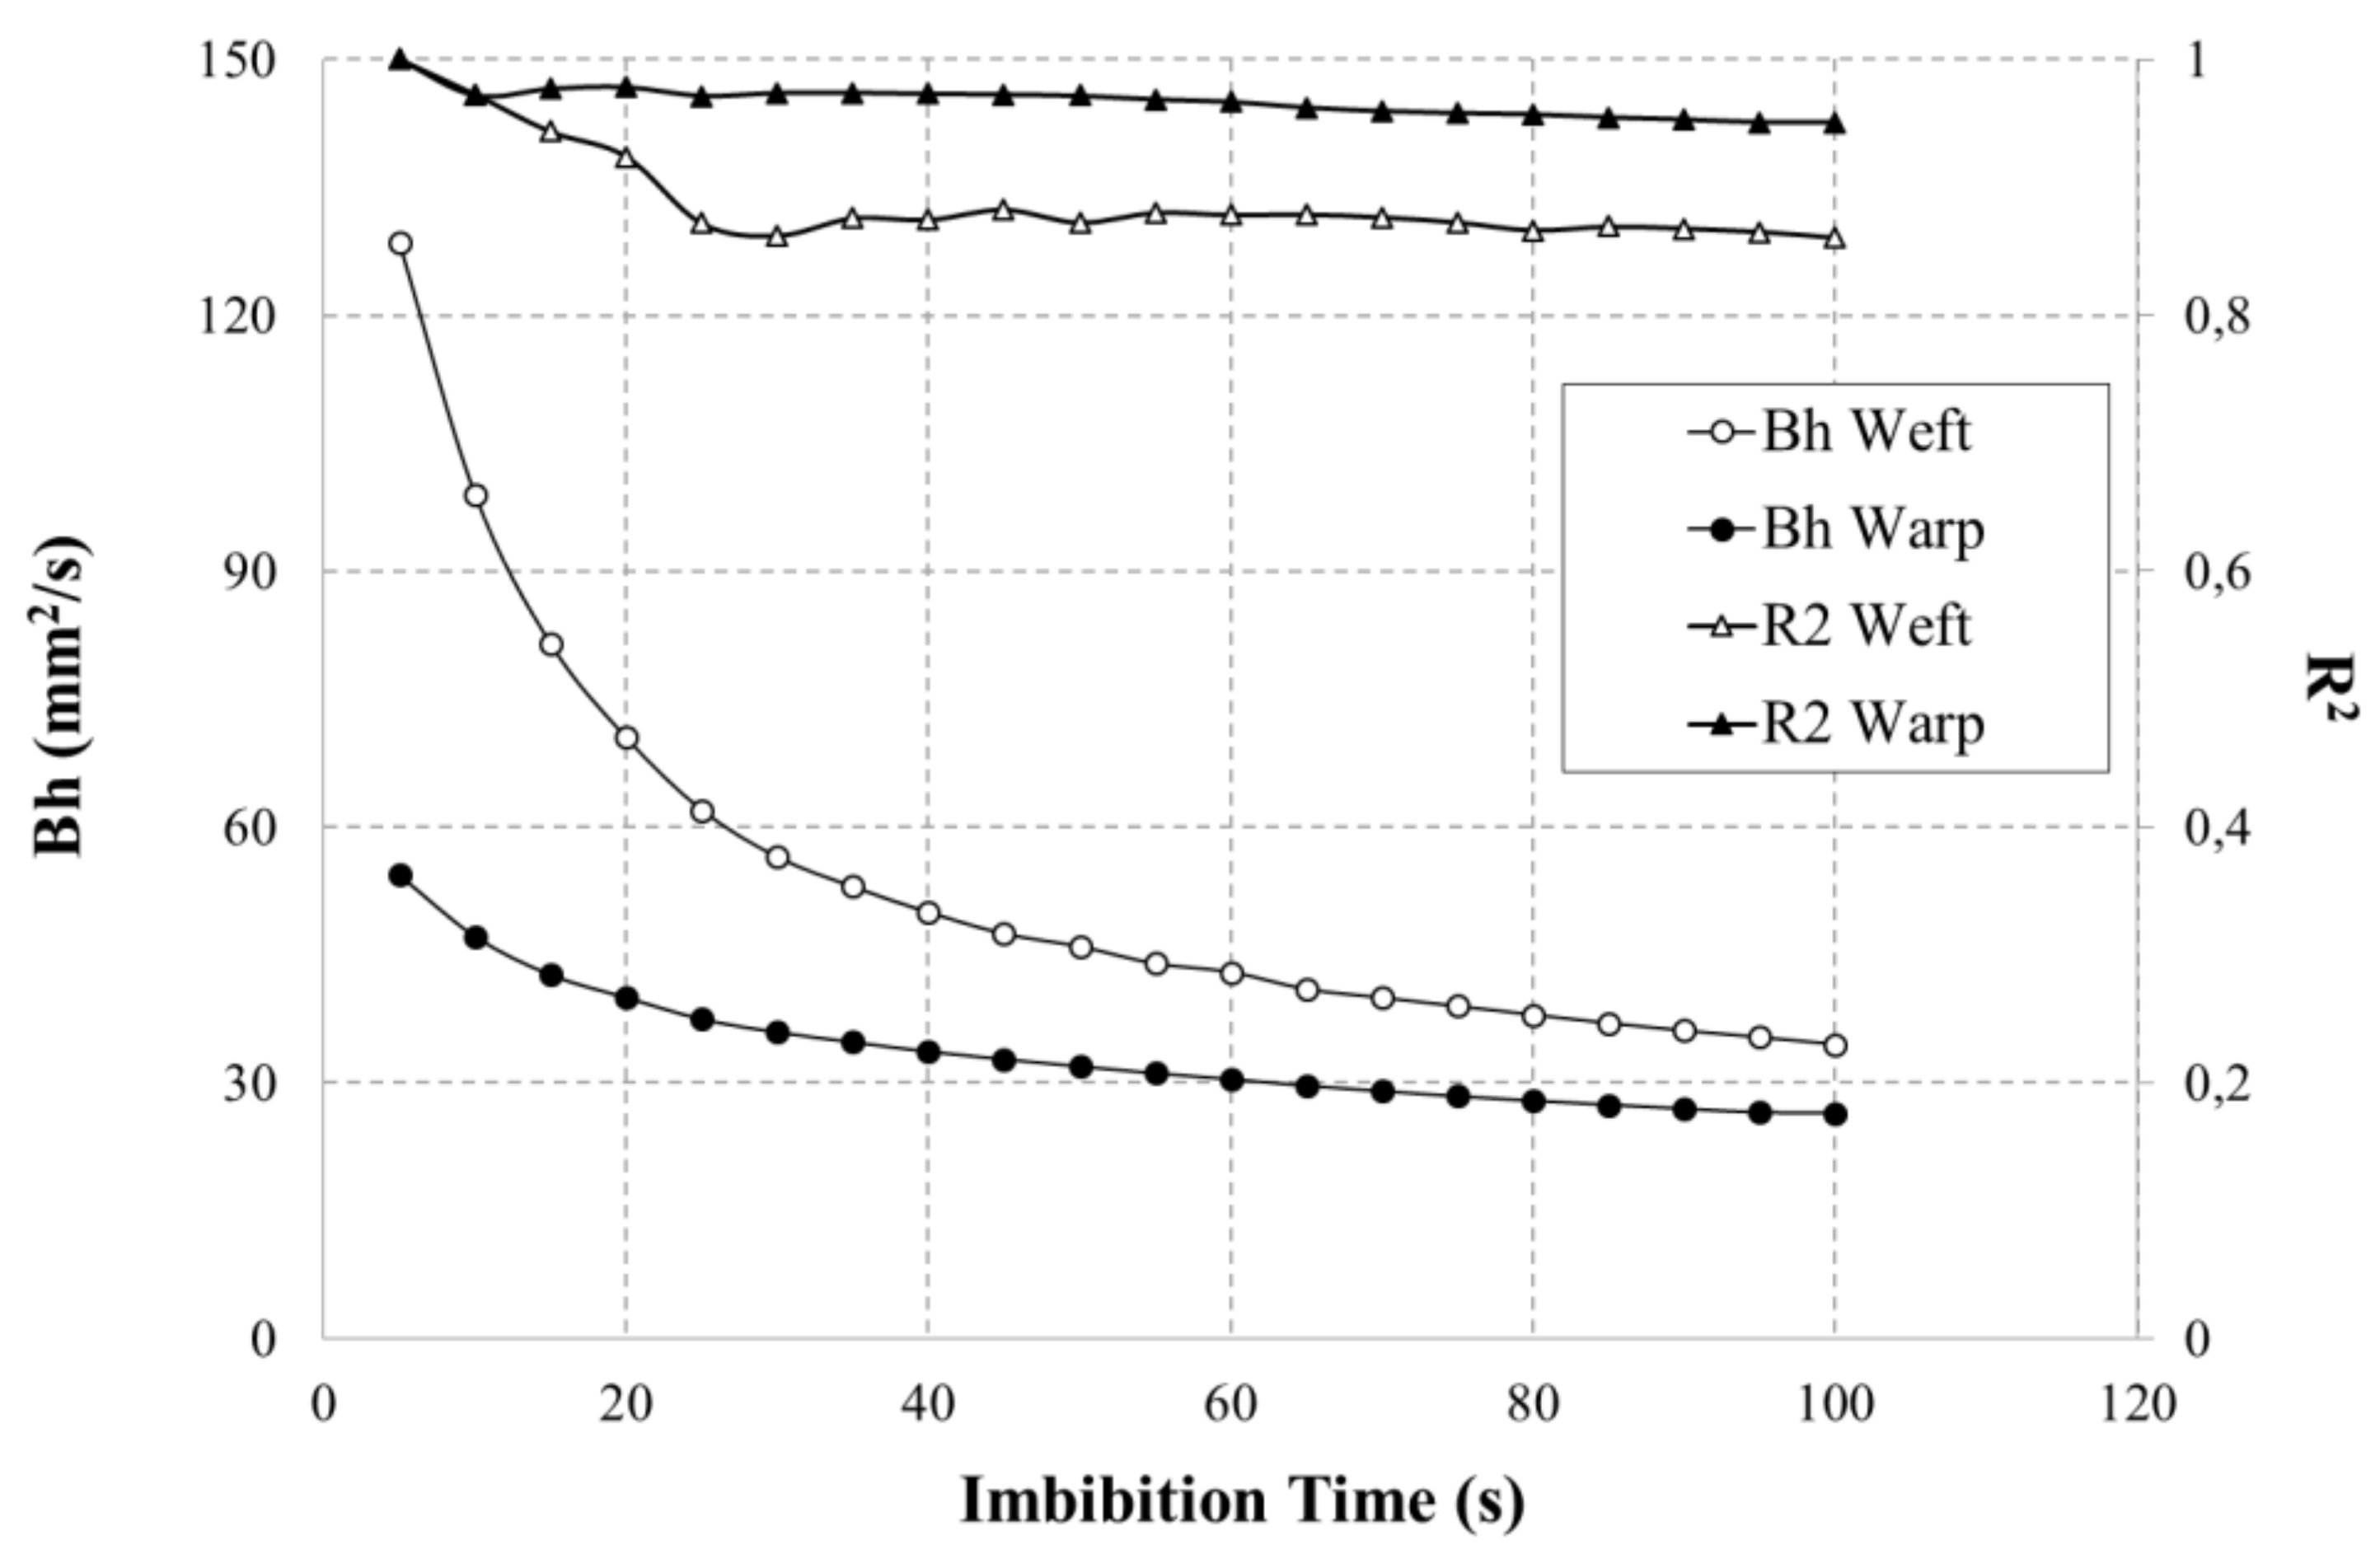
Figure 9.
Characteristic distance Lc of the elementary cell.
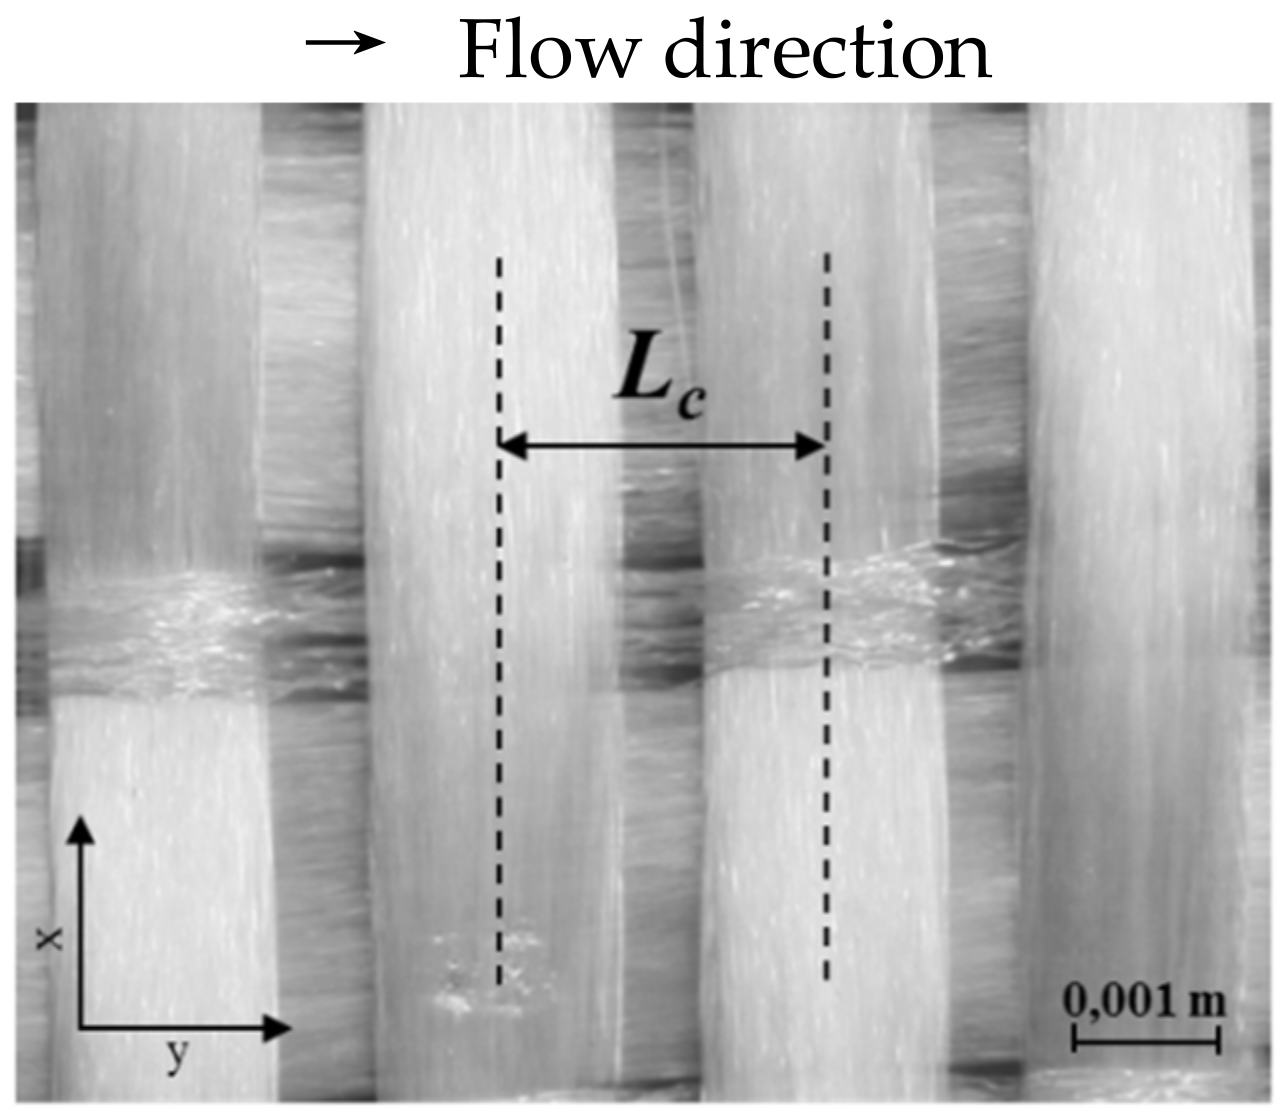
Figure 10.
Schematics of the experimental RTM manufacturing setup.

Figure 11.
Top view of the composite plate and cutting pattern for void content analysis.
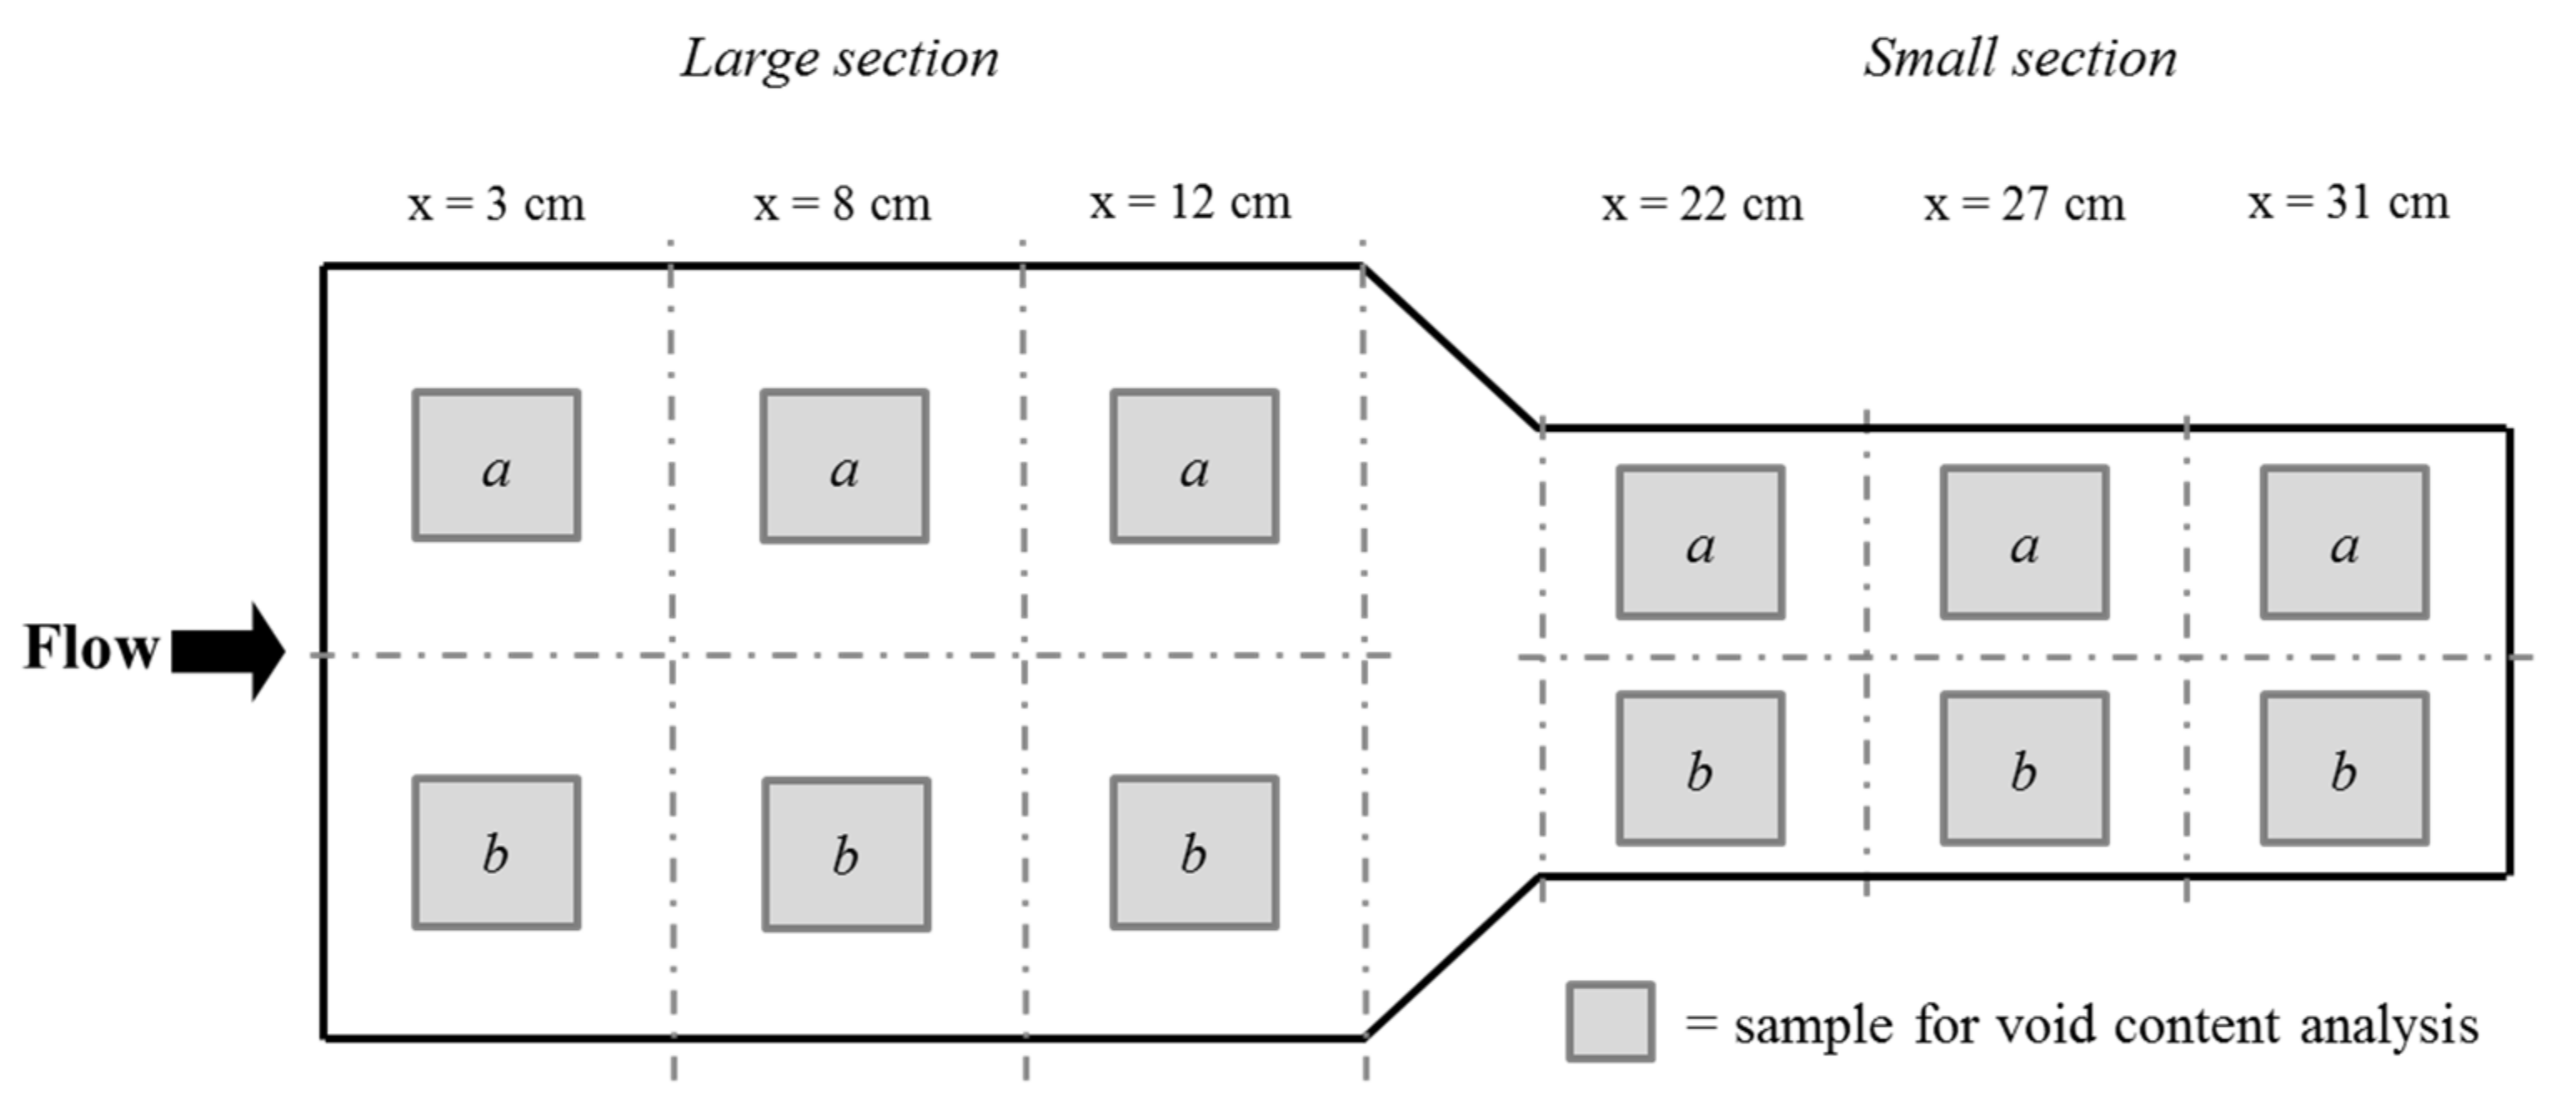
Figure 12.
Void content analysis averaged by section for the divergent injections.
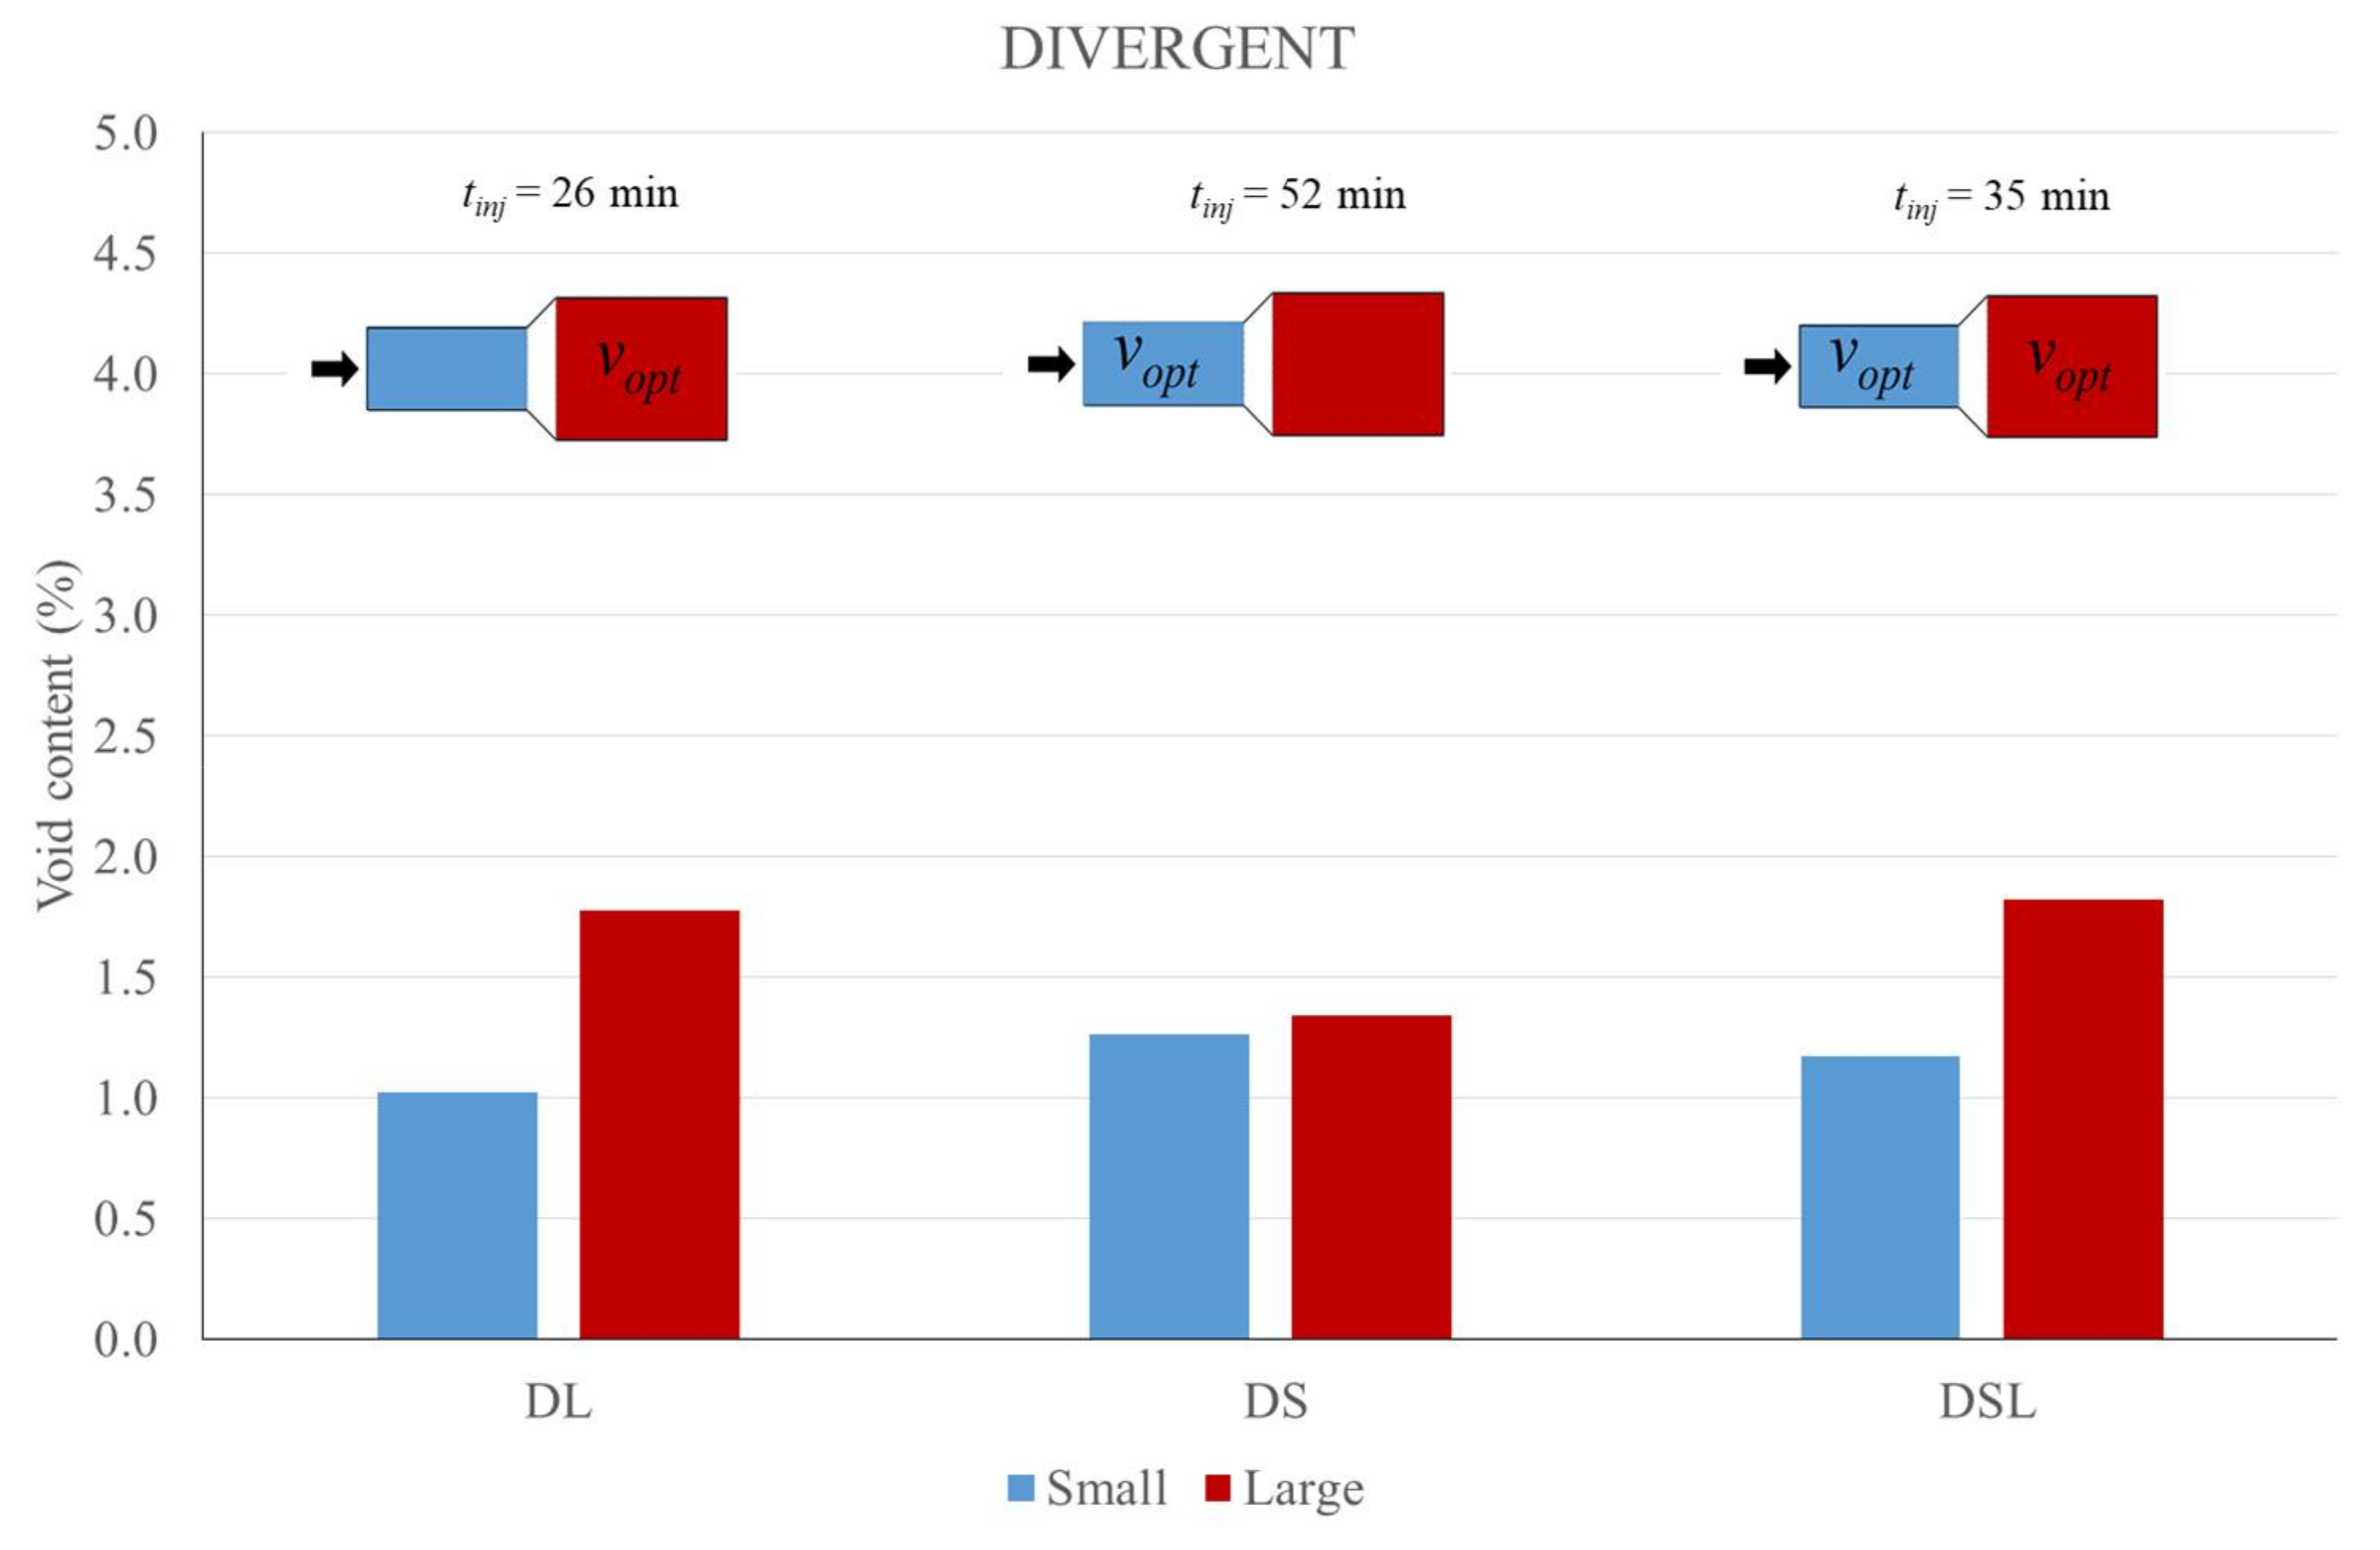
Figure 13.
Void content analysis averaged by section for the convergent injections.

Figure 14.
Measured void content as a function of injection velocity and distance from inlet.


Table 1.
Summary of capillary characterization of TG15N fabric with hexadecane.
| Bh (mm2·s−1) | Lc (mm) | vopt (mm·s−1) | |
|---|---|---|---|
| Warp | 32–55 | 1.94 | 16.5–28.4 |
| Weft | 45–128 | 3.26 | 13.8–39.3 |
Table 2.
Summary of fluids properties [18].
Table 2.
Summary of fluids properties [18].
| Hexadecane | Vinyl Ester 411–350 | Epoxy DER 383 | |
|---|---|---|---|
| Viscosity (mPa·s) | 3.51 | 480 | 896 |
| Surface tension (mN/m) | 27.5 | 34.3 | 44.8 |
| Contact angle (°) | 0 | 44 | 32 |
Table 3.
Prediction of optimal injection velocities for TG15N fabric with different resins.
| vopt (mm·s−1) | ||||
|---|---|---|---|---|
| Vinyl Ester Resin | Epoxy Resin | |||
| This Work | Lebel et al. [18] | This Work | Lebel et al. [18] | |
| Warp | 0.109–0.186 | 0.077–0.18 | 0.0912–0.153 | 0.06–0.14 |
| Weft | 0.0909–0.258 | 0.077–0.20 | 0.0763–0.212 | 0.06–0.14 |
Table 4.
Summary of the injection strategies considered during the manufacturing program.
CONVERGENT  | DIVERGENT  | |||||
|---|---|---|---|---|---|---|
| Plate Name | Large Section | Small Section | Plate Name | Small Section | Large Section | |
| Case 1 | CL | vopt | 2 vopt | DL | 2 vopt | vopt |
| Case 2 | CS | 0.5 vopt | vopt | DS | vopt | 0.5 vopt |
| Case 3 | CLS | vopt | vopt | DSL | vopt | vopt |
Table 5.
Summary of void content analyses.
| Distance from Injection Point | ||||||||
|---|---|---|---|---|---|---|---|---|
| 3 cm | 8 cm | 12 cm | 22 cm | 27 cm | 31 cm | |||
| Void content (%) | Divergent | DL | 0.915 | 1.031 | 1.121 | 1.524 | 1.711 | 2.068 |
| DS 1 | 1.499 | 1.300 | 0.990 | 0.956 | 1.053 | 1.437 | ||
| DSL | 1.291 | 1.160 | 1.071 | 1.312 | 1.744 | 2.415 | ||
| Convergent | CL | 0.582 | 0.397 | 1.855 | 1.753 | 2.952 | 3.377 | |
| CS | 0.753 | 0.794 | 0.829 | 1.671 | 2.525 | 2.713 | ||
| CLS | 1.163 | 1.536 | 2.552 | 2.324 | 3.024 | 2.786 | ||
1 Data from only one composite plate.
© 2018 by the authors. Licensee MDPI, Basel, Switzerland. This article is an open access article distributed under the terms and conditions of the Creative Commons Attribution (CC BY) license (http://creativecommons.org/licenses/by/4.0/).
Share and Cite
MDPI and ACS Style
Causse, P.; Ravey, C.; Trochu, F. Capillary Characterization of Fibrous Reinforcement and Optimization of Injection Strategy in Resin Transfer Molding. J. Compos. Sci. 2018, 2, 19. https://doi.org/10.3390/jcs2020019
AMA Style
Causse P, Ravey C, Trochu F. Capillary Characterization of Fibrous Reinforcement and Optimization of Injection Strategy in Resin Transfer Molding. Journal of Composites Science. 2018; 2(2):19. https://doi.org/10.3390/jcs2020019
Chicago/Turabian StyleCausse, Philippe, Christophe Ravey, and François Trochu. 2018. "Capillary Characterization of Fibrous Reinforcement and Optimization of Injection Strategy in Resin Transfer Molding" Journal of Composites Science 2, no. 2: 19. https://doi.org/10.3390/jcs2020019