Simulation of the Oxygen Permeability of a Composite Container


1
Laboratoire PIMM, ARTS ET METIERS ParisTech, 151 Boulevard de l’Hôpital, 75013 Paris, France
2
MBDA France, 1 Avenue Réaumur, 92350 Le Plessis-Robinson, France
*
Author to whom correspondence should be addressed.
J. Compos. Sci. 2018, 2(2), 21; https://doi.org/10.3390/jcs2020021
Submission received: 9 January 2018
/
Revised: 19 March 2018
/
Accepted: 26 March 2018
/
Published: 29 March 2018
Abstract
:A kinetic model has been derived from the classical (Fick and Henry’s) laws of the gas theory for predicting the oxygen permeability of a closed composite container, initially filled by pure nitrogen under a pressure slightly higher than the atmospheric pressure. Its two main parameters, namely the coefficients of oxygen solubility and diffusion, were determined beforehand by routine laboratory tests of oxygen permeation at 20, 30, and 45 °C. It appears clearly that oxygen molecules will quickly cross the composite wall to progressively modify the gas composition inside the container. Several solutions are proposed for trying to reduce the oxygen permeability.
1. Introduction
Oxidation is one of the main mechanisms of chemical degradation limiting the lifetime of polymeric materials. It can be initiated by the decomposition of the own instabilities of the polymer, frequently hydroperoxides [1]. It can also result from the interactions of the polymer with an irradiation source, such as UV light [2] or ionizing radiation (γ, β, or α) [3], and with chemical reagents in the form of free radicals (in ground state) coming from the exposure environment, such as chlorine disinfectants of drinking water [4,5].
In the arms and defense industry, it is usual to protect the polymer-based compounds that are very sensitive to oxidation (ammunition, propellants, etc.) in closed containers under a slight overpressure of pure nitrogen. However, some of these containers are made of an organic matrix composite material that is not totally impermeable to gases. It is thus feared that oxygen, which is initially present in the outer atmosphere of the container, crosses (by diffusion) the composite wall to progressively modify the gas composition inside the container. Accurate knowledge of the environmental conditions remains a major issue for the future studies on the durability of polymer-based compounds.
This article aims to present a relatively simple model for evaluating the changes in oxygen concentration inside the composite container over a quite realistic storage duration of polymer-based compounds, typically one decade. This model is derived from the classical (Fick and Henry’s) laws of the gas theory [6]. Its main parameters are determined from routine laboratory tests of oxygen permeation at low temperature close to room temperature.
But, this model is not just a predictive tool. Indeed, it can be also used for carefully selecting the different constituents (i.e., the fibrous architecture and matrix) of the composite material and their respective fractions, but also for determining the minimum wall thickness of the composite container, allowing for the preservation of the polymer-based compounds depending on the environmental conditions.
2. Experimental
2.1. Composite Material
The composite container was manufactured by filament winding. It is made of epoxy matrix reinforced by about 80 wt % of glass fibers. It is a tube of about 54 cm inner diameter, 57 cm outer diameter, and 7 m long.
This tube was cut with a diamond saw in both perpendicular and parallel directions to the fibers. Cross-sections were polished with a MECAPOL P320 device using silicon carbide abrasive papers of decreasing particle size (typically from 80 to 2400 granulometry) in order to be examined by optical microscopy and thus to check the good quality of the composite material after processing.
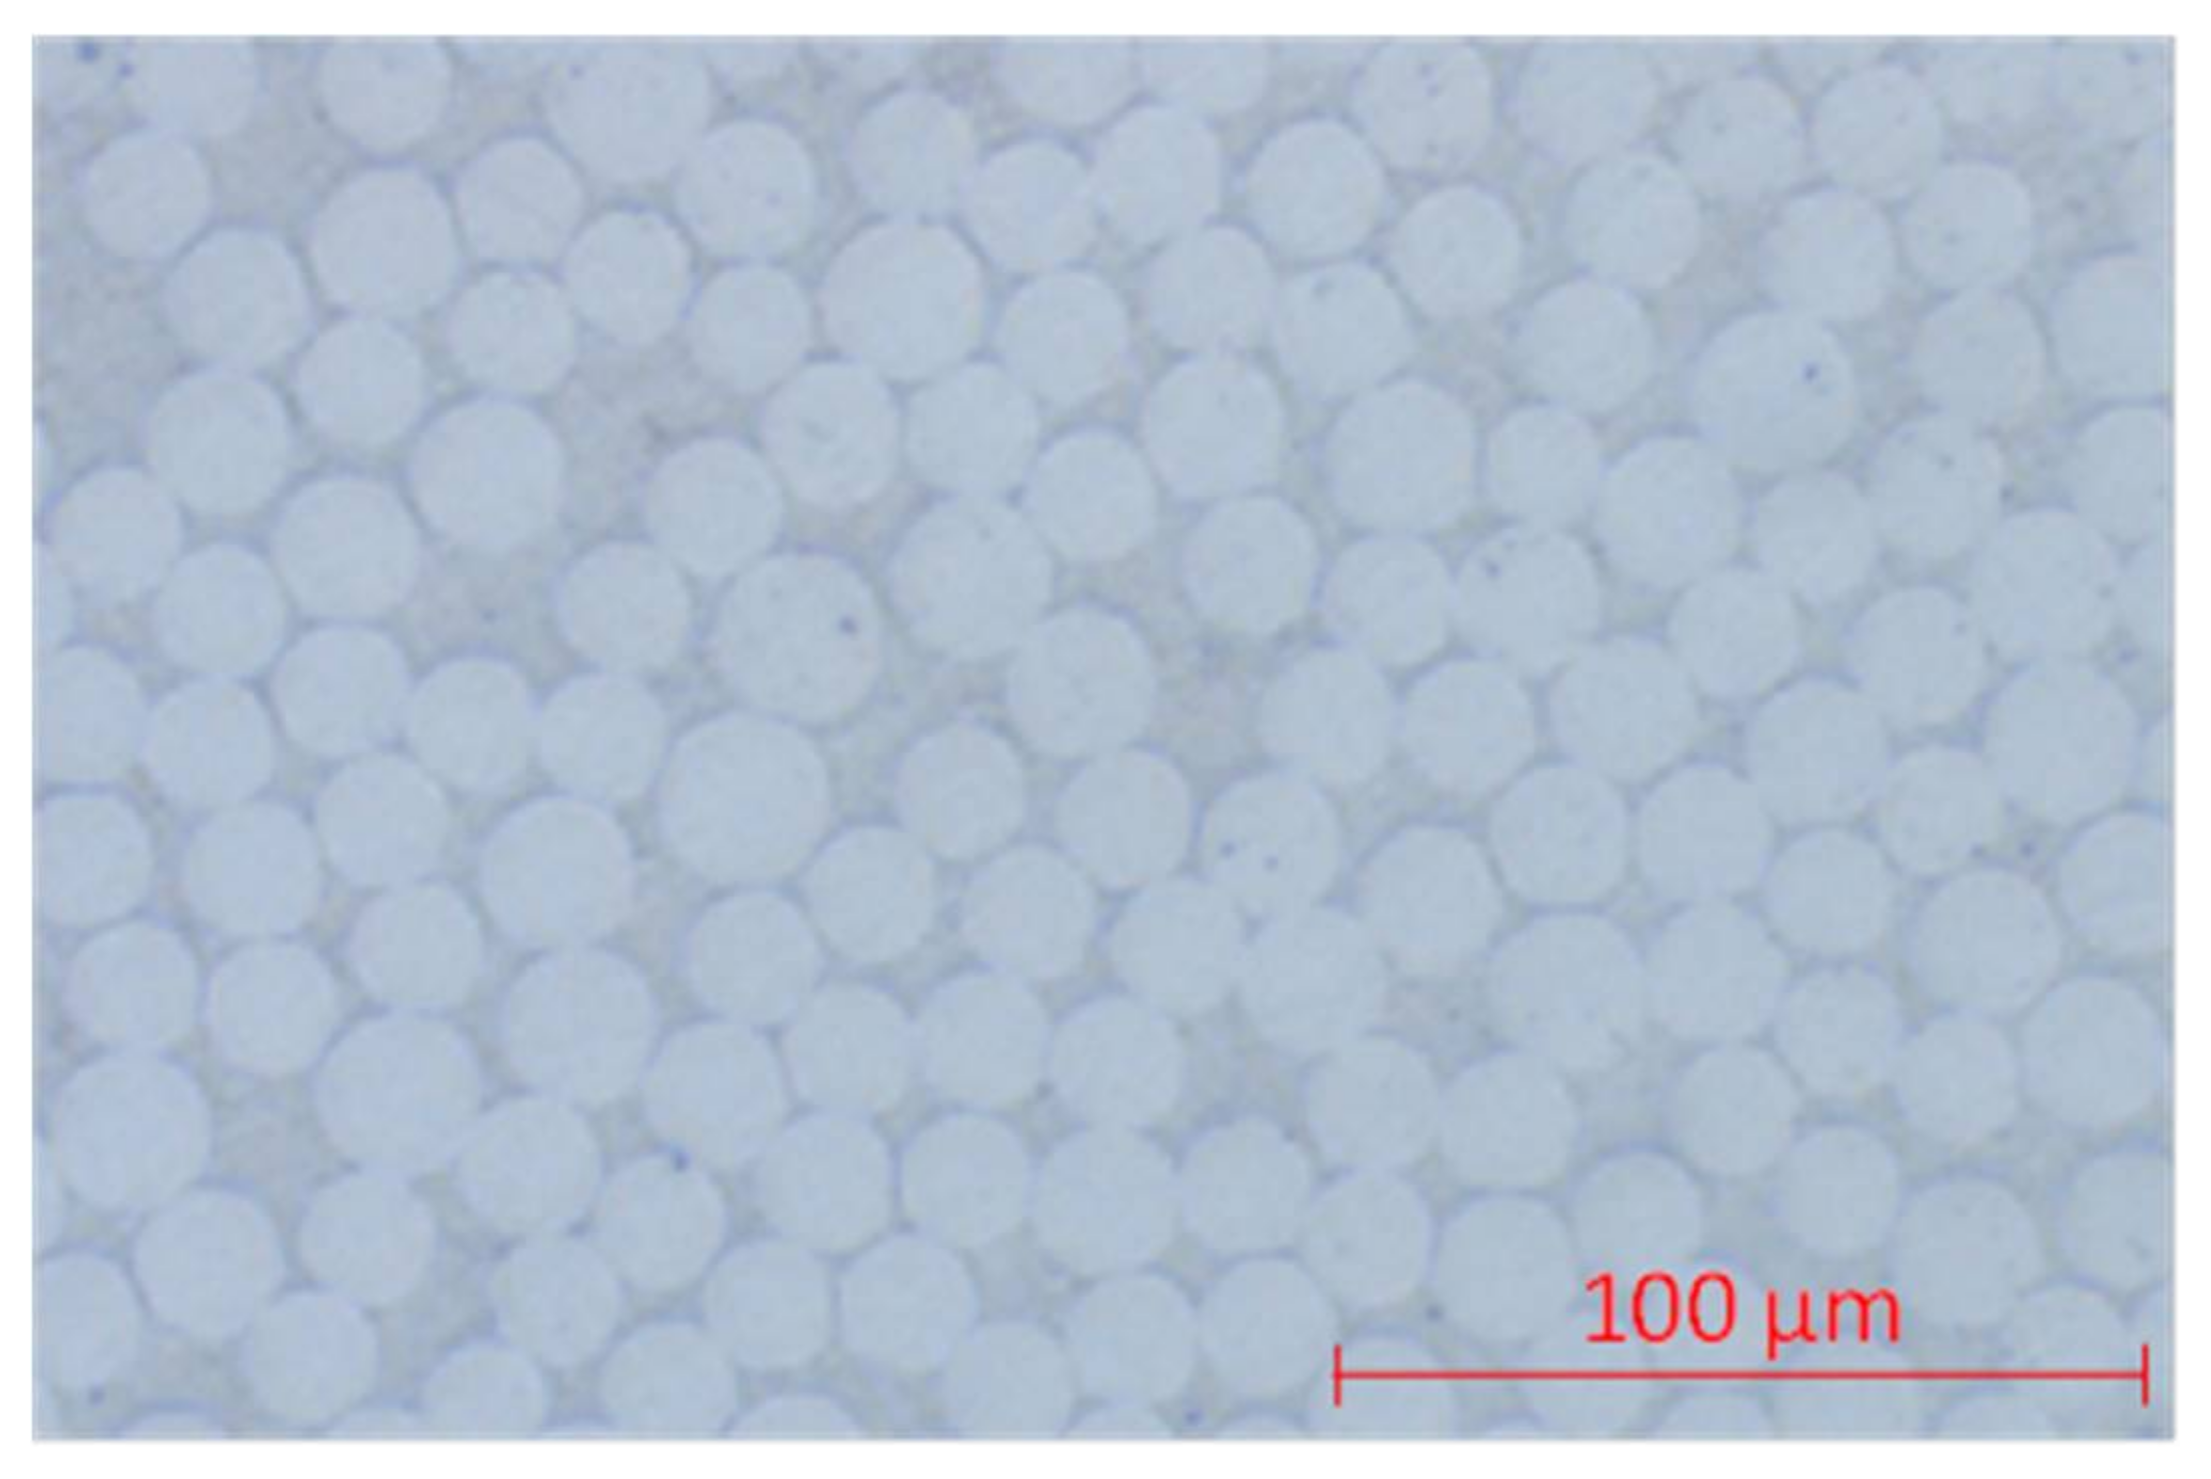
As an example, Figure 1 shows a surface cut in the perpendicular direction to the fibers, i.e., in the radial direction of the tube. It can be observed in the fairly homogeneous distribution of the fibers in the wall thickness, but also in the total absence of defects and damages of micrometric size (i.e., porosity, cracks, fiber/matrix debonding, etc.). As no fiber interlacing was put in evidence on micrographs, this material has been considered as a common unidirectional laminate thereafter.
The average diameter of the glass fibers and their volume fraction was determined by image analysis with the ImageJ software. They are about 15 µm and 60 vol %, respectively. It is noteworthy that this last value is quite consistent with the weight fraction of fibers of 80 wt % announced by the composite manufacturer. This satisfying agreement can be checked by simple calculation using the orders of magnitude of the densities of the glass fiber (≈2.6) and epoxy resin (≈1.2).
2.2. Oxygen Permeation
The oxygen transport properties across the wall thickness of the composite container were determined by oxygen permeation at 20, 30, and 45 °C in the total absence of humidity (0% RH). This technique consists of measuring the changes over time of the oxygen flow through a thin sample in order to deduce, from the resulting kinetic curve, the oxygen transport properties by applying the classical (Fick and Henry’s) laws of the gas theory [6]. In the present study, the sample is a unidirectional laminate disc of 100 mm diameter and 0.5 mm thick, which was taken within the tube wall by lathe machining.
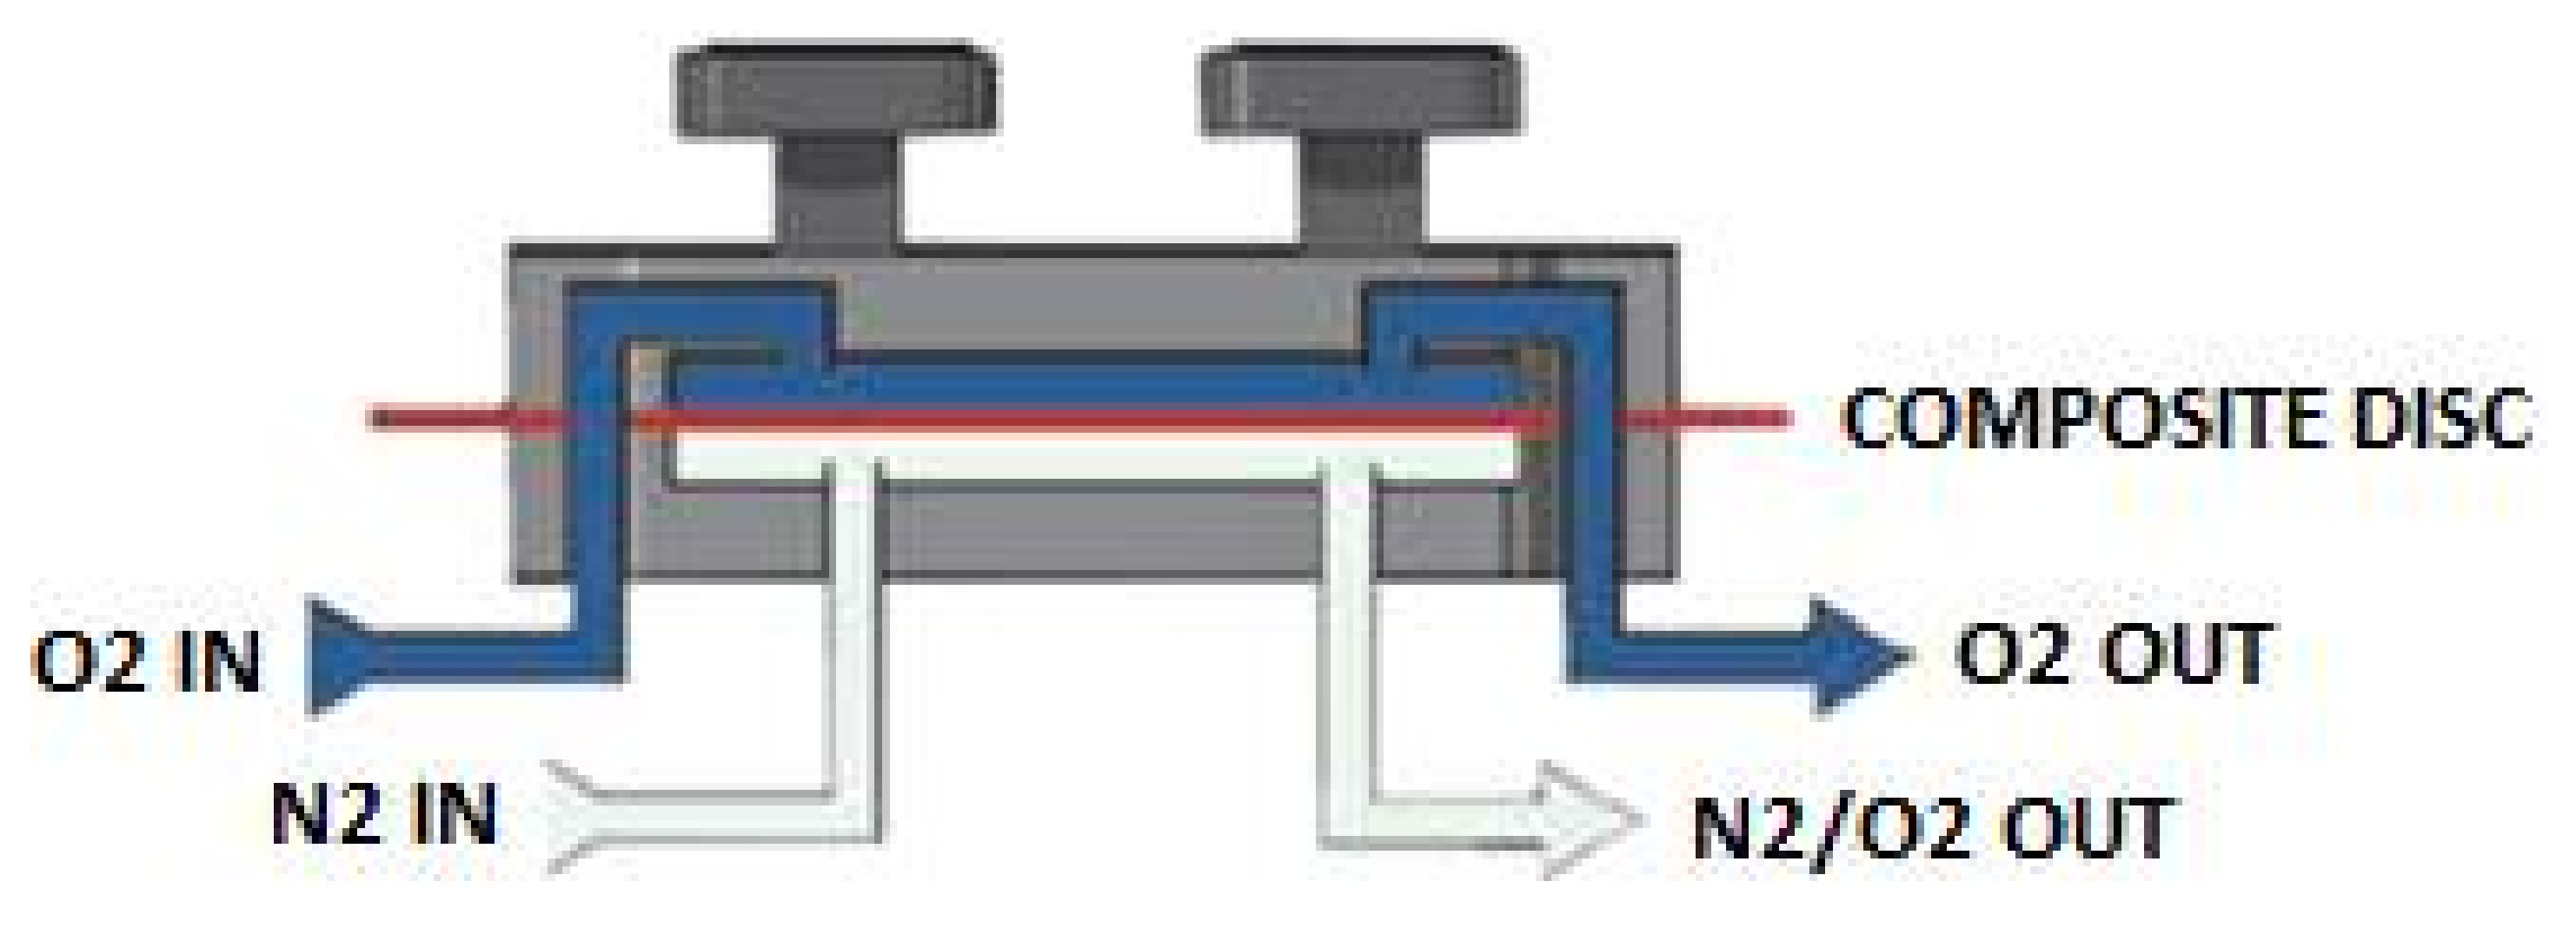
Very schematically, the composite disc is placed between the two compartments of a Systech 8001 permeameter. Firstly, a primary vacuum is obtained in both compartments by means of a common vane pump. This preliminary operation must be done carefully. It can last several weeks. It allows for the removal of all traces of oxygen in both compartments, but also the elimination of all the volatile compounds (in particular, sorbed water) that would have been released by the sample during the permeation experiment. Then, pure oxygen is introduced under a pressure ranged between 2 and 3 bars into the upper compartment, while the lower compartment is swept by an oxygen free carrier gas (in this case, pure nitrogen) under atmospheric pressure. The pressure difference induces an oxygen flow from the upper to lower compartment, i.e., through the composite disc (see Figure 2).
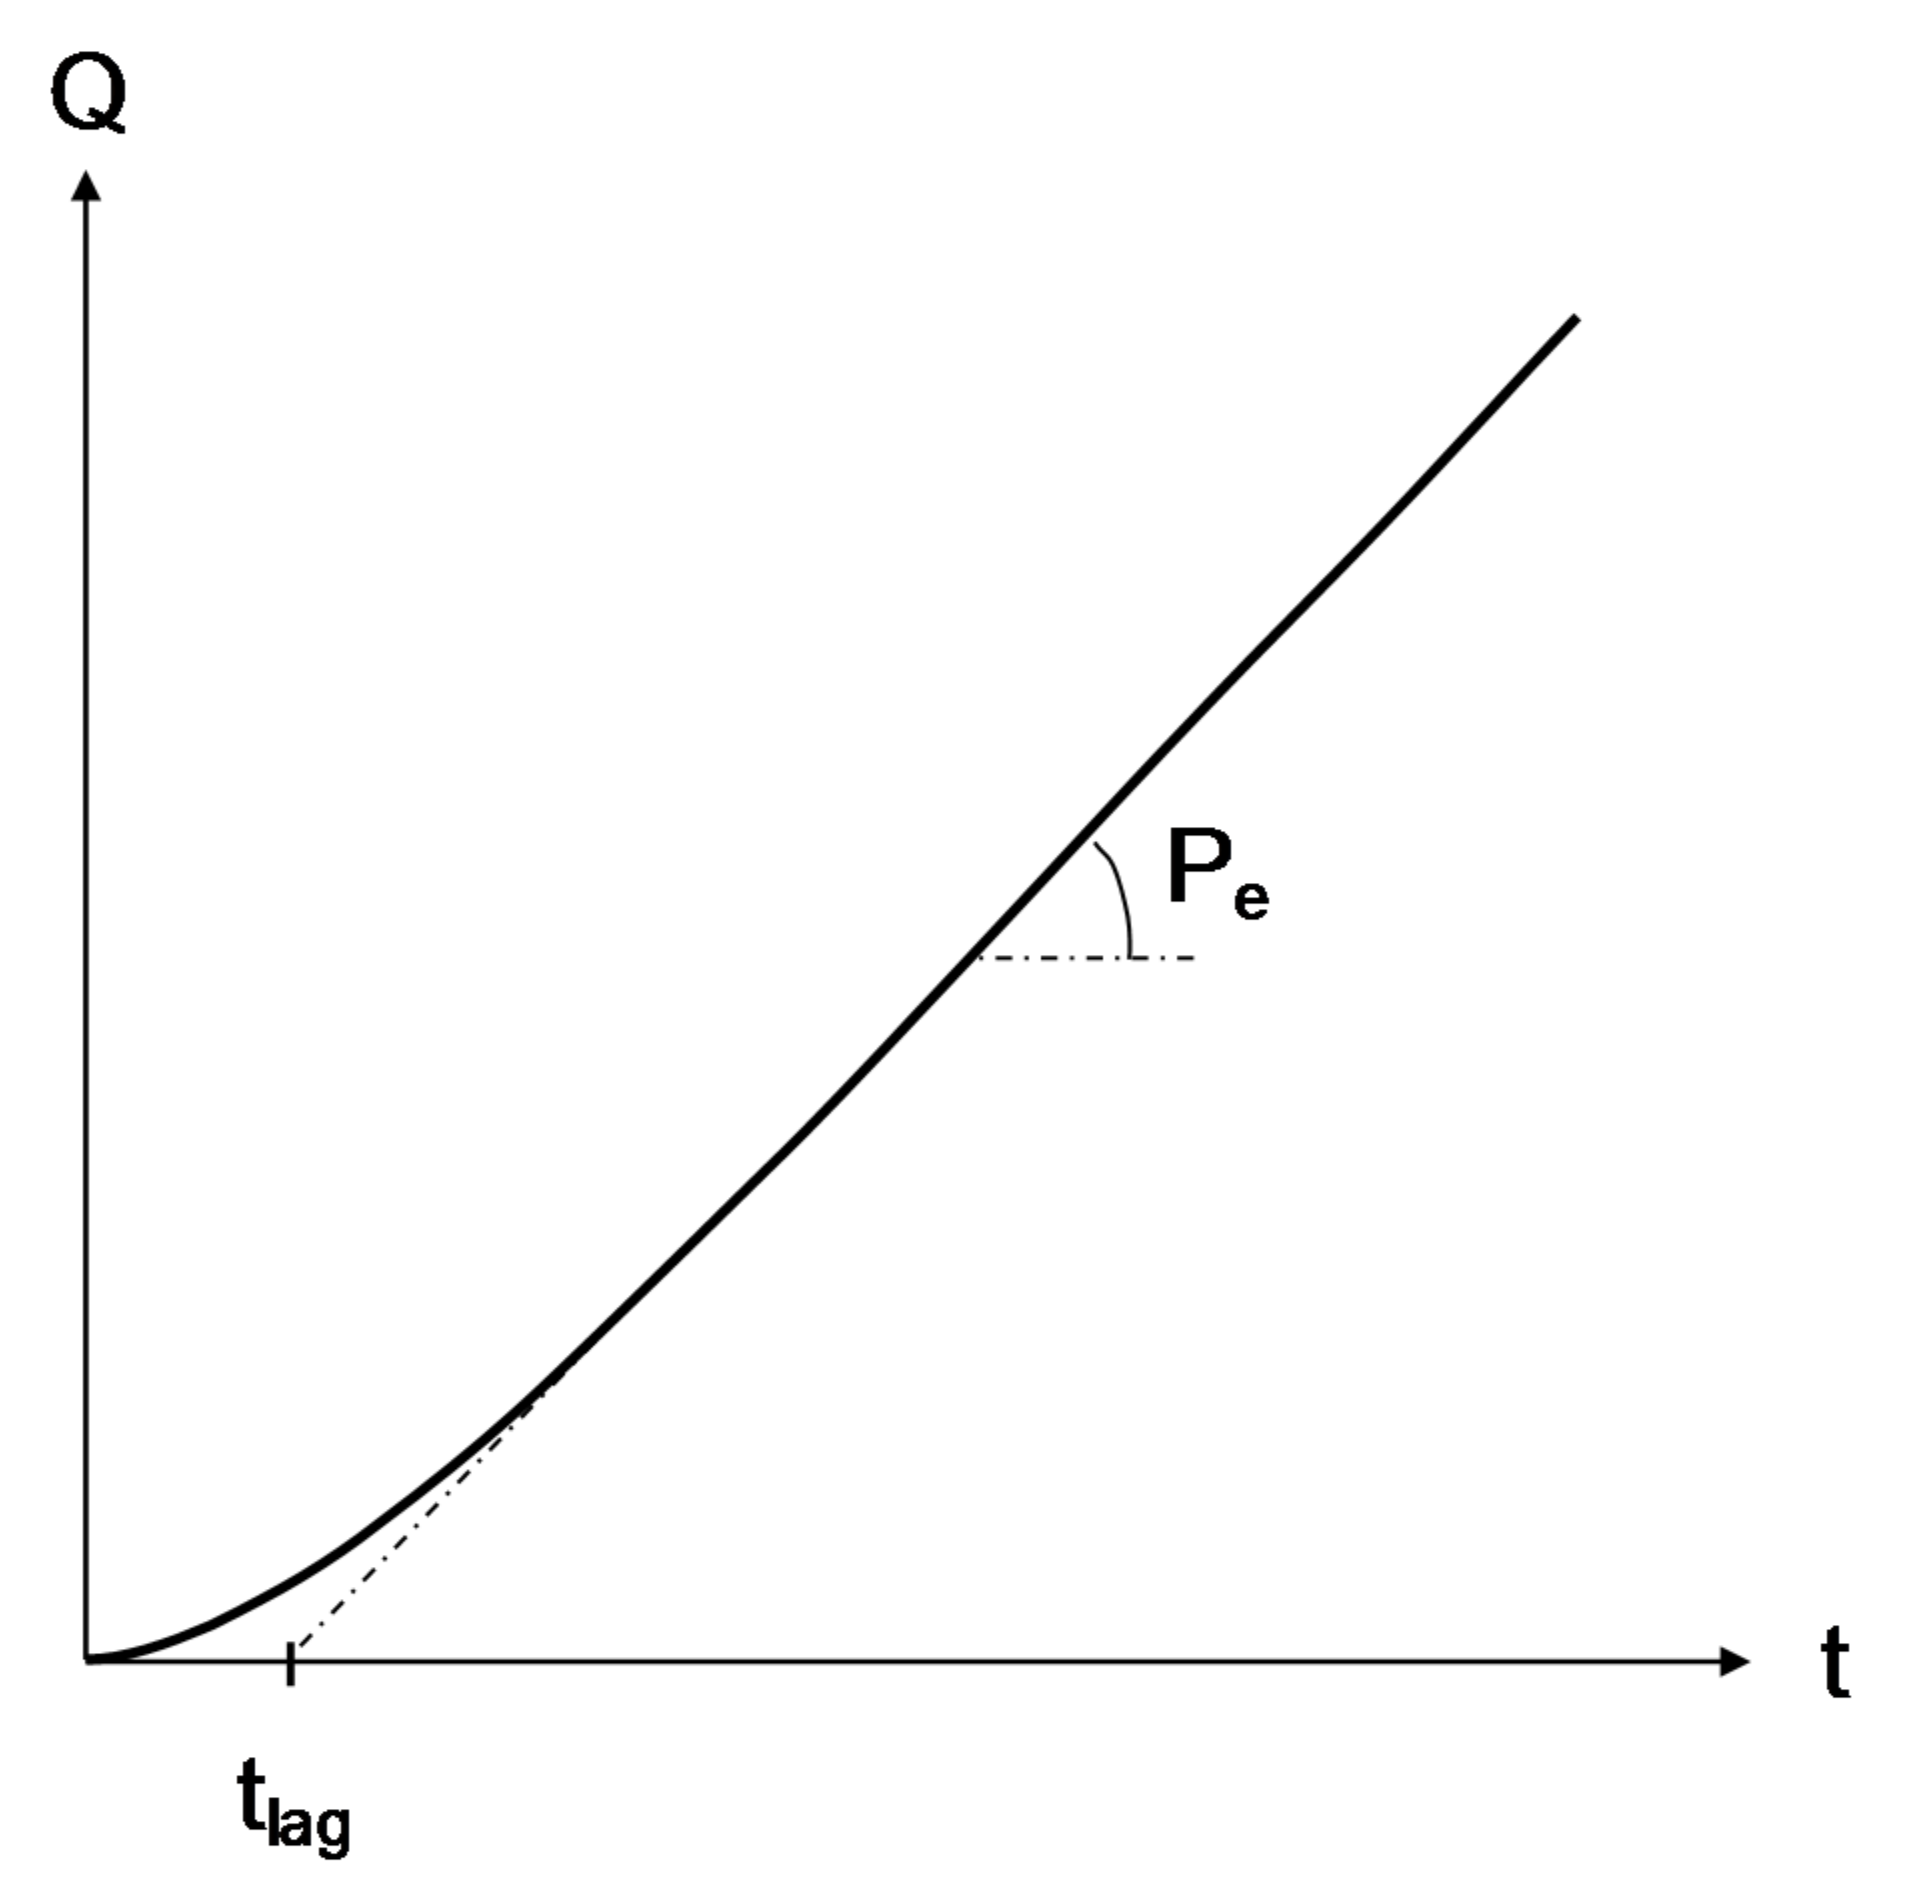
Indeed, two important kinetic quantities are determined graphically (Figure 3):
- The time lag (tlag) corresponds to the duration of the transient regime, i.e., the duration for the first oxygen molecules to completely cross the composite disc of thickness E. Thus, tlag is the characteristic time for oxygen diffusion. According to Barrer [7], it is inversely proportional to the coefficient of oxygen diffusion D:
- The permeability (Pe) corresponds to slope of the steady-state regime, i.e., of the linear part of the kinetic curve. Its general mathematical expression is
As D is known thanks to the first equation, the second equation can be used for deducing the value of the coefficient of oxygen solubility S.
2.3. Oxygen Transport Properties
The values of S and D determined experimentally at 20, 30, and 45 °C are summarized in Table 1. It is important to remember here that the experimental error in permeation is wide enough. It is of the order of 30% for both coefficients.
It can be seen that S and D vary little or erratically with temperature, and their values are located within the experimental error interval. Thus, in a first approach, it was assumed that they were totally independent of temperature. Their average value calculated for the whole temperature interval under investigation is also reported in Table 1.
The order of magnitude of S is in satisfying agreement with the values reported in the literature for an epoxy matrix crosslinked by an aromatic hardener. Indeed, for this matrix family, S is typically ranged between 9.0 × 10⁻⁵ [8] and 3.4 × 10⁻⁴ mol·m−3·Pa−1 [9].
In contrast, D is about two orders of magnitude higher than the values reported in the literature for this matrix family, for which D is typically ranged between 1.1 × 10⁻¹³ [8] and 3.0 × 10⁻¹³ mol·m−3·Pa−1 [9]. At first sight, this result could seem surprising, because it was expected that the presence of fibers, which are oriented in the perpendicular direction to the oxygen flow, increases the tortuosity of the diffusion paths and thus reduces the diffusivity in the composite material [10].
According to the literature [10,11,12], this behavior can be explained by the presence of physical discontinuities in the composite material such as defects and damages (porosity, matrix cracking, fiber/matrix debonding, etc.), and a fiber/matrix interphase considerably more permeable than the matrix. Thus, the diffusion coefficient is a more complex quantity, often designated as an “effective” quantity, that accounts for the ease with which oxygen molecules cross the composite thickness. Indeed, this coefficient does not just depend on the diffusivity in the matrix and the fiber fraction and orientation, but also on the extent of the physical discontinuities in the composite material.
Simplified homogenized models, based only on geometric considerations, were proposed for calculating the diffusion coefficient in the different principal directions of an unidirectional laminate if its value in the matrix and the volume fraction of fibers are known. According to Kondo et al. [13], the diffusivities in the perpendicular (D⊥) and parallel directions to the fibers (D//) would be related by the following relationship:
in which Vf is the volume fraction of fibers in the composite and α is a constant such as for a cubic stack and for an hexagonal stack of fibers [14].
In addition, in the parallel direction, it can be written [15]:
in which Dm is the coefficient of oxygen diffusion in the matrix.
More recently, Roy and Singh [16] showed that these models can be improved to take into account different types of physical discontinuities.
In this study, the impact of defects and damages can be excluded, because they were not evidenced by optical microscopy in Section 2.1. In contrast, the possibility of a highly permeable fiber/matrix interphase has to be considered with great attention. It presumably results from a lower crosslinking density of the epoxy resin at the close vicinity of the fiber surface. Indeed, let us recall that the oxygen diffusivity in crosslinked polymers is about 3 decades faster in rubber state than in glassy state [6]. To check this assumption, Equation (4) has been rewritten as follows:
in which Vm and Vi is the volume fraction of matrix and interphases in the composite, and Dm and Di is the coefficient of oxygen diffusion in the matrix and interphase respectively.
i.e.,
It can be deduced that oxygen molecules will be preferentially conveyed through the interphases if
Let us assume that: . Then, this inequality can be rewritten:
i.e.,
In other words, the interphases will play a key role in the diffusion process if they represent more than 0.1 vol % of the composite matrix.
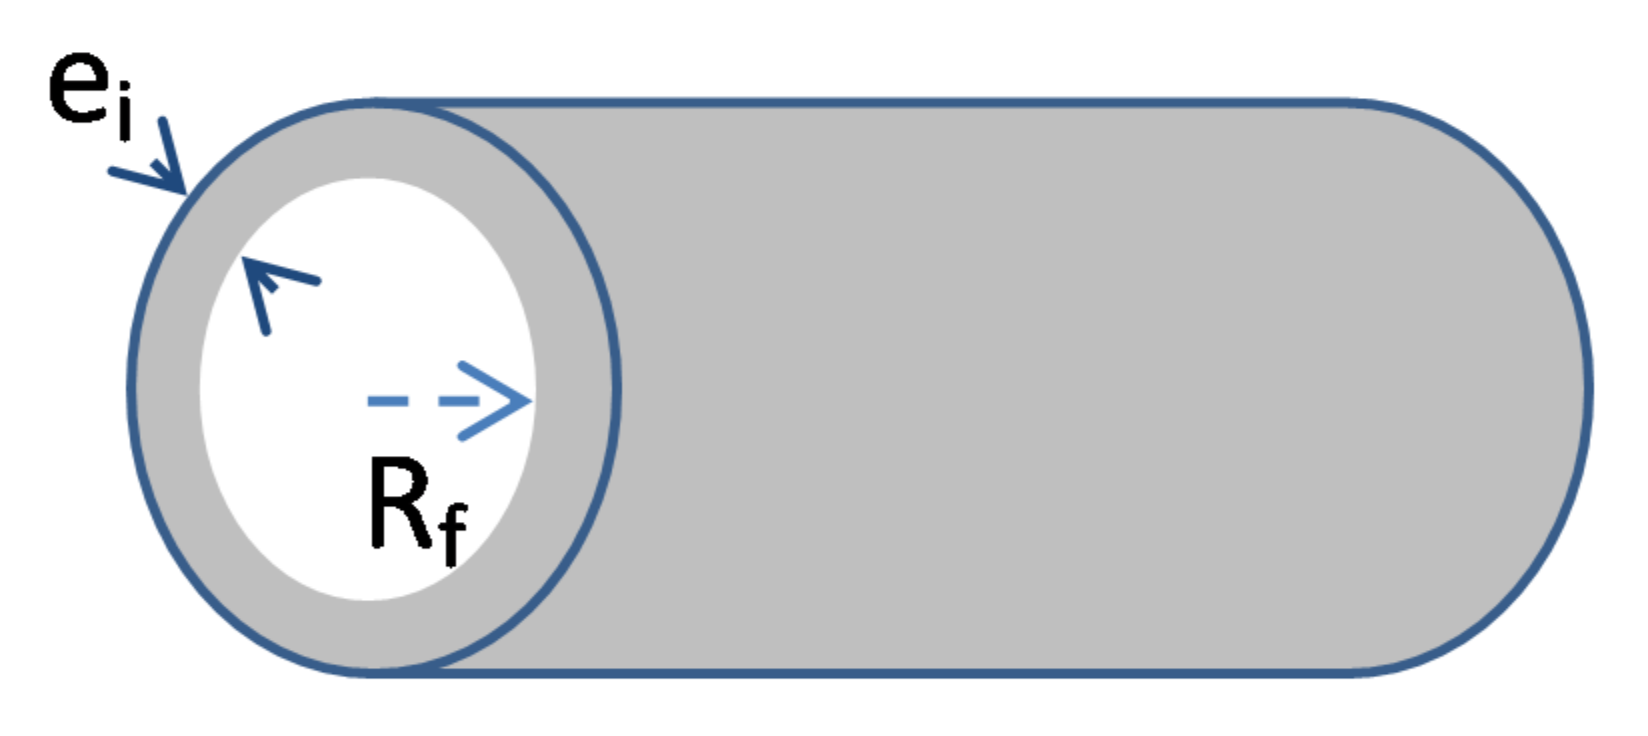
Now, let us consider an interphase of tubular shape around the fiber (Figure 4). Its wall thickness is noted ei and the fiber radius Rf. For a cubic stack of fibers, the volume fraction of interphases can be written:
i.e.,
The introduction of Equation (11) into Equation (9) leads finally to:
Let us recall that Rf = 15 µm and Vm ≈ 40%. The numerical application gives . In other words, the interphases will play a key role in the diffusion process if they present a minimal thickness of 4 nm, which is a quite realistic order of magnitude.
Of course, this assumption must be also checked experimentally, in particular by measuring a polished cross-section the glass transition temperature Tg near the fiber surface with a probe of nanometric size. Unfortunately, our laboratory is not equipped with this type of experiment for the moment. It is noteworthy that experiments at so low scale are very difficult to realize and interpret. That is the reason why they constitute a real challenge still today.
3. Kinetic Modeling
3.1. Theory
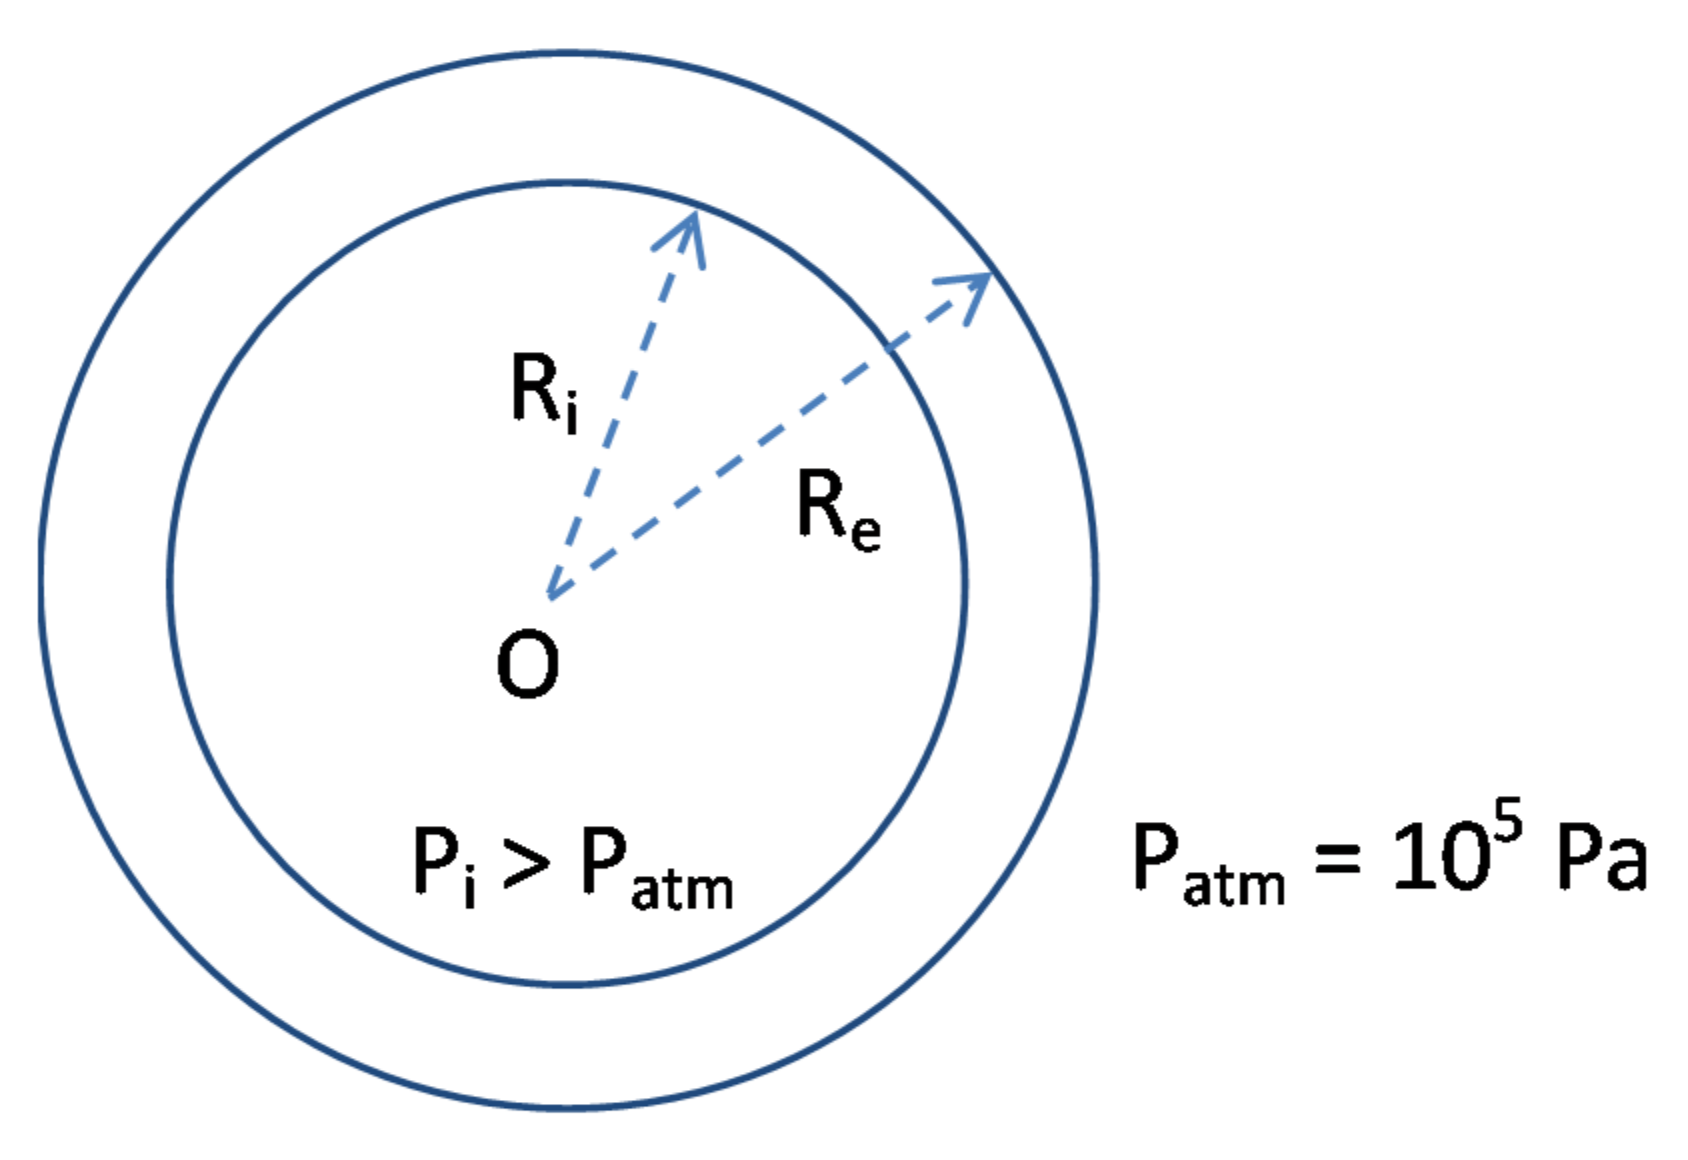
A radial cross-section of the composite container is schematized in Figure 5. Its inner and outer radii are, respectively, noted Ri and Re, and its length L. The container is filled with pure nitrogen under a pressure Pi slightly higher than the outer atmospheric pressure Patm.
Oxygen molecules cross (by diffusion) the composite wall, firstly through the outer surface in contact with ambient air and, finally, through the inner surface in contact with nitrogen. There is infinity of diffusion directions, but all these directions are radial. Therefore, for describing the oxygen transport through the composite wall, only one variable will be considered: the radial coordinate r. In this case, the molar flow of oxygen ϕ writes:
i.e.,
in which C is the oxygen concentration. Its values on the inner and outer surfaces of the tube are noted Ce and Ci, respectively.
The integration of this last equation along the entire wall leads to
Let us now write the mathematical expression of the oxygen balance within a volume element, which is located between two nested sub-tubes of respective radii r and r + dr and length L (see Figure 6):
in which S is the crossed surface. It comes:
then
i.e.,
then
i.e.,
The introduction of Equation (21) into Equation (15) leads to
then
then
finally
The expression of the oxygen debit is obtained by integrating the oxygen flow on the crossed surface S, i.e., on the surface perpendicular to the radial direction
in which θ is the angular coordinate and z is the longitudinal coordinate. It comes to
then
i.e.,
The oxygen concentration on the inner and outer surfaces of the tube is given by the classical Henry’s law [6], respectively:
and
in which PO2,i and PO2,atm are the partial pressures of oxygen inside and outside the composite container, respectively.
It is well known that the atmospheric pressure is Patm = 105 Pa, and air is composed of 21 mol% of oxygen. Thus, the application of the well-known Dalton’s law to Equation (31) gives
It is also known that the composite container is initially filled by pure nitrogen. Thus, at t = 0, Ci = 0. However, oxygen molecules will cross (by diffusion) the composite wall over time; thus, the molar fraction of oxygen will progressively increase inside the tube. Simultaneously, nitrogen molecules, initially contained inside the tube, will cross the composite wall in the opposite direction in order to leave the tube. Therefore, if the gas pressure is identical inside and outside the tube, i.e., if Pi = Patm, air is expected to be the final composition of gas inside the tube. In contrast, if the gas pressure is higher inside than outside the tube, i.e., if Pi > Patm, then the molar fraction of oxygen is expected to reach a final value lower than 21 mol%.
Thereafter, three simplifying assumptions have been made:
● The total number of moles of gas inside the tube remains constant throughout the storage duration of polymer-based compounds, i.e.,
In other words, there are as many moles of oxygen entering inside the tube as moles of nitrogen coming out of the tube. This assumption is valid if the gas pressure is almost the same inside and outside the tube, but also if the transport properties of nitrogen and oxygen in polymers are very close. Fortunately, these latter differ by no more than a factor 2 [6].
● Nitrogen and oxygen obey the theory of perfect gases, i.e.,
in which V is the volume of gas inside the tube, R = 8.314 J·mol−1·K−1 is the universal constant for perfect gases, and T is the absolute temperature (expressed in K).
● The slight overpressure of gas inside the tube is maintained at its initial value throughout the storage duration of polymer-based compounds, i.e.,
with β a coefficient greater than unity, but not so much higher. Typically, β is ranged between 1.1 and 1.4.
Taking into account these three assumptions, Equation (30) can be rewritten:
i.e.,
Therefore, Equation (29) can be rewritten:
i.e.,
then
then
i.e.,
then
i.e.,
This last equation gives access to the number of oxygen moles entering at any time t inside the composite container depending on the environmental conditions. The resulting mathematical expressions of the oxygen concentration C and molar fraction of oxygen xO2 inside the composite container are, respectively,
and
i.e.,
Thus, according to this model, C will be totally independent of the gas pressure inside the composite container, unlike xO2. In addition, as the coefficients of oxygen solubility S and diffusion D are almost independent of the temperature (see Section 3.1), C and xO2 will vary much less than expected with temperature.
3.2. Prediction of the Oxygen Permeability
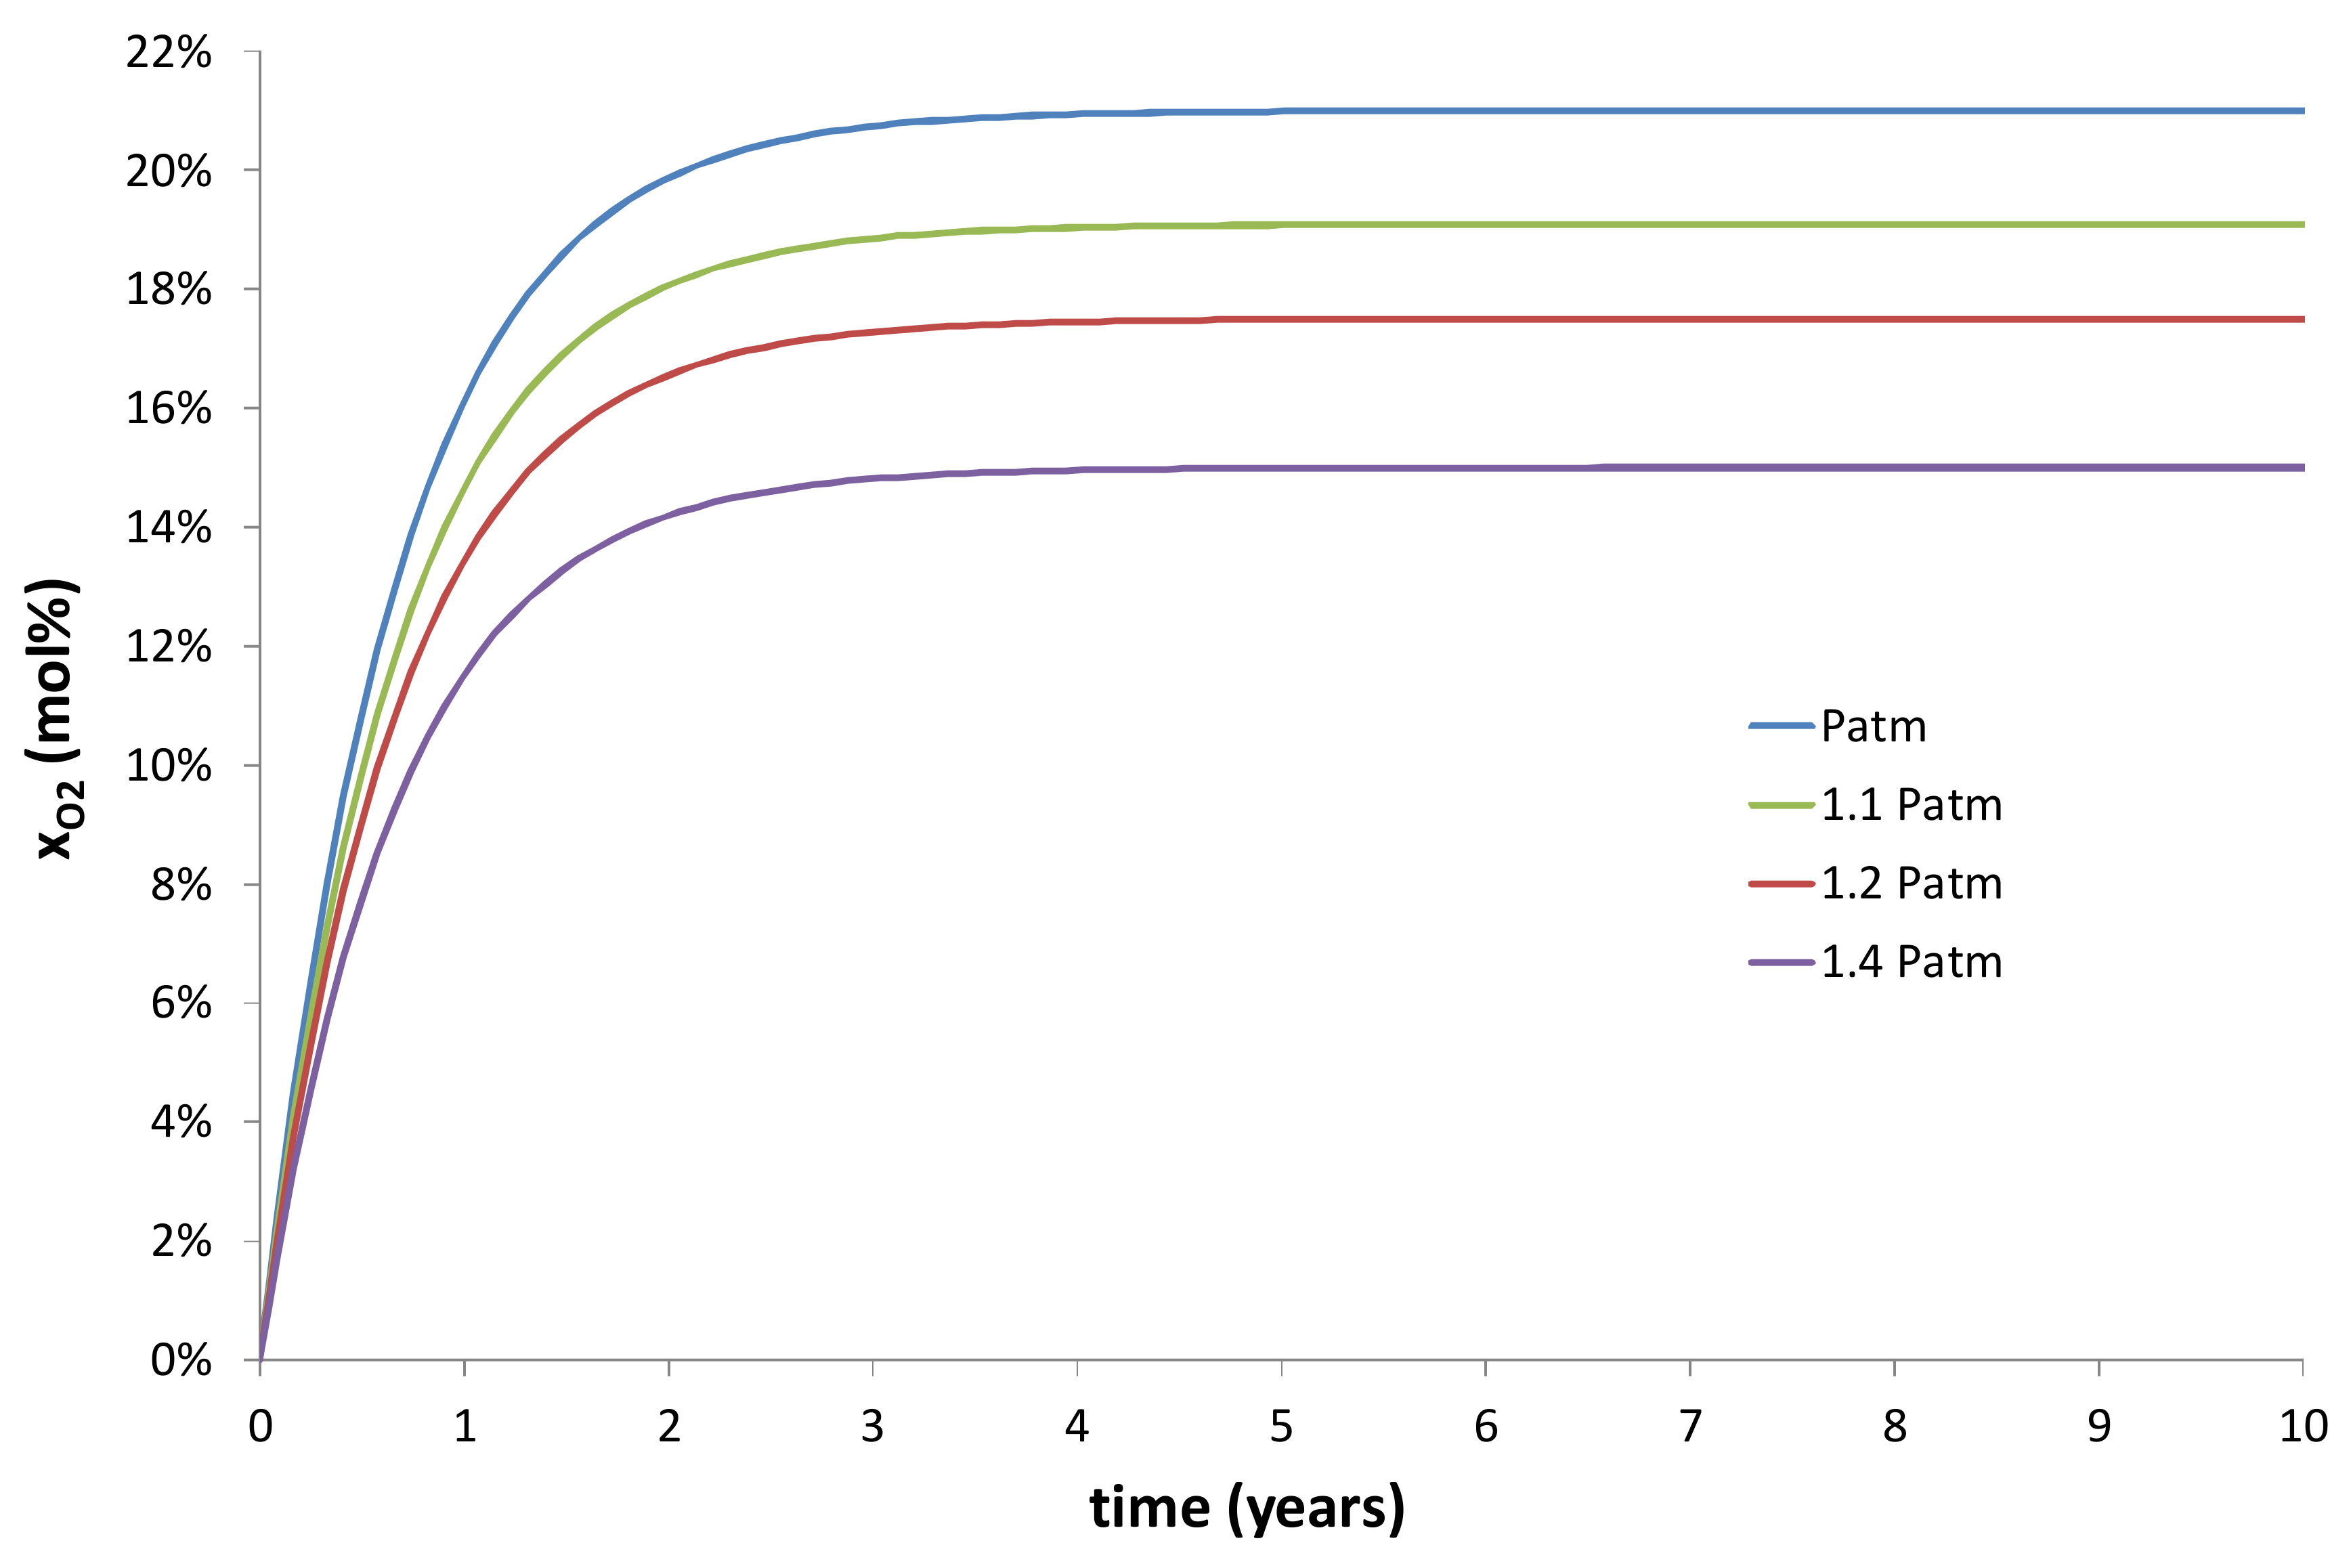
Let us remember that the composite container under study has approximately the following sizes: Ri = 54 cm, Re = 57 cm, and L = 7 m. Figure 7 reports the changes in molar fraction of oxygen xO2 at 25 °C for different inner pressures of gas, typically for Pi = Patm, 1.1 × Patm, 1.2 × Patm, and 1.4 × Patm. The resulting kinetic curves are mainly distinguished by their final saturation value. As expected, air (i.e., 21 mol% of oxygen) is the final composition of gas inside the composite container when Pi = Patm. Moreover, the maximum value of xO2 decreases slowly when Pi increases. Typically, xO2 reaches a maximum value of 19 mol% when Pi = 1.1 × Patm, 17 mol% when Pi = 1.2 × Patm, and 15 mol% when Pi = 1.4 × Patm.
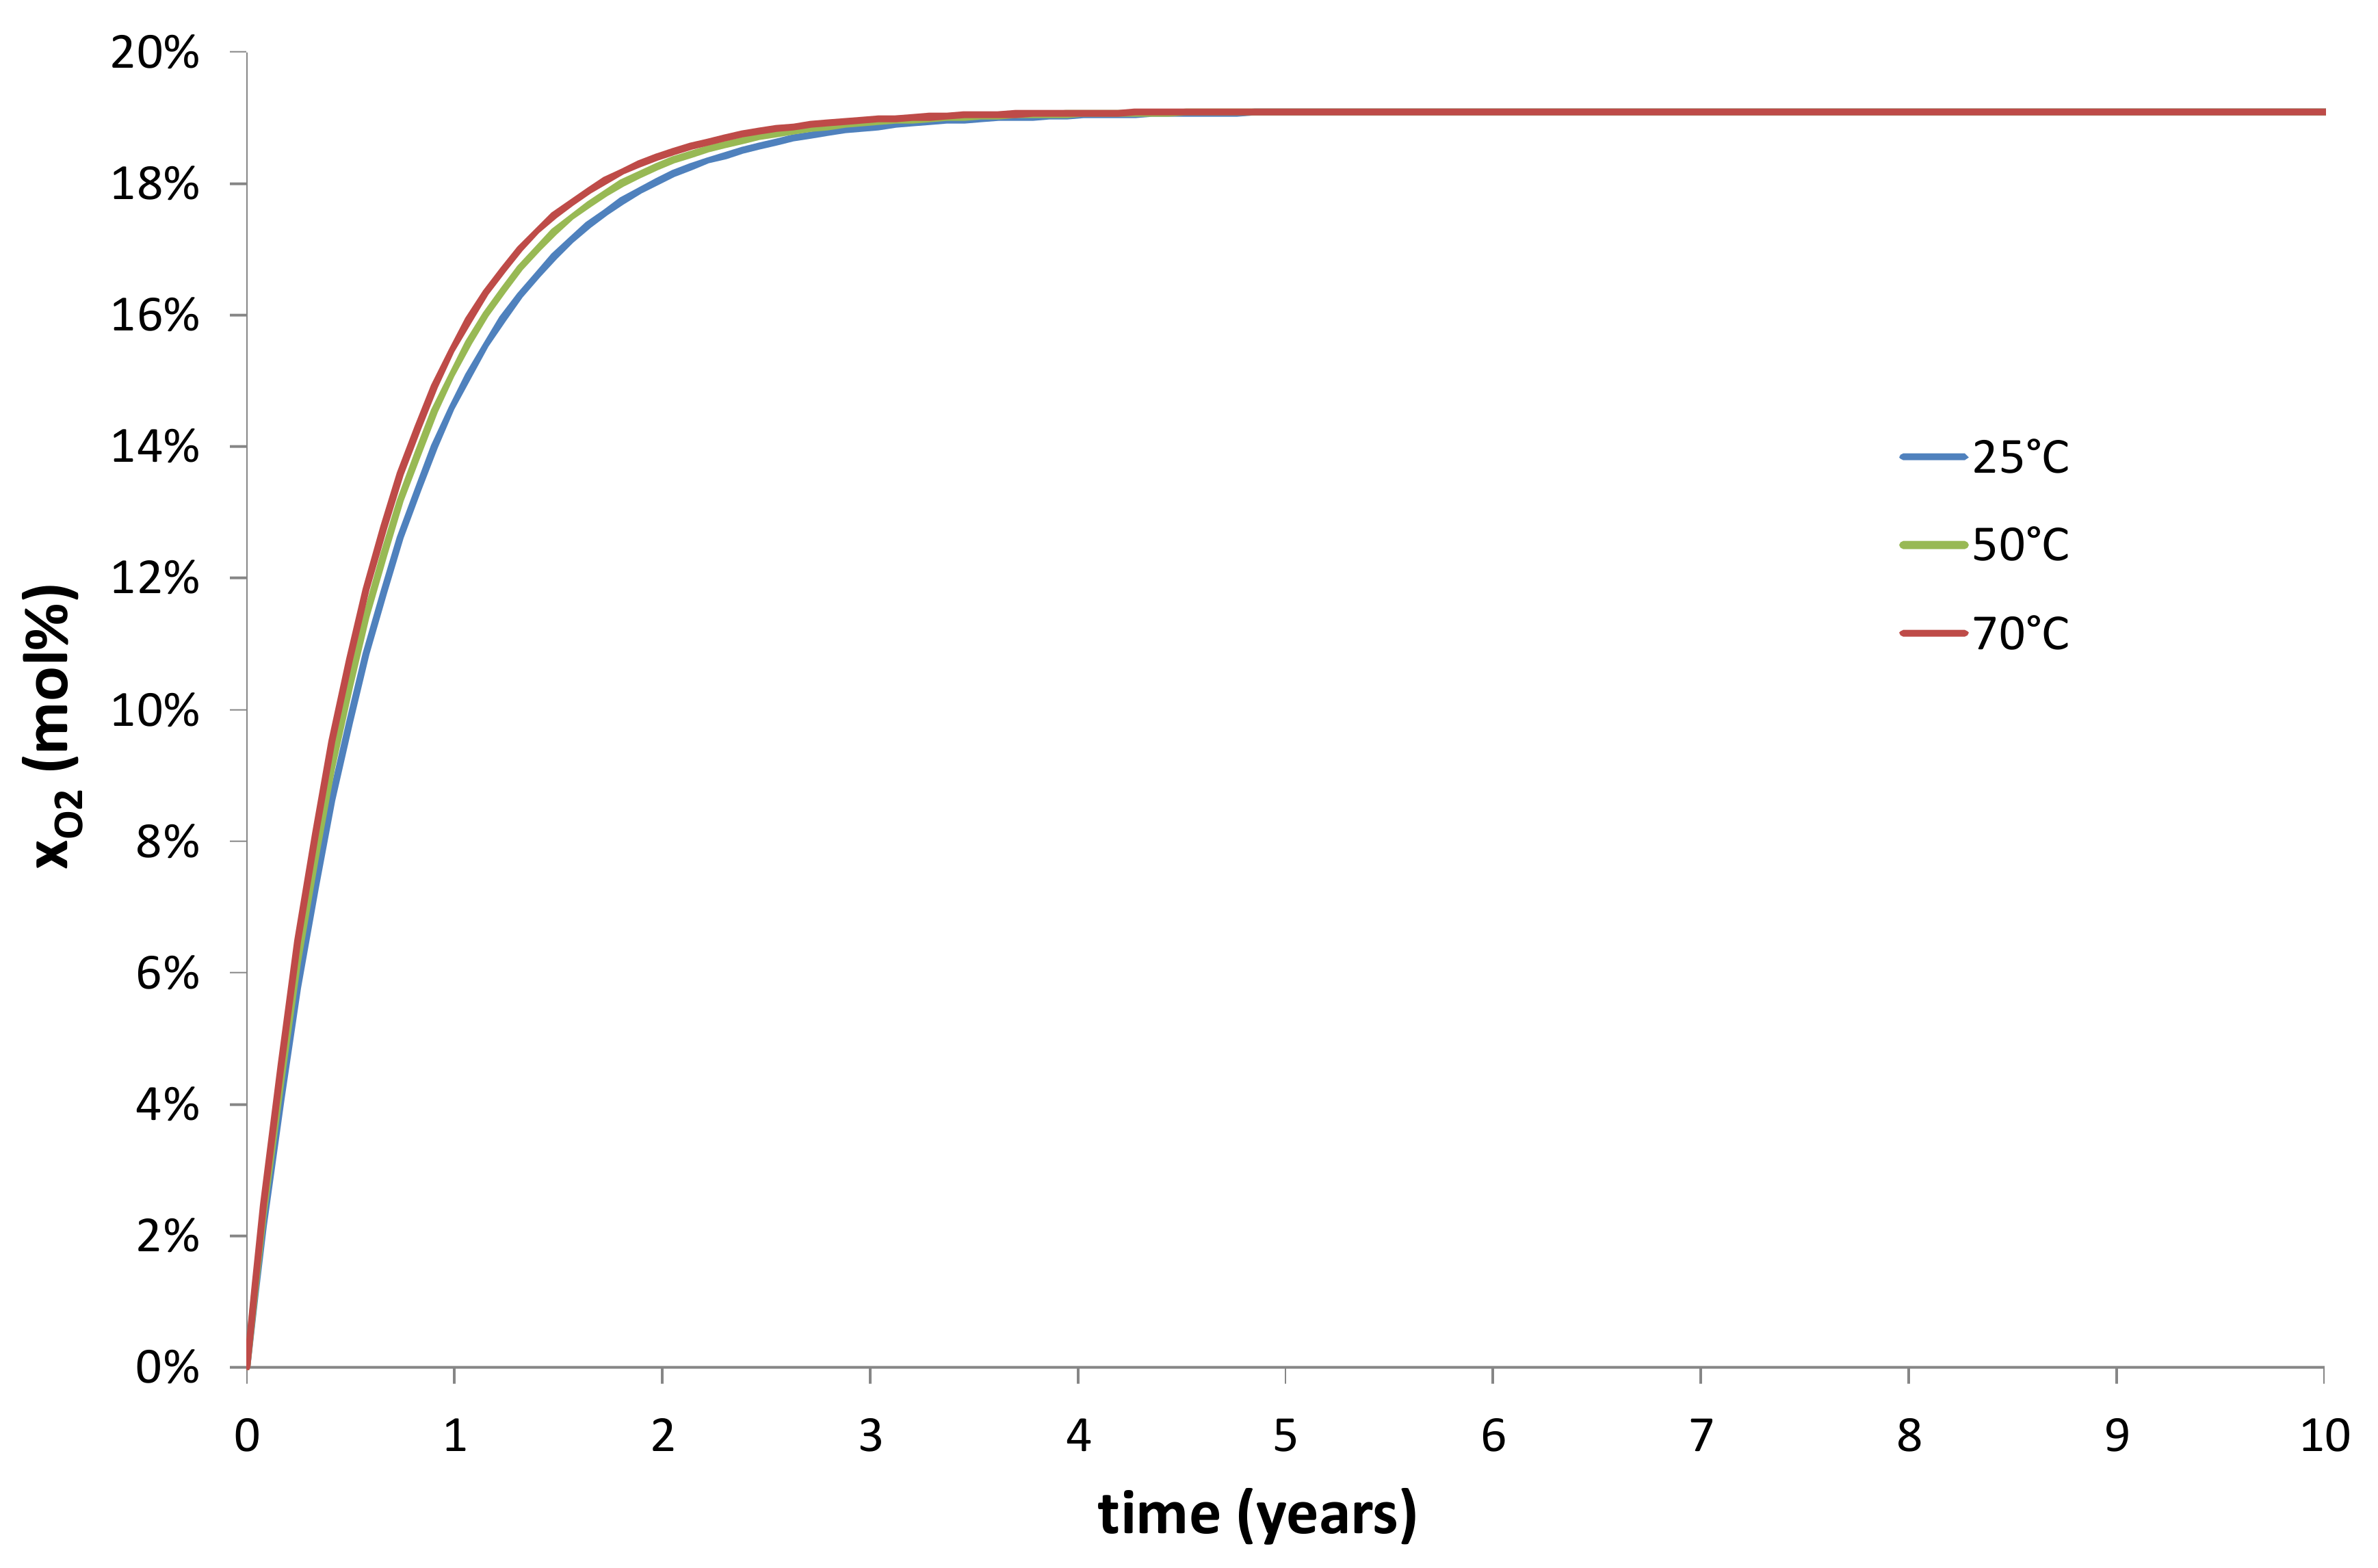
Figure 8 and Figure 9, respectively, report the changes in C and xO2 at 25, 50, and 70 °C for an inner pressure of gas of Pi = 1.1 × Patm. As expected (see Equations (45) and (47)), only C depends on temperature. The different kinetic curves of C mainly distinguish by their final saturation value, which decreases when T increases. Typically, C reaches a maximum value of 8.6 mol·m−3 at 25 °C, 7.9 mol·m−3 at 50 °C, and 7.5 mol·m−3 at 70 °C. In contrast, xO2 reaches a maximum value of 19 mol% whatever the temperature.
Oxygen molecules rapidly cross the composite wall whatever the scenario that is considered. Indeed, the maximum values of C and xO2 are reached after only 3–4 years whatever the inner gas pressure and temperature. This time is largely lower than the minimum duration imposed by the specifications for the composite container, typically 10 years.
Different solutions can be proposed to tentatively increase this time:
- A reduction of the coefficient of oxygen diffusion across the composite wall thanks to a careful selection of the different constituents (i.e., the fibrous structure and matrix) of the composite material. In particular, the use of a denser fibrous architecture with fibers oriented in several directions (i.e., fabric, braid, or knit) would allow for a significant increase of the fiber fraction and the tortuosity of diffusion paths.
- A reduction of the coefficient of oxygen diffusion thanks to a better control of the processing conditions of the composite material to guarantee minimum ratios of defects and damages (porosity, matrix cracking, fiber/matrix debonding, etc.) and a higher crosslinking density of the epoxy resin in the fiber/matrix interphase.
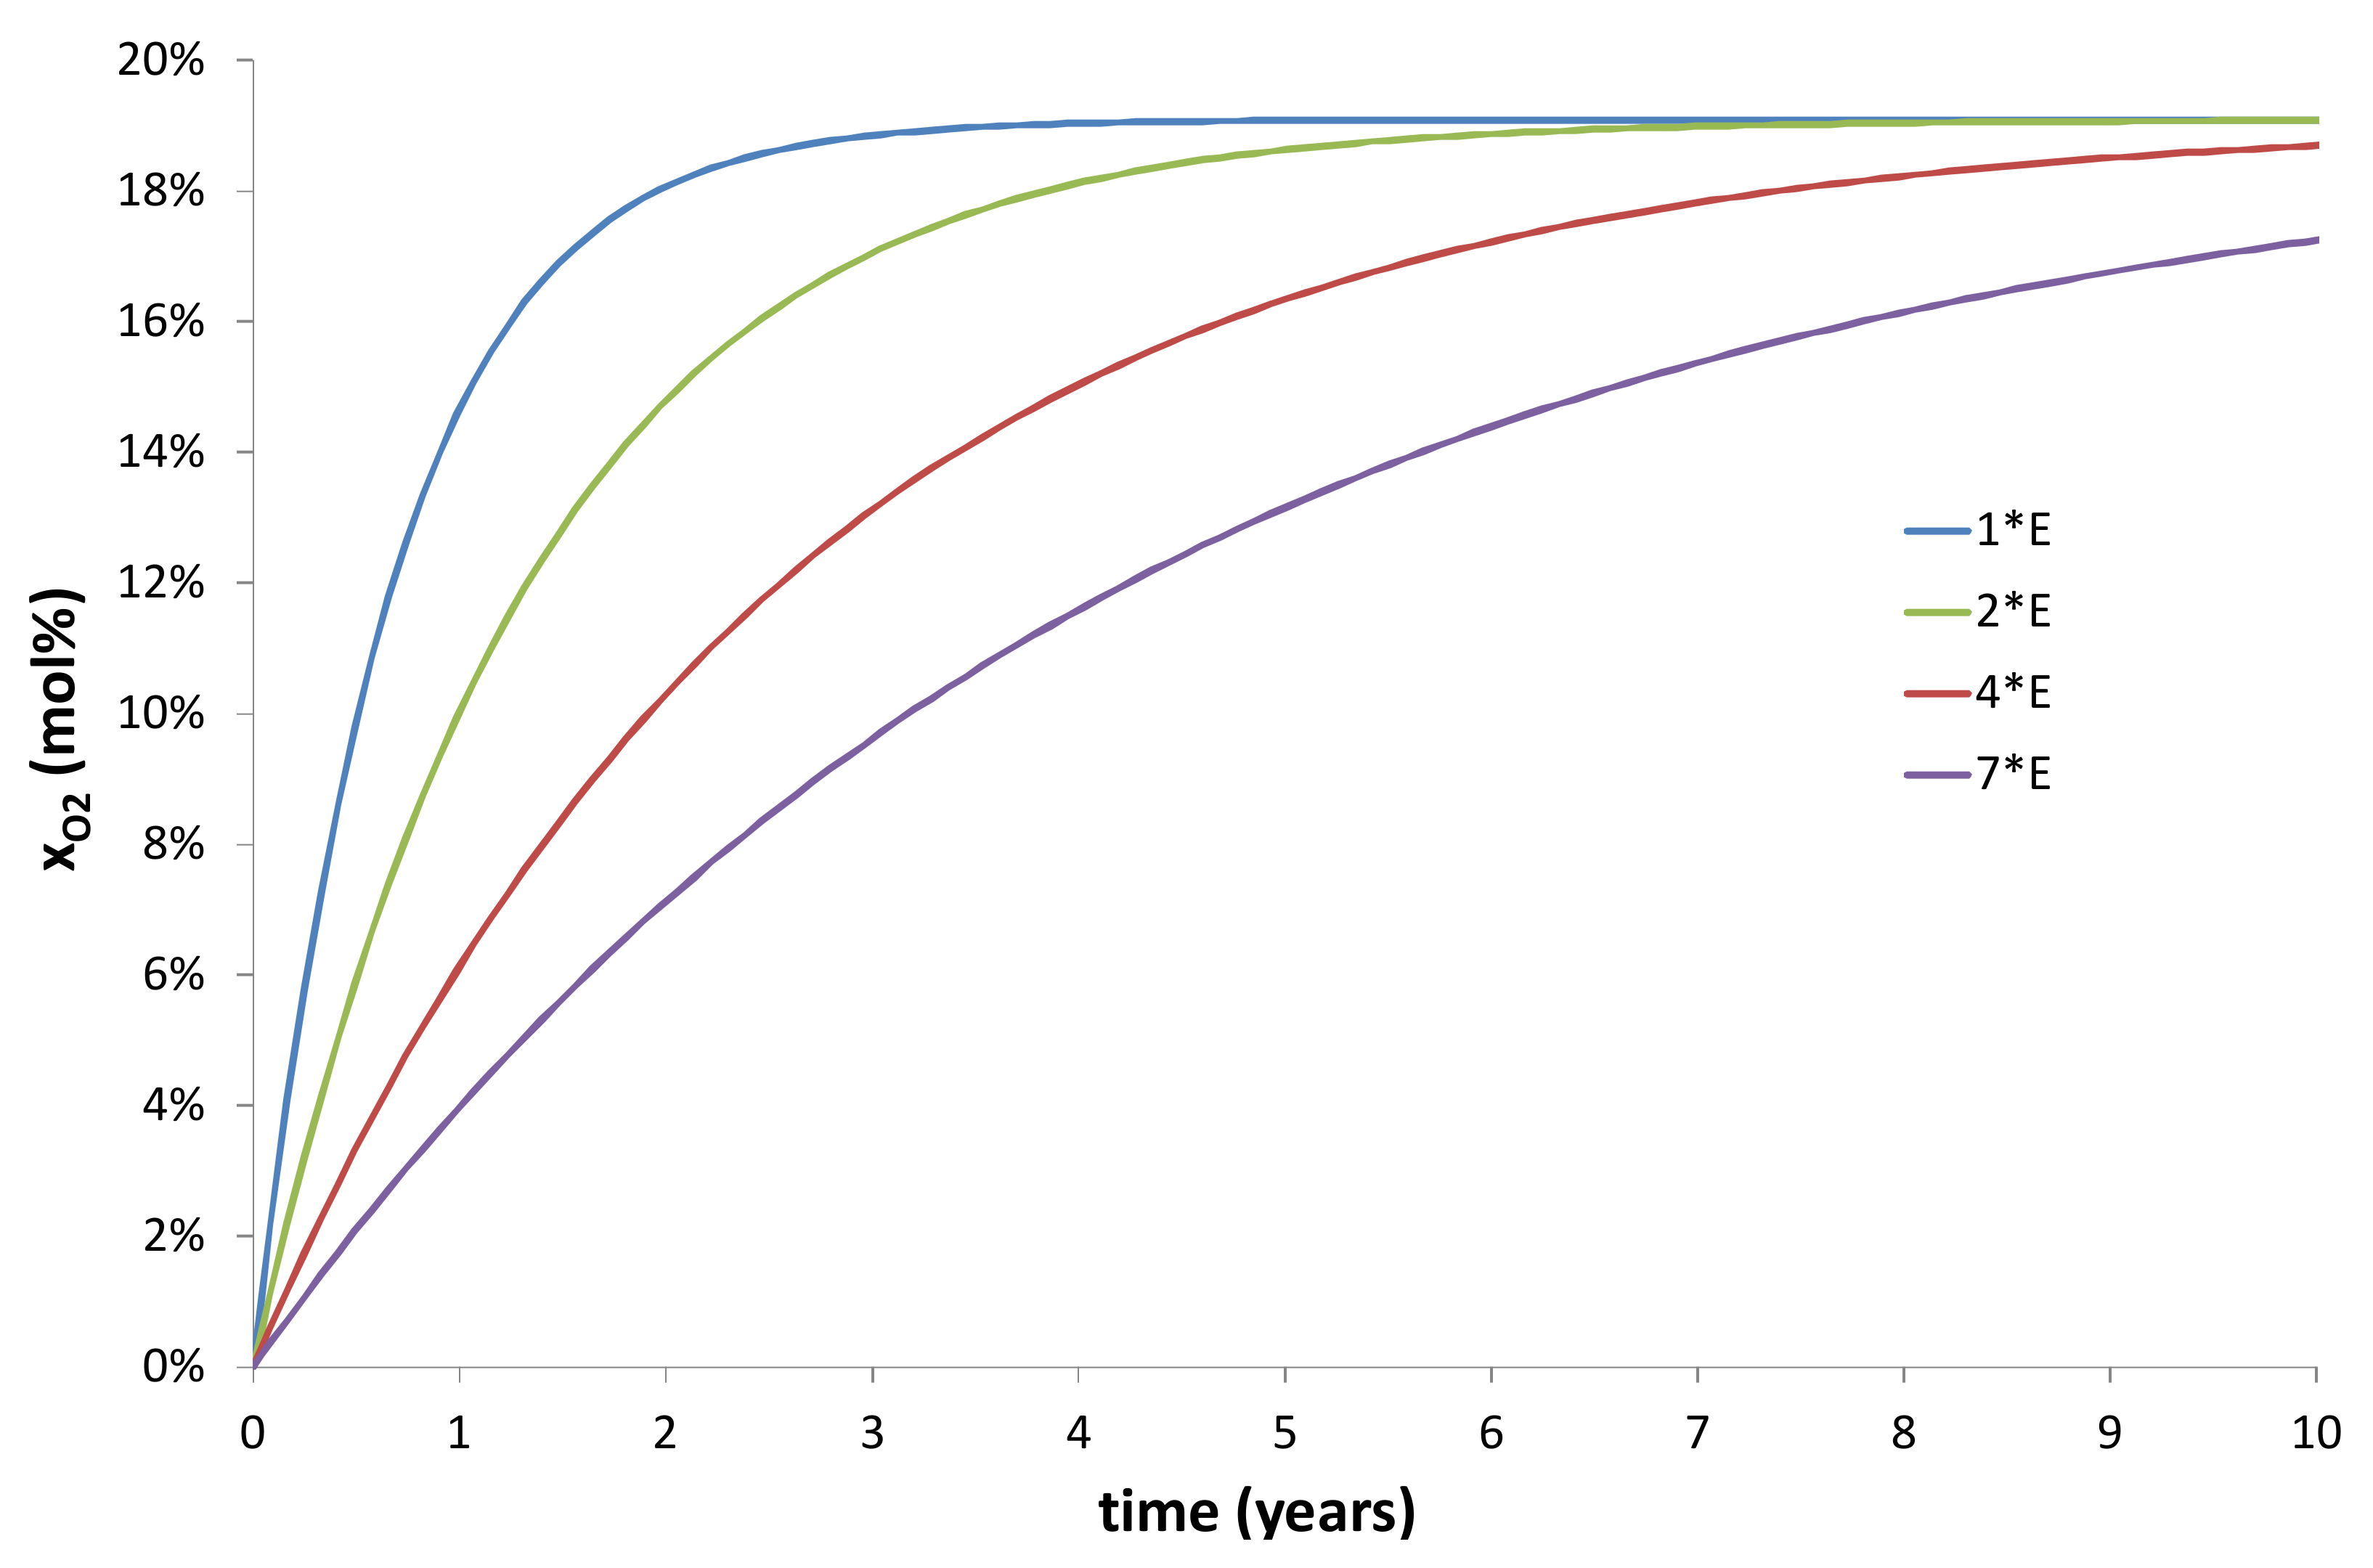
- An increase of the wall thickness of the composite container E = Re − Ri. In the present study, E was approximately fixed at 3 cm. However, this thickness can be progressively increased in order to extend the duration of the transient regime of the kinetic curves, as evidenced in Figure 10 and Figure 11.
- The use of an impermeable coating is certainly another possibility to reach this goal.
4. Conclusions
The main results of this study can be summarized as follows. On one hand, oxygen permeation tests have assessed the permeability to oxygen of the composite material under study. The high value is presumably due to the low crosslinking density of the epoxy resin in the fiber/matrix interphase. On the other hand, a kinetic model has been derived from the classical (Fick and Henry’s) laws of the gas theory. It appears clearly that oxygen molecules will quickly cross the composite wall to progressively modify the gas composition inside the container. Contrary to what was believed until now, the initial composition and pressure of the gas atmosphere inside the container only impact the molar fraction of oxygen xO2, but this effect is relatively limited (Figure 7).
Thenceforth, several solutions have been proposed to tentatively reduce the oxygen permeability, for instance: a careful selection of the different constituents (i.e., the fibrous architecture and matrix) of the composite material, the use of a denser fibrous architecture (i.e., fabric, braid or knit) to significantly increase the fiber fraction and the tortuosity of diffusion paths, a better control of the processing conditions to guarantee minimum ratios of defects and damages but also a higher crosslinking density of the epoxy resin in the interphase, an increase of the wall thickness of the composite container, the use of an impermeable coating, etc.
Author Contributions
Virginie Defauchy performed the experiments; Virginie Defauchy and Xavier Colin analyzed the data; Xavier Colin developed the kinetic model and performed the simulations; all authors wrote the paper.
Conflicts of Interest
The authors declare no conflict of interest.
References
- Colin, X.; Fayolle, B.; Audouin, L.; Verdu, J. The classical kinetic model for radical chain oxidation of hydrocarbon substrates initiated by bimolecular hydroperoxide decomposition. Int. J. Chem. Kinent. 2006, 38, 666–676. [Google Scholar] [CrossRef]
- François-Heude, A.; Richaud, E.; Desnoux, E.; Colin, X. A general kinetic model for the photothermal oxidation of polypropylene. J. Photochem. Photobiol. 2015, A296, 48–65. [Google Scholar] [CrossRef] [Green Version]
- Colin, X.; Monchy-Leroy, C.; Audouin, L.; Verdu, J. Lifetime prediction of polyethylene in nuclear plants. Nucl. Instrum. Methods Phys. Res. 2007, B265, 251–255. [Google Scholar] [CrossRef]
- Colin, X.; Audouin, L.; Verdu, J.; Rozental-Evesque, M.; Rabaud, B.; Martin, F.; Bourgine, F. Aging of polyethylene pipes transporting drinking water disinfected by chlorine dioxide. I. Chemical aspects. Polym. Eng. Sci. 2009, 49, 1429–1437. [Google Scholar] [CrossRef]
- Mikdam, A.; Colin, X.; Minard, G.; Billon, N.; Maurin, R. A kinetic model for predicting the oxidative degradation of additive free polyethylene in bleach desinfected water. Polym. Degrad. Stab. 2017, 146, 78–94. [Google Scholar] [CrossRef]
- Van Krevelen, D.W.; Hoftyser, P.J. Properties of Polymers. Their Estimation and Correlation with Chemical Structure. Their Numerical Estimation and Prediction from Additive Group Contributions, 4th ed.; Elsevier: Amsterdam, The Netherlands, 2009; pp. 656–681. [Google Scholar]
- Barrer, R.M.; Rideal, E.K. Permeation, diffusion and solution of gases in organic polymers. Trans. Faraday Soc. 1939, 35, 628–643. [Google Scholar] [CrossRef]
- Damian, C.; Espuche, E.; Escoubes, M. Influence of three ageing types (thermal oxidation, radiochemical and hydrolytic ageing) on the structure and gas transport properties of epoxy-amine networks. Polym. Degrad. Stab. 2001, 72, 447–458. [Google Scholar] [CrossRef]
- Colin, X.; Marais, C.; Verdu, J. A new method for predicting the thermal oxidation of thermoset matrices: Application to an amine crosslinked epoxy. Polym. Test. 2001, 20, 795–803. [Google Scholar] [CrossRef]
- Colin, X.; Mavel, A.; Marais, C.; Verdu, J. Interaction between cracking and oxidation in organic matrix composites. J. Compos. Mater. 2005, 39, 1371–1389. [Google Scholar] [CrossRef]
- Pochiraju, K.; Tandon, G.P. Interaction of oxidation and damage in high temperature polymeric matrix composites. Compos. Part A 2009, 40, 1931–1940. [Google Scholar] [CrossRef]
- Vu, D.Q. Endommagements Induits Par la Thermo Oxydation Dans les Composites Carbone/Epoxy Unidirectionnels et Stratifies. Ph.D. Thesis, ENSMA, Poitiers, France, 2011. [Google Scholar]
- Kondo, K.; Taki, T. Moisture diffusivity of unidirectional composites. J. Compos. Mater. 1982, 16, 82–93. [Google Scholar] [CrossRef]
- Whitcomb, J.; Xiaodong, T. Micromechanics of moisture diffusion in composites with impermeable fibers. J. Compos. Mater. 2002, 36, 1093–1101. [Google Scholar] [CrossRef]
- Tsai, S.W. Composite Design, 4th ed.; Think Composites: Dayton, OH, USA, 1988. [Google Scholar]
- Roy, S.; Singh, S. Analytical modeling of orthotropic diffusivities in a fiber reinforced composite with discontinuities using homogenization. Compos. Sci. Technol. 2009, 69, 1962–1967. [Google Scholar] [CrossRef]
Figure 1.
Examination by optical microscopy of a surface cut in the radial direction of the composite container. The scale is indicated at the bottom right.
Figure 1.
Examination by optical microscopy of a surface cut in the radial direction of the composite container. The scale is indicated at the bottom right.

Figure 2.
Scheme of the permeation cell.

Figure 3.
General shape of the cumulative oxygen flow versus the time of the experiment. Graphical determination of tlag and Pe.
Figure 3.
General shape of the cumulative oxygen flow versus the time of the experiment. Graphical determination of tlag and Pe.

Figure 4.
Schematization of a tubular interphase (in grey) around a fiber (in white area). Indication of its wall thickness and the fiber radius.
Figure 4.
Schematization of a tubular interphase (in grey) around a fiber (in white area). Indication of its wall thickness and the fiber radius.

Figure 5.
Schematization of a radial cross-section of the composite container. Indication of the inner and outer radii and gas pressures.
Figure 5.
Schematization of a radial cross-section of the composite container. Indication of the inner and outer radii and gas pressures.

Figure 6.
Schematization of the oxygen flow through a volume element of the composite wall.
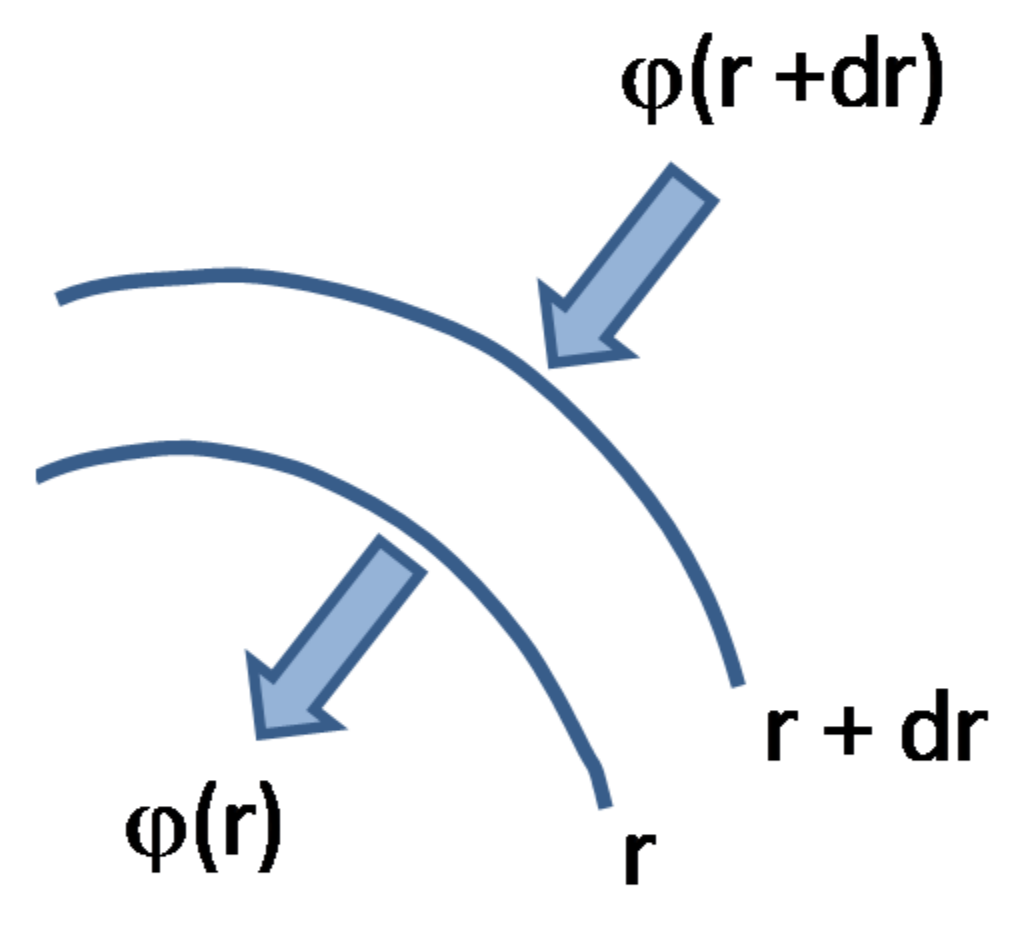
Figure 7.
Changes in the molar fraction of oxygen xO2 over time at 25 °C. Impact of the inner pressure of gas.
Figure 7.
Changes in the molar fraction of oxygen xO2 over time at 25 °C. Impact of the inner pressure of gas.

Figure 8.
Changes in the oxygen concentration C over time for an inner gas pressure of 1.1 × Patm. Impact of temperature.
Figure 8.
Changes in the oxygen concentration C over time for an inner gas pressure of 1.1 × Patm. Impact of temperature.
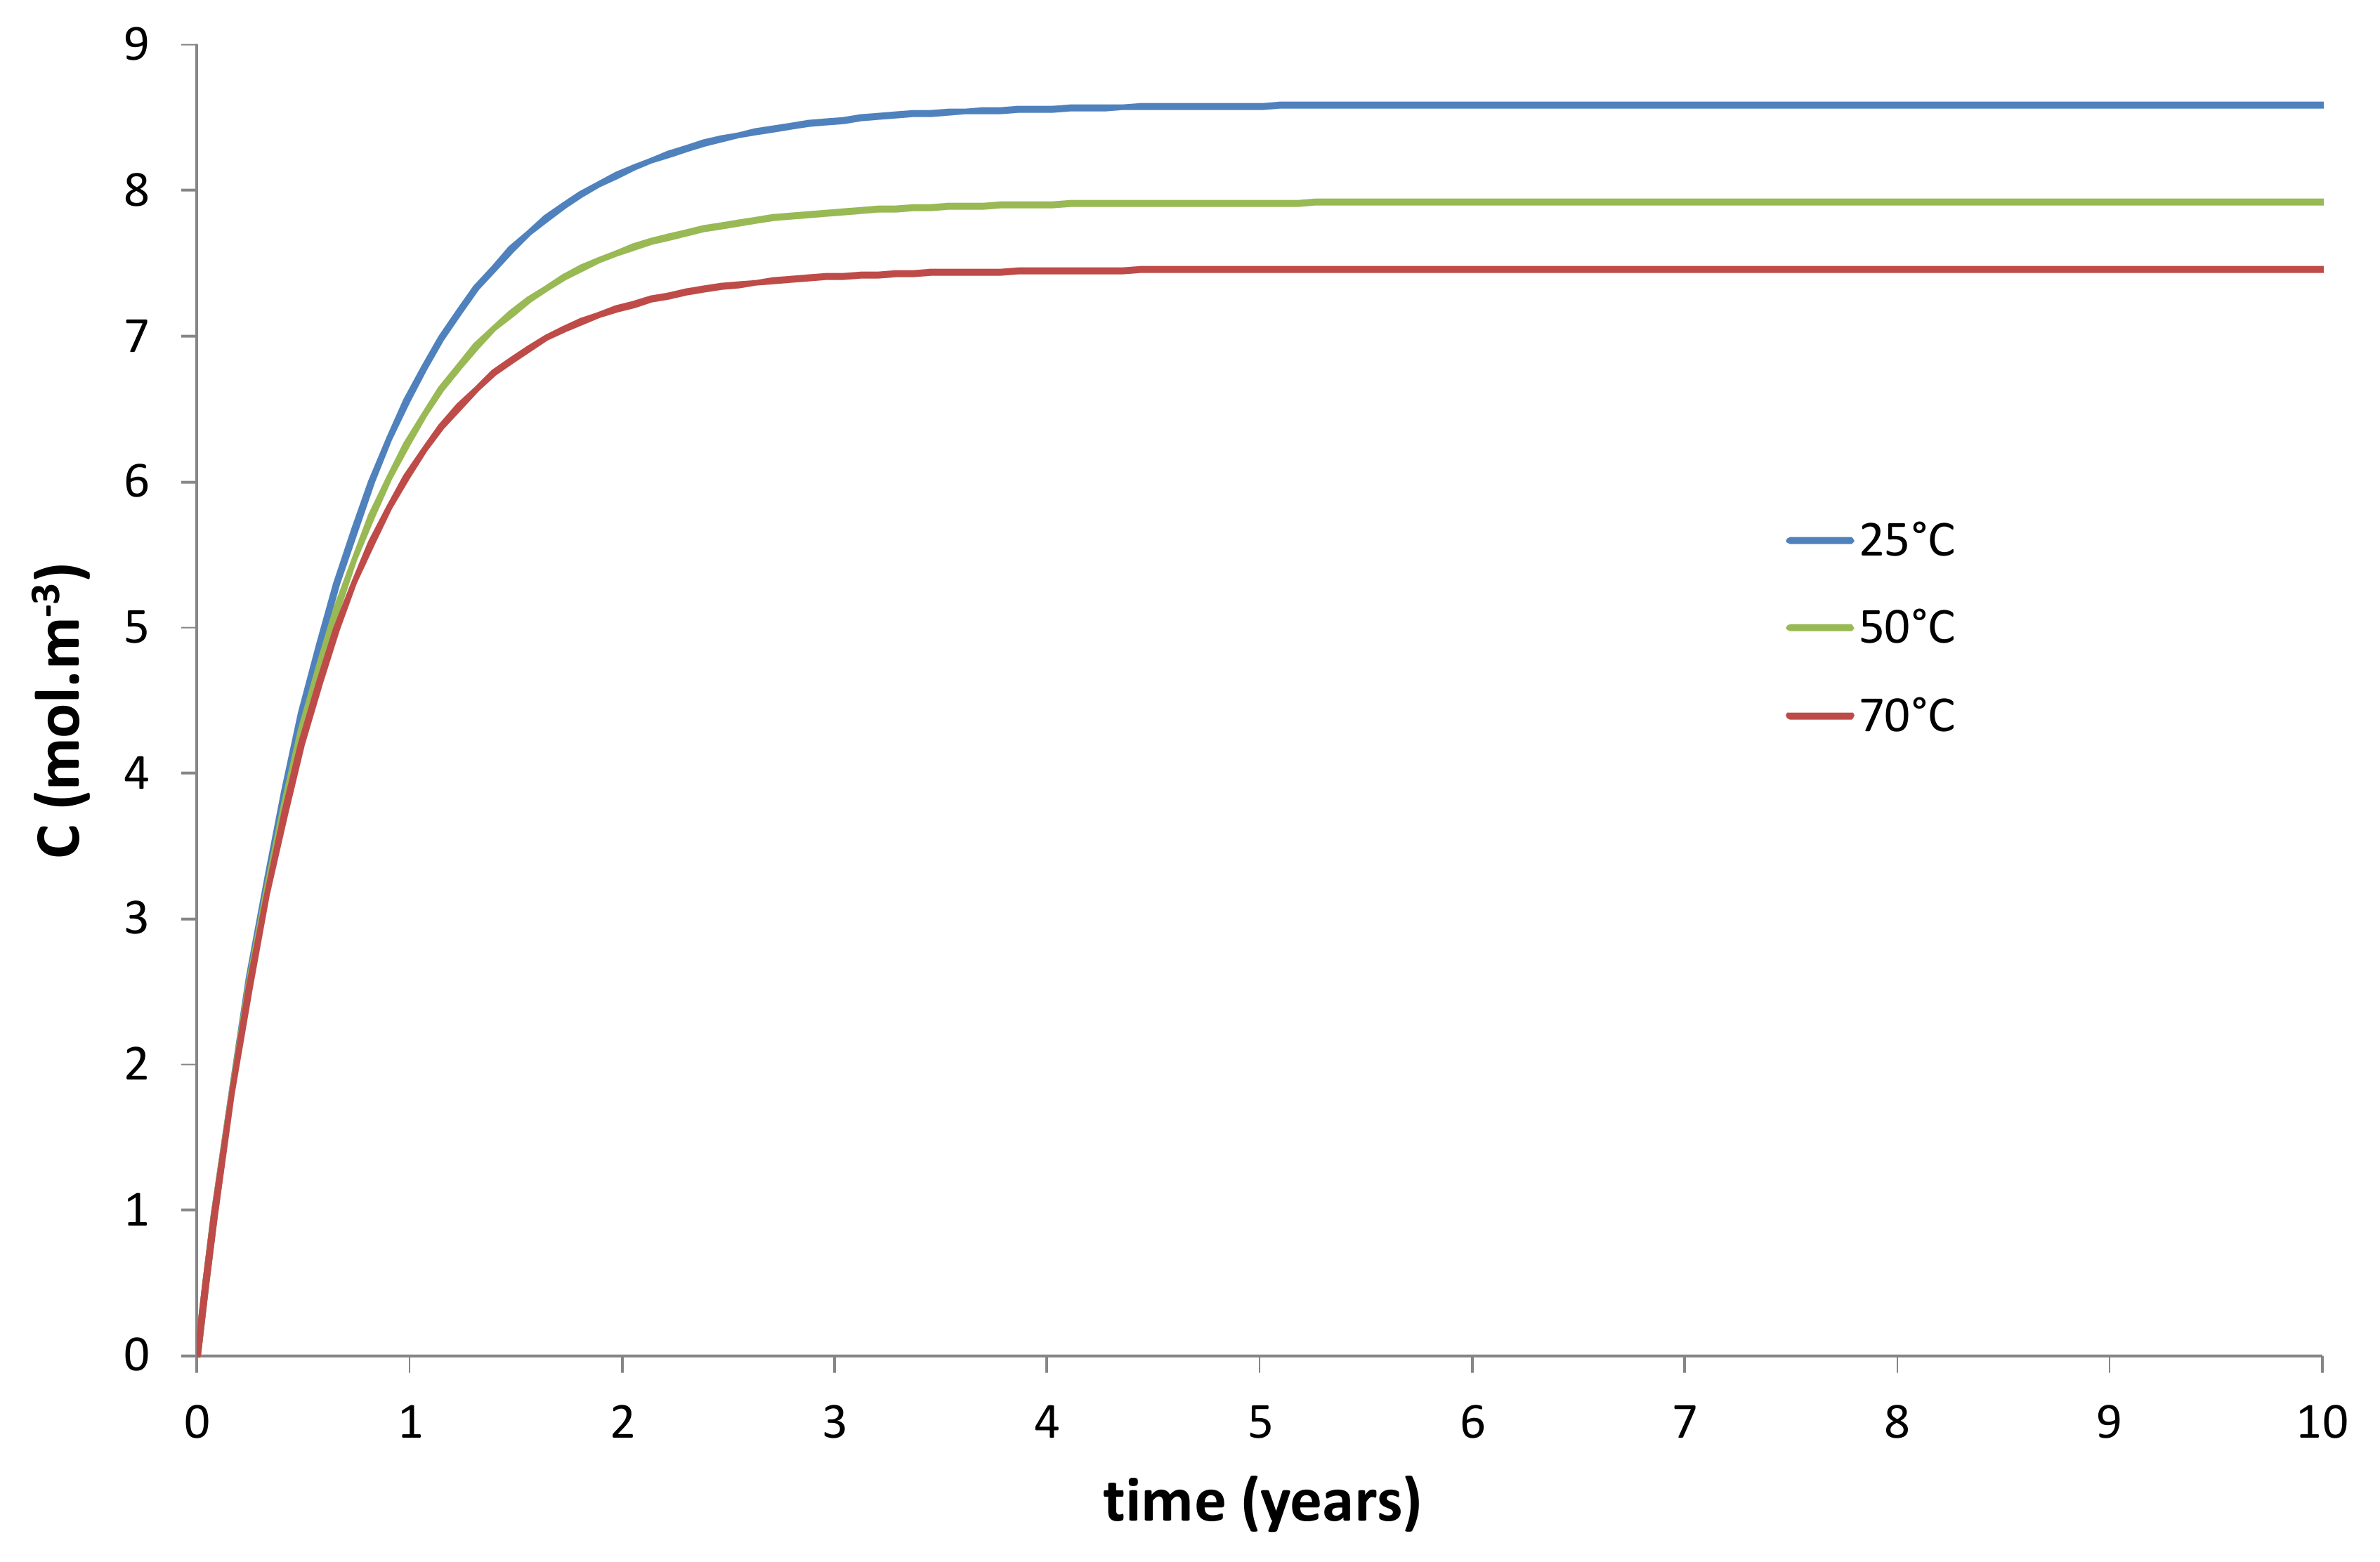
Figure 9.
Changes in the molar fraction of oxygen xO2 over time for an inner gas pressure of 1.1 × Patm. Impact of temperature.
Figure 9.
Changes in the molar fraction of oxygen xO2 over time for an inner gas pressure of 1.1 × Patm. Impact of temperature.

Figure 10.
Changes in the oxygen concentration C over time at 25 °C for an inner gas pressure of 1.1 × Patm. Impact of wall thickness.
Figure 10.
Changes in the oxygen concentration C over time at 25 °C for an inner gas pressure of 1.1 × Patm. Impact of wall thickness.
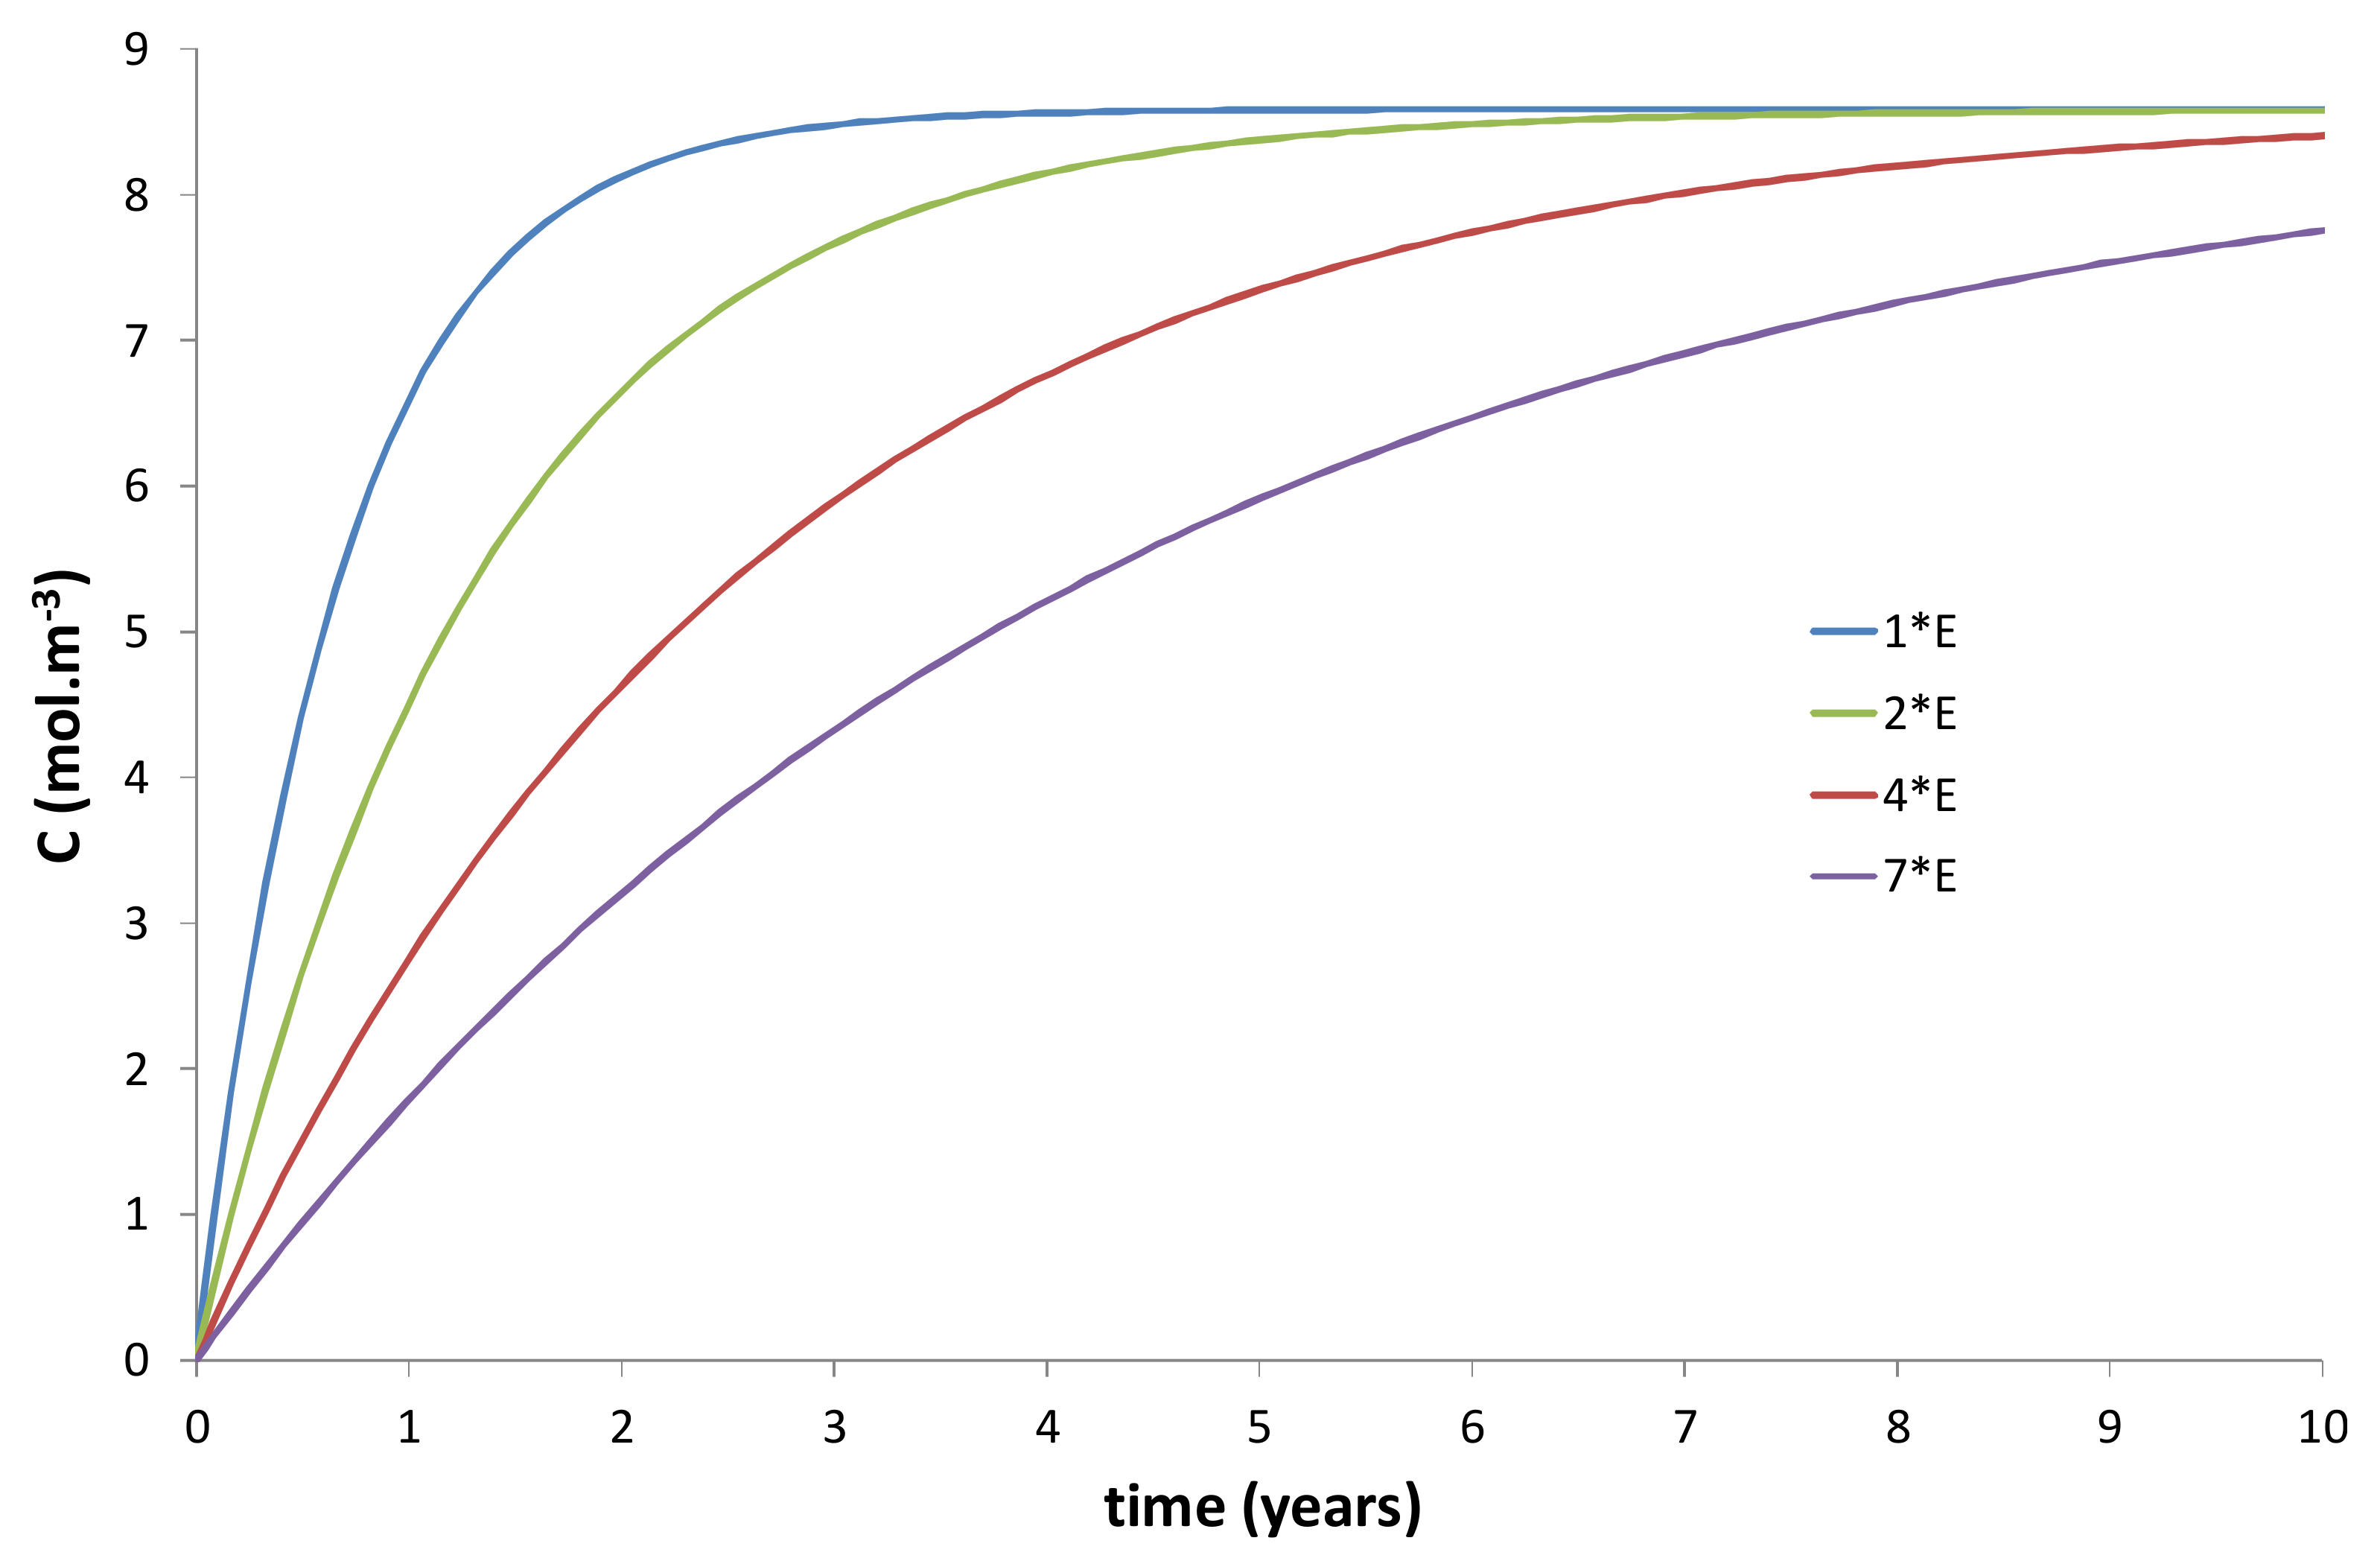
Figure 11.
Changes in the molar fraction of oxygen xO2 over time at 25 °C for an inner gas pressure of 1.1 × Patm. Impact of wall thickness.
Figure 11.
Changes in the molar fraction of oxygen xO2 over time at 25 °C for an inner gas pressure of 1.1 × Patm. Impact of wall thickness.

Table 1.
Values of S and D measured between 20 and 45 °C by oxygen permeation. Their average value in the whole temperature interval is given in the last column.
Table 1.
Values of S and D measured between 20 and 45 °C by oxygen permeation. Their average value in the whole temperature interval is given in the last column.
| Measured Values | Average Value | |||
|---|---|---|---|---|
| T (°C) | 20 °C | 30 °C | 45 °C | From 20 to 45 °C |
| S (mol·m−3·Pa−1) | 2.9 × 10⁻⁴ | 1.3 × 10⁻⁴ | 1.2 × 10⁻⁴ | 1.8 × 10⁻⁴ |
| D (m2·s−1) | 6.9 × 10⁻¹¹ | 8.7 × 10⁻¹¹ | 7.4 × 10⁻¹¹ | 7.6 × 10⁻¹¹ |
© 2018 by the authors. Licensee MDPI, Basel, Switzerland. This article is an open access article distributed under the terms and conditions of the Creative Commons Attribution (CC BY) license (http://creativecommons.org/licenses/by/4.0/).
Share and Cite
MDPI and ACS Style
Defauchy, V.; Le Corre, H.; Colin, X. Simulation of the Oxygen Permeability of a Composite Container. J. Compos. Sci. 2018, 2, 21. https://doi.org/10.3390/jcs2020021
AMA Style
Defauchy V, Le Corre H, Colin X. Simulation of the Oxygen Permeability of a Composite Container. Journal of Composites Science. 2018; 2(2):21. https://doi.org/10.3390/jcs2020021
Chicago/Turabian StyleDefauchy, Virginie, Hélène Le Corre, and Xavier Colin. 2018. "Simulation of the Oxygen Permeability of a Composite Container" Journal of Composites Science 2, no. 2: 21. https://doi.org/10.3390/jcs2020021