Low-Velocity Impact Properties of Sandwich Structures with Aluminum Foam Cores and CFRP Face Sheets


Karlsruhe Institute of Technology, Institute for Applied Materials, 76131 Karlsruhe, Germany
*
Author to whom correspondence should be addressed.
J. Compos. Sci. 2018, 2(2), 24; https://doi.org/10.3390/jcs2020024
Submission received: 8 March 2018
/
Revised: 29 March 2018
/
Accepted: 30 March 2018
/
Published: 4 April 2018
Abstract
:Within this contribution, the low-velocity impact behavior of sandwich structures was investigated. The sandwich structures consisted of carbon fiber reinforced polymer (CFRP) face sheets in various setups, and different core structures, including an open-cell and a closed-cell aluminum foam. The matrix of the face sheets was foamed polyurethane, which also acts as the adhesive connecting the face sheets to the core. Low-velocity indentation tests were carried out with multiple sandwich configurations. The indentation behavior was further examined by additional quasi-static indentation tests, and in situ indentation tests sequentially recorded by X-ray computed tomography. Both the low velocity indentation tests and the quasi-static tests were supported by digital image correlation measurements of the lower specimen surfaces. The overall indentation behavior was described consistently to sandwich structures with different material combinations in literature. The influence of each sandwich configuration parameter on the indentation behavior was determined and described in detail.
1. Introduction
Apart from quasi-static bending stiffness [1,2,3], the rigidity to dynamic impact loads at low to medium velocity is a critical characteristic for sandwich structures, while maintaining a low weight. Low velocity impact testing (LVI) is a common method to determine the dynamic indentation behavior of sandwich structures. Other test setups include small-mass impact tests [4,5], in which the full perforation of the sandwich specimens is not necessarily achieved, or dynamic three-point bending [6].
Crupi et al. [7,8,9] present substantial work on LVI properties of sandwich structures with aluminum face sheets and closed-cell aluminum foam cores. They compare different impact velocities, including quasi-static indentation tests [7,8], and observe the absence of any velocity-induced influence, since the force-indentation graphs show good resemblance. Furthermore, they use low impact velocities for partial perforation of the specimens at various stages, in order to connect the failure behavior of the specimens (and their components) to characteristic parts of the force-indentation graphs. They also investigate sandwich structures with aluminum face sheets laminated with glass fiber reinforced plastics (GFRP) [9,10,11], which fail significantly less ductilely than the tested sandwich structures with pure aluminum face sheets, and show delamination between the GFRP and the aluminum layers.
Li et al. [12] investigate the indentation behavior of sandwich composites with GFRP face sheets and aluminum foam cores. They also compare LVI results to quasi-static indentation tests but observe a different behavior and different force-indentation results, depending on the impact energy and velocity. Similar results were achieved by Mines et al. [13], differing from the observations by Crupi et al. [7,8].
Han et al. [14] match various stages in an LVI impact event on sandwich structures with aluminum face sheets and aluminum foam cores to the corresponding failure behavior, similar to the observations by Crupi et al. [7,8]. Mines et al. [13] provide detailed investigations on the LVI failure behavior of carbon fiber reinforced polymer (CFRP)-honeycomb sandwich structures. All of the listed authors consistently show that the penetration of the first face sheet causes a load peak, followed by a load plateau while penetrating the core structure, and a second load peak caused by the perforation of the lower face sheet.
For the investigation of deformation behavior, Li et al. [12] cut the specimens after testing. Crupi et al. [7,8,9,10] use X-ray computed tomography (CT), which prevents the introduction of further damage through the cutting process, and provides the opportunity to investigate the whole specimen volume instead of only one cross-sectional layer.
Digital image correlation (DIC) on sandwich specimens is performed by Wang et al. [15], using a calibrated stereo camera system monitoring a speckle pattern on the specimen face sheet surface. However, they do not conduct the DIC directly in LVI tests, but in compression after impact (CAI) tests, using specimens which were not fully penetrated during the LVI tests. Topac et al. [16] use DIC to evaluate the LVI deformation behavior on composite specimens in a bending impact test setup. Singh et al. [17], Yudhanto et al. [18] and Namala et al. [19] perform DIC measurements on FRP composite LVI specimens in a test setup with an hemispherical indenter. However, the behavior of FRP composites significantly differs from the behavior of sandwich structures, so the comparability of their results to this work is limited despite the similarities in the test setup. To the authors’ knowledge, no investigations using DIC to determine the LVI behavior of sandwich specimens are found in literature.
Most work found in literature concentrates on the investigation of the impact event, but only a few publications systematically investigating the influence of sandwich components are known to the authors. Li et al. [12] investigate three different levels face sheet thickness, but only show a comparison of energy absorption. Wang et al. investigate different face sheet- and core thickness levels, but concentrate on the behavior at compression after impact (CAI). Hassan et al. [20] show the influence of the foam core density on the LVI behavior of sandwich constructions. However, they chose very thin face sheets to emphasize the effects, so the behavior of the tested sandwich structures is dominated by the core structure, reducing the influence of the face sheets.
In this contribution, the influence of the sandwich material configuration is investigated in detail. Special focus is directed on the sandwich core, where three different structures are compared: two aluminum foams, one of which with an open-cell composition, the second with a closed cell composition, and a Nomex honeycomb structure. Further configuration parameters include the face sheet build-up and the interface of face sheets and core. The LVI tests were compared to quasi-static indentation tests, supported by DIC measurements and quasi-static in situ CT indentation tests, in order to create a detailed image of the indentation behavior.
2. Materials
Sandwich structures with different core structures, face sheet configurations, and matrix/adhesive quantities were investigated. All tested sandwich configurations included bi-axial (0/90) continuous fiber reinforced face sheets with a foamed polyurethane (PUR) matrix. Mainly, two core structures of different aluminum foams (each one type with open and closed cells) were tested, although a Nomex honeycomb structure was included as a reference. The sandwich structures were produced using a modified PUR spraying process. Both the material combinations and the production process are also described in earlier publications by the authors [21,22,23]; however, all necessary information for the low-velocity impact properties are given here.
The tested sandwich configurations are divided into different parameter sets of face sheets (fiber area weight, fiber architecture), PUR quantity, and core type.
2.1. Face Sheets
Three increments of fiber area weight were achieved by stacking up to three layers of bi-axial carbon fiber textile of each 160 g/m. Two types of fiber architecture were used: woven plain weave (“Style 447 3K Aero” by Lange + Ritter, Gerlingen, Germany), and non-crimp fabric (NCF, “Dynaotex HS 15/80 DLN2” by Lange + Ritter, Gerlingen, Germany). The latter is a unidirectional fabric with 80 g/m area weight, which was only used combined as a double layer with orthogonal orientation.
2.2. PUR Quantities and Manufacturing Process
The PUR acts both as the matrix for the face sheet fibers, and as the adhesive connecting the face sheets to the core. It was applied by a robot to the outside of a dry sandwich assembly of the face sheet fiber textiles wrapped around the core structure. For this purpose, the two PUR components (isocyanate “PUR 900” and polyol “PUR 569 IT”, both by Rühl Puromer, Friedrichsdorf, Germany), are dispensed into a high-pressure mixing nozzle mounted to a robot arm. The first charge of PUR is applied into a mould carrier, in two paths with 160 mm separation. The dry sandwich assembly is then placed upon the PUR resin, whereafter the second charge of PUR is applied for the infiltration of the other face sheet. After the application, the mould carrier is closed to form a cavity of 20 mm, without restrictions on the sandwich sides. Heated to 60 C, the PUR then foams and cures, while infiltrating the face sheet fibers and at the same time connecting the face sheet to the core.
Three increments of PUR discharge rate were used: 75.5 g/m, 113.3 g/m, and 226.6 g/m.
2.3. Core Types
Two types of aluminum foams, one of them an open cell foam (OC, “PPI10” by mPore, Lindenberg, Germany) and the other a closed cell foam (CC, “Alcoras Big Cell” by AlCarbon, Bremen, Germany) were investigated as a core structure. Furthermore, a Nomex honeycomb structure (NH, “ECA 9.6-48” by Euro Composites, Echternach, Luxembourg) was compared to the aluminum foams as a reference structure with a more brittle behavior than the ductile aluminum foams.
2.4. Sandwich Configurations
The sandwich configurations investigated for this contribution were labeled by their components, as shown in Table 1. The standard configuration with 320 g/m woven fabric, 113.3 g/m PUR quantity, and the open-cell aluminum foam core is thus abbreviated with “320w113oc”, the other configurations equivalently.
2.5. Specimen Geometry
For the low-velocity tests and the quasi-static indentation tests, the produced sandwich plates were cut to square specimens with 150 mm length and width. For the in situ CT indentation tests, circular specimens with a diameter of 92 mm were cut from the plates. The sandwich height was 20 mm. For means of digital image correlation (DIC), a spray pattern was applied to the bottom side of each square specimen.
3. Methods
The indentation tests were conducted following DIN EN ISO 6603-2. Deferring from the test standard, additional quasi-static tests with otherwise equivalent test setup were conducted. The number of specimens was reduced to three (LVI) and two (quasi-static), respectively. Nevertheless, influences of single parameters could be identified and quantified due to the large number of tested sandwich variations.
3.1. Low-Velocity Indentation
For the LVI-tests, an Instron Dynatup 9250 HV drop tower (Norwood, MA, USA) was used, equipped with a semi-spherical indenter of 20 mm diameter attached to a drop weight of 5.24 kg. The weight was dropped from a height of 1.08 m, which calculates as a kinetic impact energy of 55.5 J. This drop height (or impact energy, respectively) was determined in pre-trials, as the lowest value of height (or energy) at which all specimens were fully penetrated. A load cell with a maximum load of 20 kN was attached to the indenter. The specimens were clamped between two rigid steel support plates, each with a circular hole of 100 mm diameter. A high-speed camera (model “MotionPro X4 plus” by RedLake, Toronto, Canada) was mounted below the test setup, recording the lower specimen surface vertically through the hole of the lower specimen support plate. It was set to a frame rate of 10 kHz at a resolution of 512 pixels × 512 pixels. The camera was triggered synchronously with the load measurements by a light barrier for the drop weight. The test setup with a mounted specimen and installed drop weight is shown in Figure 1.
3.2. Quasi-Static Indentation
The setup of indenter and specimen support from the LVI-tests was mounted on a ZwickRoell ZMART.PRO universal testing machine (Ulm, Germany) with a maximum load of 500 kN. The testing machine was equipped with an inductive extensometer measuring the indentation depth. Figure 1b shows the setup of the quasi-static indentation tests. The indentation progress was set to 5 mm/min. Underneath the specimen support frame, a GOM ARAMIS Adjustable 4M setup (Braunschweig, Germany) with a calibrated stereo camera system was mounted, recording the lower specimen surface with the spray pattern. The camera system was set up to a resolution of 2658 pixels × 1728 pixels at a frequency of 1.5 Hz. The synchronization of the video data to the measurements of force and indentation depth was realized by a laser trigger: the red spot on the specimen surface was visible in the recorded images. It was switched off in the moment of the indenter touching the specimen surface, while, simultaneously, the recording of the load-indentation data was started.
3.3. Digital Image Correlation (DIC)
For the LVI and quasi-static indentation test setups, digital image correlation was used to characterize the deformation- and damage behavior of the sandwich specimens. The spray pattern on the lower specimen surface was adapted to the camera resolutions: since the high-speed camera used in the LVI-tests had a low resolution, the spray pattern needed to be coarse. This way, some details of the deformation measurements were lost, while ensuring the ability to identify and distinguish the facets of the patterns. In the quasi-static test setup with a higher camera resolution, the spray pattern was finer, allowing for a more refined measurement of deformation.
Using the GOM Correlate software (version 2016, Braunschweig, Germany), DIC measurements were extracted for both the LVI- and the quasi-static tests. The data were analyzed for deformation patterns. Only qualitative comparisons were made, since the non-calibrated single-camera setup of the LVI-test does not allow for distinguishing in-plane and out-of-plane deformation values.
3.4. In Situ CT Indentation
As the DIC could only be performed on the lower specimen surface, additional specimens were scanned using X-ray computed tomography (CT) at several steps during a quasi-static indentation test. Round specimens (diameter 92 mm) were mounted into a Poly(methyl methacrylate) (PMMA) dome setup, which included a support plate with a circular hole of 70 mm diameter, and a lockable mount for a PMMA indenter (see Figure 2). The geometry differed from the LVI and quasi-static tests due to resolution limits of the CT-setup. The specimen mounting also differed: instead of clamping the specimen between two steel support plates, the in situ specimens were placed upon the support plate and only fixed with a small strip of tape against unwanted displacement inside the PMMA dome. The quasi-static indentation tests were conducted using a ZwickRoell ZMART-PRO universal testing machine with a maximum load of 200 kN, equipped with a load cell of 20 kN maximum capacity. At several steps during the test, the indentation was stopped, with the indenter fixed before removing the load and extracting the PMMA dome setup from the testing machine. The dome was then placed in a Yxlon Y.CT Precision CT-system (Hudson, OH, USA), and scanned at a tube current of 180 kV at 0.4 mA. A copper filter of 0.5 mm was applied. In addition, 2400 projections at 500 ms integration time were recorded and reconstructed. For the processing of the reconstructed image data, the software Fiji [24] was used. The recorded load-indentation data were assembled after the tests using the indentation depth measured in the CT-scans as alignment points.
4. Results
Table 2 shows an overview of all tested specimen configurations, including the average values of the effective density, the maximum force, and the absorbed energy. The values are formed as an average of both LVI and quasi-static indentation tests.
4.1. Low-Velocity Indentation
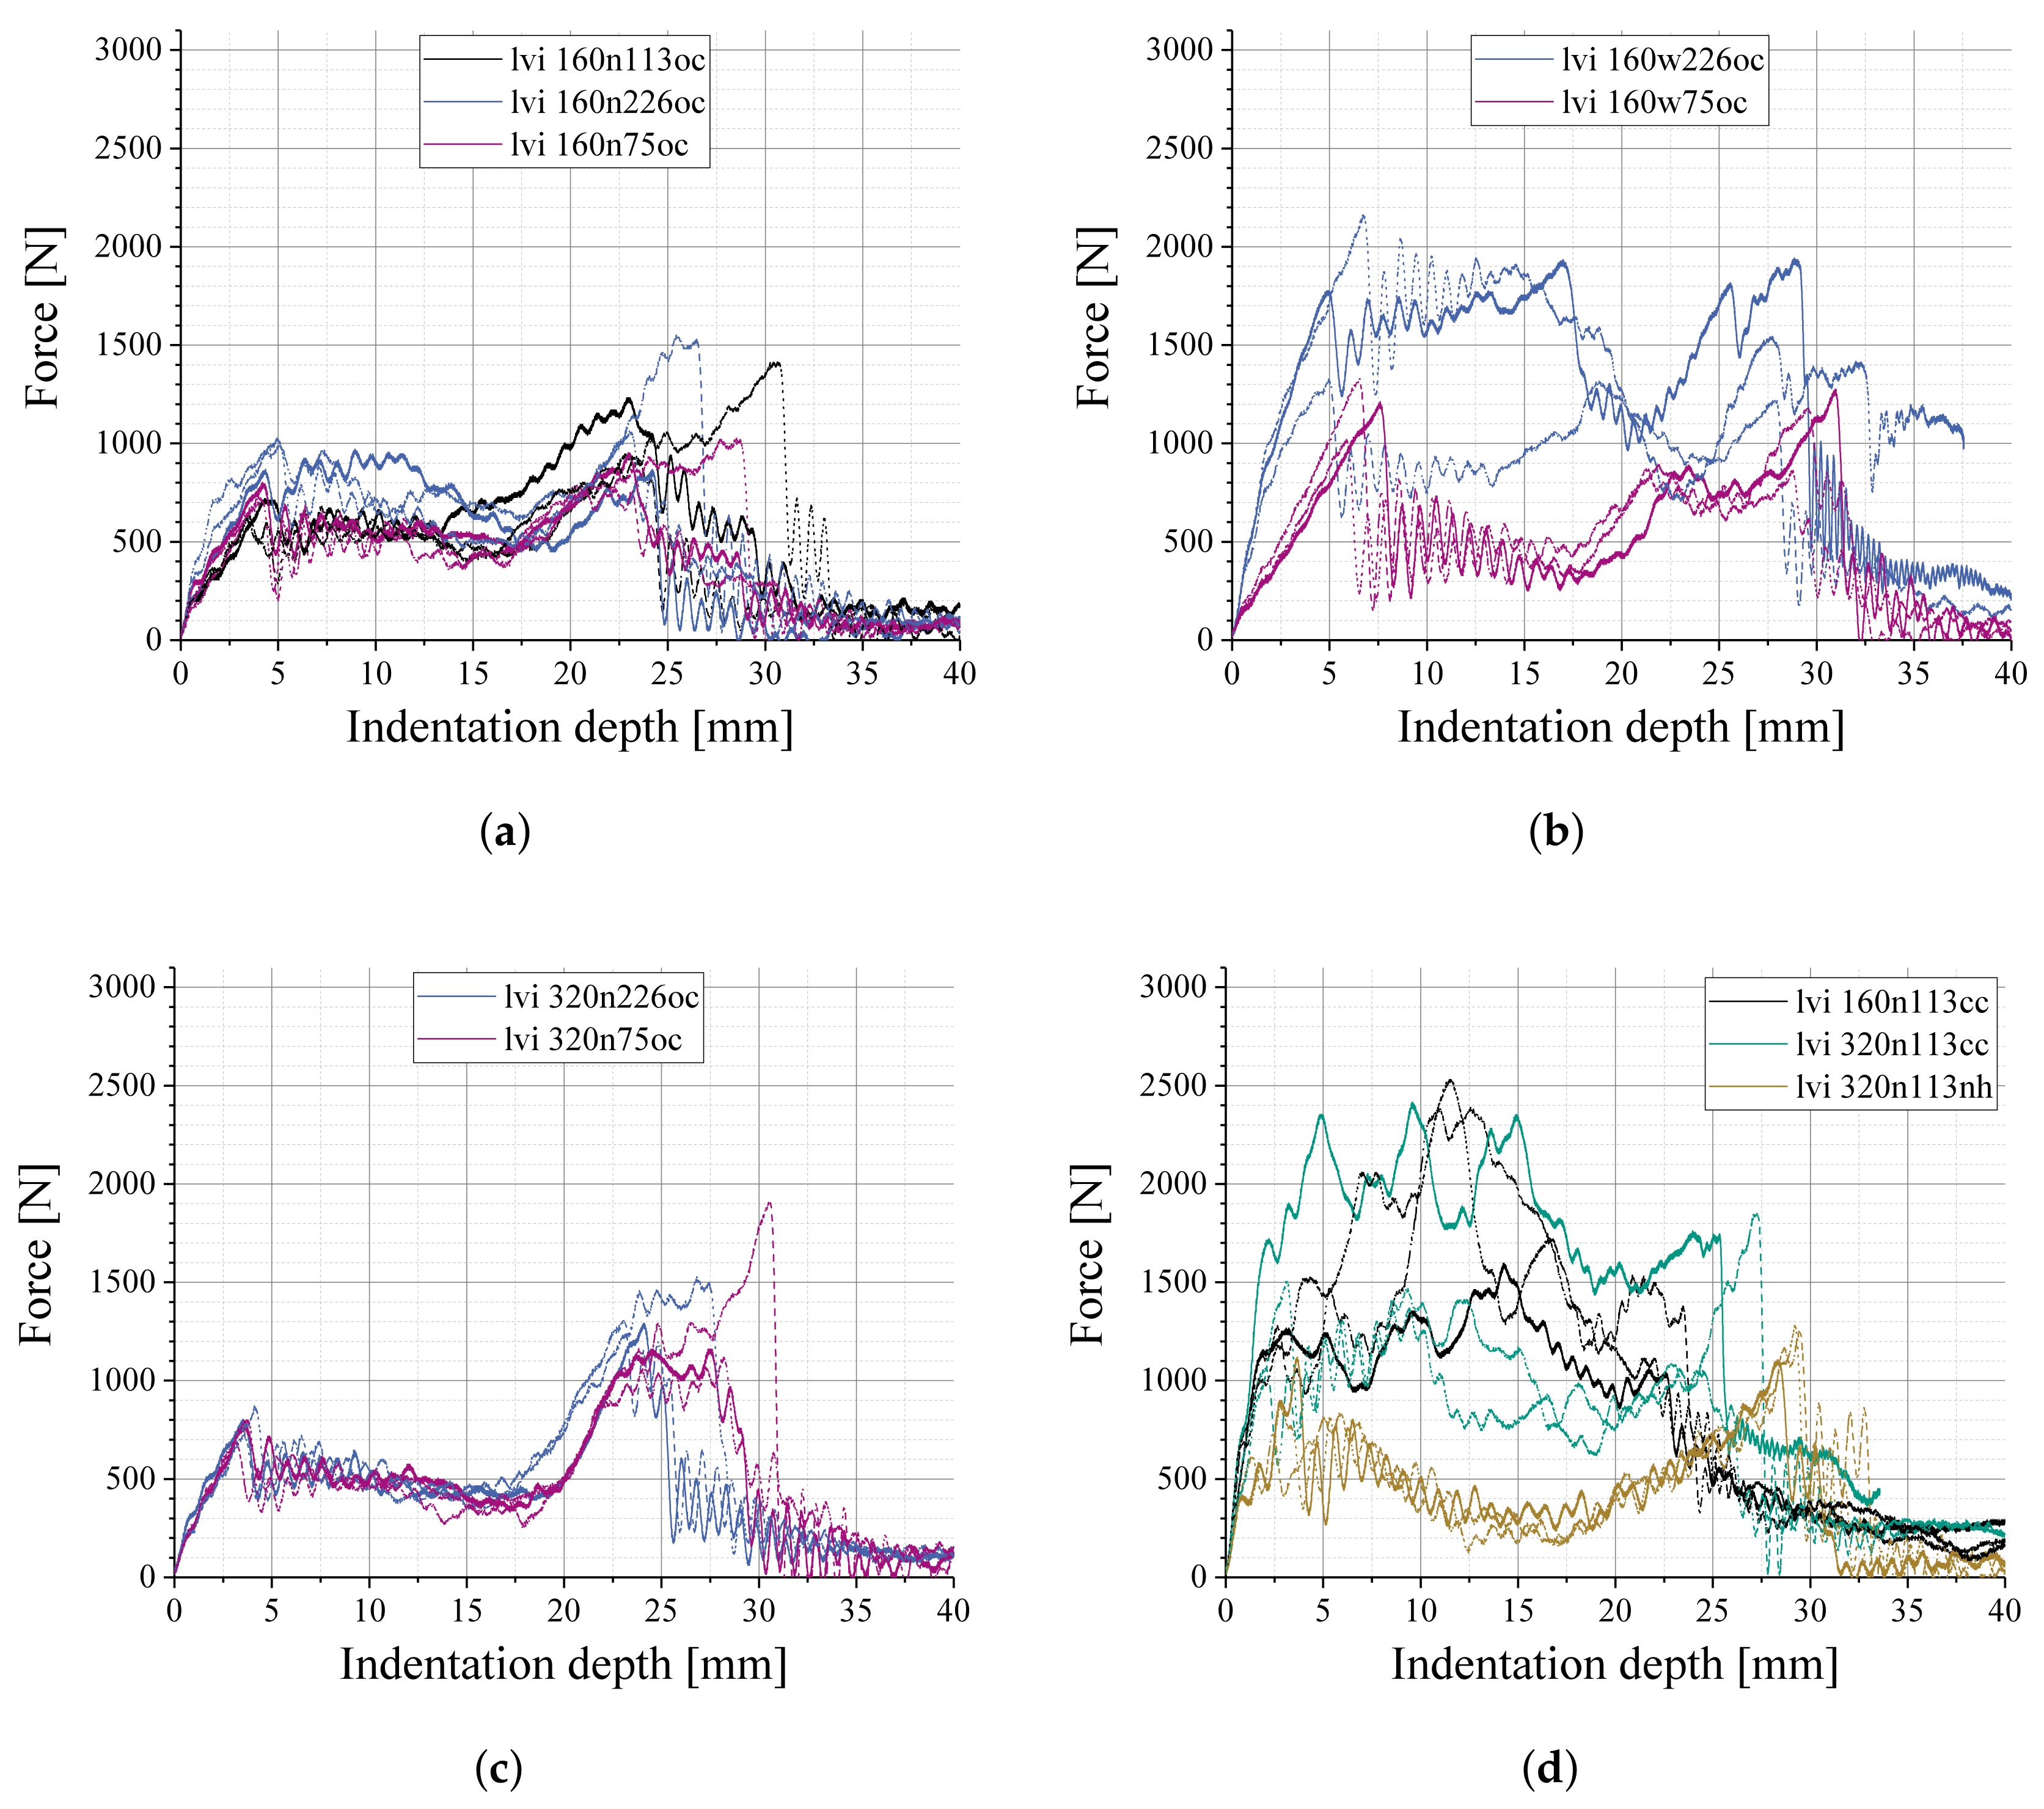
The force-indentation graphs from the LVI tests shown in Figure 3 are grouped into four different varied parameter sets for better overview. Further specimen configurations are shown in Figure A1. For each parameter configuration, two graphs are shown. Differing from the standard configuration (320w113oc, shown in black in each graph), one parameter is varied at a time to determine its influence on the force-indentation behavior. In Figure 3a, specimens with a higher (bright blue, 160 g/m) and a lower fiber area weight in the face sheets (brown, 480 g/m) are compared. In Figure 3b, a configuration with NCF face sheets is compared (red). Figure 3c compares a higher (purple, 226.6 g/m) and a lower (blue, 75.5 g/m) PUR content. The core is varied in Figure 3d, with a CC-core (cyan) and a NH core (yellow) compared to the standard OC core.
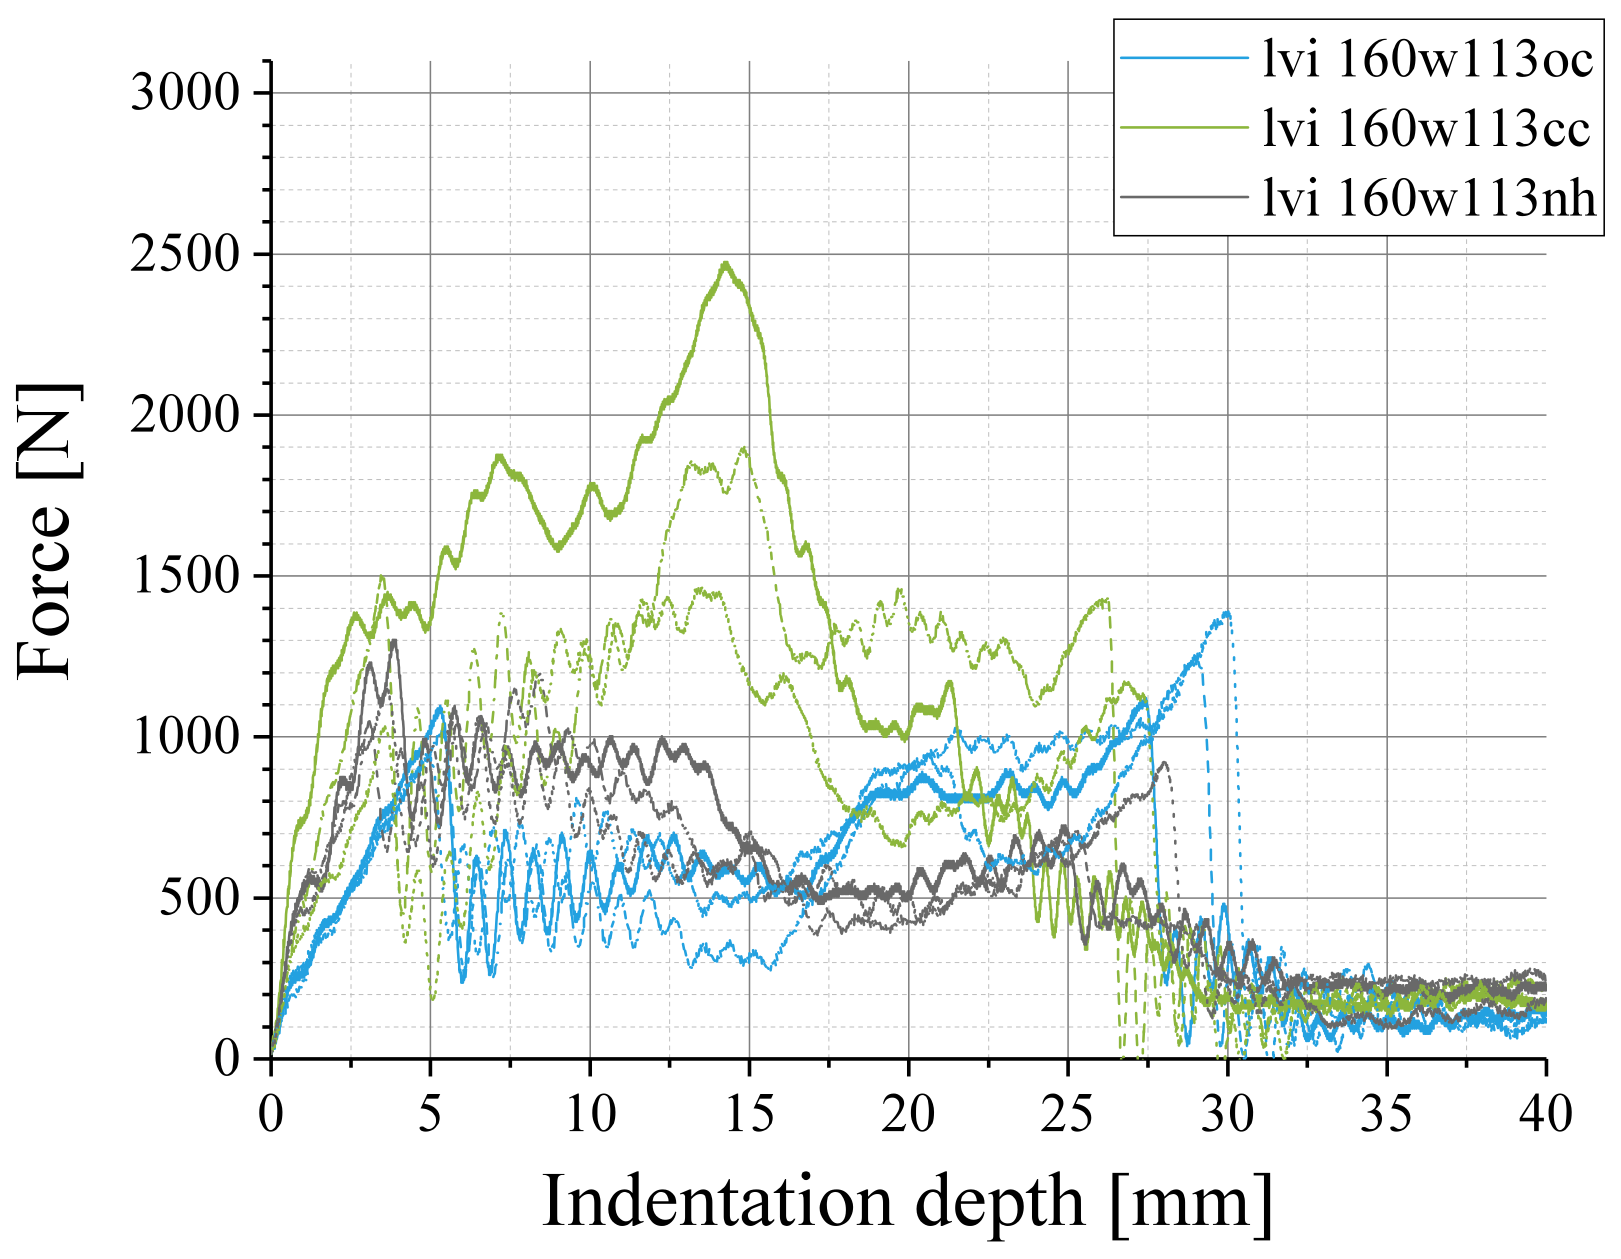
Two of the three 320w113cc specimens (CC core) differ in their load-indentation behavior: They do not show a final load drop followed by a oscillation with decreasing amplitude, but instead a load drop with slightly decreasing indentation depth. This indicates an incomplete penetration through the lower face sheet, as the indenter is slightly deflected upwards elastically. For a better comparability of the core structures, an otherwise equivalent set of specimens with a lower face sheet fiber area weight of 160 g/m is compared in Figure 4.
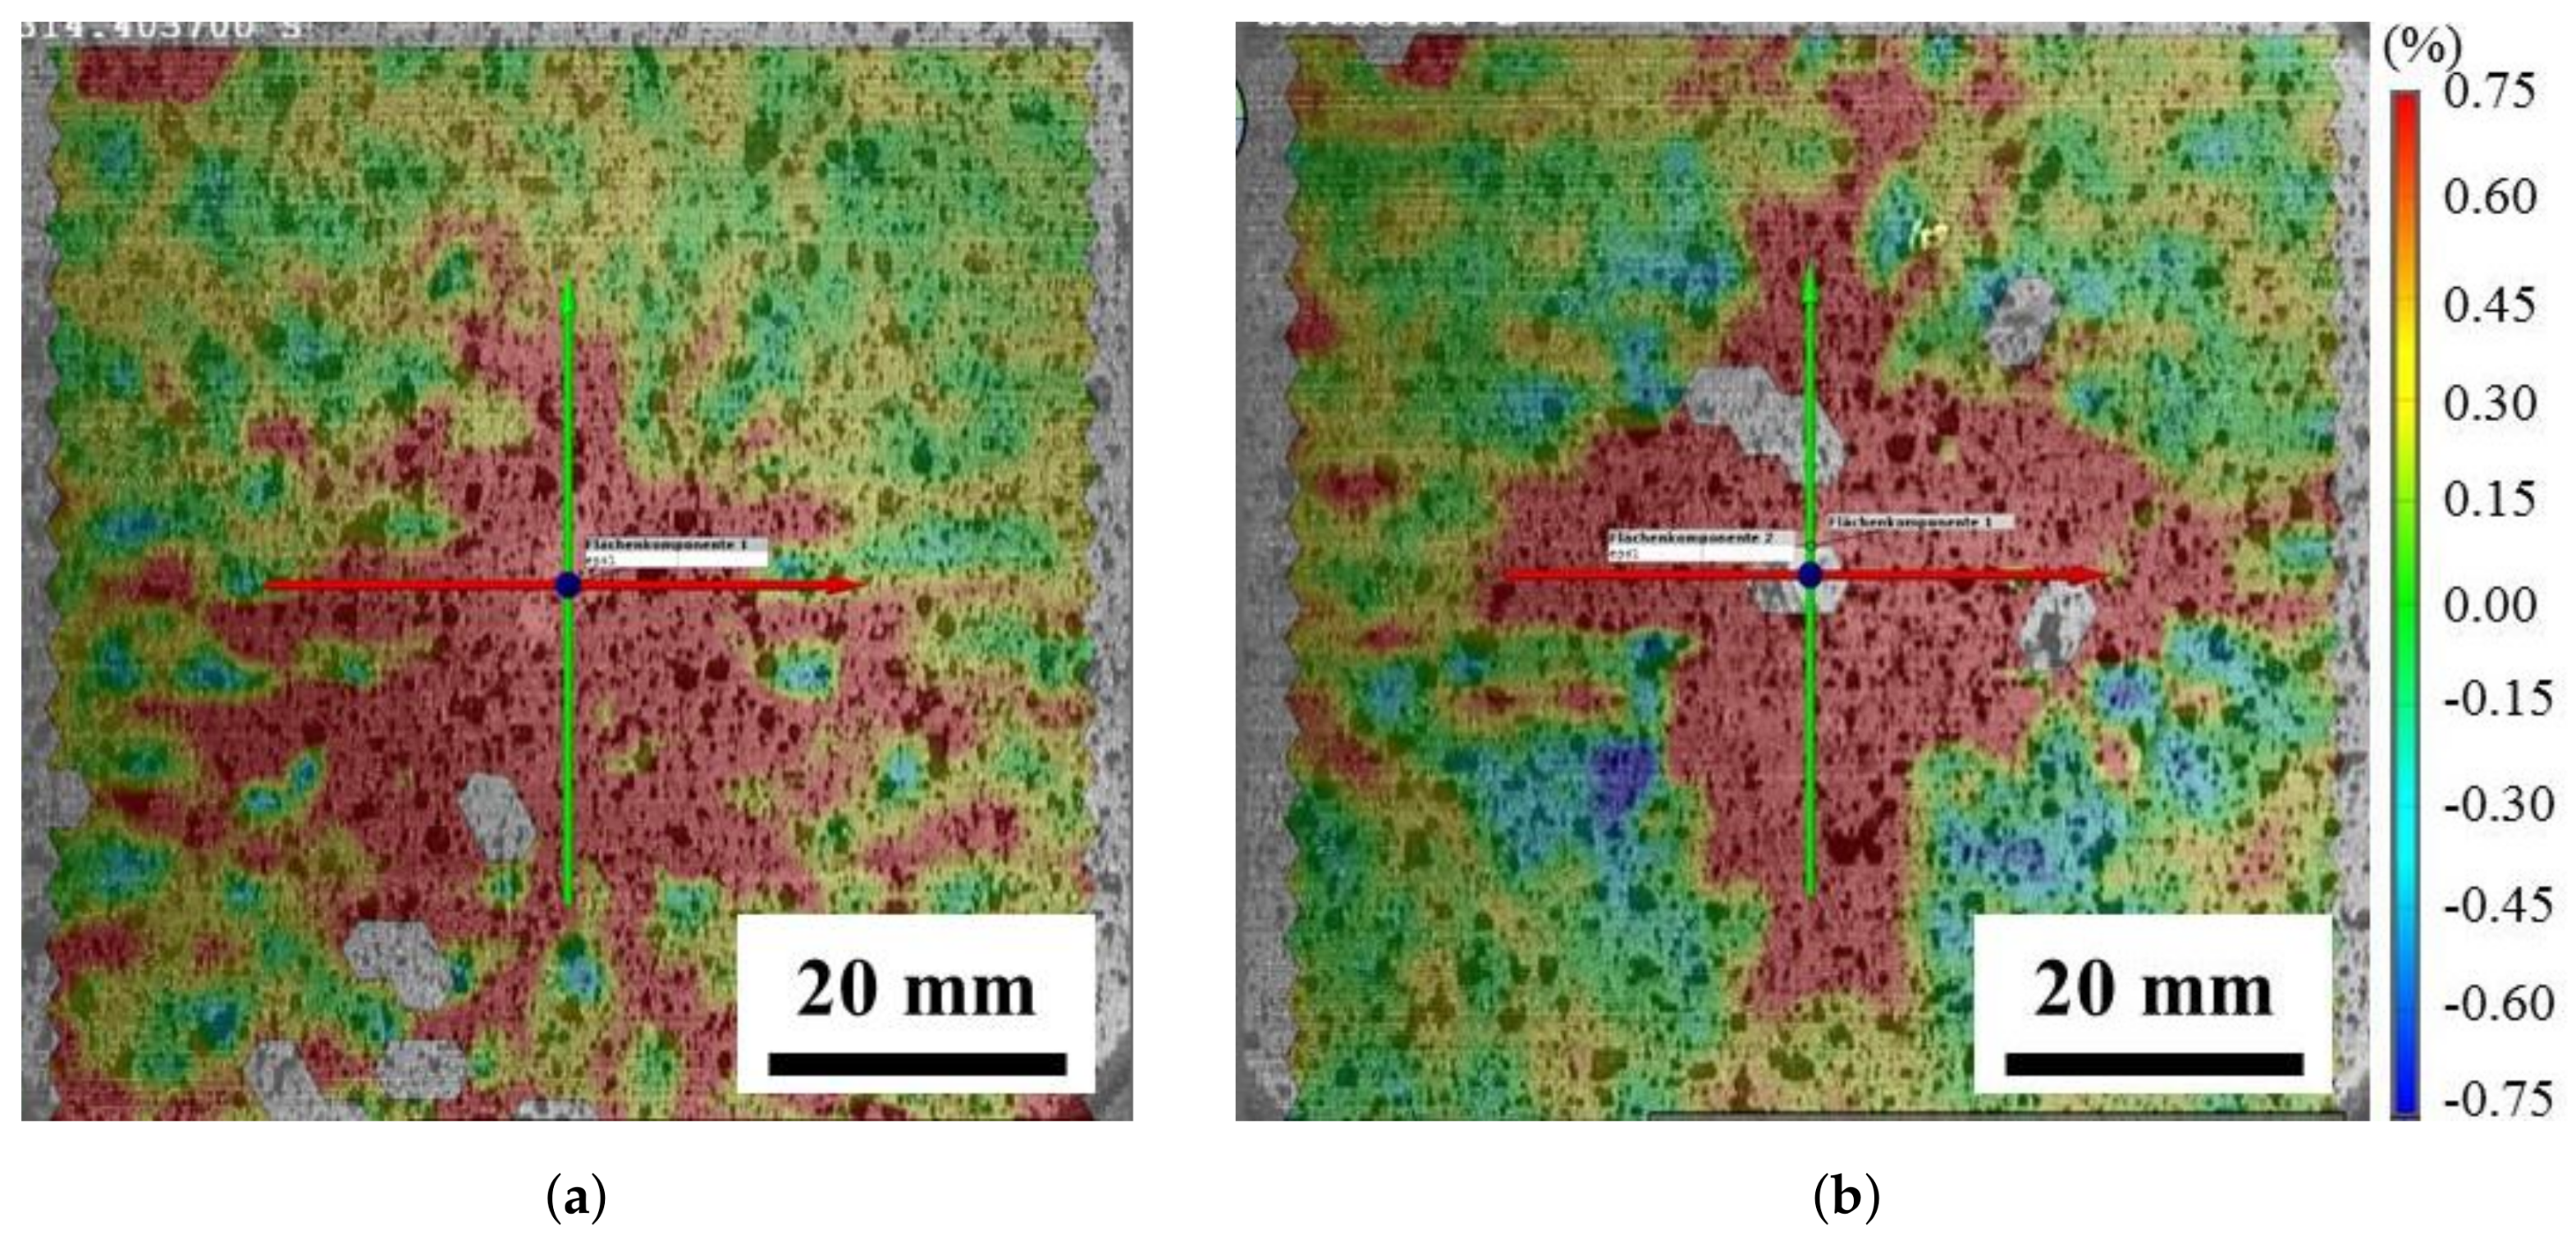
Figure 5 shows exemplary DIC results from the initial deformation in the LVI tests. As the camera resolution was low, the DIC patterns were lost in early stages, preventing a further evaluation of the images (lost pattern areas visible as non-colored spots in the images). Nevertheless, it could be observed that, regardless of the other sandwich configuration parameters, the face sheet fiber architecture produces a characteristic deformation behavior of the face sheets: NCF face sheets deform, creating a circular topography (see Figure 5a), whereas woven face sheets create a cross-like topography (see Figure 5b), with the fiber orientation horizontal/vertical in both cases.
4.2. Quasi-Static Indentation
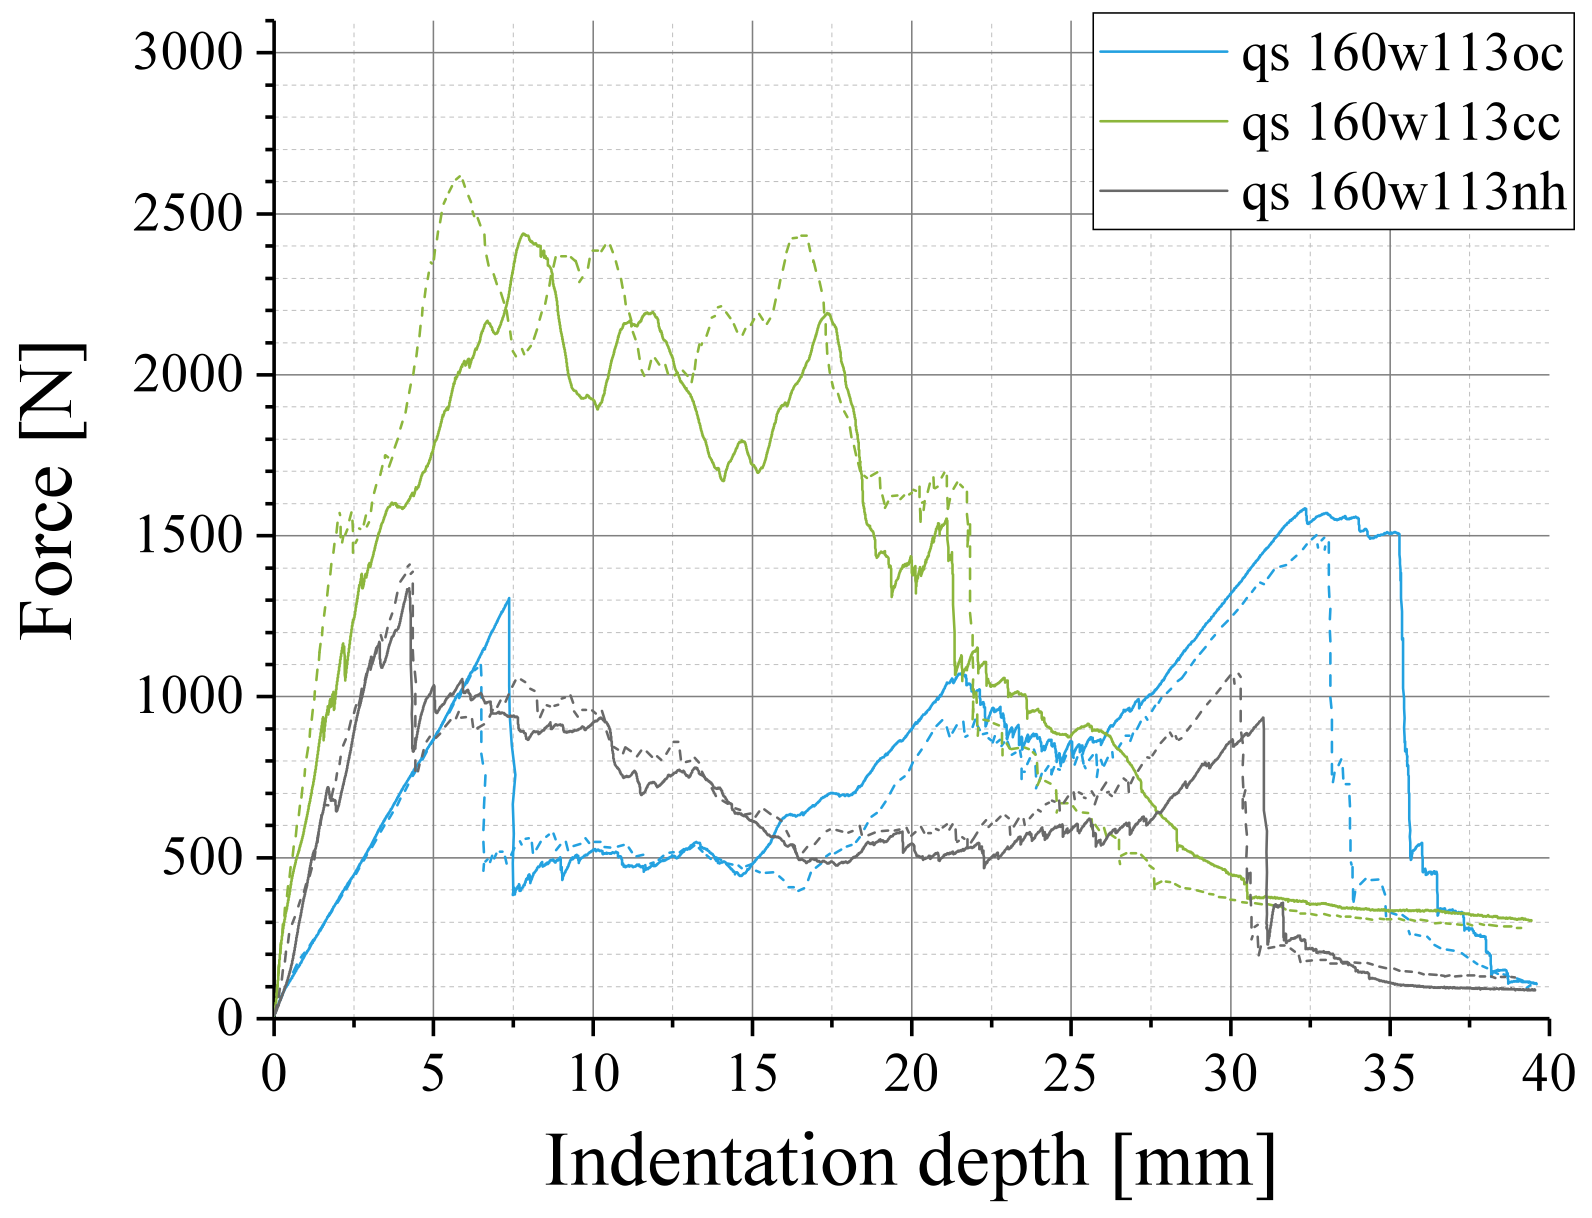
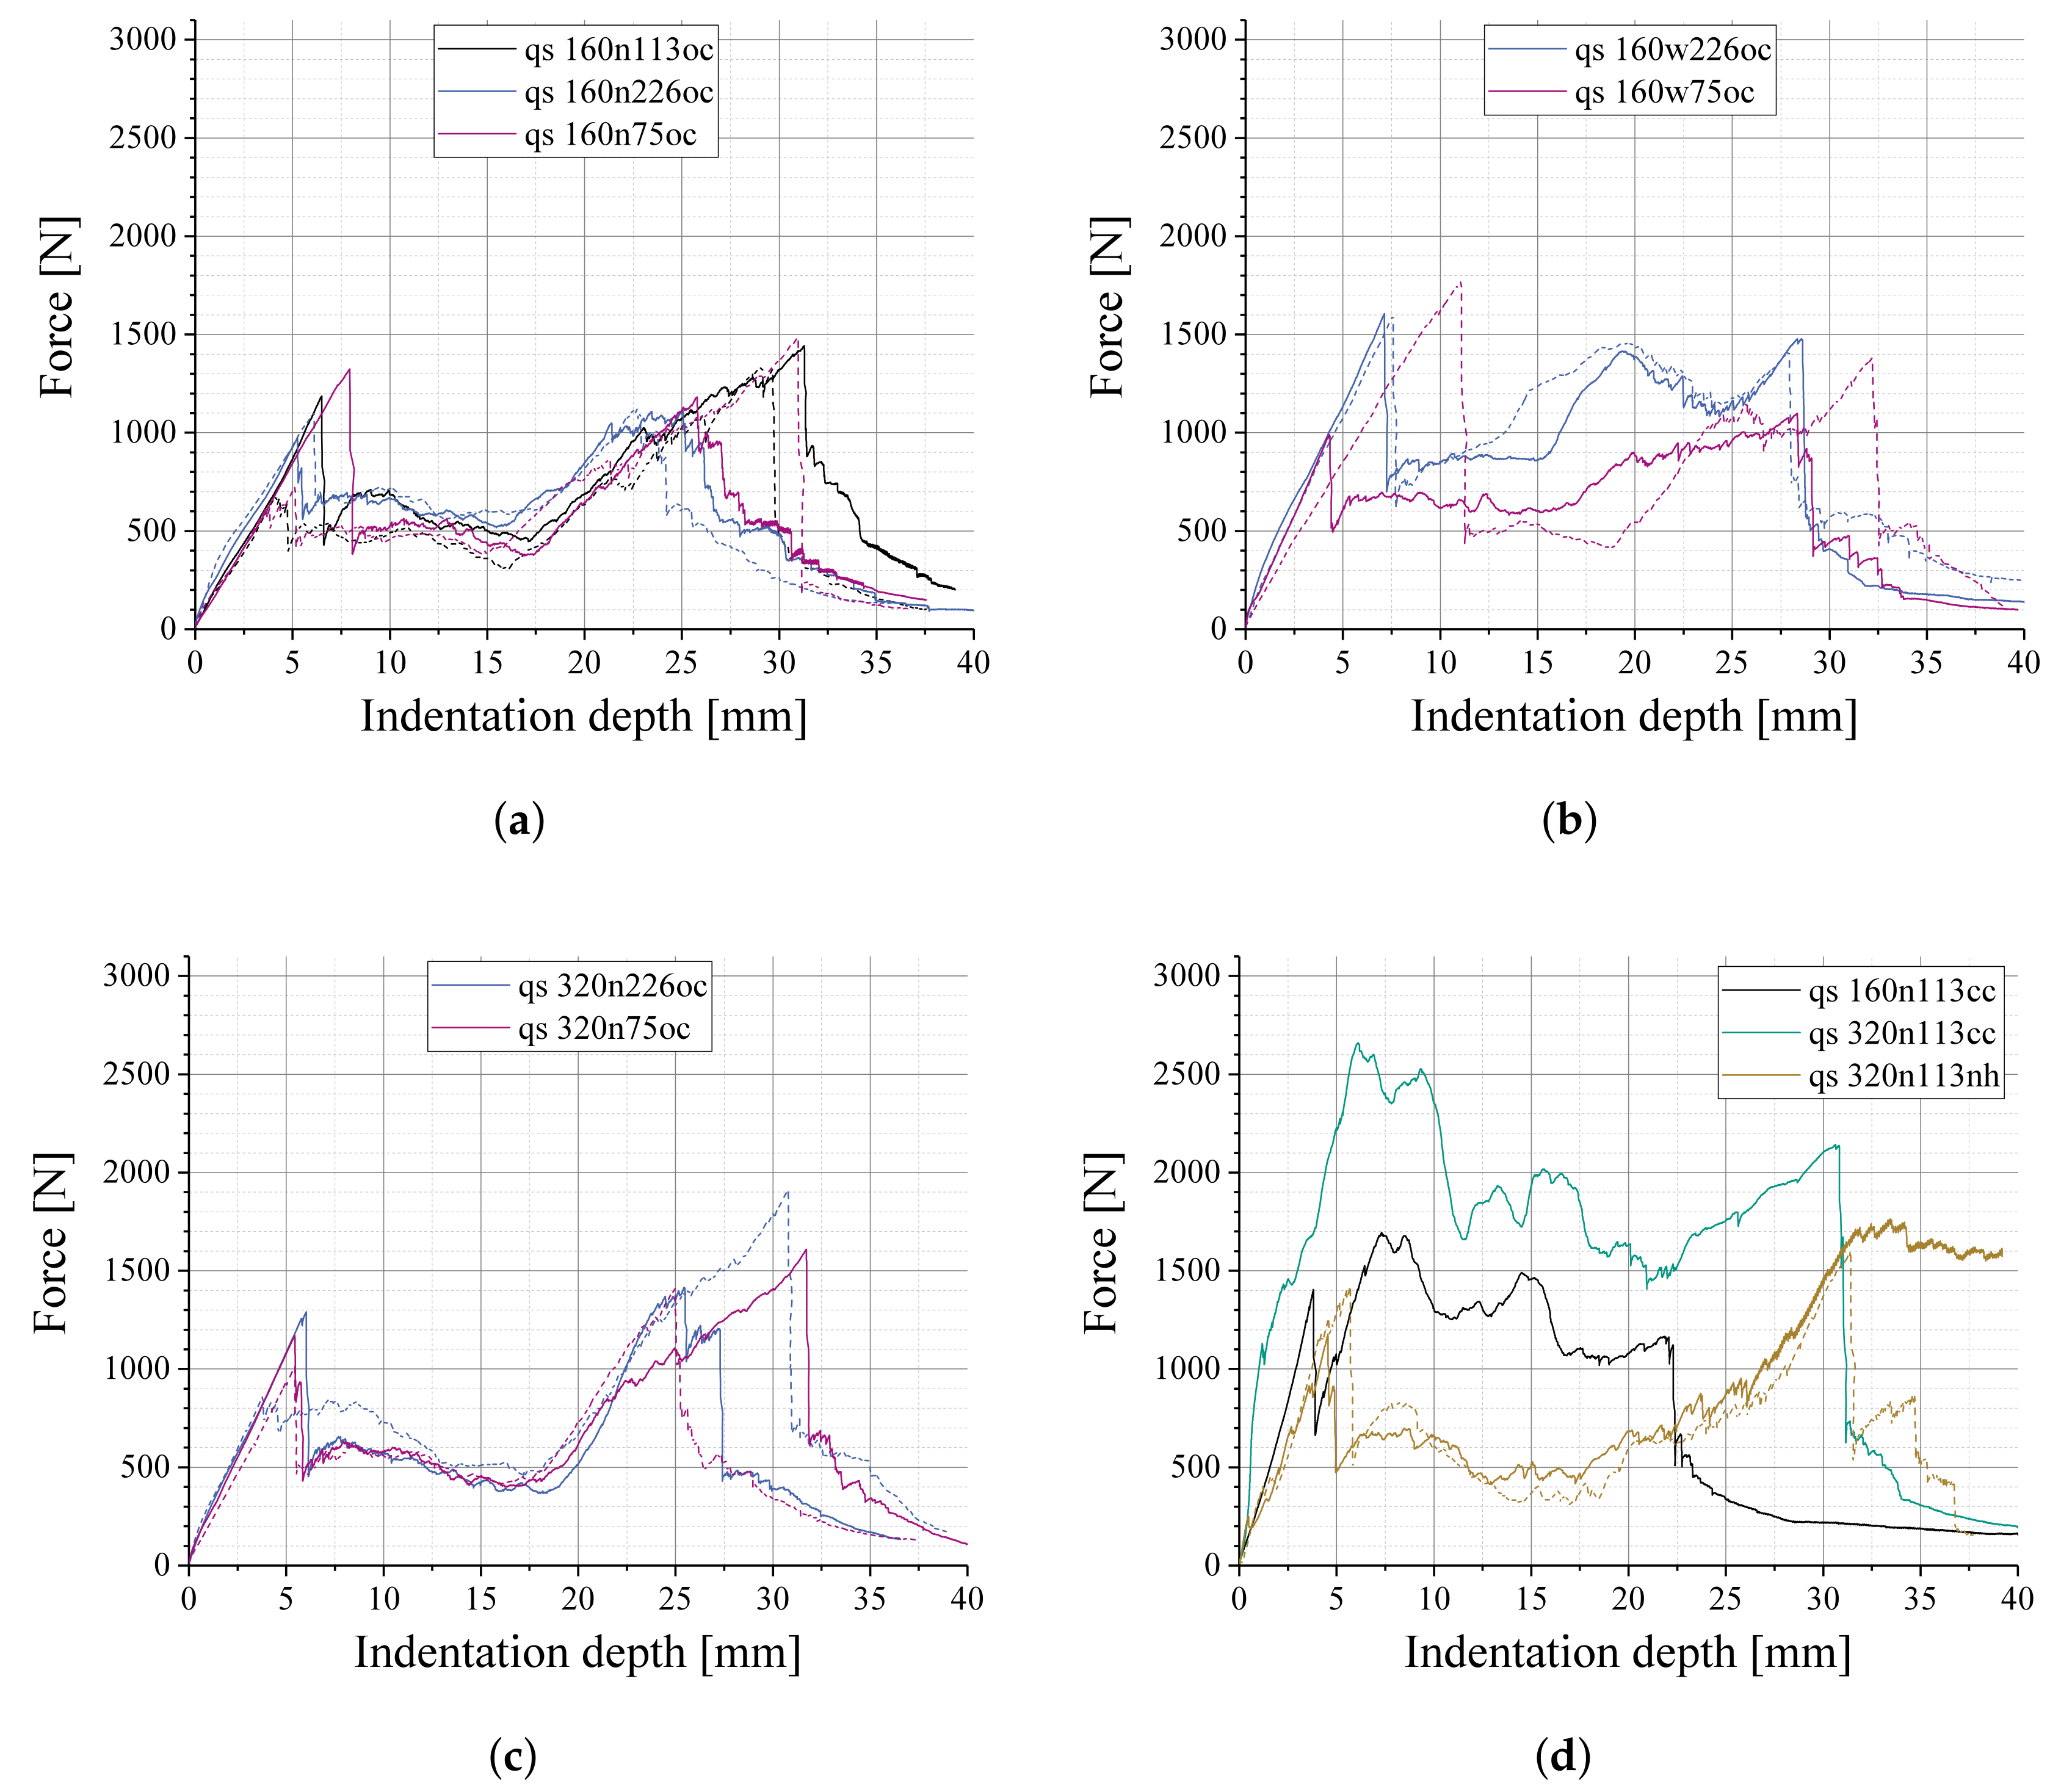
The force-indentation graphs from the quasi-static indentation tests shown in Figure 6 are grouped into four different varied parameter sets, equivalently to Figure 3. For reasons of completeness, the quasi-static indentation test results of the specimen configurations in Figure 4 are shown in Figure 7. Further specimen configurations are shown in Figure A2.
Figure 8 shows the DIC results from the quasi-static indentation tests, according to Figure 5. In this case, a calibrated stereo camera system with a higher resolution was used. The observed deformation pattern matches the pattern in the LVI tests. As the DIC shows more precise results with the quasi-static indentation tests, it is used to further comprehend the damage behavior observed in the LVI tests. With the higher camera resolution, a more refined pattern can be observed for the woven face sheets (Figure 8b): additional to the cross-shaped pattern with approximately zero deformation in fiber-direction, the mesh-like shape of the fiber textile is visible. In the case of specimens with NCF face sheets (Figure 8a), a quite homogeneous deformation pattern with circular topography is observed, not showing any trace of fiber direction in the pattern.
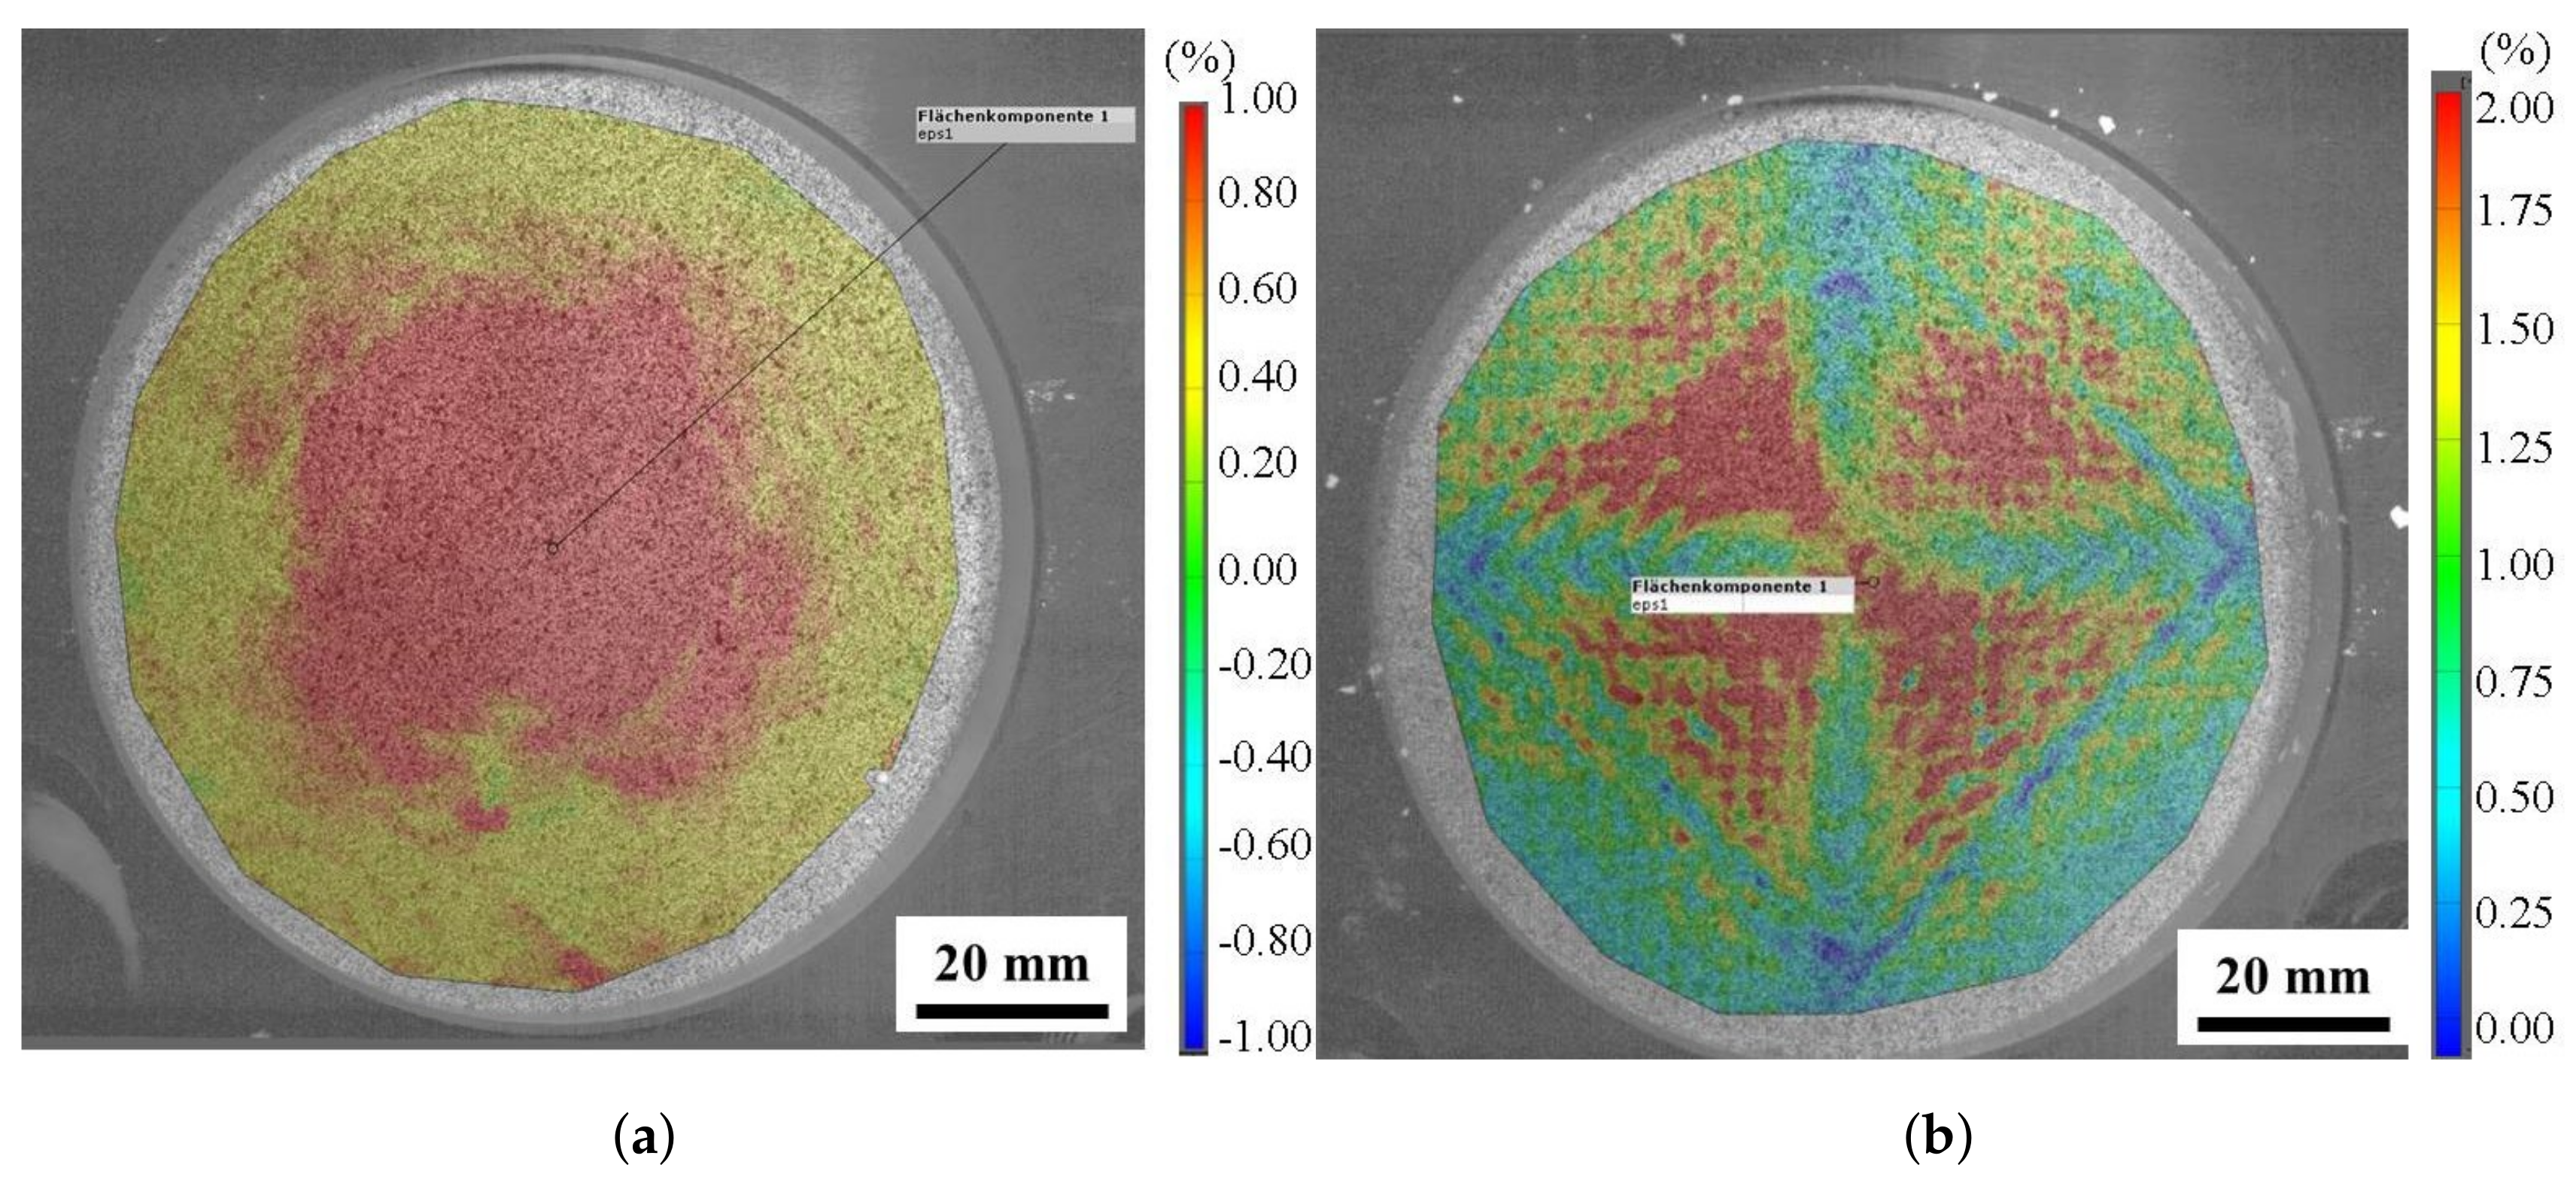
The fiber area weight was noticed to be a further influence on the deformation behavior. Figure 9 shows the DIC results for two specimens with different fiber area weight, at the moment directly before the penetration of the lower face sheet. Both pictures were scaled equally. The specimen with the lower face sheet fiber area weight (Figure 9a) shows a concentrated deformation around the indenter in the specimen center, whereas the specimen with the higher face sheet fiber area weight (Figure 9b) shows a deformation pattern more distributed across the hole of the support plate.
4.3. In Situ CT Indentation
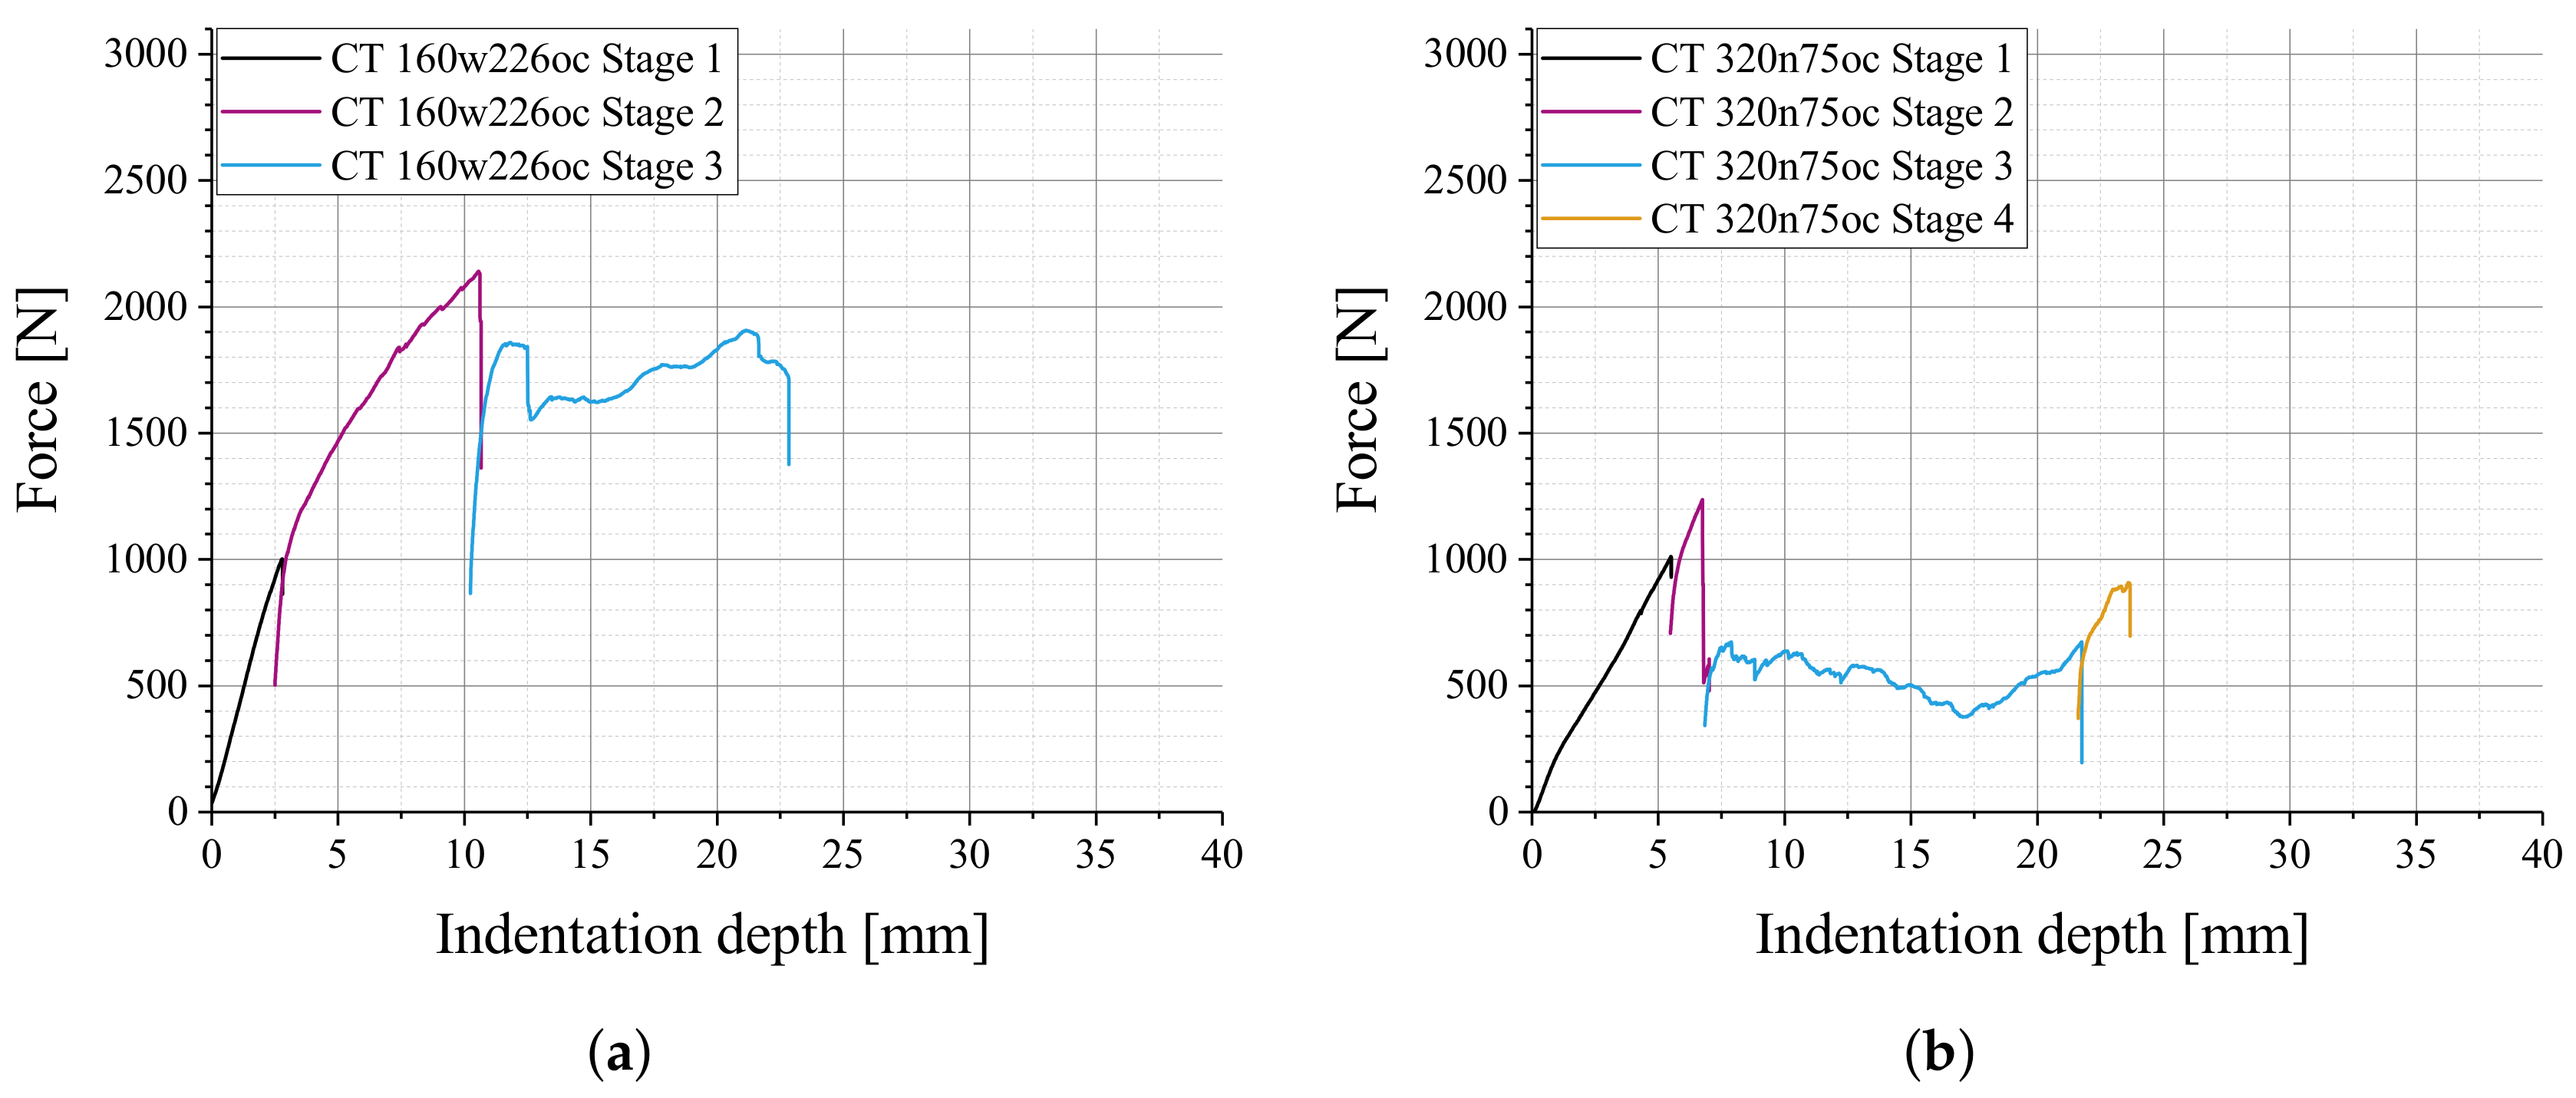
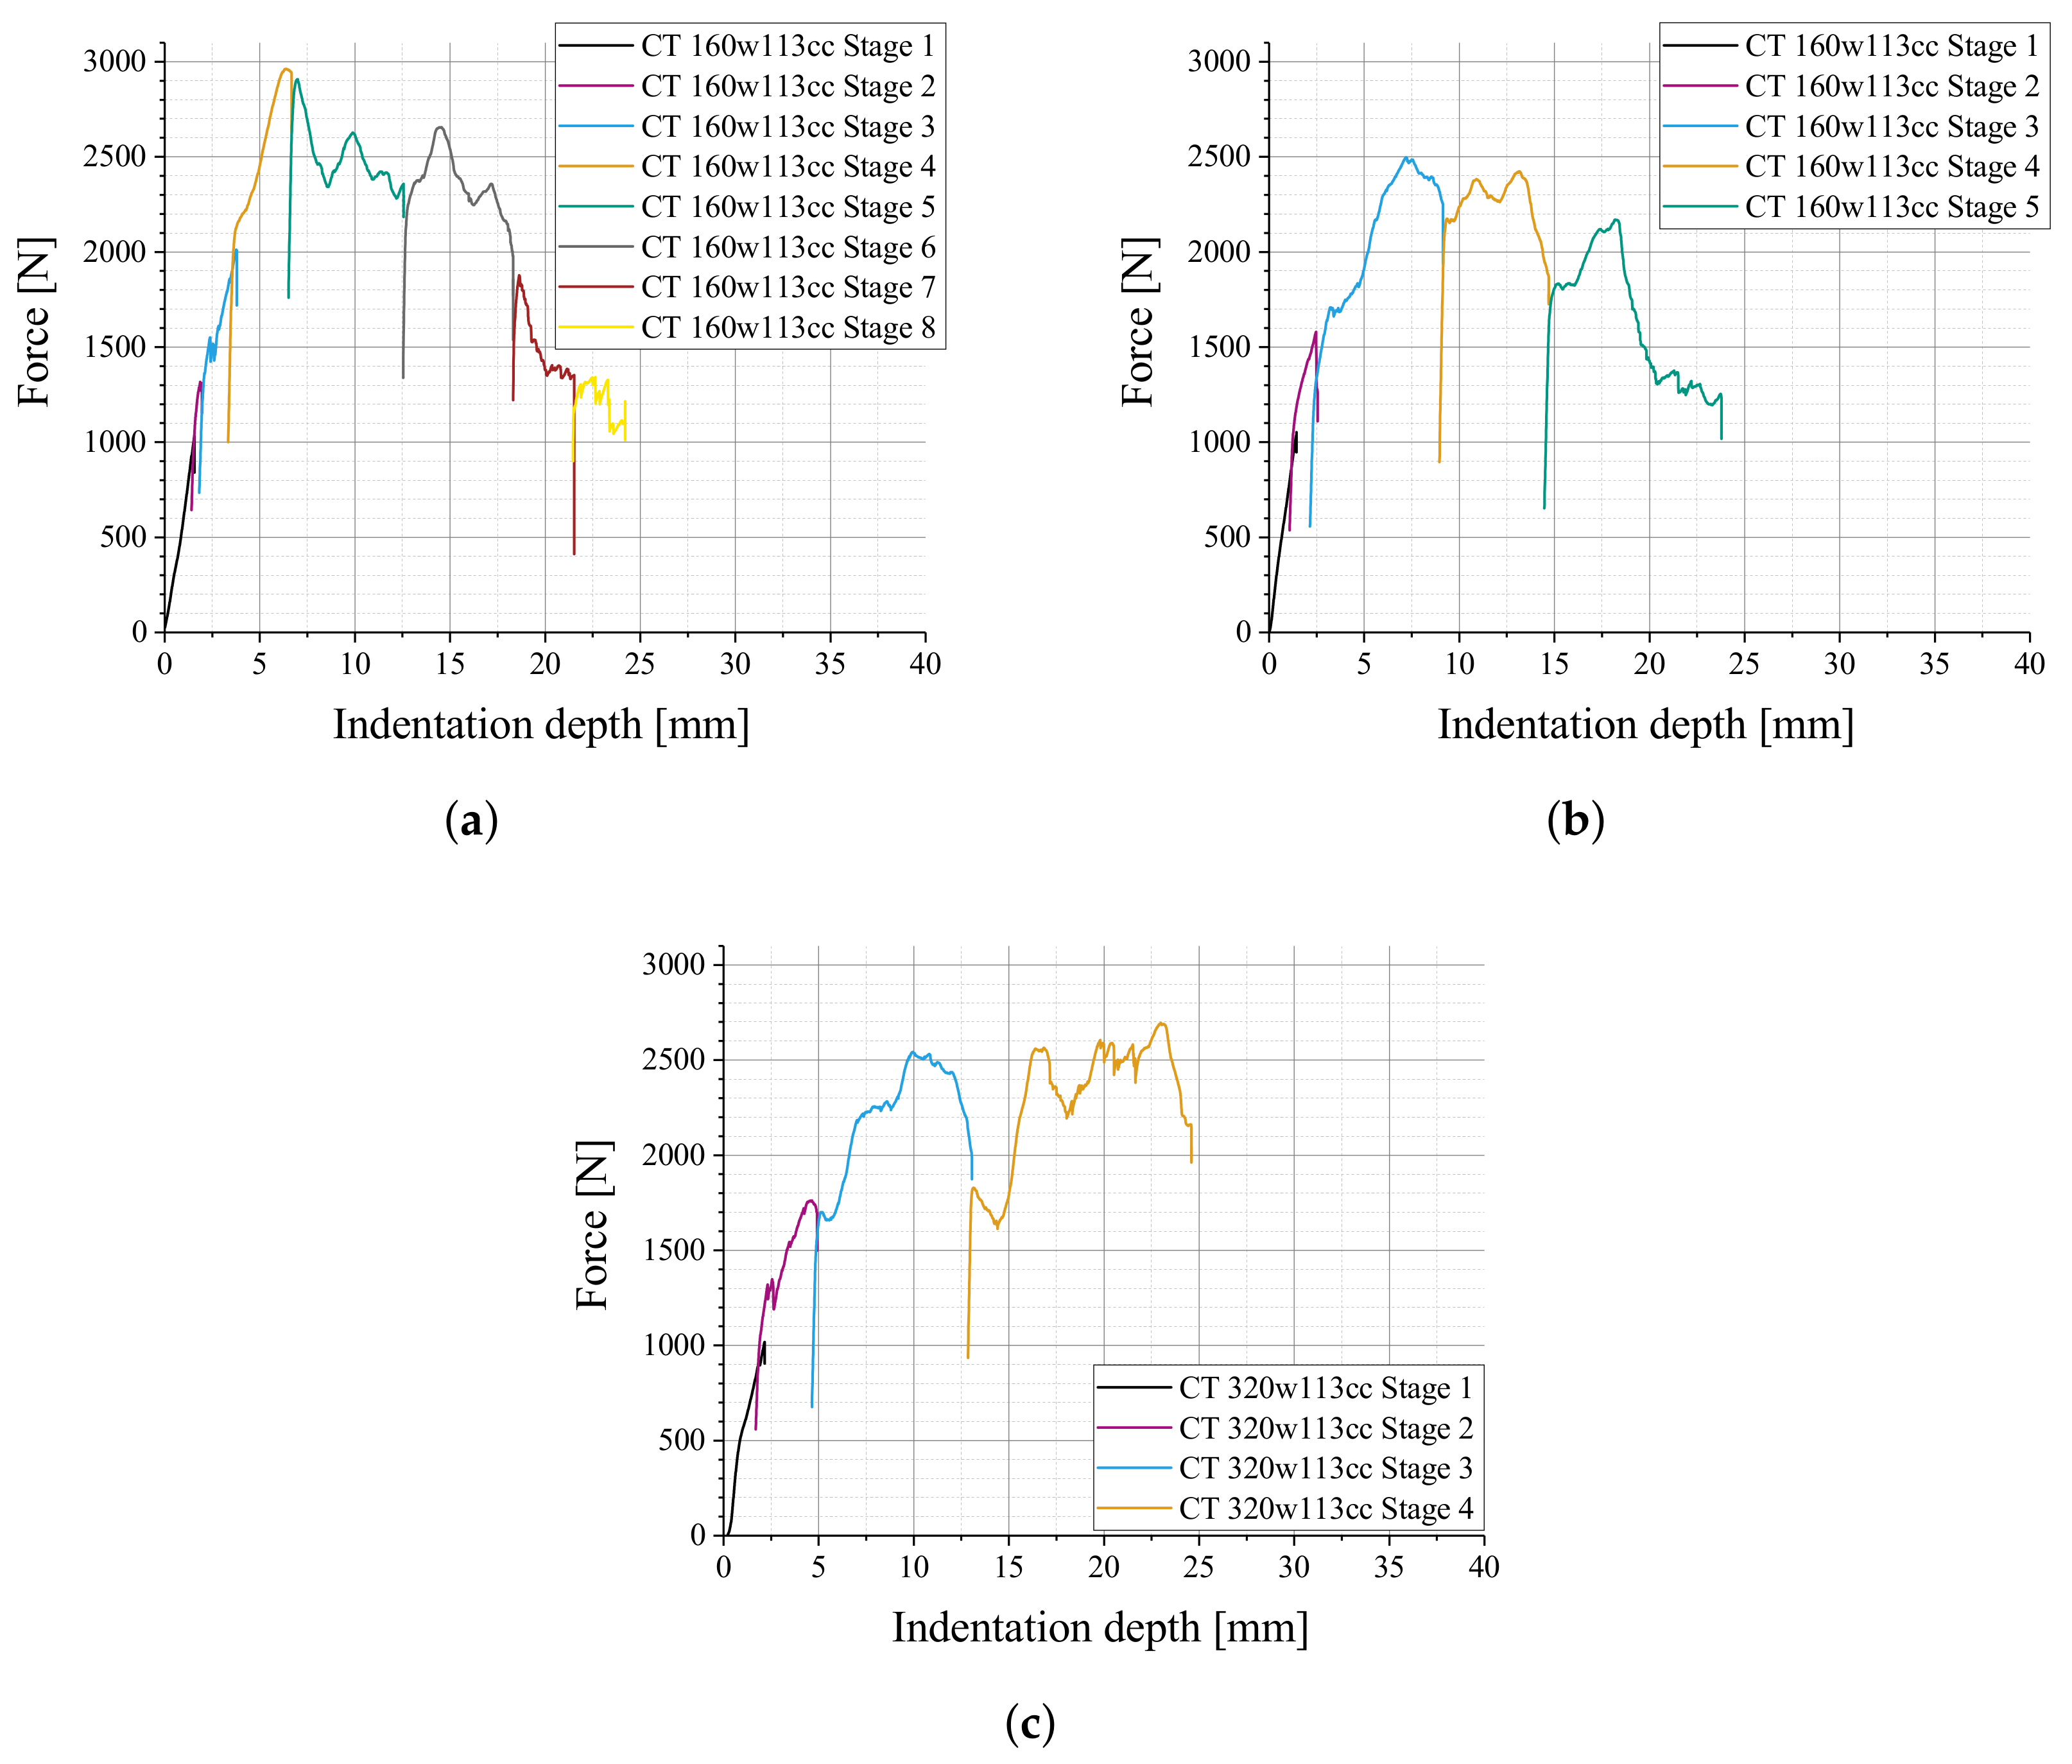
Although the geometry of the in situ PMMA-dome setup differed from the LVI and quasi-static indentation tests, qualitative observations in the load-indentation graphs (such as load drops) can be compared. Figure 10 shows an exemplary set of force-indentation graphs, measured in four stages. In Figure 10a, the original data obtained from the universal testing machine is shown. For each stage, the indentation travel was reset to zero, in order to prevent errors due to the removal and re-installing of the PMMA globe. In Figure 10b, the resulting force-indentation graph is shown, with the initial indentation depth for stages 2–4 resulting from the CT-scans in between the stages.
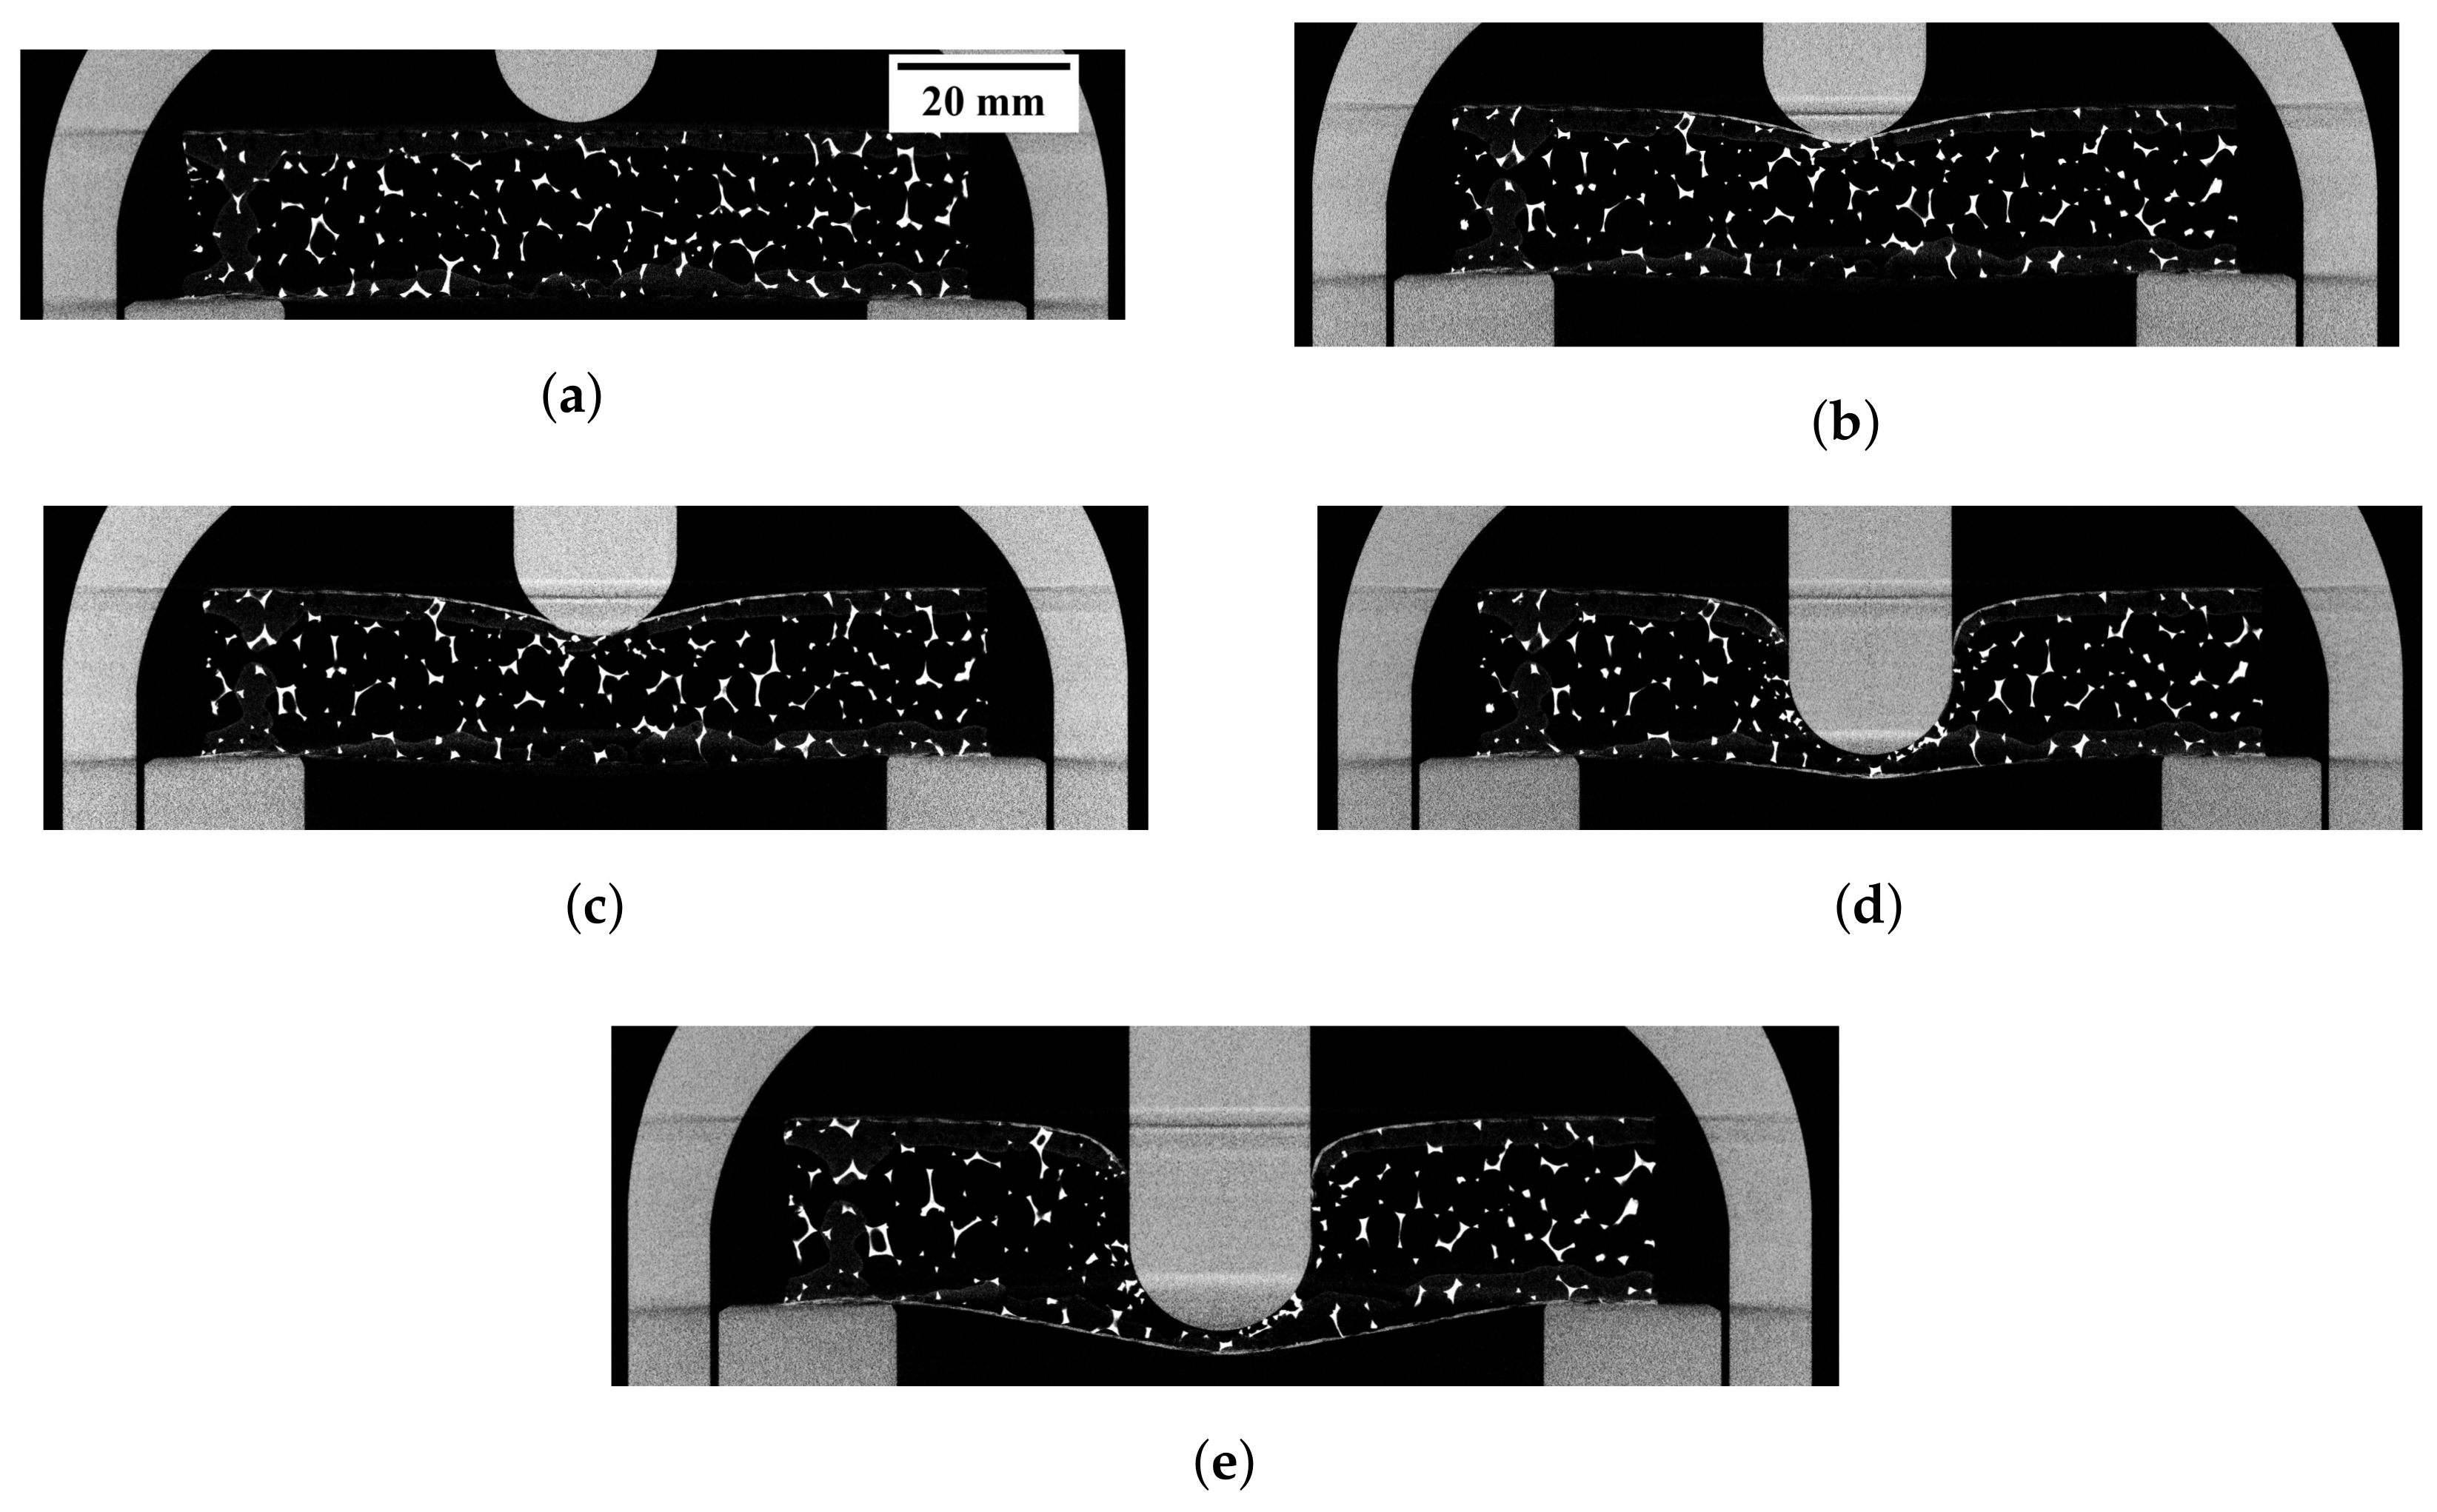
From the X-ray CT scans, characteristic behaviors of the force-indentation-graphs were investigated. Almost all specimens show a load drop in the force-indentation graph at approximately 5 mm indentation depth. Figure 11 shows the sample with 320w113oc configuration from the graph in Figure 10b, at the end of each stage. In stage 2, the indentation test was halted immediately after the load drop occurred. In the corresponding CT-scan (Figure 11c), the face sheet is seemingly intact, although a crack might be too small to be visible in the scan. It is plausible that the load drop after stage 2 is the moment of fiber rupture, as no other load drop was observed, and the face sheet is clearly torn after stage 3: in the CT-scan at the end of stage 3 (Figure 11d), the indenter has pushed through the upper face sheet and most of the core, and creates a visible indentation on the lower face sheet. It should be noted that the horizontal artifacts visible in the indenter and dome structure are caused by the image reconstruction process and have no further significance.
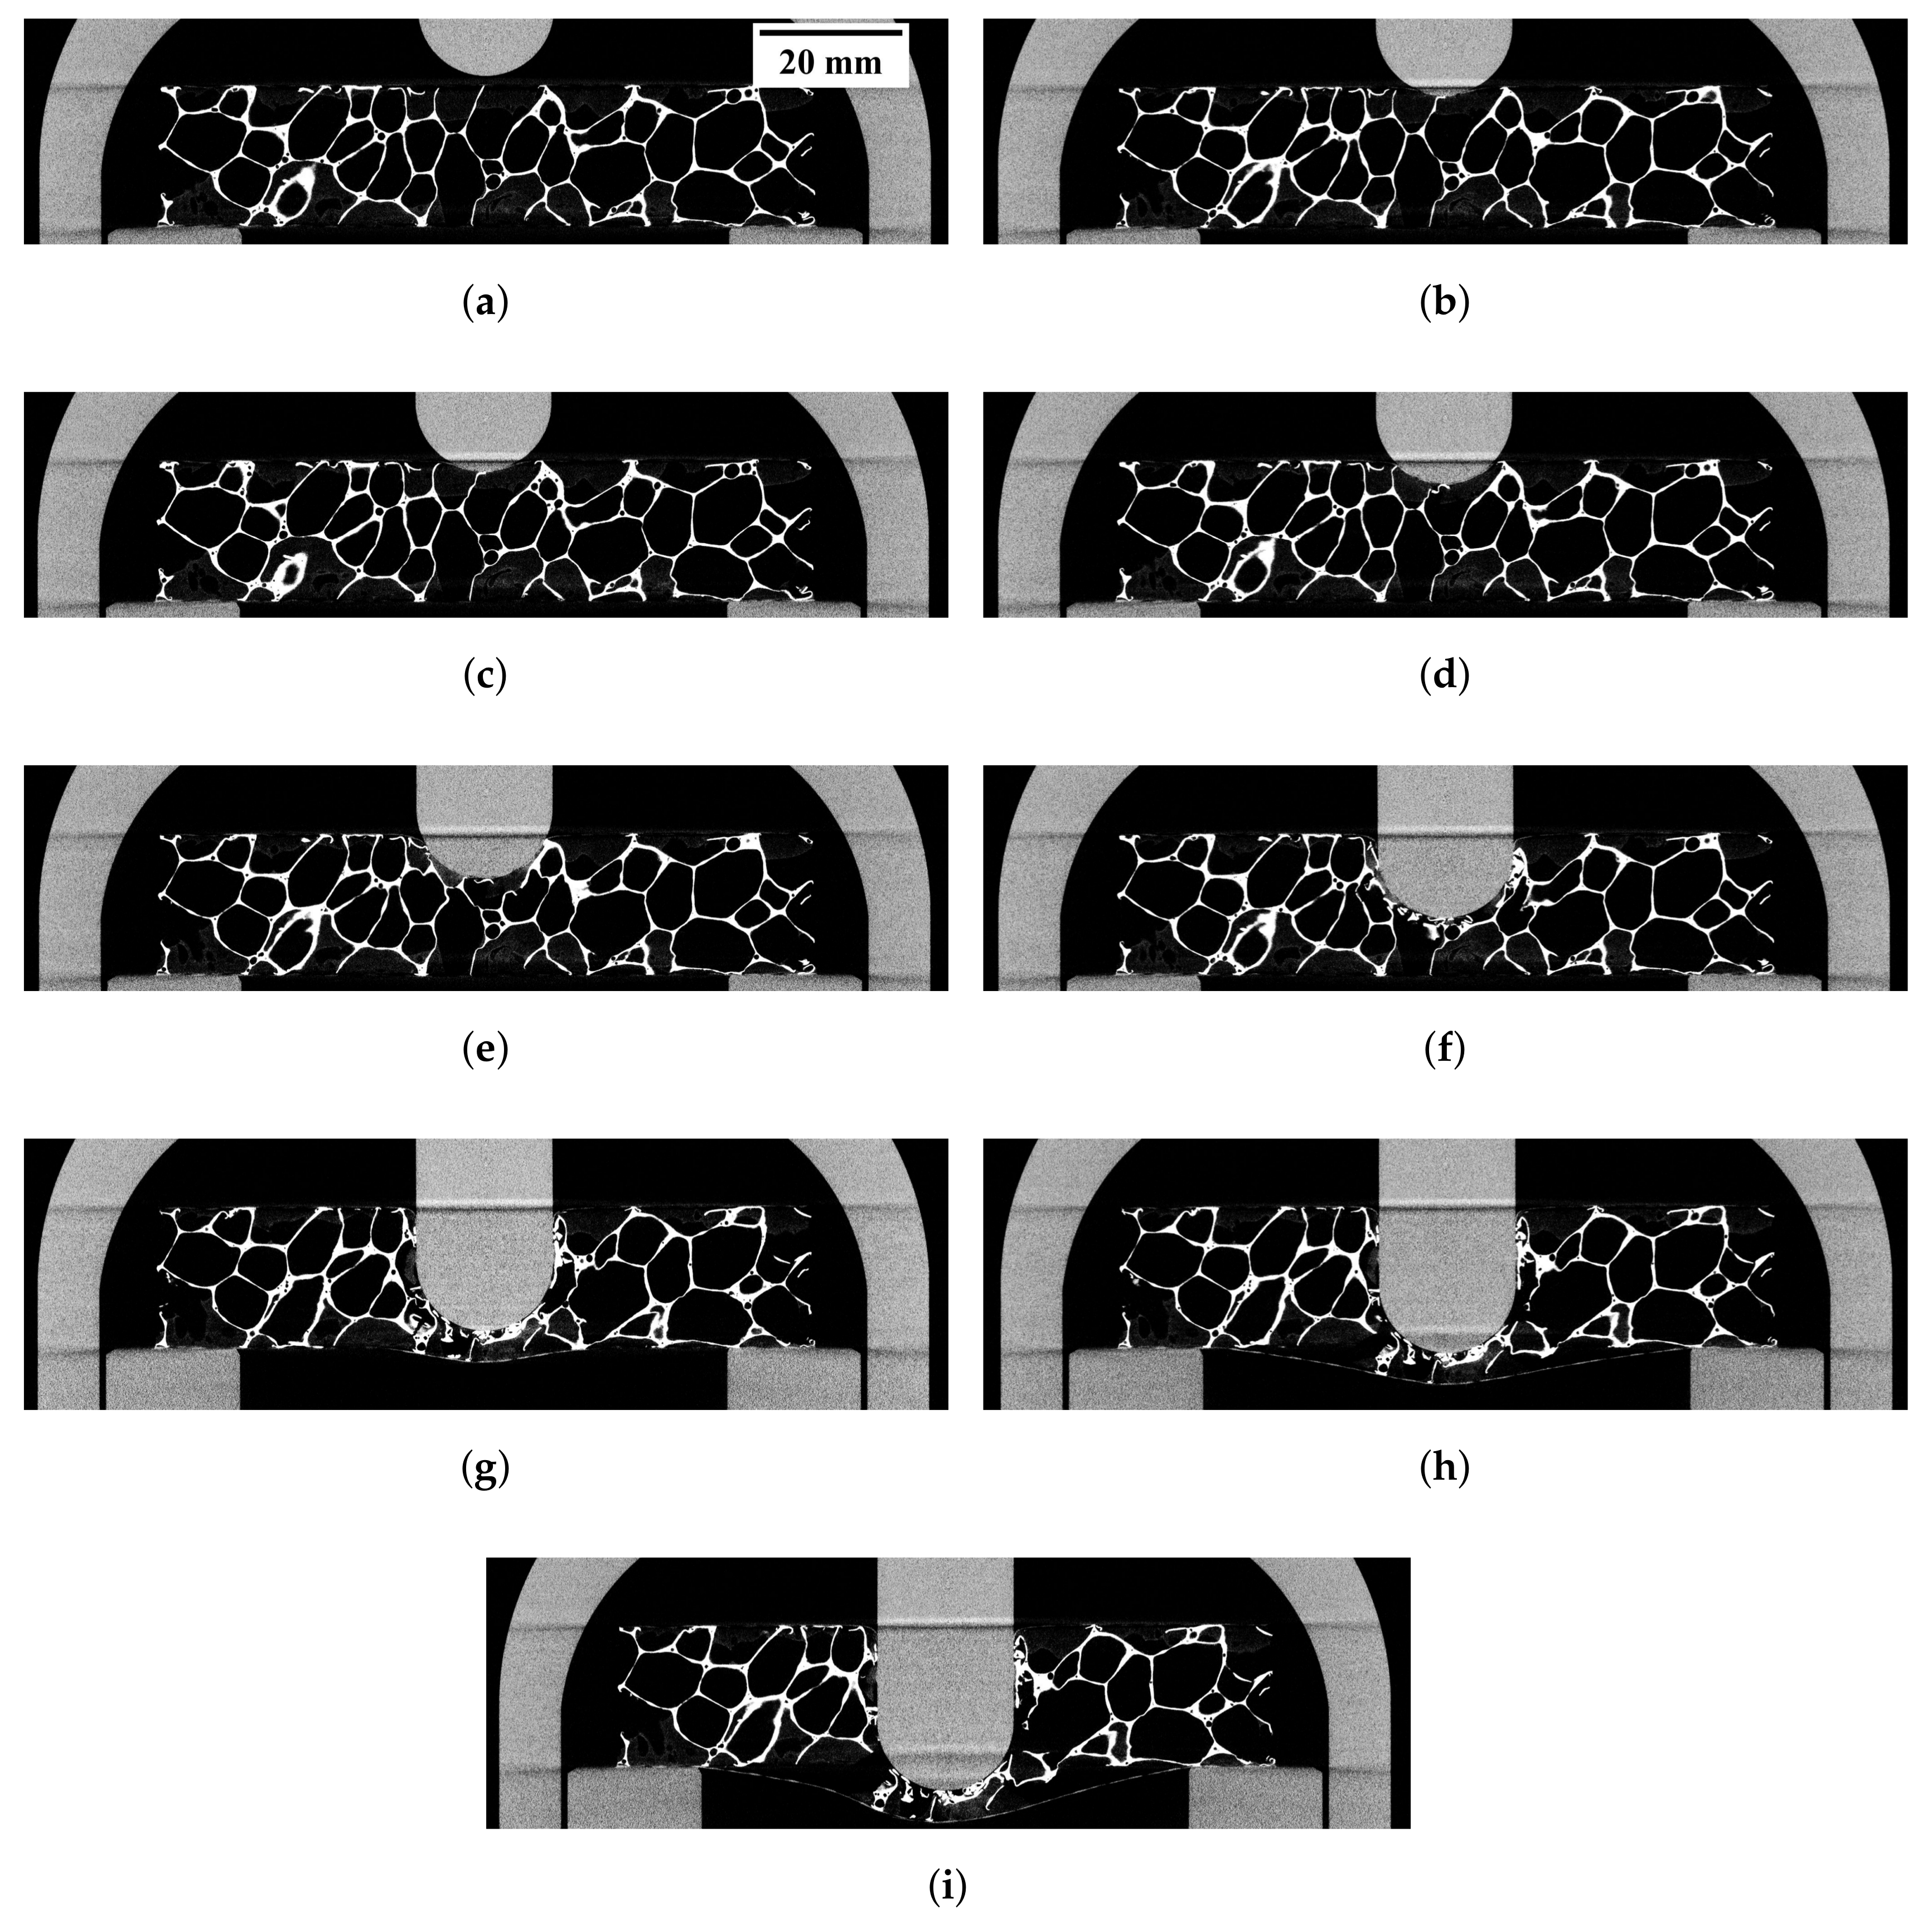
The CC-core specimens in Figure 12 do not show the kind of load drop visible in the OC-core specimen (Figure 10b). This is also observed in many of the LVI and quasi-static indentation tests: only the 320w113cc-specimens in the quasi-static indentation tests (Figure 6d, green curves) and one 160n113cc-specimen (Figure A2d, black curve) show a load drop at approximately 5 mm indentation, and most of those show a significant incline of the force directly afterwards. The CT scans in Figure 13 (160w113cc specimen, corresponding to graph in Figure 12a) show an indentation behavior resembling a punching procedure, showing almost no overall bending of the specimen. The deflection of the lower face sheet is accompanied not by a bending of the core structure (as observed for the OC specimen in Figure 11), but by a detachment of the face sheet from the core. Further specimen configurations are shown in Figure A3.
5. Discussion
5.1. Conformity of LVI and Quasi-Static Indentation Behavior
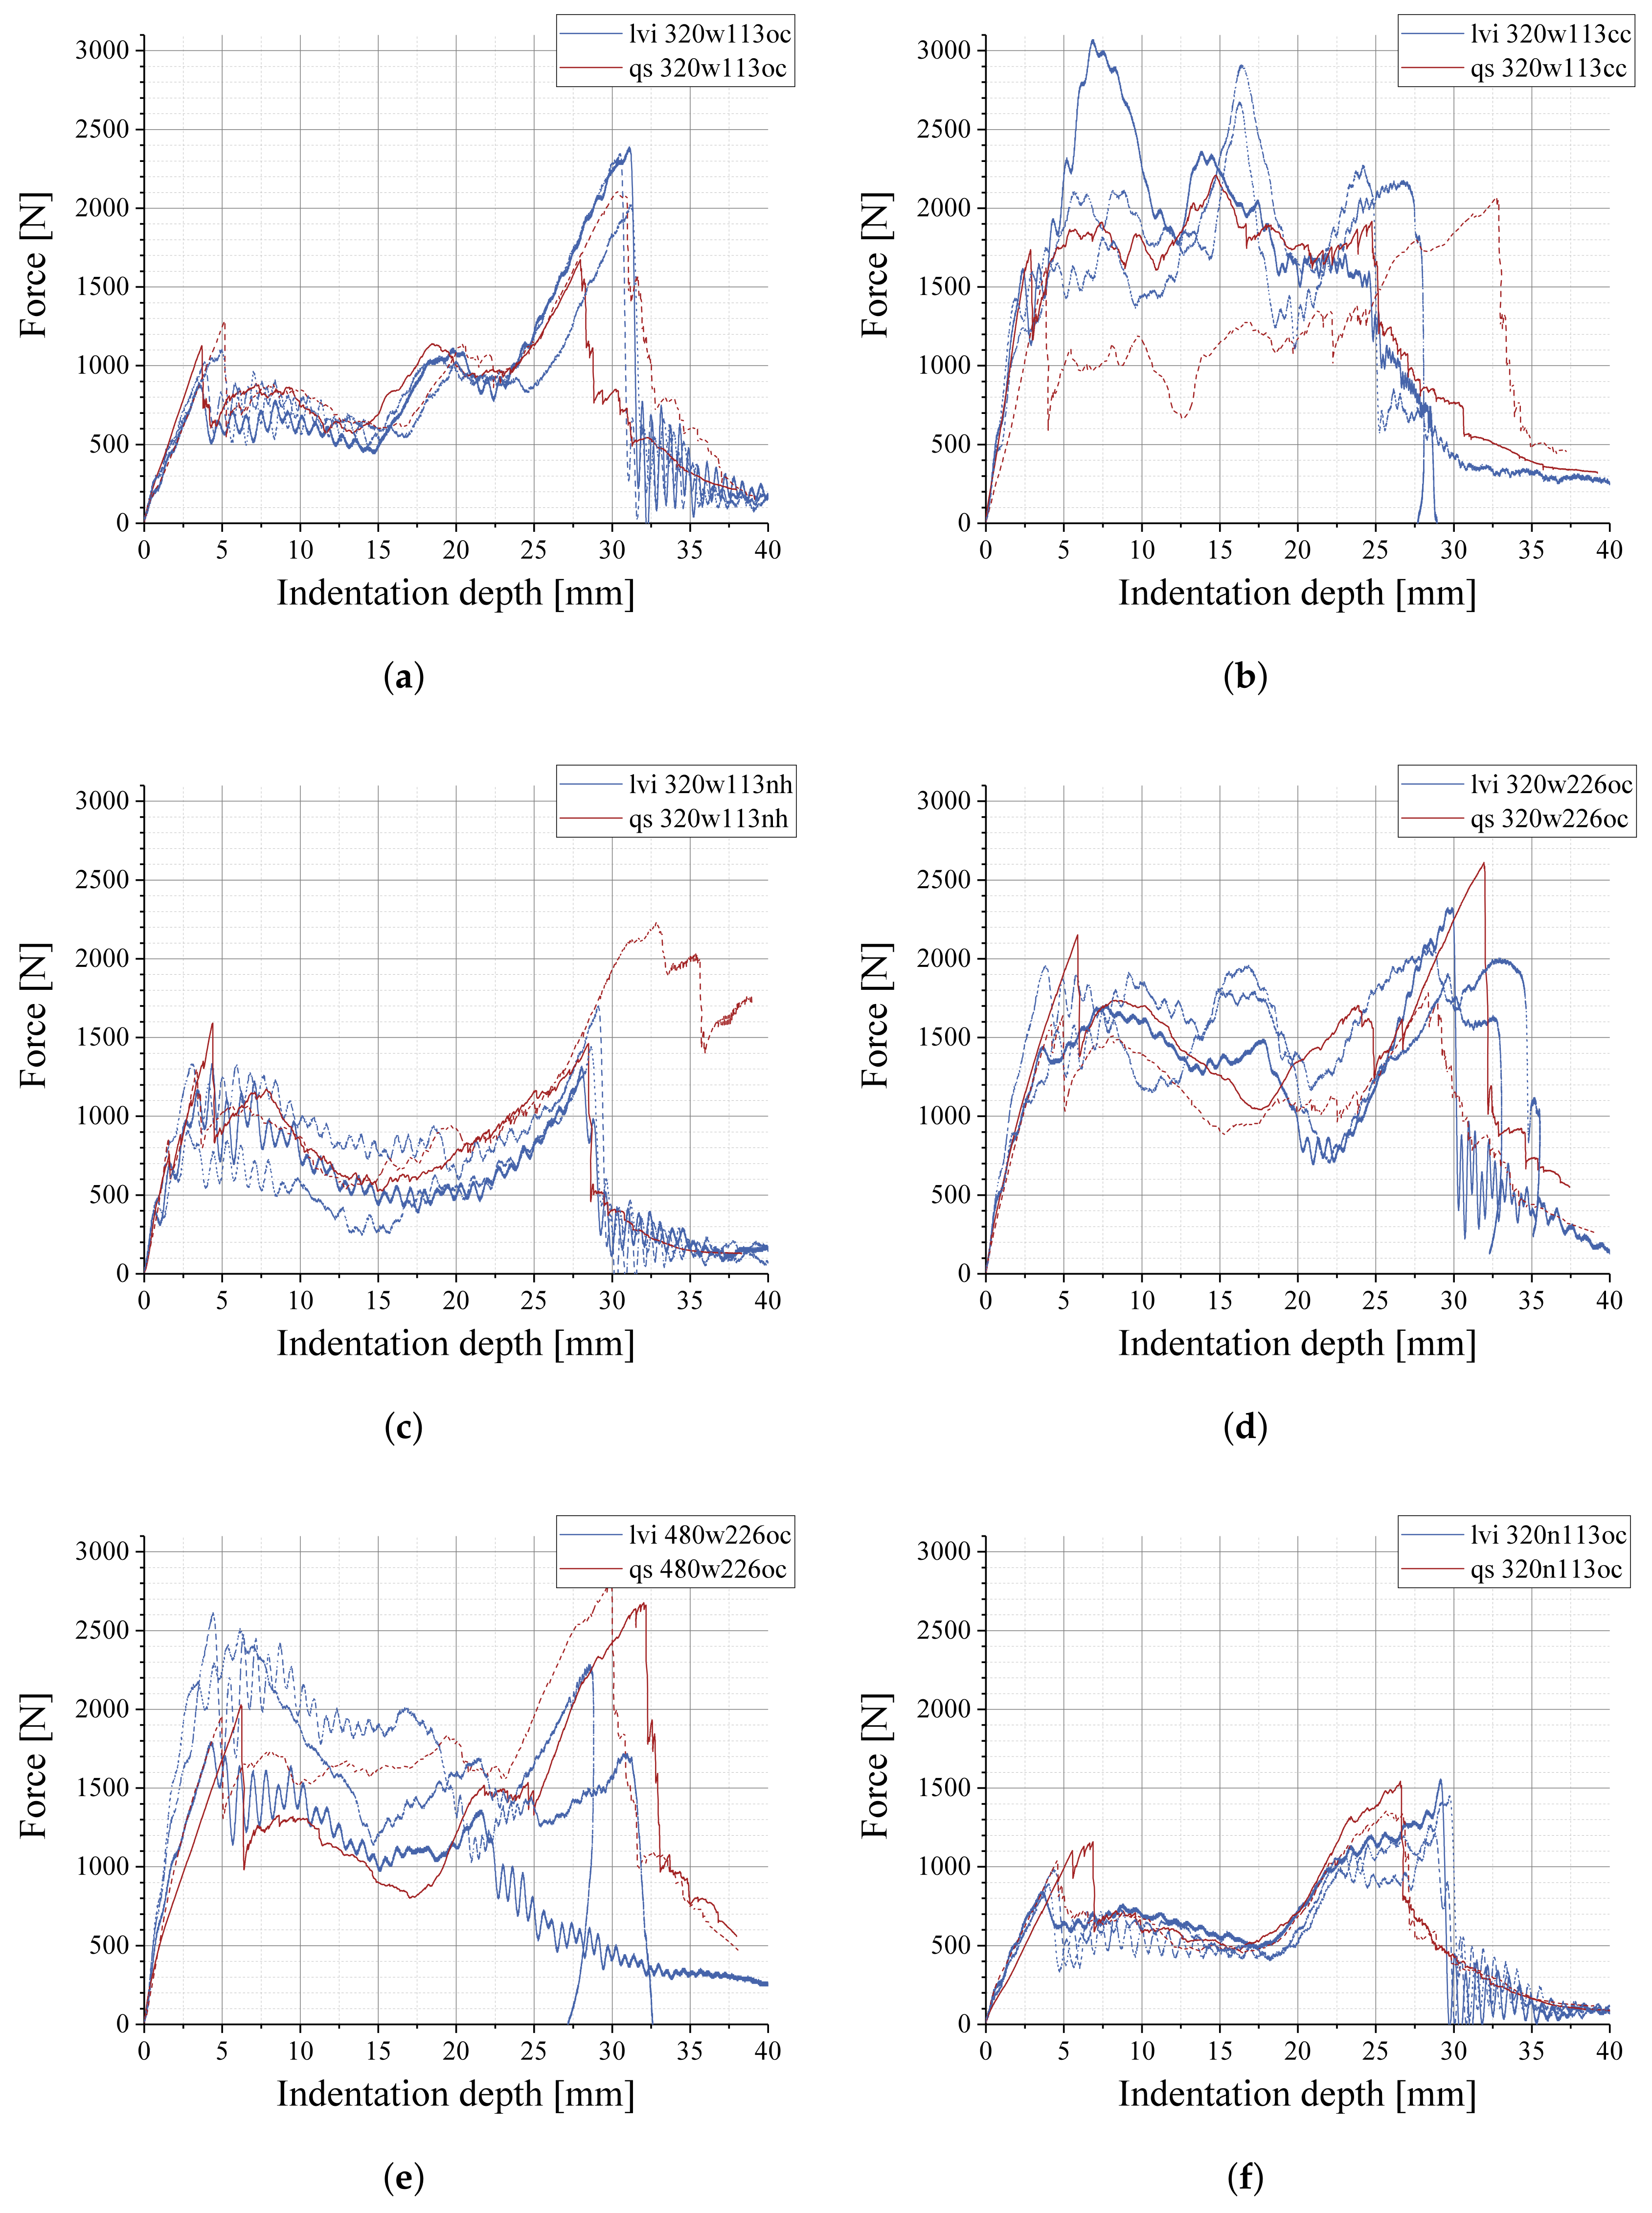
In Figure 14, the force-indentation graphs from the LVI tests (Figure 3) and the quasi-static indentation tests (Figure 6) are compared. As Figure 14 illustrates, they show good conformity. This is in accordance with the observations made by Crupi et al. [7,8], and differs from the observations made by Li et al. [12] and Mines et al. [13], who observe influences by impact speed and thus cannot reach conformity of LVI and quasi-static tests. Deviations occurred only for few specimens: one CC specimen (Figure 14b, pale red curve) shows a behavior similar to the OC an NH type core specimens in the quasi-static indentation test. One NH-type specimen fails at a higher force value, higher indentation value and a smaller load drop (Figure 14c, pale red curve), but otherwise shows the same behavior as the LVI specimens. One specimen with a 480 g/m woven face sheet (Figure 14e, blue curve) lacks the second large load drop at approximately 30 mm indentation depth. In general, both the force levels, the shape, and the indentation levels of events, such as load drops or plateau segments occuring, match well for all parameter sets. Figure 14 shows examples for each configuration parameter: different cores are displayed in Figure 14a–c; a larger PUR quantity in Figure 14d, a 480 g/m face sheet in Figure 14e, and an NCF face sheet in Figure 14f.
As Figure 5 and Figure 8 show, the deformation behavior before the penetration of the lower face sheet is also similar for the LVI and the quasi-static indentation test. However, the cross-shape deformation of the woven specimen in the LVI test (Figure 5b) bears a higher deformation value than its environment—opposite to the cross-shape deformation in the quasi-static test (Figure 8b). This is likely to be an effect caused by the camera system: the single camera used in the LVI tests can only record the out-of-plane deformation based on the increasing spray pattern size of the approaching face sheets, whereas the stereo-camera system used in the quasi-static indentation tests can actually measure in-plane deformations on the deformed face sheet surface. As a result, the LVI DIC-data shows a cross-shaped pattern of the out-of-plane deformation, and the quasi-static DIC-data shows a cross-shaped pattern of the lower in-plane deformation in fiber direction.
The good resemblance of force-indentation graphs is not the case for the in situ CT specimens, as their geometry (particularly the width-to-height ratio and the diameter of circular hole of the support plate) significantly differs. This causes a different deformation behavior, especially at large indentation depths. Deformations in the upper face sheet, which were not located near the indentation spot, did not occur in the LVI and quasi-static tests, but could be observed in the in situ indentation tests.
The assembly of the individual force-indentation curves for each stage (see Figure 10) shows transition points with apparent settling effects. These are likely to be caused by the re-mounting of the PMMA dome inside the testing machine, which was done by manually adjusting the load to a level close to, but under no circumstance higher than the final load value of the previous stage. The fixation of the indenter was loosened after the load adjustment, thus the subsequent stage was carried out starting from a lower load value. However, since the initial indentation value was based on the X-ray CT image data, no accumulating measuring error was created. Thus, the qualitative evaluation of characteristic events in the force-indentation graphs was possible.
5.2. Indentation Behavior
The comparison of the force-indentation graphs with the CT data (Figure 10 and Figure 12), together with the reconstructed images (Figure 11 and Figure 13), indicates that large load drops are caused by the penetration of a face sheet, and load plateaus are caused by the penetration of the core structure. In the LVI-tests, the load drop caused by the penetration of the lower face sheet is accompanied by a diminishing oscillation of the force, plausibly caused by inertia of the indenter. This is consistent with the results presented by Han et al. [14], Mines et al. [13] and Crupi et al. [8]. In some cases, the lower face sheet was separated from the core structure. This separation can not clearly be identified in the force-indentation graphs.
5.3. Influence of Sandwich Configuration
The effect of the sandwich configuration parameters face sheet fiber area weight, face sheet architecture, PUR quantity, and core structure on the indentation behavior was investigated.
The main influence is caused by the core type. Figure 3d or Figure 6d show the LVI- and quasi-static indentation behavior for specimen configurations with different core structures and otherwise equal parameters. The OC core type (black curve) shows an initial load peak, followed by two consecutive load plateaus and a final load peak. The CC core type (cyan curve) does not show similar distinct load peaks and plateaus, but a higher overall load level. The NH core type (brown curve) shows a behavior resembling the OC type, but with only one distinct load plateau between the load peaks. As the final load drop of some of the CC specimens indicate an incomplete penetration of the fibers, the set of sandwich configurations is also compared with an 160 g/m face sheet (Figure 4 and Figure 7). These configurations show the same behavior as described for the 320 g/m specimens, except for the final load drop of the CC configuration, which indicates full penetration and does not show elastic deflection.
A similar influence is observed for the PUR quantity, as Figure 3c or Figure 6c show. The load peaks of the 320w226oc configuration (purple curve) at approximately 5 and 30 mm resemble the behavior of the otherwise equal configuration with standard PUR (320w113oc, black curve), but the overall load level is higher and less constant. The configuration with less PUR (320w75oc, blue curve) shows a similar behavior as the standard configuration. This indicates that a large PUR quantity stiffens the core in terms of indentation rigidity—an effect not observable in quasi-static compression testing of the described materials [22].
The face sheet fiber architecture does not appear to have a distinct influence on the force-indentation graph, although the peak load levels of the specimens with 320n113oc configuration (Figure 3b or Figure 6b, red curve) is lower than the standard configuration (320w113oc, black curve). The main difference between the specimens with NCF face sheets to the specimens with woven face sheets is the deformation behavior observed by DIC. Figure 8 shows specimens with 160 g/m face sheets, on the left with an NCF architecture and on the right with a woven architecture. The specimen with the woven face sheet has only one layer of textile, leading to a distinct weave pattern visible on the surface. Additionally, a global cross-shaped deformation pattern is visible. In contrast, the specimens with NCF face sheets show no fiber-induced deformation patterns, but an almost isotropic deformation, even without an observable influence of the global 0/90 fiber direction. As there are no further differences from the specimen configurations except for the weave, this observation is very likely caused by the different path of load distribution: the woven face sheets have a web of interlocking weave intersections, whereas the NCF face sheets distribute the load perpendicular to the fibers through the PUR matrix even within each 0/90 layer. At high load levels, the weave pattern is not visible anymore, but a diamond-shaped global pattern indicating the fiber orientation can still be observed (Figure 9a). In Figure 9b, the deformation behavior is shown for 320 g/m woven face sheets. No weave pattern is visible, but the global cross-shaped pattern still exists. The lack of visible weave pattern could be a result of in-plane shift between the two textile layers, which could compensate the effect. More likely, however, it is a result of load distribution between the two layers of textile, as this is assumed to be the cause of the NCF deformation pattern. Interestingly, this seemingly substantial difference does not lead to large discrepancies in the overall indentation behavior.
The increased face sheet fiber area weight of specimen configuration 480w113oc (yellow curves in Figure 3a) effects a higher load level compared to the standard configuration (320w113oc, black curve). Decreased fiber area weight (bright blue curve) does not show a significantly different behavior from the standard configuration.
Together, this indicates that the magnitude of the load peaks is determined by the face sheets, whereas the deformation behavior between the load peaks is largely determined by the core structure.
The assumption of the initial and final load peaks being caused by the face sheet is supported by the observations made from the CT data. Additionally, the NCF configurations differ from the configurations with woven face sheets mainly in the magnitude of these load peaks. It is likely that the penetration of the NCF sheets is only partially caused by fiber rupture, but also accompanied by pushing the fibers aside. This is not possible with the woven fiber architecture, where the fibers have to be torn in order to be penetrated, creating a larger load peak.
The effects of face sheets and core seem to superpose: a 320 g/m face sheet combined with the rigid CC core can impede full penetration of the sandwich, at an impact energy level sufficient for full penetration of sandwich configurations with lighter face sheets or an OC core structure.
A quantitative comparison with results from literature was not considered reasonable, as the geometry of the test setup differs in many occasions: Crupi et al. [8,9] use specimens of similar sandwich configuration and a hemispherical indenter of 20 mm diameter, but use a significantly smaller specimen size (75 mm × 50 mm compared to 150 mm × 150 mm), and a smaller hole in the support plate (40 mm compared to 100 mm). Li et al. [12] use similar specimen sizes, but a fixed clamping and a larger indenter (38 mm diameter). Han et al. [14] instead use a smaller indenter (12.5 mm diameter).
Qualitatively, the deformation of the sandwich composites investigated in this contribution is closer to the sandwiches with aluminum face sheets and aluminum foam cores investigated by Crupi et al. [7,8,9] than to the sandwiches with FRP face sheets investigated by Li et al. [12]. The force-indentation behavior, however, shows more compliance to the specimens with fiber reinforced face sheets, as investigated by Li et al. [12], although the results by Han et al. [14] show a similar graph with two distinct load peaks caused by the face sheets. Although reinforced by continuous carbon fibers, the face sheets of the sandwich specimens investigated within this contribution can show an out-of-plane (i.e., bending) deformation related to a ductile material such as aluminum. Brittle behavior could be prevented by the foamed PUR matrix, although the in-plane deformation (i.e., tensile rupture) is nevertheless dominated by the fibers, which cause distinct load peaks when perforated.
6. Conclusions
The following conclusions can be drawn:
- LVI tests were conducted on a variety of sandwich configurations, accompanied and compared to quasi-static indentation tests, which were furthermore supported by DIC and CT measurements.
- The quasi-static indentation behavior of the investigated sandwich configurations is generally equal to the LVI behavior, including consistent force-indentation graphs and face sheet deformation. It was thus possible to describe the LVI behavior of the specimens with the more detailed data gained from the quasi-static and in situ CT tests, including DIC measurements.
- The failure of the first face sheet, the crushing of the core, and the failure of the second face sheet can be allocated in the force-indentation graphs, determined by observations made through in situ CT indentation tests, and consistent with literature.
- The face sheet configuration was shown to cause the load peaks observed at the start and the end of the indentation progress, and influence the maximum load level. Face sheets with higher face sheet fiber area weight, which could be generalized as ”face sheet thickness”, showed larger maximum force values. A woven architecture was shown to cause slightly higher maximum forces and less scatter than an otherwise equal NCF architecture. The DIC deformation pattern of woven face sheets also differs from the deformation pattern of NCF face sheets.
- The core type was shown to determine the overall load level and the section between the load peaks. CC cores were shown to cause higher load levels than NH and OC core structures, although the CC density was also higher.
- The PUR quantity stiffens the core structure. A large PUR quantity thus has the same effect as a denser core structure.
- The effects caused by each sandwich configuration parameter superpose, as was shown for an example of face sheet thickness and core structure.
Acknowledgments
This paper is based on investigations for the project EL 473/6-1, “Manufacturing, testing and modelling of hybrid aluminium foam-CFRP sandwiches with improved impact strength”, which is kindly supported by the German Research Foundation (DFG). The authors would like to thank the technicians in the lab, especially Marc Brecht, who helped to design the specimen support structure used in the experiments.
Author Contributions
Peter Rupp and Jonas Imhoff conceived and designed the experiments; Peter Rupp provided the materials; Jonas Imhoff performed the quasi-static and LVI experiments; Peter Rupp performed the in situ indentation tests; Peter Rupp and Jonas Imhoff analyzed the data; Peter Rupp wrote the paper. All presented work was conducted at the Hybrid and Lightweight Materials group under Kay André Weidenmann, who accompanied and supervised the research work, supported the data interpretation with his expertise, and thoroughly revised the paper.
Conflicts of Interest
The authors declare no conflict of interest. The founding sponsors had no role in the design of the study; in the collection, analyses, or interpretation of data; in the writing of the manuscript, and in the decision to publish the results.
Abbreviations
The following abbreviations are used in this manuscript:
| CFRP | carbon fiber reinforced plastic |
| CT | X-ray computed tomography |
| GFRP | glass fiber reinforced plastic |
| LVI | low-velocity impact |
| NCF | non-crimp fabric |
| PMMA | poly(methyl methacrylate), acrylic glass |
| PUR | polyurethane |
Appendix A. Force-Indentation Graphs of Further Sandwich Configurations
Figure A1.
LVI test results of further specimen configurations. (a) different PUR quantities with 160 g/m NCF face sheets; (b) different PUR quantities with 160 g/m woven face sheets; (c) different PUR quantities with 320 g/m NCF face sheets; (d) different core structures with NCF face sheets.
Figure A1.
LVI test results of further specimen configurations. (a) different PUR quantities with 160 g/m NCF face sheets; (b) different PUR quantities with 160 g/m woven face sheets; (c) different PUR quantities with 320 g/m NCF face sheets; (d) different core structures with NCF face sheets.

Figure A2.
Quasi-static indentation test results of further specimen configurations. (a) different PUR quantities with 160 g/m NCF face sheets; (b) different PUR quantities with 160 g/m woven face sheets; (c) different PUR quantities with 320 g/m NCF face sheets; (d) different core structures with NCF face sheets.

Figure A3.
In situ CT indentation test results for different sandwich configurations: (a) 160w226oc; (b) 320n75oc.
Figure A3.
In situ CT indentation test results for different sandwich configurations: (a) 160w226oc; (b) 320n75oc.
References
- Zenkert, D. (Ed.) The Handbook of Sandwich Construction; Engineering Materials Advisory Services Ltd. (EMAS): Cradley Heath, UK, 1997. [Google Scholar]
- Ashby, M.F. Materials Selection in Mechanical Design, 4th ed.; Elsevier: Amsterdam, The Netherlands, 2011. [Google Scholar]
- Allen, H.G. Analysis and Design of Structural Sandwich Panels: Commonwealth and International Library: Structures and Solid Body Mechanics Division; Elsevier: Oxford, UK, 1969. [Google Scholar]
- Bonanno, A.; Crupi, V.; Epasto, G.; Guglielmino, E.; Palomba, G. Aluminum honeycomb sandwich for protective structures of earth moving machines. Procedia Struct. Integr. 2018, 8, 332–344. [Google Scholar] [CrossRef]
- Dietrich, S.; Kuppinger, J.; Elsner, P.; Weidenmann, K. Small mass impact testing of sandwich structures. Mater. Test. 2010, 52, 765–770. [Google Scholar] [CrossRef]
- Crupi, V.; Montanini, R. Aluminium foam sandwiches collapse modes under static and dynamic three-point bending. Int. J. Impact Eng. 2007, 34, 509–521. [Google Scholar] [CrossRef]
- Crupi, V.; Epasto, G.; Guglielmino, E. Impact response of aluminum foam sandwiches for light-weight ship Structures. Metals 2011, 1, 98–112. [Google Scholar] [CrossRef]
- Crupi, V.; Epasto, G.; Guglielmino, E. Comparison of aluminium sandwiches for lightweight ship structures: Honeycomb vs. foam. Mar. Struct. 2013, 30, 74–96. [Google Scholar] [CrossRef]
- Crupi, V.; Kara, E.; Epasto, G.; Guglielmino, E.; Aykul, H. Prediction model for the impact response of glass fibre reinforced aluminium foam sandwiches. Int. J. Impact Eng. 2015, 77, 97–107. [Google Scholar] [CrossRef]
- Crupi, V.; Epasto, G.; Guglielmino, E. Internal damage investigation of composites subjected to low-velocity impact. Exp. Tech. 2016, 40, 555–568. [Google Scholar] [CrossRef]
- Crupi, V.; Kara, E.; Epasto, G.; Guglielmino, E.; Aykul, H. Theoretical and experimental analysis for the impact response of glass fibre reinforced aluminium honeycomb sandwiches. J. Sandw. Struct. Mater. 2016, 20, 42–69. [Google Scholar] [CrossRef]
- Li, Z.; Zheng, Z.; Yu, J. Low-velocity perforation behavior of composite sandwich panels with aluminum foam core. J. Sandw. Struct. Mater. 2013, 15, 92–109. [Google Scholar] [CrossRef]
- Mines, R.; Worrall, C.M.; Gibson, A.G. Low velocity perforation behaviour of polymer composite sandwich panels. Int. J. Impact Eng. 1998, 21, 855–879. [Google Scholar] [CrossRef]
- Han, M.S.; Cho, J.U. Impact damage behavior of sandwich composite with aluminum foam core. Trans. Nonferr. Met. Soc. China 2014, 24, s42–s46. [Google Scholar] [CrossRef]
- Wang, J.; Chen, B.; Wang, H.; Waas, A.M. Experimental study on the compression-after-impact behavior of foam-core sandwich panels. J. Sandw. Struct. Mater. 2015, 17, 446–465. [Google Scholar] [CrossRef]
- Topac, O.T.; Gozluklu, B.; Gurses, E.; Coker, D. Experimental and computational study of the damage process in CFRP composite beams under low-velocity impact. Compos. Part A 2017, 92, 167–182. [Google Scholar] [CrossRef]
- Singh, H.; Gupta, M.; Mahajan, P. Reduced order multiscale modeling of fiber reinforced polymer composites including plasticity and damage. Mech. Mater. 2017, 111, 35–56. [Google Scholar] [CrossRef]
- Yudhanto, A.; Wafai, H.; Lubineau, G.; Yaldiz, R.; Verghese, N. Characterizing the influence of matrix ductility on damage phenomenology in continuous fiber-reinforced thermoplastic laminates undergoing quasi-static indentation. Compos. Struct. 2018, 186, 324–334. [Google Scholar] [CrossRef]
- Namala, K.K.; Mahajan, P.; Bhatnagar, N. Digital image correlation of low-velocity impact on a glass/epoxy composite. Int. J. Comput. Methods Eng. Sci. Mech. 2014, 15, 203–217. [Google Scholar] [CrossRef]
- Hassan, M.Z.; Cantwell, W.J. The influence of core properties on the perforation resistance of sandwich structures—An experimental study. Compos. Part B 2012, 43, 3231–3238. [Google Scholar] [CrossRef]
- Rupp, P.; Wafzig, F.; Weidenmann, K.A. The interface of CFRP face sheets and aluminum foam cores in hybrid sandwich panels manufactured by a PUR spraying process. In Proceedings of the 17th European Conference on Composite Materials, Munich, Germany, 26–30 June 2016. [Google Scholar]
- Rupp, P.; Elsner, P.; Weidenmann, K.A. Specific bending stiffness of in-mould-assembled hybrid sandwich structures with carbon fibre reinforced polymer face sheets and aluminium foam cores manufactured by a polyurethane-spraying process. J. Sandw. Struct. Mater. 2017. [Google Scholar] [CrossRef]
- Rupp, P.; Elsner, P.; Weidenmann, K.A. Failure mode maps for four-point-bending of hybrid sandwich structures with carbon fiber reinforced plastic face sheets and aluminum foam cores manufactured by a polyurethane spraying process. J. Sandw. Struct. Mater. 2017. [Google Scholar] [CrossRef]
- Schindelin, J.; Arganda-Carreras, I.; Frise, E.; Kaynig, V.; Longair, M.; Pietzsch, T.; Preibisch, S.; Rueden, C.; Saalfeld, S.; Schmid, B.; et al. FIJI: An open-source platform for biological-image analysis. Nat. Methods 2012, 9, 676–682. [Google Scholar] [CrossRef] [PubMed]
Figure 1.
Test setup: (a) Low velocity impact testing (LVI) drop tower setup; (b) quasi-static indentation test setup.
Figure 1.
Test setup: (a) Low velocity impact testing (LVI) drop tower setup; (b) quasi-static indentation test setup.
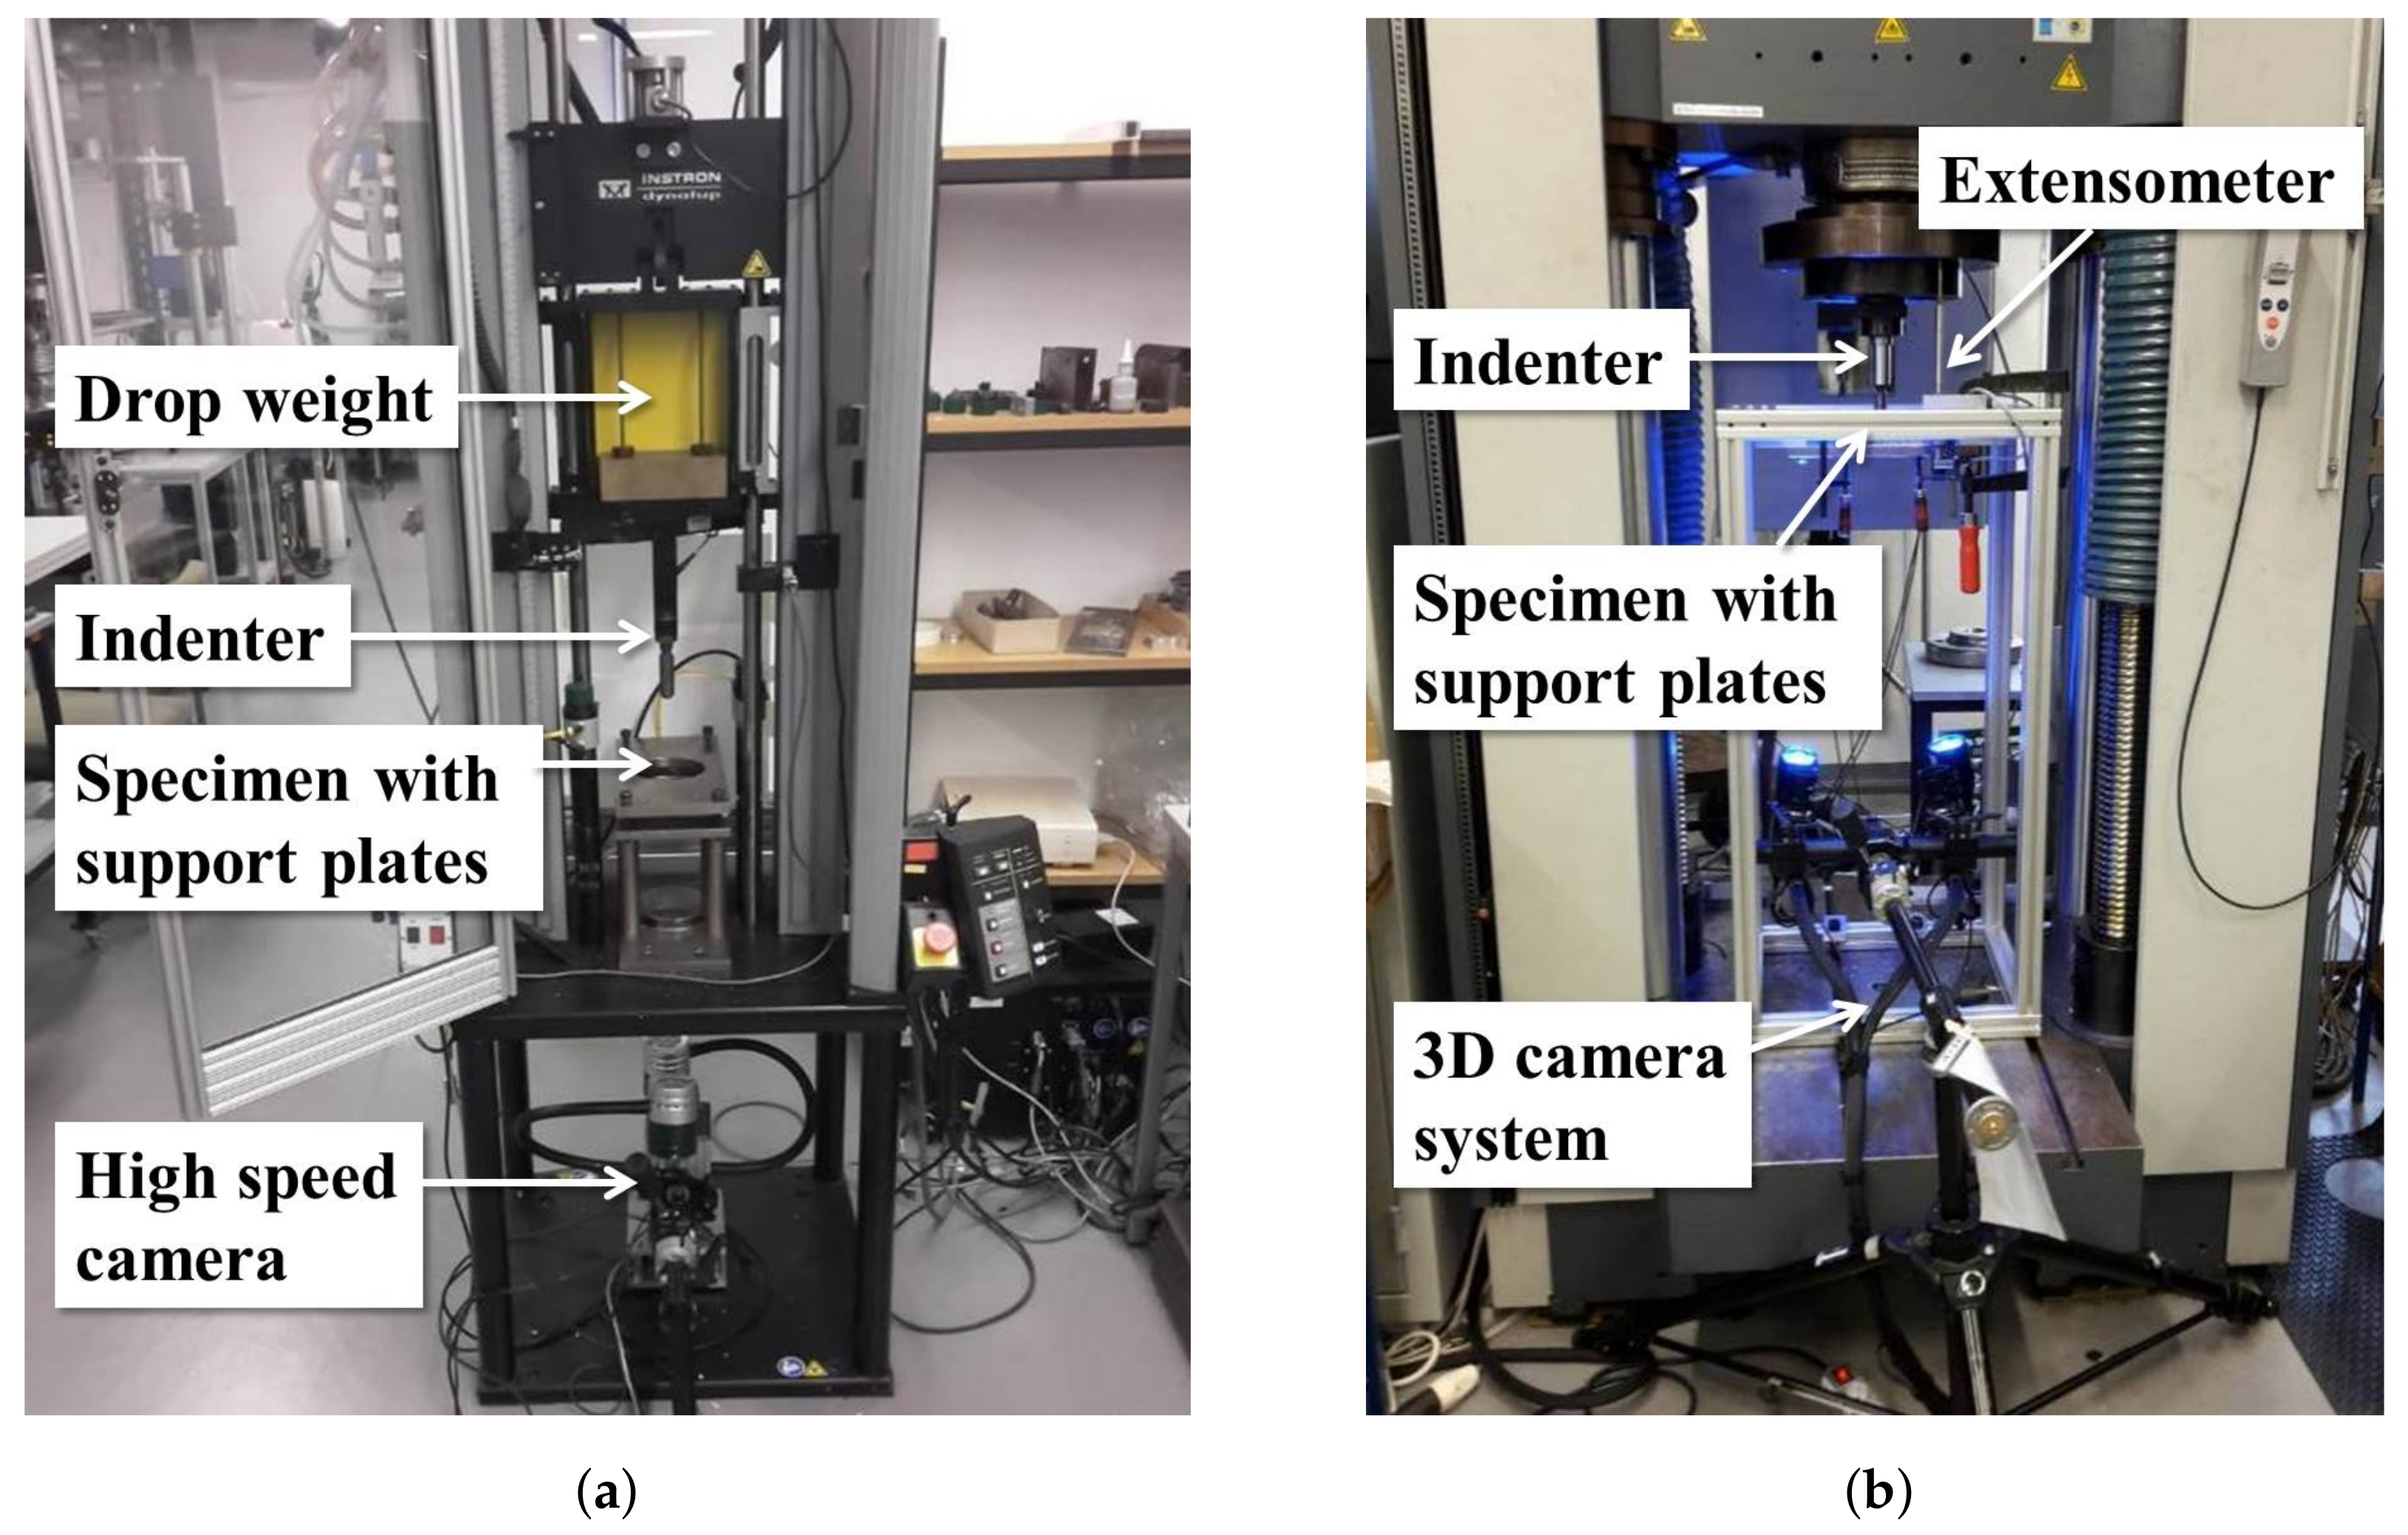
Figure 2.
Test setup for in situ computed tomography (CT) indentation, (a) Poly(methyl methacrylate) (PMMA)-dome; (b) X-ray image from CT before indentation.
Figure 2.
Test setup for in situ computed tomography (CT) indentation, (a) Poly(methyl methacrylate) (PMMA)-dome; (b) X-ray image from CT before indentation.
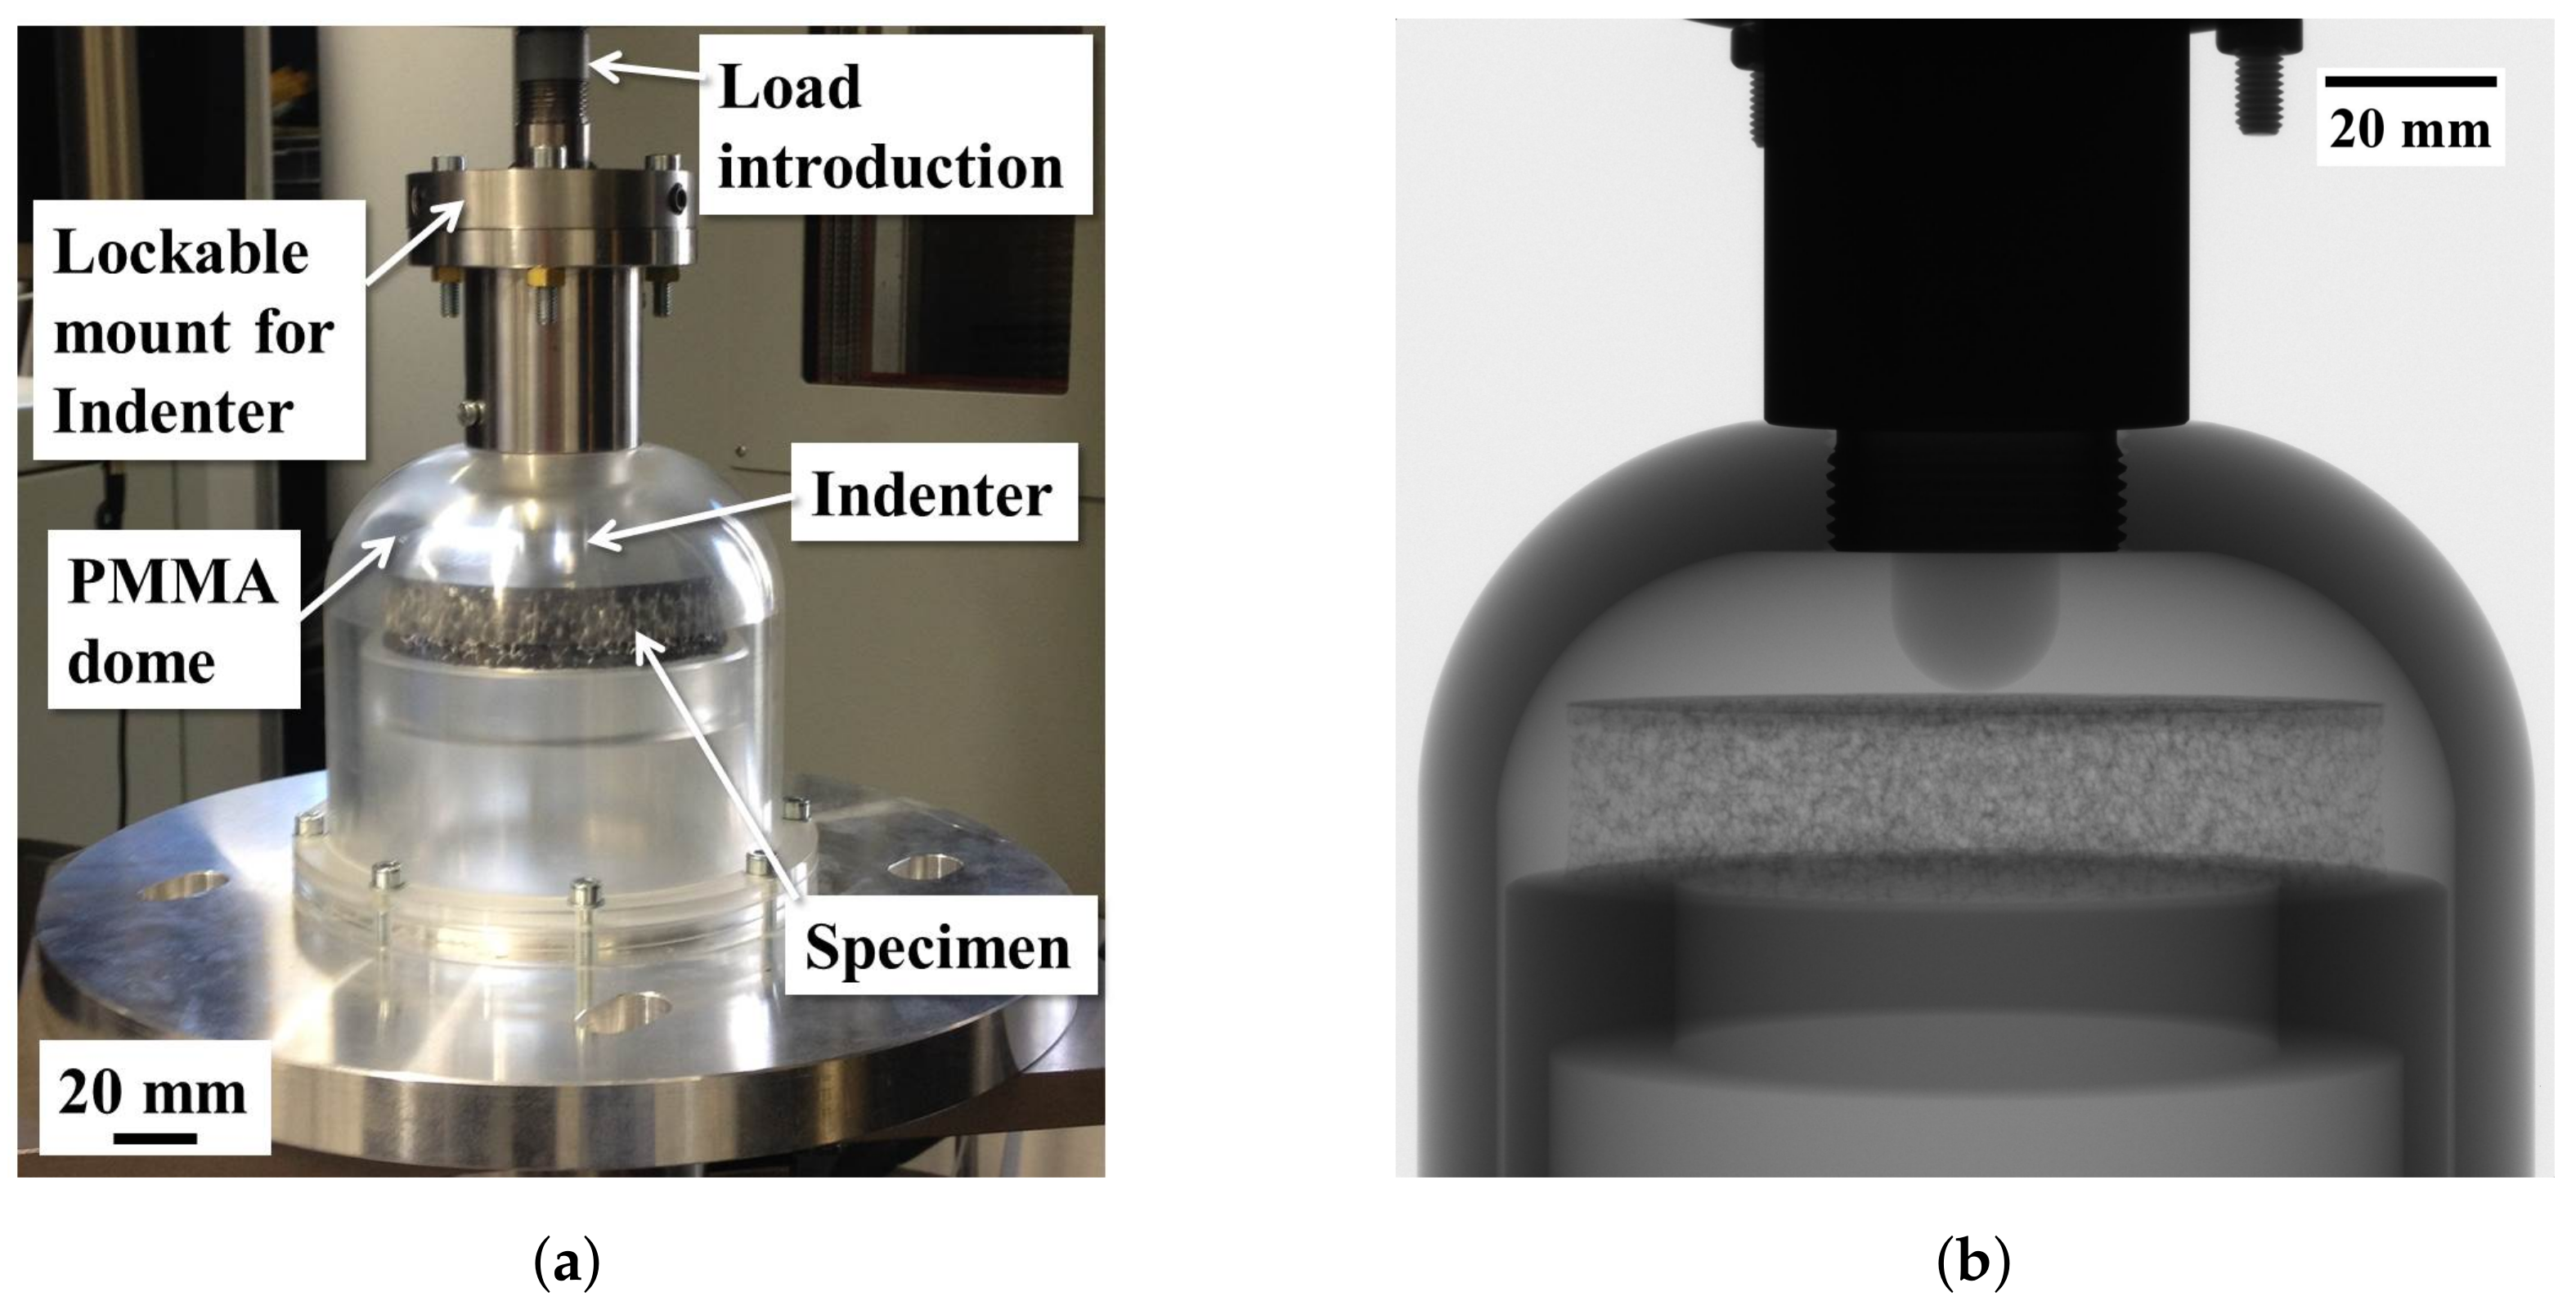
Figure 3.
LVI test results, each graph with one parameter varied from standard configuration 320w113oc: (a) fiber area weight; (b) fiber architecture; (c) polyurethane (PUR) quantity; (d) core type.
Figure 3.
LVI test results, each graph with one parameter varied from standard configuration 320w113oc: (a) fiber area weight; (b) fiber architecture; (c) polyurethane (PUR) quantity; (d) core type.
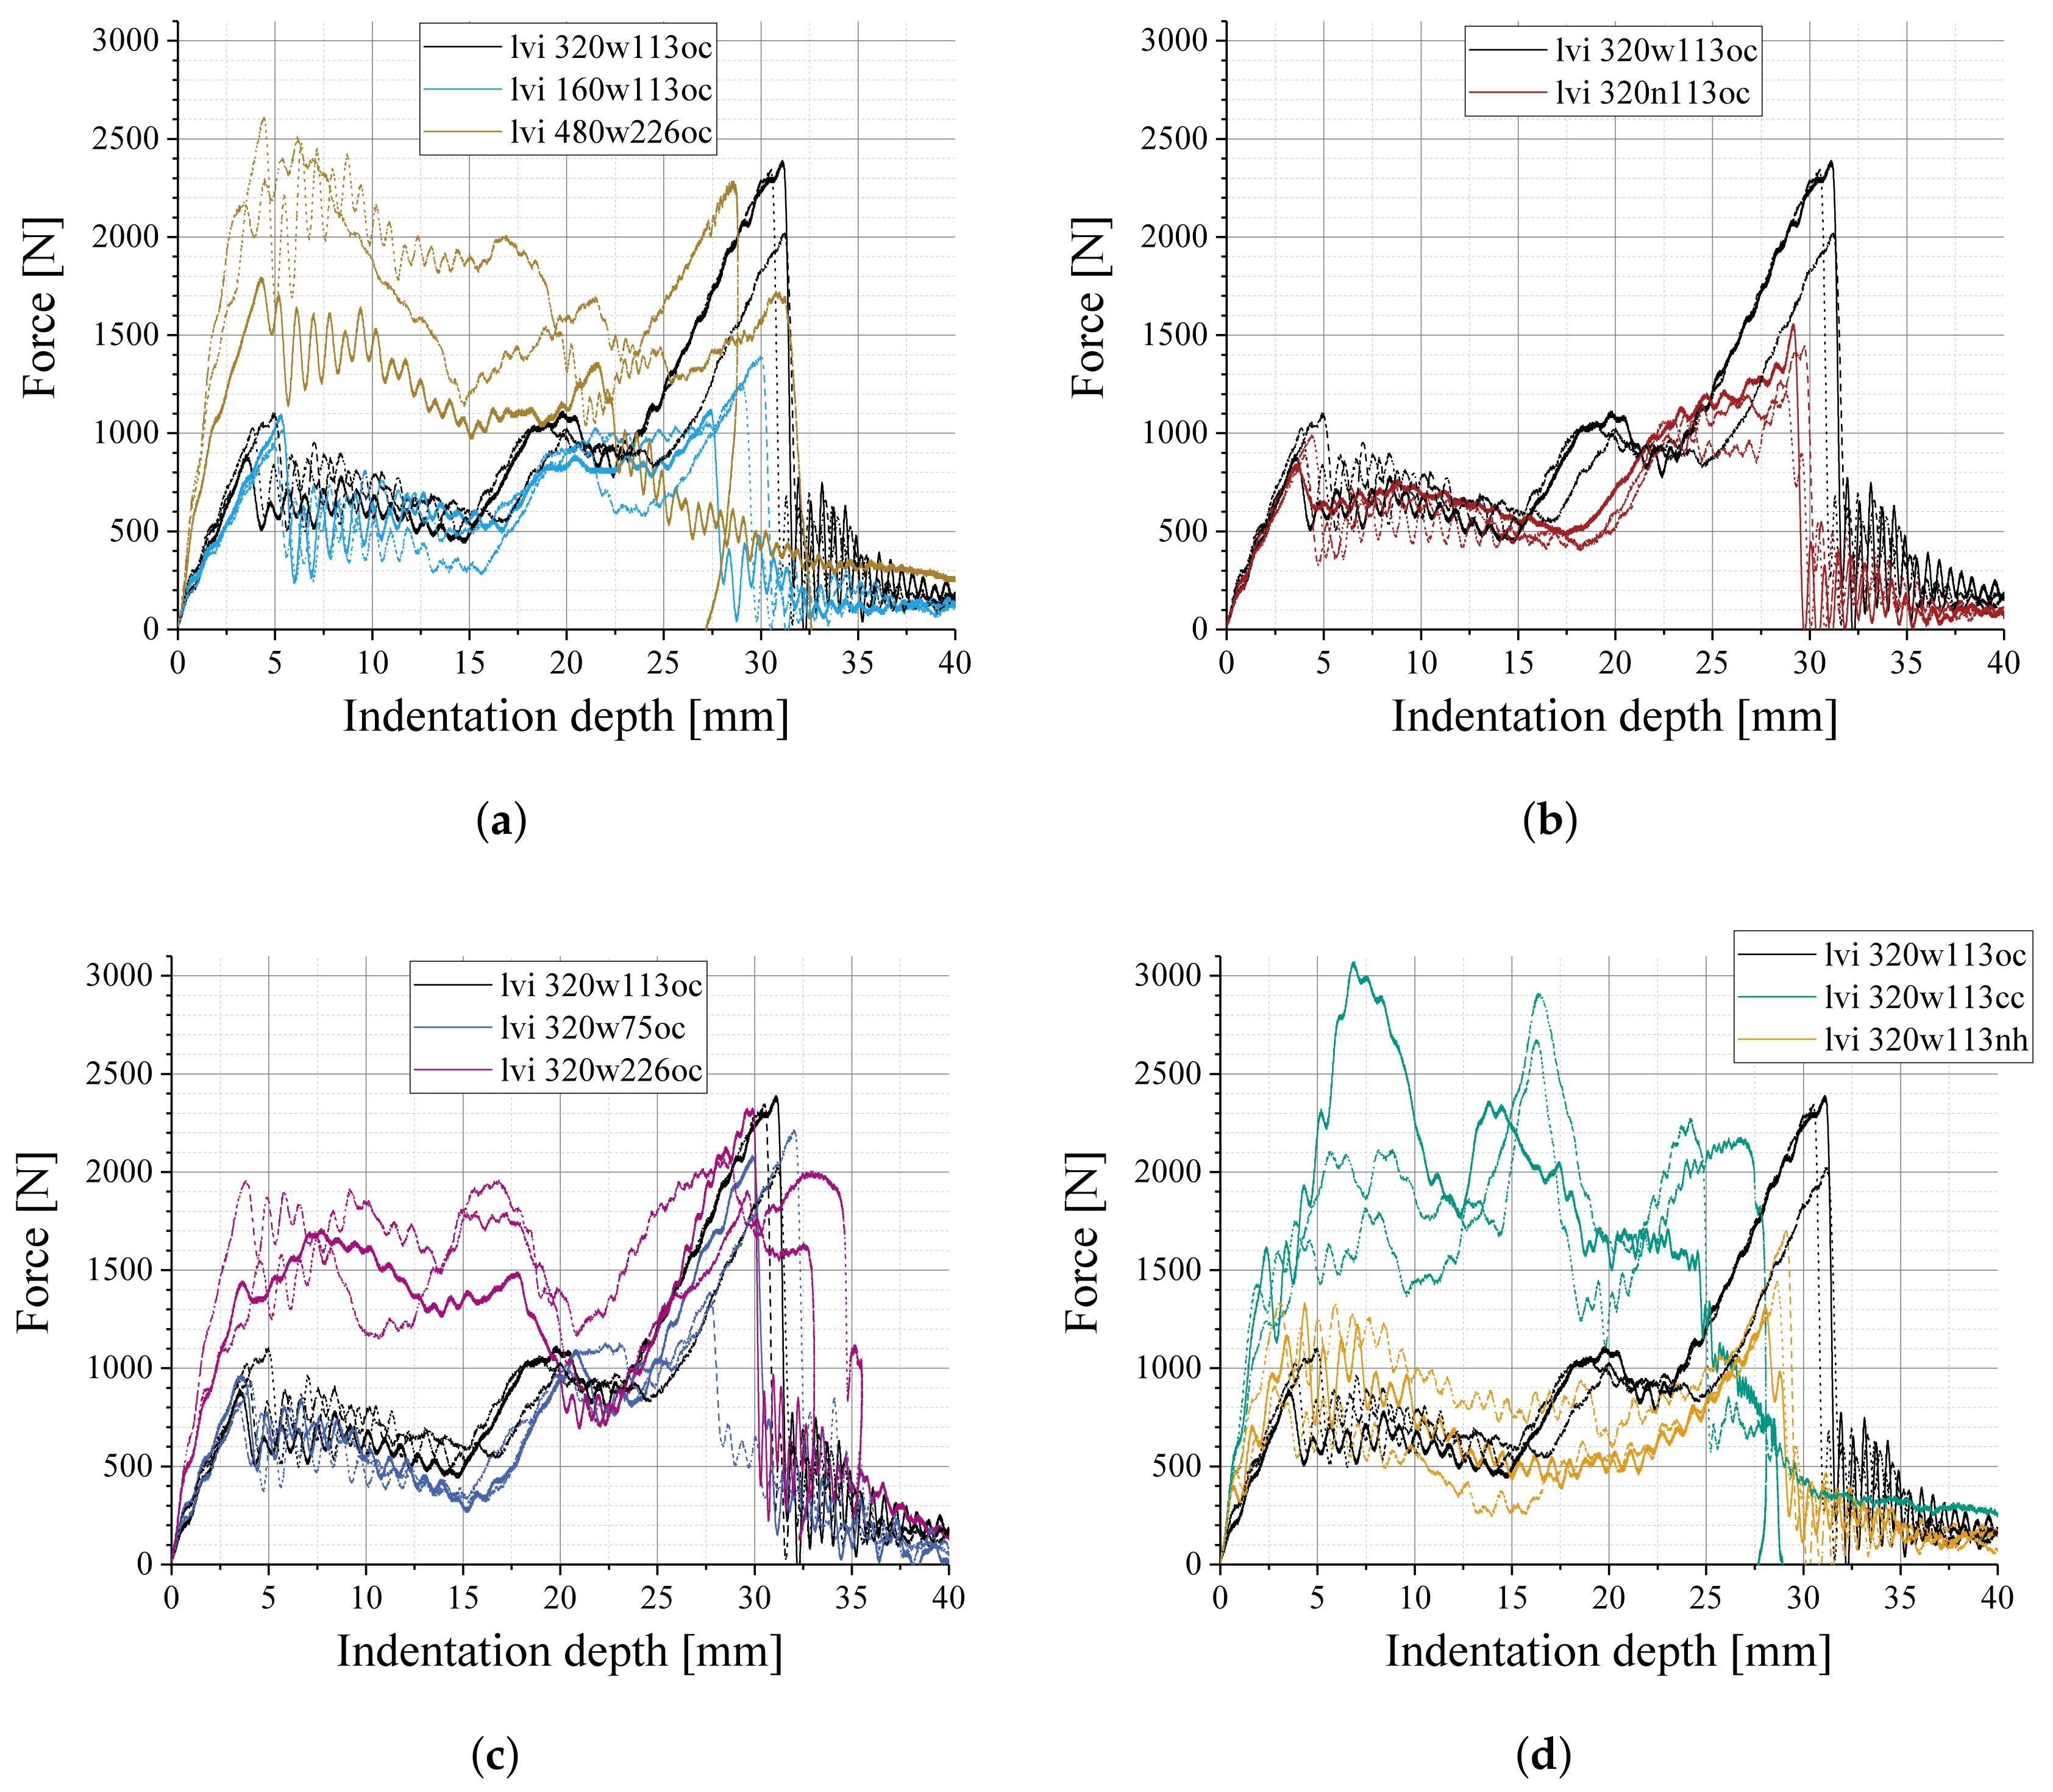
Figure 4.
LVI test results for sandwich configurations with 160 g/m woven face sheets and 113 g/m PUR, with OC, CC, and NH core.
Figure 4.
LVI test results for sandwich configurations with 160 g/m woven face sheets and 113 g/m PUR, with OC, CC, and NH core.

Figure 5.
Exemplary Digital Image Correlation (DIC) results in the LVI tests, (a) specimen with non-crimp fabric (NCF) face sheets; (b) specimen with woven face sheets.
Figure 5.
Exemplary Digital Image Correlation (DIC) results in the LVI tests, (a) specimen with non-crimp fabric (NCF) face sheets; (b) specimen with woven face sheets.

Figure 6.
Quasi-static indentation test results, each graph with one parameter varied from standard configuration 320w113oc: (a) fiber area weight; (b) fiber architecture; (c) PUR quantity; (d) core type.
Figure 6.
Quasi-static indentation test results, each graph with one parameter varied from standard configuration 320w113oc: (a) fiber area weight; (b) fiber architecture; (c) PUR quantity; (d) core type.
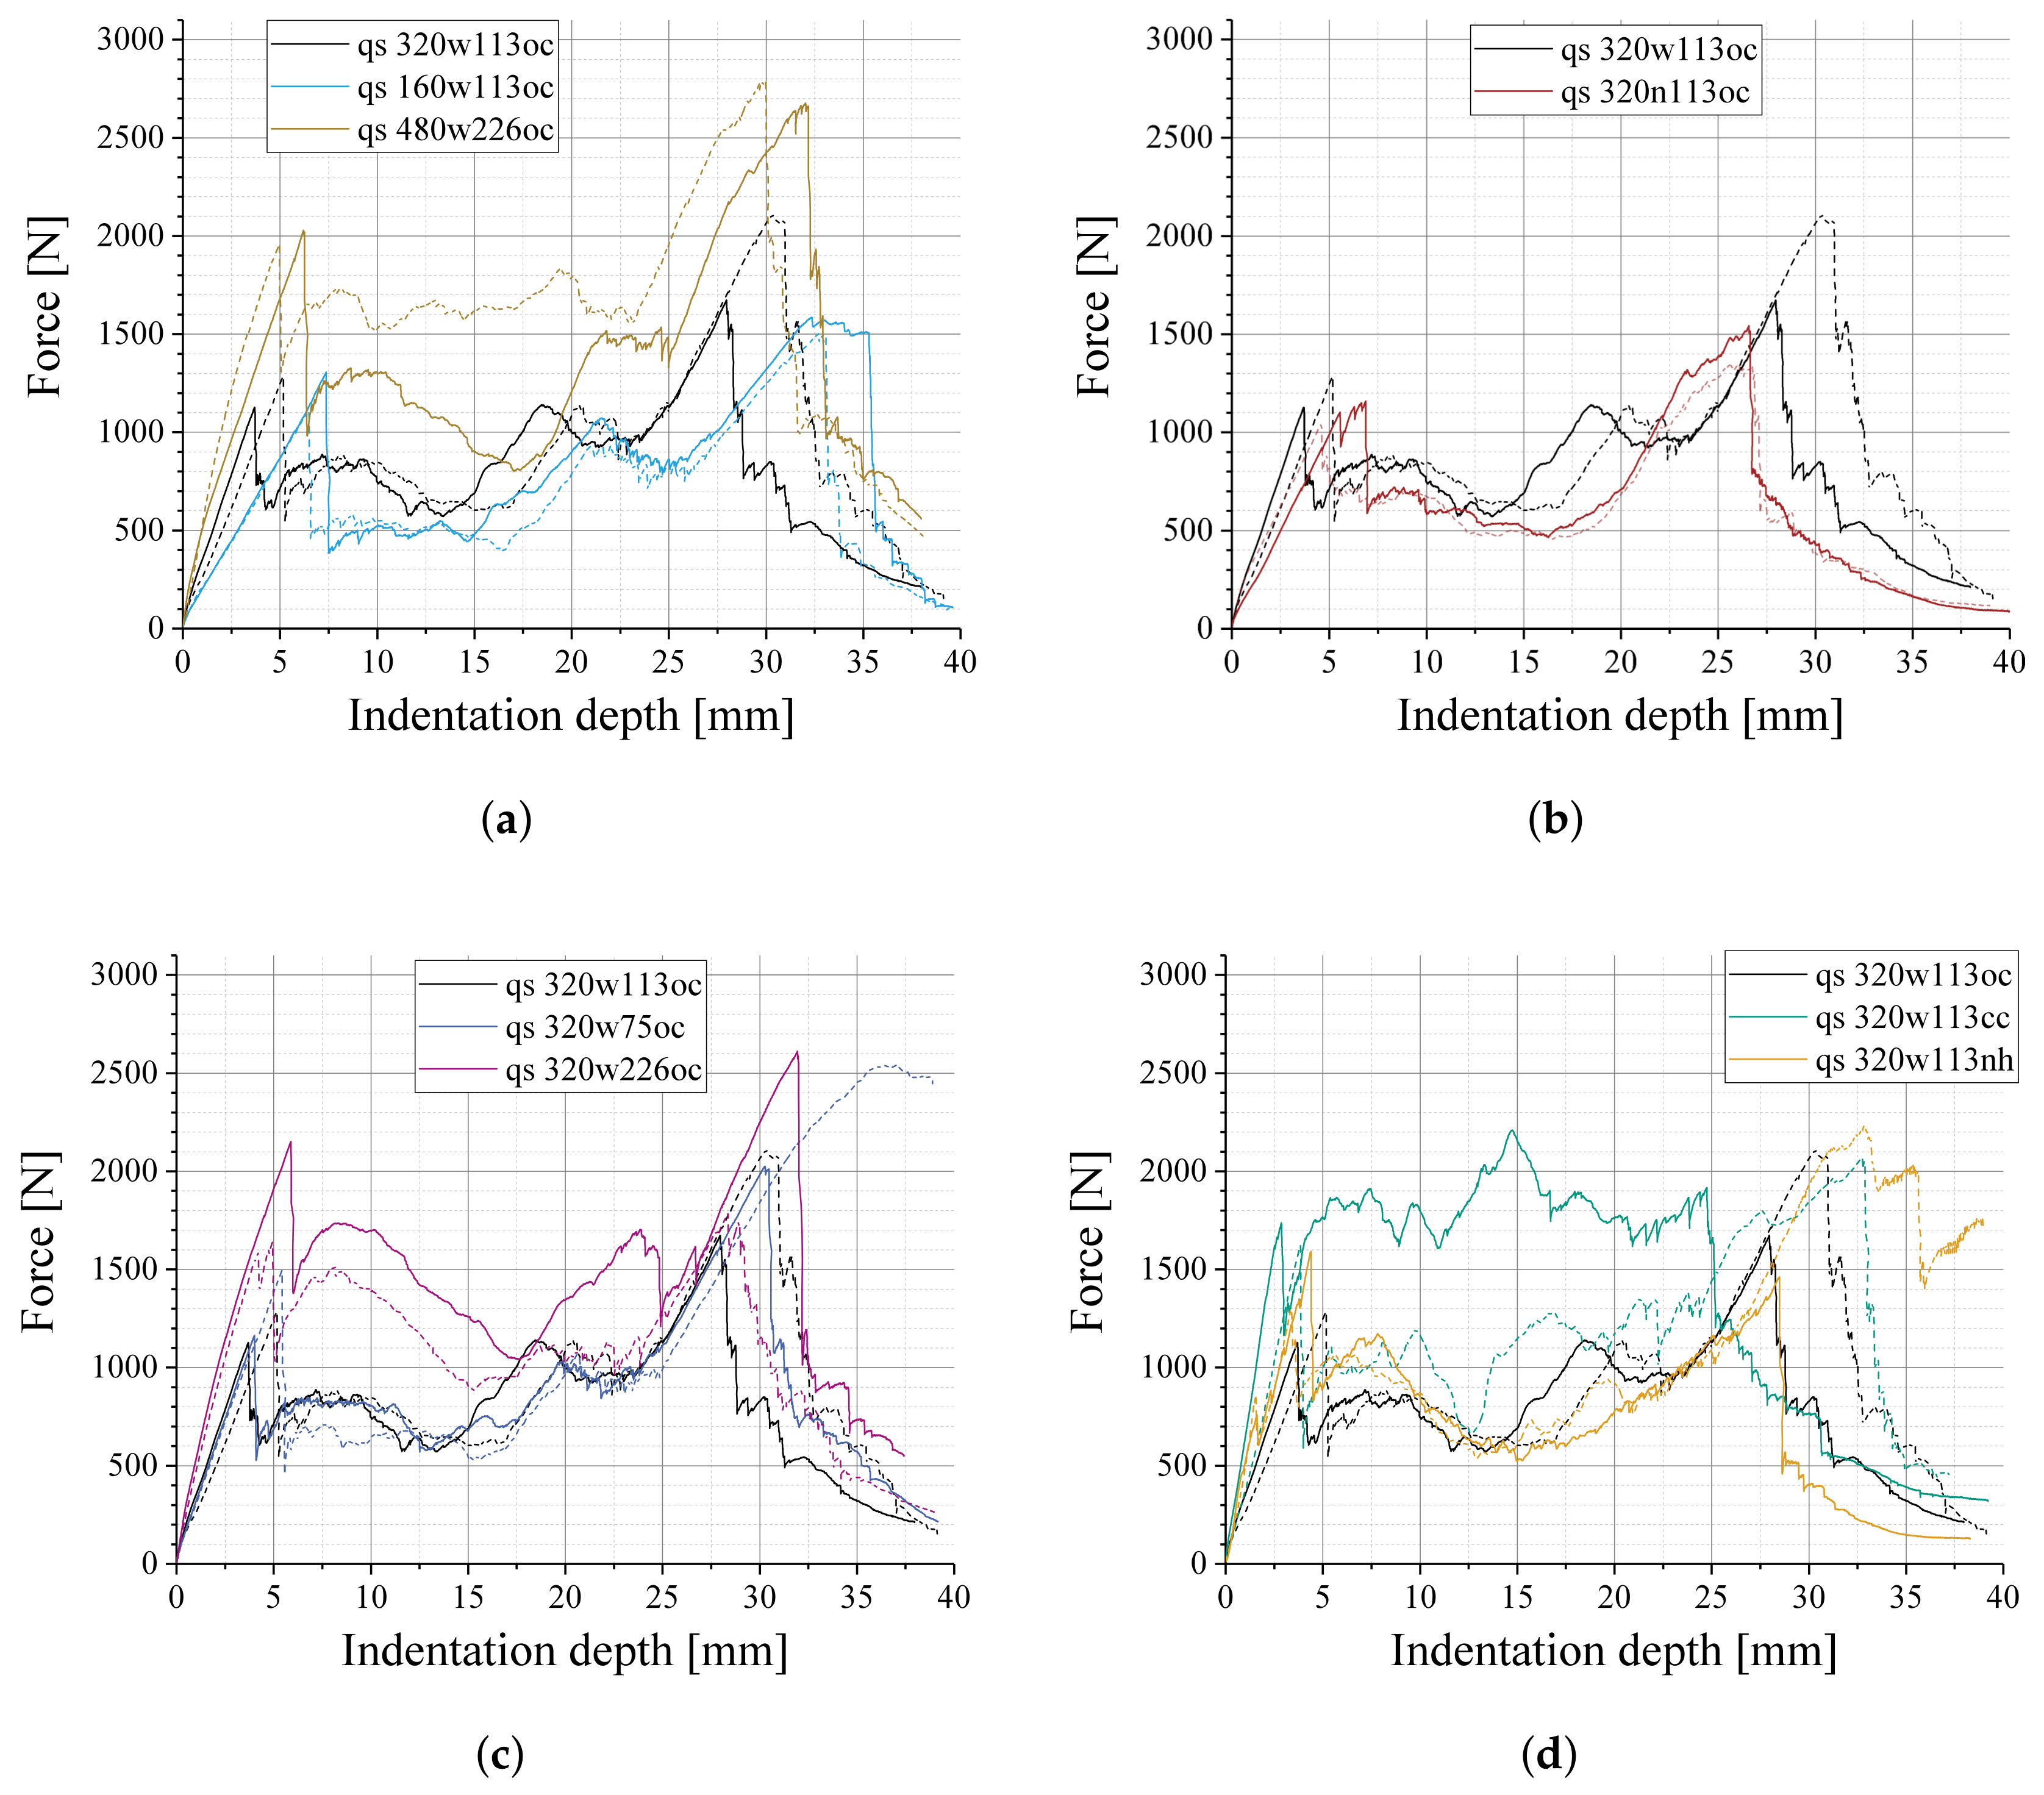
Figure 7.
Quasi-static indentation test results for sandwich configurations with 160 g/m woven face sheets and 113 g/m PUR, with OC, CC, and NH core.
Figure 7.
Quasi-static indentation test results for sandwich configurations with 160 g/m woven face sheets and 113 g/m PUR, with OC, CC, and NH core.

Figure 8.
Exemplary DIC results in the quasi-static indentation tests, (a) specimen with NCF face sheets (160n226oc); (b) specimen with woven face sheets (160w75oc).
Figure 8.
Exemplary DIC results in the quasi-static indentation tests, (a) specimen with NCF face sheets (160n226oc); (b) specimen with woven face sheets (160w75oc).

Figure 9.
Exemplary DIC results in the quasi-static indentation tests, (a) specimen with 160 g/m face sheets (160w113oc); (b) specimen with 320 g/m face sheets (320w113oc).
Figure 9.
Exemplary DIC results in the quasi-static indentation tests, (a) specimen with 160 g/m face sheets (160w113oc); (b) specimen with 320 g/m face sheets (320w113oc).
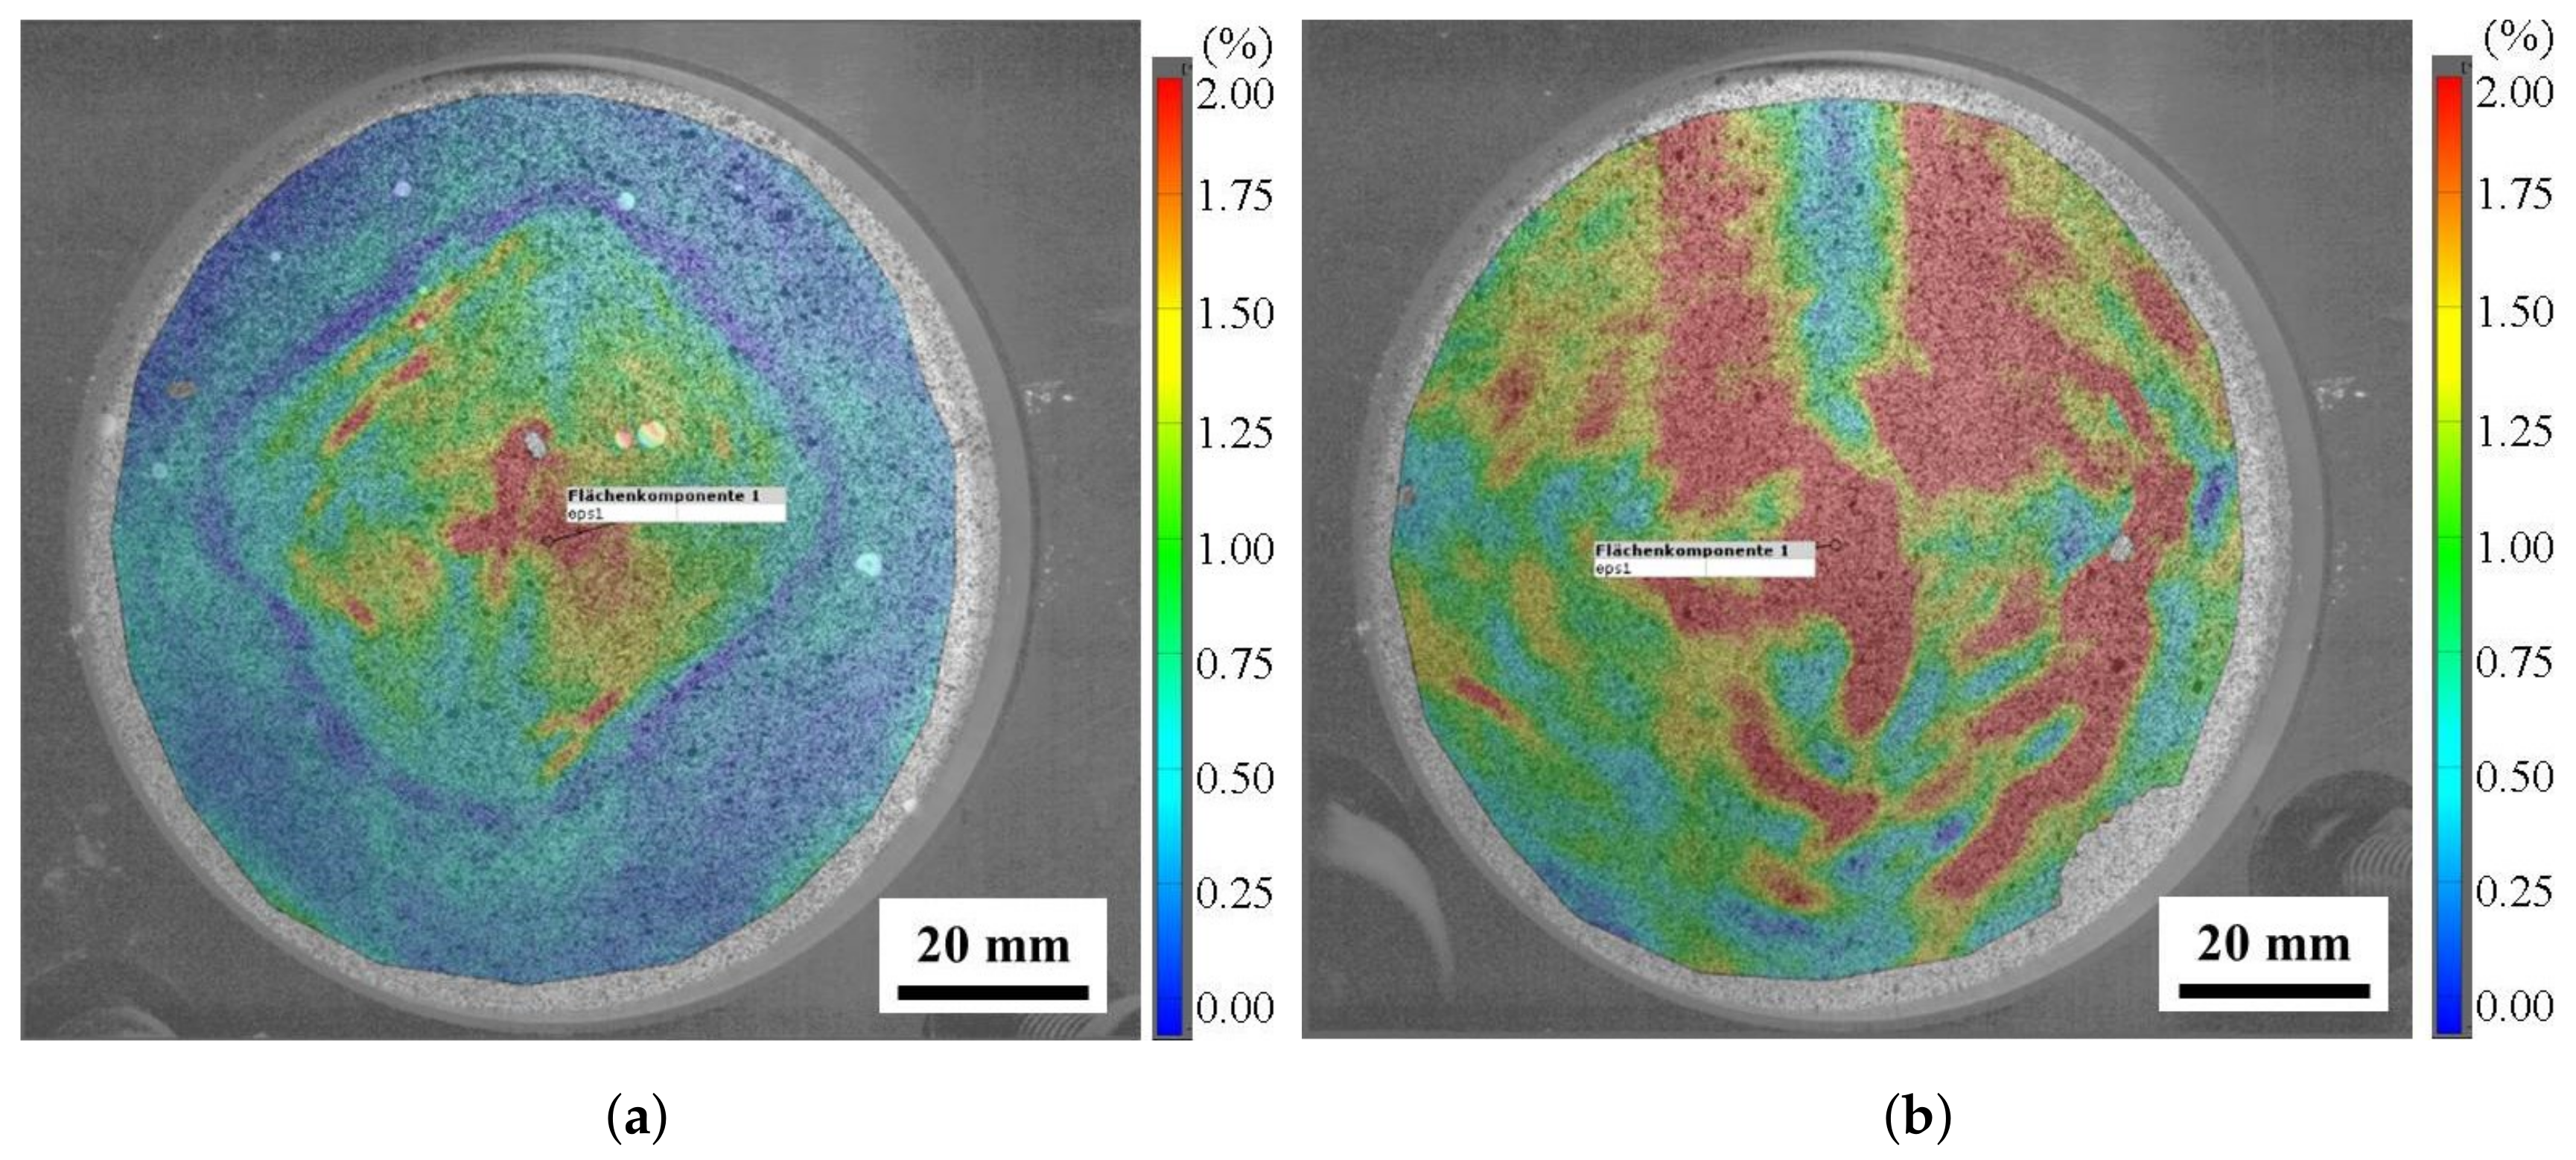
Figure 10.
In situ CT indentation test results: (a) measured force-indentation data (indentation reset before each stage); (b) force-indentation data with initial indentation depth measured by CT.
Figure 10.
In situ CT indentation test results: (a) measured force-indentation data (indentation reset before each stage); (b) force-indentation data with initial indentation depth measured by CT.
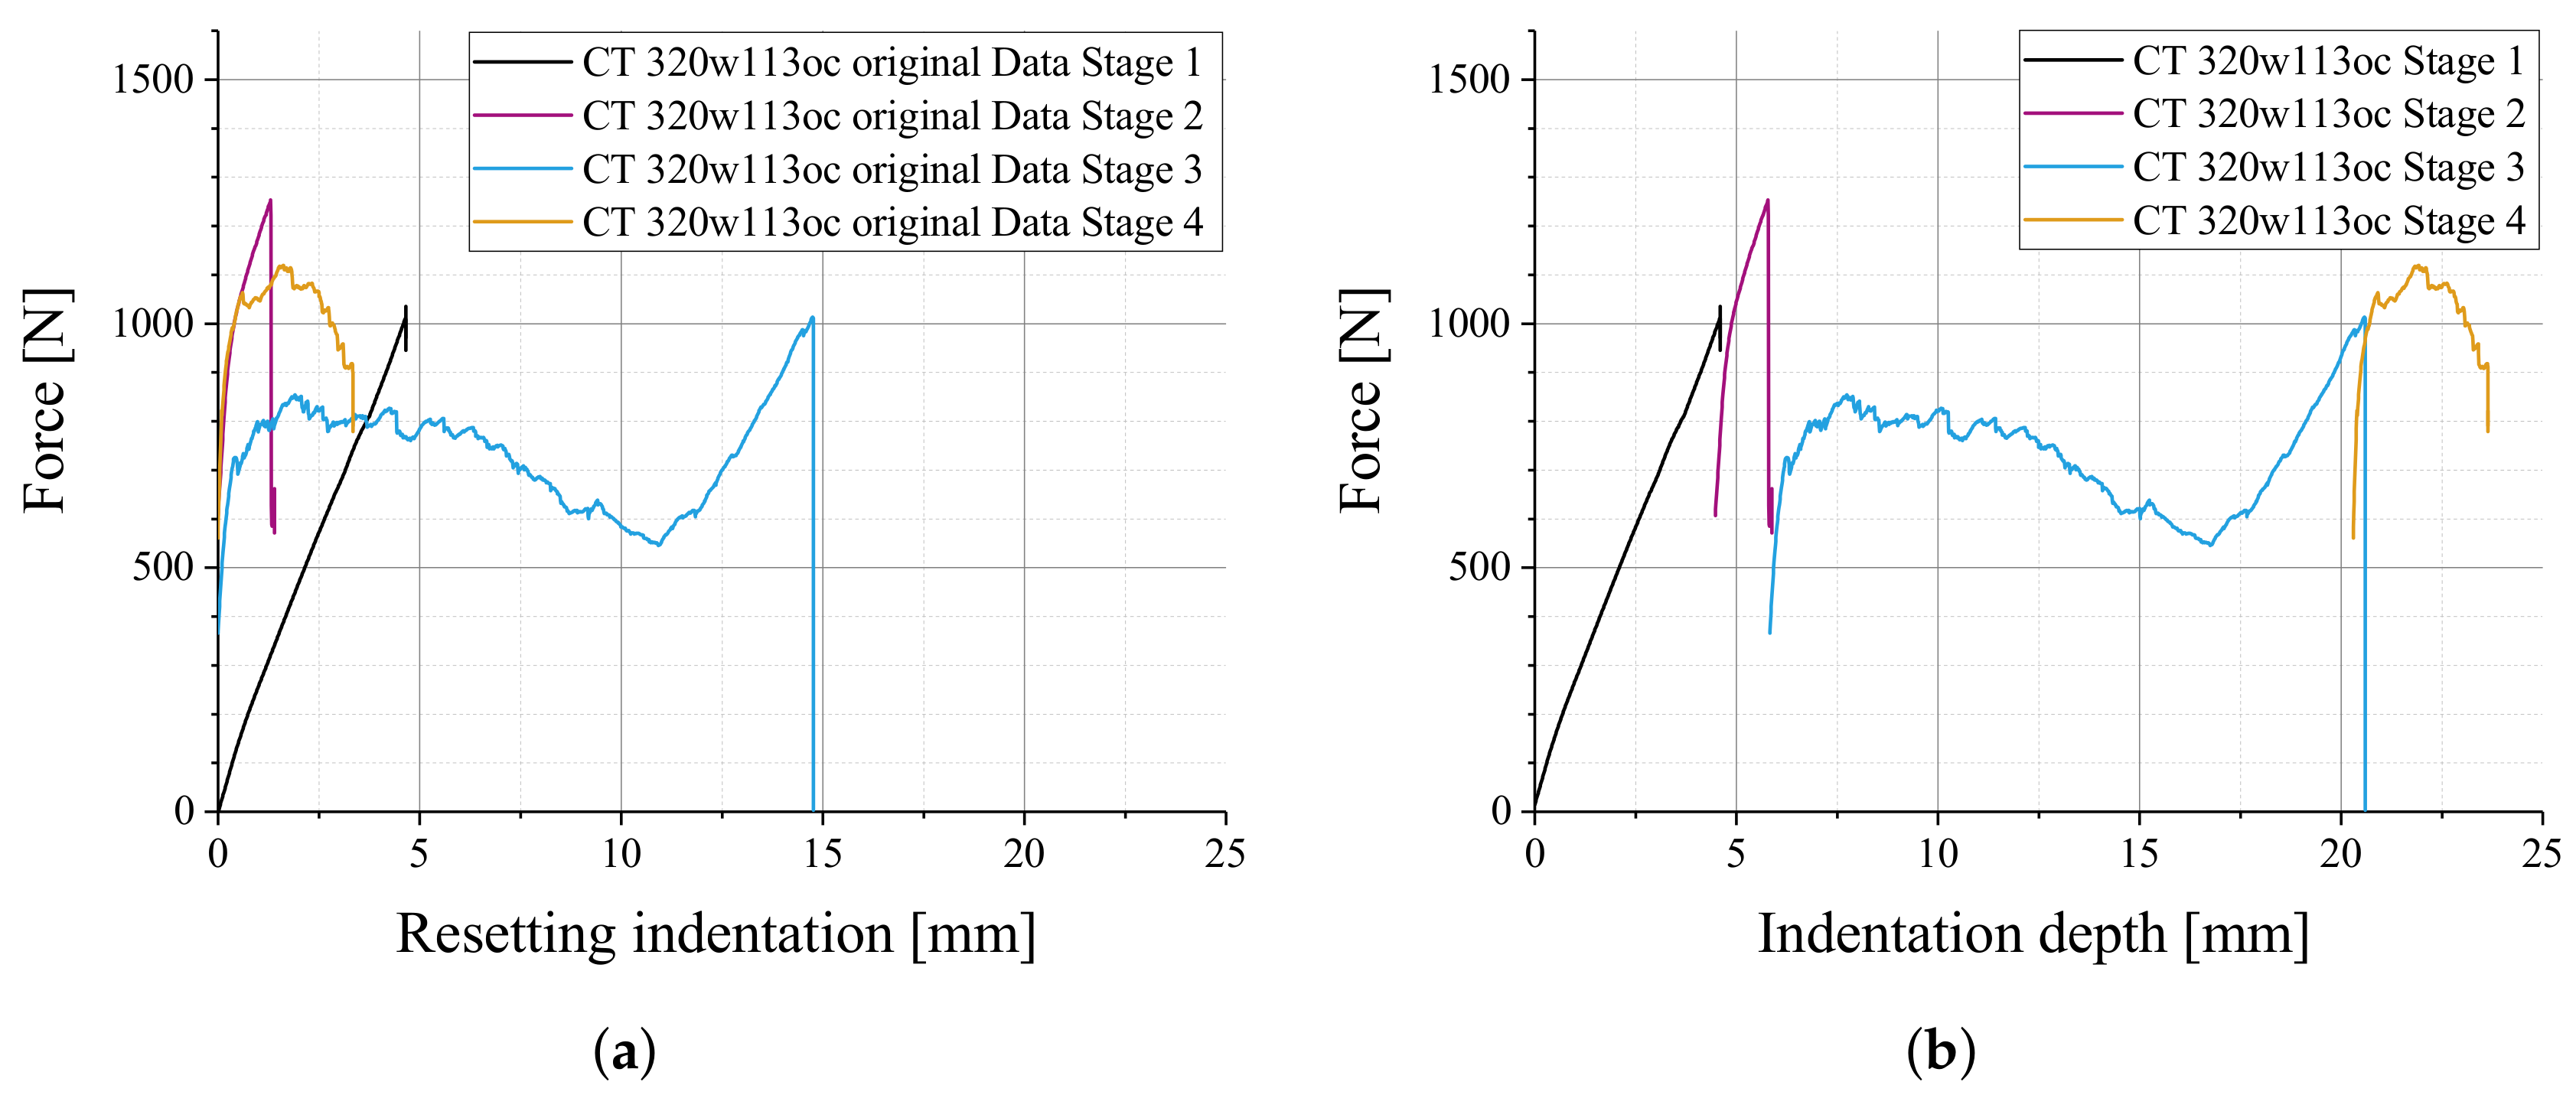
Figure 11.
X-ray CT scans of 320w113oc specimen, corresponding force-indentation-graph shown in Figure 10b. (a) before indentation; (b) stage 1, 4.60 mm indentation depth; (c) stage 2, 5.88 mm indentation depth; (d) stage 3, 20.60 mm indentation depth; (e) stage 4, 23.64 mm indentation depth.
Figure 11.
X-ray CT scans of 320w113oc specimen, corresponding force-indentation-graph shown in Figure 10b. (a) before indentation; (b) stage 1, 4.60 mm indentation depth; (c) stage 2, 5.88 mm indentation depth; (d) stage 3, 20.60 mm indentation depth; (e) stage 4, 23.64 mm indentation depth.

Figure 12.
In situ CT indentation test results for different sandwich configurations: (a,b) 160w113cc; (c) 320w113cc.
Figure 12.
In situ CT indentation test results for different sandwich configurations: (a,b) 160w113cc; (c) 320w113cc.

Figure 13.
X-ray CT scans of 160w113cc specimen, corresponding force-indentation-graph shown in Figure 12a. (a) before indentation; (b) stage 1, 1.57 mm indentation depth; (c) stage 2, 1.96 mm indentation depth; (d) stage 3, 3.79 mm indentation depth; (e) stage 4, 6.67 mm indentation depth; (f) stage 5, 12.56 mm indentation depth; (g) stage 6, 18.32 mm indentation depth; (h) stage 7, 21.53 mm indentation depth; (i) stage 8, 24.21 mm indentation depth.

Figure 14.
Comparison of LVI (blue) and quasi-static (red) indentation test results, each graph with one sandwich configuration: (a) 320w113oc; (b) 320w113cc; (c) 320w113nh; (d) 320w226oc; (e) 480w113oc; (f) 320n113oc.
Figure 14.
Comparison of LVI (blue) and quasi-static (red) indentation test results, each graph with one sandwich configuration: (a) 320w113oc; (b) 320w113cc; (c) 320w113nh; (d) 320w226oc; (e) 480w113oc; (f) 320n113oc.

Table 1.
Overview of sandwich configurations.
| Component | Parameters | Sign |
|---|---|---|
| Face sheet fiber area weight | 160 g/m | 160 |
| 320 g/m | 320 | |
| 480 g/m | 480 | |
| Face sheet fiber architecture | woven | w |
| non-crimp fabric (NCF) | n | |
| polyurethane (PUR) quantity | 75.5 g/m | 75 |
| 113.3 g/m | 113 | |
| 226.6 g/m | 226 | |
| Core type | open-cell aluminum foam | oc |
| closed-cell aluminum foam | cc | |
| Nomex honeycomb | nh |
Table 2.
Overview of tested sandwich configurations and the corresponding average test results.
| Configuration | Effective Density (g/cm) | Maximum Impact Force (N) | Absorbed Impact Energy (J) |
|---|---|---|---|
| 160n75oc | 0.168 ± 0.005 | 1118.1 ± 281.1 | 18.87 ± 3.01 |
| 160n113oc | 0.179 ± 0.008 | 1275.0 ± 199.4 | 21.03 ± 4.45 |
| 160n113cc | 0.286 ± 0.017 | 2052.7 ± 475.5 | 33.82 ± 4.08 |
| 160n226oc | 0.192 ± 0.005 | 1165.2 ± 226,5 | 20.63 ± 2.69 |
| 160w75oc | 0.168 ± 0.016 | 1300.7 ± 290.3 | 22.22 ± 4.82 |
| 160w113oc | 0.188 ± 0.004 | 1371.5 ± 188.4 | 23.80 ± 4.92 |
| 160w113cc | 0.289 ± 0.040 | 2181.5 ± 480.4 | 38.79 ± 10.15 |
| 160w113nh | 0.126 ± 0.002 | 1285.3 ± 106.2 | 22.17 ± 1.91 |
| 160w226oc | 0.248 ± 0.013 | 1727.7 ± 326.6 | 38.11 ± 9.48 |
| 320n75oc | 0.180 ± 0.002 | 1444.9 ± 328.3 | 21.30 ± 3.40 |
| 320n113oc | 0.181 ± 0.003 | 1426.1 ± 141.3 | 22.57 ± 1.19 |
| 320n113cc | 0.295 ± 0.029 | 2109.2 ± 524.5 | 41.03 ± 15.73 |
| 320n113nh | 0.126 ± 0.003 | 1404.1 ± 267.8 | 19.99 ± 5.02 |
| 320n226oc | 0.188 ± 0.004 | 1492.1 ± 254.2 | 21.03 ± 5.76 |
| 320w75oc | 0.199 ± 0.008 | 2054.7 ± 418.7 | 30.29 ± 10.29 |
| 320w113oc | 0.211 ± 0.013 | 2109.3 ± 289.9 | 31.09 ± 2.35 |
| 320w113cc | 0.298 ± 0.027 | 2590.6 ± 435.2 | 47.45 ± 4.82 |
| 320w113nh | 0.143 ± 0.002 | 1662.8 ± 350.0 | 27.16 ± 7.64 |
| 320w226oc | 0.263 ± 0.014 | 2160.3 ± 316.2 | 47.35 ± 6.12 |
| 480w226oc | 0.279 ± 0.026 | 2478.3 ± 396.2 | 48.55 ± 9.96 |
© 2018 by the authors. Licensee MDPI, Basel, Switzerland. This article is an open access article distributed under the terms and conditions of the Creative Commons Attribution (CC BY) license (http://creativecommons.org/licenses/by/4.0/).
Share and Cite
MDPI and ACS Style
Rupp, P.; Imhoff, J.; Weidenmann, K.A. Low-Velocity Impact Properties of Sandwich Structures with Aluminum Foam Cores and CFRP Face Sheets. J. Compos. Sci. 2018, 2, 24. https://doi.org/10.3390/jcs2020024
AMA Style
Rupp P, Imhoff J, Weidenmann KA. Low-Velocity Impact Properties of Sandwich Structures with Aluminum Foam Cores and CFRP Face Sheets. Journal of Composites Science. 2018; 2(2):24. https://doi.org/10.3390/jcs2020024
Chicago/Turabian StyleRupp, Peter, Jonas Imhoff, and Kay André Weidenmann. 2018. "Low-Velocity Impact Properties of Sandwich Structures with Aluminum Foam Cores and CFRP Face Sheets" Journal of Composites Science 2, no. 2: 24. https://doi.org/10.3390/jcs2020024