1. Introduction
Bubble and drop profile analysis tensiometry is presently the most frequently used technique for studies of adsorption layer properties of aqueous solutions of surfactants, polymers, and their mixtures as summarised in [
1]. There are various types of applications in many technological fields, as explained in [
2,
3,
4,
5,
6,
7]. The pioneering work in the field was made by Neumann and his team [
8,
9,
10,
11], so this methodology is now one of the routine methods for measuring the dynamic and static surface and interfacial tensions of solutions. It provides a relatively simple experimental procedure to characterise the surface activity of surfactants. Due to the possibility of accurately controlling the size of a drop, i.e., of its volume and surface area, this method can also be applied to measure the dilational visco-elasticity of interfacial layers [
12].
It was shown, however, that the results obtained from the analysis of a drop profile and a corresponding bubble profile can deviate from each other significantly, although in both cases the surface tension of the liquid/air interface is the object of investigation. A first work was published in 1999 [
13] on the adsorption of proteins and the difference between the surface tension values measured from drop and bubble profile tensiometry, respectively. Thus, the technique was used to determine the adsorbed amount of the studied protein at the interface. A general overview on this so-called depletion effect has been summarised in [
14]. From these findings, it becomes clear that for surfactant or protein solutions with concentrations below a certain limit, a respective loss in the bulk of a single drop happens due to the adsorption of the surface active species. This depletion leads to a final concentration in the drop, which is remarkably lower than the initial concentration. On the other hand, at the water/oil interface, the partitioning of surfactants between the two liquid bulk phases and the interface also depends on the volume ratios of these two fluids, and the interfacial areas [
15]. Thus, ignoring depletion effects would lead to data that do not reflect the correct adsorption behavior [
16]. A surface tension isotherm constructed in this way, i.e., using data from drop profile analysis tensiometry without considering and correcting possible depletion effects, would then lead to incorrect adsorption parameters and consequently even to wrong adsorption models.
The most straightforward (however cumbersome) way to analyse depletion is based on a numerical evaluation of the surfactant distribution within the finite volume of the drop and at its surface. In [
15], the adsorption kinetics of a surfactant at the liquid/air interface of a pendant drop was analysed via a numerical solution of the diffusion equation. This means the temporal evolution of surfactant within the axial symmetric (prolate) drop assuming the initial homogeneous distribution of surfactant concentration was simulated with the simple Langmuir isotherm serving as a boundary condition at the interface. The calculated limiting (long time) values of surface coverage (adsorbed amount) and surface tension were compared with those obtained for a spherical and a planar interface. It was found that the surface tension values obtained for the adsorption on a plane surface at long times (which correspond to Wilhelmy plate experiments, for example) are essentially lower than those obtained for a curved interface. In our study, similar results were obtained for the more realistic Frumkin adsorption model in which the intermolecular interactions and intrinsic compressibility within the adsorbed layer is considered. Also, irrespective of the main subject of the present study, it should be noted that the surface tension values obtained in [
15] for a prolate drop exceed only slightly those values obtained for a spherical interface. It is unlikely that in real experiments in view of the uncertainty of initial conditions (the initial adsorption and distribution of the surfactant over the drop surface) these small effects can be reliably detected.
In the present work, we propose a procedure that allows us to process experimental data obtained for some selected surfactant solutions using drop profile analysis tensiometry. This protocol takes into account the mass balance of the surfactant in the drop bulk and the amount adsorbed at the drop surface. It also takes into account the exact drop volume and its surface area. To verify the proposed algorithm, experimental data for CTAB, Tween 20, decanol (C10OH), SDS, and a cat-anionic surfactant mixture SDS + DoTAB were measured, and the obtained surface tension isotherms corrected for depletion.
2. Theory
The aim of this study is to develop an algorithm for fitting equilibrium surface tension data with suitable thermodynamic adsorption models; this algorithm should be applicable for the analysis of the experimental data obtained both by depletion-dependent and depletion-independent measuring techniques. We particularize here to the Frumkin adsorption model, which was previously generalized to account for a possible intrinsic compressibility of the adsorbed layer [
17,
18]; however, the algorithm is applicable to any other adsorption model.
The equation of state of the surface layer and the corresponding adsorption isotherm for the Frumkin model, respectively, have the following form:
Here
θ = Γ
ω is the surface coverage, Γ is the adsorption,
ω is the molar area, П =
γ0 –
γ is the surface pressure with
γ0 and
γ being the surface tension of the solvent and solution, respectively,
a is the interaction parameter,
R is the gas law constant,
T is the absolute temperature, and
b is the adsorption activity coefficient. The molar area is assumed to depend on the intrinsic compressibility coefficient
ε as proposed in [
18]:
It is essential that c is the final concentration of the surfactant in the drop bulk after equilibration. During the adsorption process, a part of the surfactant molecules adsorbs at the surface of the drop, and as a consequence, the surfactant concentration in the bulk of the drop decreases. In contrast, if the experiments are performed with the bubble profile analysis, Wilhelmy plate, or ring tensiometry, the amount of surfactant adsorbed at the surface is several orders of magnitude smaller and can be neglected in most cases.
The depletion effect can be quantitatively considered via a mass balance. Let us assume
M is the amount of surfactant in the solution of volume
V with the initial concentration of
c0:
. The amount of adsorbed surfactant Γ at the interface with the area
S after equilibration leads to the decreased concentration
c, i.e.,
. From here, we get the following final concentration inside the drop:
Introducing this final bulk concentration into the adsorption Equation (2), we obtain,
This set of Equations (1), (3), and (5) must be used to determine the model parameters via the best fit of the experimental data.
This fitting procedure is straightforward when the term Γ (S/V) in Equation (5) is negligible, i.e., no significant depletion happens during the adsorption process. The set of model parameters {ω0, a, b and ε} allows to determine the surface coverage θ via Equation (2) as a function of c, which in turn enables the calculation of the dependencies of other important quantities on the surfactant concentration via Equations (1) and (3). Thus, it is possible to fit the experimental data by varying the values of the model parameters.
If the equilibrium concentration in the drop bulk is smaller than the initial bulk concentration, c < c0, then the ‘model isotherm’ which in this case should yield the dependencies of the relevant quantities on c0, consists of Equations (1), (3) and (5). Also, the parameters S and V are involved in the calculations. Again, it is easily seen that the simultaneous numerical solution of these equations should provide the dependencies of the four quantities Π, θ, Γ, and ω as functions of c0, which thus makes it possible to fit the experimental data by varying the values of model parameters; then, the equilibrium concentration in the drop bulk c can be calculated via .
The approach explained above has one essential drawback. While the values of some parameters are either known (
S and
V) or can be guessed initially from physical considerations (for the Frumkin isotherm considered here these are
ω0,
a, and
ε), the
b value cannot easily be estimated. Therefore, in [
17] a procedure was proposed to obtain the value of
b by analysing the experimental dependence of Π on
c0 for the case when the values of
c and
c0 are the same.
This procedure can be generalised for the present case to obtain the dependencies of the measurable quantities and
c on the initial surfactant concentration
c0. To do this, one should analyse the experimental isotherm, which in fact comprises the pairs of values (
c0, Π) for
n experimental points, in the following way. If we formally consider the parameter
b as a “dependent” variable, the model isotherm could be represented as a set of simultaneous equations to be solved to calculate
b via
c0 and Π as follows:
where {
α} denotes the set of relevant model parameters. Then it becomes possible to calculate the values of
b in each of the n experimental point (
c0i, Π
i) arranged in an increasing order of Π as follows:
Now, the “average” value for the
bi could be calculated as the weighted average over all
n experimental values. Among several definitions of weighting, the relation
with
was found to yield the best fit value of
b of the theoretical predictions to the experimental data in terms of minimising the target function
δ with respect to the following set of model parameters {α}:
A computation procedure to estimate the value of b was developed, operating as follows. With an initial set of suitable values of the other model parameters (for the Frumkin model these are ω0, a, and ε), one should repeatedly perform the calculations of the target function, varying these parameters to seek for the set that corresponds to a minimum δ value. This will yield the b value, which can then be used to calculate the adsorption isotherm. This algorithm was implemented in a software package used to perform the calculations presented in this study.
3. Materials and Experimental Methods
The drop and bubble profile analysis tensiometer PAT-1 (SINTERFACE Technologies, Berlin, Germany) was used to measure the surface tension isotherms. The principle of this methodology is described elsewhere in detail [
9,
10,
11]. The volume of the measuring cell of the instrument was
V = 25 mL. The buoyant (oblate) bubble and the pendant drop method allow both to measure the time dependence of surface tension of surfactant solutions until the adsorption equilibrium has been established. In this study, the profile of the bubble was slightly oblate, while that of the drops had a prolate shape. The bubbles were formed at the tip of a vertical capillary made of Teflon having an external diameter of about 3 mm. In the pendant drop method, a steel capillary with a diameter of 2.8 mm and a conical internal profile was used. The surface area of the drop or bubble was between 36 and 38 mm
2 and was kept constant automatically by the instrument software during the whole experiment. The initial volumes of the used drops and bubbles, respectively, were in the range between 25 and 27 mm
3. Note that the drop volume decreases during the adsorption process by 1 to 6%. This decrease is higher for larger values of the surface pressure. This phenomenon cannot be avoided (either the drop surface area or the drop volume can be kept constant) and was additionally taken into account in the calculation program.
The surfactants studied here were CTAB (hexadecyl trimethyl ammonium bromide), Tween 20 (Polyoxyethylene (20) sorbitan monolaurate), C10OH (decanol), and an equimolar mixture of DoTAB (dodecyl trimethyl ammonium bromide) and SDS (Sodium dodecyl sulphate), respectively. All surfactants were purchased from Sigma-Aldrich (St. Louis, MO, USA). The solutions were prepared with Milli-Q water, the surface tension of which was 72.0 ± 0.2 mN/m at 25 °C (kept constant for all experiments) over a time interval of up to 10,000 s.
4. Results and Discussion
Let us first consider the ratio of the surfactant equilibrium concentration in the drop
c to the initial concentration
c0. The calculations were done as described above using the adsorption model parameters given in
Table 1. To do these calculations, we analyse as an example the adsorption isotherm of the non-ionic surfactant C
12EO
5 measured in [
19] using the drop profile method and fitted by the Frumkin model. The geometric values of the drop were
S = 33 mm
2,
V = 24 mm
3, i.e.,
S/
V = 1.4 mm
−1. The “bubble-based” values of solution concentration
c0 were adjusted to be equal to the equilibrium “drop-based” values
c at the same surface tension or adsorption values. The fitting of experimental data by the theoretical isotherm equation was achieved mainly by adjusting the parameter
ε and slight variations of
ω and
a; the adsorption activity coefficient
b was kept virtually constant at about 1.6 × 10
4 m
3/mol.
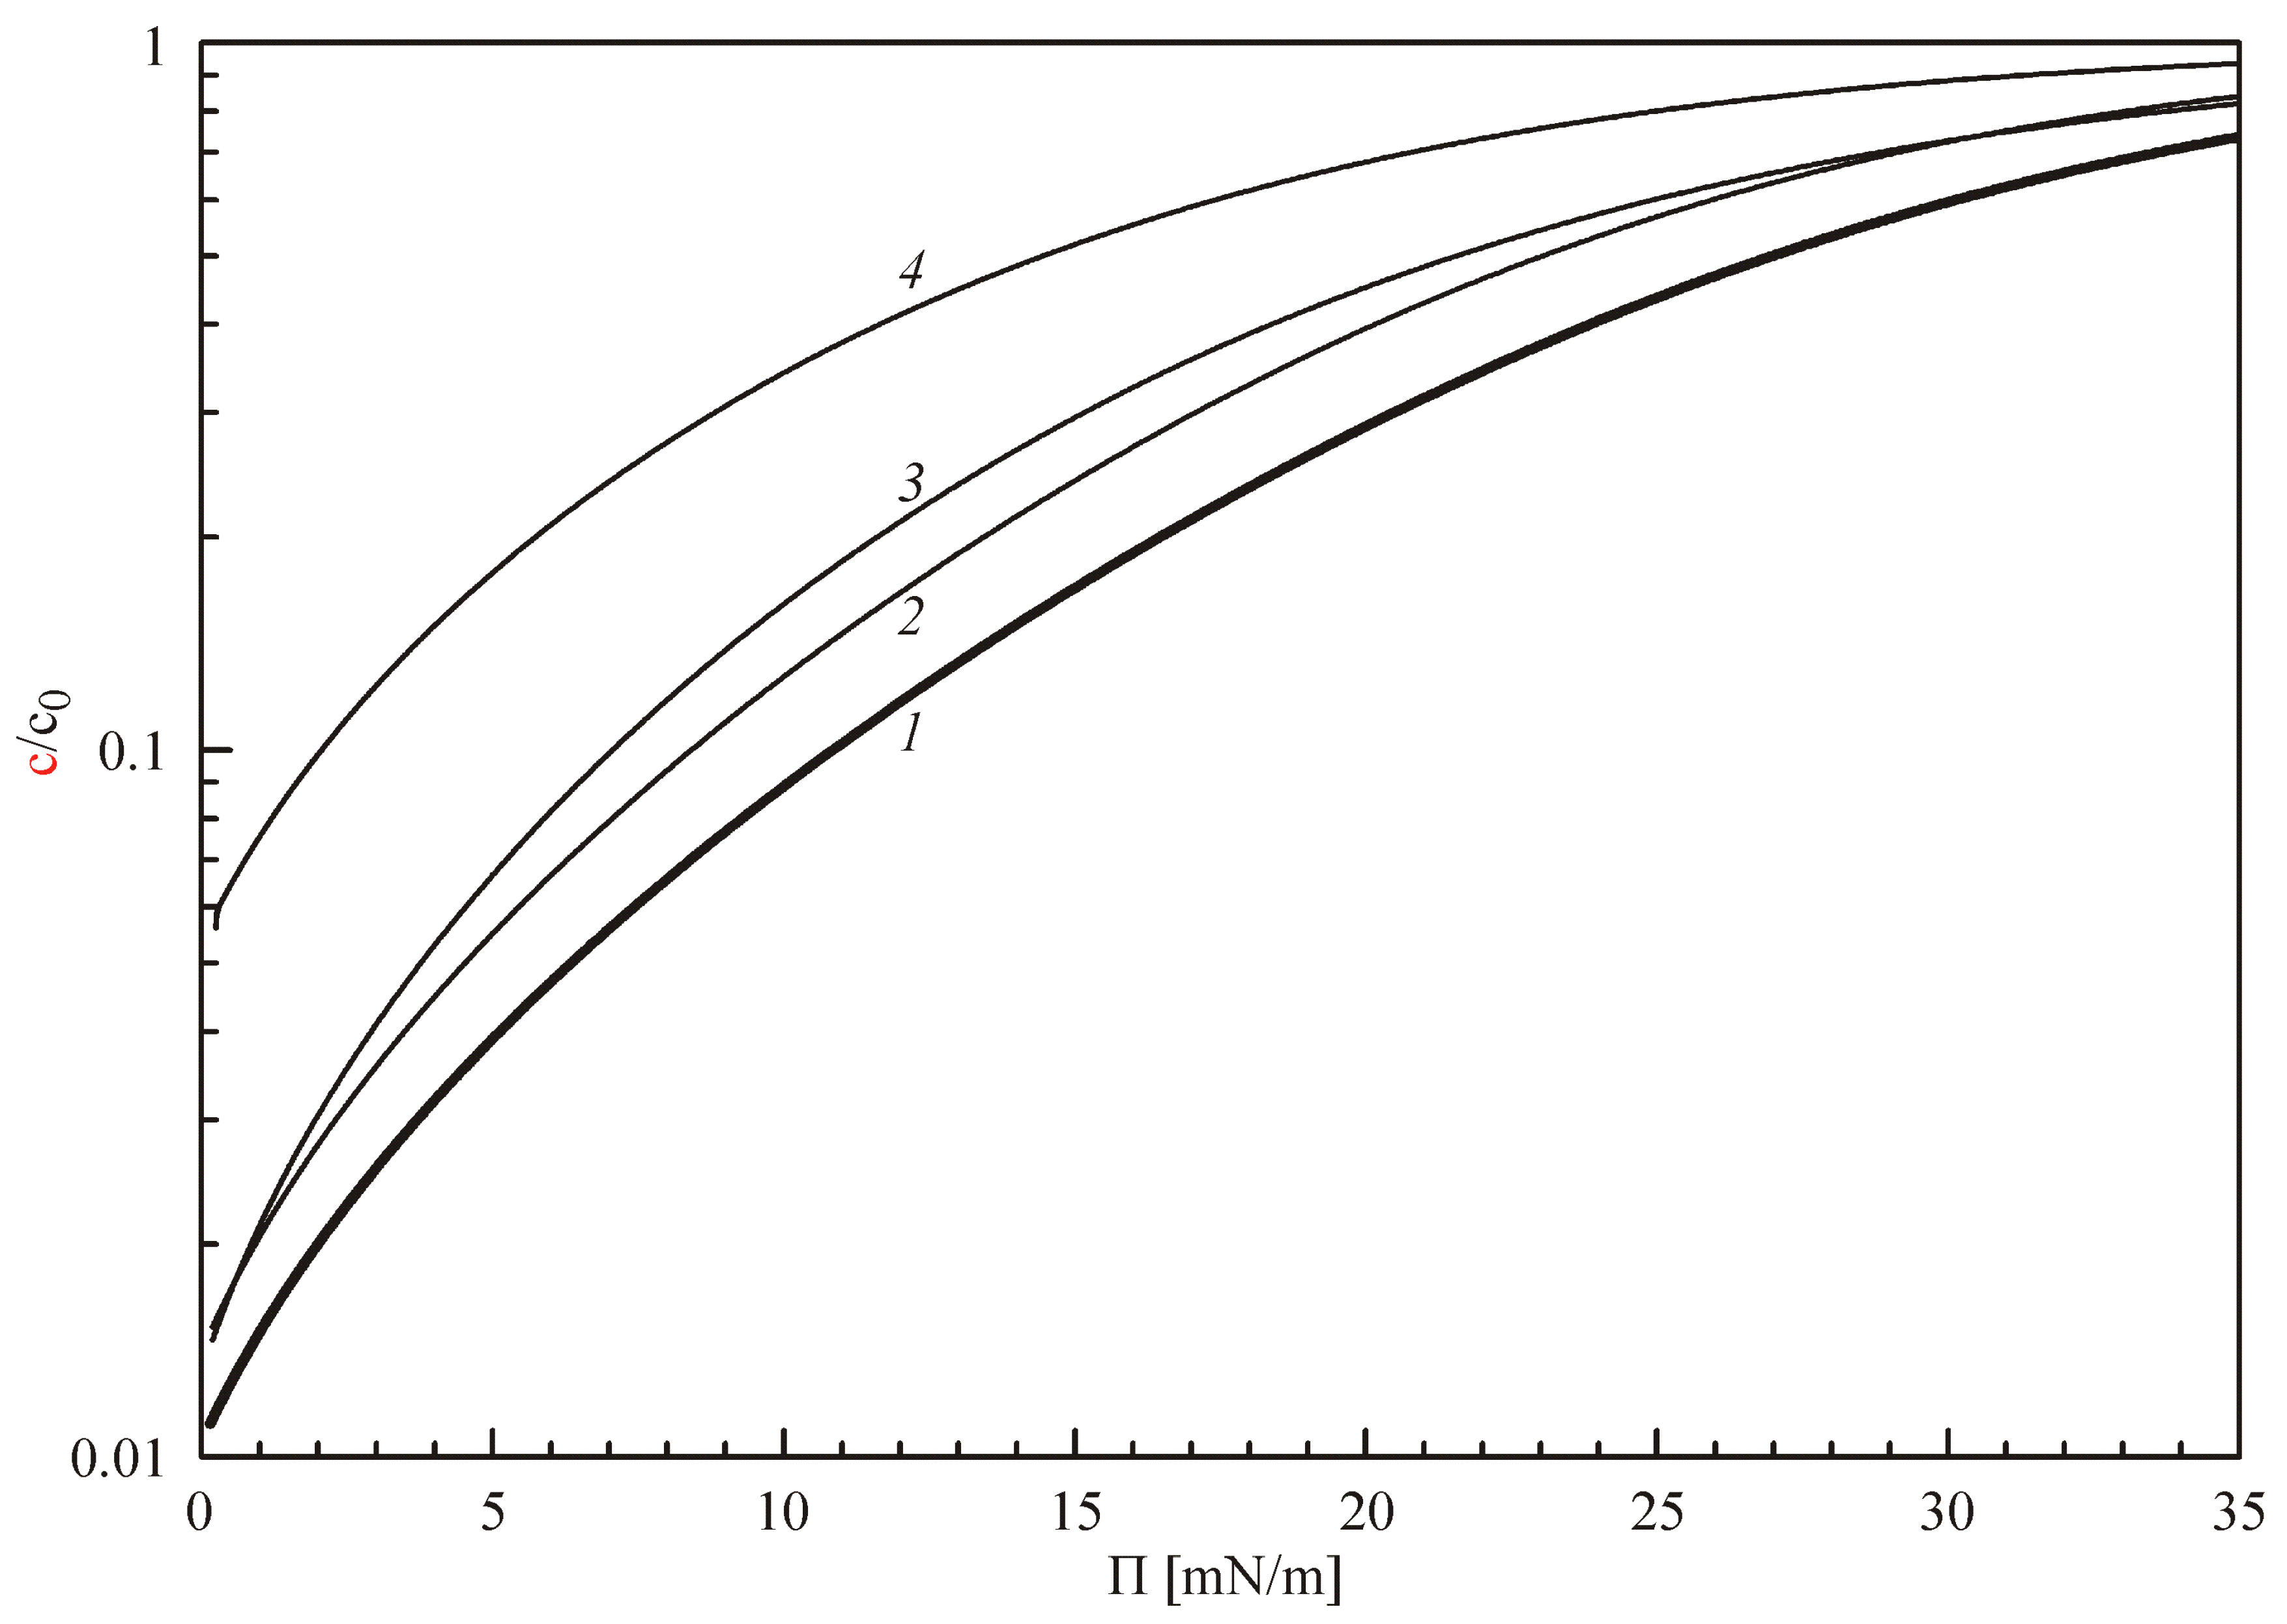
Figure 1 illustrates the dependence of the concentration ratio (
c/
c0) on the surface pressure Π for the values listed above (bold curve 1), and with certain changes of single parameters to
ω = 3.7 × 10
5 m
2/mol (curve 2), or
a = −2 (curve 3), or
S/
V = 1 mm
−1 (curve 4). It is seen that for the optimum parameter values (given by curve 1), the equilibrium surfactant concentration
c at low surface pressure is by two orders of magnitude lower than the initial concentration
c0. The highest values in
Figure 1 were obtained for
S/
V = 1 (curve 4), which quite naturally follows from relation (4) that describes the surfactant mass balance within the drop: the smaller is the ratio
S/
V, the higher is the equilibrium concentration within the drop. The increase of
ω and decrease of
a also result in an increase of the equilibrium concentration. In particular, for negative interaction parameters
a, the variations of this parameter result in strong changes of the equilibrium surfactant concentration within the drop, which is usual for ethoxylated surfactants in case the adsorption behaviour is described by the Frumkin adsorption model [
20,
21,
22].
The main purpose of the present work is to demonstrate the consistency of the proposed approach to study the surface-active properties of surfactant solutions via the analysis of data obtained by various experimental methods. To make this demonstration as obvious as possible, the following systematic is applied. In all figures below, the experimental points and theoretically calculated curves plotted as dependencies both on the initial bulk concentration
c0, and on the equilibrium concentration
c are shown in the same figures. To distinguish between these two scales, the experimental values plotted against
c0 are shown by black open symbols, while those plotted against
c are shown by red filled symbols. Moreover, to compare the results obtained by fitting the depletion-dependent experimental data along the equilibrium concentration
c with the data obtained by depletion-independent techniques (such as bubble profile analysis tensiometry), the fitting results are recalculated via Equation (4) into dependencies on
c0, which are shown in the figures by dashed black lines. The results obtained by fitting of the depletion-independent experimental data by the model isotherm are recalculated into the depletion-dependent scale and plotted against
c by solid lines in red colour. Then, the more perfect is the agreement between the experimental data obtained by a certain method, and the corresponding dependence obtained by fitting of the data measured by the alternative method, the more consistent is the proposed approach applied to this particular system, provided the fitting was performed in both cases with the same set of model parameters (see
Table 1).
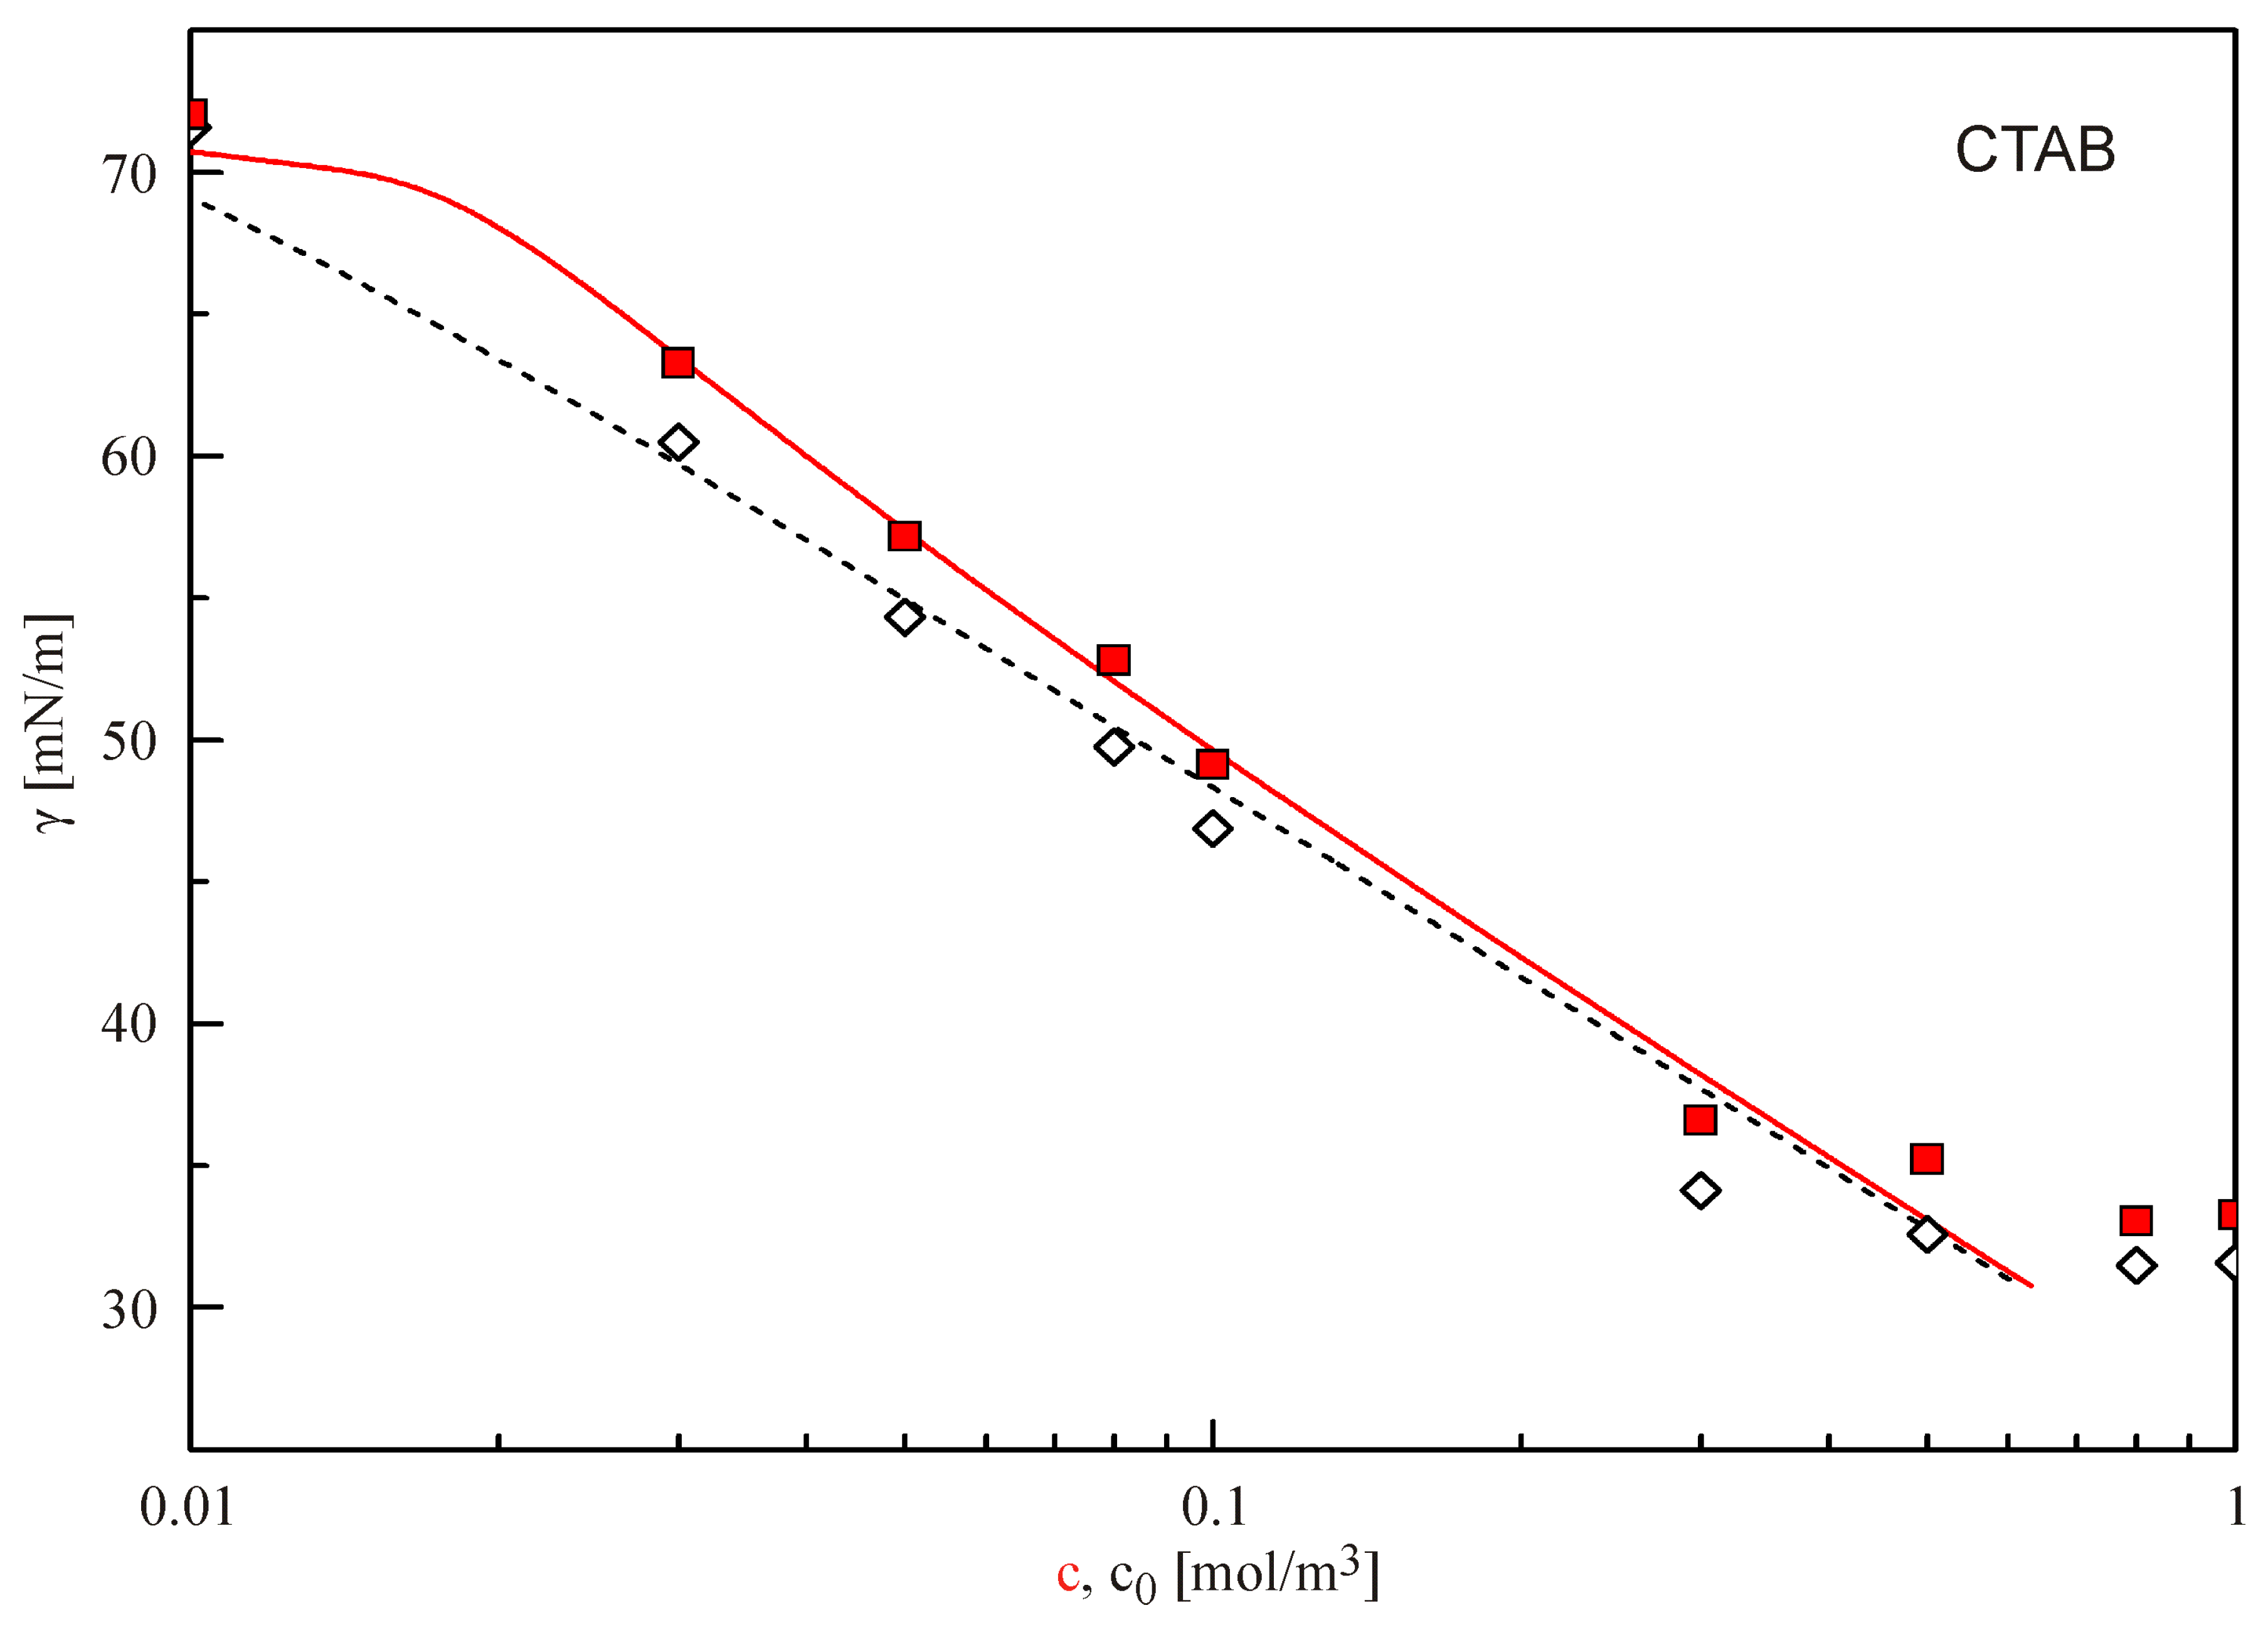
In
Figure 2 the equilibrium surface tensions for CTAB solutions are shown as measured with PAT using the configuration of bubble profile (◇) and drop profile (
■) analysis tensiometry, respectively. As one can easily see, the data measured in the bubble mode are much lower than those obtained in the drop mode. Hence, the obtained isotherm constructed with the drop data is shifted toward higher concentrations as compared with the isotherm obtained from the bubble data. Moreover, the slope of the isotherm is less steep for the bubble data as that for the drop data.
The isotherm data have been fitted in two ways as described above, with the model isotherm parameters listed in the Table; the depletion of the surfactant concentration due to adsorption was calculated for the surface area to drop volume radio S/V = 2.3 mm−1. The correspondence between the experimental points and the recalculated fitting curves in the range below the CMC is obvious.
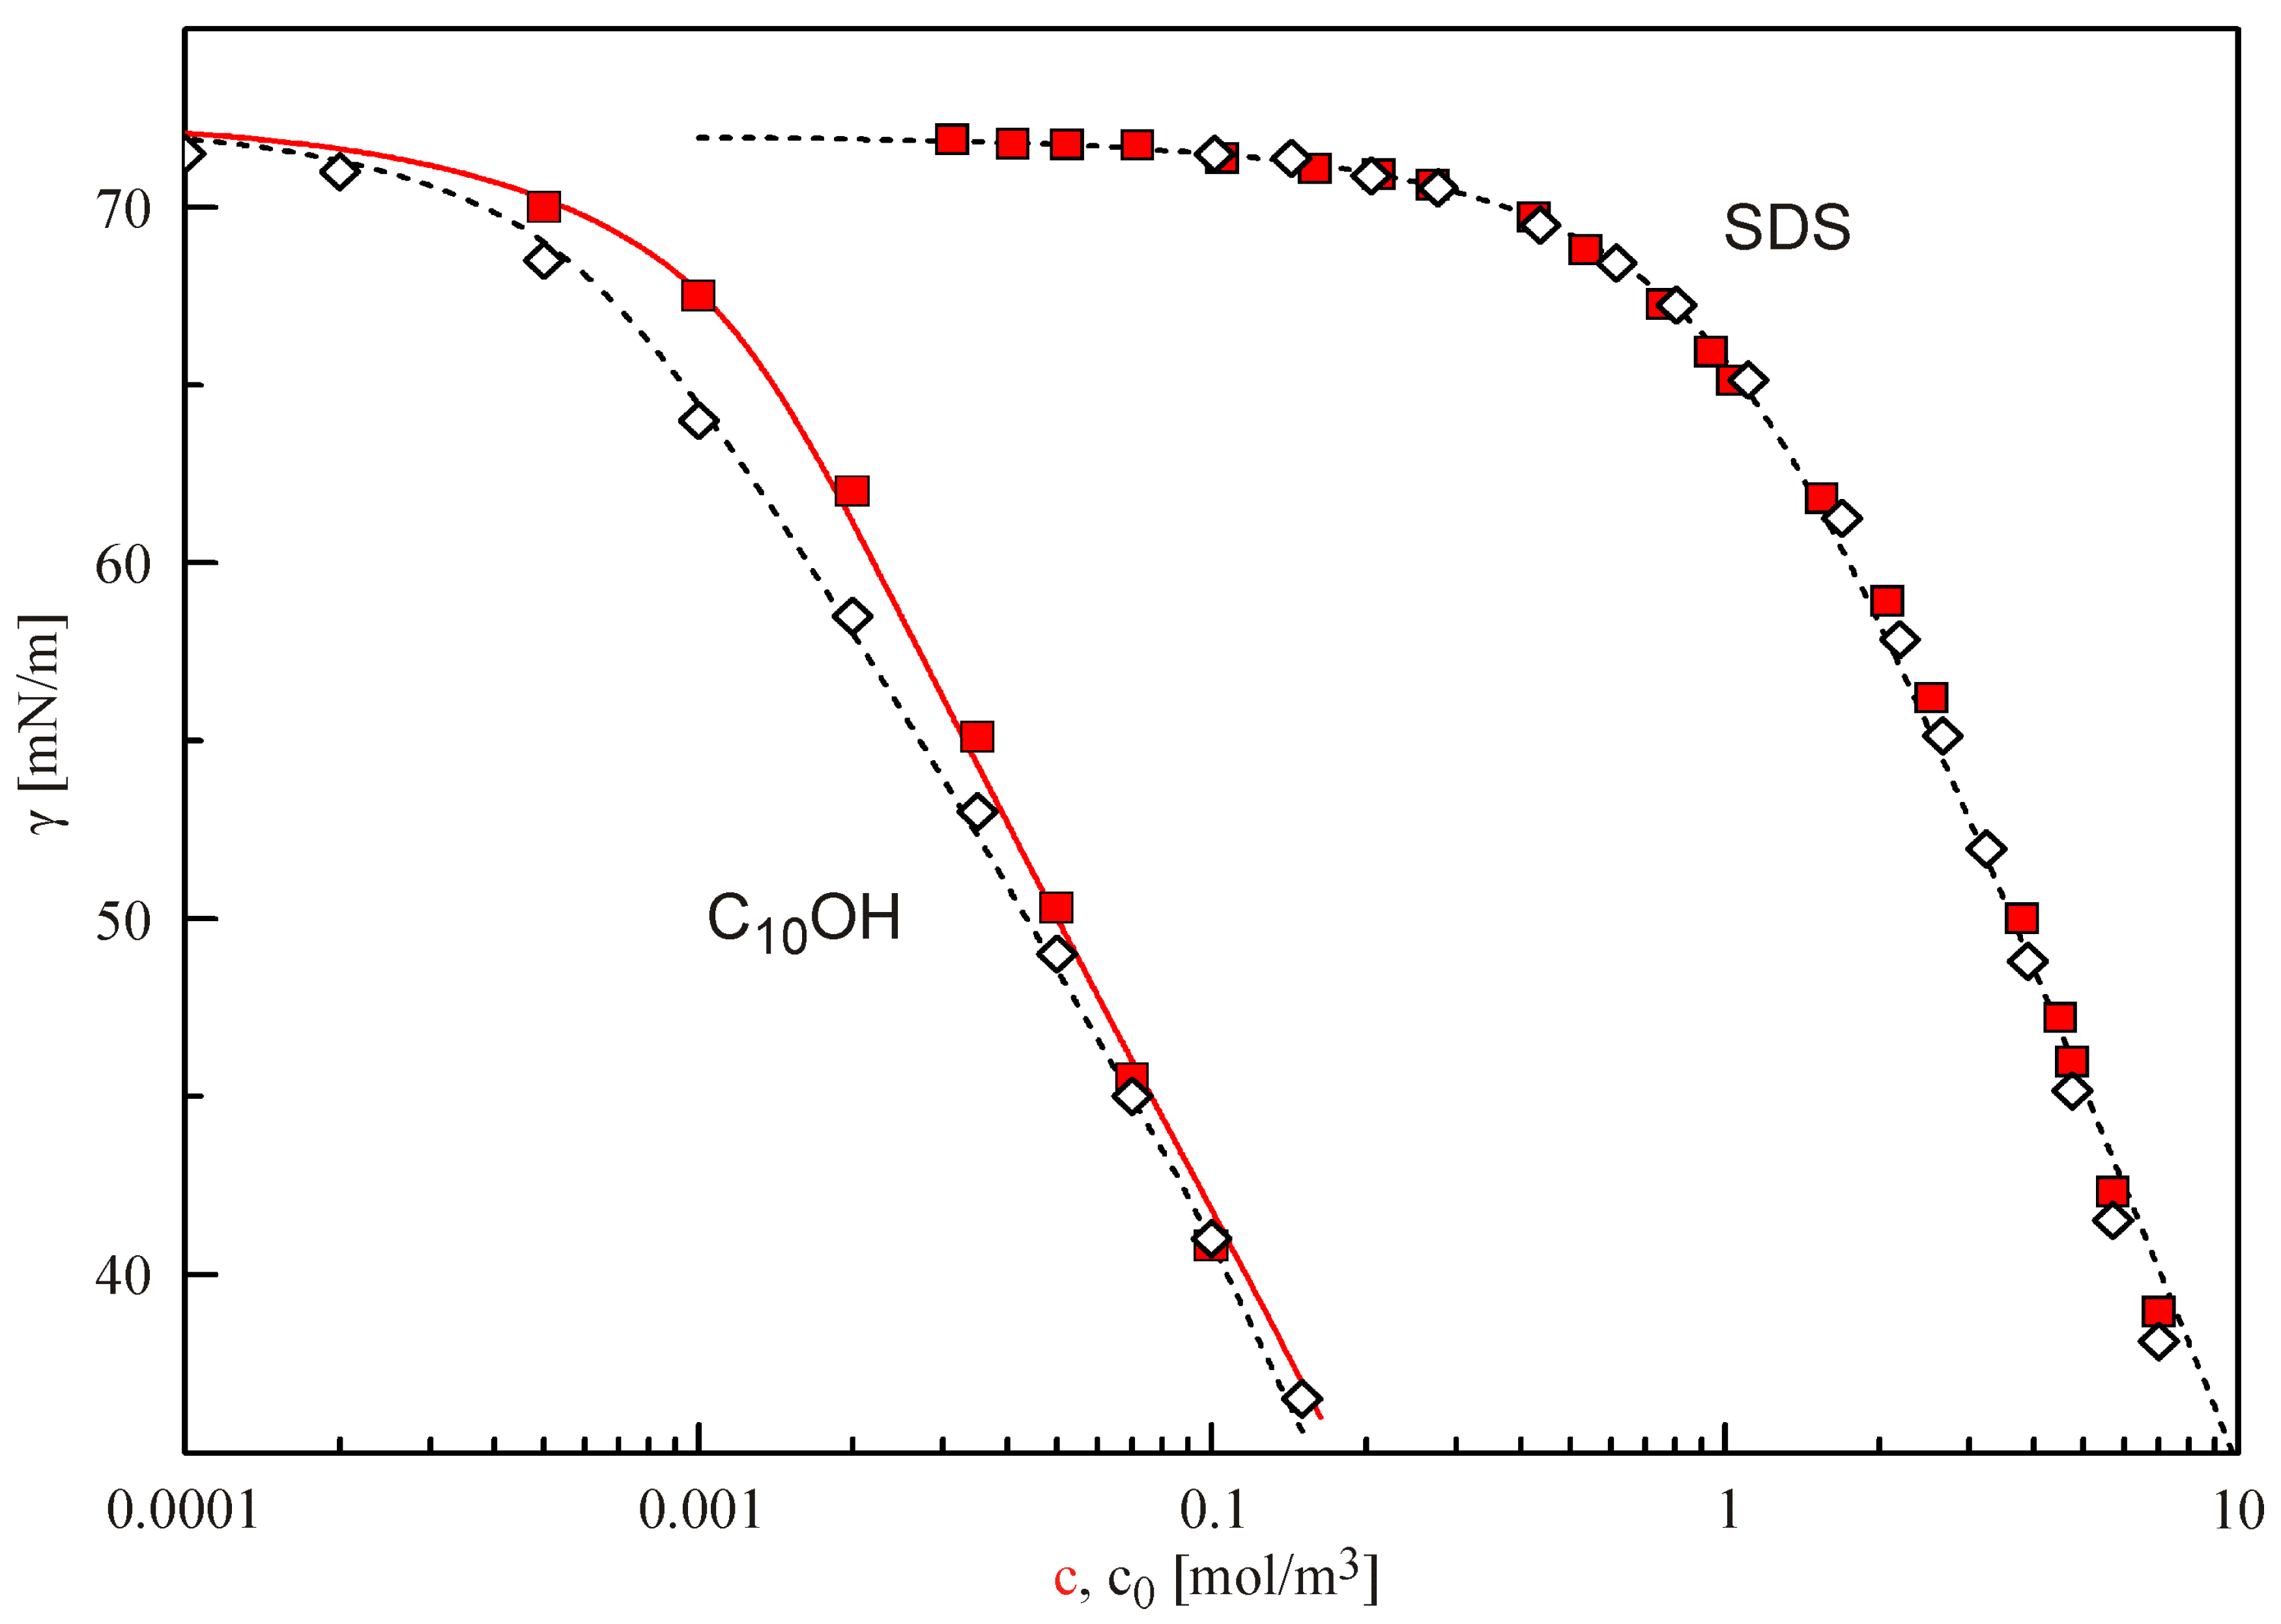
The graphs in
Figure 3 show the experimental data and the isotherms for two more surfactants: the anionic surfactant SDS and the non-ionic decanol C
10OH. The model parameters used in the fitting are listed in
Table 1. From the location of the isotherms, we can easily see that SDS is much less surface active than C
10OH. Consequently, the resulting correction, with the same ratio
S/
V, leads to much less depletion, i.e., the SDS data measured in the drop and bubble mode, respectively, are almost identical. In contrast, the surface activity of C
10OH is larger than that of SDS, and the depletion effects are more significant.
There is an excellent agreement between the curves calculated for C10OH as explained above (the dashed curve with the bubble data and the solid curve with the drop data). Thus, the proposed procedure for fitting equilibrium surface tension data with the Frumkin model including the simultaneous consideration of depletion due to adsorption leads to perfectly consistent results.
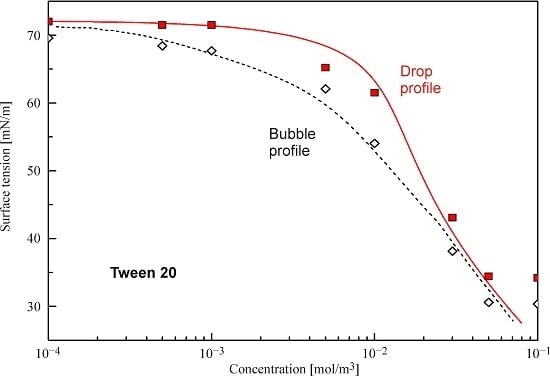
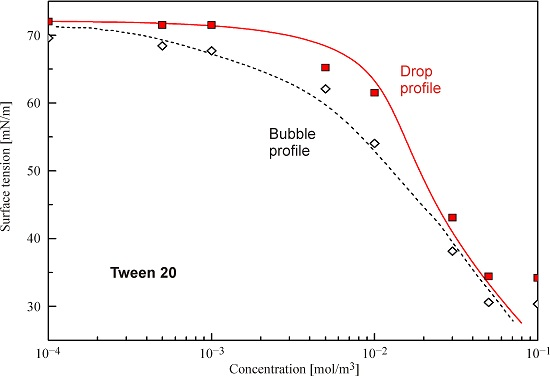
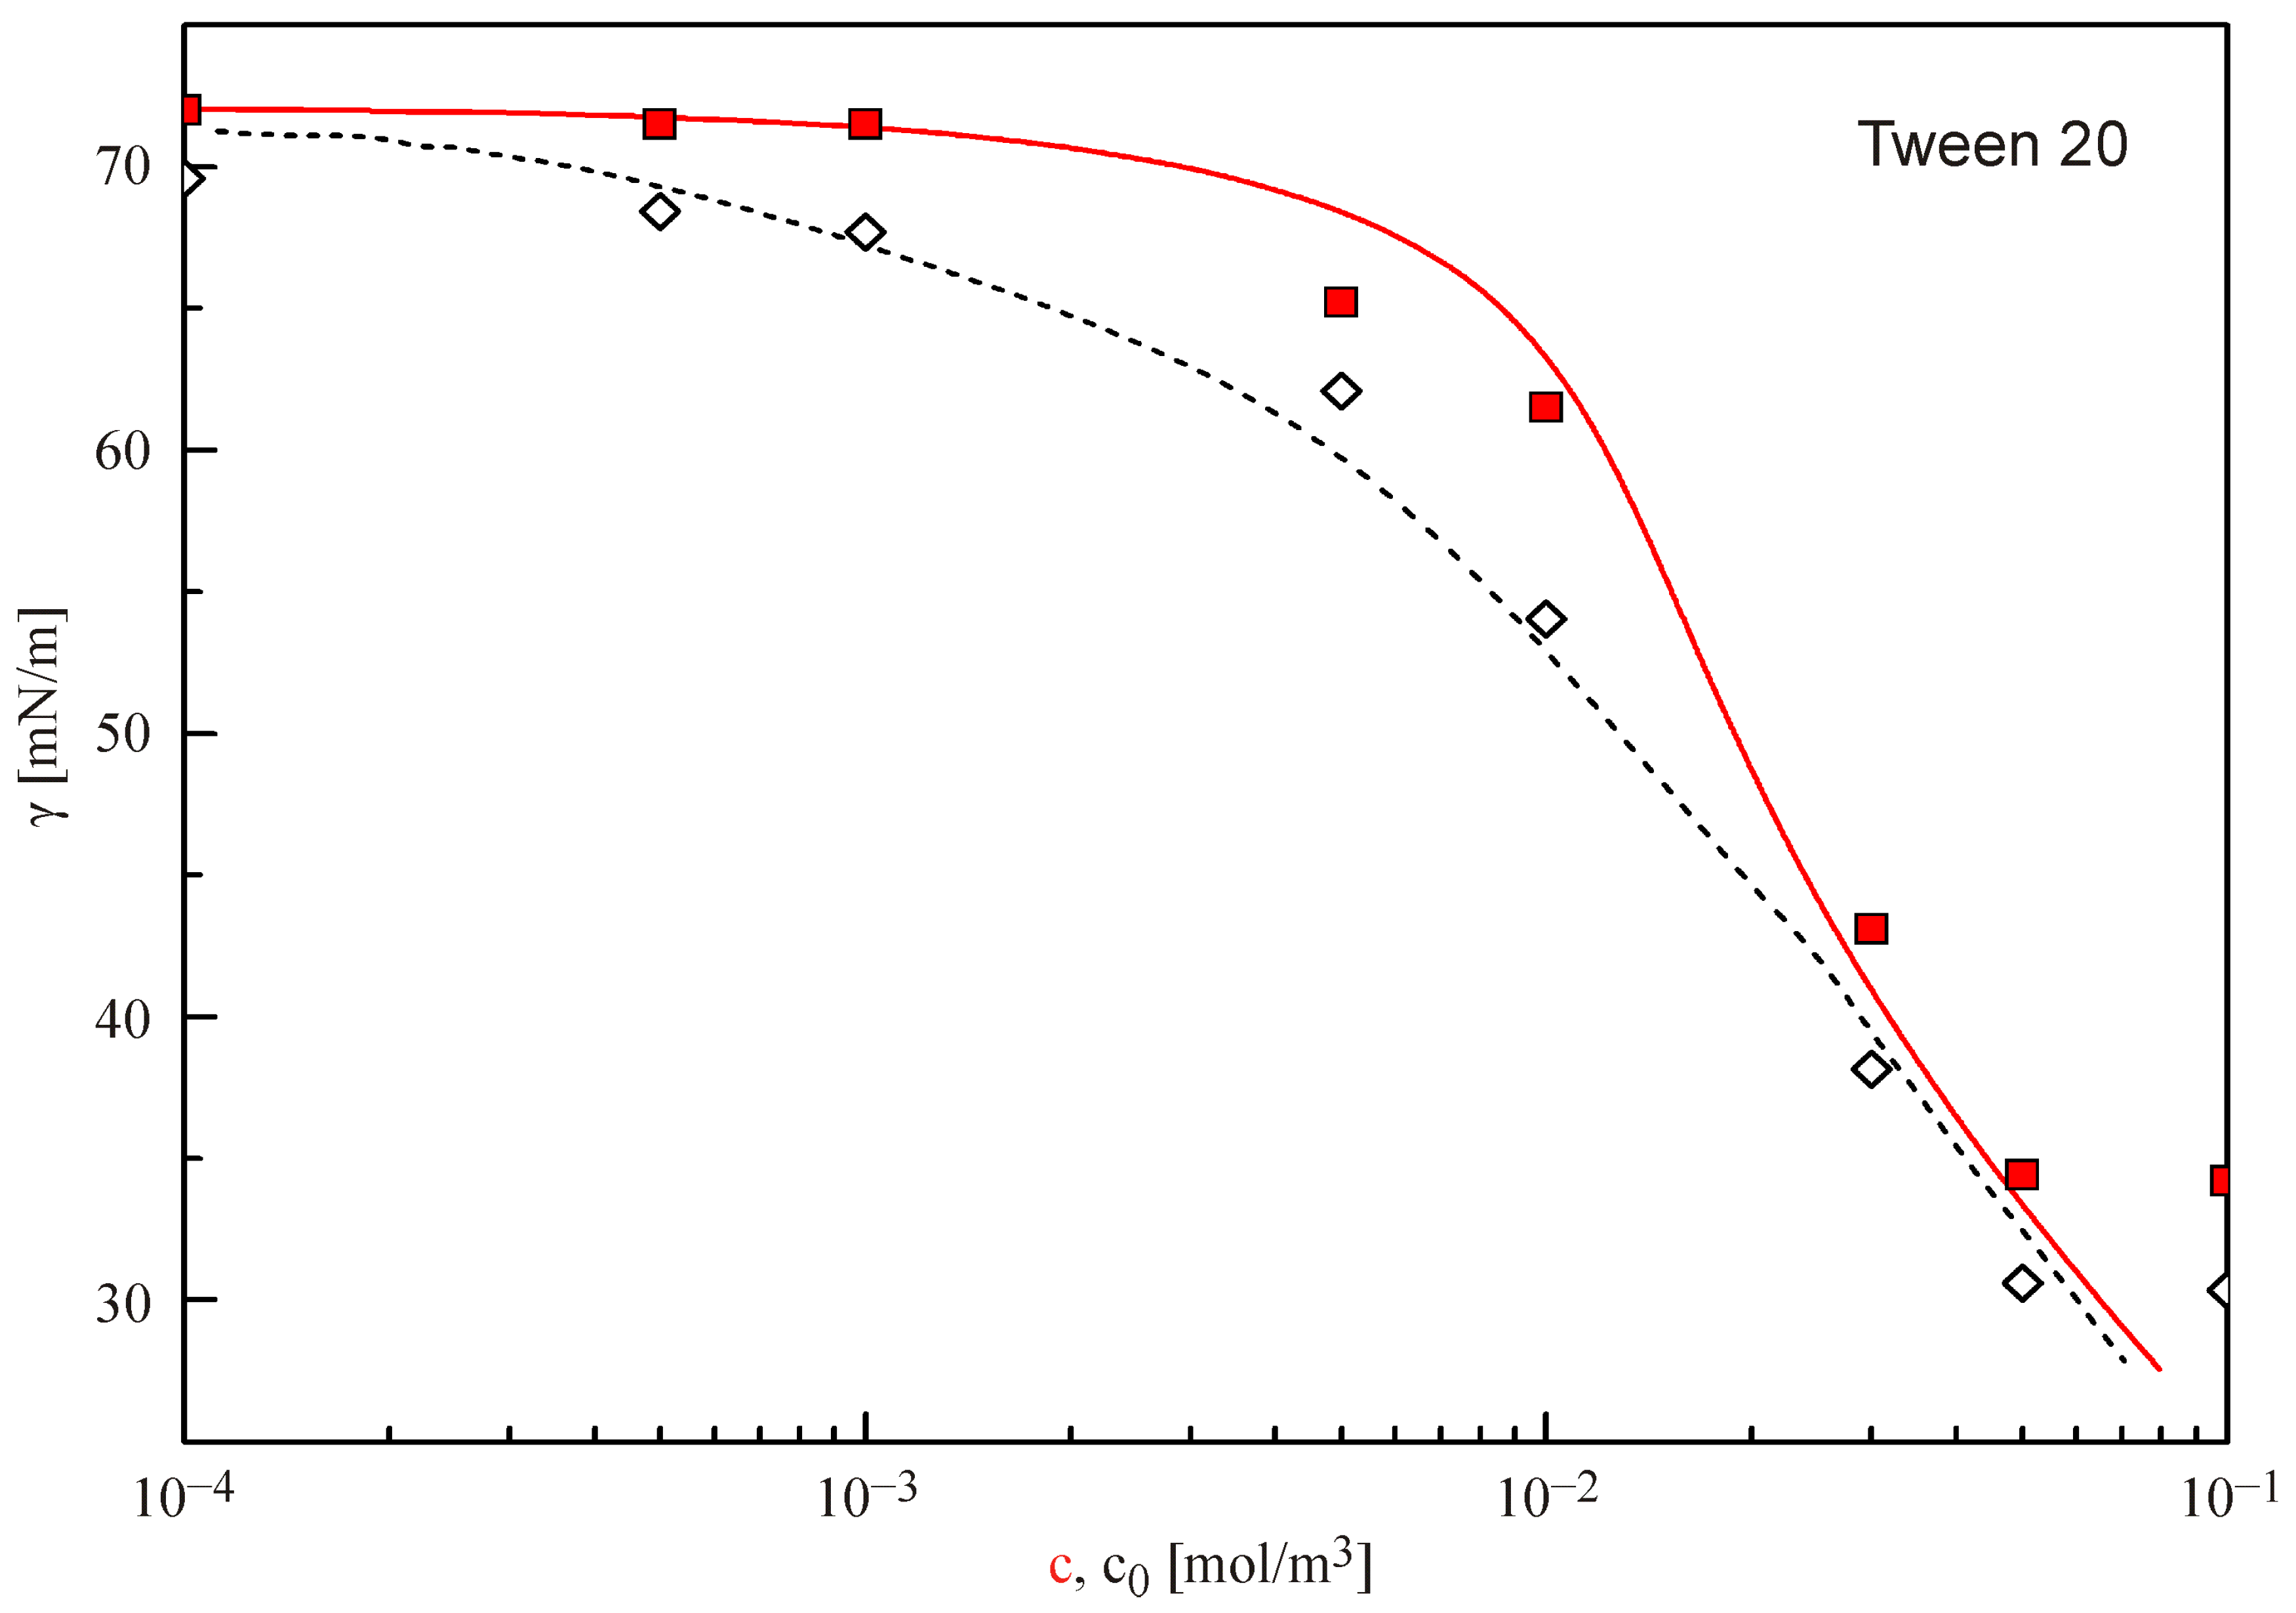
The experimental results and the isotherms for Tween 20 calculated with the parameters shown in
Table 1 are summarised in
Figure 4. Again, a satisfactory correspondence is seen between the experimental data and the fitting curves recalculated as explained above.
Let us consider now the isotherms measured by the bubble and drop profile analysis methods for aqueous solutions of the equimolar ion pair of the cationic DoTAB (R
+Br
−) and the anionic SDS (Na
+R
−) having the same length of the alkyl chain. Details of mixed adsorption layers of anionic and cationic surfactants were reviewed in [
23]. It was shown therein that the formation of a soluble surface layer of a Na
+R
−/R
+Br
− mixture involves a highly surface active complex, which adsorbs at very low bulk concentrations (at several orders of magnitude lower concentrations than the individual components). Therefore, among all combinations of ions that could participate in the formation of the adsorption layer, it is sufficient to take the adsorption of only
R−R+ into account, as this is the entity with the highest adsorption activity coefficient
bR−R+.
The results obtained for mixtures of SDS (Na
+R
−) and DoTAB (R
+Br
−) in a wide concentration range and various molecular mass ratios (1/64, 1/8, 1/4, 1/2, 1/1 and 8/1) were extensively discussed in [
23]. It is worth mentioning that the surface tension isotherms obtained for all these mixtures, when plotted as surface pressure in dependence of the average ionic product concentration (c
R+c
R−)
1/2, collapse on a single curve.
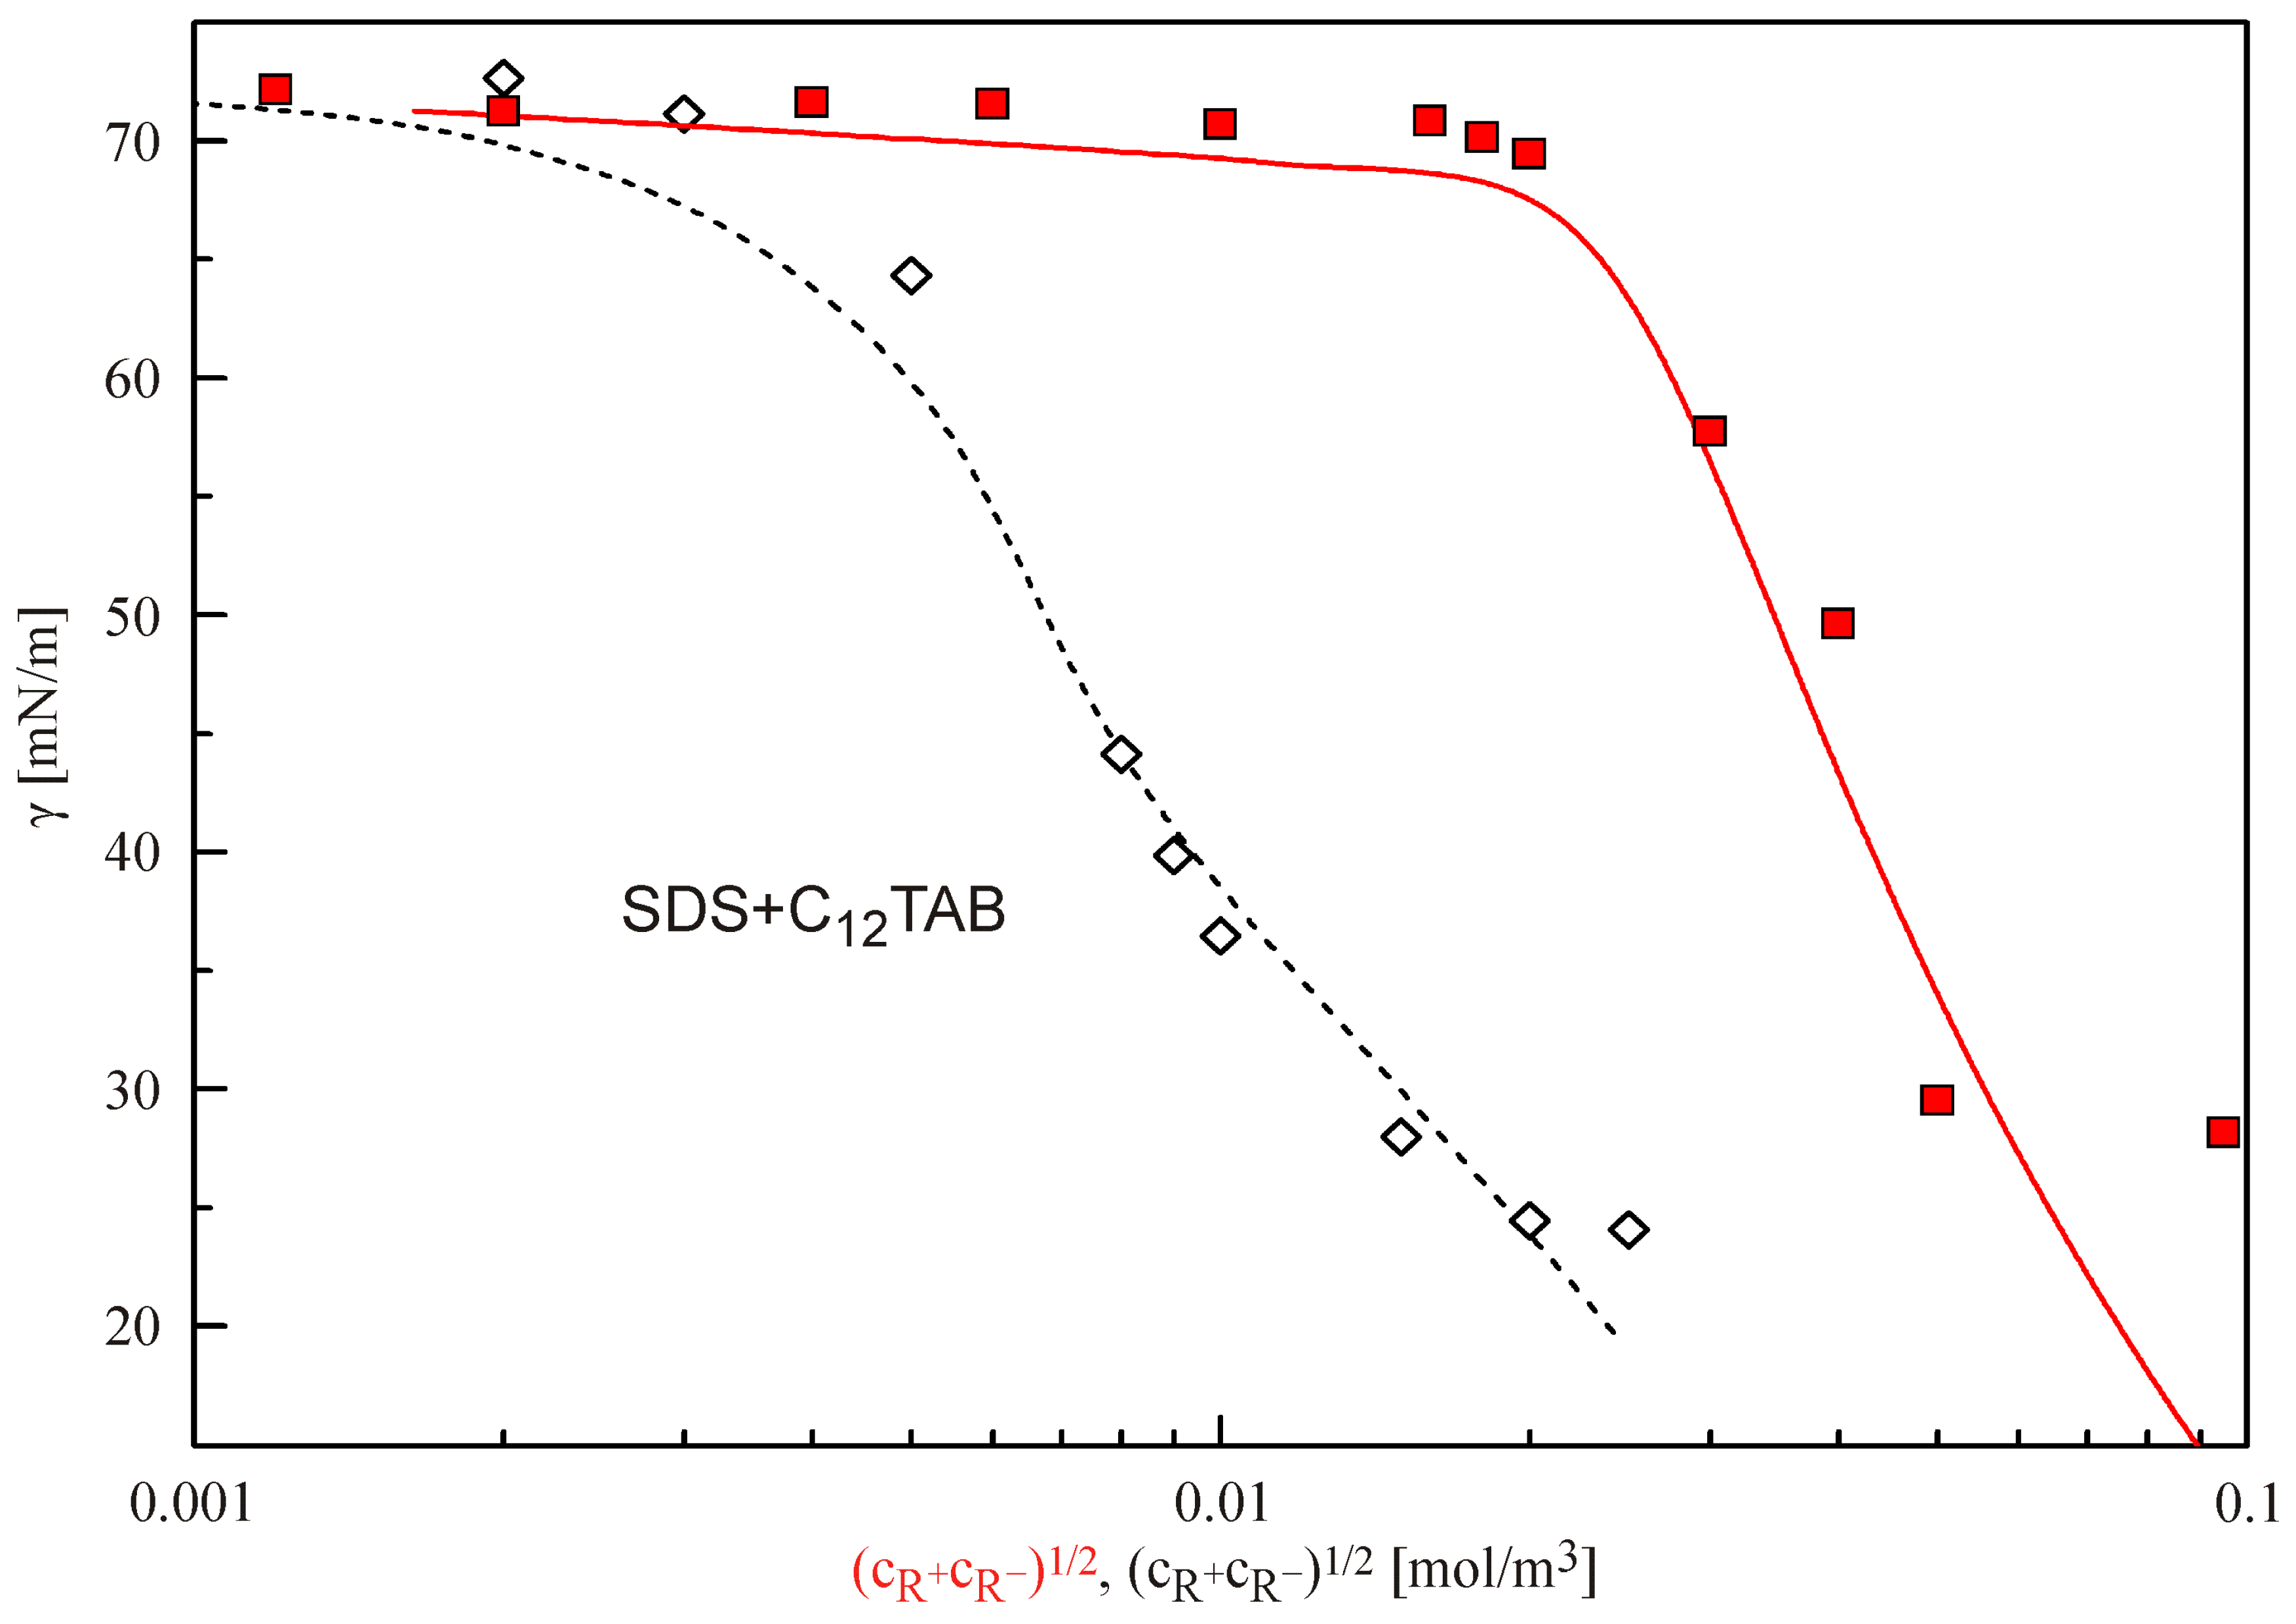
In the present article, only the equimolar mixture of the two surfactants (1/1) is analysed. Therefore, the ionic product concentration (c
R+c
R−)
1/2 is equal to the concentration of each surfactant in the mixture, or to half of the total concentration of the two surfactants. The experimental data and calculated results obtained by fitting with the parameters listed in
Table 1 are plotted in
Figure 5. The dashed curve calculated for the depletion-independent case is quite close to that presented in [
23] as obtained by Wilhelmy plate experiments. The fitting of the experimental data is good, and the molar area estimated via a best fit is realistic. Again, the agreement of the results obtained by fitting the experimental data obtained by a certain method, and the corresponding dependence obtained by fitting the data obtained by the alternative method demonstrates the consistency of the approach proposed here.
5. Conclusions
An algorithm is developed for the determination of the characteristic adsorption parameters from experimental data measured by drop profile analysis tensiometry. The algorithm assumes the balance between the surfactant mass in the drop bulk and the amount adsorbed at the drop surface, taking into account the surface area and volume of the drop, and hence the capillary radius. The application of the proposed algorithm to fit the data obtained for a surfactant by various experimental methods results in the same set of model parameters, showing the consistency of the proposed data analysis procedure.
The comparative analysis of the data calculated for surfactants with different adsorption activity has shown increasing differences between the results obtained for the same surfactant by the drop profile method and the bubble profile method (for which the surfactant concentration in the vicinity of the interface does not vary during the adsorption, i.e., no depletion effects occur). The differences, which are observed between the results measured by the drop and bubble methods, become less significant with increasing initial surfactant concentration (that is, with the decrease of the surface tension). For capillaries with a smaller radius, the ratio of the drop surface area to the drop volume is higher, which results in a higher decrease of the surfactant concentration within the drop bulk as compared with the initial one during the adsorption equilibration process.
The overall conclusion is that for surfactants with a sufficiently high adsorption activity, i.e., the value of the adsorption activity parameter b is larger than 10 m³/mol, the drop profile analysis tensiometry provides equilibrium surface tension data that can be analysed with respect to the adsorption model only, when the depletion of the bulk concentration due to adsorption at the drop surface is quantitatively considered.


