Comparison of the Critical Coagulation Concentrations of Allophane and Smectites


1
Bundesanstalt für Geowissenschaften und Rohstoffe (BGR), Stilleweg 2, D-30655 Hannover, Germany
2
Landesamt für Bergbau, Energie und Geologie (LBEG), Stilleweg 2, D-30655 Hannover, Germany
*
Author to whom correspondence should be addressed.
†
Present Address: Bundesamt für Kerntechnische Entsorgungssicherheit (BfE), Willy-Brandt-Straße 5, 38226 Salzgitter, Germany.
Colloids Interfaces 2018, 2(1), 12; https://doi.org/10.3390/colloids2010012
Submission received: 5 March 2018
/
Revised: 16 March 2018
/
Accepted: 19 March 2018
/
Published: 21 March 2018
Abstract
:Clays consist of fine particles (clay minerals) which under certain conditions can be dispersed in water, forming a fairly stable dispersion. The stability of the clay mineral dispersions depends on the pH, solid/liquid ratio, and most of all on the type and concentration of dissolved ions. The difference between the dispersibility of different clays is not yet understood. In the present study allophane and smectite (main constituent of bentonite) are compared. Allophane surfaces are dominated by aluminol groups. Therefore, they can be used to investigate the properties of the edges of platy dioctahedral clay minerals. Dispersion and coagulation of allophane was understood based on the charge of the surface functional groups. Dispersion of allophane was only possible at pH < 5 where the aluminol groups became positive and at low ionic strength (critical coagulation concentrations (CCC) < 10 mmol/L NaCl). Dispersion at high pH may also be possible but this was not tested in the present study. In contrast to allophane, bentonite dispersions coagulated when the edges of the smectites became positive. This is probably caused by heterocoagulation leading to edge (+)/face (−) aggregation. CCC values of different bentonite dispersions ranged from 10 to 750 mmol/L. Most of the Wyoming bentonite dispersions were more stable and even above the CCC, sedimented much slower compared to other bentonites. The reason for this phenomenon could not be identified and needs further research.
1. Introduction
Dispersion of a clay mineral in a liquid depends on the sample pretreatment (aggregate size, mechanical activation), primary particle size distribution, layer charge density, solution/solid ratio, pH, and ionic strength. The forces determining the stability of dispersions are van der Waals attraction, electrostatic repulsion, and repulsion due to adsorbed large molecules [1]. Dispersions can be destabilized if dispersed particles are forced to coagulate, e.g., by increasing the ionic strength. This process called flocculation or coagulation, can be best explained by the DLVO (Derjaguin, Landau, Verwey, Overbeek) theory [2,3,4]. At low ionic strength the extension of the diffuse double layer (DDL) is larger and particle interaction depends on the interaction of the DDLs. With increasing ionic strength, the DDL is compacted and its extension decreases. At a certain ionic strength, depending on the type of ions, the DDL is so compacted that the surface potentials of the clay minerals are no longer masked. The resulting particle interaction causes coagulation and the dispersion is flocculated. The concentration, at which this coagulation occurs, is termed CCC: the critical coagulation concentration, or c.c.c. [2], or ck [5]. Van Olphen [2] defined the CCC as: “…the minimum electrolyte concentration that will cause the rapid flocculation of a suspension in a given time”. According to Missana & Adell [6] the DLVO-theory fails to explain the dependency of the CCC on the pH value in the case of clays.
The CCC strongly depends on the type of ions added to the system, particularly on their valency. Cations with larger charge are more effective with respect to flocculation. According to the empirical rule of Schulze and Hardy [7] 25–150 mmol/L monovalent cations are required for flocculation. Much lower concentrations of bivalent cations (0.5–3 mmol/L) or trivalent cations (0.01–0.1 mmol/L) are required for flocculation of dispersed colloidal particles.
The CCC has a direct impact on different applications of clays; for example, for water treatment or detachment of colloidal particles from barrier systems [8,9], often termed “erosion”. Bentonites are used as a geotechnical barrier for the encapsulation of high level radioactive waste. The possibility to detach colloidal smectite particles from the engineered barrier in crystalline host rock depends on the composition of the rock pore water surrounding the barrier. In case the ionic strength decreases to values below the CCC, smectite particles could be dispersed and hence could possibly be detached from the barrier. The probability of smectite colloid detachment, however, is much larger if Na is the dominant smectite counter ion [10]. The interlayer composition, however, also depends on the composition and ionic strength of the surrounding rock water and may change over time [9], particularly in post-glacial periods.
The CCC can be measured by single particle detection methods, low-angle static light scattering, turbidemitry, and dynamic light scattering [11]. The advantage of the dynamic light scattering is that coagulation kinetics can be measured. Novich & Ring [12] reported on the use of photon correlation spectroscopy for the investigation of the coagulation rate of clays. Other methods are based on the investigation of dispersions after a defined time. The dispersions then can be investigated in different ways. Hetzel & Doner [13] measured the absorbance of the top 2 cm at 615 nm. As an alternative, the CCC can also be determined based on visual inspection [2]. Notably, the CCC values measured can mostly only be used for a relative assessment because the parameters (and the experimental conditions) are arbitrarily selected [2].
The CCC of Ca/Mg dominated smectites is lower than that of Na- or Li-exchanged smectites, commonly ≤1 mmol/L (0.4 mmol/L [14]; 0.3 mmol/L [15]; 1 mmol/L [9]). More information is available about CCC values of Na-smectites. The significant range of values can be explained by different pH values and probably also by different materials and methods (e.g., if PO4 was used or not). The CCC of Na-smectites is much lower at low pH values (due to edge-face heterocoagulation). Tombacz & Szekeres [16] reported 25 mmol/L and Tombacz et al. reported 200–250 mmol/L at pH 4 [17]. At pH 10, Novich & Ring [12] reported 290 mmol/L and Tombacz & Szekeres found 100 mmol/L at pH 8 [16]. Much larger values were reported by Tombacz et al. (up to 400 mmol/L) at pH 8 [17].
Typical CCC values for Na-smectites are around 5 mmol/L if no phosphate is used and 300–400 mmol/L if PO4 is used to prevent heterocoagulation [7]. Smectites are known to differ with respect to their properties such as layer charge density (LCD), charge location (montmorillonitic or beidellitic), particle size (diameter of the TOT layers), chemical composition (isomorphic substitution of Al by Mg and/or Fe), microporosity, and even morphology. According to Frey & Lagaly [18], the CCC of montmorillonite and beidellite differs in that it is a little lower for beidellites (0.37–0.44 mol/L NaCl for montmorillonite and 0.25–0.29 mol/L NaCl for beidellites; determined with 0.01 mol/L Na4P2O7). Comprehensive studies comparing a set of well characterized different bentonites/smectites do not exist.
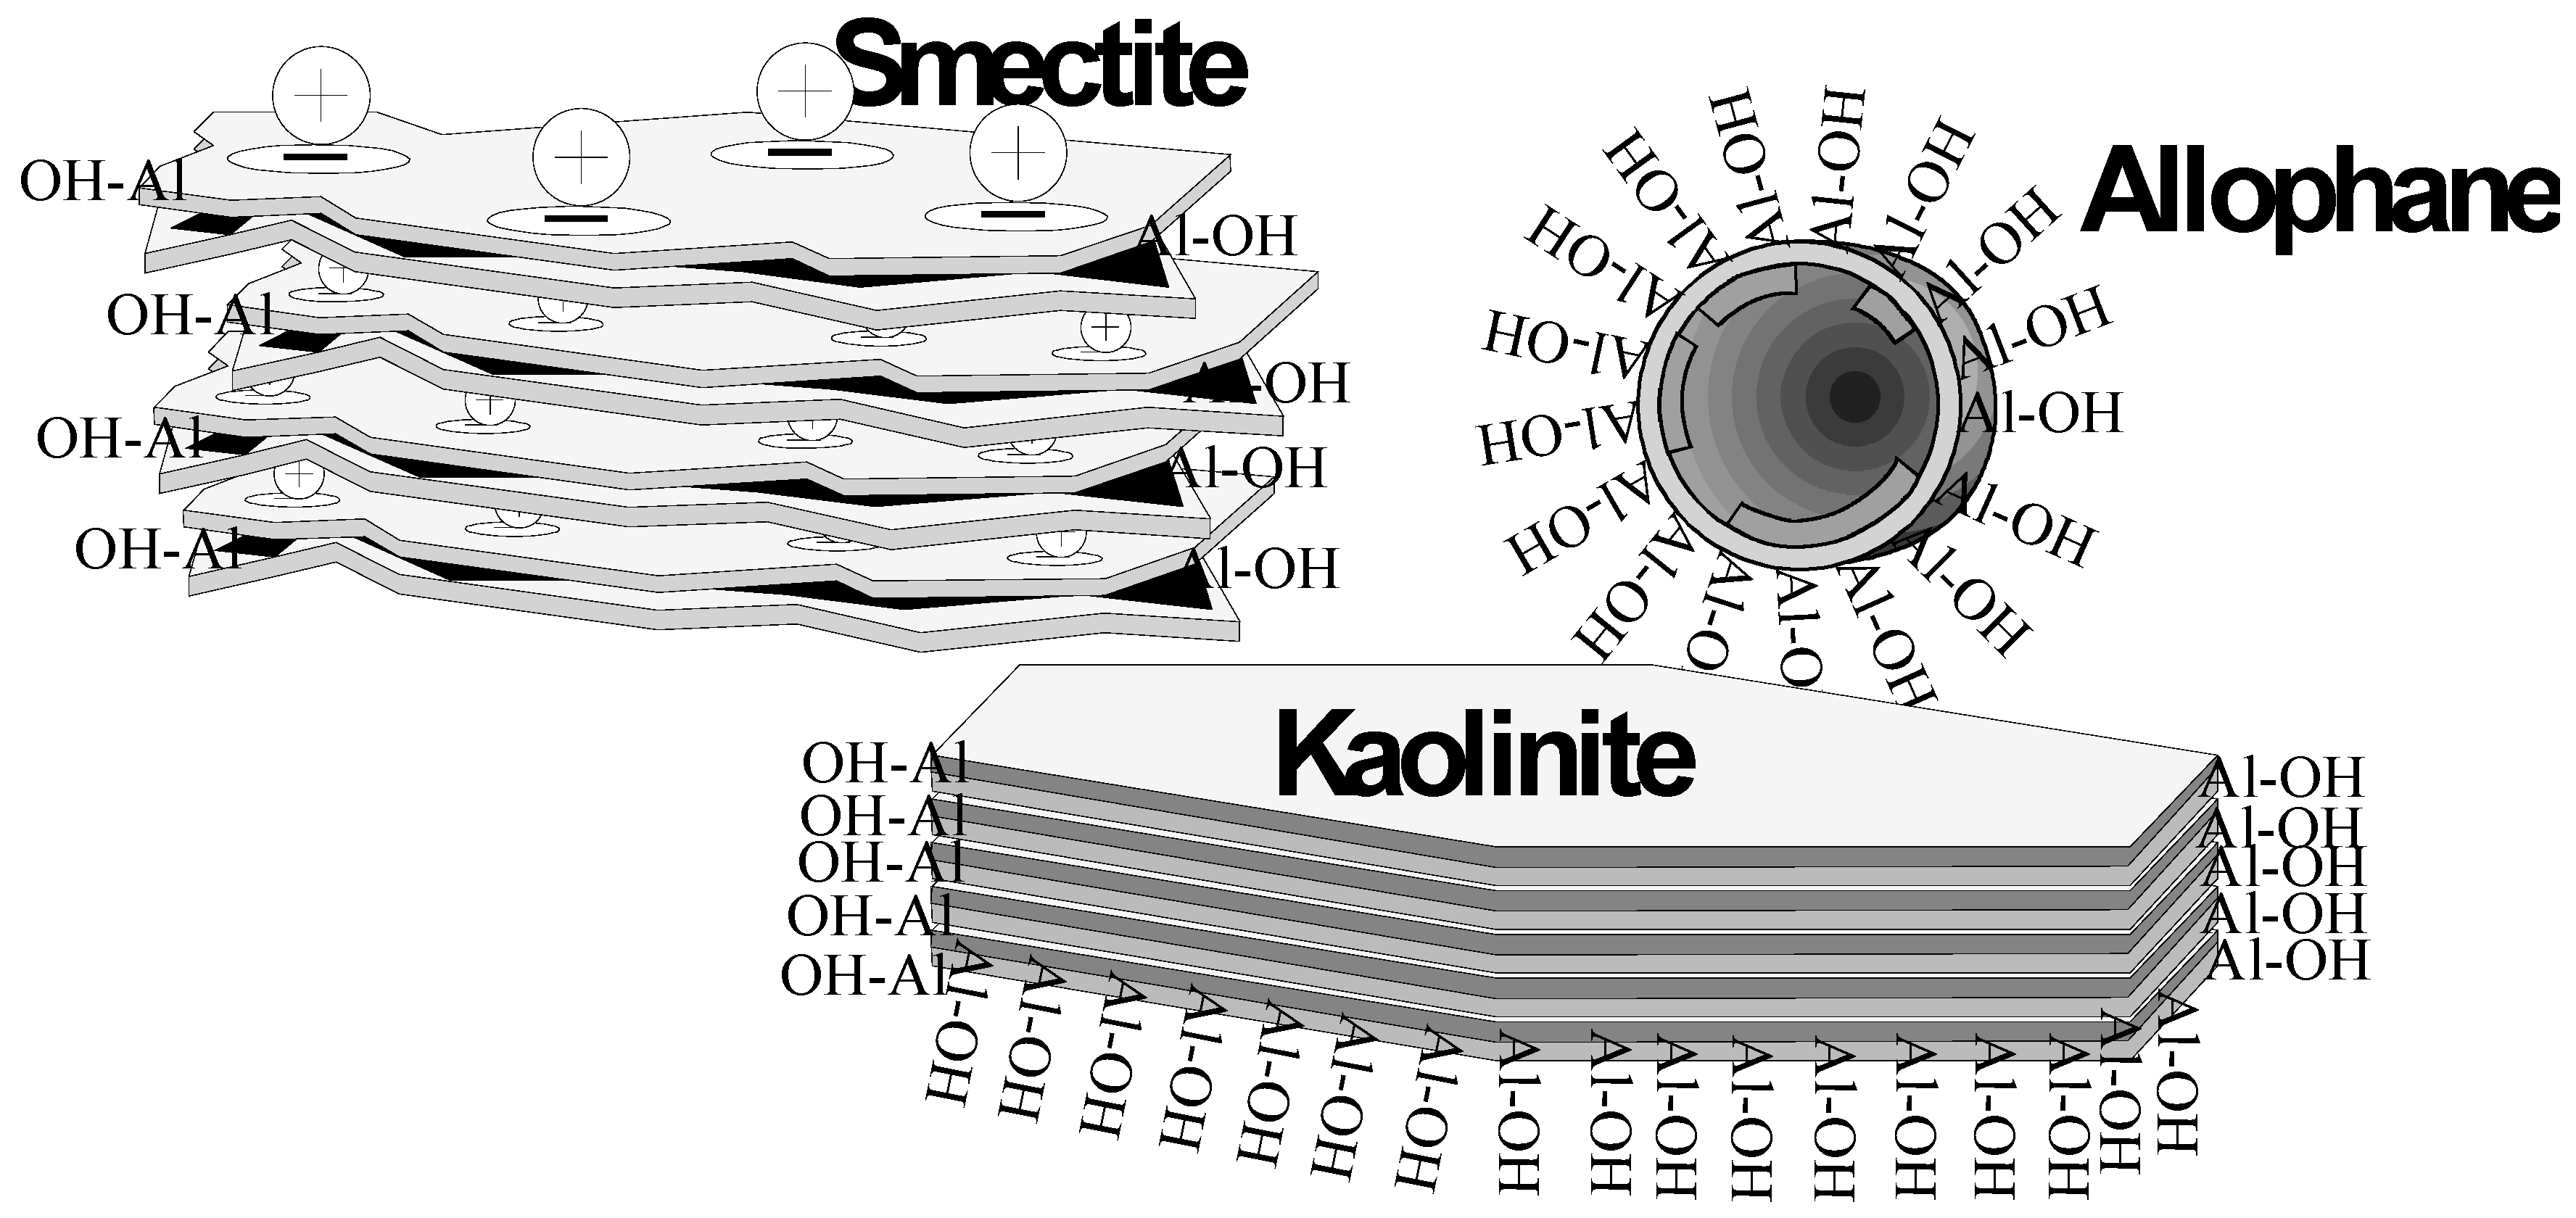
The permanent charge of kaolinites is much lower compared to smectites. Hence their properties are much more affected by the variably charged aluminol groups. Kretzschmar et al. [11] also found heterocoagulation to be important for kaolinites at pH < 5.8. In contrast to smectites and kaolinites, and other clay-sized minerals with heterogeneous surfaces (different chemical characteristics of edges and faces) allophanes do not show heterogcoagulation because of the spherical primary particles exhibiting one type of surface only. The properties of allophanes, therefore, are determined by the aluminol groups of the nano balls [19]. Hence, allophane is an ideal material to study the effect of different ambient conditions (pH, ionic strength) on the coagulation behavior of materials with surfaces dominated by aluminol groups, hence representing the edges of smectites and other dioctahedral clay minerals. Most of the aluminol groups of allophane are doubly coordinated but some defects sites exists (‘pore region’) where singly coordinated aluminol groups exist, which are supposed to be more reactive than doubly coordinated ones [20,21,22]. The amount of aluminol groups of smectites is about 10 mmol/100g [23] and the 3 to 4-fold amount was found for allophane [24]. Allophane can be dispersed in an acidic environment [25,26] but also under alkaline conditions if the aluminol groups are negatively charged. Allophane primary particles are known to strongly interact with each other [27]. Coagulation behavior also depends on sample pre-treatment such as removal of poorly crystalline iron oxohydroxides [27]. Allophanes can be better dispersed if samples were not dried after collection in the field [28,29,30]. No CCC values for allophane were published so far. Only few allophane deposits occur providing useful reference materials. In the present study, allophane from an Ecuadorian deposit was used [31,32]. The different important surface properties of smectite, kaolinite, and allophane are sketched in Figure 1.
The aim of the present study is to determine the range of CCC values of a significant set of well-characterized smectites and allophane, and to identify the reason(s) for the differences.
2. Materials and Methods
The allophane sample was derived from an Ecuadorian deposit [31,32,33]. For the present study the fine fraction separated from the allophane rich and organic poor layer PM-4-7 was used [31]. For the transport from Ecuador to Germany, excess water was added to prevent the material from drying (water/clay about 1/1 w/w). The mud was homogenized using a hand mortar. Subsequently the water content was determined, and more water was added to produce a 10 mass% slurry which was used to separate the <5 µm fraction with a technical scale hydrocyclone. The water content of the overflow slurry containing <5 µm material only, was determined and the slurry was used as precursor for the different CCC mixtures. For the CCC investigations of allophane the solid/liquid ratio as well as the pH was varied. The solid/liquid ratio ranged from 0.03 (3 mg/10 mL) to 0.20 mass% (20 mg/10 mL). The pH and the ionic strength were adjusted before the addition of the allophane. Because of the low solid/liquid ratio no significant change of the pH was found.
Bentonite samples were used to study the smectite properties. The samples were characterized before [10,34,35,36,37]. Basic parameters used to investigate the CCC are given in Table 1. The samples B30 and B35 which were rich in interstratified illite-smectite minerals were not considered in the present study. Carbonate containing bentonite samples were treated with acetic acid to remove the carbonates and repeatedly washed with NaCl to obtain carbonate-free Na saturated samples. Carbonate free bentonites were repeatedly washed with NaCl only. The amount of exchangeable Na+ was >95% for all samples after treatment (checked by CEC measurements). No fractionation to enrich the smectites was performed because traces of quartz and/or feldspar do not affect the results. Before drying and grinding all samples were carefully dialyzed to remove excess salts (until the water reached a conductivity of about 10 µS/cm). The dialyzed slurry was adjusted to a solid content of 0.17–0.83 mass% (standard: 0.2 mass%). In a first attempt, 6–8 mL of the slurry was subjected to 10 mL glass bottles and investigated with respect to the CCC based on visual inspection. The first photograph was taken after 24 h and then increments of salt solutions were added (from 50 µL 0.1 M NaCl at the beginning up to 200 µL 5 M NaCl at the end). After shaking the bottles for 10 s each using a Vortex-T Genie 2 homogenizer (Scientific Industries, Bohemia, NY, USA), the dispersions were again allowed to stand for 24 h and then the next photograph was taken. This was repeated until all samples showed flocculation. After 24 h the dispersions were investigated with respect to the volume of the sediment. A value of 100% dispersion corresponds to a stable dispersion, no sediment formed (<CCC). Any degree of dispersion <100% indicates that the smectites coagulated (>CCC). The degree of dispersion of a system >CCC represents the coagulation kinetics (proceeding of coagulation after 24 h) and hence provides further information.
Selected samples were used to investigate the effect of varying solid/liquid ratio and pH on the CCC.
All tests were performed without addition of phosphate which is sometimes used to prevent heterocoagulation. In natural systems or in the geotechnical bentonite barrier, however, phosphate is not present. The CCC, therefore, was determined without the addition of phosphate. The results are supposed to be comparable, because the pH values of the Na saturated materials are similar (between 6.7 and 7.2) as a result of the pH buffering capacity of Na exchanged smectites [34].
For scanning electron microscopy (SEM) investigation a FEI Quanta 600 F (FEI Company, Eindhoven, The Netherlands) operated in low-vacuum mode (0.6 mbar) was used. Therefore, sputtering of the samples with gold or carbon is not necessary. The microscope is equipped with the EDX-system Genesis 4000 of EDAX. Freshly broken surfaces of slowly air-dried samples were investigated.
3. Results
3.1. Allophane
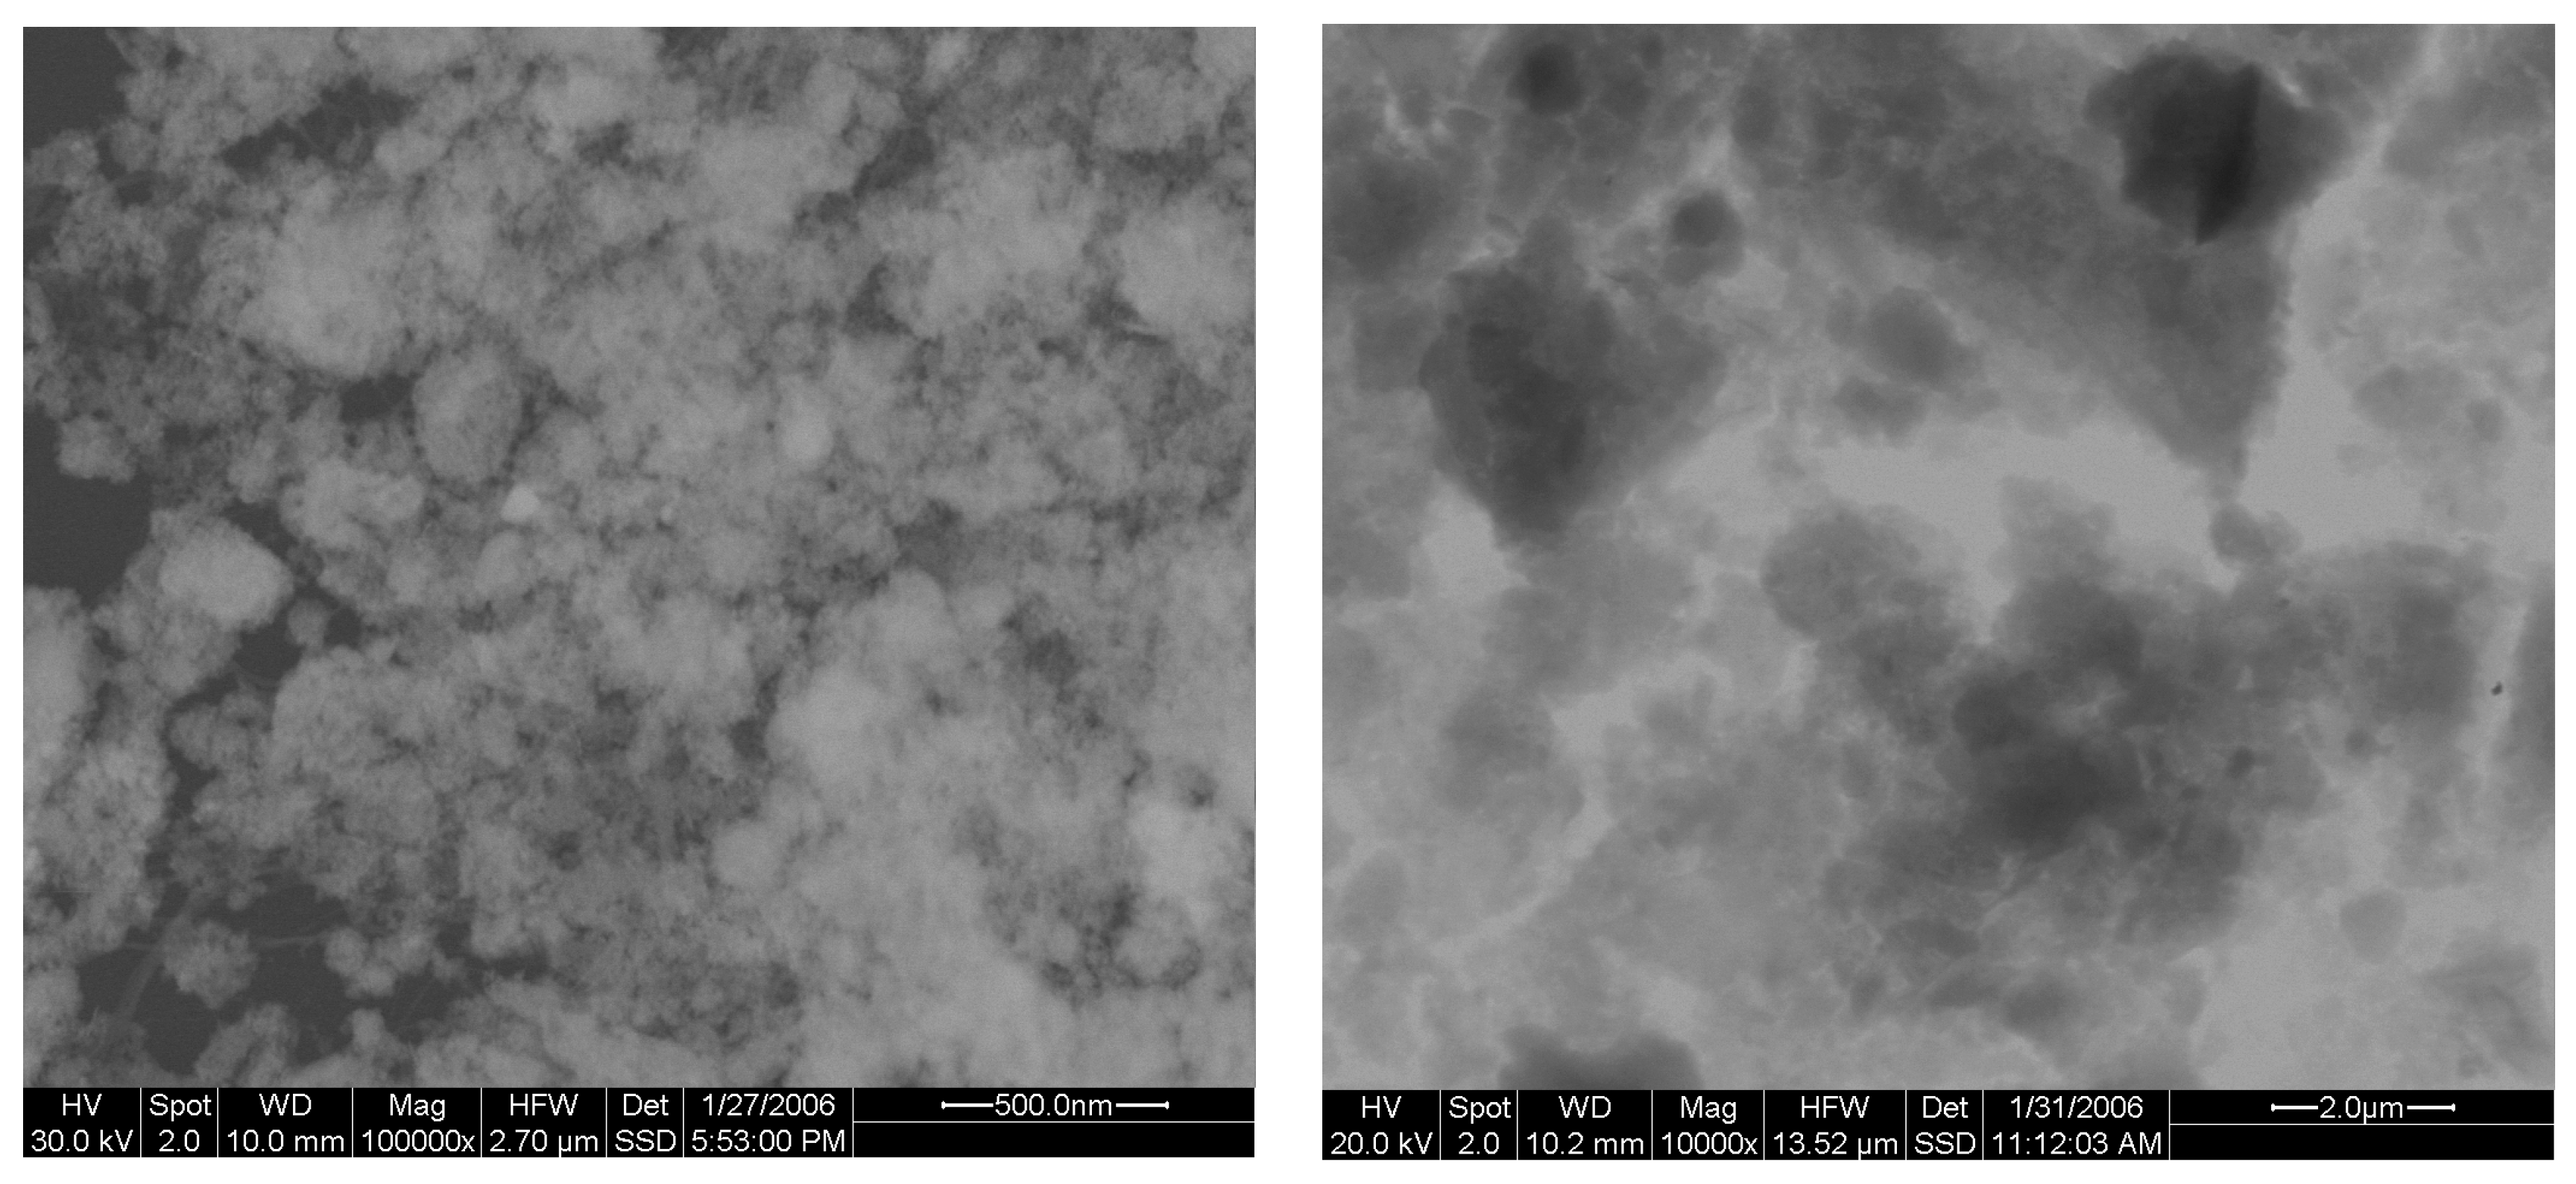
Allophane is a young clay-sized mineral which commonly forms upon weathering of volcanic ashes. The diameter of the spherical primary particles is around 5 nm [19,31]. However, allophanes commonly form different types of aggregates of larger size [27]. The Ecuadorian material is dominated by cloud like aggregates between 0.1 and 1 µm (Figure 2). Based on extensive electron microscopy studies the presence of imogolite could be excluded in this sample. Traces of imogolite exist in other samples from this deposit.
The CCC investigations of the allophane sample are shown in Figure 3. In contrast to the sedimentation times typical of smectites, fast sedimentation within a few hours was observed. After 2 h, only three samples showed full dispersion, all other materials sedimented forming a thin sediment layer. For all these three samples the ionic strength was 0 and the pH was 4. These dispersions were stable for days. This indicated that minor allophane dissolution occurred because even small amounts of Al3+ in solution would have caused rapid flocculation. The solid/liquid ratio, which was varied from 0.03 to 0.20 mass% did not affect the pH dependence. At a slightly higher pH of 5, complete sedimentation caused by coagulation was found. Dispersion of allophane is only possible at low ionic strength (<1 mmol/L NaCl) and at pH < 5 and probably at elevated pH at which the aluminol groups become negatively charged (not tested in the present study).
3.2. Bentonites
3.2.1. Solid/Liquid Ratio
The solid/liquid ratio was varied in order to determine a reference solid/liquid ratio (Figure 4) and to exclude possible coagulation caused by high solid contents. The degree of dispersion was recorded after 24 h of settling.
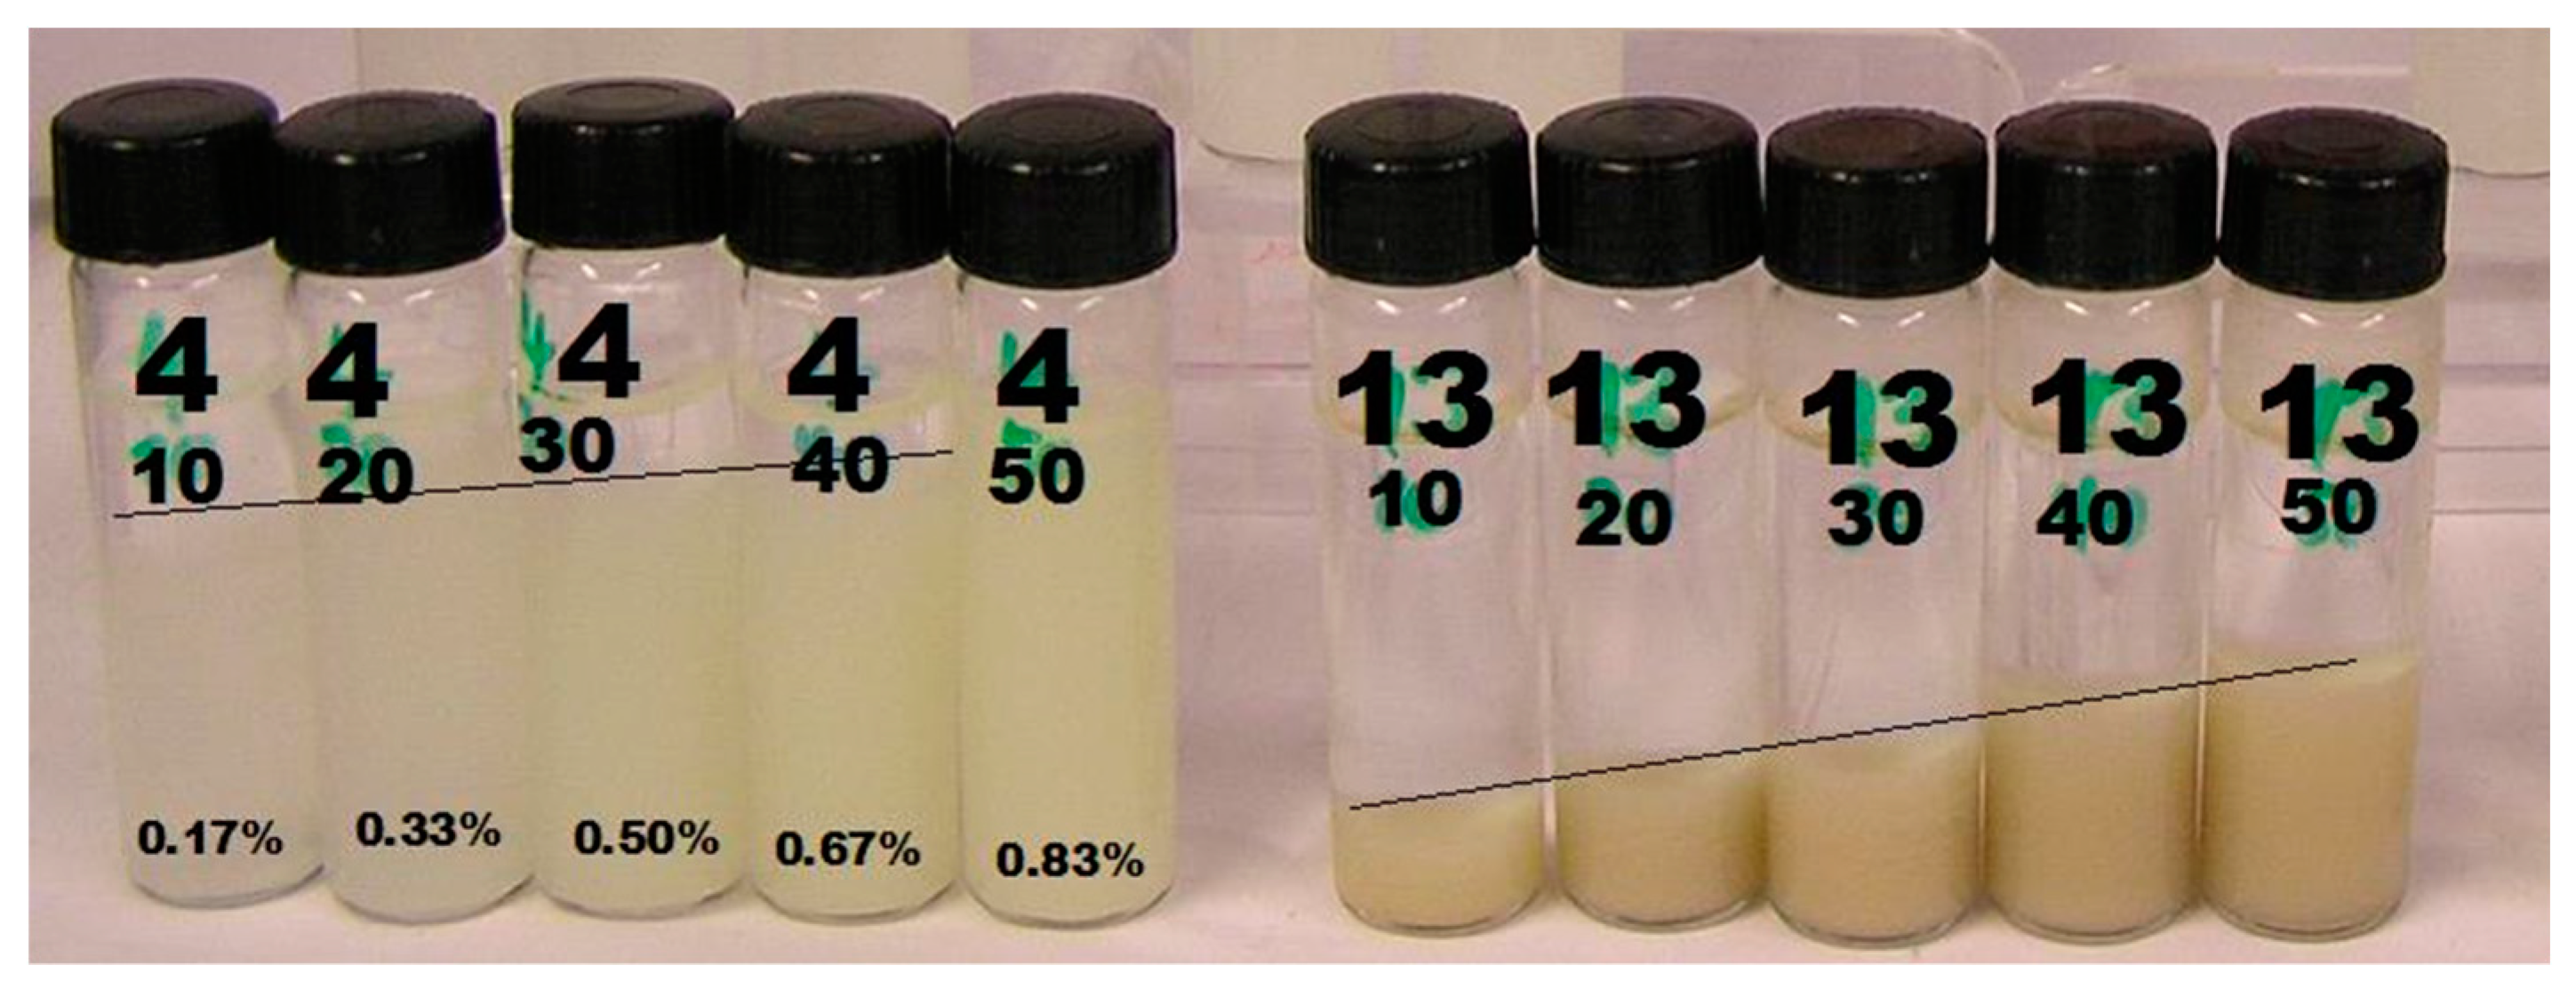
Below the CCC a gradual increase of the degree of dispersion with increasing solid/liquid ratio was observed (marked by the thin black lines in Figure 4). The slope of the lines representing the different degrees of dispersion (Figure 4) was larger in case of faster coagulating samples (e.g., #13 vs. #4 in Figure 4). In principal all solid/liquid ratios tested would be suitable to compare all bentonites. The differences, however, were larger in case of lower solid/liquid ratios. The standard solid/liquid ratio was, therefore, set to 0.2 mass% corresponding to 100 mg solid dispersed in 50 mL water. Lower solid/liquid ratios were not suitable because of the visibility of the dispersion which was particularly poor in case of white bentonites. For the investigation of such dispersions spectroscopic methods would have to be used.
No relation was observed between the CCC and the solid/liquid ratio used in this study. In case of larger solid/liquid ratios, however, the degree of dispersion was larger and hence coagulation was more difficult to observe (e.g., around 95% degree of dispersion).
3.2.2. pH Effect
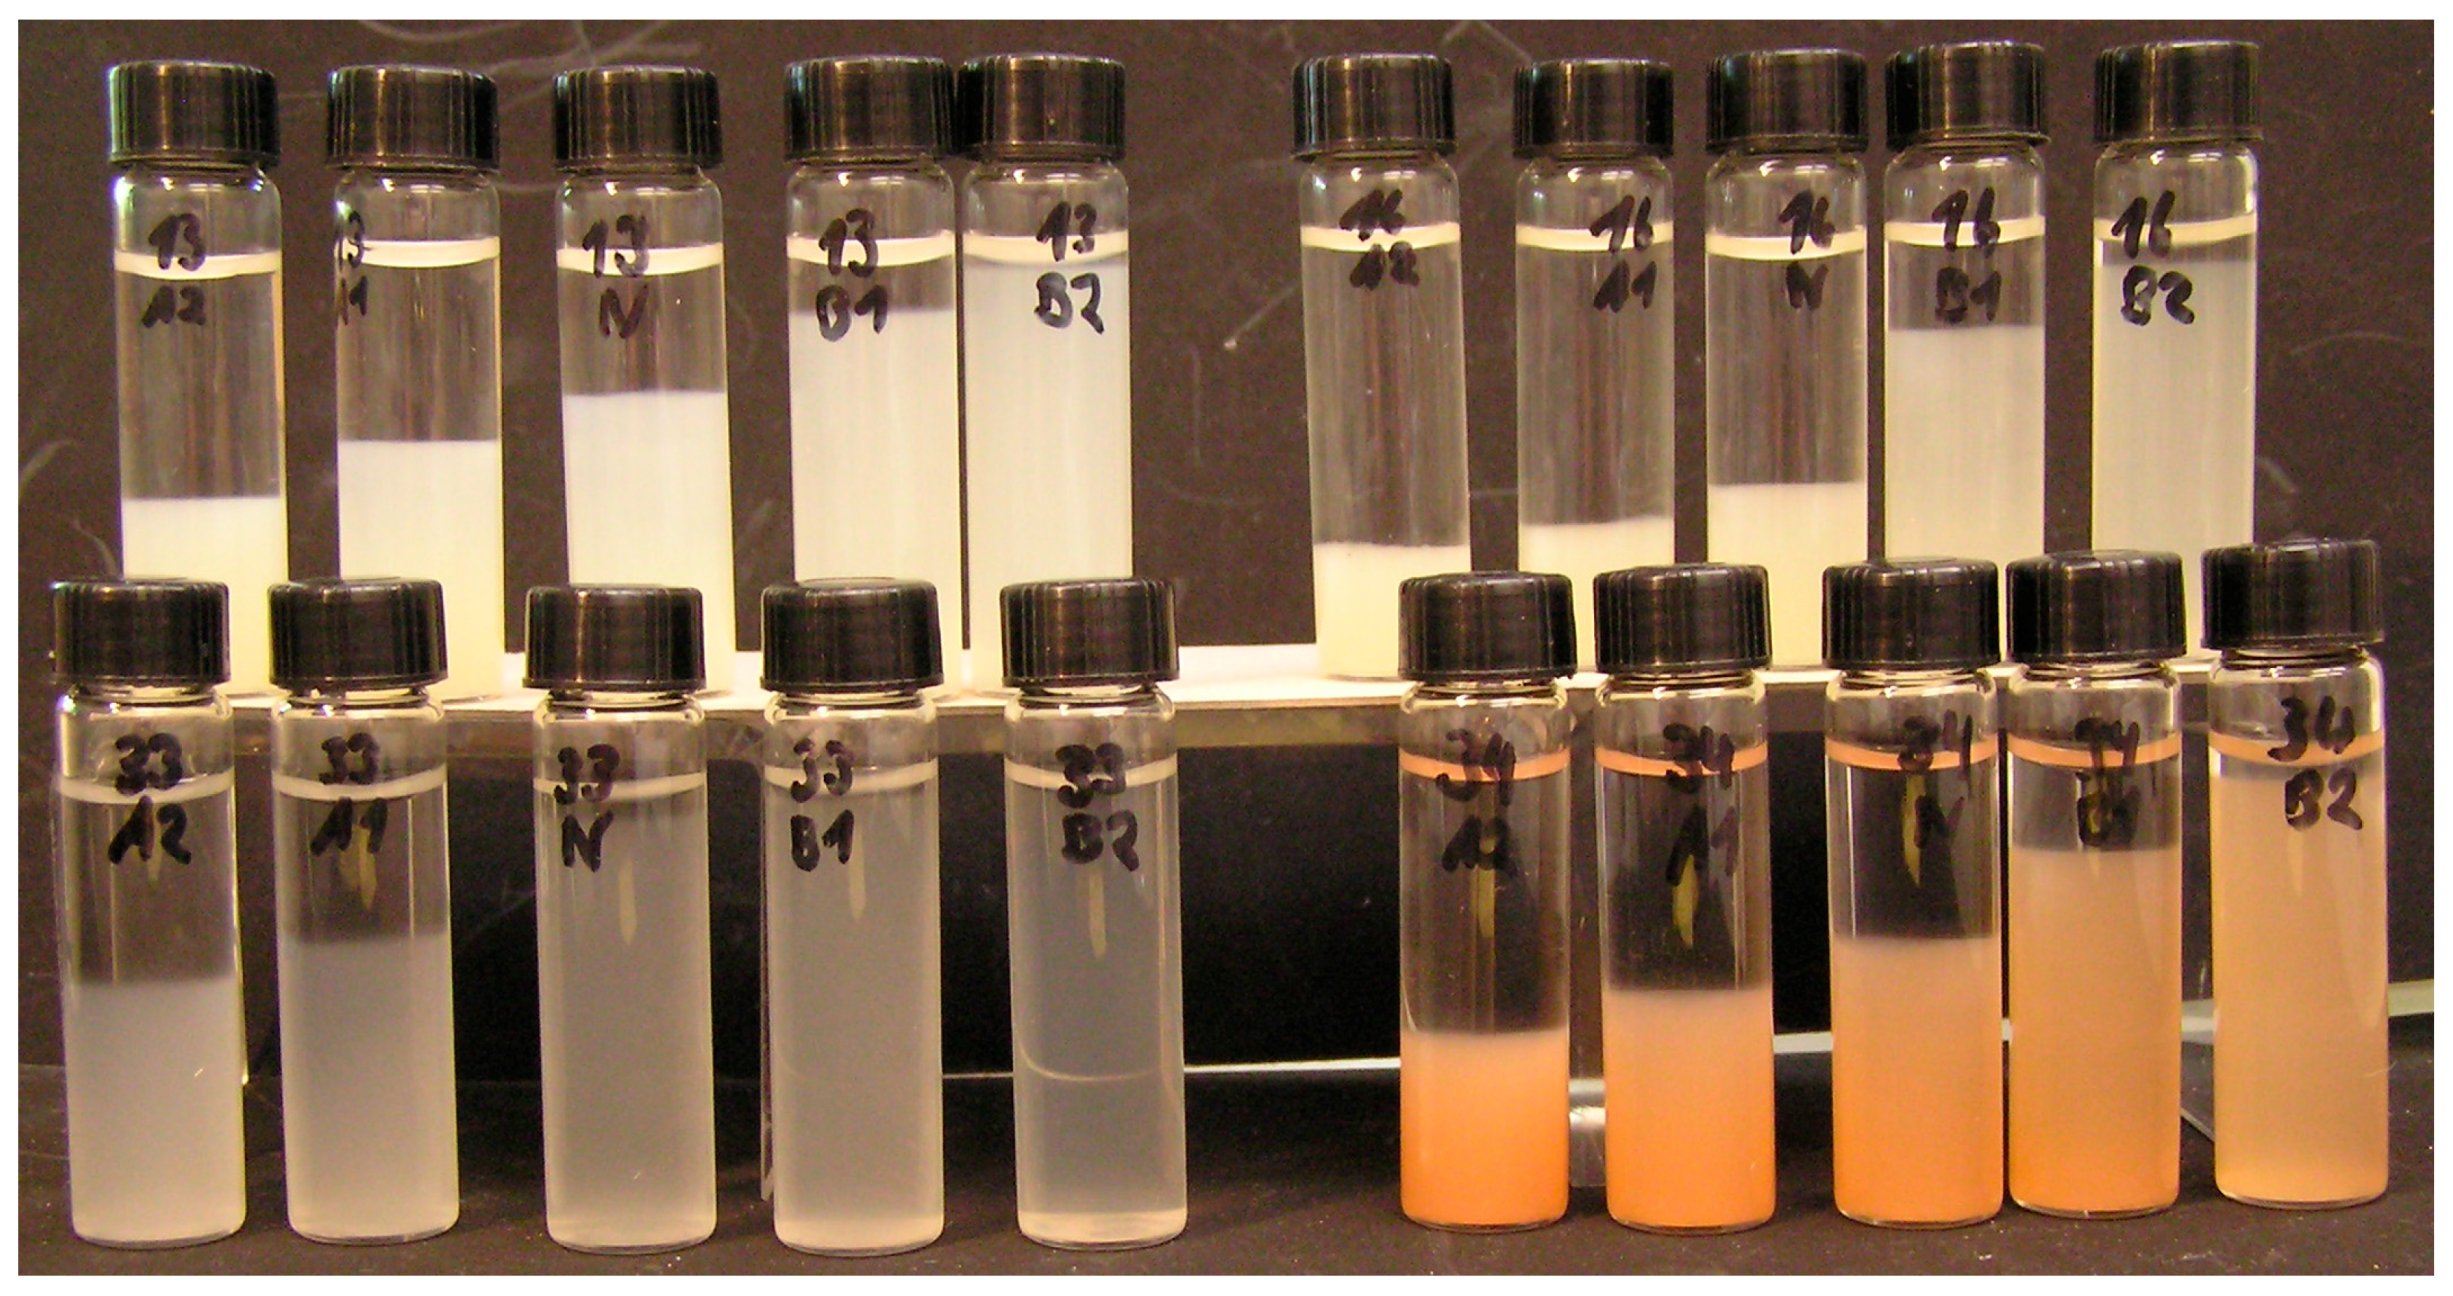
Four samples were selected to study the effect of different pH values on coagulation. Two acidic (A1, A2) and two basic samples (B1, B2; in this case indicating different alkalinity) as well as a neutral sample were prepared. Because of different pH buffering capacity slightly different final pH values were obtained. As an example, the most acidic samples (A2) varied in pH from 4.0 to 4.6. Even more significant differences were found for the less acidic samples (A1) which varied in pH from 5.3 to 6.6. The neutral and basic samples were closer together. Coagulation was again investigated by recording the degree of dispersion of the different tubes after 24 h of standing after stepwise increasing the NaCl concentration. An example is given in Figure 5. All degrees of dispersion of the different samples were compared with the NaCl concentration (Figure 5).
At low NaCl concentrations (<3 mmol/L) no coagulation was observed, all suspensions remained at 100% dispersion (Figure 6). At a NaCl-concentration above 4 mmol/L all acidic samples with pH values <5 coagulated, samples with pH around 6 were still well dispersed. These samples started to coagulate at NaCl concentrations above 7 mmol/L, only slightly above the more acidic ones. The neutral dispersions, on the other hand, were much more stable. They all showed significant coagulation at about 20 mmol/L. The degree of dispersion of the neutral samples B13, B16, and B34 showed a marked decrease with increasing NaCl concentration. The Wyoming bentonite sample B33, on the other hand, did not show further coagulation. Its degree of dispersion was constant (about 90%) until NaCl concentrations above 100 mmol/L. The most striking difference between the different samples was the stability of the basic Wyoming bentonite samples (B33). All other basic dispersions showed coagulation <50 mmol/L. In contrast, the first coagulation of the basic Wyoming bentonites was observed at a NaCl-concentration >100 mmol/L which resulted in much more significant differences of the CCC of the acidic and the basic samples compared with the other bentonites.
3.2.3. Coagulation Kinetics
Using spectroscopic methods, e.g., determining the extinction of visible or UV light as a function of time, coagulation kinetics can be measured which characterizes how fast coagulation proceeds above the CCC. In the present study all dispersions were allowed to stand for 24 h. Dispersions with no sign of sedimentation were below the CCC and such with degrees of dispersion <100% were coagulated. The degrees of dispersion of the coagulated samples represented the coagulation kinetics because most of them would coagulate further forming an even more voluminous sediment. In order to investigate the kinetics, the time of recording the degrees of dispersion was varied. Figure 7 shows the degrees of dispersion at a NaCl concentration of about 600 mmol/L depending on time. At this concentration some samples apparently were still well dispersed (<CCC) and others were already coagulated.
The long term observation proved that those samples with a 24 h degree of dispersion of 100% were above the CCC. They, however, needed more time to coagulate. At a NaCl concentration of about 600 mmol/L, therefore, all bentonite dispersions were coagulated. Most of the samples showed degrees of dispersion of <70% after 24 h. Four samples showed degrees of dispersion of >80%, all of which were from Wyoming. After 96 h of sedimentation these samples reached the same level as the others. Wyoming bentonite dispersions obviously coagulate more slowly than others. One sample from Wyoming (B33) settled faster than the other samples from Wyoming. On the other hand, also samples B37 (Slovakia) and B05 (Milos) coagulated slower than most of the other bentonite dispersions.
3.2.4. All Bentonites
The degrees of dispersion (24 h, 0–750 mmol/L NaCl) of all bentonite dispersions are shown in Figure 8.
One third of the bentonite dispersions coagulated at NaCl concentrations below 20 mmol/L and one third coagulated between 20 mmol/L and 50 mmol/L. About 15% coagulated between 50 mmol/L and 100 mmol/L and another 15% coagulated above 100 mmol/L (24 h value). The extraordinary behavior of Wyoming bentonites was confirmed. Sample B33, representing the fastest coagulating Wyoming bentonite sample of the sample set, coagulated at 33 mmol/L but the other dispersions were much more stable. The first signs of coagulation of samples B08 and B09 were observed at about 180 mmol/L NaCl but the degree of dispersion of these samples did not change until 750 mmol/L. Sample B20, on the other hand, did not show any sign of coagulation until 750 mmol/L and then dropped to values below B08 and B09. The larger degree of dispersion of samples B05 and B37 (Figure 7) becomes evident at larger NaCl concentrations only.
4. Discussion
The surface of allophane is dominated by aluminol groups, allophanes consist of so-called nano-balls. The surface species distribution was investigated with potentiometric titration in combination with zeta potential measurements [31]. Both methods proved that neutral aluminol groups dominate at pH around 6 (≡Al–O–H = 100%) and at pH 4.2, the concentration of neutral and positively charged surface species is equal (≡Al–O–H = ≡Al–O–H2+). Coagulation tests conducted in the present study proved that allophane can only be dispersed at pH 4 at low ionic strength (Figure 3; alkaline conditions were not tested). This is in accordance with literature. At pH 4, most of the surface sites are positively charged. This leads to effective repulsion and hence to dispersion. At pH 5, most of the surface sites are neutral and no dispersion was observed. This leads to the assumption that the neutral surface sites interact with each other. One could speculate that the surface sites of adjacent particles tend to condensate (≡Al–O–H + H–O–Al≡ = ≡Al–O–Al≡ + H2O). This mechanism would at least explain the irreversible loss of dispersibility of allophane upon drying which was reported earlier. More specifically, Churchman & Tate [30] observed the formation of larger aggregates after drying (particularly at pH 6 at which the neutral surface sites dominate), Warketin & Maeda [29] proved that there was lower hydratability after drying, and Kitagawa [28] observed a more diffuse appearance after drying. These observations prove the interactions of adjacent allophane particles at pH > 5 which also determines the dispersibility (coagulation behavior). In conclusion the dispersibility of allophanes was understood based on repulsion of positive surface sites and interaction of neutral ones.
The coagulation of bentonite dispersions is much more complicated. Major minerals of bentonites are platy smectites. Four bentonite dispersions were compared at different pH values. All acidic dispersions were less stable than the neutral or alkaline ones, which probably can be explained by heterocoagulation: the edges of smectites, analogous to allophane surfaces, are positively charged at pH < 5 but the faces remain negatively charged independent of the pH. As a result electrostatic edge/face interaction leads to coagulation. To prevent heterocoagulation phosphate can be added but in the present study no phosphate was used to represent naturally existing conditions. The behavior of smectite dispersions at different pH was understood based on the results obtained for the allophane at different pH. Allophanes, therefore, can sometimes be used to study the reactions of the edges of smectites without the need to consider the permanently charged surface as well.
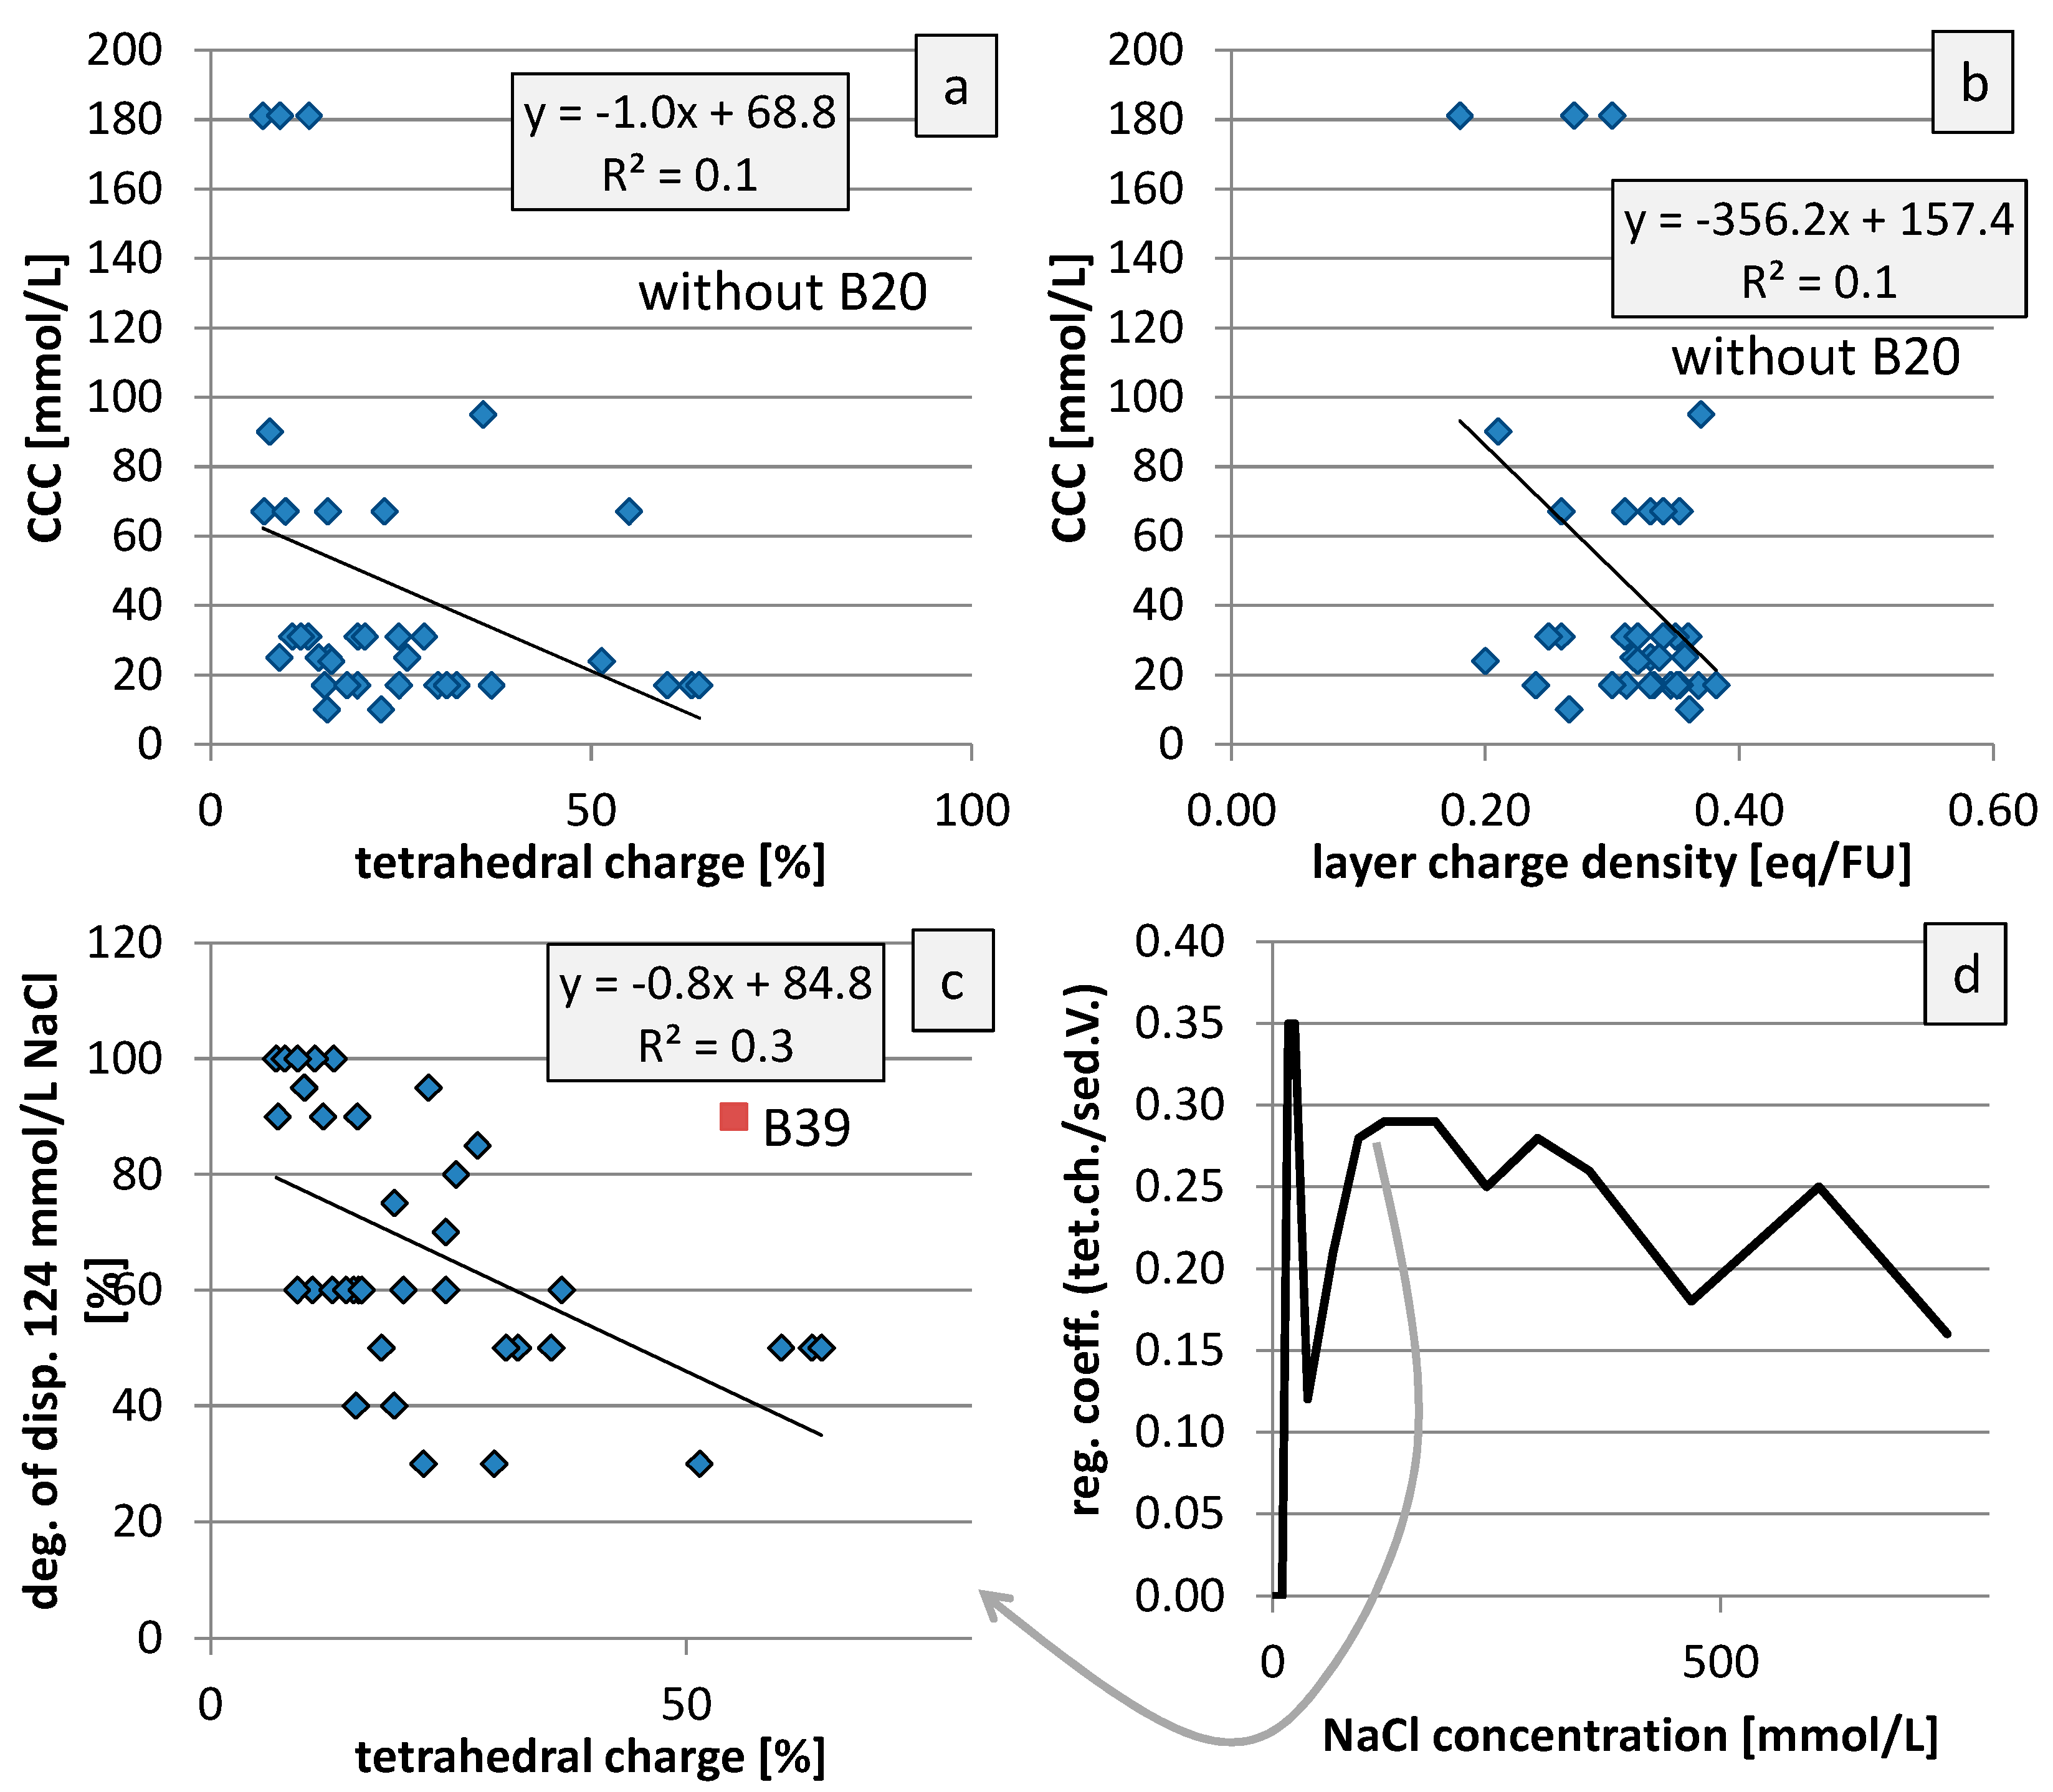
The CCC was determined as the minimum NaCl concentration at which first coagulation (defined as degree of dispersion <100%) was observed after 24 h. The aim of the study was to investigate the reason for the differences of the different bentonites. Yet it was reported that the tetrahedral charge affects the CCC [7]. The CCC values were, therefore, compared with the charge characteristics (layer charge density (LCD)) and portion of tetrahedral charge; Figure 9a,b). Sample B20 showed a much higher CCC (750 mmol/L) compared with others and hence was not considered. No clear relation was found between either tetrahedral charge (Figure 9a) or layer charge density (Figure 9b) with the CCC. A weak trend, on the other hand, was found when comparing the tetrahedral charge with the degree of dispersion (Figure 9c, 124 mmol/L NaCl) which was used as an alternative to characterize coagulation. Figure 9d shows the evolution of the regression coefficient representing the weak trend shown in Figure 9c (R2 = 0.3) depending on the NaCl concentration. At low NaCl concentrations a peak of the regression coefficient was found but also at higher NaCl concentrations weak trends (as shown in Figure 9c) were found. Sample B39 was left out because this sample has a naturally degraded octahedral sheet and hence could not be compared with the others (a detailed discussion is provided by Kaufhold [39]). The degree of dispersion was found to better correlate with the tetrahedral charge than the CCC. The degree of dispersion, in contrast to the CCC, better reflects the strength of particle interaction. A small degree of dispersion indicates strong particle interaction (fast coagulation) and a larger degree of dispersion (e.g., 90%) represents weaker particle interaction although the NaCl concentration was above the CCC. This may explain why the degree of dispersion is better correlated with the tetrahedral charge than the CCC. Tetrahedral charge, because cations are bound more strongly in the Stern layer, leads to stronger interaction of the particles in turn leading to coagulation [7].
In the present study most coagulation tests were run for 24 h. In these tests Wyoming bentonites were all different from the other bentonites. This was recently also reported by Missana et al. [40]. After 96 h, however, Wyoming bentonites showed the same sediment volume as the others. These bentonites obviously coagulated more slowly. The possible reasons for this different behavior are discussed in the following: Wyoming bentonites are mostly low charged and have a low specific surface area. Other low charged bentonites (bentonites containing low charged smectites such as B16, Bavaria; B32, England; B36, Slovakia; B38, Russia) did not behave as Wyoming bentonites. A direct effect of the layer charge density can be excluded. The typical low surface area of Wyoming bentonites was previously related to the degree of structural order at the edges [37]. In the (wet-) transmission EM (TEM) smectites of Wyoming bentonites often show 120° angles and well developed crystal edges (mica like appearance) [38]. No TEM or wet-TEM data, however, exists to allow discussion about appearances of their crystal edges. The effect of particle or edge morphology, on the other hand, is difficult to investigate quantitatively because there is no proxy value that can be determined with sufficient accuracy representing particle morphology. Based on Kaufhold [37], the BET (Brunauer, Emmet, Teller) N2-surface (SSAN2BET) indirectly represents information about particle edges. Other bentonites, however, had an even lower SSAN2BET (e.g., B23 = 7 m2/g) compared with the Wyoming bentonites (10–30 m2/g) but coagulated faster. This parameter, therefore, does not provide further information. However, particle morphology or even particle size distribution could play an important role with respect to coagulation. The presence of small and larger particles, as an example, would lead to different structures in the sediment or gel. Such explanations, however, remain highly speculative.
Wyoming bentonites also contain relatively (compared with other bentonites) large amounts of S-phases and organic carbon. The S-phases, gypsum and pyrite, would support coagulation either by lowering the pH (pyrite oxidation) or release of Ca (partial gypsum dissolution). After purification, however, the S-content of all Wyoming bentonites was <0.0 mass%. The highest organic content after purification was 0.7 mass% (sample B27) which persisted in the H2O2 treatment. This sample, however, behaved as the other Wyoming bentonites which contained less organic material. Organic carbon, therefore, also cannot explain the extraordinary behavior. Wyoming bentonites also contain relatively large contents of soda soluble silica (cristobalite and opal-A) which, at least theoretically, could affect coagulation. The relation of soda soluble silica and degree of dispersion at different NaCl concentrations, however, is poor which suggests, that this parameter does not determine coagulation. Amongst the Wyoming bentonites B33 was the fastest coagulating sample. None of the measured parameters (chemical and mineralogical composition, SSAN2BET, exchangeable cation population, pH value, tetrahedral charge, layer charge density) differed from the other Wyoming bentonites. Only the amount of soda soluble silica was slightly lower (2.4 mass%) compared with the others (3.1–9.8 mass%). This small difference cannot explain the different coagulation kinetics. Samples B37 and B05 also coagulated slowly. These both do not show common properties which differed from the others. In conclusion, the coagulation is supposed to be determined by parameters which were not yet measured. The special behavior of Wyoming bentonites, however, may be a suitable starting point for future studies to improve the understanding of the coagulation of smectites.
5. Conclusions
Dispersion and coagulation of allophane can easily be understood based on the charge of the surface functional groups. Dispersion of allophane is possible at pH < 5 where the aluminol groups become positive and at low ionic strength (CCC < 10 mmol/L NaCl). Dispersion would probably also be possible at high pH, i.e., if the aluminol groups are negatively charged, but this was not investigated in the present study. Bentonite dispersions, on the other hand, coagulate faster at low pH values—probably caused by heterocoagulation (edge-face aggregation). Notably, the CCC values measured represented coagulation kinetics. CCC values of different bentonite dispersions ranged from 10 to 750 mmol/L. Most of the Wyoming bentonite dispersions were more stable, and even above the CCC, they coagulated much more slowly compared to other bentonites. The range of CCC values measured in the present study corresponds to the range reported in literature, but the reason for the extraordinary behavior of Wyoming bentonites could not be identified and needs further research.
Author Contributions
A.K. designed, performed, and analyzed the allophane experiments, and S.K. designed, performed, and analyzed the bentonite experiments. S.K. and R.D. discussed and interpreted overall results and wrote the manuscript.
Conflicts of Interest
The authors declare no conflict of interest.
References
- Overbeek, J.T.G. Recent developments in the understanding of colloid stability. J. Colloid Interface Sci. 1977, 58, 408–422. [Google Scholar] [CrossRef]
- Van Olphen, H. An Introduction to Clay Colloid Chemistry; Wiley: New York, NY, USA, 1977. [Google Scholar]
- Lagaly, G. Ullmann’s Encyclopedia of Industrial Chemistry; VCH-Verlagsgesellschaft: Weinheim, Germany, 1986; Volume A7, pp. 341–367. [Google Scholar]
- Lagaly, G. From clay mineral crystals to colloidal clay mineral dispersions. In Coagulation and Flocculation: Theory and Application; Dobias, B., Ed.; Marcel Dekker: New York, NY, USA, 1992; pp. 427–494. [Google Scholar]
- Lagaly, G.; Dékány, I. Colloid Clay Science. In Handbook of Clay Science–Developments in Clay Science; Bergaya, F., Lagaly, G., Eds.; Elsevier: Amsterdam, The Netherlands, 2003; pp. 243–345. [Google Scholar]
- Missana, T.; Adell, A. On the Applicability of DLVO Theory to the Prediction of Clay Colloids Stability. J. Colloid Interface Sci. 2000, 230, 150–156. [Google Scholar] [CrossRef] [PubMed]
- Lagaly, G. Reaktionen der Tonminerale. In Tonminerale und Tone–Struktur, Eigenschaften, Anwendung und Einsatz in Industrie und Umwelt; Jasmund, K., Lagaly, G., Eds.; Springer: Berlin, Germany, 1993; pp. 89–158. [Google Scholar]
- Neretnieks, I.; Liu, L.; Moreno, L. Mechanisms and Models for Bentonite Erosion; SKB Technical Report TR-09-35; Department of Chemical Engineering and Technology, Royal Institute of Technology, KTH: Stockholm, Sweden, 2009. [Google Scholar]
- SKB. Long-Term Safety for KBS-3 Repository at Forsmark and LAXMAR—A First Evaluation; Technical Report TR-06-09; SKB: Stockholm, Sweden, 2006. [Google Scholar]
- Kaufhold, S.; Dohrmann, R. Detachment of colloidal particles from bentonites in water. Appl. Clay Sci. 2008, 39, 50–59. [Google Scholar] [CrossRef]
- Kretzschmar, R.; Holthoff, H.; Sticher, H. Influence of pH and Humic Acid on Coagulation Kinetics of Kaolinite: A Dynamic Light Scattering Study. J. Colloid Interface Sci. 1998, 202, 95–103. [Google Scholar] [CrossRef]
- Novich, B.E.; Ring, T.A. Colloid Stability of Clays Using Photon Correlation Spectroscopy. Clays Clay Miner. 1984, 32, 400–407. [Google Scholar] [CrossRef]
- Hetzel, F.; Donner, H.E. Some colloidal properties of Beidellite: Comparison with low and high charge Montmorillonites. Clays Clay Miner. 1993, 41, 453–460. [Google Scholar] [CrossRef]
- Lagaly, G.; Ziesmer, S. Colloid chemistry of clay minerals: The coagulation of montmorillonite dispersions. Adv. Colloid Interface Sci. 2003, 100, 105–128. [Google Scholar] [CrossRef]
- Chheda, P.; Grasso, D.; van Oss, C.J. Impact of ozone on stability of montmorillonite suspensions. J. Colloid Interface Sci. 1992, 153, 226–236. [Google Scholar] [CrossRef]
- Tombácz, E.; Szekeres, M. Colloidal behavior of aqueous montmorillonite suspensions: The specific role of pH in the presence of indifferent electrolytes. Appl. Clay Sci. 2004, 27, 75–94. [Google Scholar] [CrossRef]
- Tombácz, E.; Ábrahám, I.; Gilde, M.; Szántó, F. The pH-dependent colloidal stability of aqueous montmorillonite suspensions. Colloids Surf. 1990, 49, 71–80. [Google Scholar] [CrossRef]
- Frey, E.; Lagaly, G. Selective coagulation in mixed colloidal suspensions. J. Colloid Interface Sci. 1979, 70, 46–55. [Google Scholar] [CrossRef]
- Wada, K. Allophane and imogolite. In Minerals in Soil Environments; Dixon, J.B., Weed, S.B., Eds.; Soil Science Society of America: Madison, WI, USA, 1989; pp. 1051–1087. [Google Scholar]
- Cornell, R.M.; Schwertmann, U. The Iron Oxides; VCH-Verlagsgesellschaft: Weinheim, Germany, 1996. [Google Scholar]
- Essington, M.E. Soil and Water Chemistry: An Integrative Approach; CRC Press: Boca Raton, FL, USA, 2003; p. 534. [Google Scholar]
- Abidin, Z.; Matsue, N.; Henmi, T. Nanometer-scale chemical modification of nano-ball allophane. Clays Clay Miner. 2007, 55, 443–449. [Google Scholar] [CrossRef]
- Kaufhold, S.; Dohrmann, R. The variable charge of dioctahedral clay minerals. J. Colloid Interface Sci. 2013, 390, 225–233. [Google Scholar] [CrossRef] [PubMed]
- Kaufhold, A. Eigenschaften von Allophan aus Ecuador (Santo Domingo de los Colorados) und Anwendungspotential als Rohstoff. Ph.D. Thesis, Martin Luther University of Halle-Wittenberg, Halle, Germany, 2011; p. 175. [Google Scholar]
- Dahlgren, R.A. Quantification of allophane and imogolite. In Quantitative Methods in Soil Mineralogy; Luxmoore, R.J., Ed.; Miscellaneous Publication: Madison, WI, USA, 1994; pp. 431–451. [Google Scholar]
- Harsh, J. Poorly crystalline Aluminosilicate Clays. In Handbook of Soil Science; Sumner, M.E., Ed.; CRC Press: Boca Raton, FL, USA, 2000; pp. F169–F182. [Google Scholar]
- Karube, J.; Nakaishi, K.; Sugimoto, H. Fujihara Size and shape of allophane particles in dispersed aqueous systems. Clays Clay Miner. 1996, 44, 485–491. [Google Scholar] [CrossRef]
- Kitagawa, Y. The ‘unit particle’ of allophane. Am. Mineral. 1971, 56, 465–475. [Google Scholar]
- Warkentin, B.P.; Maeda, T. Physical and mechanical characteristics of Andisols. In Soils with Variable Charge; Theng, B.K.G., Ed.; Society of Soil Science: Hamilton, New Zealand; Soil Bureau: Lower Hutt, New Zealand, 1980; pp. 281–301. [Google Scholar]
- Churchman, G.J.; Tate, K.R. Stability of aggregates of different size grades in allophanic soils from volcanic ash in New Zealand. J. Soil Sci. 1987, 38, 19–27. [Google Scholar] [CrossRef]
- Kaufhold, S.; Kaufhold, A.; Jahn, R.; Brito, S.; Dohrmann, R.; Hoffmann, R.; Gliemann, H.; Weidler, P.; Frechen, M. A new massive deposit of allophane raw material in Ecuador. Clays Clay Miner. 2009, 57, 72–81. [Google Scholar] [CrossRef]
- Kaufhold, S.; Ufer, K.; Kaufhold, A.; Stucki, J.; Anastácio, A.; Jahn, R.; Dohrmann, R. Quantification of allophane clay from Ecuador. Clays Clay Miner. 2010, 58, 707–716. [Google Scholar] [CrossRef]
- Kaufhold, S.; Dohrmann, R.; Abidin, Z.; Henmi, T.; Matsue, N.; Eichinger, L.; Kaufhold, A.; Jahn, R. Fluoride adsorption on allophane. Appl. Clay Sci. 2010, 50, 25–33. [Google Scholar] [CrossRef]
- Kaufhold, S.; Dohrmann, R.; Koch, D.; Houben, G. The pH of aqueous bentonite suspensions. Clays Clay Miner. 2008, 56, 338–343. [Google Scholar] [CrossRef]
- Ufer, K.; Stanjek, H.; Roth, G.; Dohrmann, R.; Kleeberg, R.; Kaufhold, S. Quantitative phase analysis of bentonites by the Rietveld method. Clays Clay Miner. 2008, 56, 272–282. [Google Scholar] [CrossRef]
- Kaufhold, S.; Dohrmann, R.; Klinkenberg, M. Water uptake capacity of bentonites. Clays Clay Miner. 2010, 58, 37–43. [Google Scholar] [CrossRef]
- Kaufhold, S.; Dohrmann, R.; Klinkenberg, M.; Siegesmund, S.; Ufer, K. N2-BET specific surface area of bentonites. J. Colloid Interface Sci. 2010, 349, 275–282. [Google Scholar] [CrossRef] [PubMed]
- Kaufhold, S. (Ed.) Bentonites–From Mine to Application; 2018; in press; ISBN 978-3-510-96859-6. [Google Scholar]
- Kaufhold, S.; Stucki, J.W.; Finck, N.; Steininger, R.; Zimina, A.; Dohrmann, R.; Ufer, K.; Pentrák, M.; Pentráková, L. Tetrahedral charge and Fe content in dioctahedral smectites. Clay Miner. 2017, 52, 51–55. [Google Scholar] [CrossRef]
- Missana, T.; Alonso, U.; Fernández, A.M.; García-Gutiérrez, M. Colloidal properties of different smectite clays: Significance for the bentonite barrier erosion and radionuclide transport in radioactive waste repositories. Appl. Geochem. 2018. submitted. [Google Scholar]
Figure 1.
Schematic representation of the surface properties of allophane, smectite, and kaolinite.

Figure 2.
Electron microscopy images of the cloud like allophane aggregates (left: scanning electron microscopy (SEM) operated in SEM-mode; right: SEM operated in transmission EM (TEM) mode).
Figure 2.
Electron microscopy images of the cloud like allophane aggregates (left: scanning electron microscopy (SEM) operated in SEM-mode; right: SEM operated in transmission EM (TEM) mode).

Figure 3.
Photography of the critical coagulation concentrations (CCC) determination of the Ecuadorian allophane and list of experimental parameters.
Figure 3.
Photography of the critical coagulation concentrations (CCC) determination of the Ecuadorian allophane and list of experimental parameters.
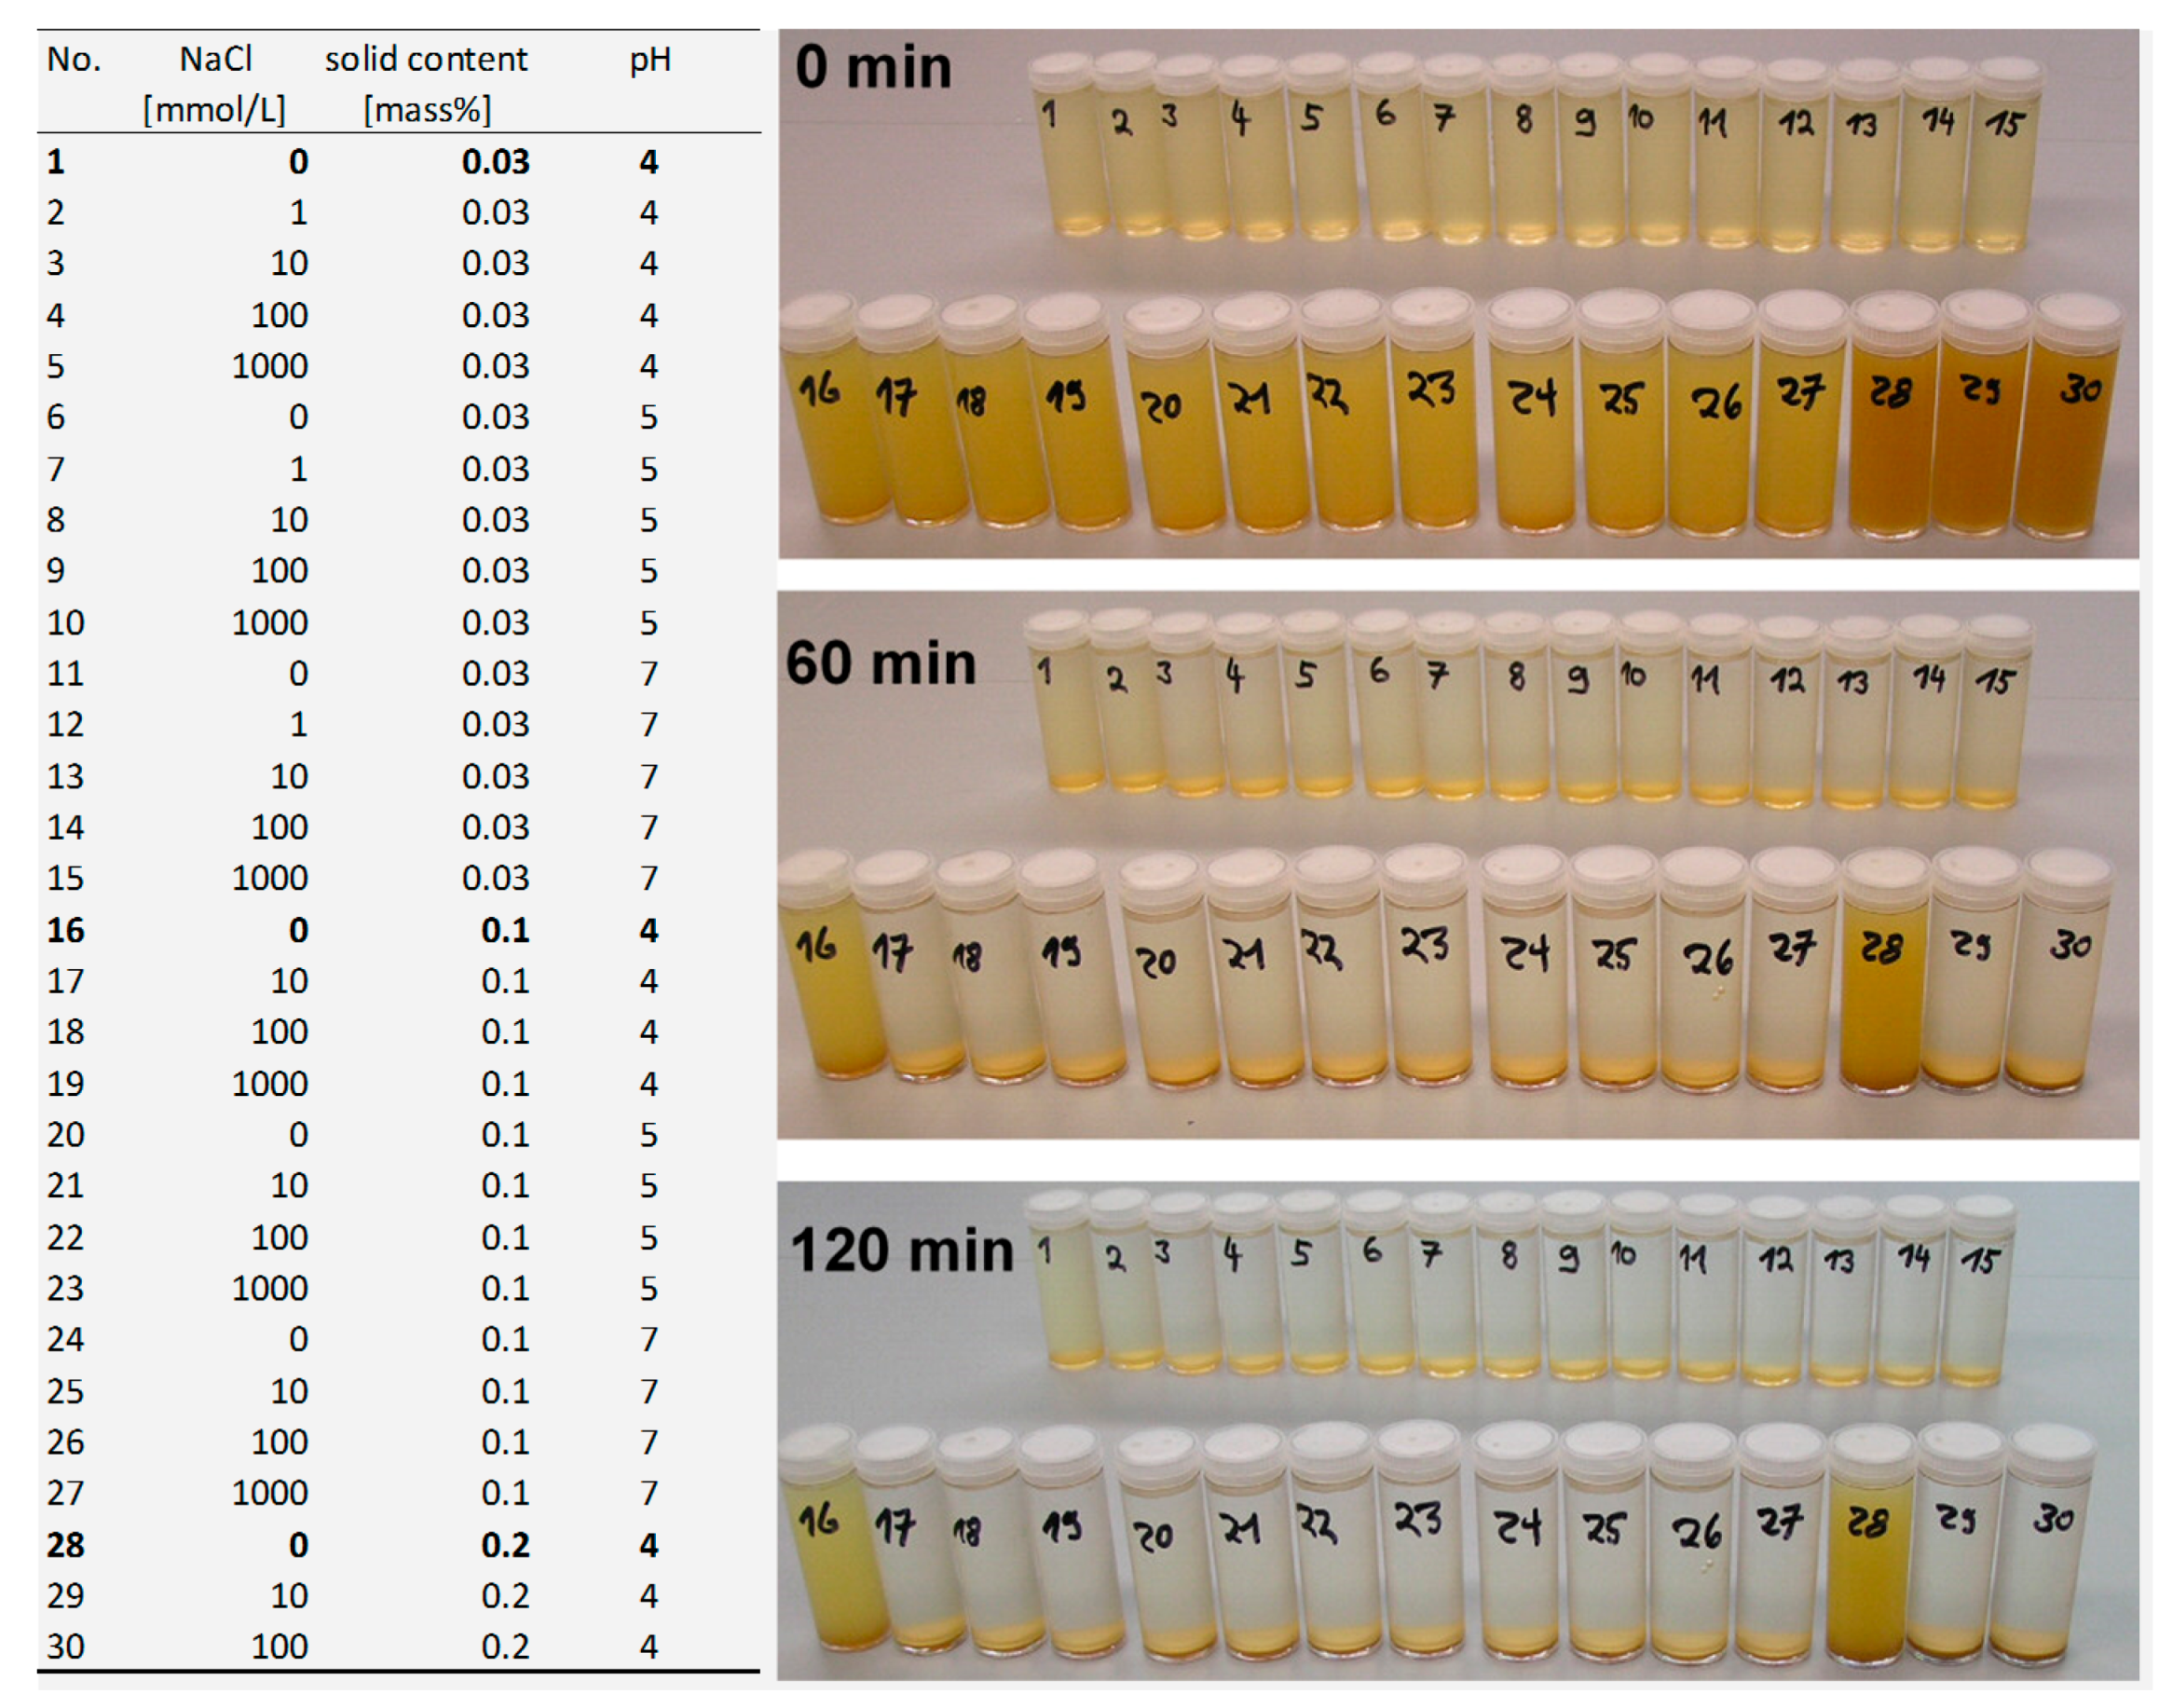
Figure 4.
Photograph of three of the eight selected samples with varying solid/liquid ratios (24 h after the eighth addition of 100 µL 4 M NaCl; solid/liquid ratio ranged from 10 mg/6 mL (0.17 mass%) up to 50 mg/6 mL (0.83 mass%) (Adapted from [38]).
Figure 4.
Photograph of three of the eight selected samples with varying solid/liquid ratios (24 h after the eighth addition of 100 µL 4 M NaCl; solid/liquid ratio ranged from 10 mg/6 mL (0.17 mass%) up to 50 mg/6 mL (0.83 mass%) (Adapted from [38]).

Figure 5.
Photograph of the four different samples (B13, B16, B33, B34) adjusted to different pH values (acidity: A2 > A1 > N > B1 > B2) after 24 h (Step 9, salt concentration 28.6 mmol/L NaCl).
Figure 5.
Photograph of the four different samples (B13, B16, B33, B34) adjusted to different pH values (acidity: A2 > A1 > N > B1 > B2) after 24 h (Step 9, salt concentration 28.6 mmol/L NaCl).

Figure 6.
Degree of dispersion of four selected bentonite dispersions (samples B12 (a), B16 (b), B33 (c), B34 (d)) adjusted to five different pH values (A2, A1: acidified; N: neutral; B1, B2: alkaline) depending on the NaCl concentration (conc.) after 24 h.
Figure 6.
Degree of dispersion of four selected bentonite dispersions (samples B12 (a), B16 (b), B33 (c), B34 (d)) adjusted to five different pH values (A2, A1: acidified; N: neutral; B1, B2: alkaline) depending on the NaCl concentration (conc.) after 24 h.
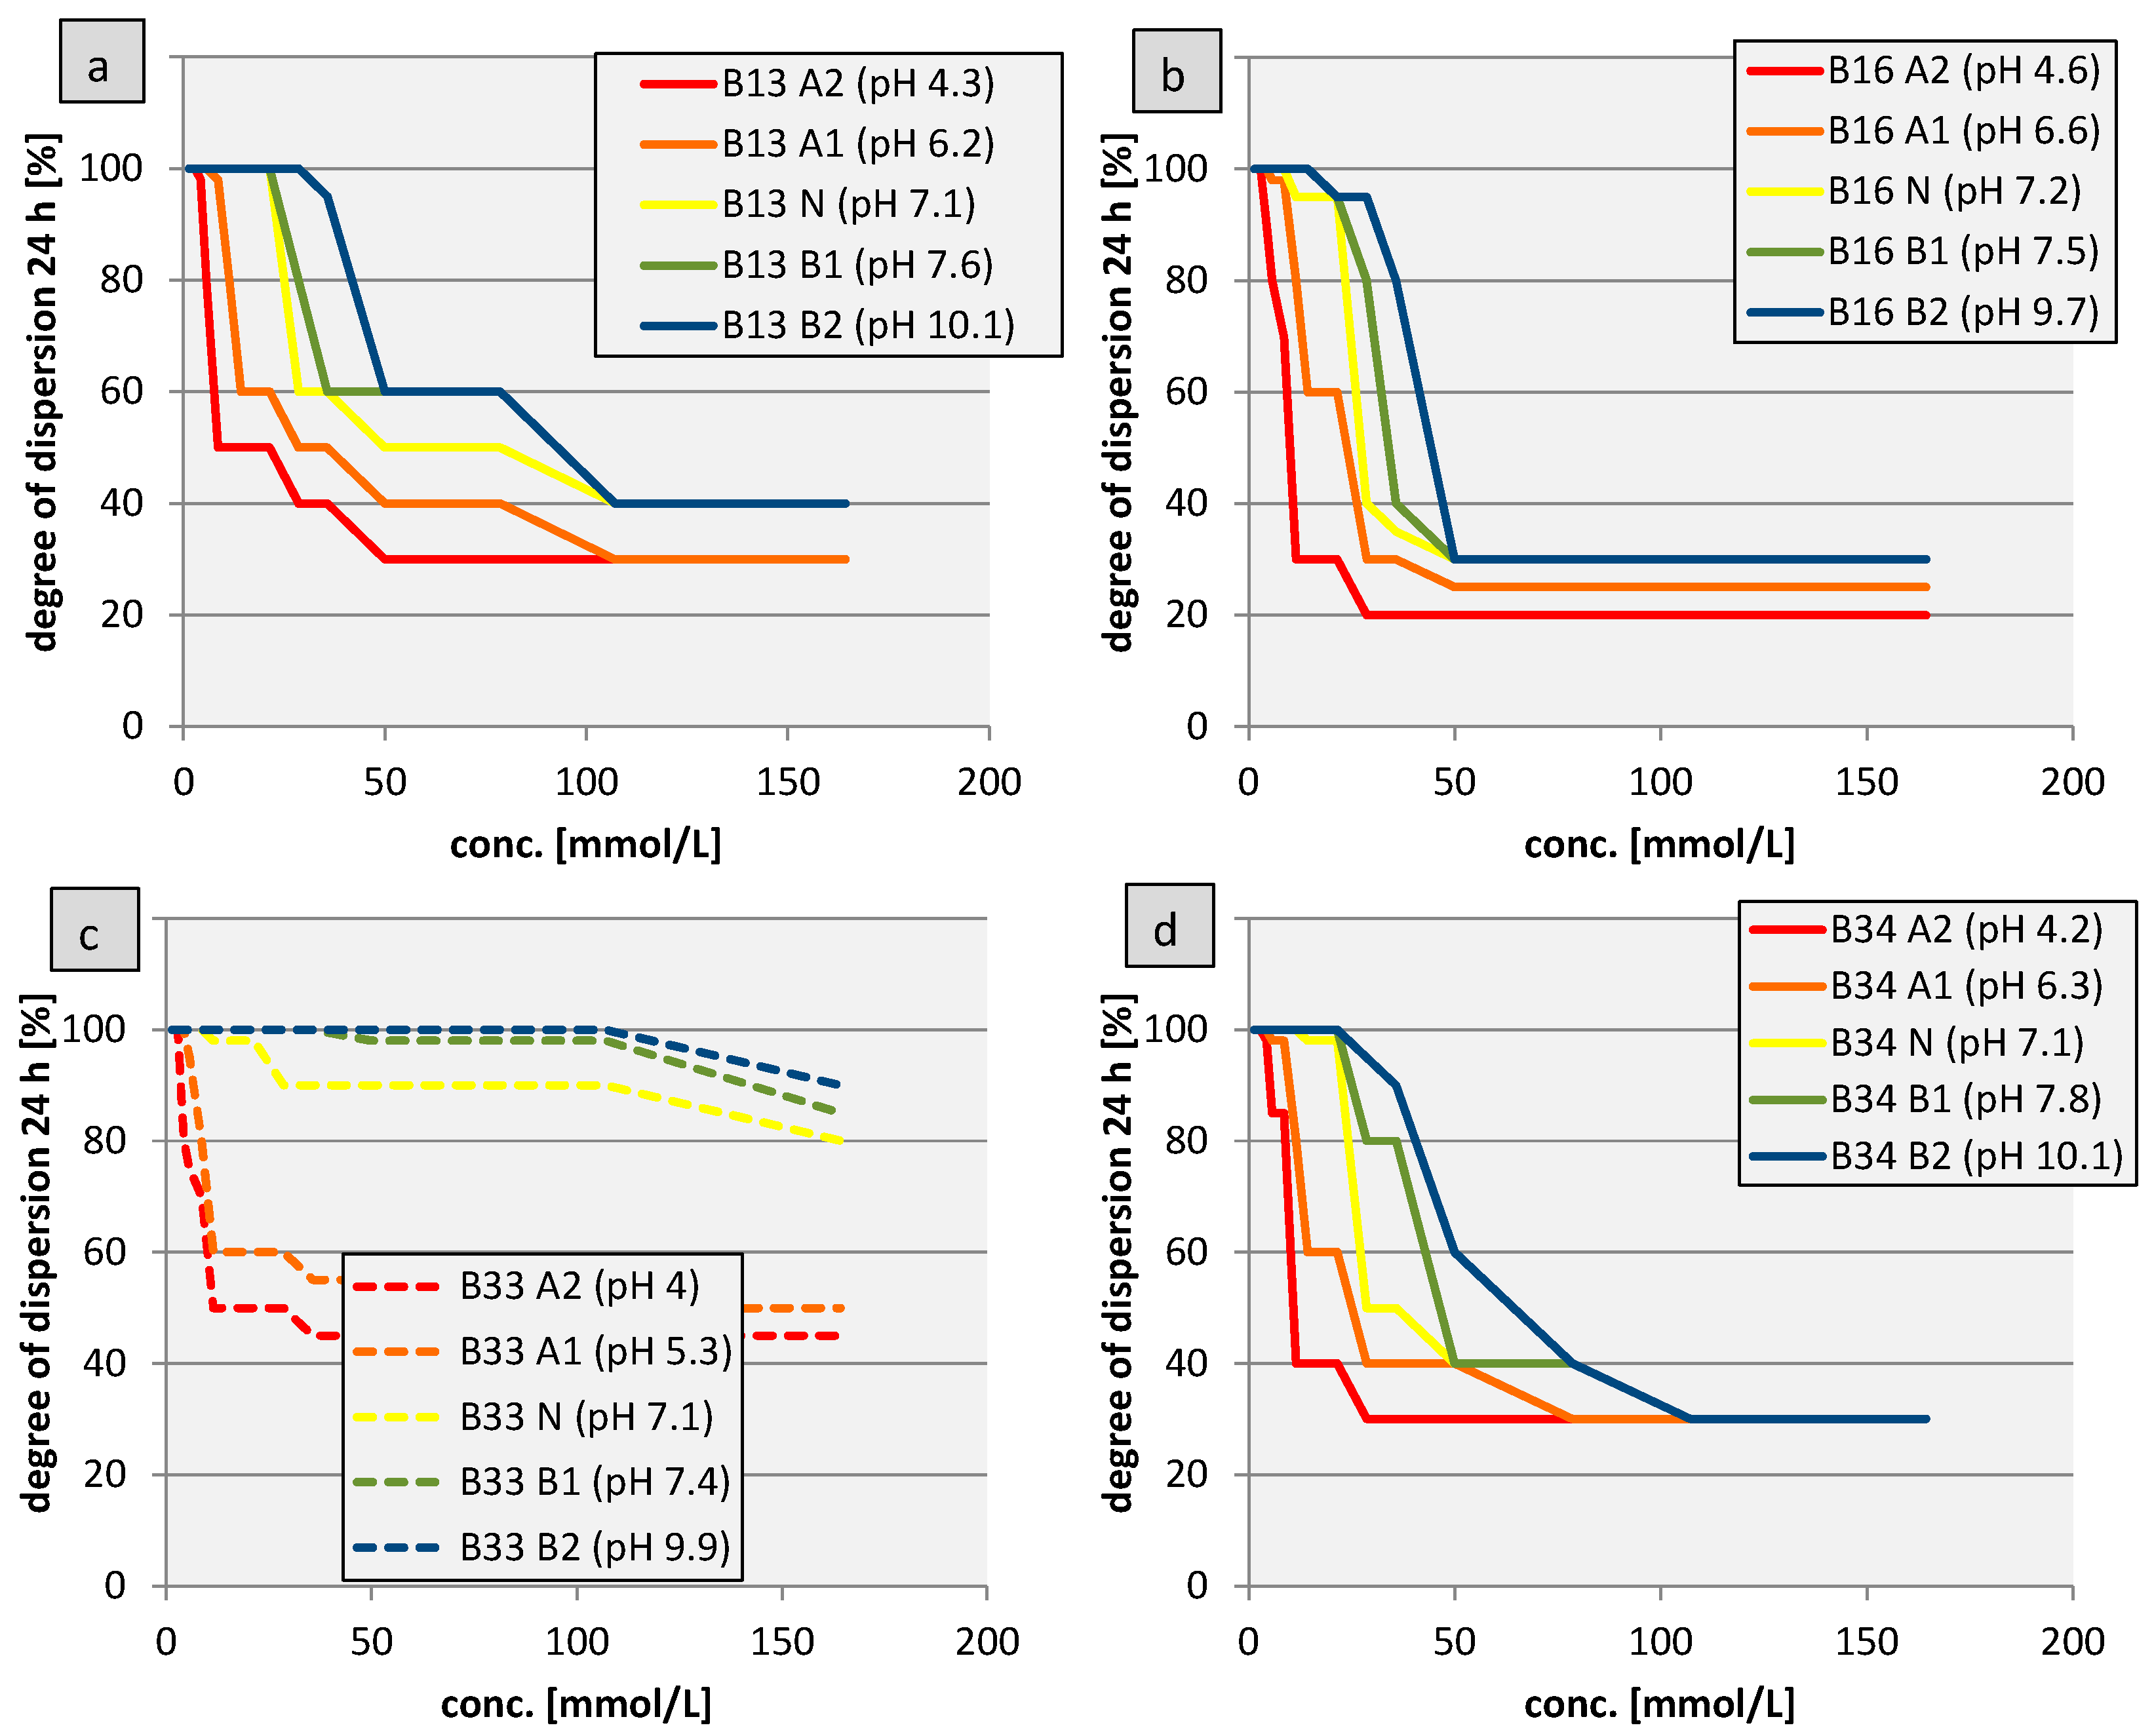
Figure 7.
Degrees of dispersion determined after 1, 5, 24, and 96 h at a NaCl concentration of about 600 mmol/L (far above the CCC). All 38 Na-saturated bentonites were used.
Figure 7.
Degrees of dispersion determined after 1, 5, 24, and 96 h at a NaCl concentration of about 600 mmol/L (far above the CCC). All 38 Na-saturated bentonites were used.
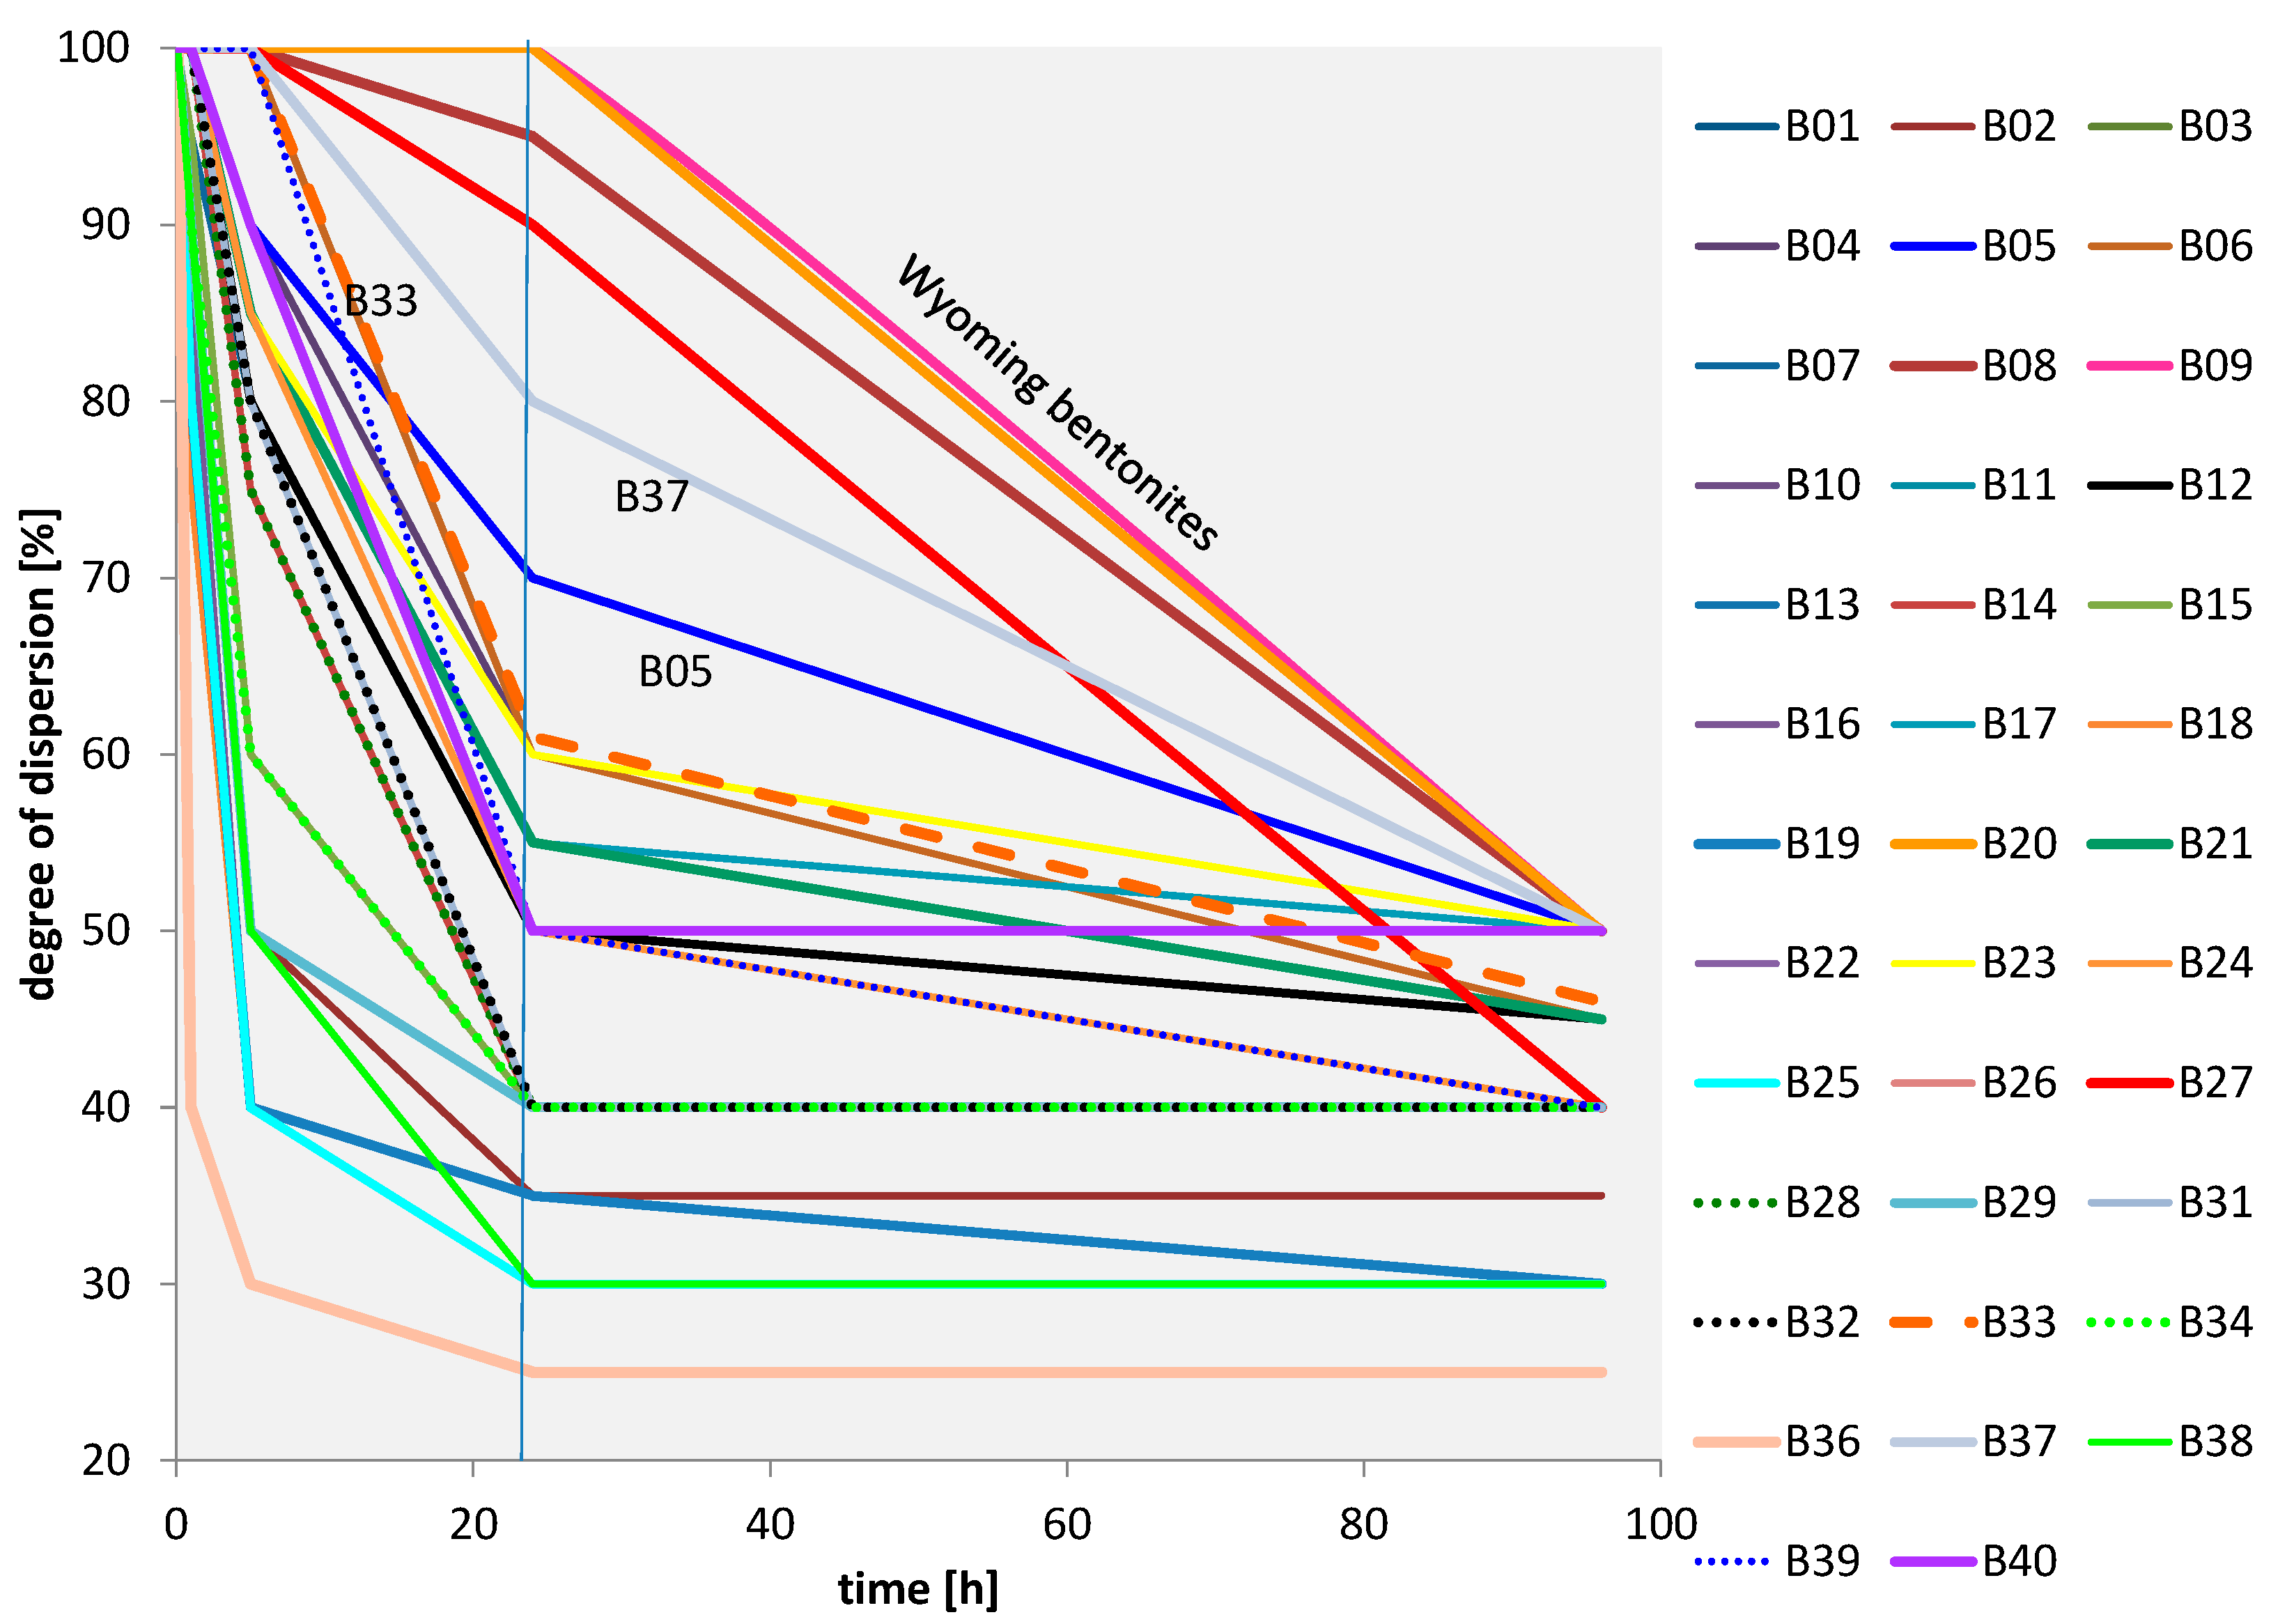
Figure 8.
Degree of dispersion (24 h, 0–750 mmol/L NaCl) of all bentonite dispersions.
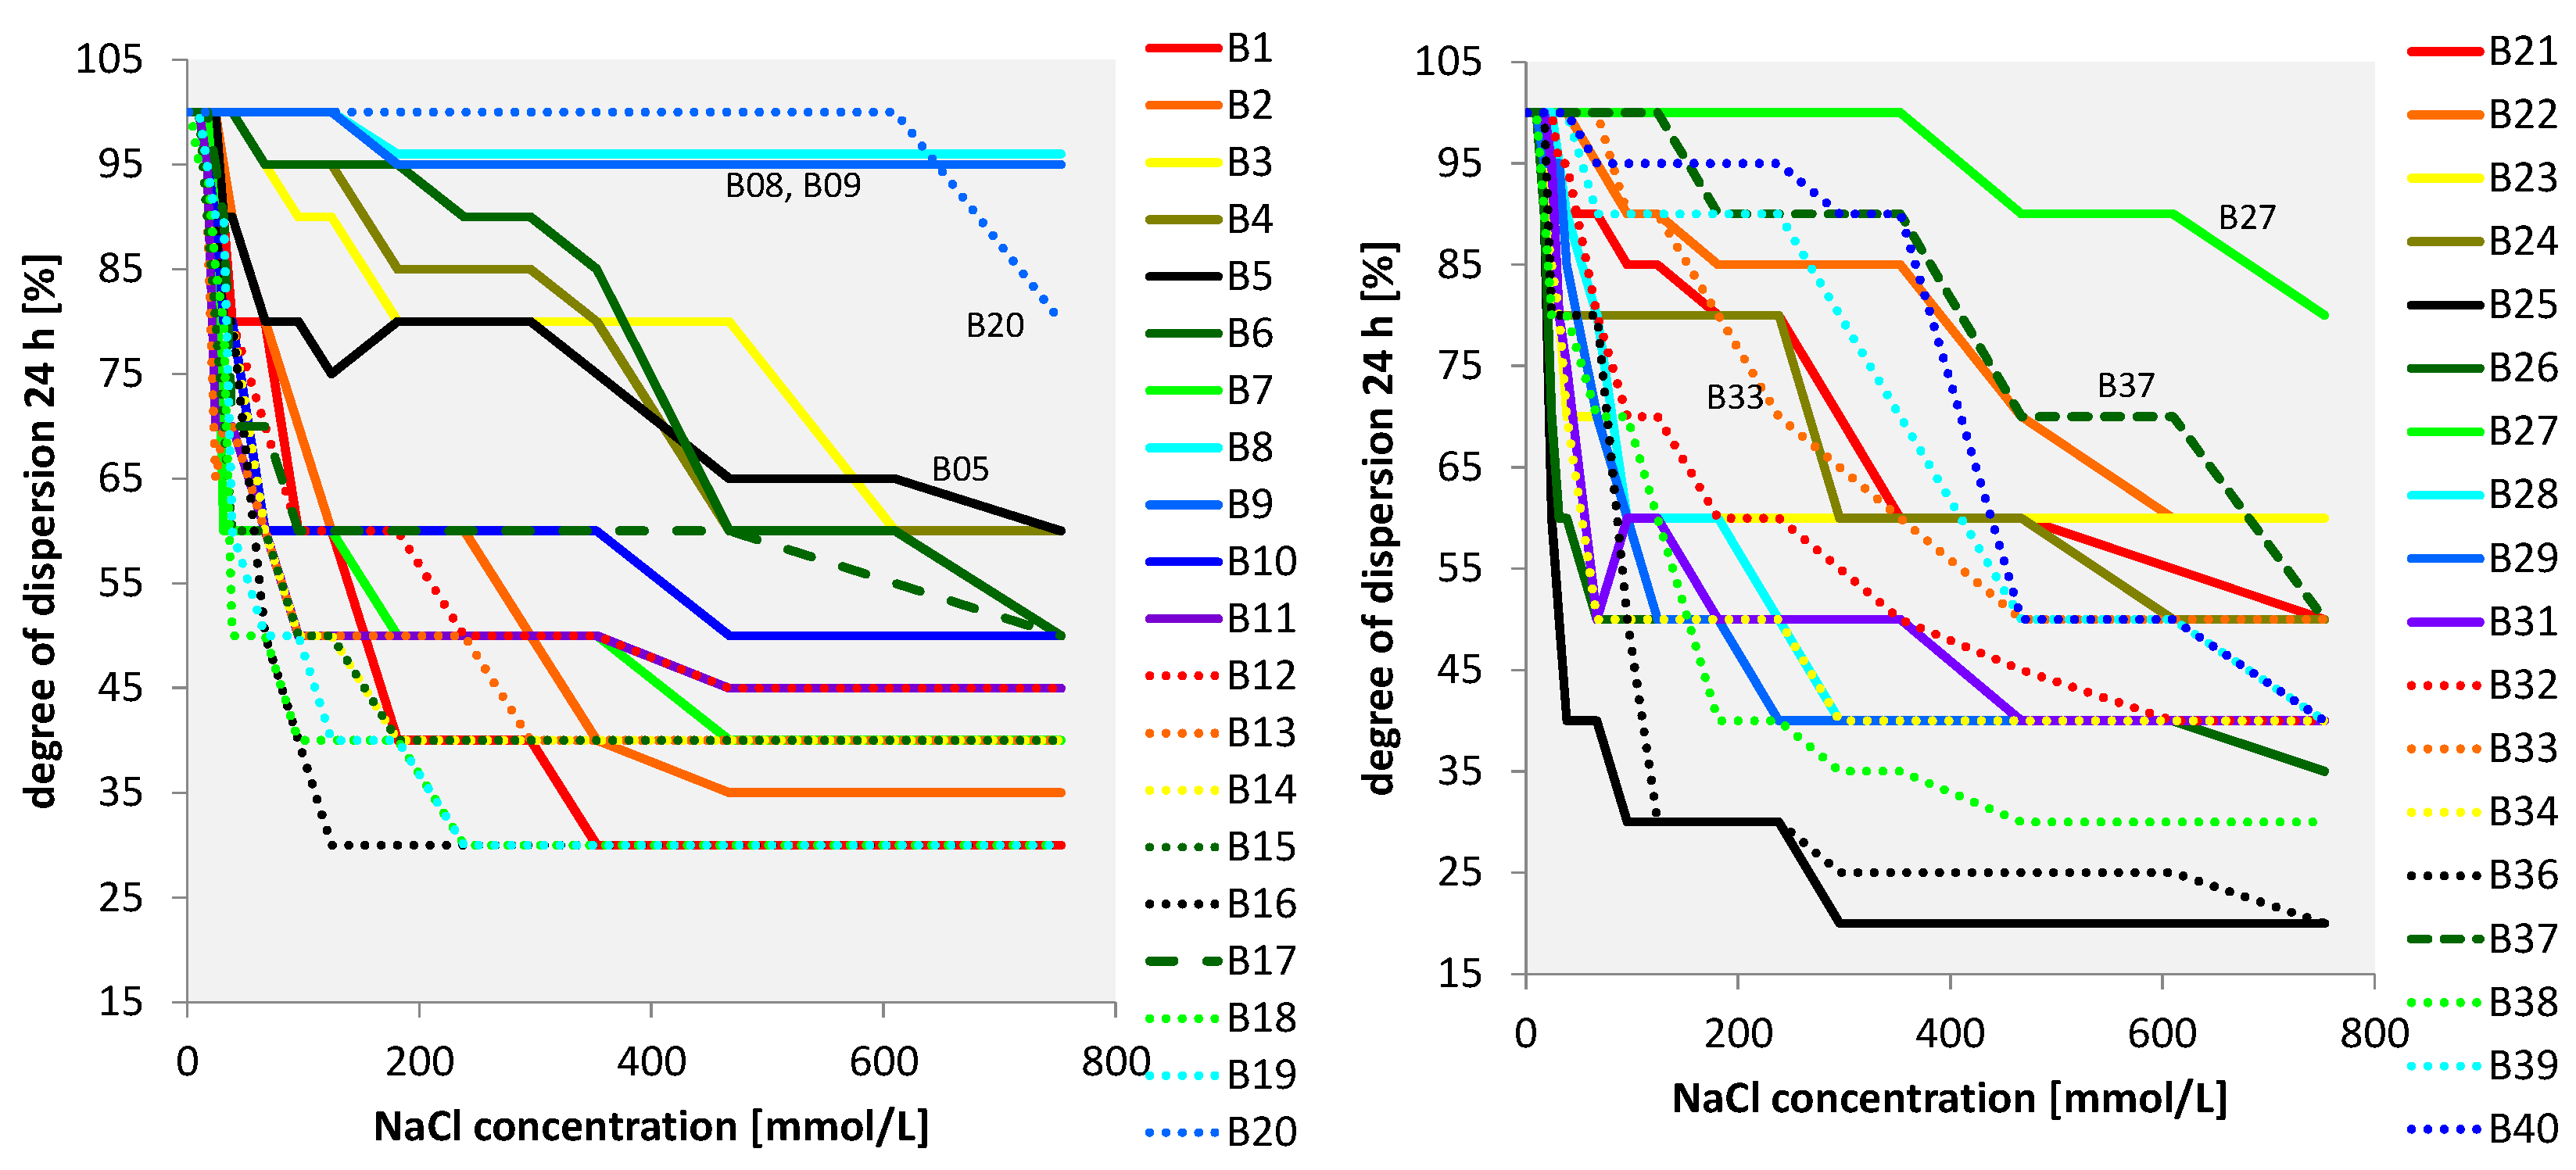
Figure 9.
Statistical investigation of the data presented in Figure 4 (all bentonites). (a): CCC vs. tetrahedral charge; (b): CCC vs. layer charge density; (c): degree of dispersion after addition of 124 mmol/L NaCl vs. tetrahedral charge; and (d): regression coefficient of degree of dispersion vs. tetrahedral charge depending on the NaCl concentration.


Table 1.
List of samples used and basic parameters which were used to investigate the CCC.
| Sample | Material | Location | Mineral. Comp. | Chem. Comp. | Tetrahedral Charge (%) | Layer Charge Density (eq/FU) | BET Surface Area (m2/g) | Soda Soluble Silica (mass%) |
|---|---|---|---|---|---|---|---|---|
| PM-4-7 | allophane | Ecuador | [32] | [31] | n.d. | n.d. | 273 | n.d. |
| B01 | bentonite | Sardinia | [35] | [10] | 11 | 0.36 | 14 | 1 |
| B02 | bentonite | Sardinia | [35] | [10] | 13 | 0.35 | 22 | 1 |
| B03 | bentonite | Milos | [35] | [10] | 15 | 0.33 | 63 | 3 |
| B04 | bentonite | Milos | [35] | [10] | 23 | 0.31 | 46 | 0 |
| B05 | bentonite | Milos | [35] | [10] | 19 | 0.31 | 65 | 0 |
| B06 | bentonite | Milos | [35] | [10] | 10 | 0.33 | 42 | 1 |
| B07 | bentonite | Milos | [35] | [10] | 16 | 0.33 | 59 | 1 |
| B08 | bentonite | Wyoming | [35] | [10] | 7 | 0.27 | 15 | 4 |
| B09 | bentonite | Wyoming | [35] | [10] | 13 | 0.18 | 31 | 10 |
| B10 | bentonite | India | [35] | [10] | 37 | 0.33 | 67 | 1 |
| B11 | bentonite | India | [35] | [10] | 32 | 0.31 | 66 | 1 |
| B12 | bentonite | India | [35] | [10] | 15 | 0.35 | 40 | 1 |
| B13 | bentonite | Hungary | [35] | [10] | 63 | 0.37 | 102 | 0 |
| B14 | bentonite | Hungary | [35] | [10] | 60 | 0.33 | 130 | 1 |
| B15 | bentonite | Hungary | [35] | [10] | 64 | 0.38 | 100 | 1 |
| B16 | bentonite | Bavaria | [35] | [10] | 22 | 0.27 | 59 | 1 |
| B17 | bentonite | Georgia | [35] | [10] | 14 | 0.32 | 54 | 1 |
| B18 | bentonite | Spain | [35] | [10] | 15 | 0.36 | 43 | 2 |
| B19 | bentonite | Spain | [35] | [10] | 19 | 0.35 | 49 | 1 |
| B20 | bentonite | Wyoming | [35] | [10] | 11 | 0.25 | 22 | 4 |
| B21 | bentonite | Morocco | [35] | [10] | 28 | 0.34 | 23 | 1 |
| B22 | bentonite | Argentina | [35] | [10] | 7 | 0.35 | 31 | 4 |
| B23 | bentonite | Argentina | [35] | [10] | 9 | 0.36 | 7 | 1 |
| B24 | bentonite | Morocco | [35] | [10] | 26 | 0.34 | n.d. | 1 |
| B25 | bentonite | Bavaria | [35] | [10] | 30 | 0.30 | n.d. | 1 |
| B26 | bentonite | Czech R. | [35] | [10] | 18 | 0.35 | n.d. | 8 |
| B27 | bentonite | Wyoming | [35] | [10] | 8 | 0.21 | n.d. | 3 |
| B28 | bentonite | Indonesia | [35] | [10] | 20 | 0.32 | 72 | 5 |
| B29 | bentonite | Indonesia | [35] | [10] | 31 | 0.33 | 96 | 1 |
| B31 | bentonite | Armenia | [35] | [10] | 16 | 0.32 | 38 | 4 |
| B32 | bentonite | England | [35] | [10] | 25 | 0.26 | 112 | 2 |
| B33 | bentonite | Wyoming | [35] | [10] | 12 | 0.25 | 16 | 2 |
| B34 | bentonite | Russia | [35] | [10] | 36 | 0.37 | 24 | 1 |
| B36 | bentonite | Slovakia | [35] | [10] | 51 | 0.20 | 57 | 1 |
| B37 | bentonite | Slovakia | [35] | [10] | 9 | 0.30 | 58 | 1 |
| B38 | bentonite | Russia | [35] | [10] | 25 | 0.24 | 22 | 1 |
| B39 | bentonite | Romania | [35] | [10] | 55 | 0.26 | 111 | 27 |
| B40 | bentonite | Brazil | [35] | [10] | 10 | 0.34 | 66 | 2 |
Abbreviations: Mineral.—Mineralogical; Comp.—Composition; Chem.—Chemical; n.d.—not detected.
© 2018 by the authors. Licensee MDPI, Basel, Switzerland. This article is an open access article distributed under the terms and conditions of the Creative Commons Attribution (CC BY) license (http://creativecommons.org/licenses/by/4.0/).
Share and Cite
MDPI and ACS Style
Kaufhold, S.; Kaufhold, A.; Dohrmann, R. Comparison of the Critical Coagulation Concentrations of Allophane and Smectites. Colloids Interfaces 2018, 2, 12. https://doi.org/10.3390/colloids2010012
AMA Style
Kaufhold S, Kaufhold A, Dohrmann R. Comparison of the Critical Coagulation Concentrations of Allophane and Smectites. Colloids and Interfaces. 2018; 2(1):12. https://doi.org/10.3390/colloids2010012
Chicago/Turabian StyleKaufhold, Stephan, Annette Kaufhold, and Reiner Dohrmann. 2018. "Comparison of the Critical Coagulation Concentrations of Allophane and Smectites" Colloids and Interfaces 2, no. 1: 12. https://doi.org/10.3390/colloids2010012