Waterflooding of Surfactant and Polymer Solutions in a Porous Media Micromodel


Department of Mechanical Engineering, Iowa State University, 2529 Union Drive, Ames, IA 50011, USA
*
Author to whom correspondence should be addressed.
Colloids Interfaces 2018, 2(2), 23; https://doi.org/10.3390/colloids2020023
Submission received: 1 May 2018
/
Revised: 3 June 2018
/
Accepted: 11 June 2018
/
Published: 12 June 2018
(This article belongs to the Special Issue Colloids and Interfaces in Oil Recovery)
Abstract
:In this study, we examine microscale waterflooding in a randomly close-packed porous medium. Three different porosities were prepared in a microfluidic platform and saturated with silicone oil. Optical video fluorescence microscopy was used to track the water front as it flowed through the porous packed bed. The degree of water saturation was compared to water containing two different types of chemical modifiers, sodium dodecyl sulfate (SDS) and polyvinylpyrrolidone (PVP), with water in the absence of a surfactant used as a control. Image analysis of our video data yielded saturation curves and calculated fractal dimension, which we used to identify how morphology changed the way in which an invading water phase moved through the porous media. An inverse analysis based on the implicit pressure explicit saturation (IMPES) simulation technique used mobility ratio as an adjustable parameter to fit our experimental saturation curves. The results from our inverse analysis combined with our image analysis show that this platform can be used to evaluate the effectiveness of surfactants or polymers as additives for enhancing the transport of water through an oil-saturated porous medium.
1. Introduction
Understanding multiphase flows in porous media is critical for enhancing the recovery of oil from porous bedrock [1]. When a reservoir is tapped through a wellbore in the bedrock for the first time, a pressure differential between the reservoir and the wellbore can be used as a primary form of recovery. Once the pressure differential reaches hydrostatic equilibrium, secondary forms of recovery such as waterflooding (i.e., water injection) can be used to extract the remaining oil [2]. Approximately 40% of the total available oil is extracted using these two methods [3].
Chemical methods, including the addition of surfactants, polymers, or alkali to the water, are used to enhance the recovery of oil beyond the 40% limit encountered with hydrostatic pressure and water [4,5]. Surfactants in water reduce the interfacial tension between the water and the oil, which also reduce the capillary forces and enhance the oil displacement efficiency [6,7]. Polymers act as viscosifying agents, where the inherent viscoelasticity of the polymer flood generates localized non-Newtonian shear stress that pulls oil threads [8,9]. A modification of the relative difference in phase viscosities, known as mobility, is known to enhance oil displacement [10,11]. A combination of chemical methods has been proposed as an effective method for enhancing oil recovery [12].
Understanding how these mechanisms act in isolation to each other and how they can be combined is critical for improving oil displacement efficiency. However, transport through oil-bearing porous media occurs at a rate of one linear foot per day [13], and the direct observation of large-scale oil displacement phenomena can take weeks [14], making the study of multiphase processes slow and difficult. The slow rate of observation is a direct result of transport through the interconnected network of grains that make up the porous media [15]. Micromodels based on lab-on-a-chip platforms offer one possible approach to experimentally investigating multiphase processes in porous media micromodels at shorter time scales [16].
Micromodels enable the direct observation of flow through porous media. In this approach, an optically transparent flow cell is constructed with a uniform distribution of glass or quartz beads dispersed inside to act as the porous grain structure, and direct visualization of the flow is then performed using optical microscopy techniques [17,18]. Although advances in microfabrication technology allow for the manufacturing of complex pore structures [19], most micromodels used to study multiphase fluid flow through pore media have been done in rectangular pore bodies and throats [16,20,21,22,23,24,25]. Computer-aided design of microchannels [26,27] can be used to mimic heterogeneous porous media structure. However, this method produces 2D pore structures that are not representative of 3D pore space. Micro-computed tomography (micro-CT) [28,29] or focused ion beam-scanning electron microscopy (FIB-SEM) [30] can be used to reconstruct the 3D pore structure for incorporation into porous media micromodels. Reproducing 3D pore space using these approaches is expensive and limited in scale [31,32,33], which led to a recent proposal to utilize microfluidic devices with patterned channels as a 2.5D structure to mimic the transport characteristics of 3D pore space [34].
This article presents a microfluidic platform to evaluate chemical methods for enhanced oil recovery through the waterflooding process. The platform consisted of a 750-µm-wide microfluidic channel, fabricated by soft lithography, into which glass beads saturated by silicone oil were packed to form a random porous bed. This allowed us to bridge the gap between 2D and 3D pore structures by utilizing soft lithography to create 2D microchannels and glass beads to form a porous 3D network. In this way, our platform helps to fill in the critical gap of 2.5D porous media micromodels by presenting an alternate pathway towards the fabrication of these types of devices.
We used optical fluorescence microscopy to track the invasion of an aqueous fluorescent dye to the main channel through a side channel. Tracking the dye enabled us to evaluate the saturation of the aqueous phase relative to the oil phase. The injection of pure water was compared to the injection of water containing two different kinds of chemical modifiers: sodium dodecyl sulfate (SDS) and polyvinylpyrrolidone (PVP). SDS is an anionic surfactant and PVP is a polymer. Our analysis based on optically tracking the invasion of the aqueous phase demonstrated that chemical modifiers significantly improved the displacement of oil from the microfluidic channel, although image analysis of fractal dimension morphology illustrated differences in aqueous phase invasion.
Micromodels offer qualitative information on flow characteristics, but quantitative tools for comparison to experiment are not well-developed [35]. Our work also seeks to address this gap by introducing an inverse analysis based on implicit pressure explicit saturation (IMPES) to determine the mobility of our surfactant and polymer phases. The analysis presented here offers an approach to interpreting two-phase flow data in a porous microfluidic channel and obtaining parameters such as saturation and mobility that can be used to compare effectiveness of different chemical methods for enhancing oil recovery. Optical measurements of waterflooding can also guide the assessment of other multiphase flow problems, such as the transport of sequestered carbon dioxide in porous bedrock [36,37], filtration of contaminants [38,39], and the additive manufacturing of complex fluid networks [40] or thermal management [41].
2. Materials and Methods
2.1. Device Fabrication
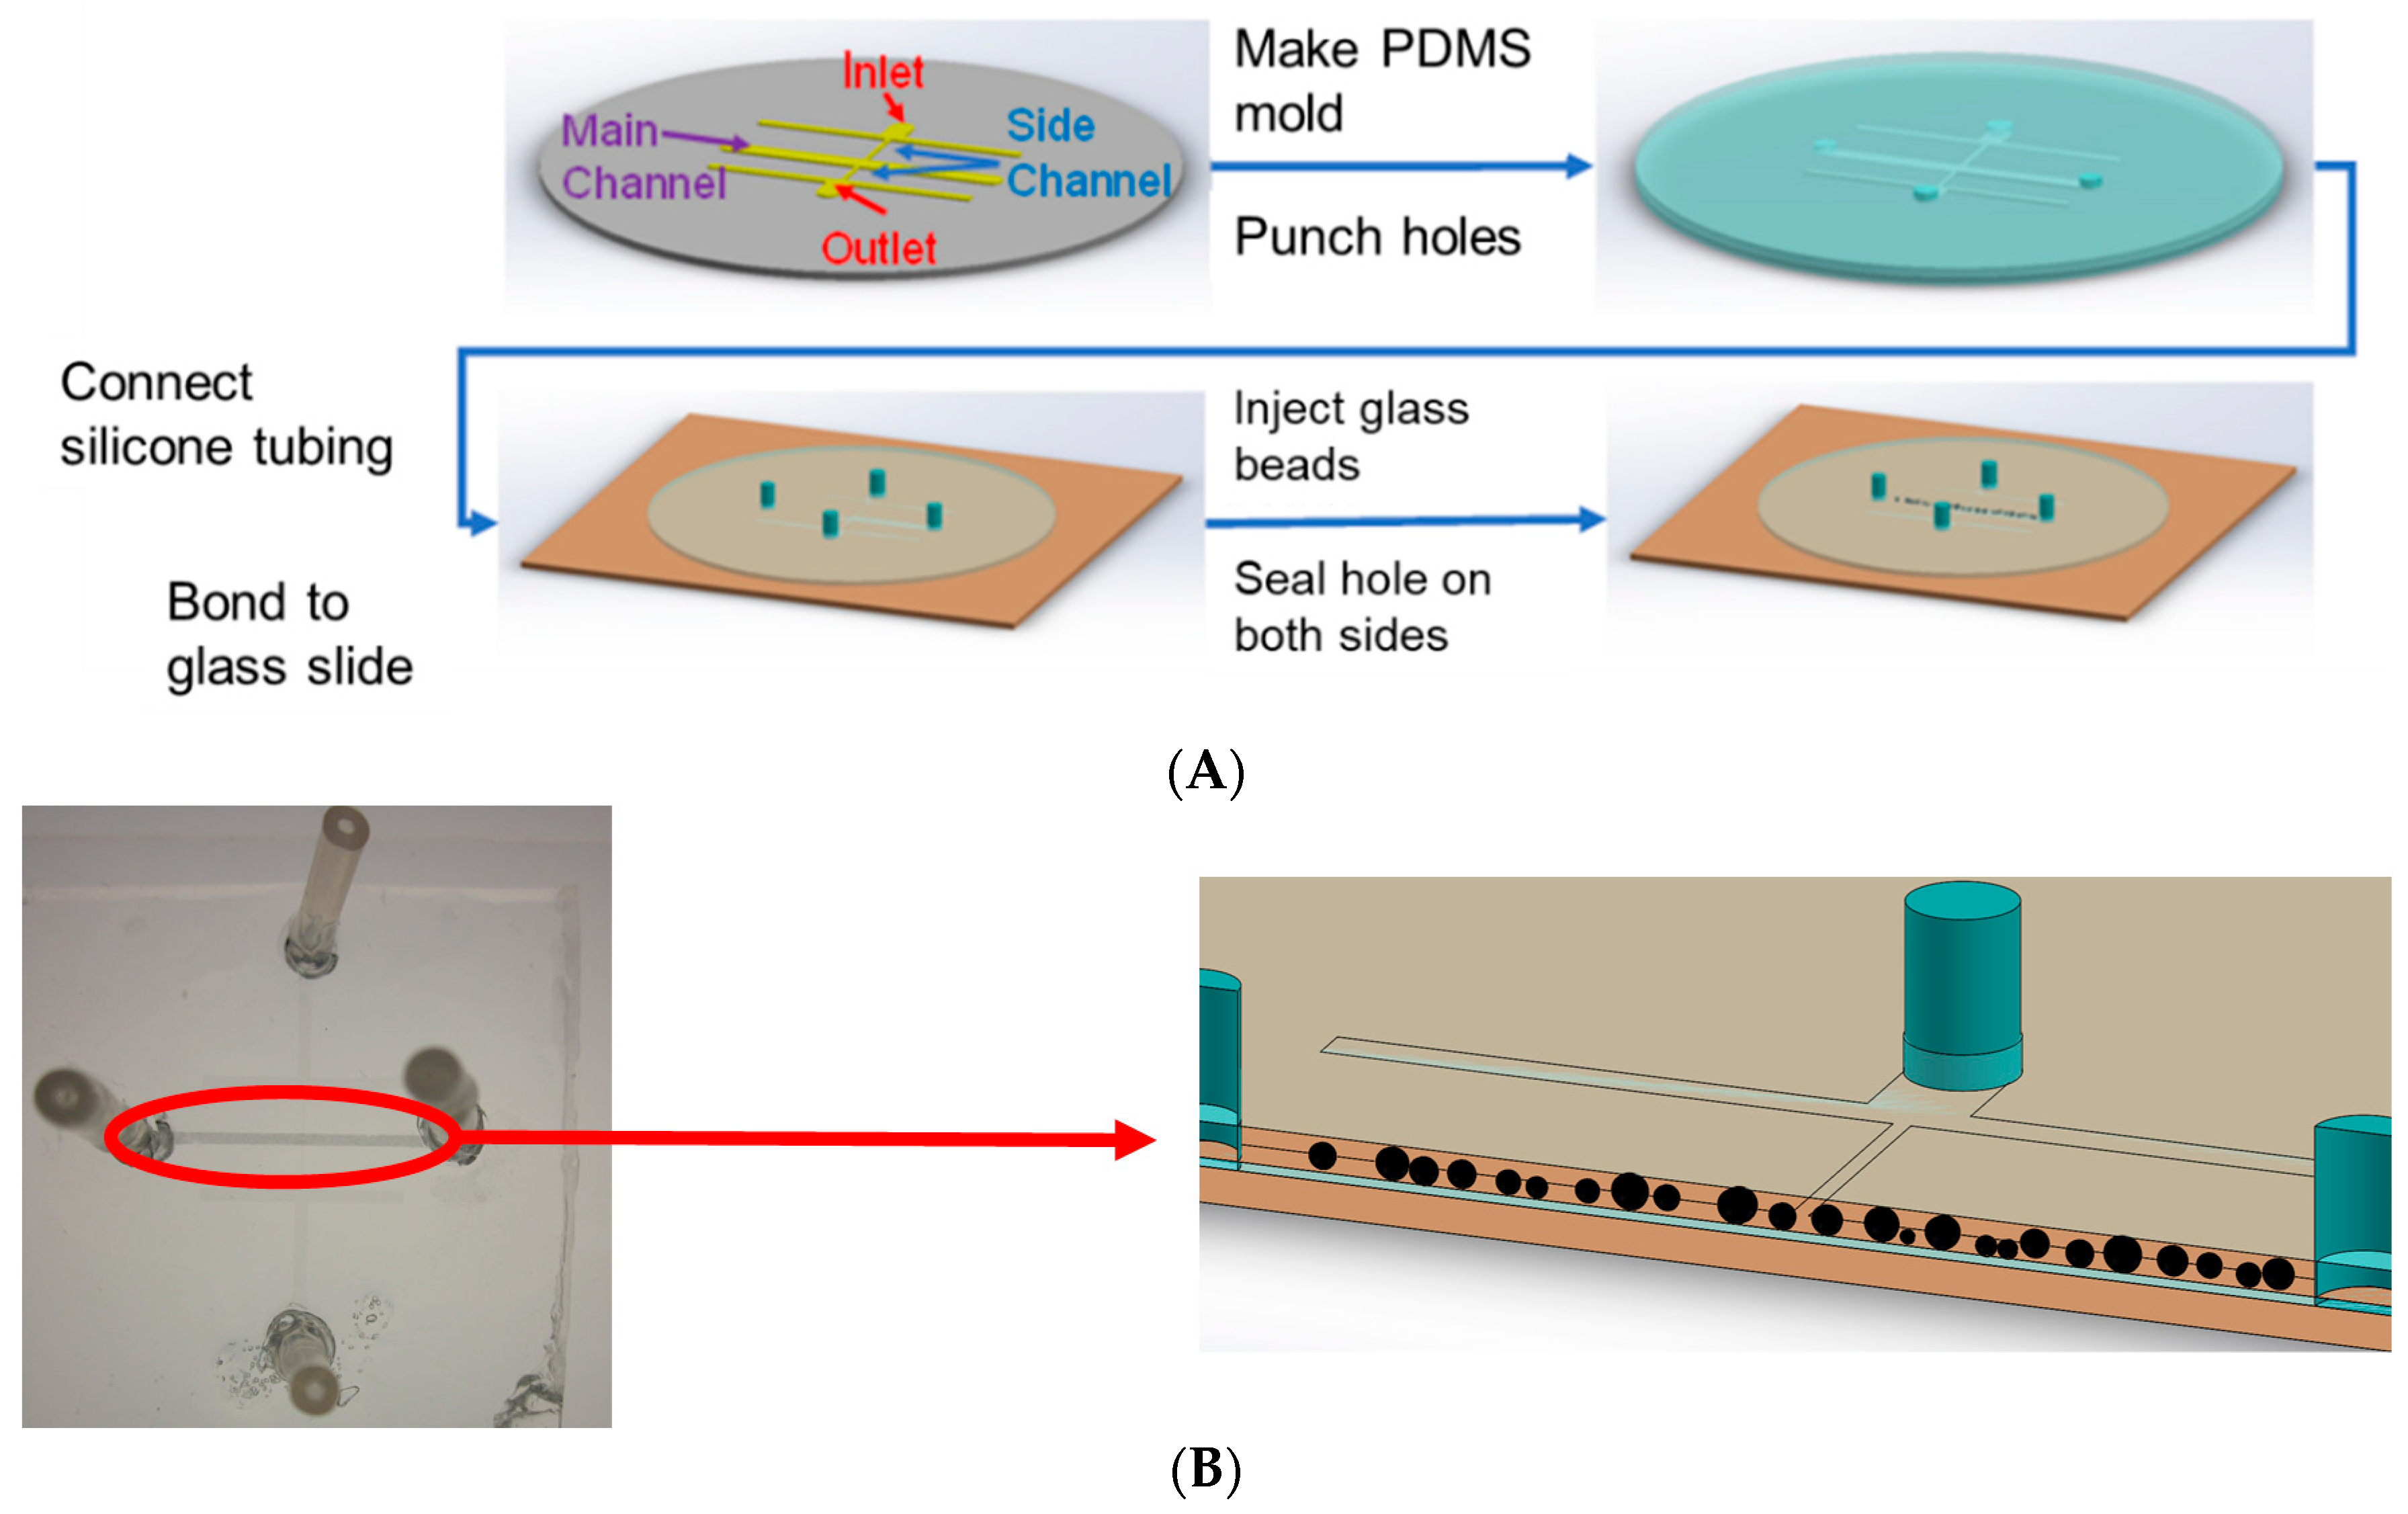
Our device was designed using AutoCAD and printed as a mask onto a transparent plastic sheet (CAD/Art Services, Bandon, OR, USA). The channel consisted of a main channel (750 μm wide and 17 mm long) along with a side channel (20 μm wide and 3 mm long) for injection of the fluorescent dye. The porous media was assembled from glass beads packed within the main channel. The fabrication process, shown in Figure 1A, began with conventional photolithography used to transfer the pattern from the mask to a 4-inch silicon wafer (University Wafer, South Boston, MA, USA) using photoresist (SU8 2050, Microchem, Westborough, MA, USA). The photoresist thickness was approximately 54 µm based on profilometry measurements.
Once the pattern was produced onto a silicon substrate through photolithography, it was transferred to a polystyrene petri dish into which polydimethylsiloxane (PDMS, Sylgard 184, Dow Corning, Midland, MI, USA) was poured to form a mold. The PDMS was mixed with a ratio of 10:1 monomer to curing agent by weight. After pouring the uncured PDMS over the pattern, the mold was placed in a desiccator, where air bubbles were removed from the mold using a vacuum pump. The mold was placed into an oven to cure for 2 h at 60 °C. The cured mold was then removed from the silicon master using a razor, and 3-mm-diameter holes were opened at the channel ends with a biopsy punch to create injection points for the fluids.
The PDMS microfluidic device was bonded to a microscope slide (Fisher Scientific, Catalog# 12-550C, Pittsburgh, PA, USA) that had been washed in acetone and methanol to remove organic debris, after which the solvent was washed off the slide with deionized water (ARIES High Purity Water System, Aries Filterworks, Berlin, NJ, USA) and the slide was then dried with nitrogen. Dust debris was removed from the PDMS using adhesive office tape, after which the microscope slide and the PDMS were placed inside a plasma cleaner (Harrick Plasma, PDC-32G, Ithaca, NY, USA) and treated for 2 min. The PDMS and the microscope slide were then placed in contact with one another before being heated at 60 °C for around 2 h to improve sealing. The microfluidic device was then removed from the oven and silicone tubing (Saint-Gobain, Version SPX-50, Product#ABX00001, Courbevoie, France) was inserted through the 3-mm holes, with a small amount of PDMS placed around the tubing perimeter to ensure a firm seal. The device was finally placed back in the oven for 1 h to cure.
The porous media was formed using randomly close-packed soda lime glass microspheres (P2050SL-2.5 35–45 μm—1 kg, Cospheric, Santa Barbara, CA, USA). Sieves with 38 μm, 45 μm, and 63 μm meshes were used to separate the glass microspheres and achieve a diameter range of ~48–63 μm after several rounds of sieving. Since the diameter of our microspheres was larger than the side channels used to inject our aqueous phase, we expected the microspheres to remain in place. A laboratory scale (LW Measurements, Model# HRB224, Rohnert Park, CA, USA) was used to weigh samples of 0.15 g of glass microspheres, which were dispersed in 20 mL of DI water and pumped into the large microchannel using a syringe pump (GenieTouch, Kent Scientific, Torrington, CT, USA) until the channel was filled with glass microspheres. After introducing the glass microspheres, the device was placed in an oven for 8 h to evaporate excess water, making it ready for use. The device was weighed both before and after the injection process to determine the amount of glass microspheres injected into the device. This mass measurement was used with an estimate of the average microsphere radius (~55.5 μm) to calculate the total volume occupied by the glass microspheres. This measurement provides an estimate of the porosity of the structure formed by the packed glass microspheres, which we found to be comparable to calculations of porosity based on image analysis. The porosity value that we obtained from these two measurements was small (Supplementary Tables S1 and S3). Multiple devices were fabricated using this technique, and we selected devices based on image analysis that were within 10% of the target average porosities (0.063, 0.113, and 0.143).
2.2. Image Capture and Processing
Experimental observations of water injection were accomplished using an Olympus IX70 microscope with a 10× objective lens. A scientific CMOS camera (Optimos, QImaging, Surrey, BC, Canada) was used to record video and capture images (480 × 270) for porosity analysis. An LED light source (wLS, QImaging) was used to illuminate the sample and excite the fluorescent dye. Video of the dye being injected into the fluid was captured at a rate of five frames per second. The scale for these images was 3.7281 microns per pixel.
After capturing experimental videos, we used ImageJ (National Institutes of Health, Version 1.51, Bethesda, MD, USA) to crop the videos and retain the main channel where the oil displacement occurred. These videos were then analyzed using a program written in MATLAB (Mathworks, Version 2017B, Natick, MA, USA) to track changes in fluorescence due to aqueous phase invasion. The program applies a boxcar filter to reduce the image noise. A threshold value for each frame of the video was calculated to retain the area occupied by the fluorescent dye. This area was compared to unoccupied area to obtain the degree of water saturation. This result was also used to obtain the fractal dimension of the aqueous phase.
2.3. Device Characterization
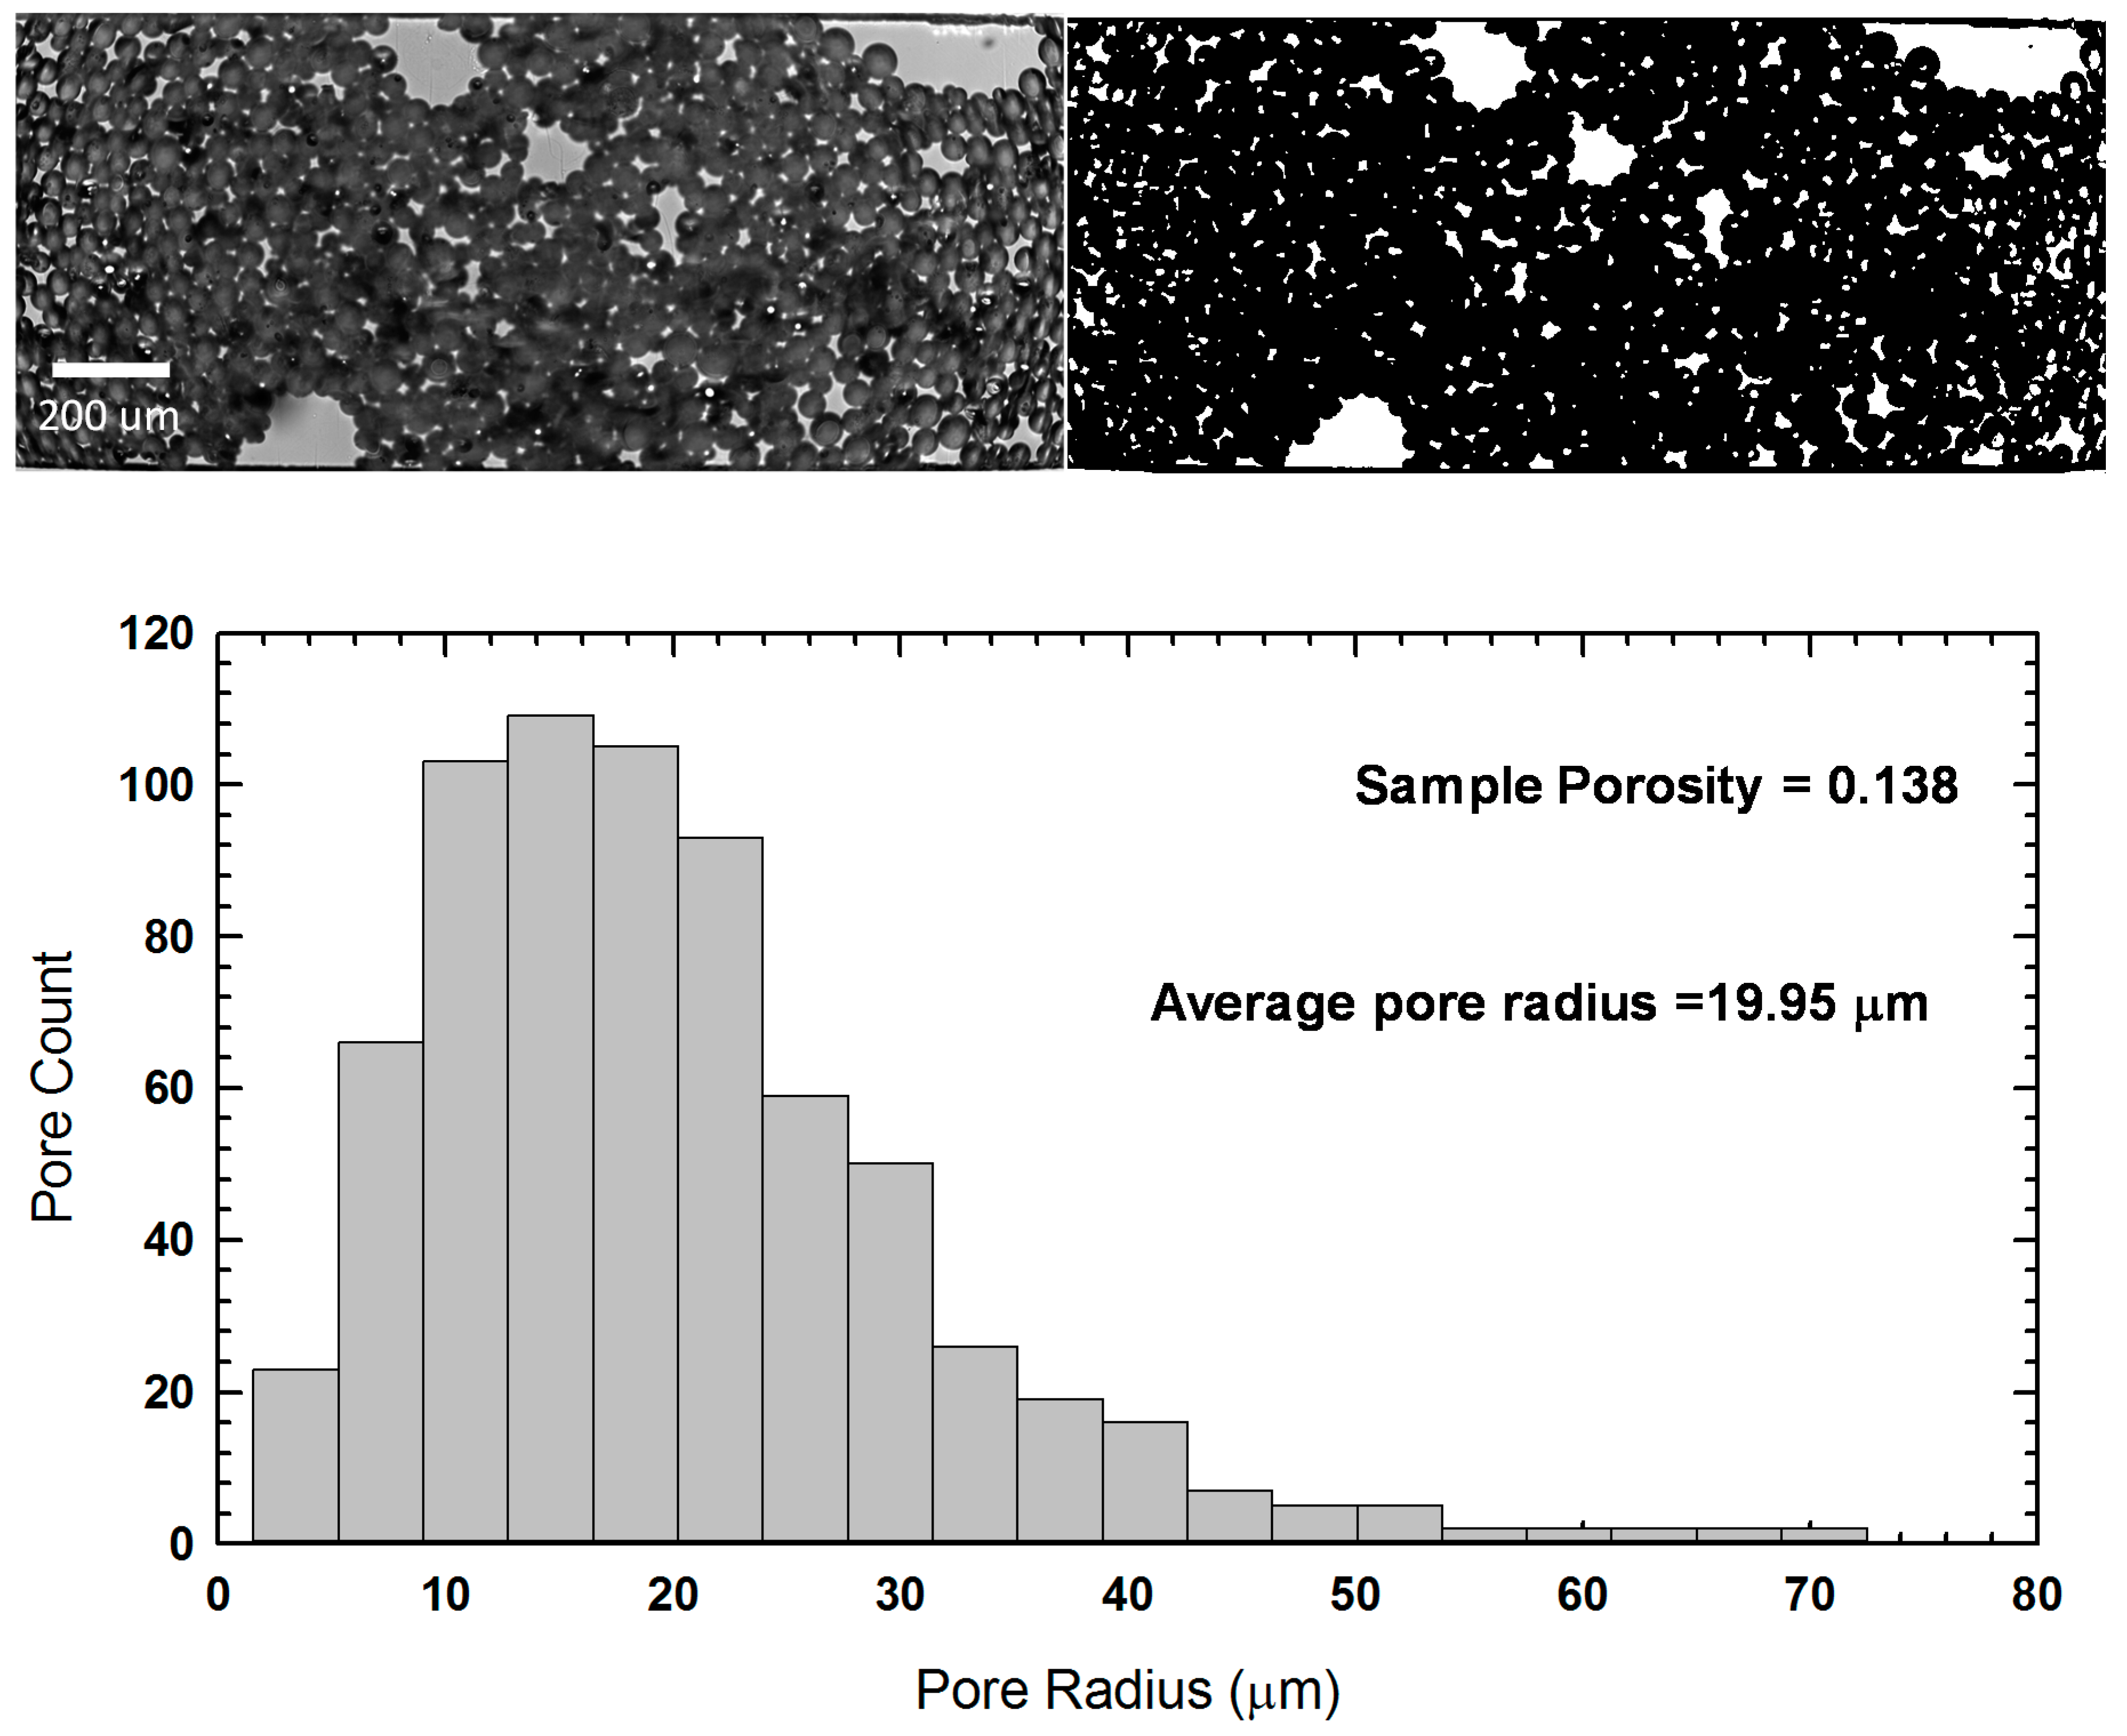
MATLAB code [42], initially developed to measure porosity and pore radius for thin rock samples, was adapted to provide a measure of the porosity of our glass bead packed bed. The MATLAB code used in this work was used to accurately determine the porosity of 3D rock samples using 2D images obtained through micro-CT scans [43]. Before performing an experiment, an optical image was taken of the point where the main channel met with the dye injection port (Figure 2, top-left). After the image is converted to black and white (Figure 2, top-right), the MATLAB algorithm draws a series of test lines across the image to determine the average sizes of pore space (white) and grain size (black), with the ratio of empty pore space to total image area representing the porosity for a thin sample. The average porosity measured within the device was consistent with measurements made by weighing the device. The observed pore size was 20 μm for the test sample (Supplementary Table S2), while the distribution of pore sizes is shown in Figure 2. The average porosities for all of our packed beds were 0.063, 0.113, and 0.143. The porosity values fell within a reasonable range based on predictions for randomly packed polydisperse spheres in 3D, with 0.03 being a theoretical lower limit [44].
2.4. Experimental Details
The experiments utilized silicone oil (νoil = 5 cSt, ρoil = 0.913 g/mL) as a defending fluid. After porosity measurements were completed, silicone oil (product # 317667, Sigma Aldrich, St. Louis, MO, USA) was injected into the main channel before the main channel was sealed with PDMS to prevent leaks. Deionized water (νwater = 1 cSt, ρwater = 0.99 g/mL), used as the invading fluid, was injected into the microfluidic device through a side channel using a syringe pump (Chemyx Fusion 100, Stafford, TX, USA). The mobility ratio, defined as the ratio of dynamic viscosities (M = νoil ρoil/νwater ρwater), is a measure of the ease with which an invading fluid flows in the presence of a defending fluid [45], with lower mobility allowing the invading fluid to flow through the porous media and recover more oil than a mobility is higher.
The capillary number [20] is Ca = νoil ρoil vinj/γωo, where vinj is the average velocity of the invading fluid during injection and γwo is the surface tension between the two fluid phases. The characteristic injection velocity is vinj = Q/b d, where Q is the injection rate, b is the gap thickness of the device (~54 µm) and d is the median pore-throat size (~20 μm). The injection rate for all experiments in this article was fixed at 0.1 mL/h using a syringe pump. Initial experiments were conducted using deionized water containing 0.1875 mM of rhodamine B dye sourced from Acros Organics (Morris Plains, NJ, USA). The surface tensions for the different aqueous fluids used in our device were evaluated using a surface tension apparatus (Fisher Scientific, Product #14-818). The surface tension of 5 cSt silicone oil on a solid interface is based on published results [46]. The contact angle for the oil–water interface was evaluated by injecting both phases into a microfluidic channel and using image analysis [46] to evaluate the resulting angle. From these parameters, we were able to estimate the characteristic capillary number for each of our fluid systems.
Experiments conducted with water injection into the oil-saturated porous medium were compared to experiments in which a surfactant was introduced to reduce surface tension. Two chemical modifiers, sodium dodecyl sulfate (SDS, Sigma Aldrich, Product#75746) and polyvinylpyrrolidone (PVP, Alfa Aesar, MW 40,000, Product #J62417, Ward Hill, MA, USA), were selected for comparison based on their use in the petroleum industry for enhancing oil recovery [47,48]. The fluorescent dye solution was prepared as previously described, and a surfactant or polymer with a concentration of 0.1 wt % was added to this solution. Based on the interpolation of published data, the viscosities of our solutions were approximately 0.99 mPa·s for SDS in water [49] and 0.9 mPa·s for PVP in water [50]. Our injection flow rate was slow, and each experiment took only approximately 30 min to complete, during which time we did not observe PDMS swelling. The injection experiments were conducted in a manner similar to those described for water alone.
3. Theory and Simulation
Modeling two-phase fluid flow in porous media requires a coupled system of nonlinear time-dependent partial differential equations [51]. We used an approach known as the implicit pressure explicit saturation (IMPES) model [52] to simulate the transport of the invading water phase in our device. The model relies on an implicit formulation of conservation of mass and momentum to reduce the computational cost of the simulation [53].
The formulation of the model begins with a mass balance for an incompressible, immiscible two-phase flow [54],
where φ is the medium porosity, ρ is the fluid density, S is the saturation, u is the volumetric velocity, q is the mass flow rate per unit volume, and α is the phase type (water or oil). Darcy’s law is used to model the volumetric velocity of the fluid phases as they flow through the porous medium for a thin section of negligible depth,
where krα is the relative permeability, K is the absolute permeability tensor of the porous medium, and P is pressure.
Substituting Equation (2) into Equation (1) and applying the assumption that porosity does not change with time yields [52]
where the parameter, λ, is referred to as the phase mobility. The saturation of the water phase is defined as
where u = uw + uo is the total velocity of the system and fw = λw/(λw + λo) measures the fraction of water flowing through the system. Introducing a set of simple analytical expressions allows us to close the model presented by Equations (3) and (4),
where Swc is the water trapped in the pores during the formation of the porous medium and Sor is the lowest oil saturation that can be achieved by water displacement. The oil and water phase saturations are constrained by So + Sw = 1.
The solution to these systems of equations is based on the approach of Aarnes et al. [52] and was coded in MATLAB. The simulation approach is summarized here. The model simulates a two-dimensional representation of the oil-saturated porous medium. The fluid properties (density and viscosity) mentioned in the Materials and Methods section are used to estimate the initial mobility ratio of the system. The initial oil saturation distribution is assumed to be uniform throughout our porous medium. The absolute permeability tensor, K, is generated using a random distribution with a log-normal profile. As the time step within the simulation advances, the pressure distribution is calculated using a two-point flux approximation (TPFA) scheme to discretize the pressure equation (Equation (3)) along with edge velocities.
An explicit finite-volume formulation of the saturation equation (Equation (4)) of the form
is used to advance the change in phase saturation with a dimensionless time step, . The parameter is the total flux over an edge between two adjacent cells and , and is the fractional flow function at . The fractional flow function is:
The model presented here was used to directly compare with experimental results. This was done by taking the ensemble average of the water phase saturation, , across the simulation domain with N elements (i.e., total numbers of grid blocks) as a function of simulation time. The results were converted to experimental time, which allowed for a direct comparison to experimental results. The ensemble average of experimentally observed water saturation was directly measured by identifying the area occupied by the rhodamine B dye. We obtained a coefficient of determination through water phase saturation to determine the goodness of fit for the simulation.
If the coefficient of determination (COD) was below a value of R2 = 0.9, we ran a series of forward simulations to try and improve the fit to our data. Mobility was used as an adjustable parameter as a way to account for mixing [55] between phases. The mobility for the next forward simulation was drawn from a uniform probability distribution,
where Mf is the mobility ratio associated with the best COD, Mi+1 is the mobility for the next forward simulation, ξ is a random uniform number that ranges from 0 to 1, and δ is a maximum possible range parameter, which we set to a value of 0.1. The new COD value was compared to the old COD value when the simulation was complete. The factor Mf remained unchanged if the new COD was lower than the old COD. Otherwise, we updated Mf = Mi+1 if the COD value was found to improve.
4. Results and Discussion
4.1. Oil Displacement Efficiency
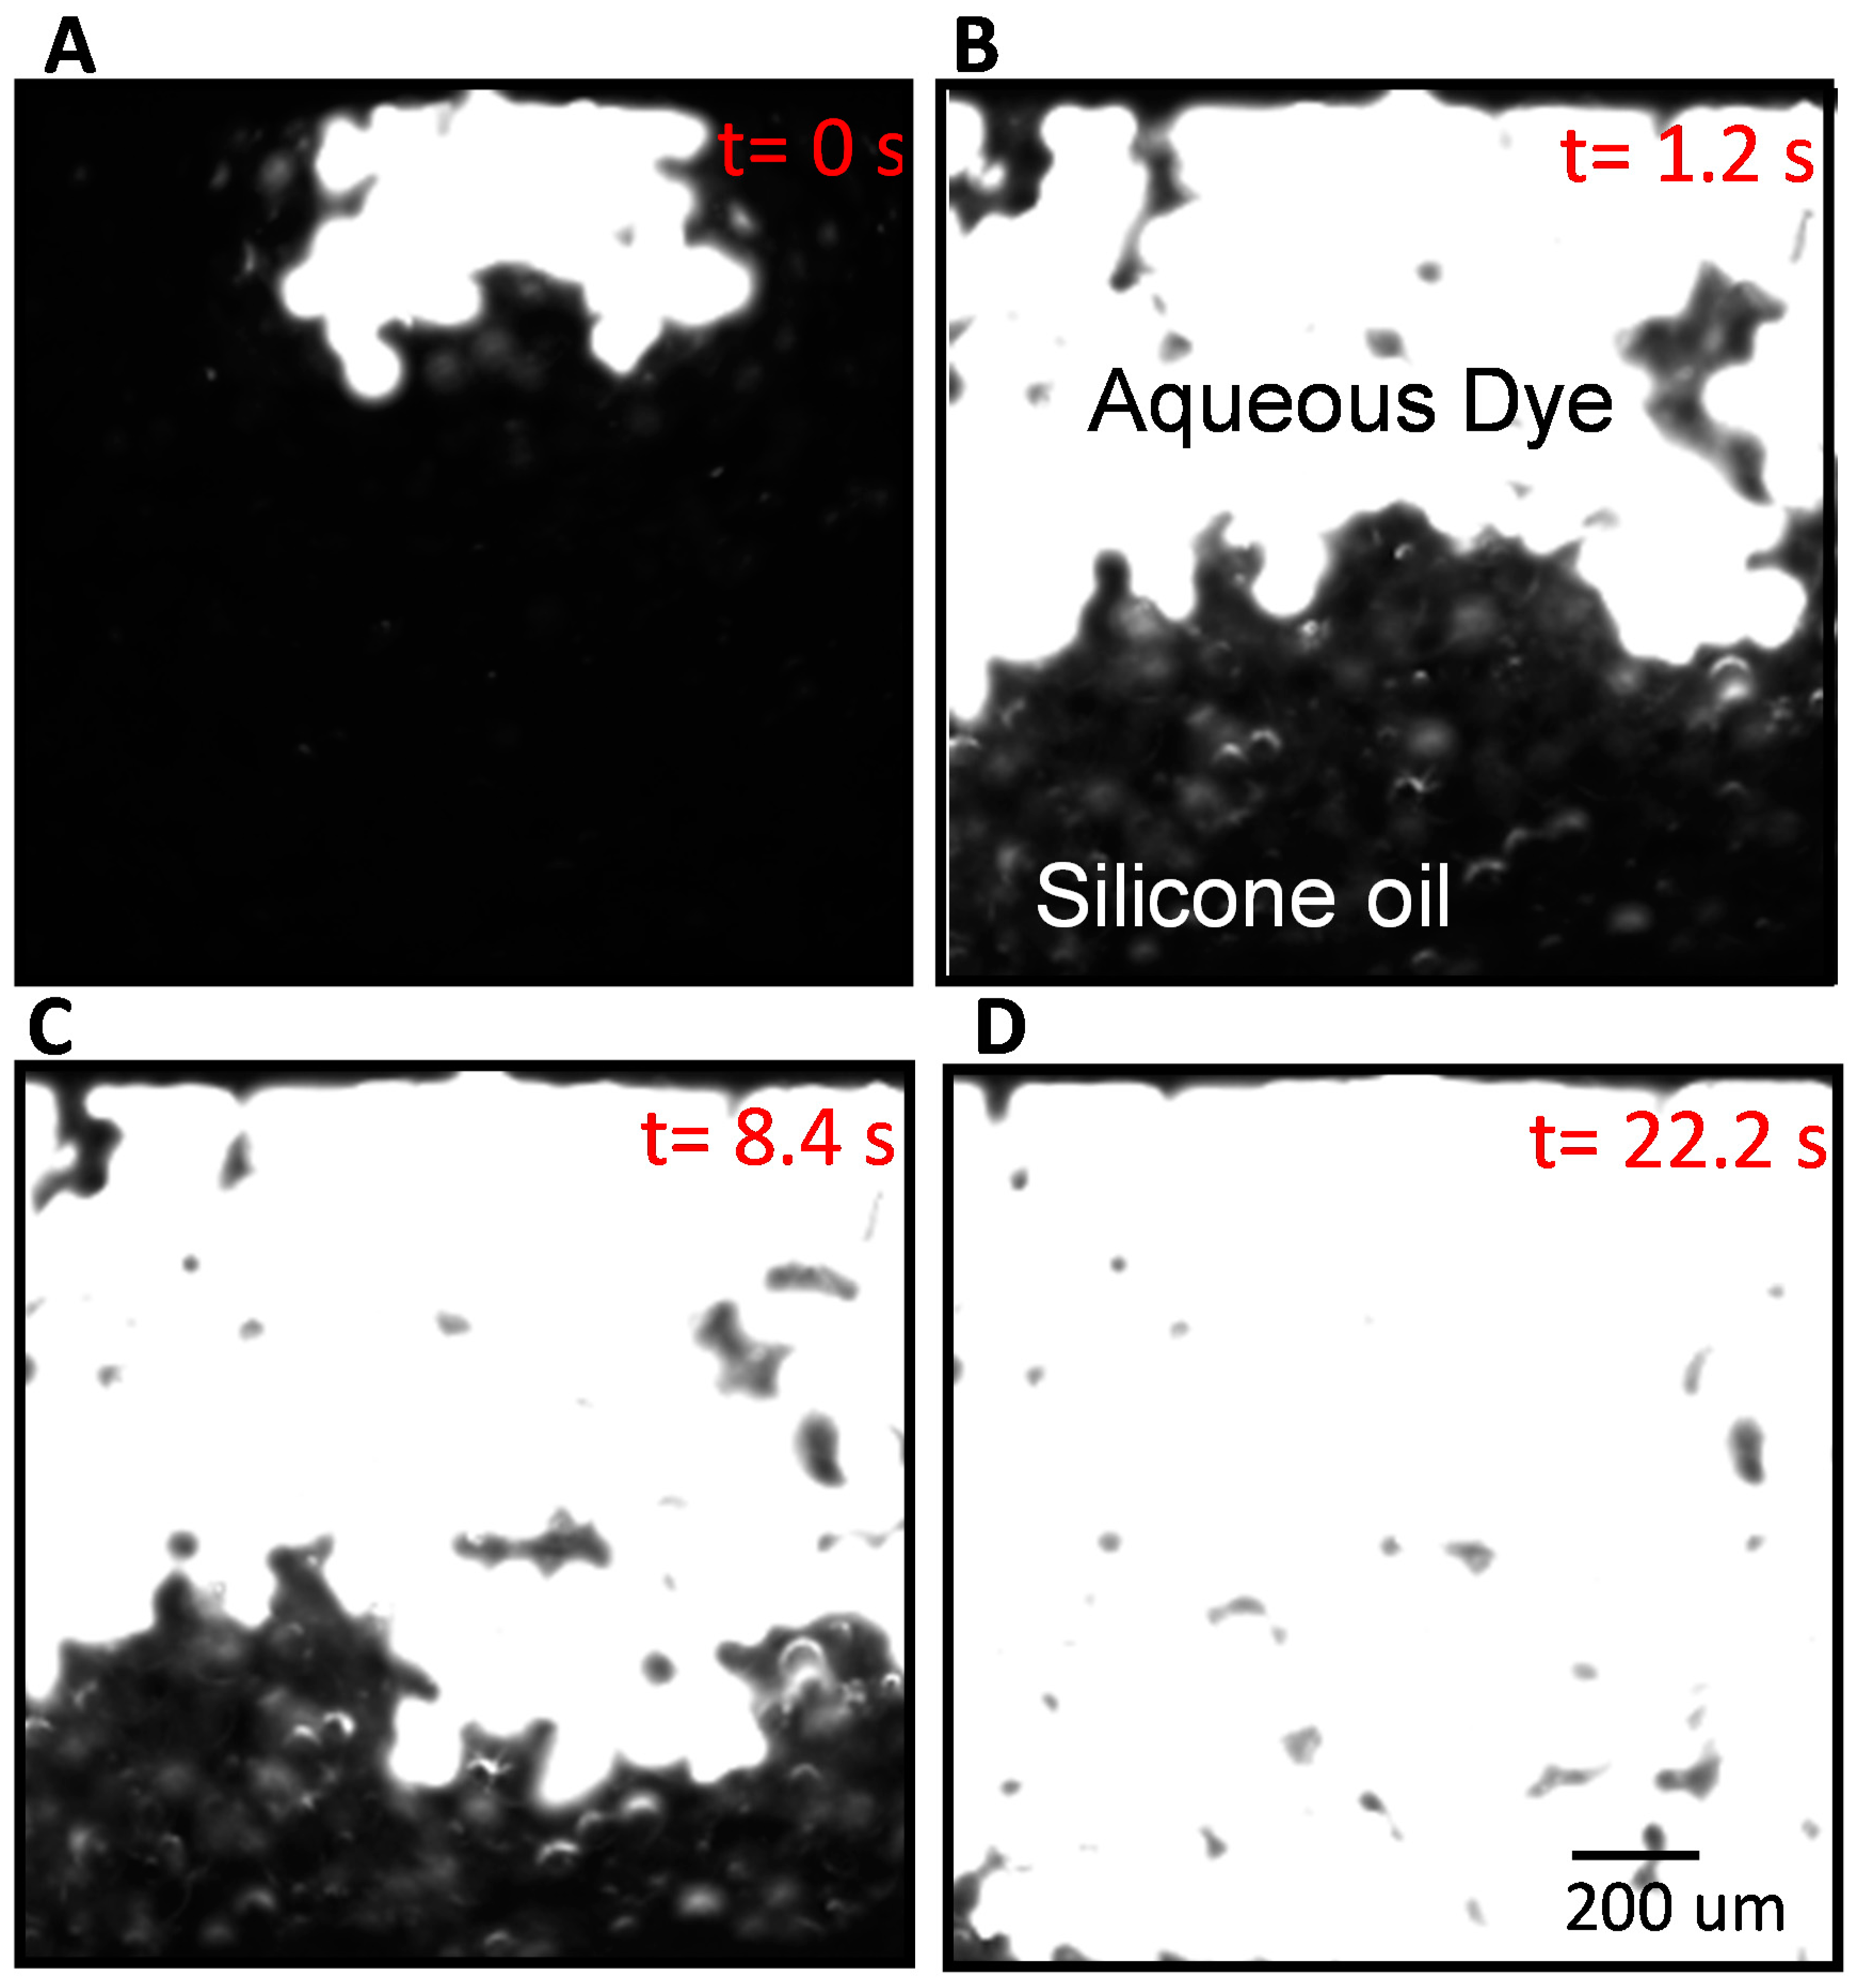
The experimental displacement of silicone oil by waterflooding is illustrated in Figure 3. The rhodamine-dyed water initially built up sufficient pressure at the inlet port to break through into the porous media micromodel. As the water displaced silicone oil, some silicone oil still remained in voids (Figure 3B,C), and after approximately 20 s, the water reached the exit port on the opposite side of the porous media micromodel (Figure 3D). Observing the porous media micromodel after the initial exit of the water, we saw a reduction in void size over time as additional silicone oil was either displaced by water or shrank due to the applied pressure of the flow.
We performed three separate types of waterflooding experiments similar to the one described in Figure 3 (Supplementary Figures S1–S3). The first type of experiment used water mixed only with rhodamine, while the other two types of experiments utilized SDS or PVP. A packed bed of glass beads was prepared before each experiment and characterized using the previously described protocol. MATLAB image analysis code was written to track the area occupied by the rhodamine dye during the experiment, allowing estimation of the average water phase saturation defined by Sw = Adye/Achannel.
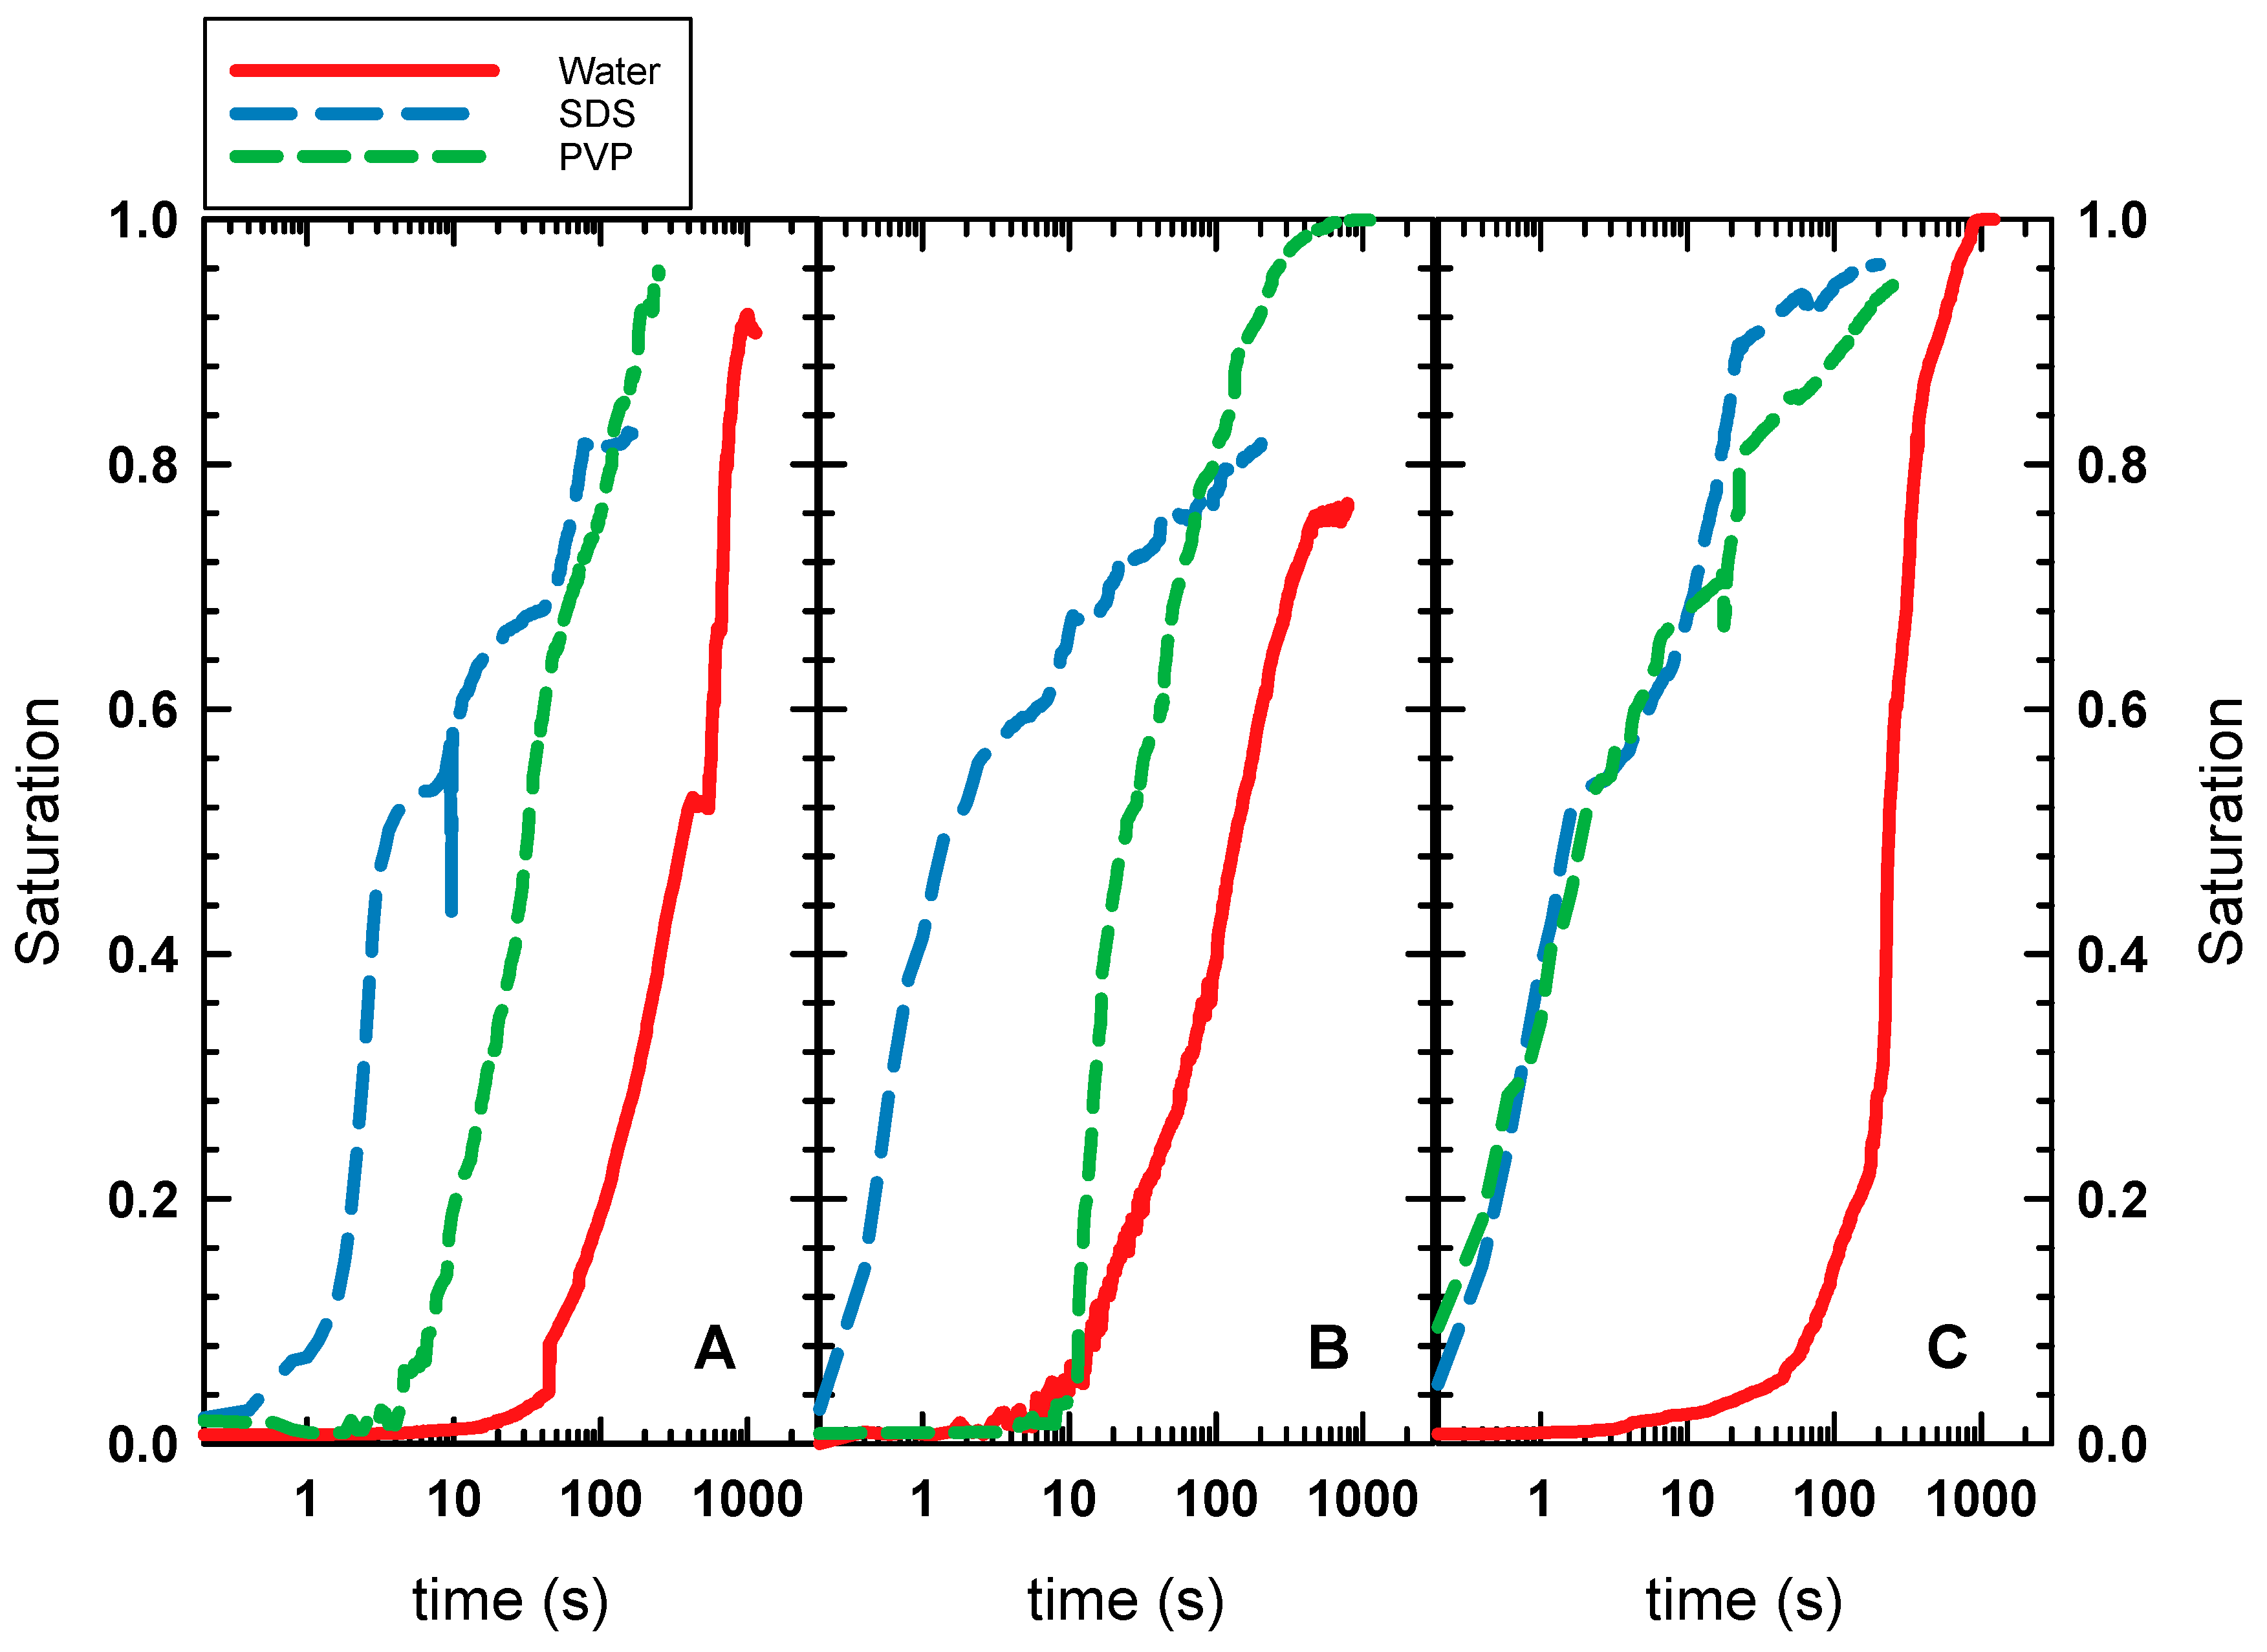
Figure 4 shows the results of our waterflooding experiments, for both the presence and absence of surfactant or polymer. Three separate packed beds of different porosities (0.063, 0.113, and 0.143) were prepared for each fluid type, and Figure 4A shows the results for a media with porosity 0.063. The water-bearing SDS initially invaded the packed bed faster than either the water-bearing PVP or water alone could do. In order to explain these results, we measured contact angle and surface tension for the three water phases examined in this work (Table 1). The measured contact angle for water in the microchannel was similar to contact angle values reported for plasma-treated PDMS surfaces [56,57,58]. We combined these values with the published value of silicone oil surface tension and Young’s equation [59],
to find the average value of the water–oil surface tension. This calculation, based on our measured values, indicated that SDS reduced the water–oil surface tension to a more significant degree than PVP or water alone, which explains why this solution invaded at a faster rate than the other solutions (Figure 4A).
The experiment shown in Figure 4B was conducted for a packed bed with porosity 0.113. As in Figure 4A, the water-bearing PVP solution achieved a higher saturation than SDS or water alone, and invasion by both surfactant solutions occurred faster than for water alone at this porosity. Water-bearing PVP solution achieved a higher saturation because polymer flooding can change surface wettability to be more water-wet, which will increase the oil recovery [60]. Both the PVP and SDS solutions invaded at comparable rates at the highest porosity, with SDS saturating the porous bed to a slightly greater extent than the PVP solution.
4.2. Fractal Dimension
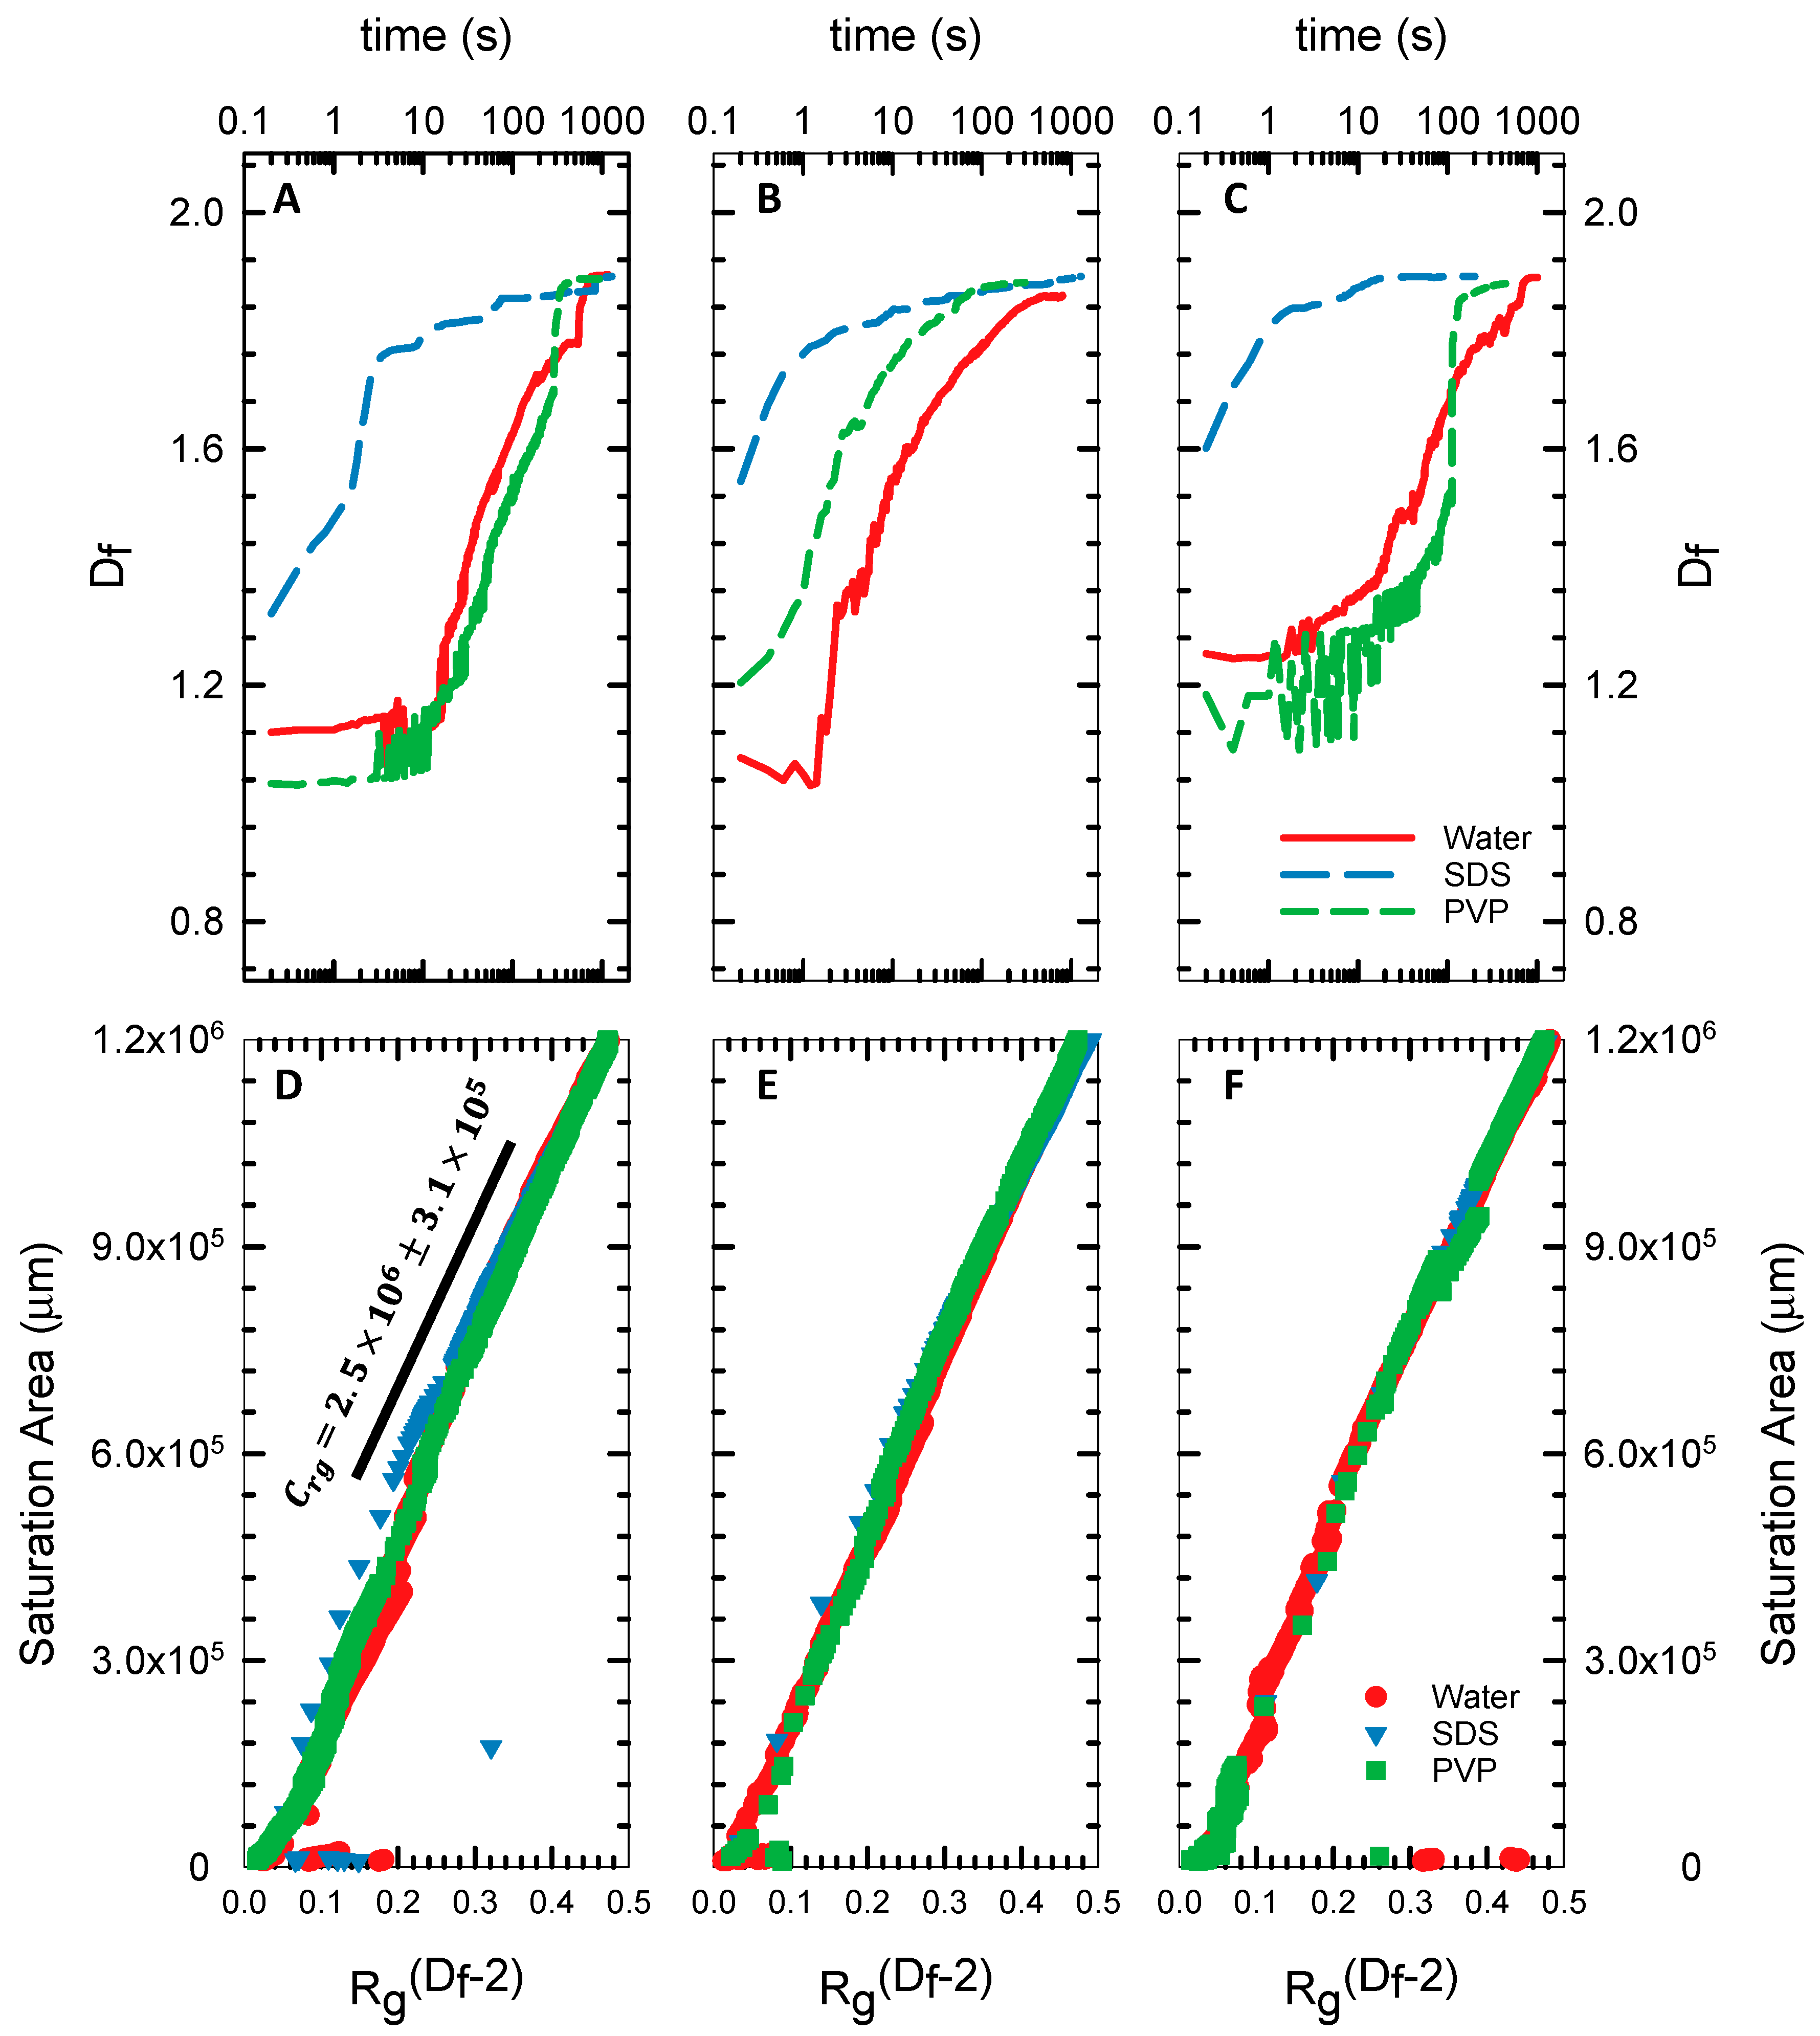
We used image analysis to evaluate the fractal dimension of the area occupied by the fluorescent dye in our microfluidic device to better understand the oil displacement kinetics. A MATLAB code was adapted to evaluate the fractal dimension using the Hausdorff technique [61], where a series of boxes were drawn within the region containing the dye. The bright pixels within each box were counted and compared to the total number of boxes drawn by the code. The values obtained by this analysis provide a measure of the fractal dimension for the area occupied by the water. The results of the image analysis (Figure 5A–C) show that water and the PVP solution began with a fractal dimension of Df ~ 1.2 or less, representing structures classified as stringy [62]. At the lowest (0.063, Figure 5A) and highest (0.143, Figure 5C) porosity levels, it took about 100 s for the water to occupy an area that morphologically resembled a fractal (Df ~ 1.6).
The only exception to this transition in morphology was the channel with porosity 0.11 (Figure 5C), for which the evolution took place over a period of time approximately half that of the other data sets. The SDS solution also exhibited different morphological behavior than the other solutions, achieving a fractal morphology on a short timescale (~1 s or less), indicating that these solutions invaded oil-saturated pore spaces at a far higher rate than the other solutions. All solutions achieved a final fractal dimension of Df ~ 1.89, indicating that fluid had percolated [63] through the packed bed in the microchannel.
The fractal dimension is connected to the area saturated by the invading fluid through its radius of gyration [64]. The radius of gyration represents a measure of the extent to which the invading fluid has displaced the oil in the porous medium, and is defined as [65]
where
where Aw is the measured area occupied by the invading water phase, N is the number of pixels making up the pattern as recorded by the CMOS camera, and xi and yi are the coordinates of each pixel in the observed pattern. We found that the relationship between area and radius of gyration was well described by , where Df is a function of time, as shown in Figure 5A–C. The relationship between area, radius of gyration, and fractal dimension proposed here is similar to previously proposed models for diffusion-limited viscous fingering in porous media [66]. By comparing data from all nine porosities examined in this work, we found that the data collapsed to a single curve when Crg = 2.5 × 10⁶ ± 3.1 × 10⁵, where Aw and Rg are in units of microns (see Figure 5D–F).
While the fractal dimension can help us identify morphological differences in the way an invading fluid phase spreads, we would also like to observe differences in rate of invasion (). Numerical calculation of the rate of invasion from image analysis data is challenging because noise in the data can create artifacts that suggest unrealistically large fluctuations in invasion rate. To minimize the effect of such artifacts, we chose to fit the area data to a model, , that is consistent with expected behavior of oil recovered through water injection into porous reservoirs [67]. The parameter, Aw,max, is the maximum area occupied by the water during the experiment, and tc is the time constant of the experiment.
Table 2 summarizes the results of fitting an exponential rise to a maximum for our area data as a function of time. The average value of the area parameter was Aw,max = 1.208 × 10⁶ ± 7.5 × 104 µm2, with the small standard deviation indicating that there was no significant difference between samples based on maximum area occupied by the invading water phase. We did find that there were significant differences in time constants for the samples we examined, with the water samples exhibiting more than a four-fold increase in time constant with increasing porosity. The time constants for SDS and PVP-bearing solutions exhibited an opposite trend (i.e., a decrease in time constant with increasing porosity). This suggests that the polymer and surfactant solutions made it easier to fill larger void volumes when compared to water alone.
The packed glass beads that formed our porous media micromodel formed a 3D network. However, our optical video microscopy measurements were obtained as 2D representations of the flow through the porous media micromodel. This could serve as a source of error in our experiments, although 2D optical video microscopy measurements of 3D fluid flow phenomena have been in good agreement with theoretical predictions based on mass conservation [68]. Finite element 3D modeling of microfluidic channels has shown that the error, assuming 2D flow behavior, is approximately 5% [69]. The error is low because most of the transport occurs in two dimensions, with the top and bottom walls acting to confine fluid flow. In future work, we will further quantify this error using velocity and diffusion data gathered from tracers dispersed within the micromodel and compare the predicted flow field to finite element models.
4.3. IMPES
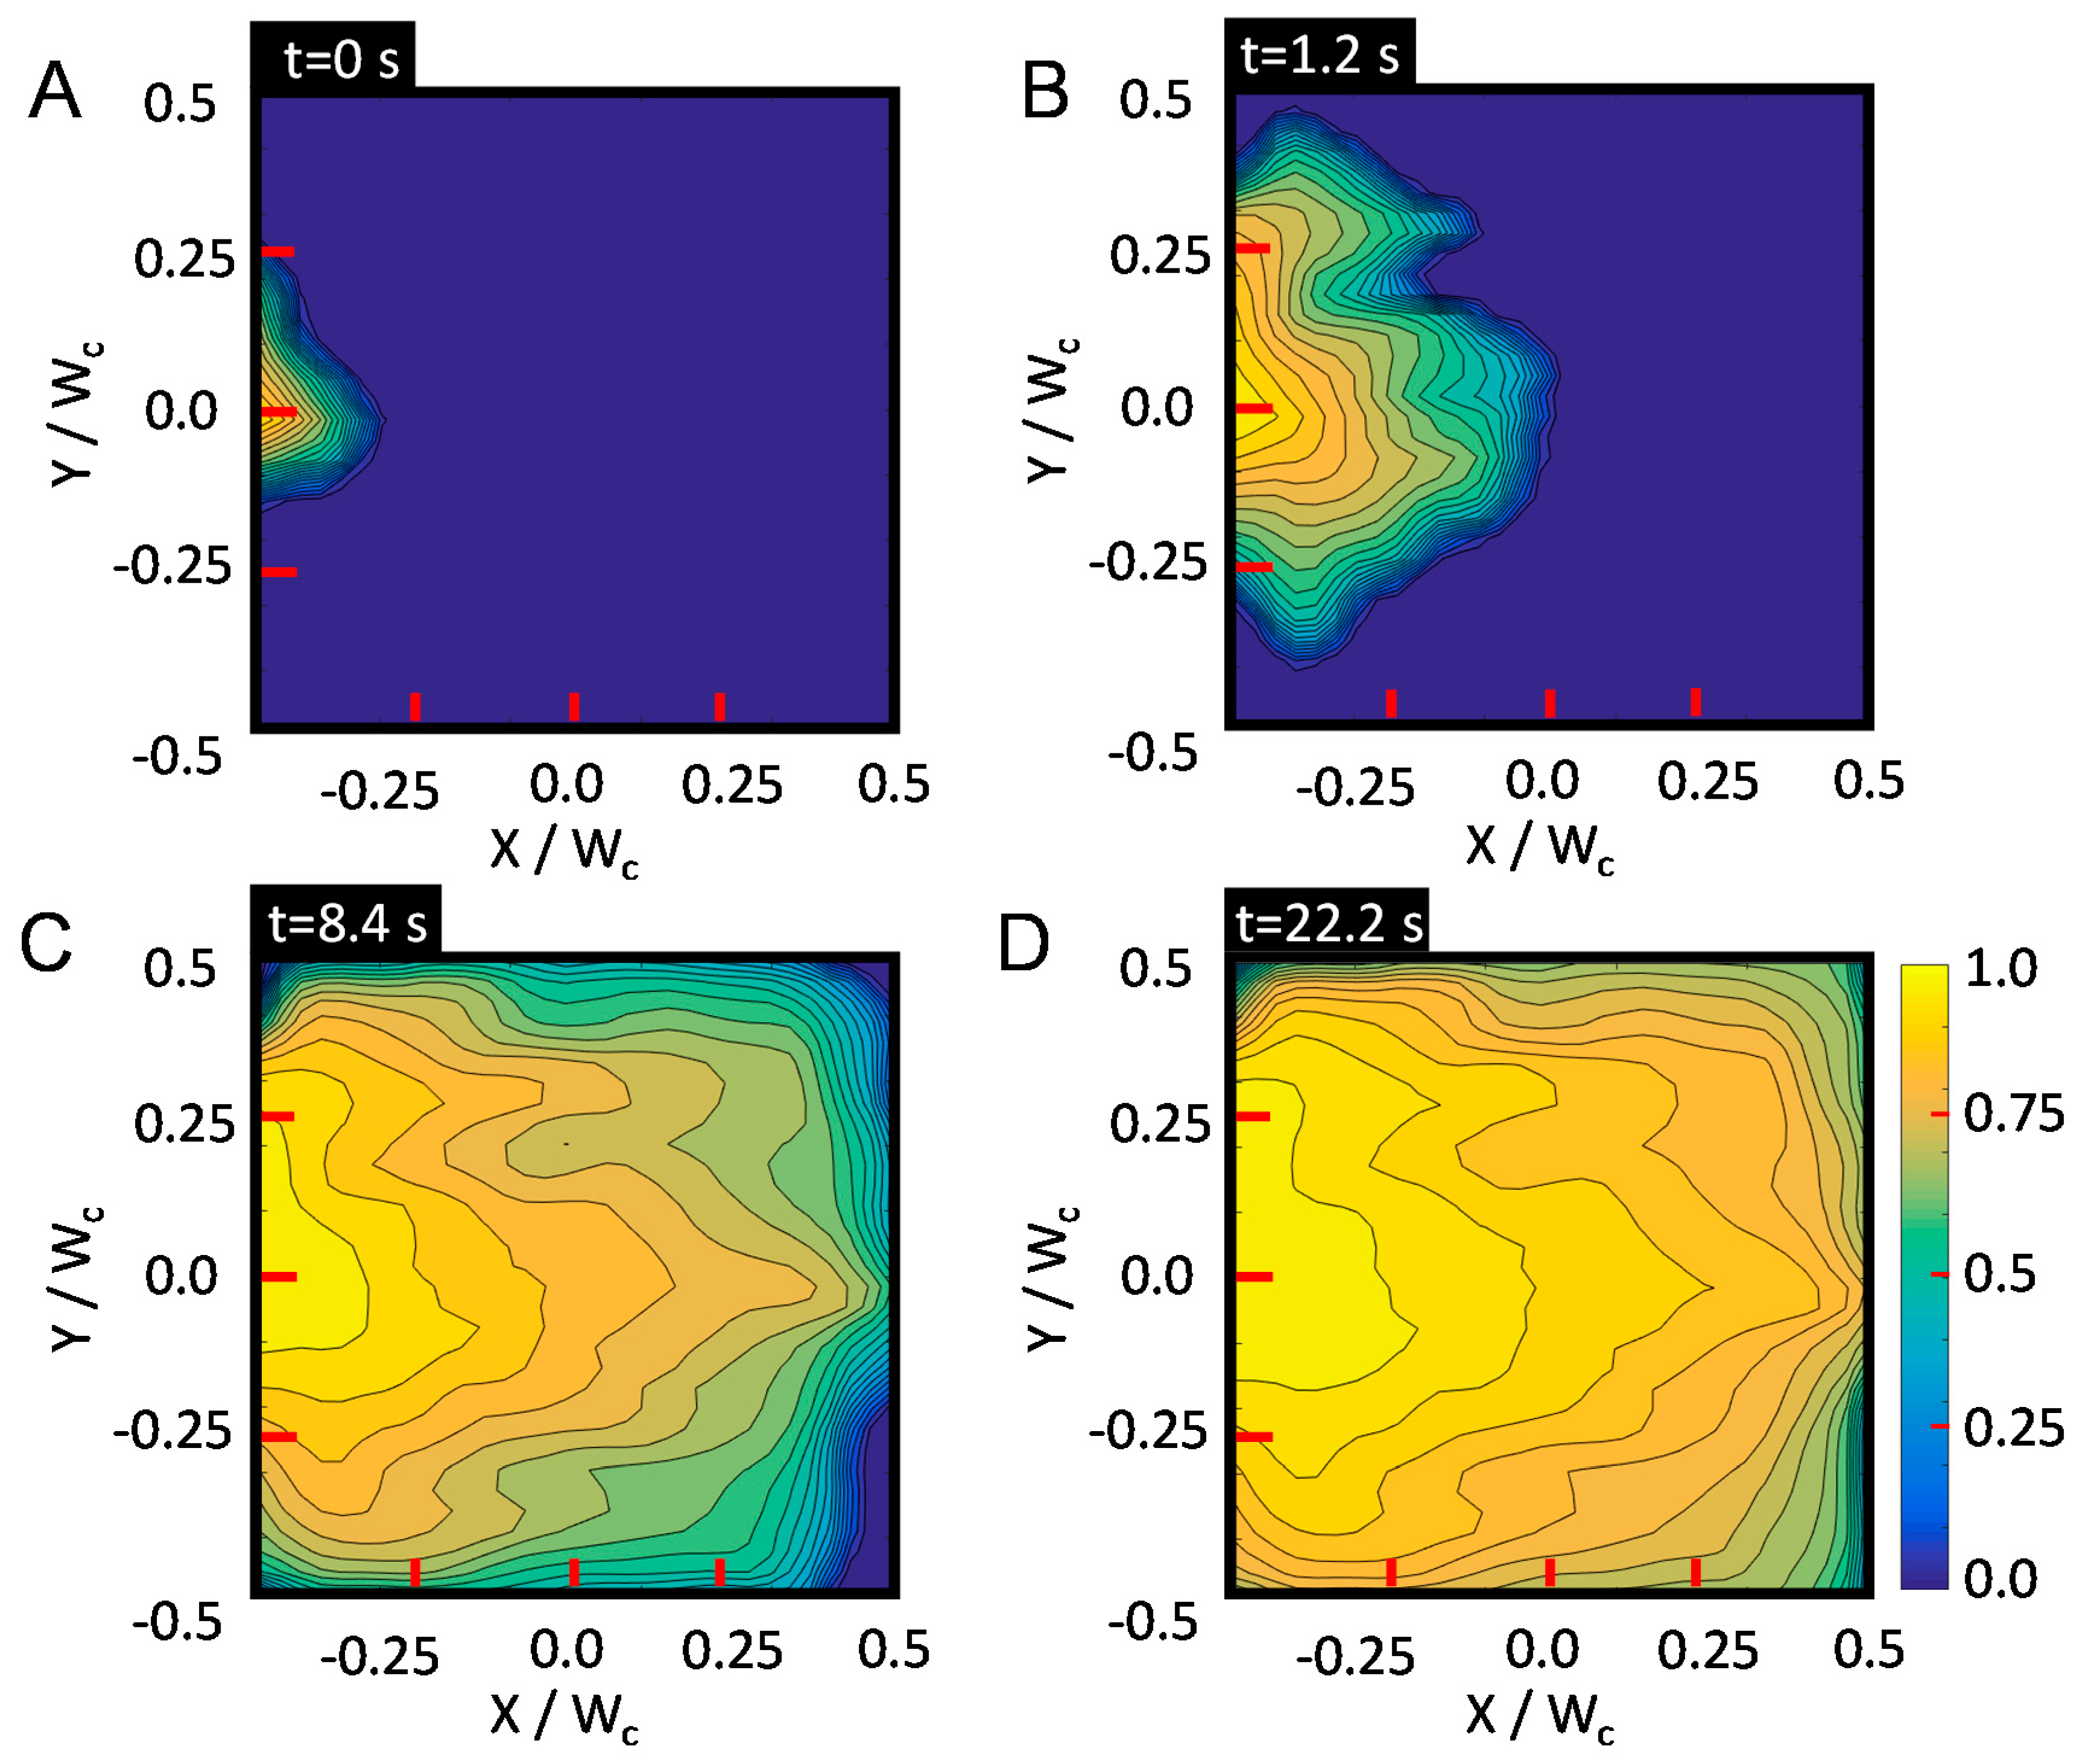
We implemented an inverse IMPES simulation to be compared to our experimental results. Figure 6 shows a sample simulation result for 0.1% SDS, matching the conditions observed in Figure 3. The key differences between the results of our simulations and the experiment is that the simulation results show the invasion initially occurring at a slightly slower rate that in the actual experiment (Figure 6A,B), and near the midpoint of the simulation (Figure 6C), the invading phase broke through and occupied a wider region than that at the comparable experimental time (Figure 3C). We attribute these differences to the fact that our IMPES simulation models do not count interfacial tension and porous structure effects. To mimic the structure of the randomly packed spheres, we modeled the permeability using values drawn from a log-normal distribution [52], although the procedure was designed to model porous rock rather than a packed bed of spheres.
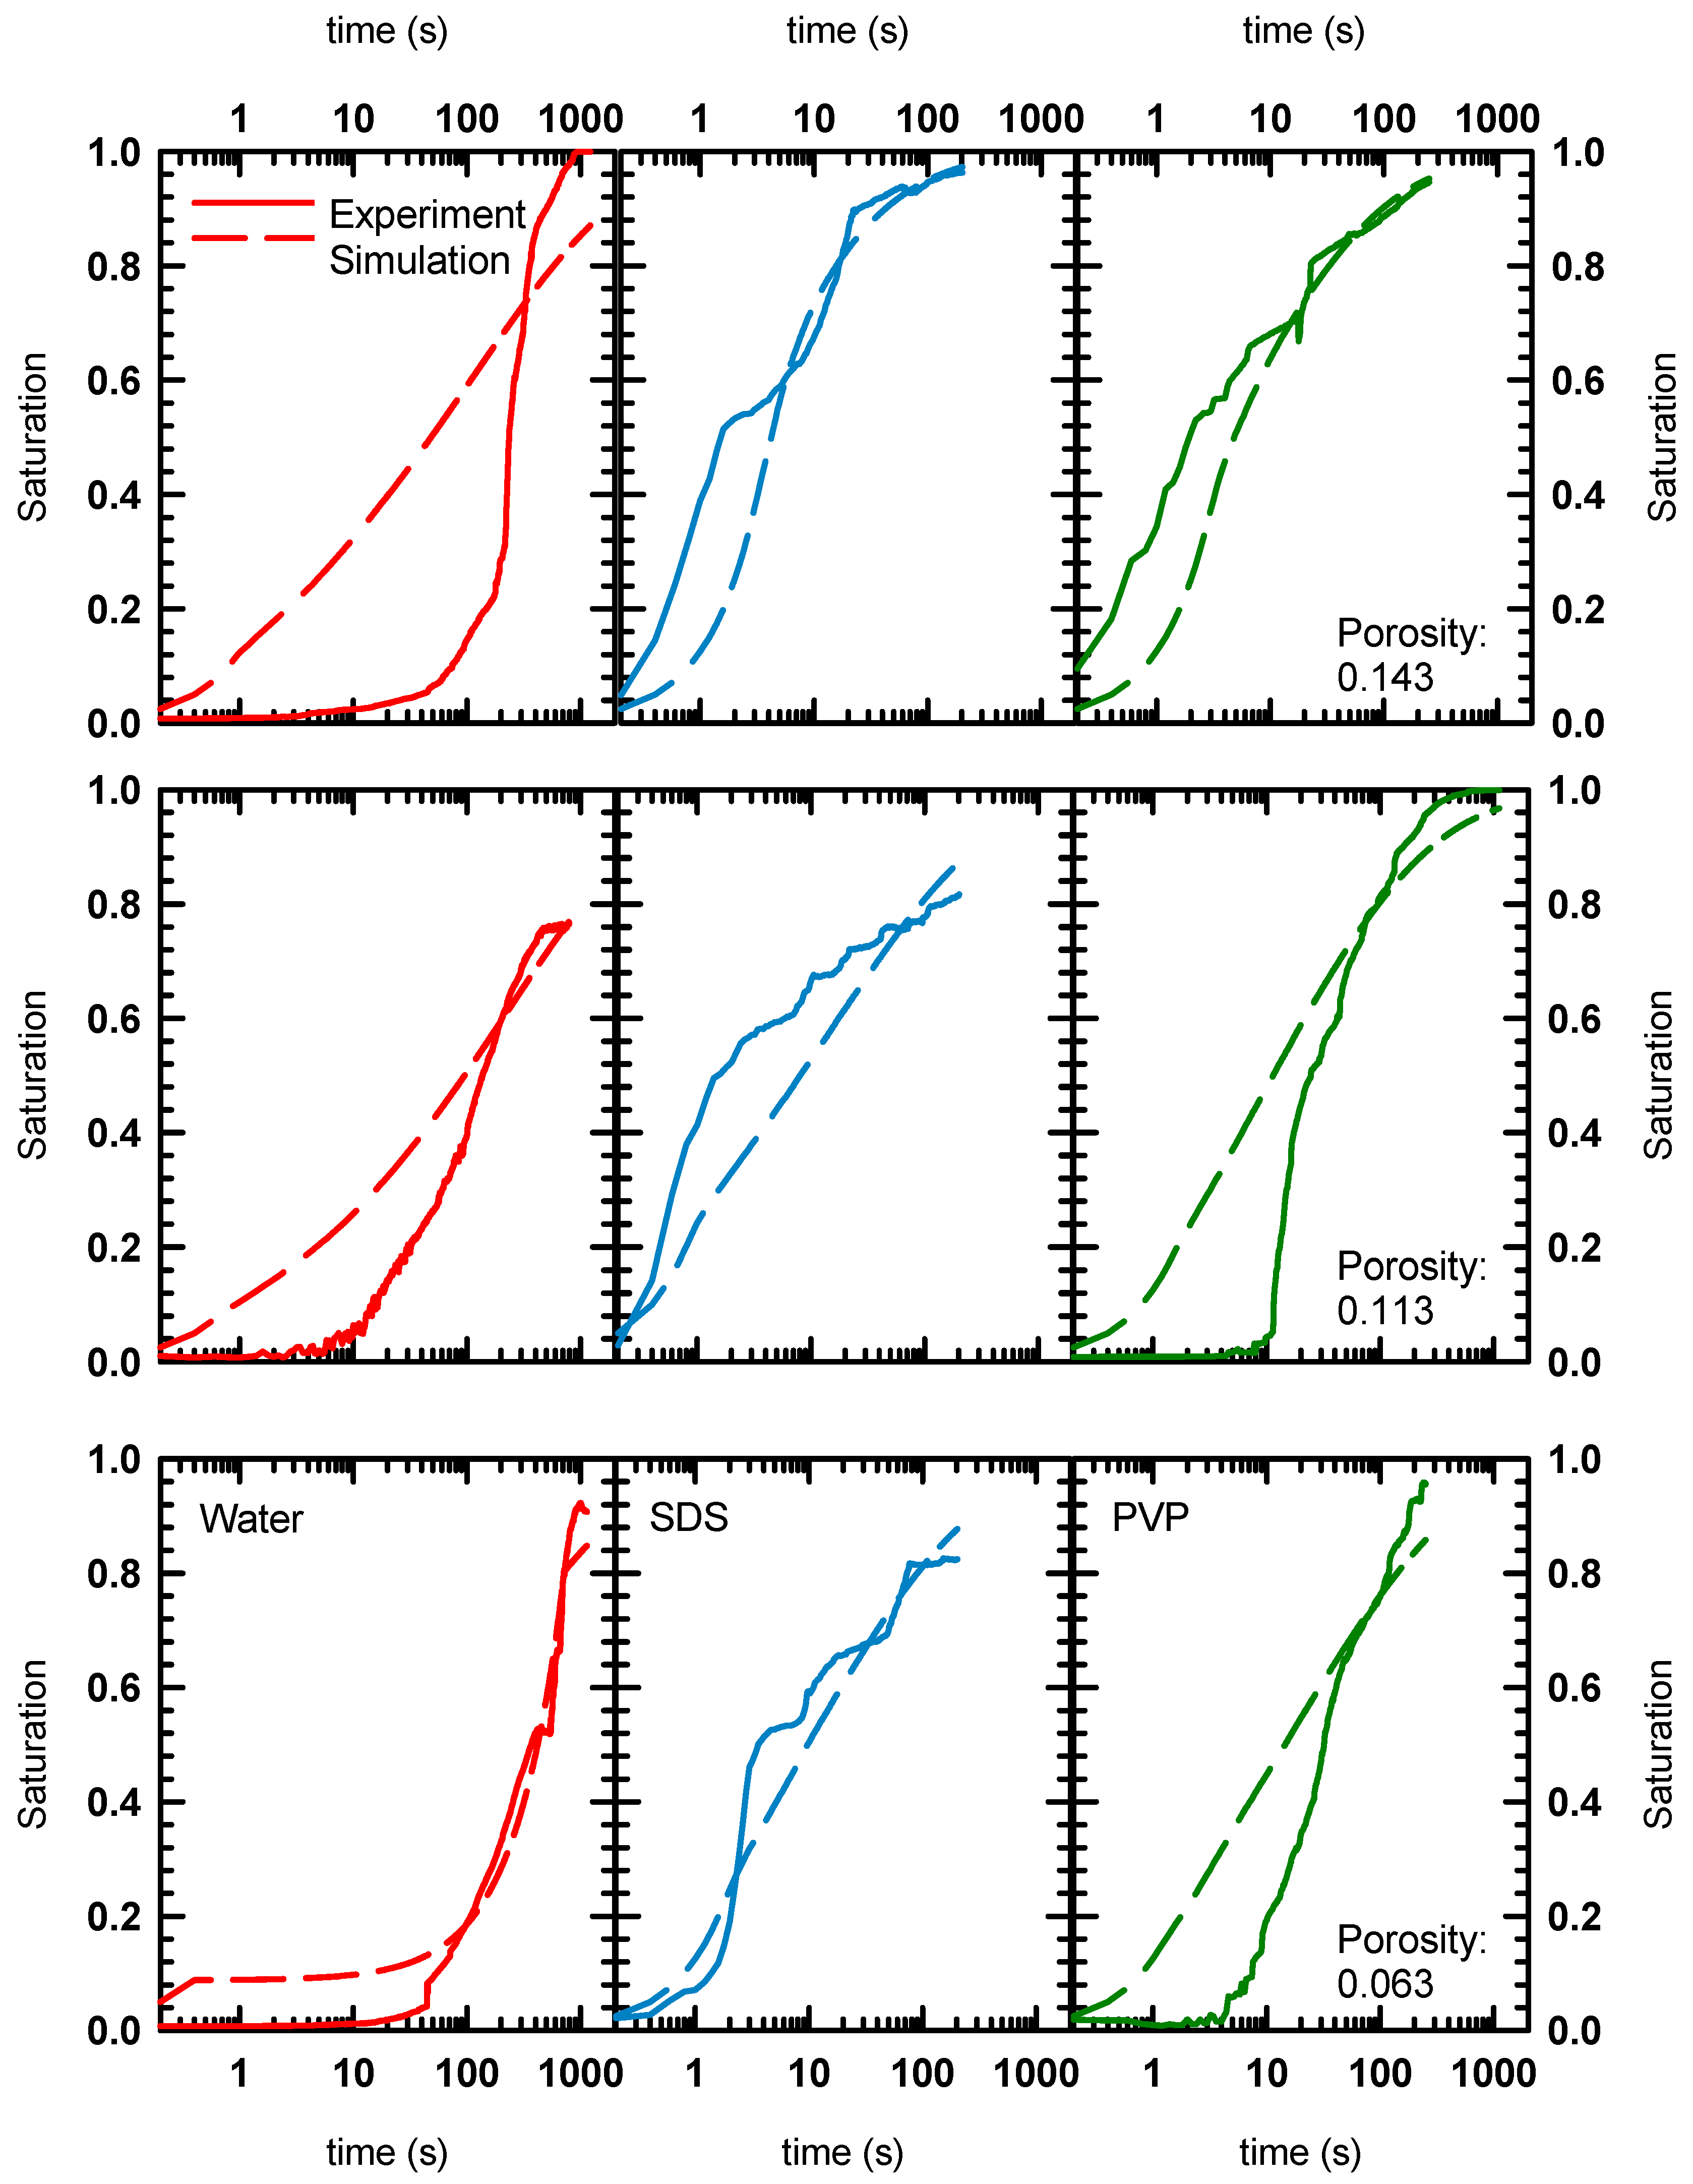
Despite these differences, the average saturation curves obtained by simulation closely matched our experimental curves (Figure 7), with high coefficients of determination for most of these curves (Table 3). The mobility ratios that best fit the data exhibited decreases with increasing porosity both for water and 0.1% PVP, indicating that these phases moved through the porous packed bed more easily at higher porosities. The mobility ratios for 0.1% SDS deviated from this trend. At a porosity of 0.113, the 0.1% SDS appeared to have a mobility of 33.3. While the coefficient of determination was low for this this case, the simulation did capture the general saturation trend as a function of time. Overall, our simulations did show that the addition of SDS or PVP improved the mobility of the water phase as it invaded an oil-saturated medium, and except for the 0.113 case, SDS exhibited lower mobility ratios than PVP for the experiments conducted here.
5. Conclusions
We developed a microfluidic platform by which the waterflooding of an oil-saturated porous structure was investigated through optical fluorescence microscopy. Where the characterization of bulk porous media is rate limited [13,14], our microfluidic platform was able to characterize the invasion of a water phase into an oil-saturated medium within a relatively short amount of time. The flexibility of this platform allows us to rapidly analyze chemical modification techniques that are commonly used in the petroleum industry [47,48] to enhance the recovery of oil. Observations of our device using optical fluorescence microscopy enable us to track the invasion of a water phase into an oil-saturated phase and evaluate parameters such as saturation [70,71,72], fractal morphology [62,64,73], temporal evolution of flow patterns [74,75], and invasion rate [76,77] that are important for evaluating the effectiveness of different types of surfactants used for waterflooding. A simulation based on the IMPES approach [51,52,54] for modeling two-phase flow in porous media was implemented in MATLAB [52] to perform an inverse analysis of our experimental data to estimate the mobility of the invading phase. The results of our inverse analysis demonstrate a significant decrease in mobility for water bearing a polymer or surfactant.
The analysis performed in this article will form the basis of future work aimed at characterizing the effect surface tension and pore structure have in our microfluidic platform. Our IMPES model will be adjusted by using closure expressions [78] for saturation curves that incorporate surface tension as it influences capillary pressure. We also aim to control the pore structure of our system through photolithography techniques [16,26] and perform microparticle image velocimetry measurements [29] to map streamline profiles that can be compared to expected flow distributions as calculated by finite element analysis [79]. The approach we have used here can be used to evaluate other enhanced oil recovery systems, including other types of polymers or surfactants [80], nanoparticles [81,82], and foams [83,84]. Our platform can also be applied to other porous media situations that involve diffusion and transport in biomedical systems [40,85], carbon sequestration [86,87], and the additive manufacturing of complex fluid networks [41,88,89].
Supplementary Materials
Supplementary materials are available online at https://www.mdpi.com/2504-5377/2/2/23/s1.
Author Contributions
H.-L.Y. fabricated devices, conducted the experiments, analyzed data, and performed simulations. J.J.J. designed the experiments and wrote image analysis algorithms to evaluate data. Both H.-L.Y. and J.J.J wrote the manuscript.
Funding
We acknowledge the Department of Mechanical Engineering at Iowa State University for funding this research.
Acknowledgments
J.J.J. acknowledges financial support from the Iowa State University Department of Mechanical Engineering. H.-L.Y. and J.J.J. thank Min Lin and the Keck Microfabrication Facility at Iowa State University for providing photolithography support for this project. We also thank Ashton Archer and Ted Heindel for providing us access to a sieve machine for separating our glass microparticles based on size.
Conflicts of Interest
The authors declare no conflicts of interest.
References
- Karadimitriou, N.K.; Hassanizadeh, S.M. A review of micromodels and their use in two-phase flow studies. Vadose Zone J. 2012, 11. [Google Scholar] [CrossRef]
- Muggeridge, A.; Cockin, A.; Webb, K.; Frampton, H.; Collins, I.; Moulds, T.; Salino, P. Recovery rates, enhanced oil recovery and technological limits. Philos. Trans. R. Soc. A 2014, 372, 20120320. [Google Scholar] [CrossRef] [PubMed]
- Blunt, M.; Fayers, F.J.; Orr, F.M. Carbon dioxide in enhanced oil recovery. Energy Convers. Manag. 1993, 34, 1197–1204. [Google Scholar] [CrossRef]
- Levitt, D.; Jackson, A.; Heinson, C.; Britton, L.N.; Malik, T.; Dwarakanath, V.; Pope, G.A. Identification and evaluation of high-performance EOR surfactants. SPE Reserv. Eval. Eng. 2009, 12, 243–253. [Google Scholar] [CrossRef]
- Raffa, P.; Broekhuis, A.A.; Picchioni, F. Polymeric surfactants for enhanced oil recovery: A review. J. Pet. Sci. Eng. 2016, 145, 723–733. [Google Scholar] [CrossRef]
- Sagi, A.R. Surfactant Enhanced Oil Recovery. Ph.D. Thesis, Rice University, Houston, TX, USA, 2015. [Google Scholar]
- Hirasaki, G.; Miller, C.A.; Puerto, M. Recent advances in surfactant EOR. SPE J. 2011, 16. [Google Scholar] [CrossRef]
- Wei, B.; Romero-Zerón, L.; Rodrigue, D. Oil displacement mechanisms of viscoelastic polymers in enhanced oil recovery (EOR): A review. J. Pet. Explor. Prod. Technol. 2014, 4, 113–121. [Google Scholar] [CrossRef]
- Sheng, J.J.; Leonhardt, B.; Azri, N. Status of polymer-flooding technology. J. Can. Pet. Technol. 2015, 54, 116–126. [Google Scholar] [CrossRef]
- Ezell, R.G.; McCormick, C.L. Electrolyte- and pH-responsive polyampholytes with potential as viscosity-control agents in enhanced petroleum recovery. J. Appl. Polym. Sci. 2007, 104, 2812–2821. [Google Scholar] [CrossRef]
- Rashidi, M.; Blokhus, A.M.; Skauge, A. Viscosity study of salt tolerant polymers. J. Appl. Polym. Sci. 2010, 117, 1551–1557. [Google Scholar] [CrossRef]
- Elraies, K.A.; Tan, I.M.; Fathaddin, M.T.; Abo-Jabal, A. Development of a new polymeric surfactant for chemical enhanced oil recovery. Pet. Sci. Technol. 2011, 29, 1521–1528. [Google Scholar] [CrossRef]
- Morrow, N.R.; Mason, G. Recovery of oil by spontaneous imbibition. Curr. Opin. Colloid Interface Sci. 2001, 6, 321–337. [Google Scholar] [CrossRef]
- Standnes, D.C.; Austad, T. Wettability alteration in chalk: 2. Mechanism for wettability alteration from oil-wet to water-wet using surfactants. J. Pet. Sci. Eng. 2000, 28, 123–143. [Google Scholar] [CrossRef]
- Blunt, M.; King, M.J.; Scher, H. Simulation and theory of two-phase flow in porous media. Phys. Rev. A 1992, 46, 7680–7699. [Google Scholar] [CrossRef] [PubMed]
- Berejnov, V.; Djilali, N.; Sinton, D. Lab-on-chip methodologies for the study of transport in porous media: Energy applications. Lab Chip 2008, 8, 689–693. [Google Scholar] [CrossRef] [PubMed]
- Chatenever, A.; Calhoun, J.C. Visual examinations of fluid behavior in porous media—Part I. J. Pet. Technol. 1952, 4, 149–156. [Google Scholar] [CrossRef]
- Krummel, A.T.; Datta, S.S.; Münster, S.; Weitz, D.A. Visualizing multiphase flow and trapped fluid configurations in a model three-dimensional porous medium. AIChE J. 2013, 59, 1022–1029. [Google Scholar] [CrossRef] [Green Version]
- Anbari, A.; Chien, H.-T.; Datta, S.S.; Deng, W.; Weitz, D.A.; Fan, J. Microfluidic model porous media: Fabrication and applications. Small 2018, 14, 1703575. [Google Scholar] [CrossRef] [PubMed]
- Lenormand, R.; Touboul, E.; Zarcone, C. Numerical models and experiments on immiscible displacements in porous media. J. Fluid Mech. 1988, 189, 165–187. [Google Scholar] [CrossRef]
- Ferer, M.; Ji, C.; Bromhal, G.S.; Cook, J.; Ahmadi, G.; Smith, D.H. Crossover from capillary fingering to viscous fingering for immiscible unstable flow: Experiment and modeling. Phys. Rev. E 2004, 70. [Google Scholar] [CrossRef] [PubMed]
- Cottin, C.; Bodiguel, H.; Colin, A. Drainage in two-dimensional porous media: From capillary fingering to viscous flow. Phys. Rev. E 2010, 82. [Google Scholar] [CrossRef] [PubMed]
- Lenormand, R.; Zarcone, C.; Sarr, A. Mechanisms of the displacement of one fluid by another in a network of capillary ducts. J. Fluid Mech. 1983, 135, 337–353. [Google Scholar] [CrossRef]
- Chang, L.-C.; Tsai, J.-P.; Shan, H.-Y.; Chen, H.-H. Experimental study on imbibition displacement mechanisms of two-phase fluid using micro model. Environ. Earth Sci. 2009, 59, 901. [Google Scholar] [CrossRef]
- Theodoropoulou, M.A.; Sygouni, V.; Karoutsos, V.; Tsakiroglou, C.D. Relative permeability and capillary pressure functions of porous media as related to the displacement growth pattern. Int. J. Multiph. Flow 2005, 31, 1155–1180. [Google Scholar] [CrossRef]
- Wu, M.; Xiao, F.; Johnson-Paben, R.M.; Retterer, S.T.; Yin, X.; Neeves, K.B. Single- and two-phase flow in microfluidic porous media analogs based on Voronoi tessellation. Lab Chip 2011, 12, 253–261. [Google Scholar] [CrossRef] [PubMed]
- Xiao, F.; Yin, X. Geometry models of porous media based on Voronoi tessellations and their porosity–permeability relations. Comput. Math. Appl. 2016, 72, 328–348. [Google Scholar] [CrossRef]
- Heshmati, M.; Piri, M. Interfacial boundary conditions and residual trapping: A pore-scale investigation of the effects of wetting phase flow rate and viscosity using micro-particle image velocimetry. Fuel 2018, 224, 560–578. [Google Scholar] [CrossRef]
- Roman, S.; Soulaine, C.; AlSaud, M.A.; Kovscek, A.; Tchelepi, H. Particle velocimetry analysis of immiscible two-phase flow in micromodels. Adv. Water Resour. 2016, 95, 199–211. [Google Scholar] [CrossRef]
- Bera, B.; Mitra, S.K.; Vick, D. Understanding the micro structure of Berea Sandstone by the simultaneous use of micro-computed tomography (micro-CT) and focused ion beam-scanning electron microscopy (FIB-SEM). Micron 2011, 42, 412–418. [Google Scholar] [CrossRef] [PubMed]
- Bakke, S.; Øren, P.-E. 3-D Pore-scale modelling of sandstones and flow simulations in the pore networks. SPE J. 1997, 2, 136–149. [Google Scholar] [CrossRef]
- Blunt, M.J. Flow in porous media pore-network models and multiphase flow. Interface Sci. 2001, 6, 197–207. [Google Scholar] [CrossRef]
- Gunda, N.S.K.; Bera, B.; Karadimitriou, N.K.; Mitra, S.K.; Hassanizadeh, S.M. Reservoir-on-a-Chip (ROC): A new paradigm in reservoir engineering. Lab Chip 2011, 11, 3785–3792. [Google Scholar] [CrossRef] [PubMed]
- Xu, K.; Liang, T.; Zhu, P.; Qi, P.; Lu, J.; Huh, C.; Balhoff, M. A 2.5-D glass micromodel for investigation of multi-phase flow in porous media. Lab Chip 2017, 17, 640–646. [Google Scholar] [CrossRef] [PubMed]
- Marchand, S.; Bondino, I.; Ktari, A.; Santanach-Carreras, E. Consideration on data dispersion for two-phase flow micromodel experiments. Transp. Porous Media 2017, 117, 169–187. [Google Scholar] [CrossRef]
- Kim, M.; Sell, A.; Sinton, D. Aquifer-on-a-Chip: Understanding pore-scale salt precipitation dynamics during CO2 sequestration. Lab Chip 2013, 13, 2508–2518. [Google Scholar] [CrossRef] [PubMed]
- Song, W.; de Haas, T.W.; Fadaei, H.; Sinton, D. Chip-off-the-old-rock: The study of reservoir-relevant geological processes with real-rock micromodels. Lab Chip 2014, 14, 4382–4390. [Google Scholar] [CrossRef] [PubMed]
- Kersting, A.B.; Efurd, D.W.; Finnegan, D.L.; Rokop, D.J.; Smith, D.K.; Thompson, J.L. Migration of plutonium in ground water at the Nevada Test Site. Nature 1999, 397, 56–59. [Google Scholar] [CrossRef]
- Jensen, K.H.; Valente, A.X.C.N.; Stone, H.A. Flow rate through microfilters: Influence of the pore size distribution, hydrodynamic interactions, wall slip, and inertia. Phys. Fluids 2014, 26, 052004. [Google Scholar] [CrossRef]
- Miller, J.S.; Stevens, K.R.; Yang, M.T.; Baker, B.M.; Nguyen, D.-H.T.; Cohen, D.M.; Toro, E.; Chen, A.A.; Galie, P.A.; Yu, X.; et al. Rapid casting of patterned vascular networks for perfusable engineered three-dimensional tissues. Nat. Mater. 2012, 11, 768–774. [Google Scholar] [CrossRef] [PubMed]
- Marschewski, J.; Brenner, L.; Ebejer, N.; Ruch, P.; Michel, B.; Poulikakos, D. 3D-printed fluidic networks for high-power-density heat-managing miniaturized redox flow batteries. Energy Environ. Sci. 2017, 10, 780–787. [Google Scholar] [CrossRef]
- Rabbani, A.; Jamshidi, S.; Salehi, S. Determination of specific surface of rock grains by 2D imaging. J. Geol. Res. 2014, 2014, 1–7. [Google Scholar] [CrossRef]
- Rabbani, A.; Jamshidi, S. Specific surface and porosity relationship for sandstones for prediction of permeability. Int. J. Rock Mech. Min. Sci. 2014, 71, 25–32. [Google Scholar] [CrossRef]
- Van der Marck, S.C. Network approach to void percolation in a pack of unequal spheres. Phys. Rev. Lett. 1996, 77, 1785–1788. [Google Scholar] [CrossRef] [PubMed]
- Kumar, M.; Hoang, V.T.; Satik, C.; Rojas, D.H. High-mobility-ratio waterflood performance prediction: Challenges and new insights. SPE Reserv. Eval. Eng. 2008, 11, 186–196. [Google Scholar] [CrossRef]
- Matlab Central Measuring Angle of Intersection—MATLAB & Simulink Example. Available online: https://www.mathworks.com/help/images/examples/measuring-angle-of-intersection.html (accessed on 6 April 2018).
- Stahl, G.A.; Schulz, D.N. Water-Soluble Polymers for Petroleum Recovery; Springer: New York, NY, USA, 1988; ISBN 978-0-306-42915-6. [Google Scholar]
- Taylor, K.C.; Nasr-El-Din, H.A. Water-soluble hydrophobically associating polymers for improved oil recovery: A literature review. J. Pet. Sci. Eng. 1998, 19, 265–280. [Google Scholar] [CrossRef]
- Chari, K.; Antalek, B.; Lin, M.Y.; Sinha, S.K. The viscosity of polymer–surfactant mixtures in water. J. Chem. Phys. 1994, 100, 5294–5300. [Google Scholar] [CrossRef]
- Sadeghi, R.; Azizpour, S. Volumetric, compressibility, and viscometric measurements of binary mixtures of Poly(vinylpyrrolidone) + Water, + Methanol, + Ethanol, + Acetonitrile, + 1-Propanol, + 2-Propanol, and + 1-Butanol. J. Chem. Eng. Data 2011, 56, 240–250. [Google Scholar] [CrossRef]
- Kou, J.; Sun, S. On iterative IMPES formulation for two phase flow with capillarity in heterogeneous porous media. Int. J. Numer. Anal. Model. Ser. B 2010, 1, 20–40. [Google Scholar]
- Aarnes, J.E.; Gimse, T.; Lie, K.-A. An introduction to the numerics of flow in porous media using matlab. In Geometric Modelling, Numerical Simulation, and Optimization; Applied Mathematics at SINTEF; Springer: Berlin/Heidelberg, Germany, 2007. [Google Scholar]
- Li, B.; Chen, Z.; Huan, G. Comparison of solution schemes for black oil reservoir simulations with unstructured grids. Comput. Methods Appl. Mech. Eng. 2004, 193, 319–355. [Google Scholar] [CrossRef]
- Chen, Z.; Huan, G.; Li, B. An improved IMPES method for two-phase flow in porous media. Transp. Porous Media 2004, 54, 361–376. [Google Scholar] [CrossRef]
- Habermann, B. The efficiency of miscible displacement as a function of mobility ratio. Trans. Am. Inst. Min. Metall. Eng. 1960, 219, 264–272. [Google Scholar]
- Fritz, J.L.; Owen, M.J. Hydrophobic recovery of plasma-treated polydimethylsiloxane. J. Adhes. 1995, 54, 33–45. [Google Scholar] [CrossRef]
- Bhattacharya, S.; Datta, A.; Berg, J.M.; Gangopadhyay, S. Studies on surface wettability of poly(dimethyl) siloxane (PDMS) and glass under oxygen-plasma treatment and correlation with bond strength. J. Microelectromech. Syst. 2005, 14, 590–597. [Google Scholar] [CrossRef]
- Bodas, D.; Khan-Malek, C. Formation of more stable hydrophilic surfaces of PDMS by plasma and chemical treatments. Microelectron. Eng. 2006, 83, 1277–1279. [Google Scholar] [CrossRef]
- Bertrand, E.; Blake, T.D.; De Coninck, J. Dynamics of dewetting. Colloids Surf. Physicochem. Eng. Asp. 2010, 369, 141–147. [Google Scholar] [CrossRef]
- Wang, D.; Cheng, J.; Yang, Q.; Wenchao, G.; Qun, L.; Chen, F. Viscous-elastic polymer can increase microscale displacement efficiency in cores. Soc. Pet. Eng. 2000. [Google Scholar] [CrossRef]
- Matlab Central Hausdorff (Box-Counting) Fractal Dimension—File Exchange—MATLAB Central. Available online: http://www.mathworks.com/matlabcentral/fileexchange/30329-hausdorff--box-counting--fractal-dimension (accessed on 21 November 2017).
- Zhong-Can, O.Y.; Gang, Y.; Bai-Lin, H. From fractal to dendritic: Competition between diffusion and field. Phys. Rev. Lett. 1986, 57, 3203–3205. [Google Scholar] [CrossRef] [PubMed]
- Witten, T.A.; Sander, L.M. Diffusion-limited aggregation. Phys. Rev. B 1983, 27, 5686–5697. [Google Scholar] [CrossRef]
- Gharbi, R.B.C.; Qasem, F.; Peters, E.J. A relationship between the fractal dimension and scaling groups of unstable miscible displacements. Exp. Fluids 2001, 31, 357–366. [Google Scholar] [CrossRef]
- Pons, M.-N.; Weisser, E.M.; Vivier, H.; Boger, D.V. Characterization of viscous fingering in a radial Hele-Shaw cell by image analysis. Exp. Fluids 1999, 26, 153–160. [Google Scholar] [CrossRef]
- Maloy, K.J.; Boger, F.; Feder, J.; Jossang, T.; Meakin, P. Dynamics of viscous-fingering fractals in porous media. Phys. Rev. A 1987, 36, 318–324. [Google Scholar] [CrossRef]
- Aronofsky, J.S.; Masse, L.; Natanson, S.G. A model for the mechanism of oil recovery from the porous matrix due to water invasion in fractured reservoirs. Pet. Trans. 1958, 213, 17–19. [Google Scholar]
- Holden, M.A.; Kumar, S.; Castellana, E.T.; Beskok, A.; Cremer, P.S. Generating fixed concentration arrays in a microfluidic device. Sens. Actuators B Chem. 2003, 92, 199–207. [Google Scholar] [CrossRef]
- Kamholz, A.E.; Schilling, E.A.; Yager, P. Optical measurement of transverse molecular diffusion in a microchannel. Biophys. J. 2001, 80, 1967–1972. [Google Scholar] [CrossRef]
- Cheng, J.T.; Pyrak-Nolte, L.J.; Nolte, D.D.; Giordano, N.J. Linking pressure and saturation through interfacial areas in porous media. Geophys. Res. Lett. 2004, 31, L08502. [Google Scholar] [CrossRef]
- Parseval, Y.D.; Pillai, K.M.; Advani, S.G. A simple model for the variation of permeability due to partial saturation in dual scale porous media. Transp. Porous Media 1997, 27, 243–264. [Google Scholar] [CrossRef]
- Niemet, M.R.; Selker, J.S. A new method for quantification of liquid saturation in 2D translucent porous media systems using light transmission. Adv. Water Resour. 2001, 24, 651–666. [Google Scholar] [CrossRef]
- Cai, J.; Yu, B.; Zou, M.; Mei, M. Fractal analysis of invasion depth of extraneous fluids in porous media. Chem. Eng. Sci. 2010, 65, 5178–5186. [Google Scholar] [CrossRef]
- Zhu, T.; Waluga, C.; Wohlmuth, B.; Manhart, M. A study of the time constant in unsteady porous media flow using direct numerical simulation. Transp. Porous Media 2014, 104, 161–179. [Google Scholar] [CrossRef]
- Zheng, Z.; Guo, B.; Christov, I.C.; Celia, M.A.; Stone, H.A. Flow regimes for fluid injection into a confined porous medium. J. Fluid Mech. 2015, 767, 881–909. [Google Scholar] [CrossRef]
- Martys, N.; Cieplak, M.; Robbins, M.O. Critical phenomena in fluid invasion of porous media. Phys. Rev. Lett. 1991, 66, 1058–1061. [Google Scholar] [CrossRef] [PubMed]
- Geistlinger, H.; Ataei-Dadavi, I. Influence of the heterogeneous wettability on capillary trapping in glass-beads monolayers: Comparison between experiments and the invasion percolation theory. J. Colloid Interface Sci. 2015, 459, 230–240. [Google Scholar] [CrossRef] [PubMed]
- Parker, J.C.; Lenhard, R.J. A model for hysteretic constitutive relations governing multiphase flow: 1. Saturation-pressure relations. Water Resour. Res. 1987, 23, 2187–2196. [Google Scholar] [CrossRef]
- Narsilio, G.A.; Buzzi, O.; Fityus, S.; Yun, T.S.; Smith, D.W. Upscaling of Navier–Stokes equations in porous media: Theoretical, numerical and experimental approach. Comput. Geotech. 2009, 36, 1200–1206. [Google Scholar] [CrossRef]
- Wever, D.A.Z.; Picchioni, F.; Broekhuis, A.A. Polymers for enhanced oil recovery: A paradigm for structure–property relationship in aqueous solution. Prog. Polym. Sci. 2011, 36, 1558–1628. [Google Scholar] [CrossRef]
- Sedaghat, M.H.; Mohammadi, H.; Razmi, R. Application of SiO2 and TiO2 nano particles to enhance the efficiency of polymer-surfactant floods. Energy Sources Part Recovery Util. Environ. Eff. 2016, 38, 22–28. [Google Scholar] [CrossRef]
- Mohajeri, M.; Hemmati, M.; Shekarabi, A.S. An experimental study on using a nanosurfactant in an EOR process of heavy oil in a fractured micromodel. J. Pet. Sci. Eng. 2015, 126, 162–173. [Google Scholar] [CrossRef]
- Ma, K.; Liontas, R.; Conn, C.A.; Hirasaki, G.J.; Biswal, S.L. Visualization of improved sweep with foam in heterogeneous porous media using microfluidics. Soft Matter 2012, 8, 10669–10675. [Google Scholar] [CrossRef]
- Conn, C.A.; Ma, K.; Hirasaki, G.J.; Biswal, S.L. Visualizing oil displacement with foam in a microfluidic device with permeability contrast. Lab Chip 2014, 14, 3968–3977. [Google Scholar] [CrossRef] [PubMed] [Green Version]
- Klinzing, G.R.; Zavaliangos, A. A simplified model of moisture transport in hydrophilic porous media with applications to pharmaceutical tablets. J. Pharm. Sci. 2016, 105, 2410–2418. [Google Scholar] [CrossRef] [PubMed]
- Szulczewski, M.L.; MacMinn, C.W.; Herzog, H.J.; Juanes, R. Lifetime of carbon capture and storage as a climate-change mitigation technology. Proc. Natl. Acad. Sci. USA 2012, 109, 5185–5189. [Google Scholar] [CrossRef] [PubMed] [Green Version]
- Zhao, B.; MacMinn, C.W.; Juanes, R. Wettability control on multiphase flow in patterned microfluidics. Proc. Natl. Acad. Sci. USA 2016, 113, 10251–10256. [Google Scholar] [CrossRef] [PubMed] [Green Version]
- Osei-Bonsu, K.; Grassia, P.; Shokri, N. Investigation of foam flow in a 3D printed porous medium in the presence of oil. J. Colloid Interface Sci. 2017, 490, 850–858. [Google Scholar] [CrossRef] [PubMed]
- Chan, H.N.; Chen, Y.; Shu, Y.; Chen, Y.; Tian, Q.; Wu, H. Direct, one-step molding of 3D-printed structures for convenient fabrication of truly 3D PDMS microfluidic chips. Microfluid. Nanofluid. 2015, 19, 9–18. [Google Scholar] [CrossRef]
Figure 1.
(A) The design of the microfluidic device used in this work along with the procedures used to fabricate the channel; (B) A photograph of the microfluidic device with a schematic that illustrates where glass beads are packed in to form a porous structure. PDMS: polydimethylsiloxane.
Figure 1.
(A) The design of the microfluidic device used in this work along with the procedures used to fabricate the channel; (B) A photograph of the microfluidic device with a schematic that illustrates where glass beads are packed in to form a porous structure. PDMS: polydimethylsiloxane.

Figure 2.
A representative image of our porous structures (top, left) and a black and white image (top, right) generated during our measurement of the porosity. (bottom) A sample distribution of the pore radius for a representative image.
Figure 2.
A representative image of our porous structures (top, left) and a black and white image (top, right) generated during our measurement of the porosity. (bottom) A sample distribution of the pore radius for a representative image.

Figure 3.
A representative experiment for water with 0.1% SDS at a porosity of 0.143. Initially (A); the main channel was full of silicone oil which is black. When the water phase invaded the main channel, rhodamine B was used to track the displacement of silicone oil (B,C) until the whole main channel fluoresced (D). In this figure, the white represents rhodamine B and black represents silicone oil.
Figure 4.
The relationship between saturation of an invading water phase for three water-based fluids (no surfactant, 0.1% sodium dodecyl sulfate (SDS) and 0.1% polyvinylpyrrolidone (PVP)) as they displaced oil from a packed bed of glass microspheres with porosity of 0.063 (A); 0.113 (B); and 0.143 (C).

Figure 5.
The Hausdorff fractal dimension (A–C) as a function of time was evaluated using image analysis. The results in (A–C) show that, while all the samples evolved differently with time, they reached a point where they were topologically similar. Combining the fractal dimension with the radius of gyration (D–F) reveals that all samples scaled linearly with the saturation area.

Figure 6.
An implicit pressure explicit saturation (IMPES) simulation for the case with 0.1% SDS in water. Snapshots were taken at intervals that correspond to Figure 3 (A: t = 0 s, B: t = 1.2 s, C: t = 8.4 s, and D: t = 22.2 s). The color bar shows the value for the local saturation.
Figure 6.
An implicit pressure explicit saturation (IMPES) simulation for the case with 0.1% SDS in water. Snapshots were taken at intervals that correspond to Figure 3 (A: t = 0 s, B: t = 1.2 s, C: t = 8.4 s, and D: t = 22.2 s). The color bar shows the value for the local saturation.

Figure 7.
A comparison of our experimental results to an IMPES simulation of oil displacement by an invading water phase in a medium with porosity of 0.063 (bottom row), 0.113 (middle row), and 0.143 (top row).
Figure 7.
A comparison of our experimental results to an IMPES simulation of oil displacement by an invading water phase in a medium with porosity of 0.063 (bottom row), 0.113 (middle row), and 0.143 (top row).


Table 1.
A summary of the measured contact angle and water phase-solid surface tension. The oil–water surface tension and capillary number were calculated based on these parameters.
Table 1.
A summary of the measured contact angle and water phase-solid surface tension. The oil–water surface tension and capillary number were calculated based on these parameters.
| Water | 0.1% SDS | 0.1% PVP | |
|---|---|---|---|
| Contact Angle (degrees) | 11.2 ± 0.9 | 42.9 ± 1.4 | 22.3 ± 0.9 |
| γws (mN/m) | 72.2 ± 0.1 | 53.7 ± 0.4 | 66.8 ± 0.5 |
| γwo (mN/m) | 51.9 ± 0.4 | 44.2 ± 1.2 | 49.2 ± 0.7 |
| Average Capillary Number (Ca)/10−3 | 2.3 | 2.7 | 2.4 |
Table 2.
Fitting parameters for Amax and time constant of the three water-based fluid systems examined in this work.
Table 2.
Fitting parameters for Amax and time constant of the three water-based fluid systems examined in this work.
| Water | 0.1% SDS | 0.1% PVP | |||||
|---|---|---|---|---|---|---|---|
| Amax (μm2)/106 | tc (s) | Amax (μm2)/106 | tc (s) | Amax (μm2)/106 | tc (s) | ||
| Porosity | 0.063 | 1.266 | 86.2 | 1.105 | 17.6 | 1.253 | 285.7 |
| 0.11 | 1.059 | 111.1 | 1.241 | 11.0 | 1.209 | 25.3 | |
| 0.143 | 1.258 | 357.1 | 1.269 | 2.1 | 1.209 | 10.4 | |
Table 3.
The mobility ratio that best fit the experimental data, and the coefficient of determination (R2) associated with each fit.
Table 3.
The mobility ratio that best fit the experimental data, and the coefficient of determination (R2) associated with each fit.
| Water | SDS | PVP | |||||||
|---|---|---|---|---|---|---|---|---|---|
| Porosity | 0.063 | 0.113 | 0.143 | 0.063 | 0.113 | 0.143 | 0.063 | 0.113 | 0.143 |
| Mobility | 255.8 | 114.7 | 87.2 | 11.2 | 33.3 | 1.9 | 18.2 | 12.5 | 4.6 |
| R2 | 0.95 | 0.87 | 0.54 | 0.87 | 0.29 | 0.88 | 0.8 | 0.79 | 0.87 |
© 2018 by the authors. Licensee MDPI, Basel, Switzerland. This article is an open access article distributed under the terms and conditions of the Creative Commons Attribution (CC BY) license (http://creativecommons.org/licenses/by/4.0/).
Share and Cite
MDPI and ACS Style
Yeh, H.-L.; Juárez, J.J. Waterflooding of Surfactant and Polymer Solutions in a Porous Media Micromodel. Colloids Interfaces 2018, 2, 23. https://doi.org/10.3390/colloids2020023
AMA Style
Yeh H-L, Juárez JJ. Waterflooding of Surfactant and Polymer Solutions in a Porous Media Micromodel. Colloids and Interfaces. 2018; 2(2):23. https://doi.org/10.3390/colloids2020023
Chicago/Turabian StyleYeh, Hsiang-Lan, and Jaime J. Juárez. 2018. "Waterflooding of Surfactant and Polymer Solutions in a Porous Media Micromodel" Colloids and Interfaces 2, no. 2: 23. https://doi.org/10.3390/colloids2020023