1. Introduction
The
BRAF(p.V600E) mutation is found in approximately 10% of colorectal cancer patients [
1]. The prognosis of metastatic
BRAF-mutated tumours is poor [
2,
3,
4]. Colorectal cancer patients with the
BRAF mutation in their tumours show resistance to the Epidermal growth factor receptor (EGFR) inhibitor Cetuximab and their response to the
BRAF inhibitor Vemurafenib is limited [
5,
6]. Personalized treatment options and companion diagnostics are needed to better treat these patients. In order to gain a better understanding of molecular characteristics of these patients and design a personalized treatment for them, we have previously developed a 58-gene signature that characterizes the gene expression pattern of
BRAF-mutated colorectal tumors. Colorectal tumours identified by this 58-gene signature are called the
BRAF mutation-like subtype [
7]. This subtype represents approximately 20% of colorectal cancers patients, and they include both
BRAF-mutated tumours and
BRAF wild-type tumors that share a similar gene expression pattern; therefore, sequencing the
BRAF mutation alone is not sufficient to capture the whole population of the
BRAF- mutation-like subtype.
The
BRAF mutation-like subtype, in both
BRAF mutated and wild-type forms, displays similar clinical characteristics to
BRAF-mutated tumors: poor prognosis in a metastatic setting and a tendency towards resistance to anti-EGFR drugs such as Cetuximab [
3,
4,
7,
8]. To identify effective therapeutic targets of this specific subtype, 363 upregulated genes of the
BRAF mutation-like subtype were selected and an RNAi (RNA interference) screen was performed. Knockdown of the
RANBP2 gene led to a defect in microtubule dynamics and apoptosis of
BRAF mutation-like subtype cell lines during mitosis. Further, both in vitro and in vivo experiments repurposed that the mitotic microtubule-disturbing drug Vinorelbine has the same effect and is specifically lethal to this
BRAF -mutation-like subtype [
9]. These results suggested the possibility of using this 58-gene signature as a companion diagnostic to select patients with the
BRAF-mutation-like subtype of colorectal cancer to receive Vinorelbine treatment.
The original 58-gene
BRAF-mutation-like signature was developed by using fresh frozen tissues. To convert it to a companion diagnostic that can be used in clinical practice, the 58-gene signature needs to work with formalin-fixed, paraffin-embedded (FFPE) samples. Formalin fixation and paraffin embedding is the standard storage method in current clinical routine practice by pathologists; a companion diagnostic that can work with FFPE samples will make the logistics of a molecular diagnostic lab practical [
10]. However, FFPE samples often produce degraded mRNA and thereby introduce noise into gene expression data, and this introduces a level of complexity [
11]. Translation of the 58-gene
BRAF-mutation-like signature to FFPE demanded two major tasks: (1) the performance of the 58-gene signature on FFPE samples needs to be comparable to the original performance of the 58-gene signature on fresh frozen samples. (2) the readout of the 58-gene signature on FFPE samples need to be robust, and repeated measurements of a companion diagnostic need to show small variation. In this report, we demonstrate a four-steps workflow that Agendia used to convert this 58-gene signature from a research tool that works with fresh frozen samples to a companion diagnostic that works with FFPE samples. First, an FFPE sample set enriched for
BRAF(p.V600E) mutated tumors was collected. Second, the
BRAF mutation-like 58-gene signature was translated to FFPE templates and performance was evaluated. Third, the technical stability and reproducibility of the translated FFPE version of the
BRAF mutation-like 58-gene signature were accessed by using technical control samples. Finally, the borderline region was determined, and the outcome of the translated FFPE version of the
BRAF mutation-like 58-gene signature was compared to the outcome of the fresh frozen version of the signature by using paired fresh frozen and FFPE samples. Because most molecular signatures were developed by using fresh frozen samples, and most of them were not translated to companion diagnostics that can be used as predictive biomarkers in real clinical practice, the workflow we describe here and alternative approaches presented in the discussion section could serve as an option for scientists who are interested in translating their research results into clinical tools for personalized medicine.
3. Results
3.1. Pre-Screen of FFPE Samples and Mutational Analysis
For the translation of the 58-gene BRAF-mutation-like signature from a research tool that works with fresh frozen samples to a companion diagnostic that works with FFPE samples we enriched a gene expression dataset of FFPE tissues with BRAF mutated tumors. To have an accurate estimation of sensitivity and specificity of the signature on FFPE samples, the sample size of BRAF mutated tumors and BRAF wild-type tumors needs to be sufficiently large, e.g., at least greater than 50. The BRAF mutation is found in approximately 10% of colorectal cancer patients, as the consequence, the sample size of BRAF wild-type tumors is often sufficient, while the sample size of BRAF mutated tumors is often much smaller. This low percentage ~10% means that if we aim to collect at least 50 BRAF mutation samples by sequencing a random population, the total number of colorectal cancer samples needs to be sequenced in the lab would be more than 500. In order to enrich the BRAF mutation samples in the dataset, we generated the scores of the original fresh frozen version of the BRAF mutation-like 58-gene signature on FFPE samples, we use these scores to rank our FFPE samples and pre-screened a set of 96 FFPE colorectal tumors that likely harbors high percentage of BRAF mutations. The remaining 206 FFPE colorectal tumors were randomly selected.
BRAF mutations of these 302 colorectal tumors were measured: as expected, within the pre-screened 96 tumors, a high percentage 35.4% (n = 34) harbored p.V600E mutations, and within the randomly selected 206 tumours, 11.2% (n = 23) harboured p.V600E mutations. In total, 57 (18.9%) tumours harboured BRAF mutations and 245 (81.1%) were the wild-type. Within these 57 BRAF mutated tumours, 16 are microsatellite instable tumors (MSI), 7 are microsatellite stable tumors (MSS) and 34 tumors do not have MSI/MSS status available. The percentage of BRAF mutations found in these 302 FFPE samples (18.9%) is higher than expected percentage (10%) of a random population. The pre-screen procedure of mutation analysis indeed increased sample size of BRAF mutated samples in our FFPE dataset and facilitate an accurate estimation of sensitivity, but because the pre-screen procedure ranked tumors with scores without knowing which tumor is BRAF mutated, it also increased the sample size of BRAF wild-type tumors that are true BRAF mutation-like subtype in these 302 FFPE samples, which resulted in a biased estimation of reduced specificity.
3.2. Translating the Signature to FFPE Templates and Performance of the BRAF Mutation-Like 58-Gene Signature in FFPE Samples
Performance of the
BRAF mutation-like 58-gene signature was estimated by a leave-one-out cross-validation (LOOCV) on the set of 302 FFPE colorectal tumor samples. Tumors with signature scores above the threshold were assigned to the
BRAF-mutation-like group, and tumors with signature scores below the threshold were assigned to the wild-type group. The
BRAF mutation like 58-gene signature predicted 51 of 57 known
BRAF mutations and predicted 194 of the 245 tumors with no
BRAF mutation as wild-type (sensitivity 89.5%, specificity 79.2%,
Table 2).
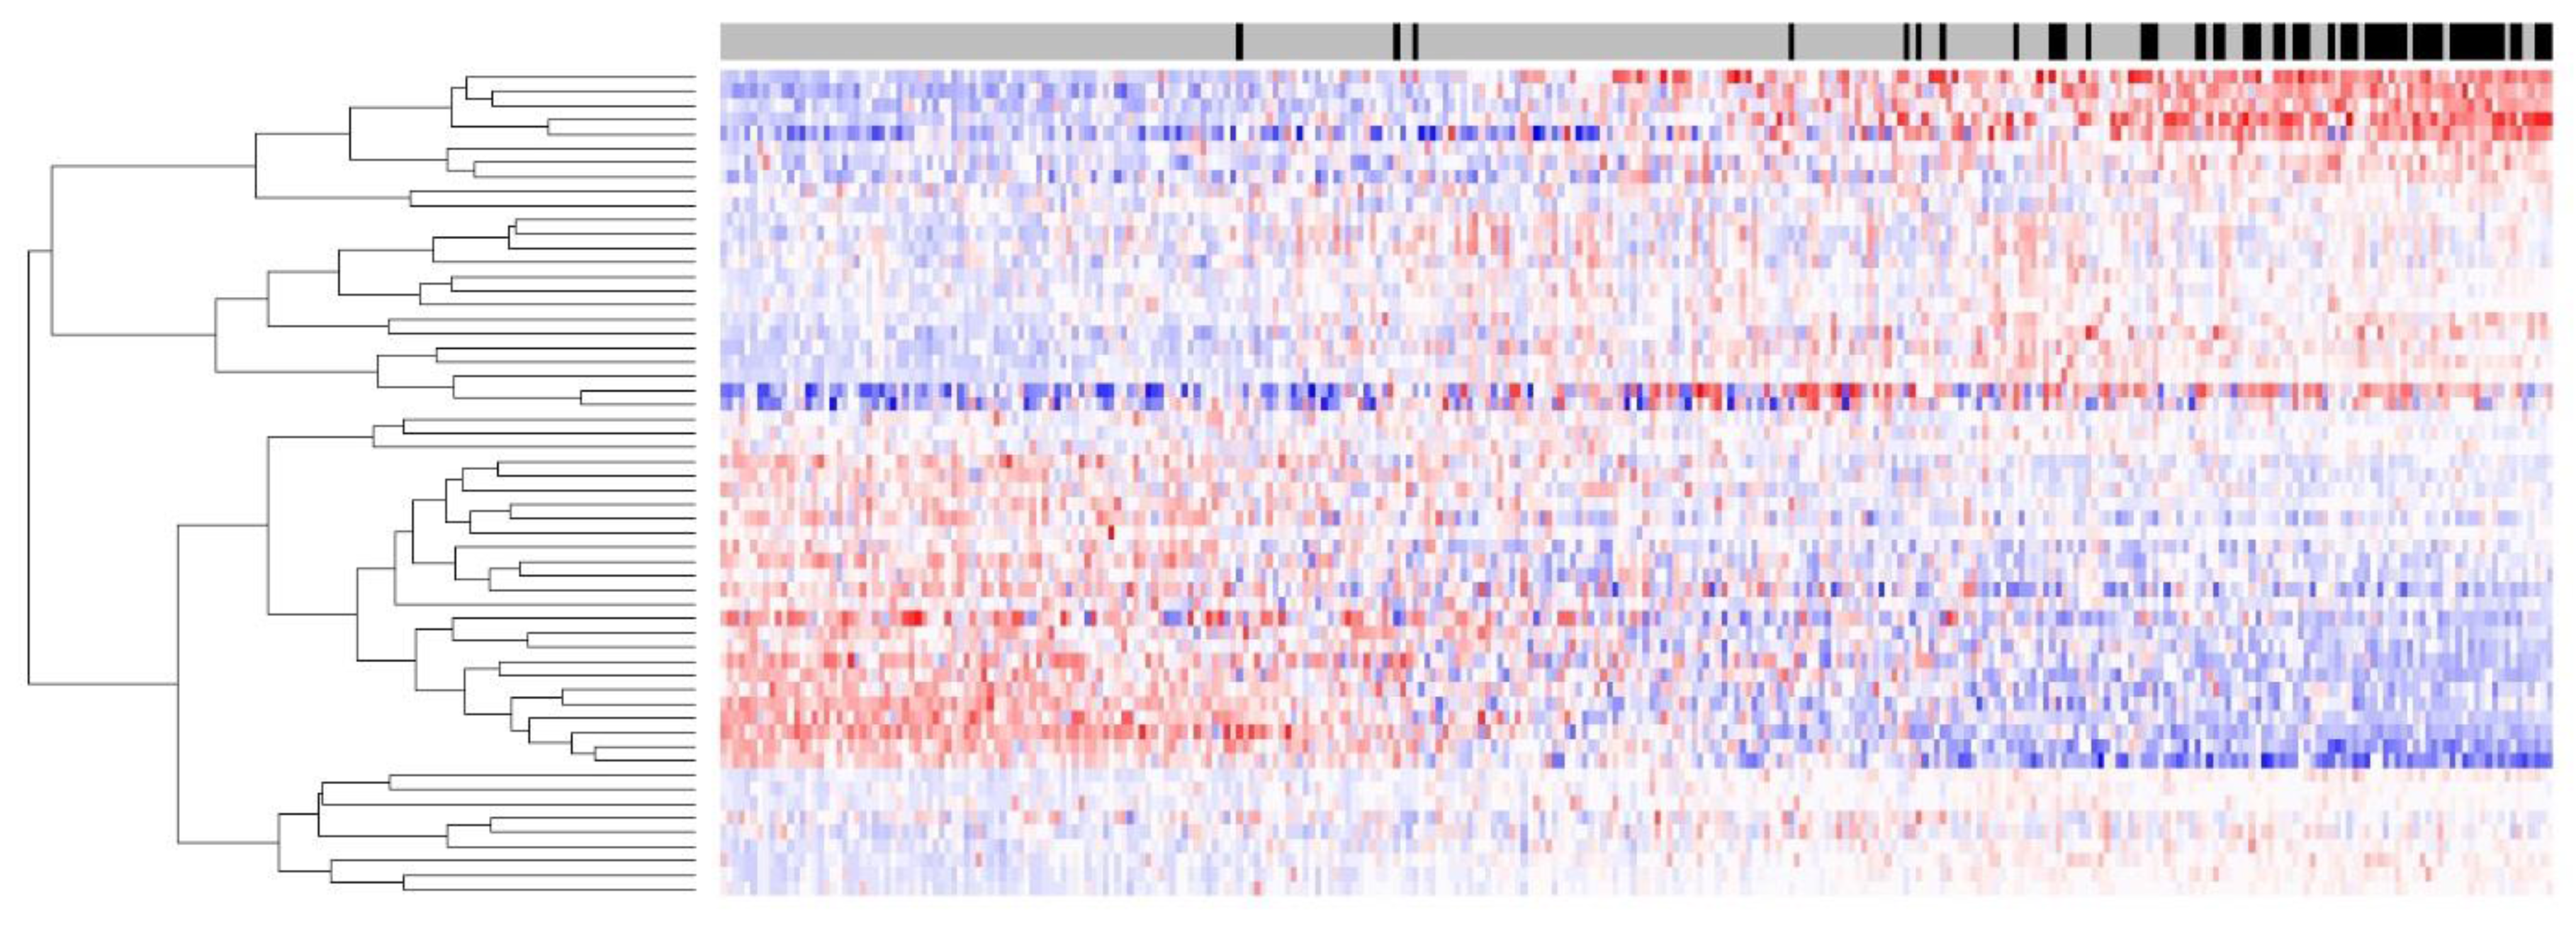
Figure 1 shows the heatmap of the 58-gene signature on 302 FFPE tumors; the separation of up-/downregulation of 58 genes is clear, indicating that the signal quality for 58 genes derived from FFPE samples was good. Despite the RNA degradation present in this FFPE sample set, a high sensitivity of 89.5% was maintained, and this sensitivity was comparable to that of the same 58-gene signature on a fresh frozen dataset.
The specificity on FFPE sample 79.2% suggests that 20.8% (51 out of 245) of BRAF wild-type tumors in this dataset share the same gene expression pattern as BRAF-mutated tumours. The specificity 79.2% is lower than the specificity 92% of the 58-gene signature on fresh frozen samples. This is mainly due to the pre-screen procedure used in this study, the top ranking 96 tumours in the pre-screen procedure during the sample collection not only enriched for BRAF mutated samples, but also enriched for BRAF wild-type samples that are true BRAF-mutation-like subtype. The BRAF-mutation-like subtype represents approximately 20% of colorectal cancers patients, of which ~10% are known BRAF mutated tumors and ~10% are BRAF wild-type tumors that share the same gene expression pattern. The total number of the percentage of BRAF mutated tumors is enriched from the expected 10% to 18.9% of 302 FFPE samples (57 BRAF-mutated tumors), as an estimation, the BRAF wild-type tumors in the BRAF-mutation-like subtype also should enriched from the expected 10% to 18.9% of 302 FFPE samples (n = 57, 302 × 18.9%). Therefore, an expected specificity would be 76.7% (1 − 57/245), and this number is comparable to the observed specificity of 79.2% of the 58-gene signature on 302 FFPE samples. This effect can also be partially inferred by excluding the 96 pre-screened tumor samples. By using only the subset of randomly selected 206 samples to analyze optimal sensitivity (87.0%) and specificity (83.6%), we could observe an increased specificity.
In total, 33.8% of all samples (102 out of 302) were classified as the
BRAF mutation-like subtype; again, this percentage is high also because of the intentional enrichment for samples with the
BRAF mutation in this FFPE sample set during sample collection. In the identified
BRAF mutation-like subtype group, 51 tumors (50%) are known
BRAF-mutated tumors, and 51 tumors (50%) are
BRAF wild-types. The exact underlying mechanism why some
BRAF wild-type tumors display the same gene expression pattern as
BRAF-mutated tumors is not clear, however, previous pathway analysis performed by our group indicated that mRNA level of activators of MEK/ERK pathway is upregulated and mRNA level of inhibitor of MEK/ERK pathway is downregulated in these
BRAF wild-types tumors [
7]. Taken together, these results indicated that only sequencing the
BRAF mutation will miss a significant portion of the
BRAF mutation-like subtype.
3.3. Stability of the BRAF Mutation-Like 58-Gene signature in FFPE Samples
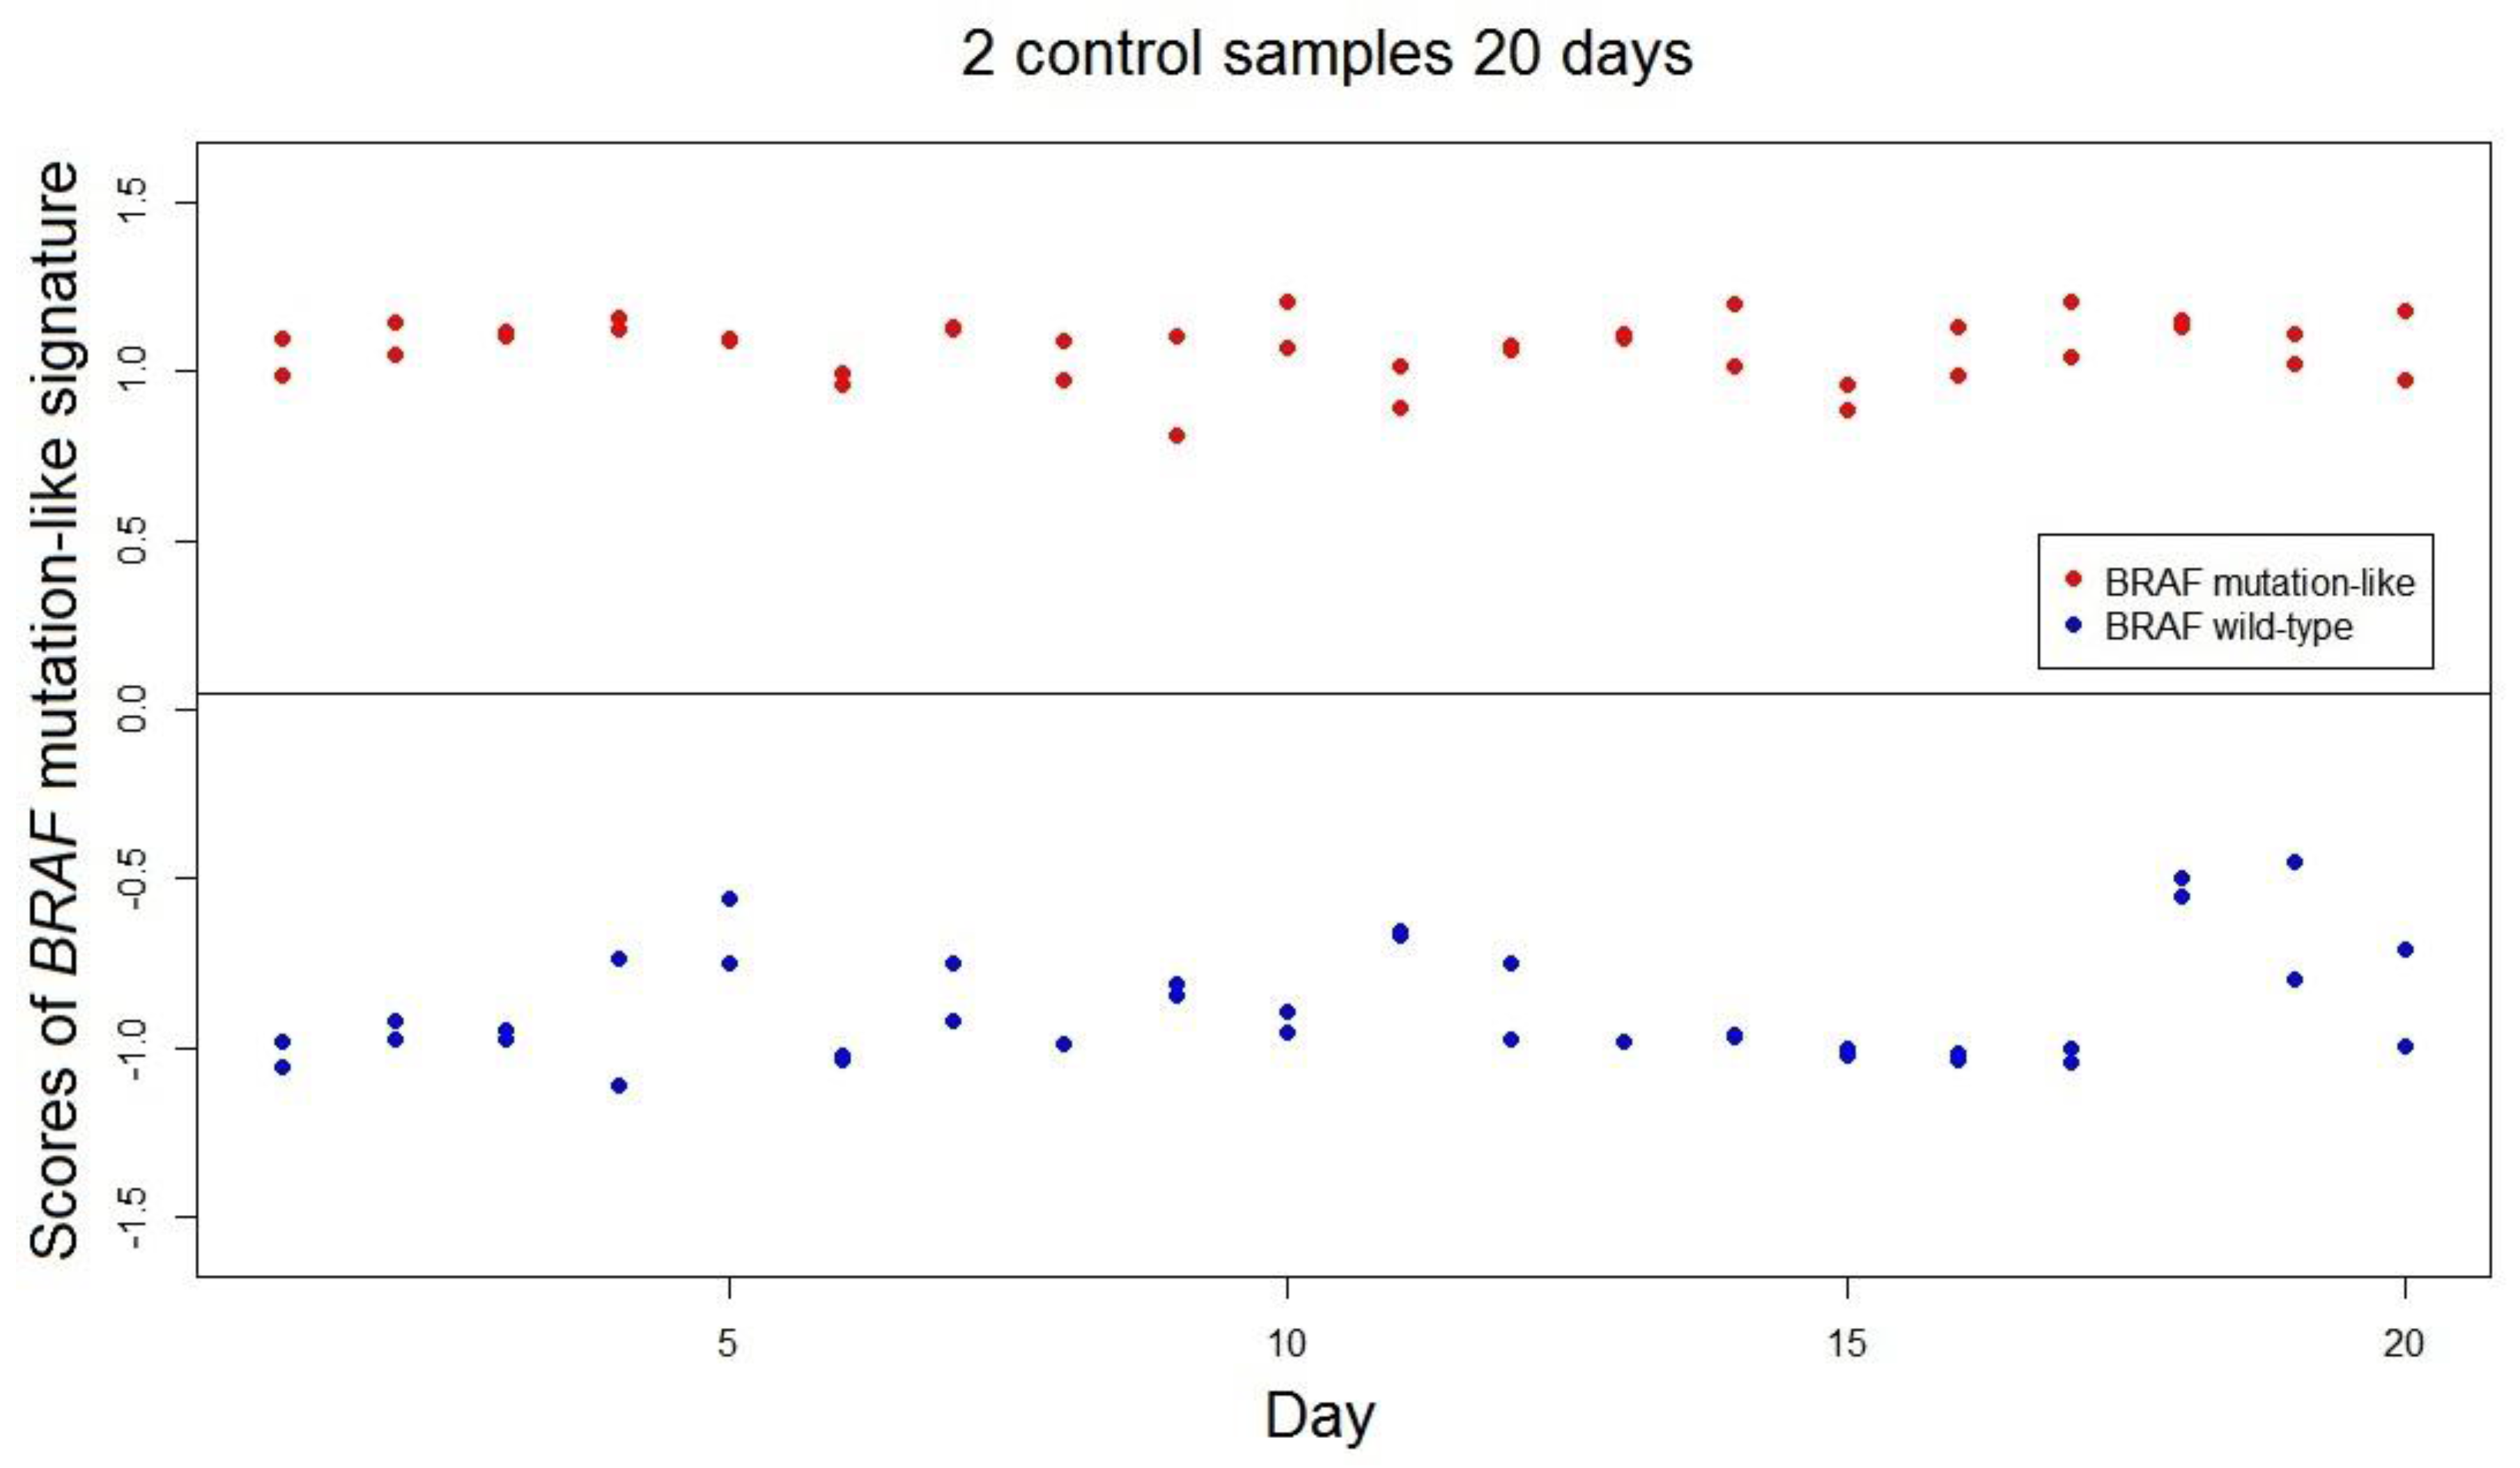
The range of scores of the
BRAF-mutation-like 58-gene signature was estimated as (−1.53, 1.53; range = 3.06). This value of range is a conservative estimation as the range was estimated by only using 302 samples, and the actual range is expected to be higher than 3.06. The stability and reproducibility over time of the
BRAF mutation-like 58-gene signature in FFPE samples was measured over 40 independent measurements using 2 FFPE colorectal tumor control samples; one known
BRAF mutated tumor and one
BRAF wild-type tumor. All 40 repeated measurements of both controls were correctly classified by the signature. The standard deviations of the scores of
BRAF mutation-like 58-gene signature are control 1: SD.Brafmut = 0.091, SD.Brafmut/range = 3.0%; control 2: SD.Brafwt = 0.169, SD.Brafwt/range = 5.5% (
Figure 2). The empirical predefined criterion is SD/Range not exceeding 10% of the range, and both controls satisfied this criterion [
13].
3.4. Comparison of the Fresh Frozen Version and the FFPE Version of the BRAF Mutation-Like 58-Gene Signature
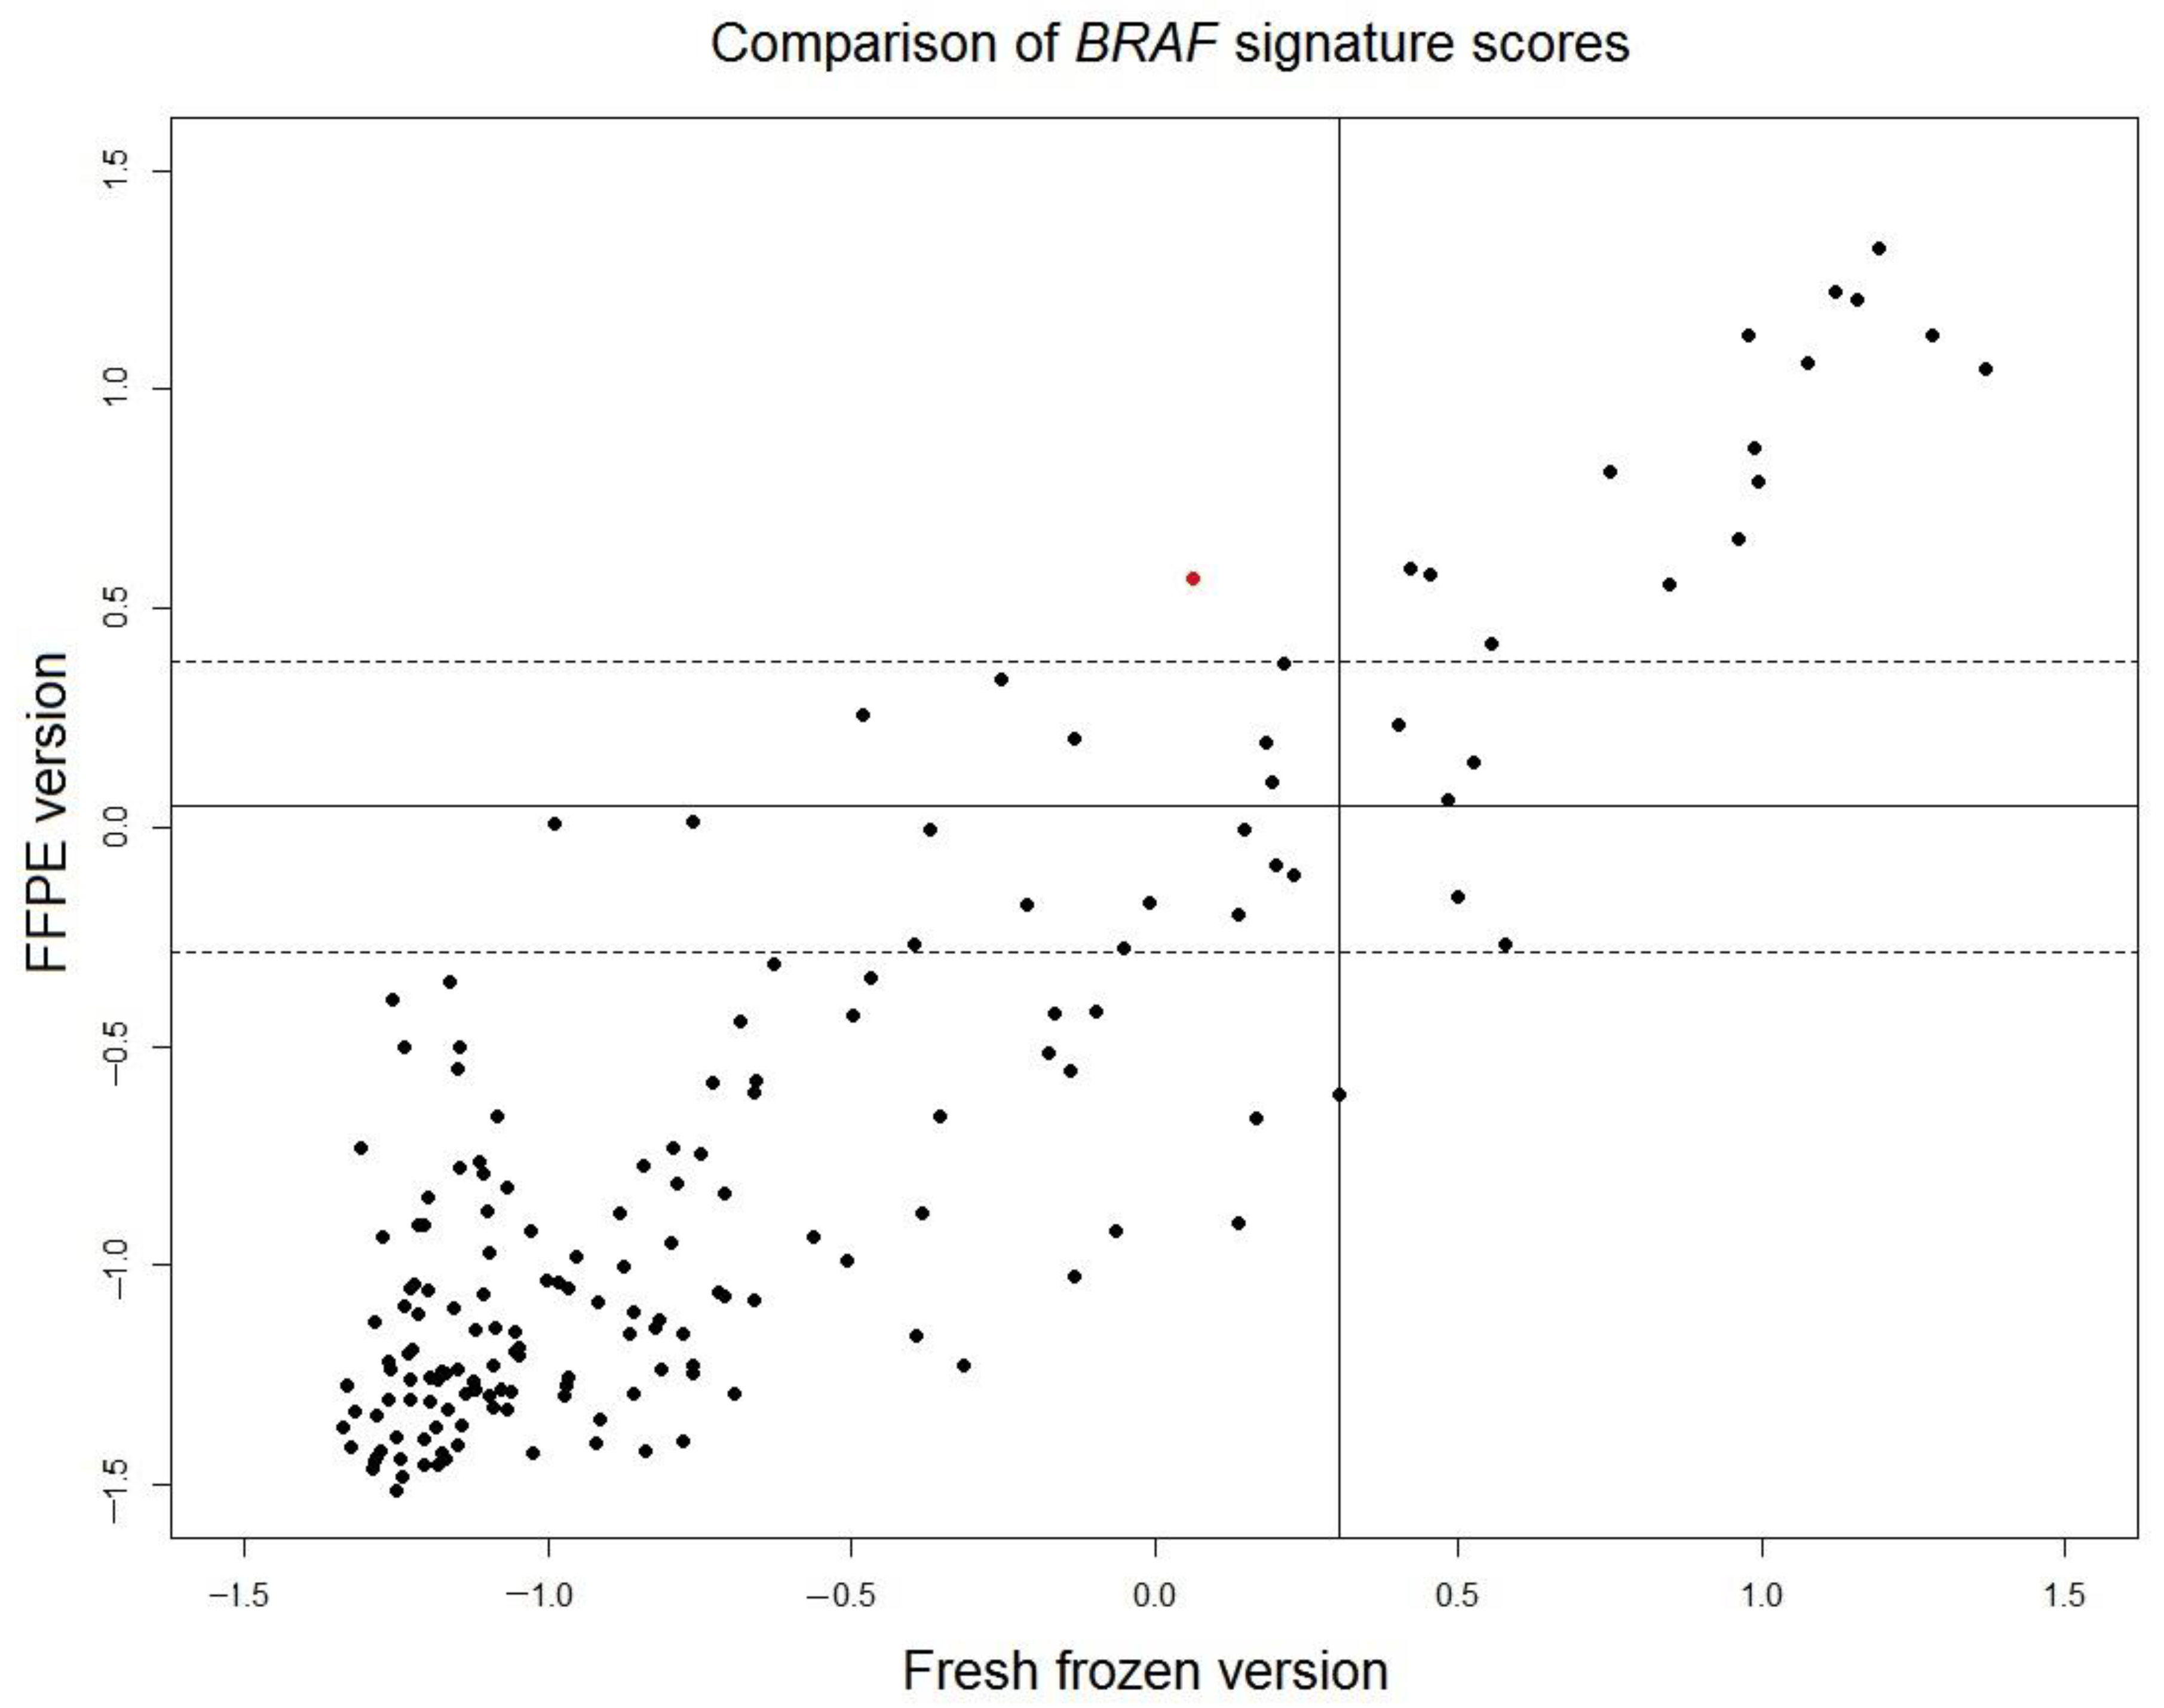
In the original cohort of fresh frozen samples of 381 tumors used to develop the
BRAF 58-gene signature [
7], paired FFPE samples of 201 tumors were available. Gene expression data of all 201 FFPE samples were measured. Twenty-five FFPE samples with low tumor percentage and six FFPE sample with low signal intensity of microarray were excluded from analysis. The scores of the translated FFPE version of the
BRAF mutation-like 58-gene signature were read out for the remaining 170 FFPE samples and were compared with the scores of the original fresh frozen version of the signature (
Figure 3). The correlation of the scores of FFPE version and fresh frozen version is high (r = 0.88). The borderline region of FFPE scores is defined as
, where
is set to a conservative estimation as the larger value of standard deviations of two control samples described in the previous section (control 2: SD = 0.169). For 148 samples outside of the borderline region, only 1 sample (0.7% of total 148 samples) switched outcome between fresh frozen version and FFPE version. This result indicated that the outcome of fresh frozen version and translated FFPE version of the
BRAF mutation-like 58-gene signature is consistent.
4. Discussion
The
BRAF mutation-like subtype of colorectal cancer, including both
BRAF mutated tumors and
BRAF wild-type tumors with a similar gene expression pattern, can be characterized by a 58-gene signature. This report described the procedure that translated the 58-gene
BRAF mutation-like signature developed with fresh frozen tissues to a companion diagnostic that can use FFPE samples. Many molecular signatures have been developed using fresh frozen samples, and translating a molecular signature developed using fresh frozen samples to a companion diagnostic that works with FFPE samples is a critical step in the development of a cancer predictive biomarker that can be used in real clinical practice [
10]. Although translating a signature from the fresh frozen setting to the FFPE setting is a technical procedure and logically straightforward, in practice, the advantage and disadvantage of a few alternatives need to be discussed. Generally, there are three different approaches one can choose.
The first approach is to develop a molecular signature directly using FFPE samples. The advantage of this approach that there is no need to process the fresh frozen sample, and it also avoids the possible situation that a molecular diagnostic test developed using fresh frozen samples cannot be translated to a molecular diagnostic test using FFPE samples. The disadvantage of this approach often involves additional studies a molecular diagnostic group wishes to carry out. Often, a molecular diagnostic lab not only aims to develop a molecular diagnostic test that works with FFPE samples but also to identify the best possible genes that characterize prognostic value, drug response or potential intervening targets. For example, in this case, the target gene RANBP2 was screened by using a fresh frozen data set. To only use FFPE samples would limit the researchers to the degraded mRNA in the FFPE samples and may result in missing the best targets in the discovery phase.
The second approach is to develop a molecular signature using fresh frozen samples first, then translates it using a matching set of fresh frozen and FFPE samples. Here, two samples, one fresh frozen sample and one matching FFPE sample, will be taken from the same tumor, and using this matching dataset, the ideal situation is to observe a linear or adjustable relationship between molecular test scores calculated on fresh frozen and FFPE samples. This approach can identify which individual genes in the molecular signature introduce large variation between fresh frozen samples and FFPE samples. One may consider removing these noise-introducing genes when a molecular signature is translated to the FFPE setting. The disadvantage of this approach comes from the intrinsic noise of both tumor heterogeneity within tumor cells and the mixture of tumor cells and non-neoplastic cells in the tumor tissue. Due to the nature of the process, fresh frozen samples and FFPE samples are taken from different regions of the same tumor. When two different regions of the same tumor are compared, the results are confounded by different mixture of both tumor heterogeneity and presence of non-neoplastic cells. For certain tumor types, for example, colorectal tumors, a tumor sample often contains a diverse mixture of immune cells, stromal cells and tumor cells, and the complexity introduced can be severe.
The third approach is similar to the second one; it develops a molecular signature using fresh frozen samples first, then it does not use a matching set of fresh frozen and FFPE samples, rather, it translates the signature by using a large set of FFPE samples to make new FFPE specific templates and new FFPE specific threshold. The advantage of this approach is that it benefits from the best possible data quality of fresh frozen samples in the discovery phase. The disadvantages are two folds: (1) in some cases, after a molecular diagnostic test developed using fresh frozen samples is translated into one using FFPE samples, its accuracy or stability will decrease too much such that it can no longer be accepted in clinical practice; (2) this approach usually requires an FFPE dataset large enough, often a sample size that is comparable to that of the fresh frozen samples used in the discovery phase.
The workflow described in this report followed the third approach discussed above. In the discovery phase, we benefited from the highest quality data and identified that
RANBP2 knockdown can kill the
BRAF-mutation-like subtype of colorectal cancer cells [
9]. In the companion diagnostic development phase, we showed a robust companion diagnostic that can use FFPE samples to select the
BRAF-mutation-like subtype. The translated FFPE version of the
BRAF mutation-like 58-gene signature had a sensitivity of 89.5% and a specificity 79.2%. The specificity of 79.2% is consistent with our expectation because the special pre-screen procedure used in this study enriched percentage of
BRAF wild-type samples that are true
BRAF-mutation-like subtype in these 302 FFPE samples, and these 20.8% (51 out of 245) of
BRAF wild-type tumors are likely true
BRAF mutation-like subtype. The sensitivity of 89.5% is high and comparable to the sensitivity of fresh frozen version of the signature. A direct evidence of robustness come from the comparison of the signature scores of 148 paired fresh frozen-FFPE samples (
Figure 3). The scores of the translated FFPE version of
BRAF-mutation-like 58-gene signature was compared with the original scores of fresh frozen version (sensitivity 90%, specificity 92%), only 0.7% (1/148) FFPE samples switched outcome. It should be noted that when the 58-gene signature readout was compared between paired fresh frozen samples and FFPE samples, the variation not only comes from RNA degradation in the FFPE sample, but also come from the fact that fresh frozen sample and FFPE sample are essentially two different sampling at two different regions of a same tumor. This variation introduced by two samplings can also be observed in
Figure 3. The scores of the translated FFPE version and the fresh frozen version of the tumors in
BRAF mutation-like subtypes (upper-right,
Figure 3) are more consistent than tumors that are not in the
BRAF mutation-like subtypes (lower-left,
Figure 3), because the tumor population of the
BRAF mutation-like subtype is likely more homogenous than tumors that are not in the
BRAF mutation-like subtypes. Despite the mix of these two different sources of variations, the comparison showed the performance of the translated FFPE version and the fresh frozen version of the
BRAF mutation-like 58-gene signature is consistent.
When measuring the sensitivity of a gene signature using mutation statuses, if the threshold of the gene signature is set at the optimal accuracy, a sensitivity of 100% is rarely observed. A few tumor sample may harbor a BRAF p.V600E mutation but the dominant gene expression pattern of this tumor sample is not a mutation like. This may be caused by other unknown mechanism that switches off the BRAF pathway despite the existence of the BRAF mutation, and rarely, the population of the BRAF mutated tumor is too small, and the gene expression pattern of mutated tumor cells is blurred by the dominant population of tumor cells of other subtypes in the same tumor sample. For Vinorelbine treatment to show clinical benefit, it is reasonable to assume that the BRAF mutation population needs to be dominant in the tumor and resulted in a measurable gene expression pattern, only in this scenario the drug will likely be effective to kill the dominant population of the tumor cells. Thus, the BRAF-mutation-like 58-gene signature would be an effective biomarker than sequencing BRAF p.V600E alone to select both actual BRAF mutation carriers and BRAF wild-type in the BRAF mutation-like subtype of colorectal cancer patients who may specifically benefit from Vinorelbine treatment. A European Union-funded multicentre clinical trial MoTriColor has started pre-screening for patient enrolment in 2016, and FFPE samples of the primary tumors will be used to test efficacy of Vinorelbine in the BRAF mutation-like subtype in this trial.

 ,
, 
