Article

Developing a Decision Support System (DSS) for a Dental Manufacturing Production Line Based on Data Mining

1
Department of Dental Technology, Shu-Zen Junior College of Medicine and Management, Kaohsiung 821, Taiwan
2
Medical Device Innovation Center, National Cheng Kung University, Tainan 70403, Taiwan
3
Fu Chi Dental Laboratory, 4F., No.232, Guanghua 1st Rd., Lingya Dist., Kaohsiung 80253, Taiwan
4
Department of Mechanical Engineering, National Pingtung University of Science and Technology, Pingtung 91201, Taiwan
*
Author to whom correspondence should be addressed.
Appl. Syst. Innov. 2018, 1(2), 17; https://doi.org/10.3390/asi1020017
Submission received: 7 April 2018 / Revised: 27 May 2018 / Accepted: 27 May 2018 / Published: 30 May 2018
(This article belongs to the Special Issue Wireless Sensor Networks on Internet of Things and Intelligent System)

Abstract

:
In this study, an Industry 4.0 framework-based decision support system (DSS) was developed using a combination of wireless network and RFID identification technology to manage a production line in a traditional dental manufacturing lab. The motivation was to prevent mistakes from manual recording, to remotely monitor the working hours of employees in manufacturing processes via internet, and to evaluate the rationality of the employee’s working hours. In the DSS, four network nodes were established to track four important manufacturing processes of digital dentistry. In each of these processes, the time spent by the dental technician was recorded by scanning their ID cards. All information was simultaneously uploaded to a databank in the cloud and analyzed by the computer software MATLAB. These programs evaluated the rationality of employees’ working hours in each of the monitored processes, which can help managers to follow up or improve the process efficiency.

1. Introduction

With the trend of ageing, the demand for medical devices continues to rise all over the world. The market value has reached 336.1 million USD and the demand for dental implants has increased significantly by the report of BMI in 2016 [1]. According to an estimation by Merrill Lynch, the market compound growth rate of artificial implants has been 17.7% since 2001. In Taiwan, dental technicians are responsible for making prostheses for patients. Therefore, how to reduce the problem of low production efficiency caused by human factors is always the goal of every dental laboratory [2]. In recent years, the Taiwan government has continuously promoted the integration of wireless networks, automated production, and process management intelligence through the policy of productivity 4.0 [3]. Much research has discussed the application of “Productivity 4.0” or “Industry 4.0” in Taiwan, but most of them have only discussed the potential benefits of and impacts on business management or production lines after assisting companies to apply this policy [4,5,6,7].
Lian et al. combined two different wireless communication protocols, ZigBee and Wi-Fi, on the same system and used Arduino to integrate with them to achieve the effect. The system can remotely monitor the changes of temperature and humidity in home without performing it through a computer. It can effectively reduce the cost of the existing remote monitoring equipment and select appropriate communication protocols for data transmissions based on different sensing signals [8]. Chen et al. used RFID technology and cloud architecture to strengthen the management system of logistics service. The idea can effectively reduce costs and assist manager tracking [9]. Cheng et al. combined RFID and expert systems to develop the material management system and material forecasting mechanism for a dental laboratory [10]. With the maturity of AI technology, how to introduce intelligent management of denture manufacturing to improve the competitiveness of a dental laboratory is an important research direction in the future.
In this study, an Industry 4.0 framework-based decision support system (DSS) has been developed using a combination of wireless network and RFID identification technology to manage a production line in a traditional dental manufacturing lab. DSS has been widely used for production line management, for example, Gramajo and Martinez [11] applied the DSS model to manage the network traffic within the users and organizations using linguistic information, which recommends priorities for suppliers. Recommendations and decisions can be processed by rating a database through a decision tree in models [12]. Our primary motivation is to prevent mistakes from manual recording, to remotely monitor the working hours of employees in manufacturing processes via internet, and to evaluate the rationality of employee’s working hours. Further, the system is able to evaluate the rationality of employees’ working hours and recommend managers a more efficient process.

2. Materials and Methods

This study aimed to establish a cloud architecture platform, a prosthesis process site, the system architecture and corresponding hardware, and a decision tree model. In this study, the cloud architecture platform used by the dental laboratory was initially based on a public cloud (ThingSpeak), and then changed to a private cloud (AWS Cloud Platform) after obtaining a large amount of data. Among the whole 14 processes of prosthesis manufacturing, only 4 critical processes were chosen to create corresponding sites for data collection. In addition, a three-tier system architecture was created to collect, transmit, and store data. The hardware was designed based on RFID and Arduino UNO. Finally, by using the decision tree, a reasonable work time model by four parameters was established.

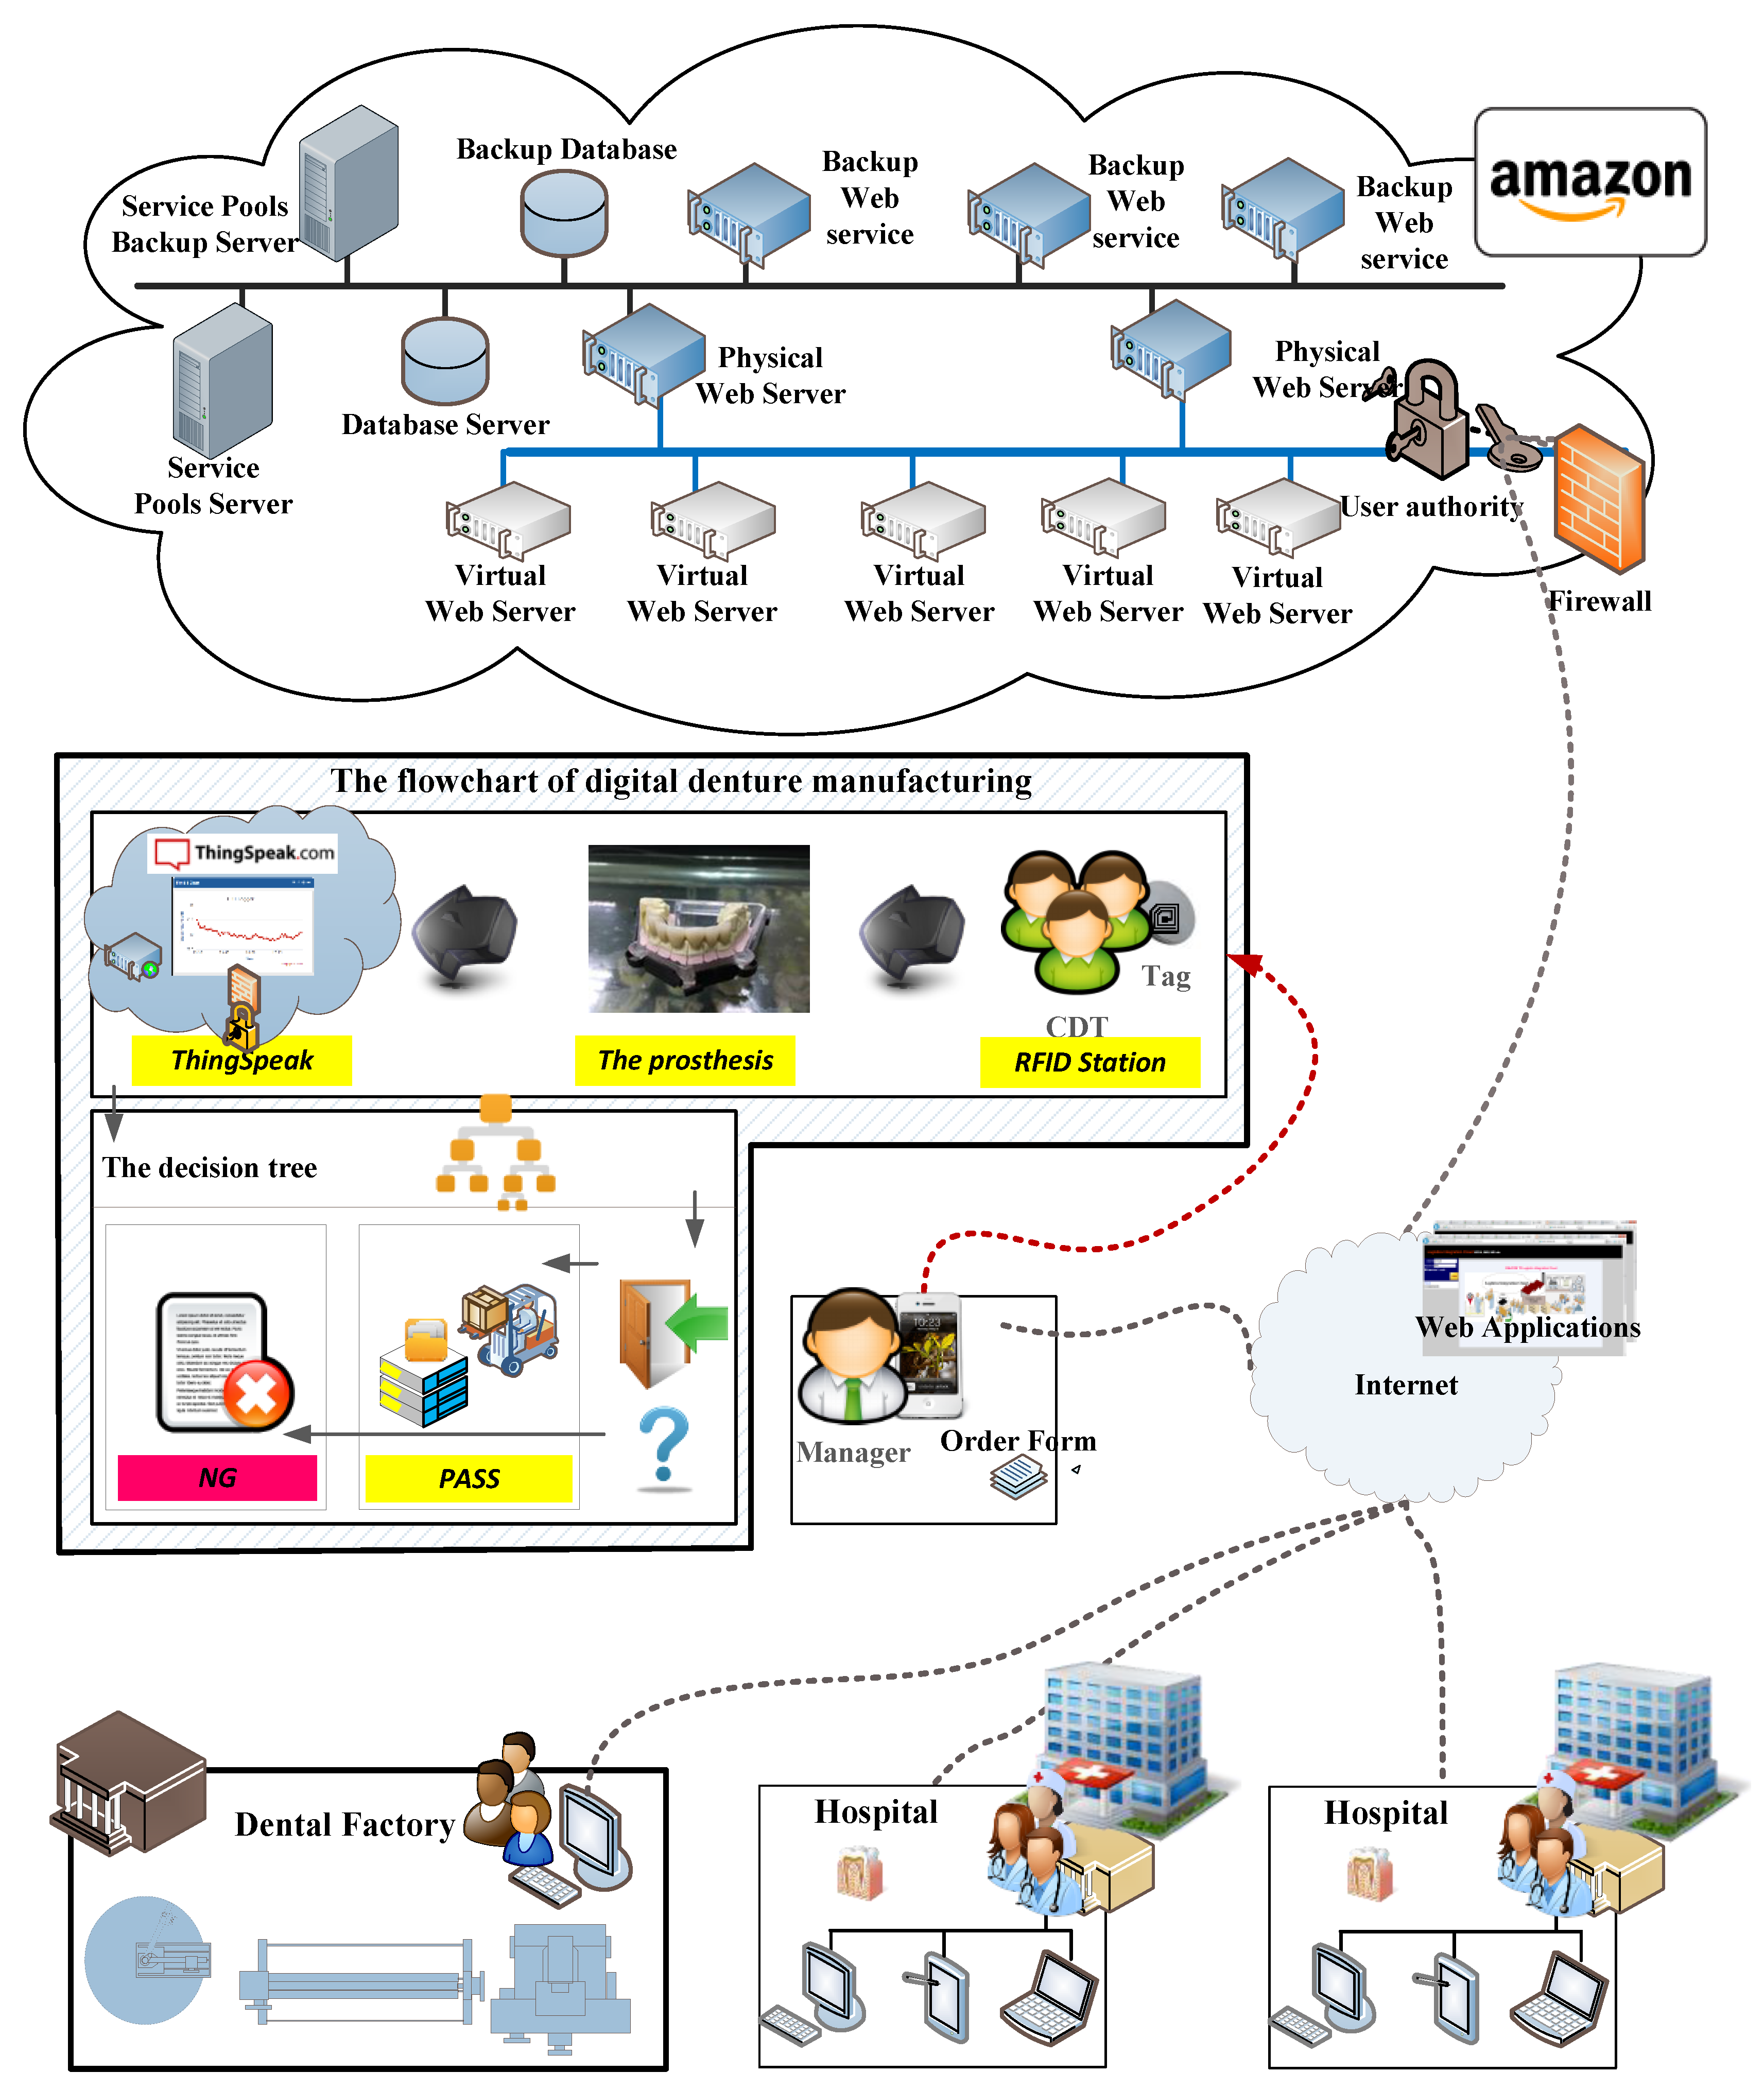
2.1. Cloud Structure

The whole scenario of this study is shown in Figure 1. The production started after the manager of the dental laboratory received orders from the hospital. Dental technicians would swipe the card with RFID tags while working at specific stations. These data were sent to the AWS Cloud and ThingSpeak for storage. Afterwards, the data manager performed decision tree analysis based on the data saved in ThingSpeak. Finally, “PASS” was recorded when the working time at the specific station was reasonable. If not, “NG” was recorded. The cloud system can be used remotely by different dental laboratories (Figure 2). By using the framework of Amazon EC2 and ThingSpeak public cloud, the cloud platform can provide many services, including data storage, data output, data graphs, account management, human–machine interfaces, and station expansion, which can be browsed on web pages by users. Based on the digitalization need in Fu Chi dental laboratory, this study developed a cloud system as shown in Figure 3. It mainly included three components: client (PC, Smartphone, Notebook), Amazon cloud server, and ThingSpeak cloud server.
(1)
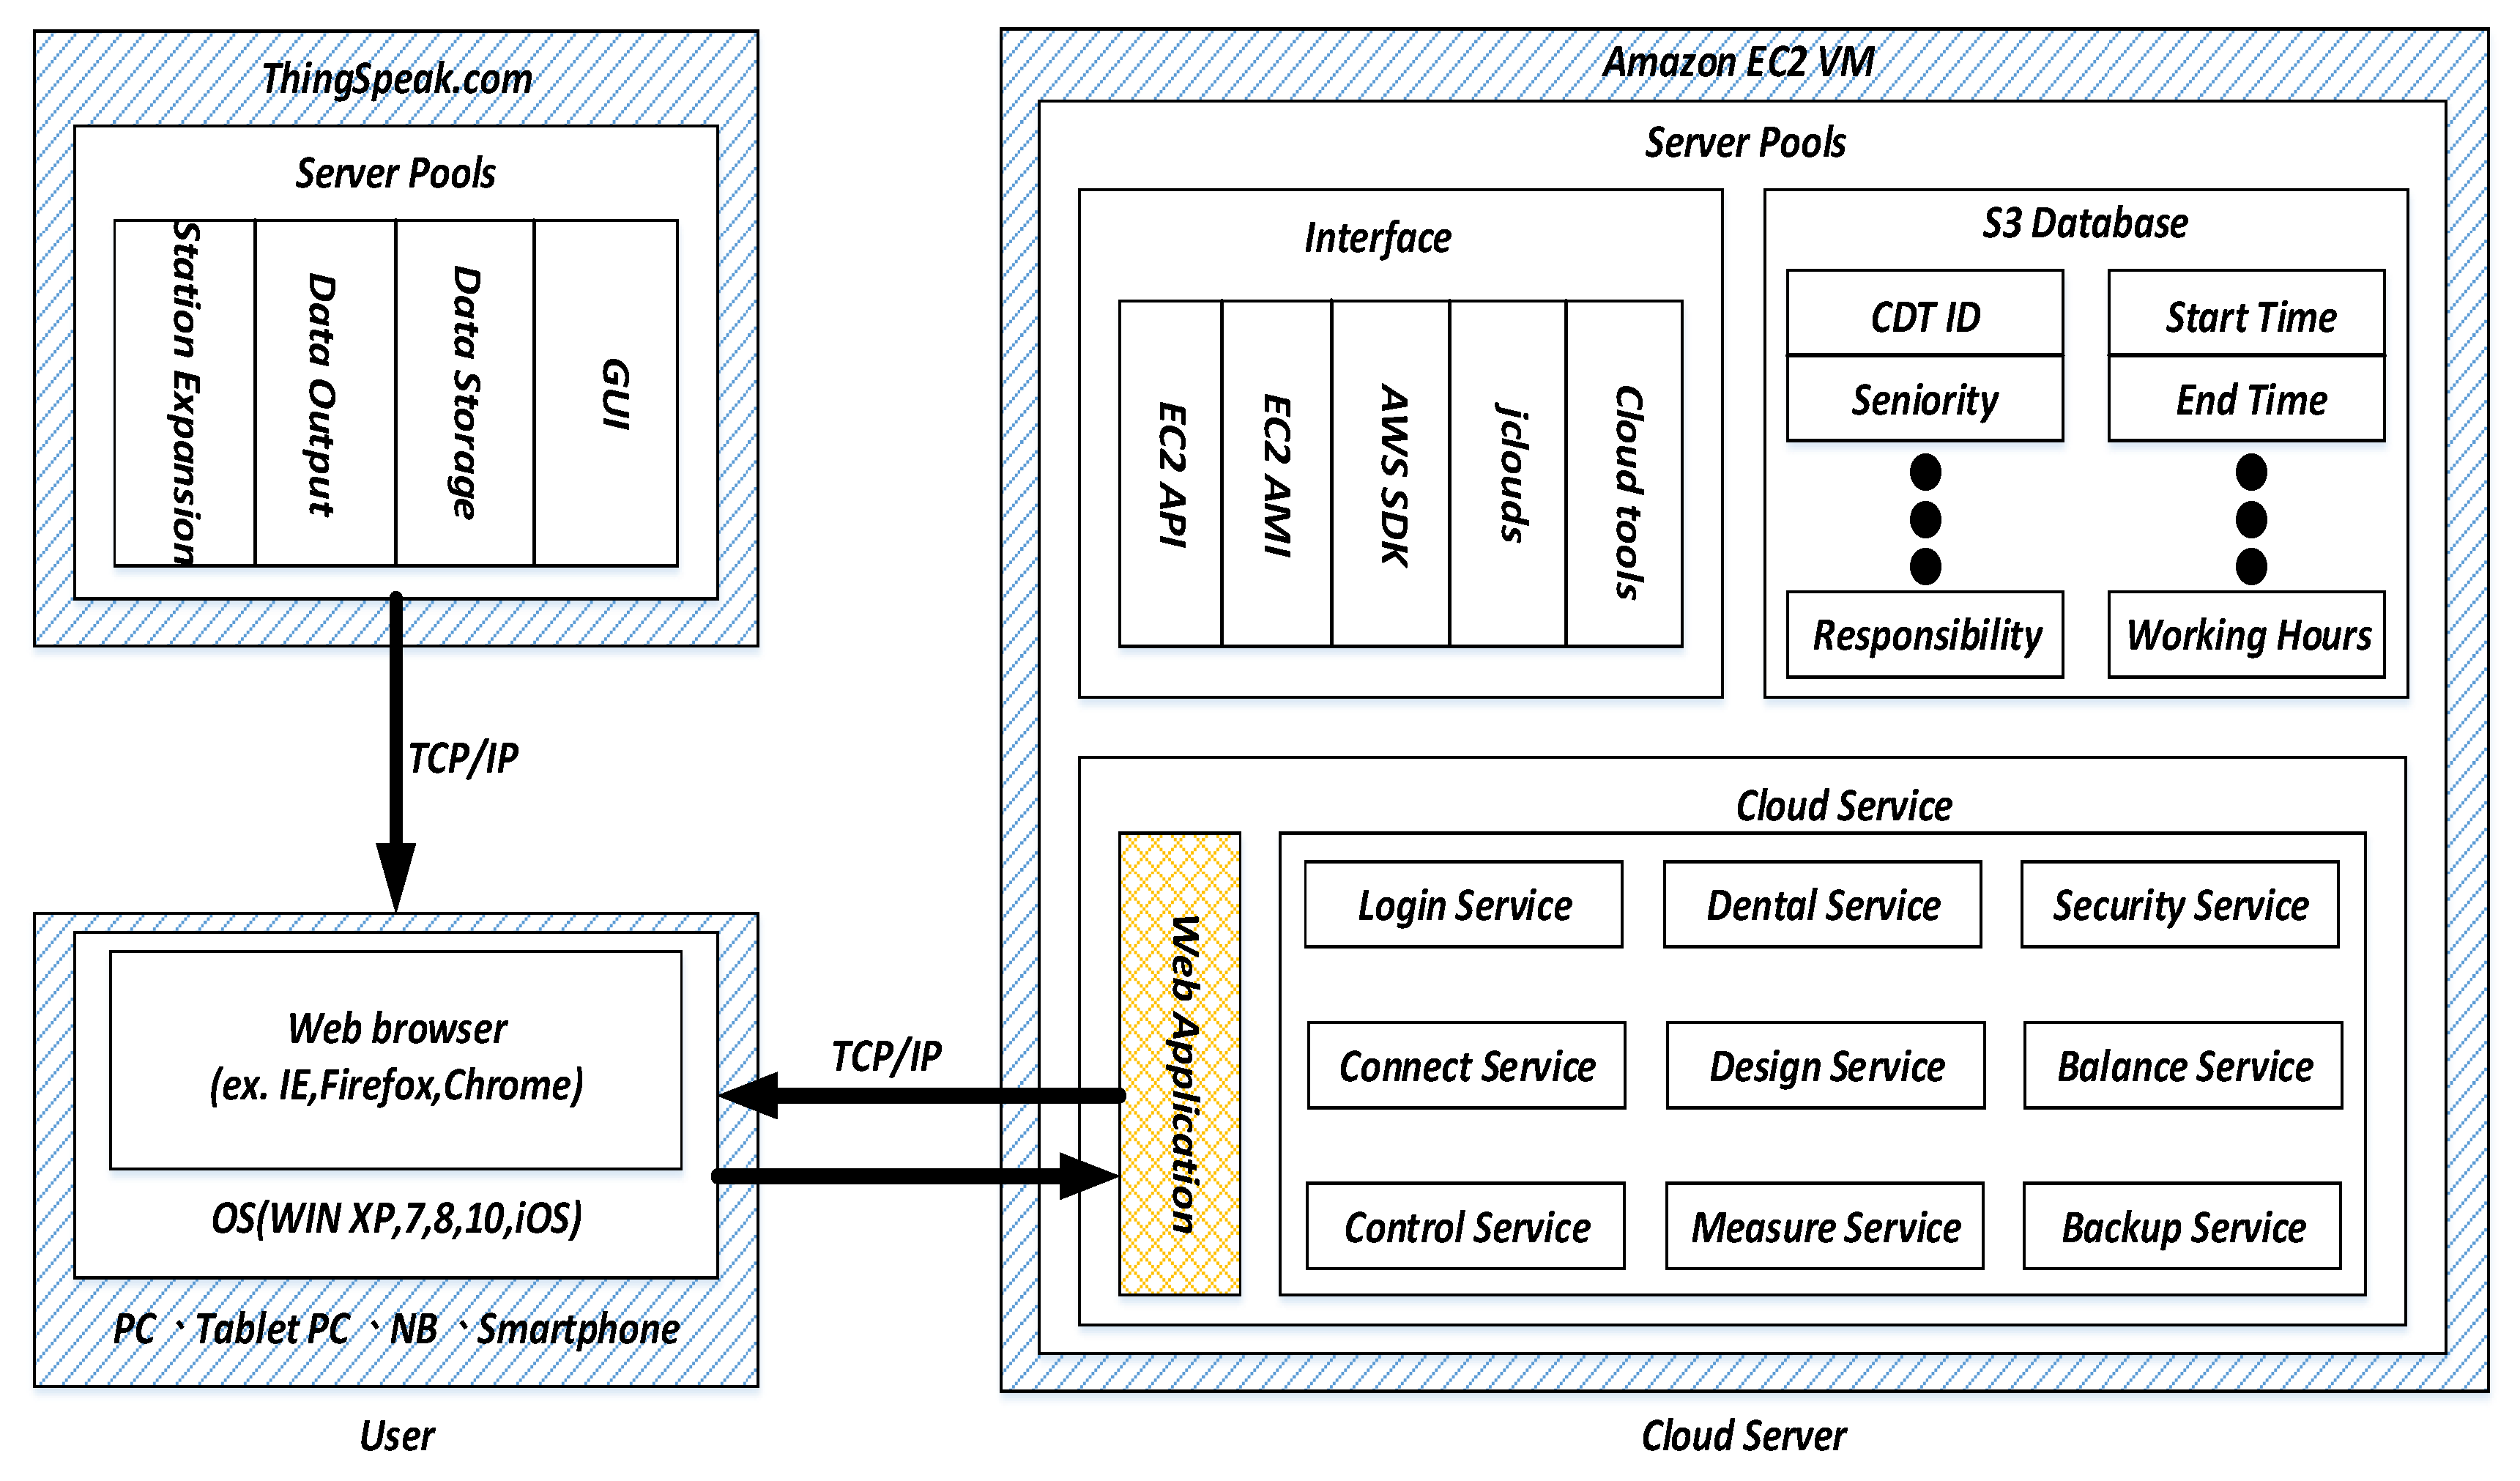
Client: The client did not need to install any application software on the computer. One could use this system after logging into the cloud by using the web authentication service via the TCP/IP protocol. The user could get the information of digital dental processes remotely by the use permission of the web page.
(2)
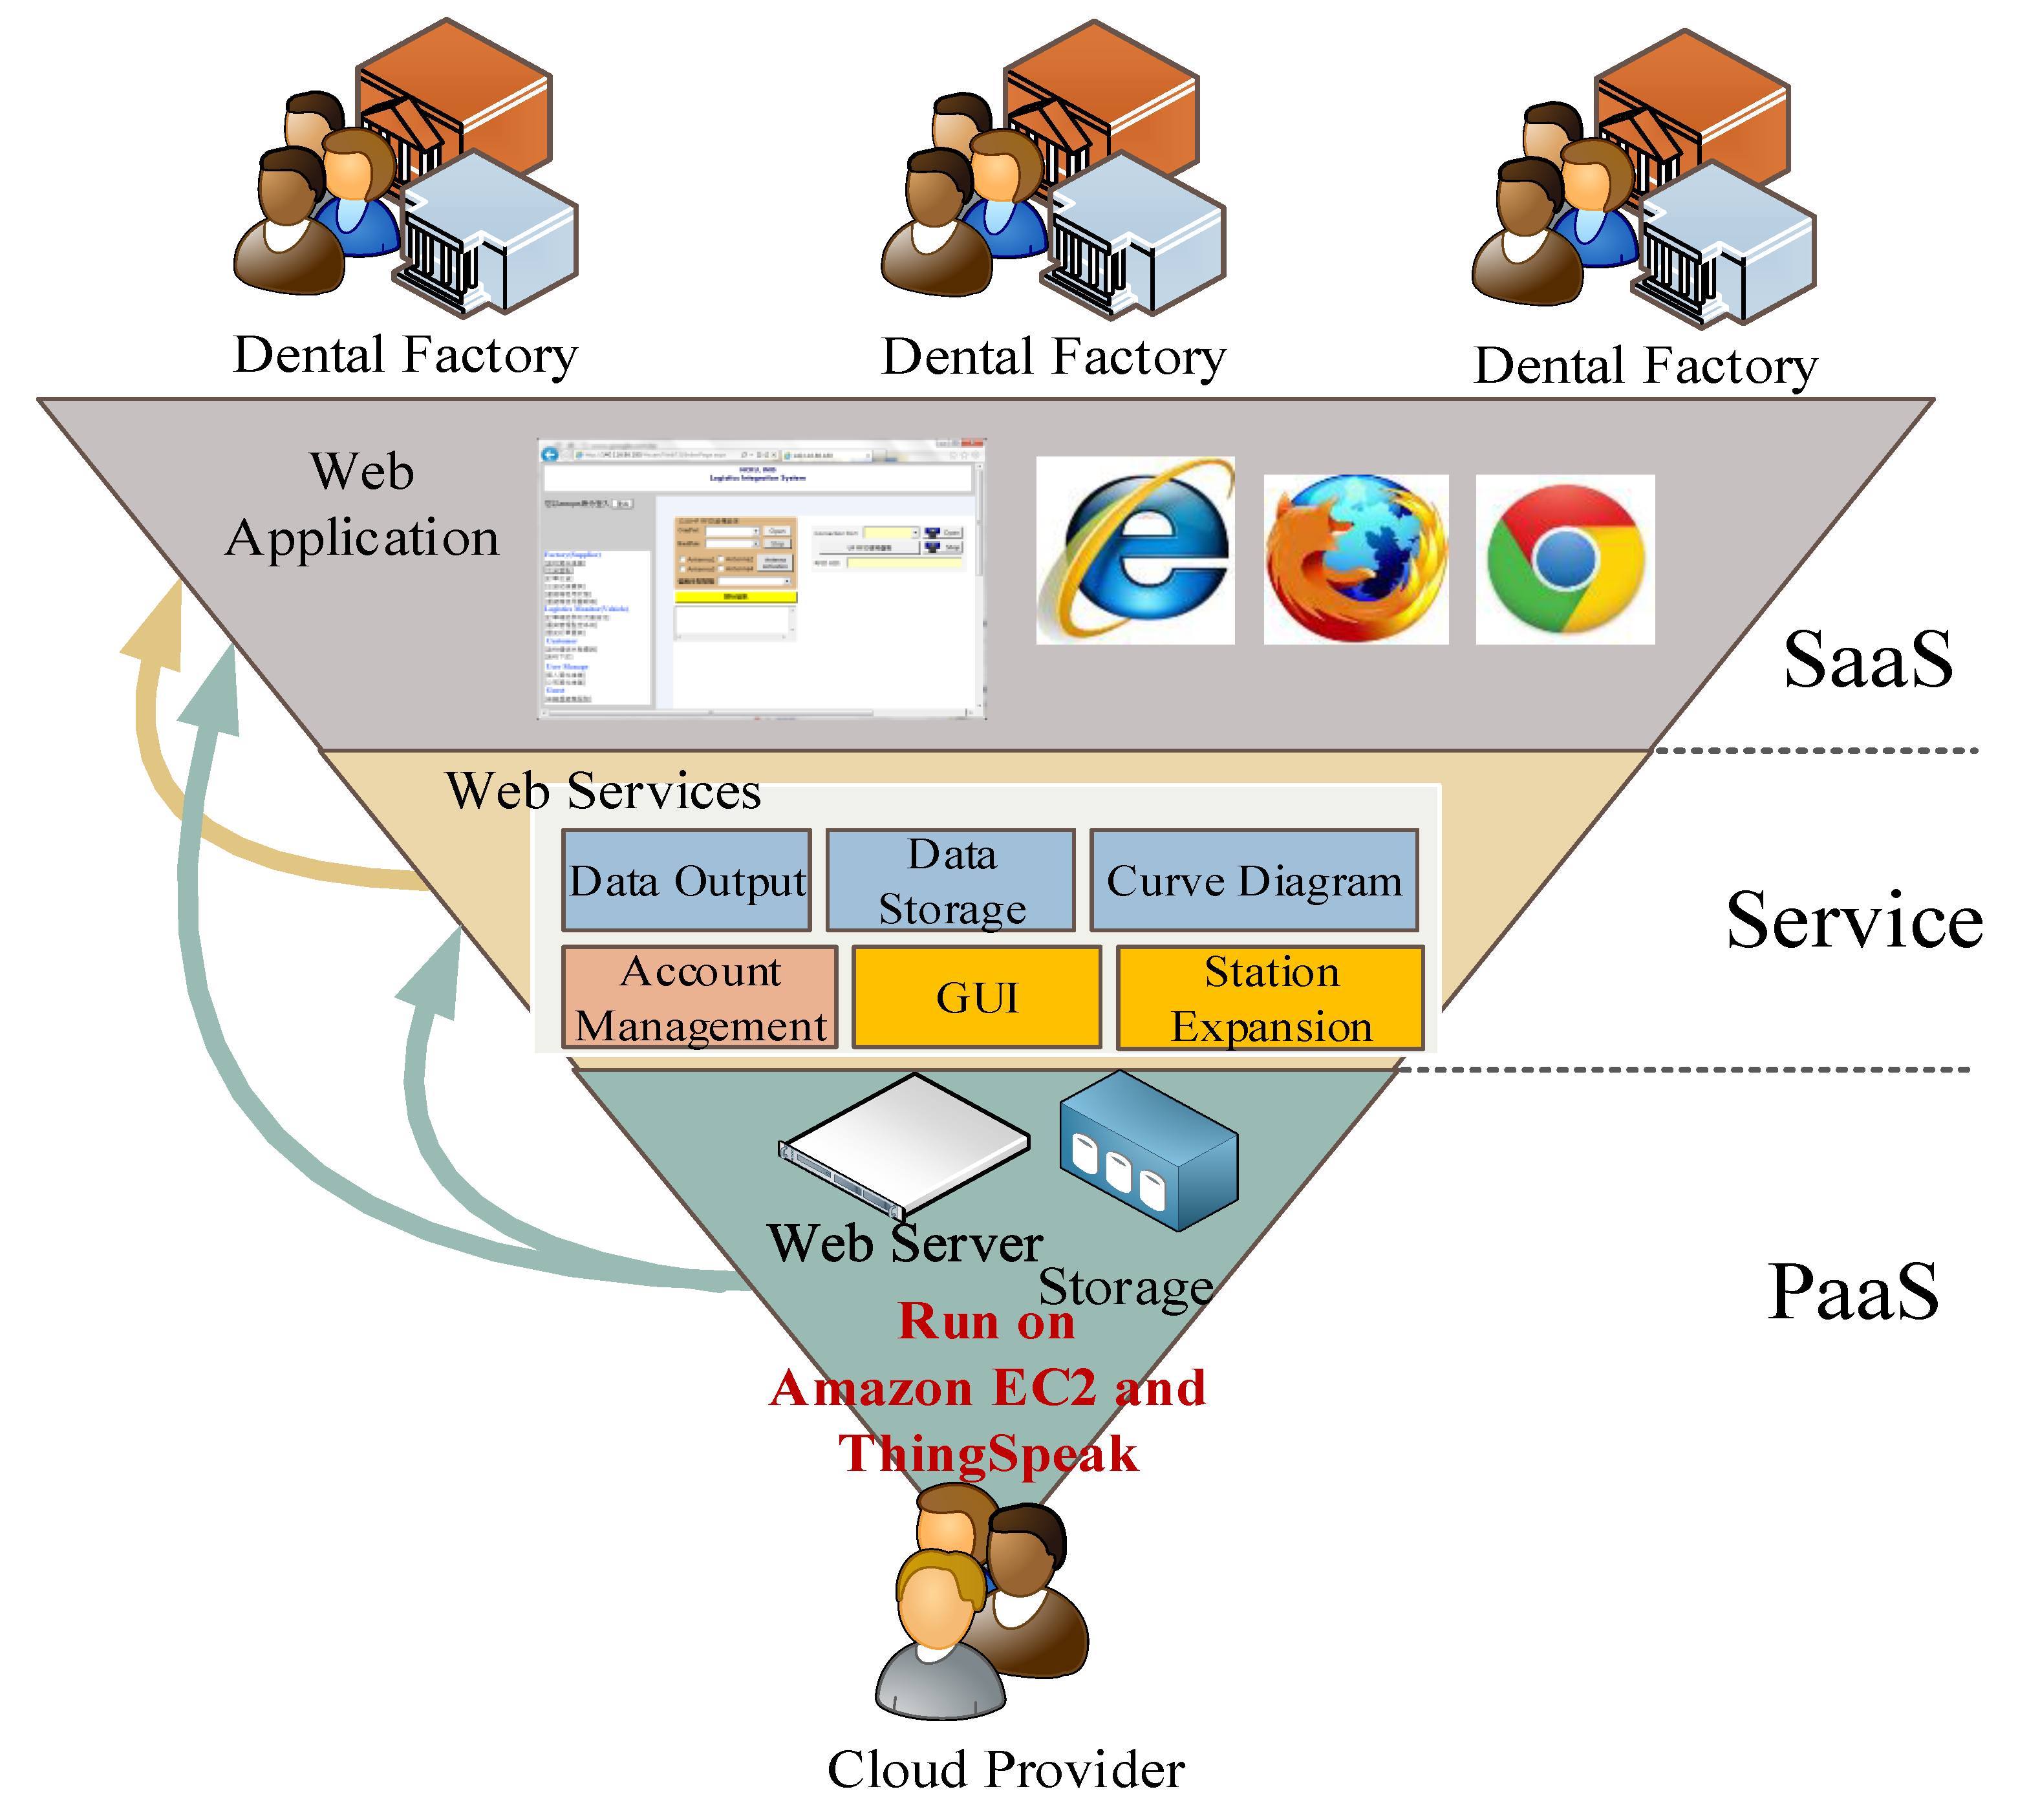
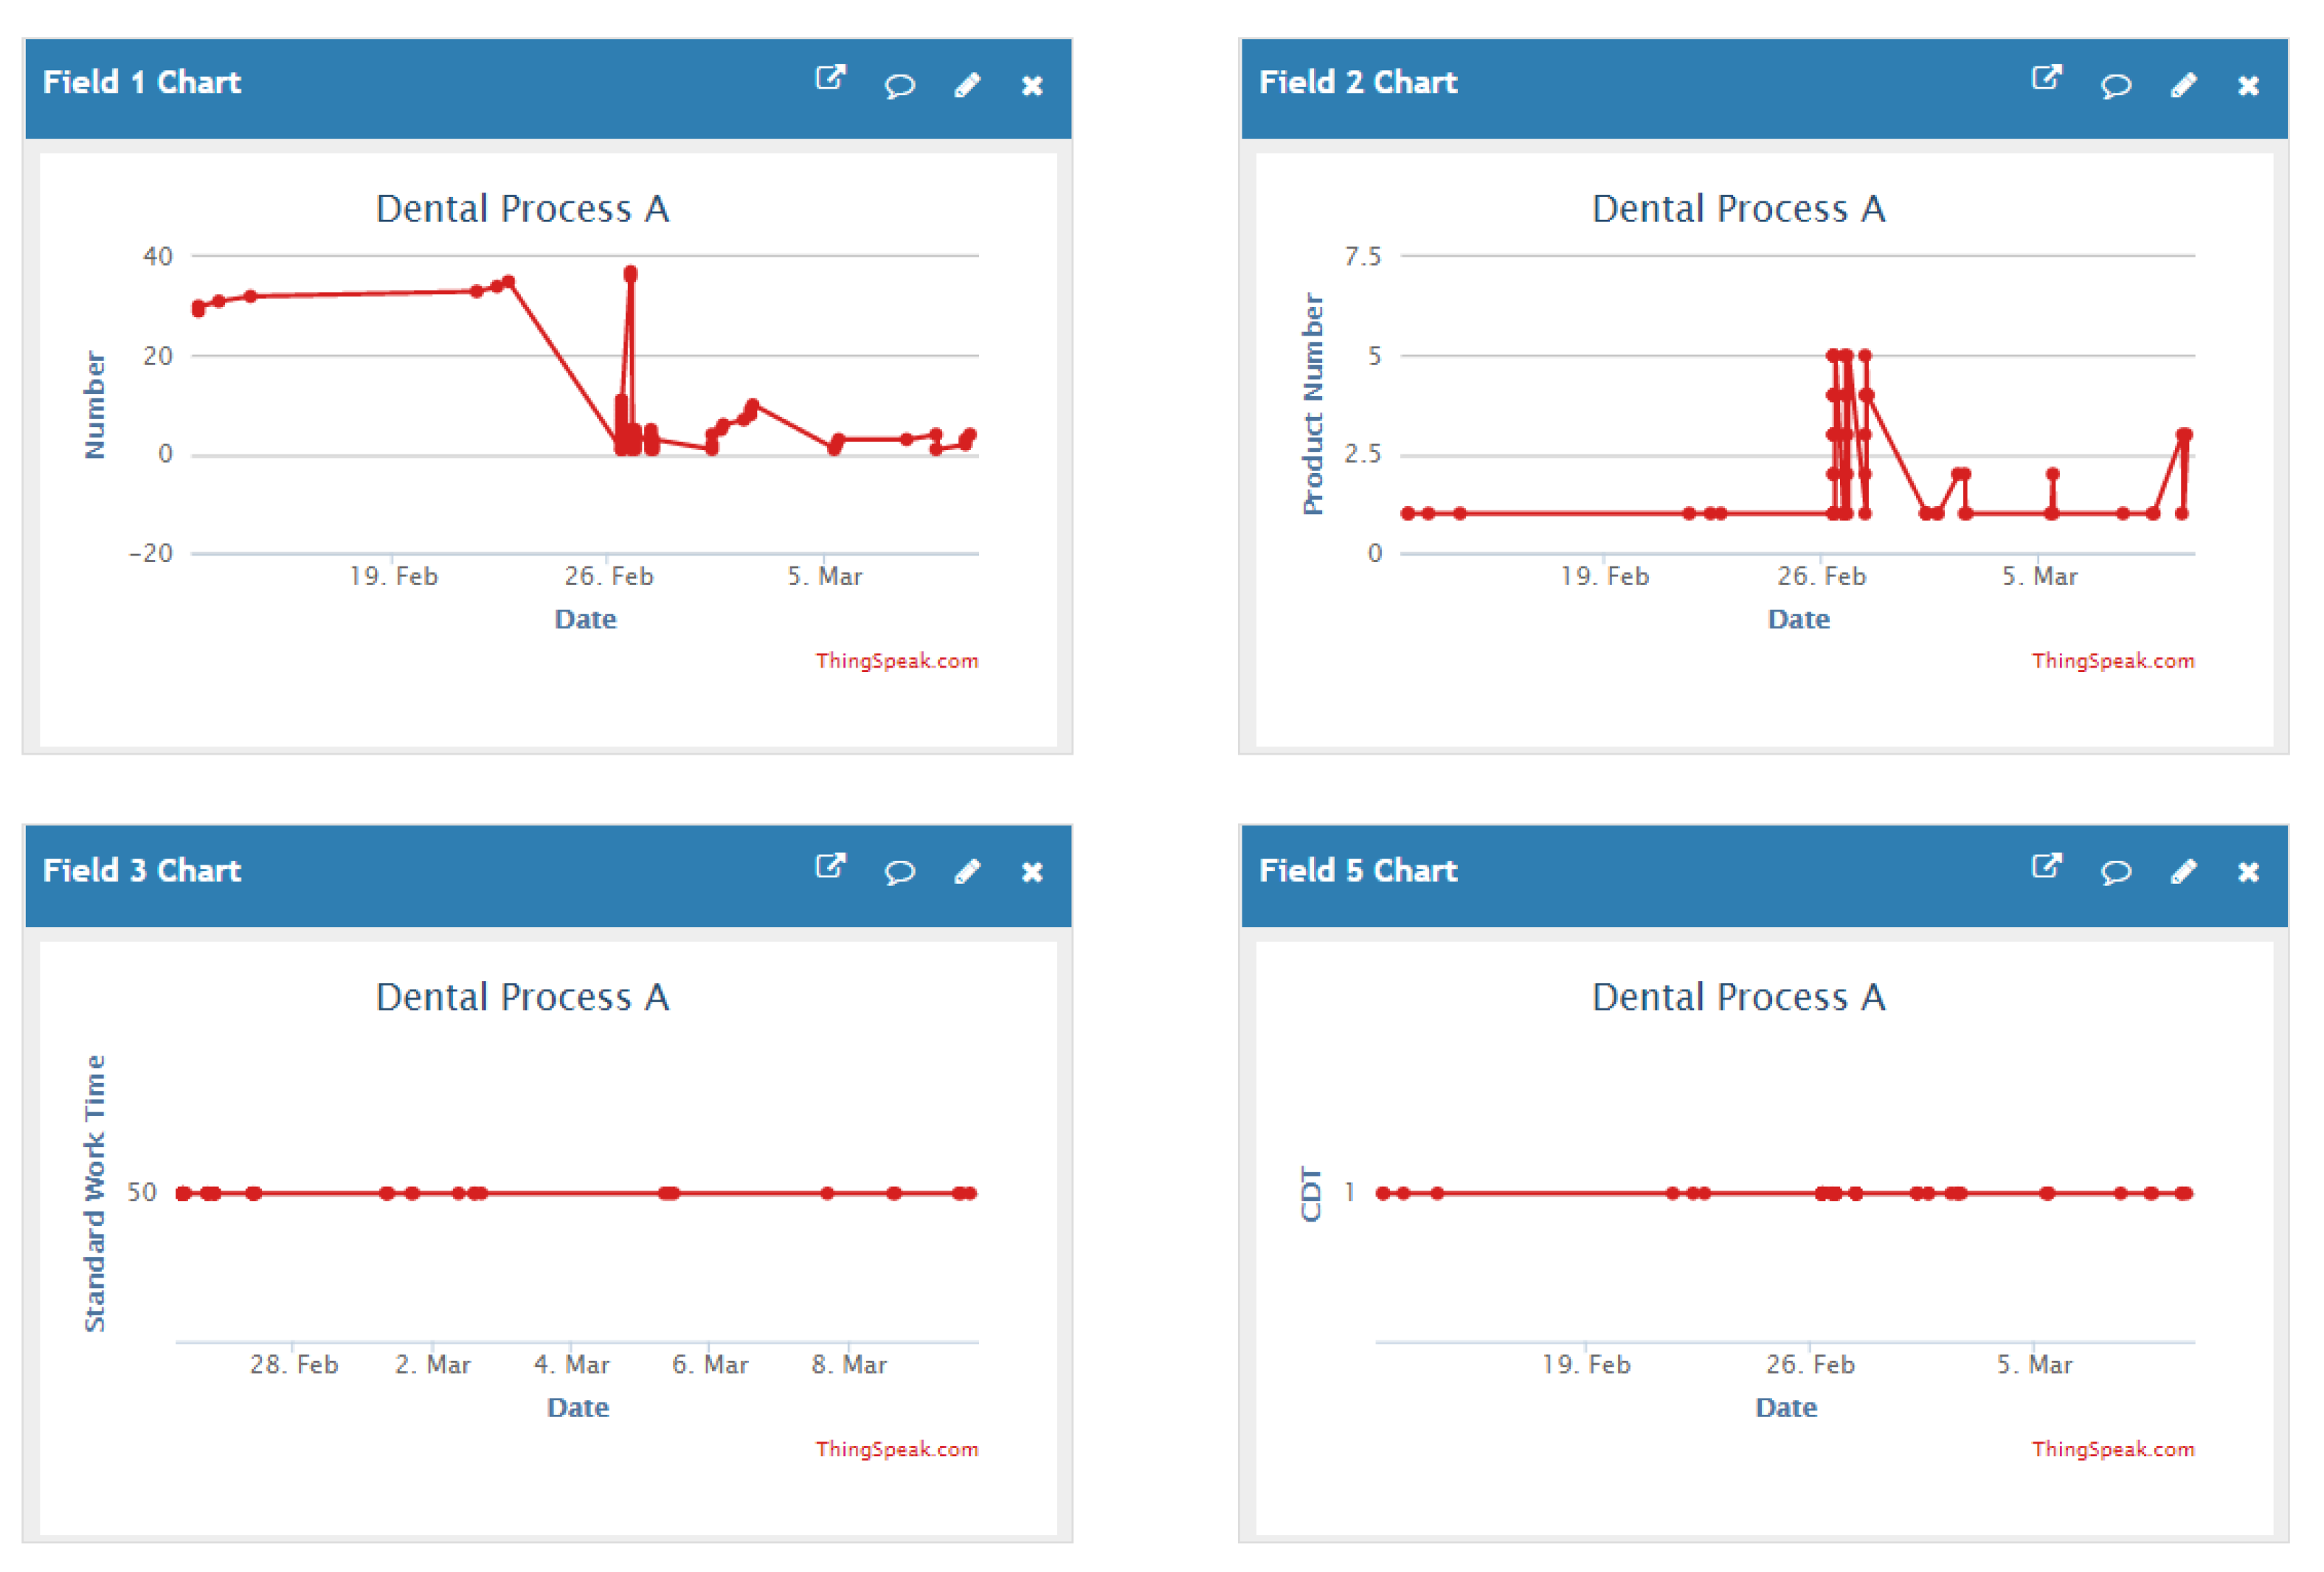
ThingSpeak cloud server: In order to quickly obtain the data from stations, this study used ThingSpeak for user authorization and graph presentation. The corresponding parameters could be shown by graphs and the amount of data shown could be chosen. The data processing service was divided into storage and retrieval. Soon after the dental technician completed the card swiping action, the data was uploaded to the cloud platform for storage. Users could export the data in CSV format. In the future, the stations and storage parameters can be expanded according to actual needs.
(3)
Amazon Cloud Server: The S3 database stored data of many parameters including tooth technician’s ID. According to this ID, the manager could identify each dental technician and obtain the relevant information from specific stations through the S3 database. The service layer provided various services in digital dental process management. Online agents were carefully set up by the security, load balancing, and backup service. In the future, users such as dentists and administrators do not need to plan and access services on their own. Instead, they can automatically receive services with safety and stability. All data at this level is only available to those who have authorization.

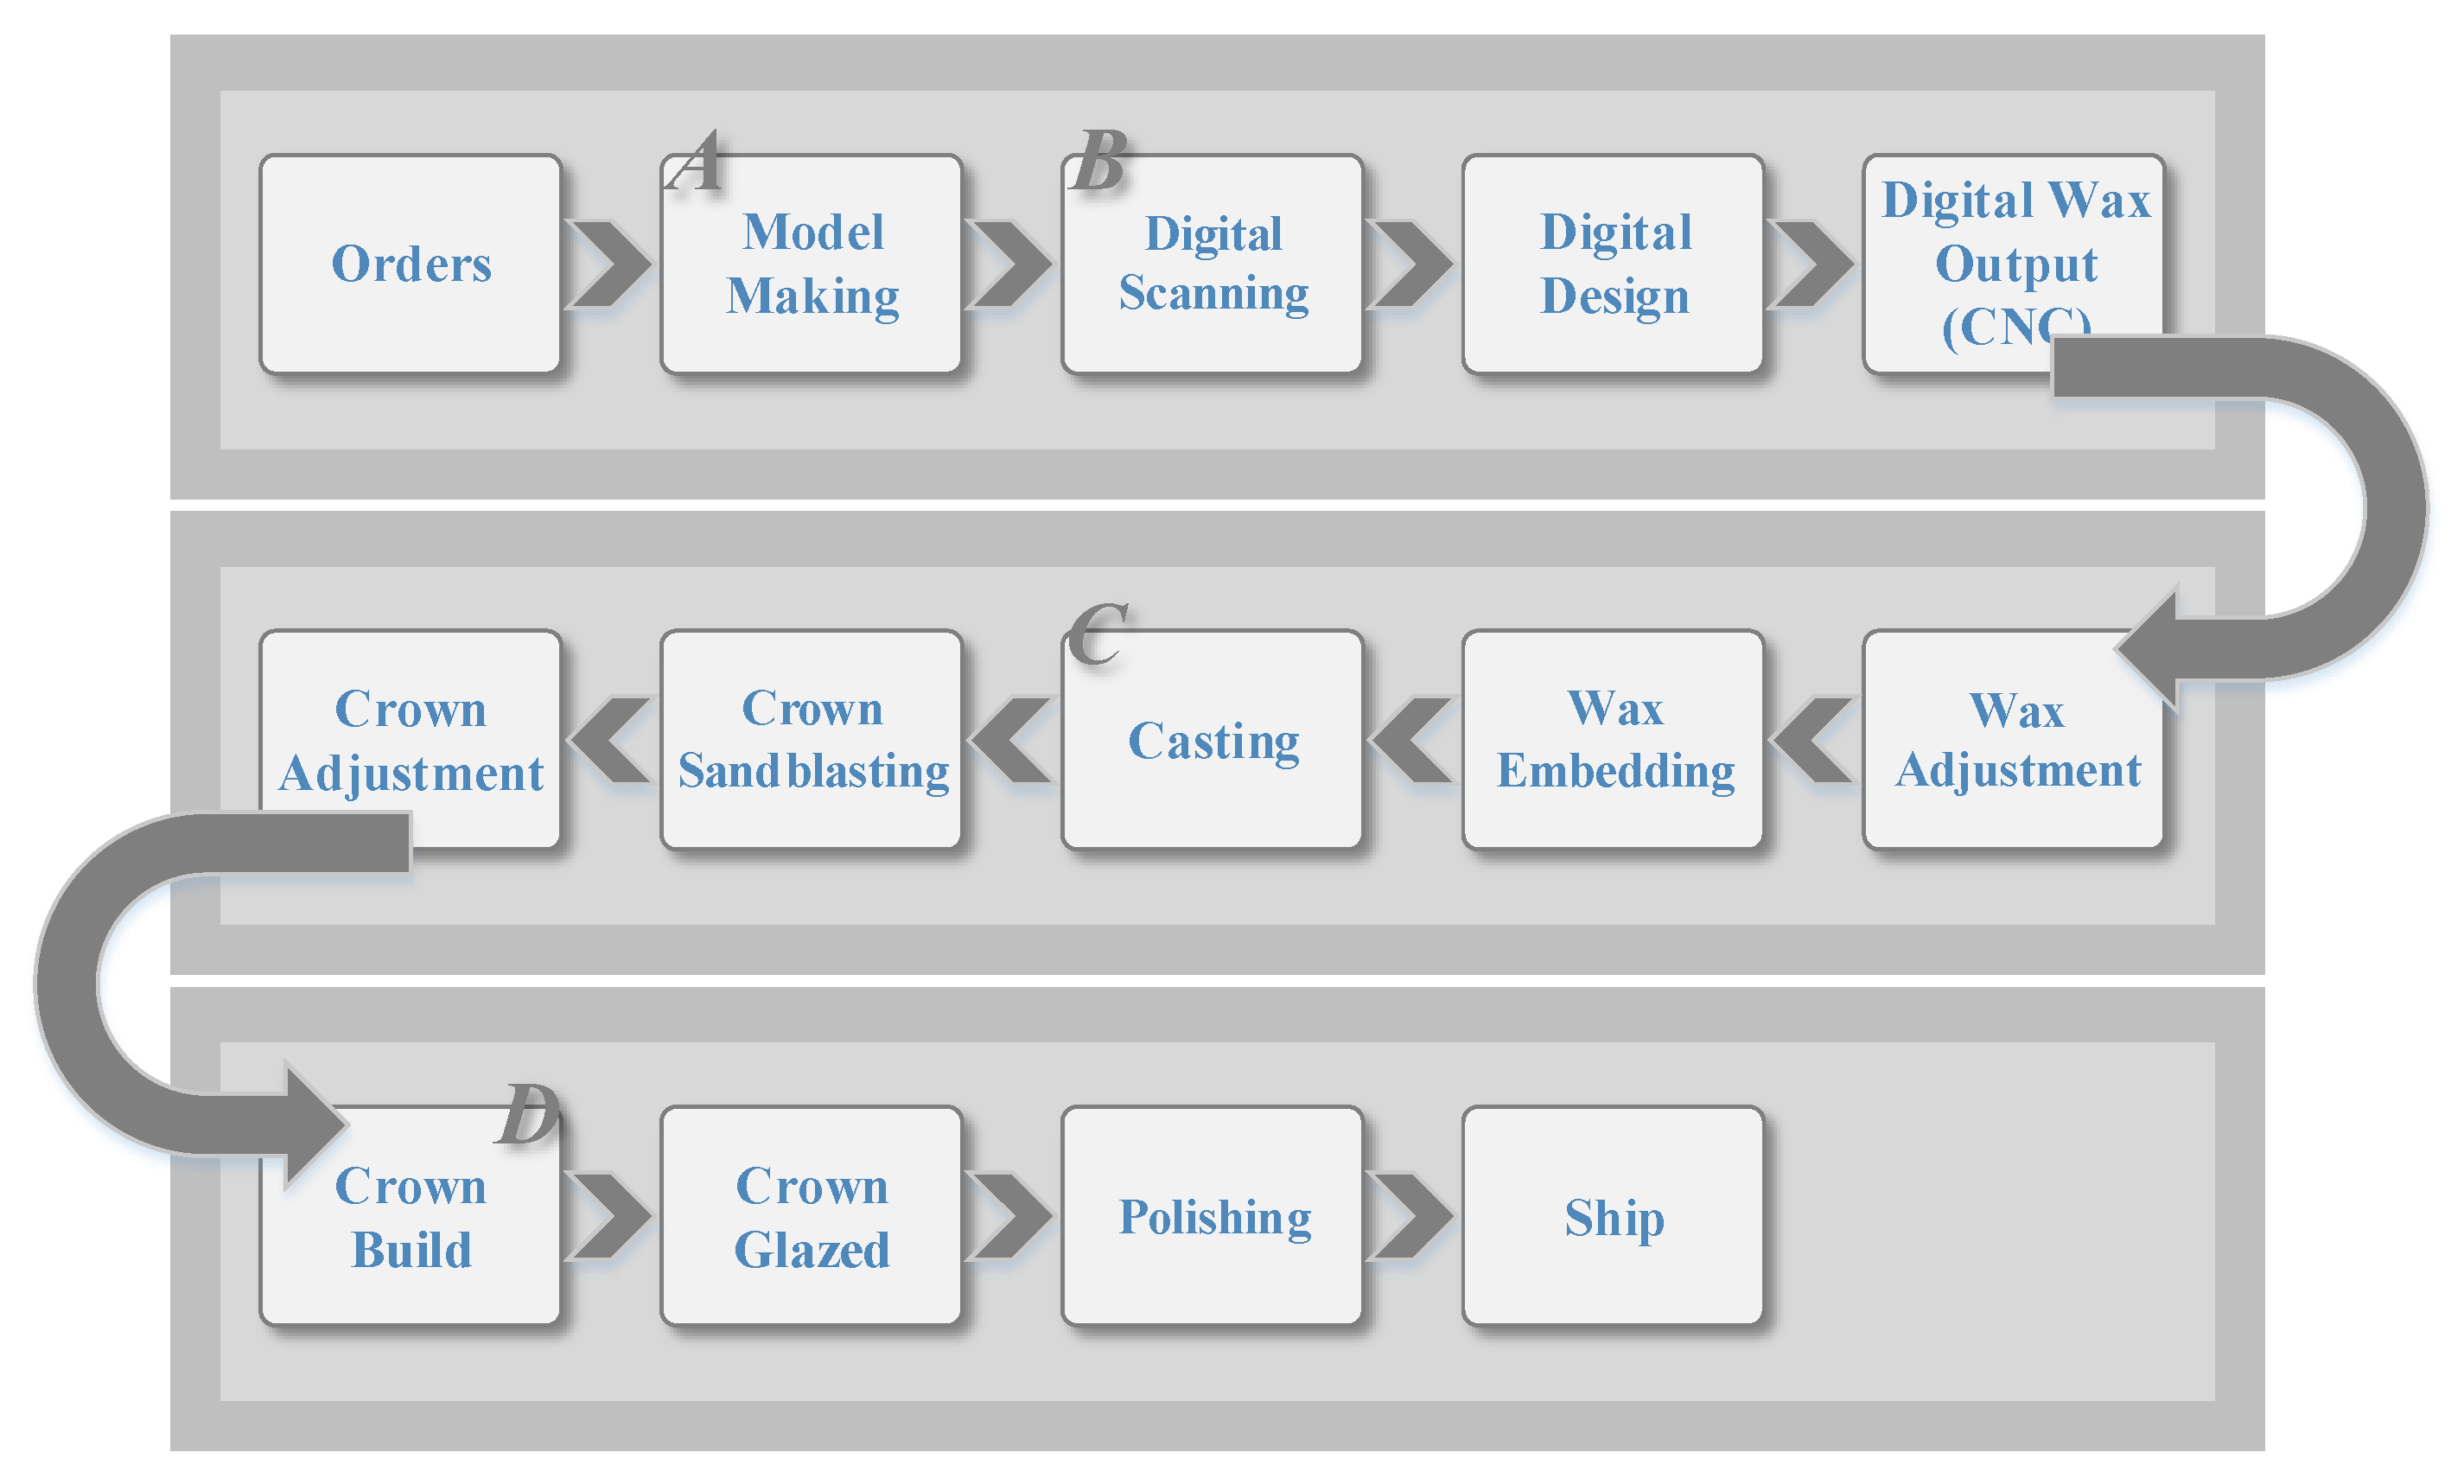
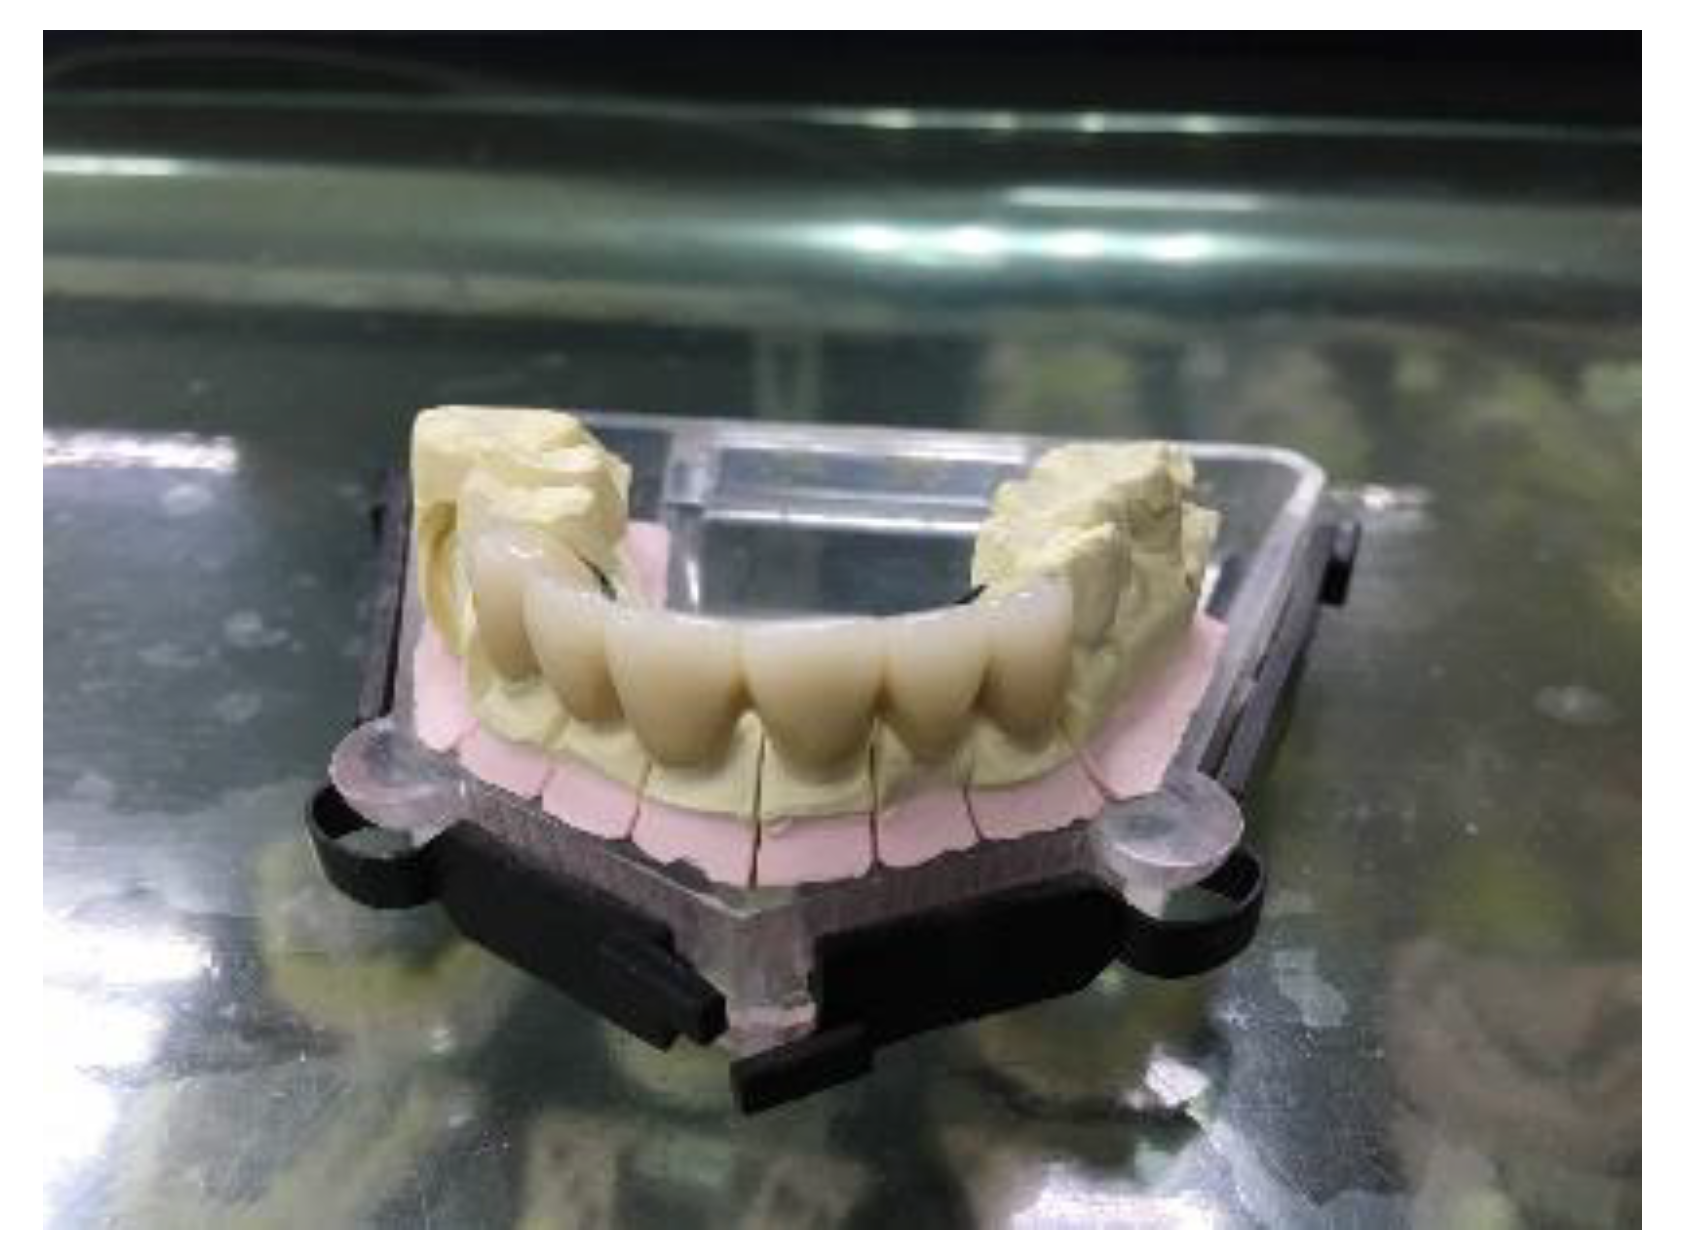
2.2. Denture Process Flowchart

The digital denture manufacturing process is shown in Figure 4. From the order acceptance to shipments, 14 complicated manufacturing procedures were required to produce prosthesis, as shown in Figure 5, that meet the doctor’s requirements. These manufacturing procedures were order acceptance, model making, digital scanning, digital design, digital wax output (CNC, Taipei City, Taiwan), wax adjustment, wax investment, casting, sandblasting of crown, crown adjustment, application of porcelain to surface, glazing of crown, polishing, and finally, shipment. After interviews with process managers and dental technicians (CDT), four procedures, including model making, digital scanning, casting, and application of porcelain to surface, were selected to set up RFID monitors at their corresponding stations due to their long processing time. The information of the CDT and his working hours during these four procedures were recorded.

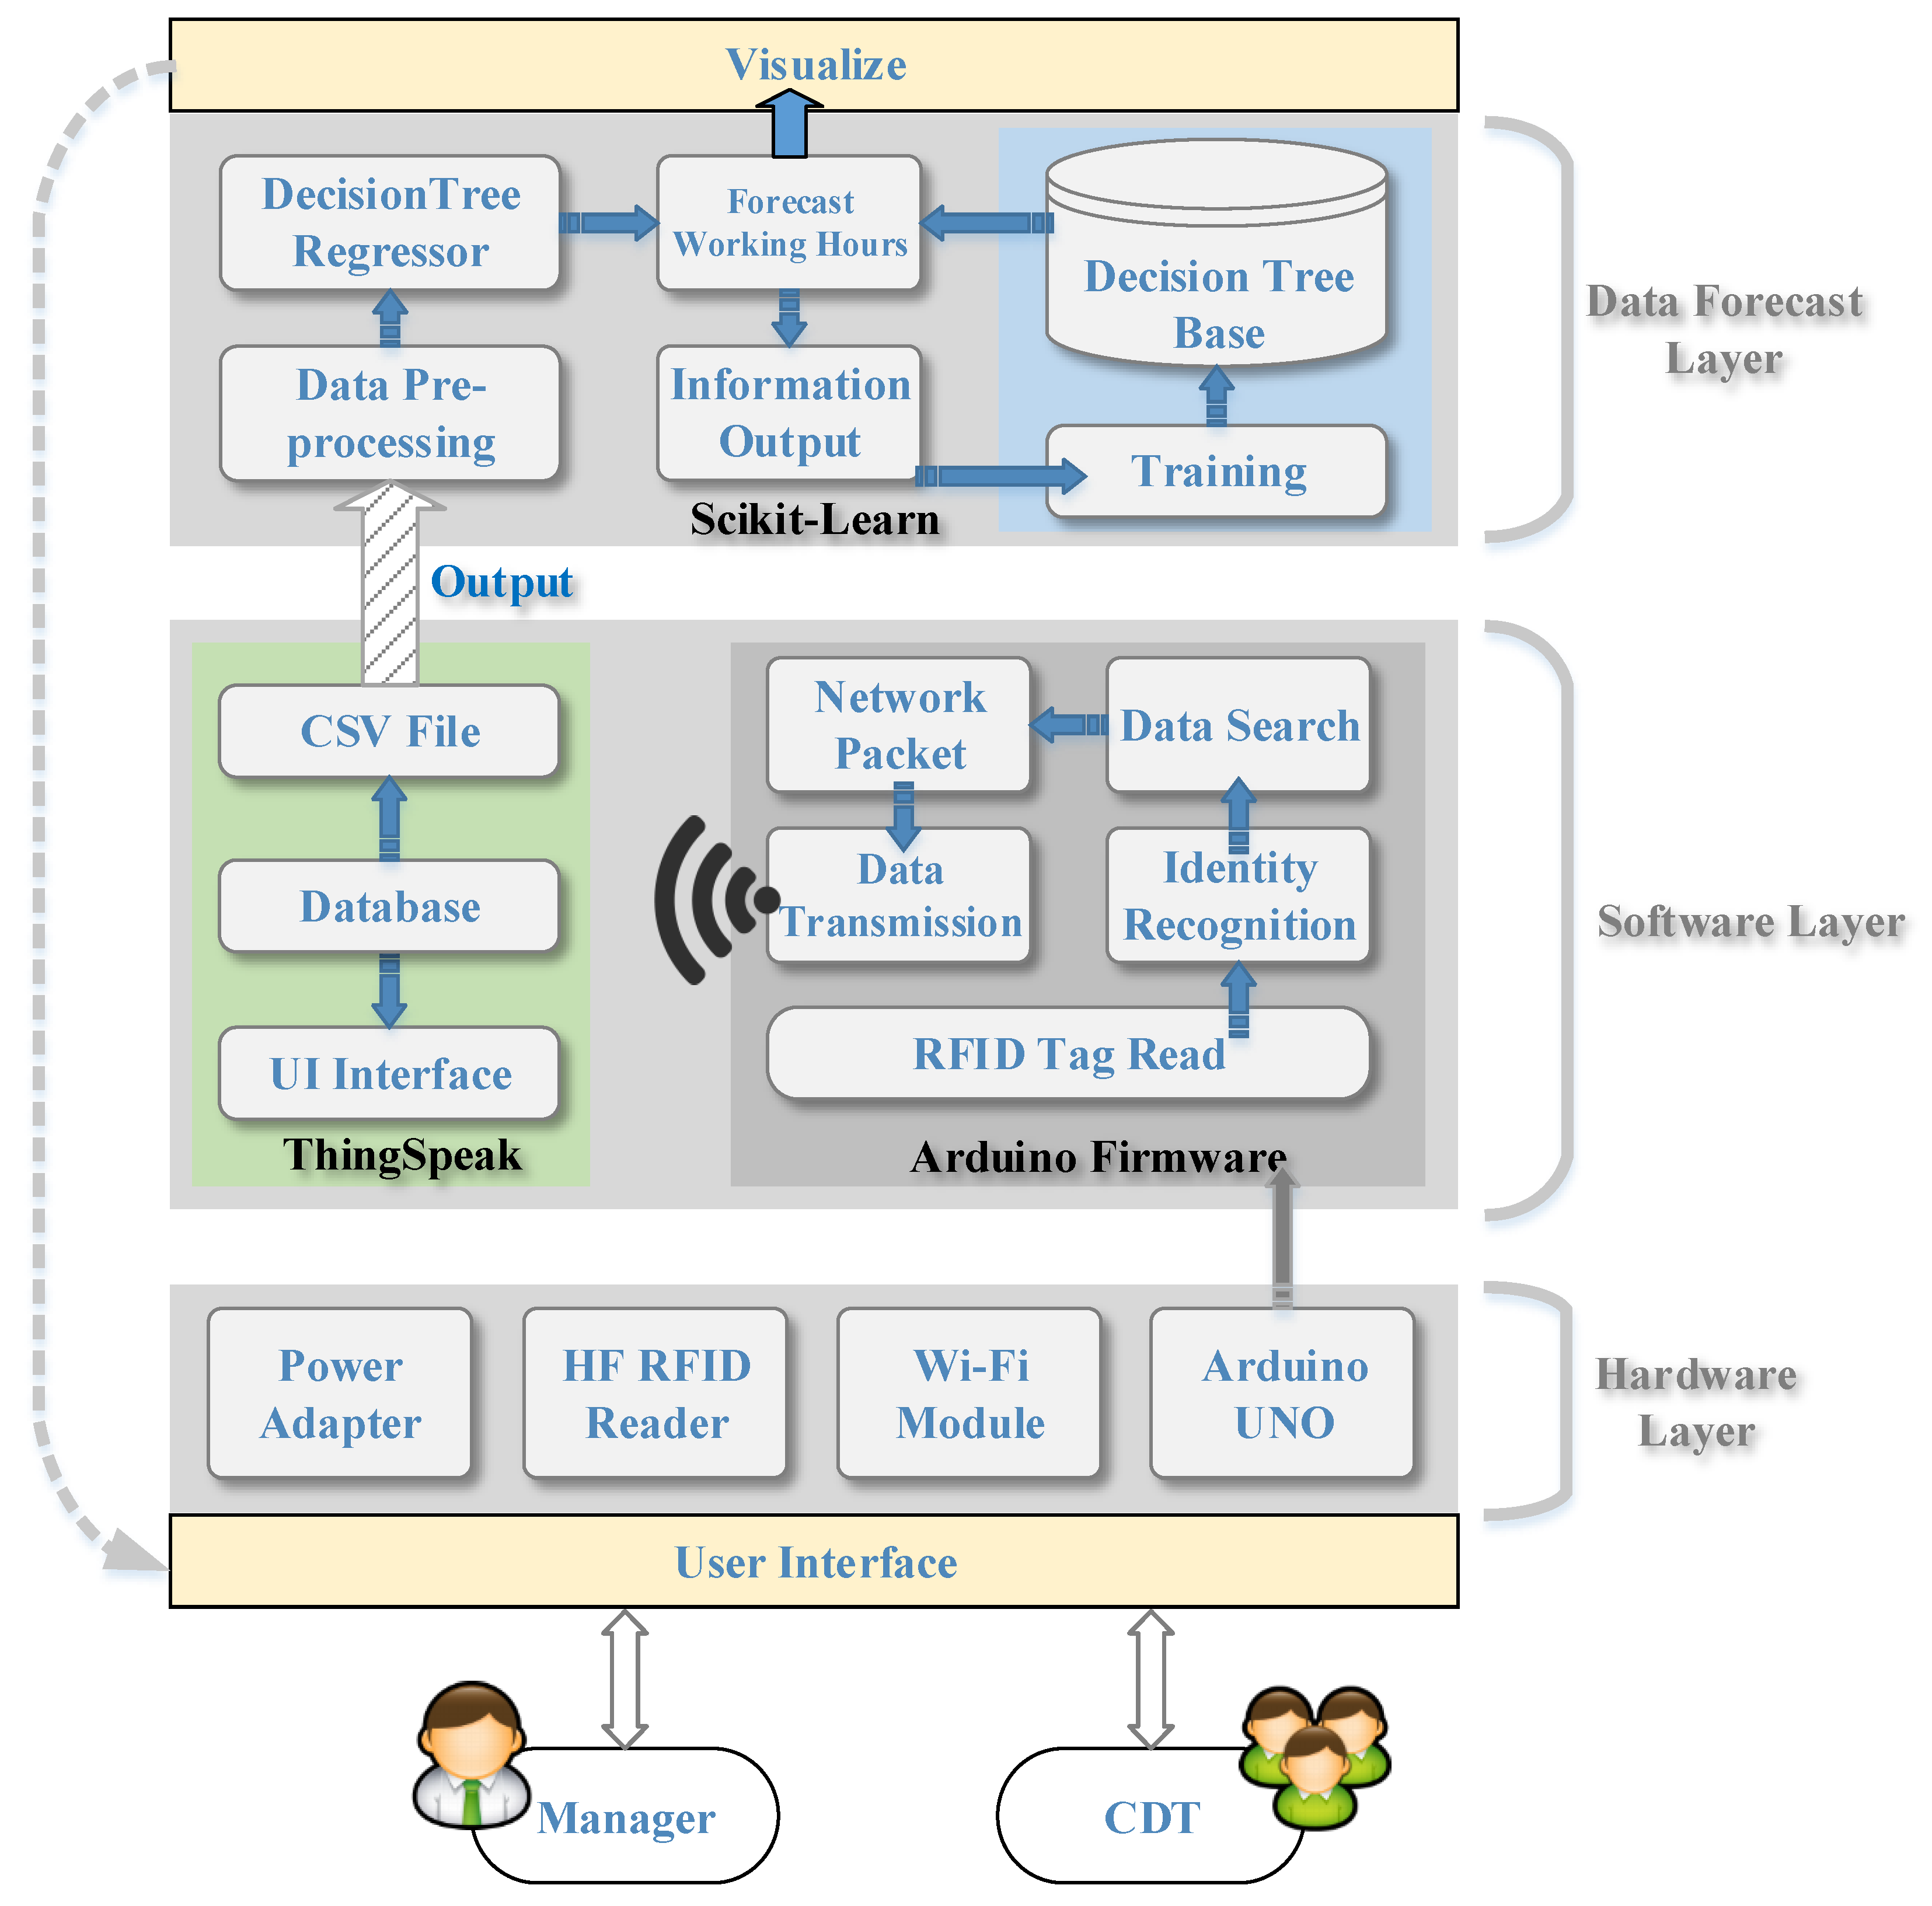
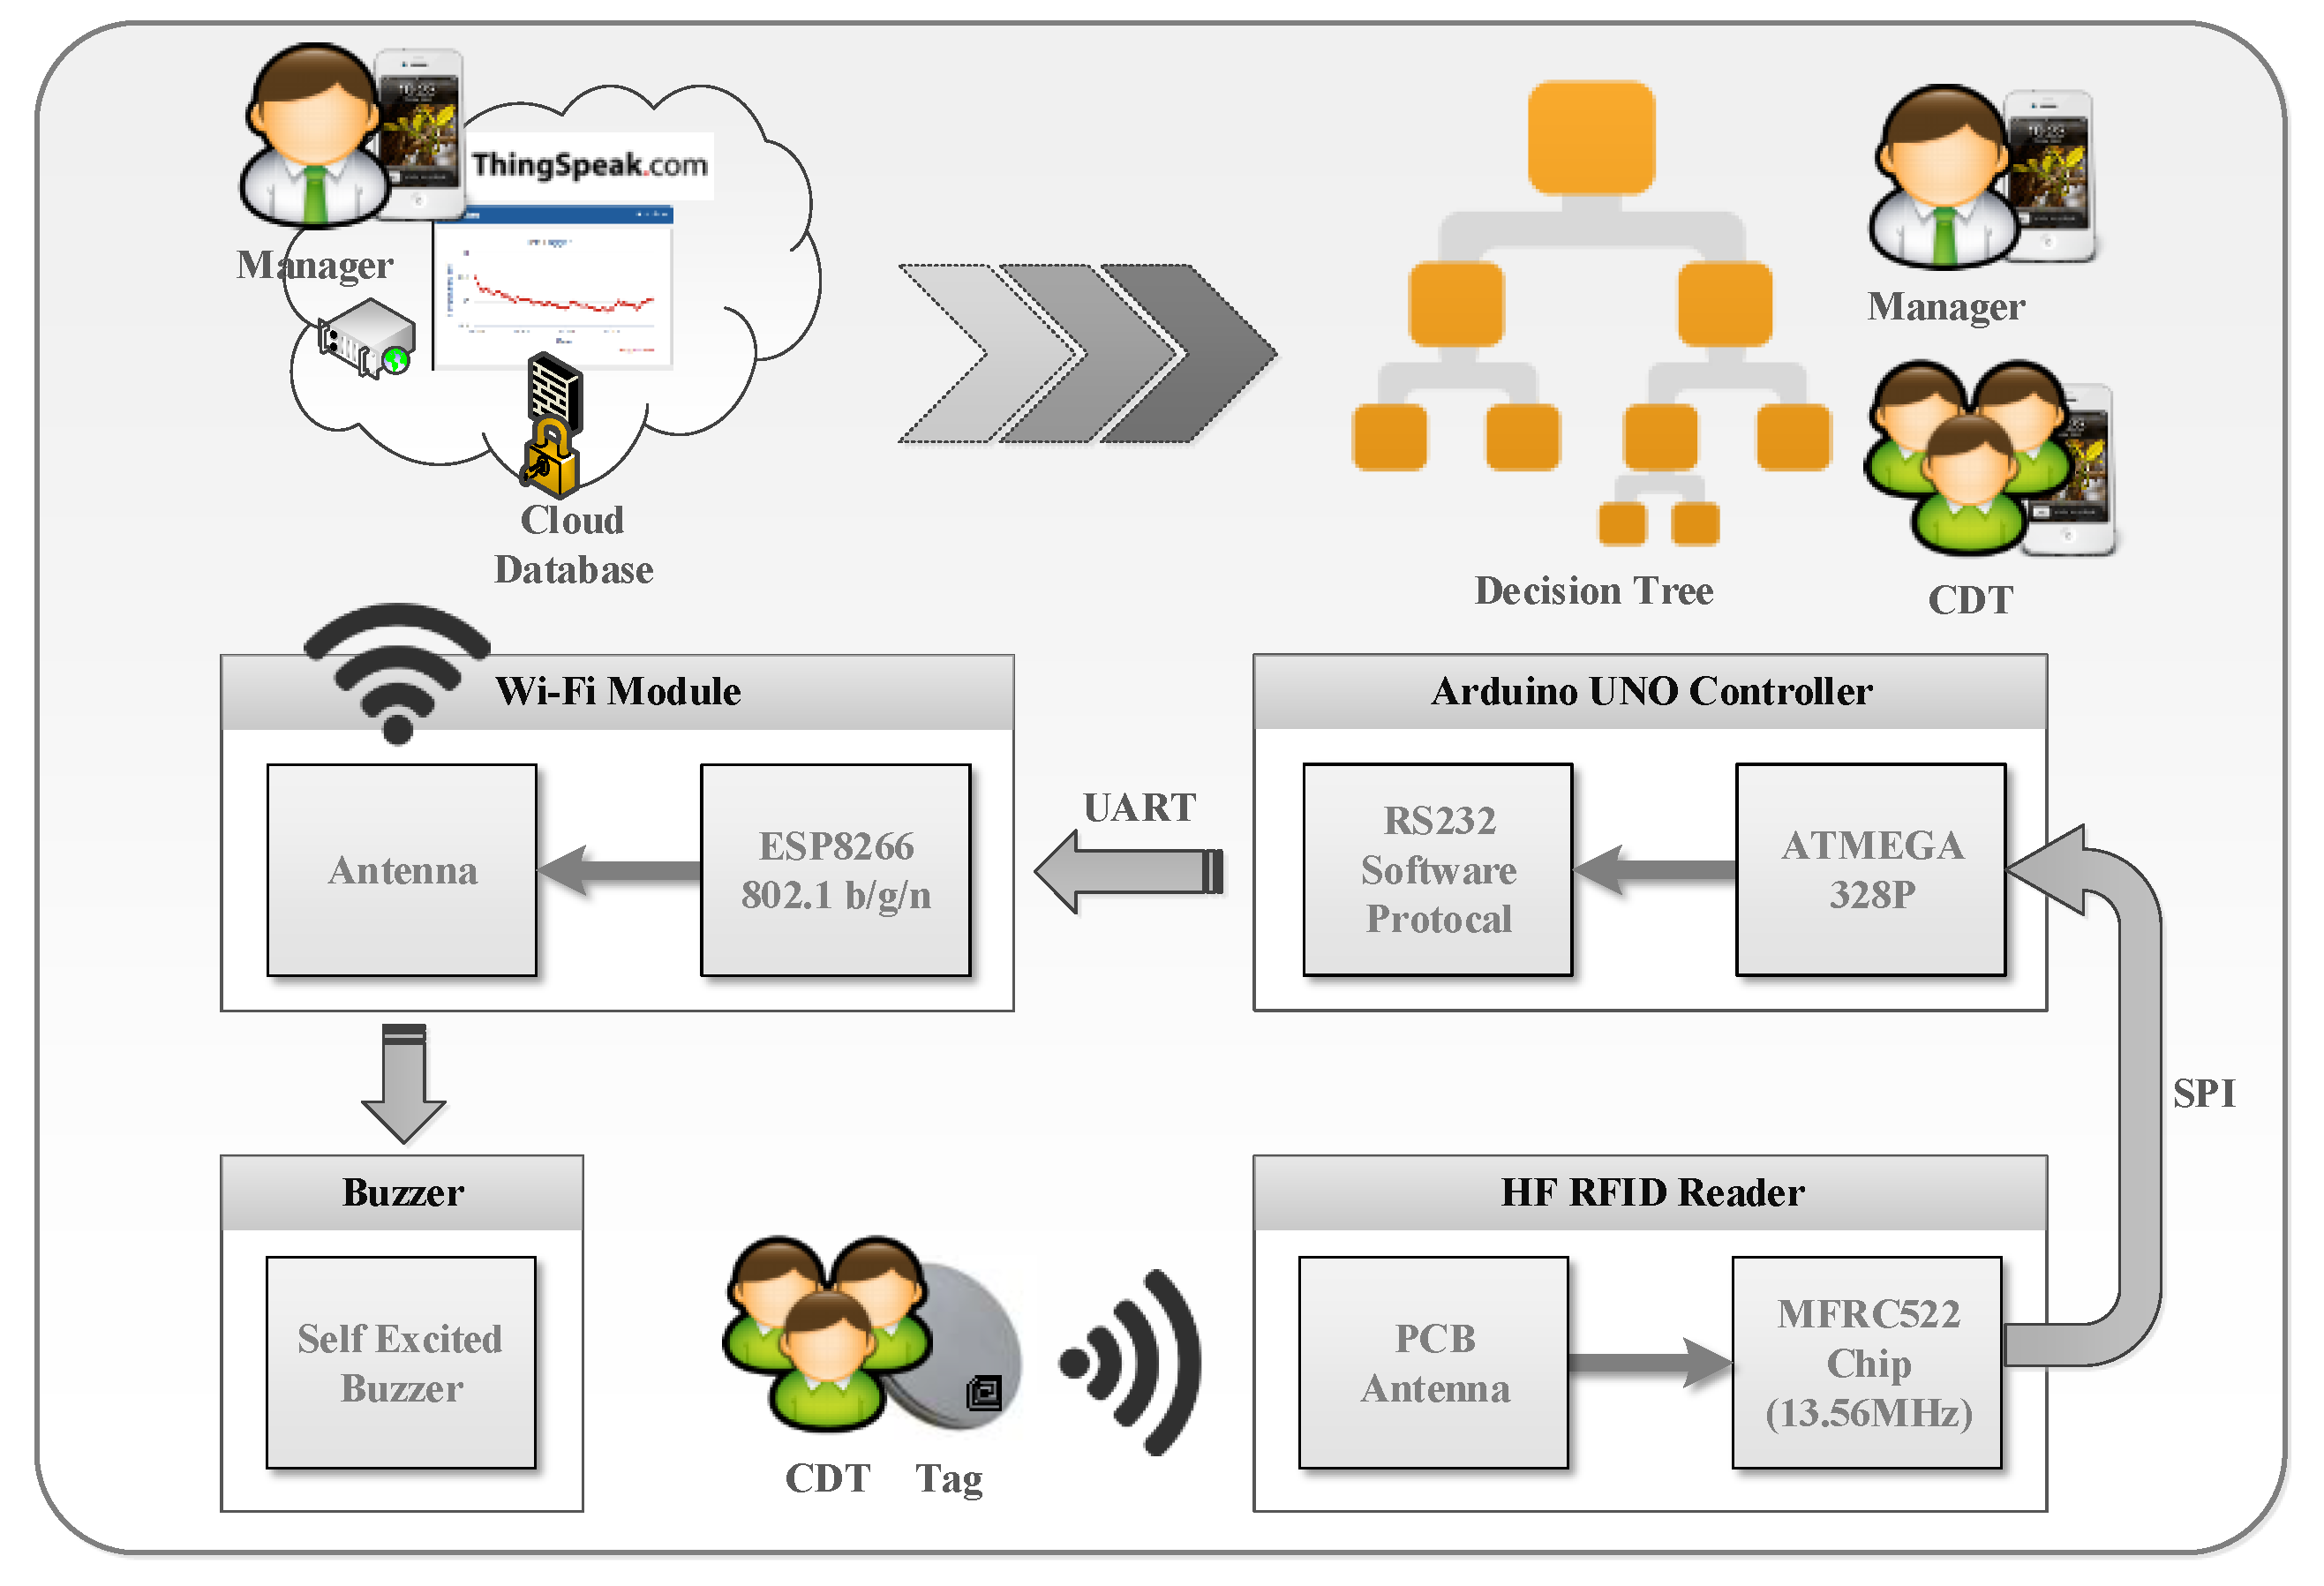
2.3. The System Framework

The system belonged to a three-tier architecture, as shown in Figure 6. From bottom to top, they were hardware layer, software layer, and data prediction layer. The hardware layer included power adapter, HF RFID Reader, Wi-Fi Module, and Arduino UNO. This layer was connected to the user interface and allowed managers and CDTs to monitor both the rationality of work hours at each station and the predictions by computer reasoning through the human–machine interface. In this layer, the Arduino control board served as the core to integrate Wi-Fi modules, high-frequency RFID readers, and system power supplies.
The software layer was divided into the Arduino module and the ThingSpeak module. The Arduino module was responsible for the data processing of each station. In each station, the CDT first swiped his card just before he started working. After he finished his work, he took the corresponding tag according to the number of prepared prosthesis and then swiped the card again. The computer system searched in the data bank to identify this CDT’s identity and his corresponding information. After the controller completed the data identification and processing, the controller packed the data into a TCP-IP-based communication protocol packet. Then, through the Wi-Fi and the wireless access, this pack was transmitted to the ThingSpeak website. In the ThingSpeak module, the ThingSpeak website served as the core of the data record. After analyzing the packet sent via the Internet, the information from each station was stored in the database. In the future, when there is a need for data analysis, the data can be converted into a CSV file output.
In the data prediction layer, the main component was the Python machine learning suite Scikit-Learn. By using this suit, the data output from the ThingSpeak database was preprocessed. Then, data processing and forecasting was done by the model developed by the Decision Tree Regressor and the decision tree library. The results were visualized on the human–machine interface as a feedback to the user. Finally, the model was retrained and then stored in the decision tree library.

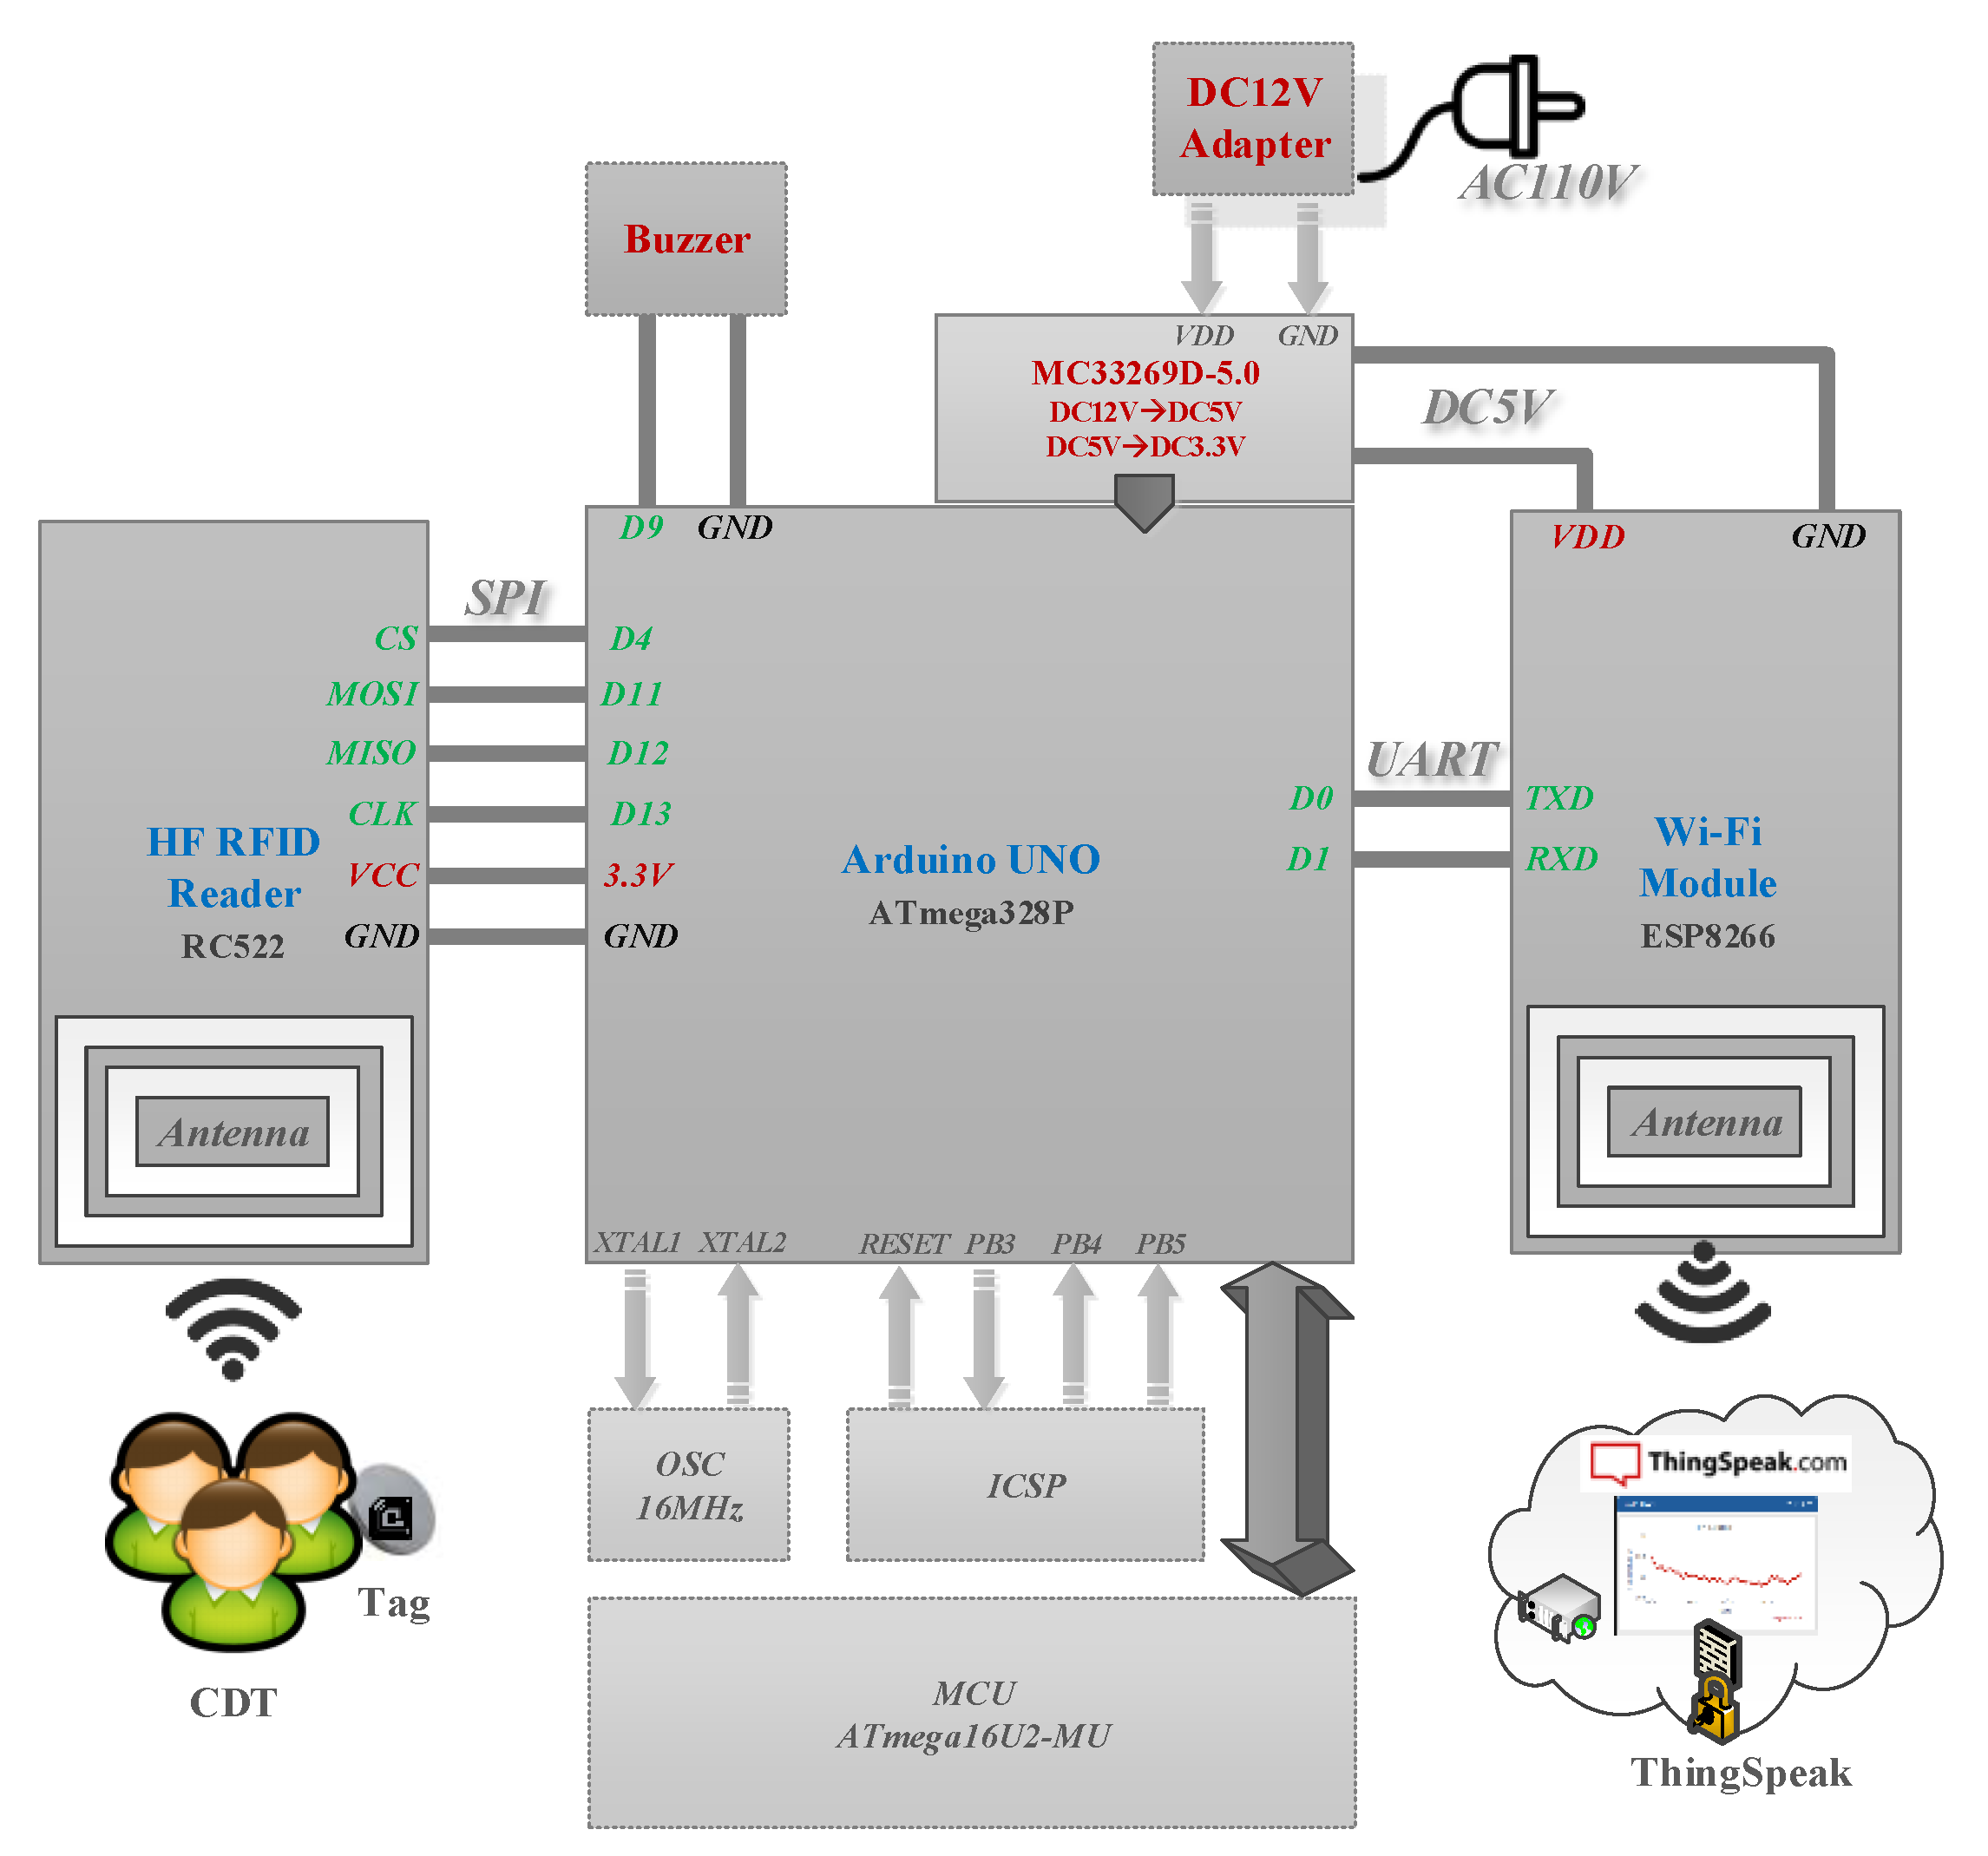
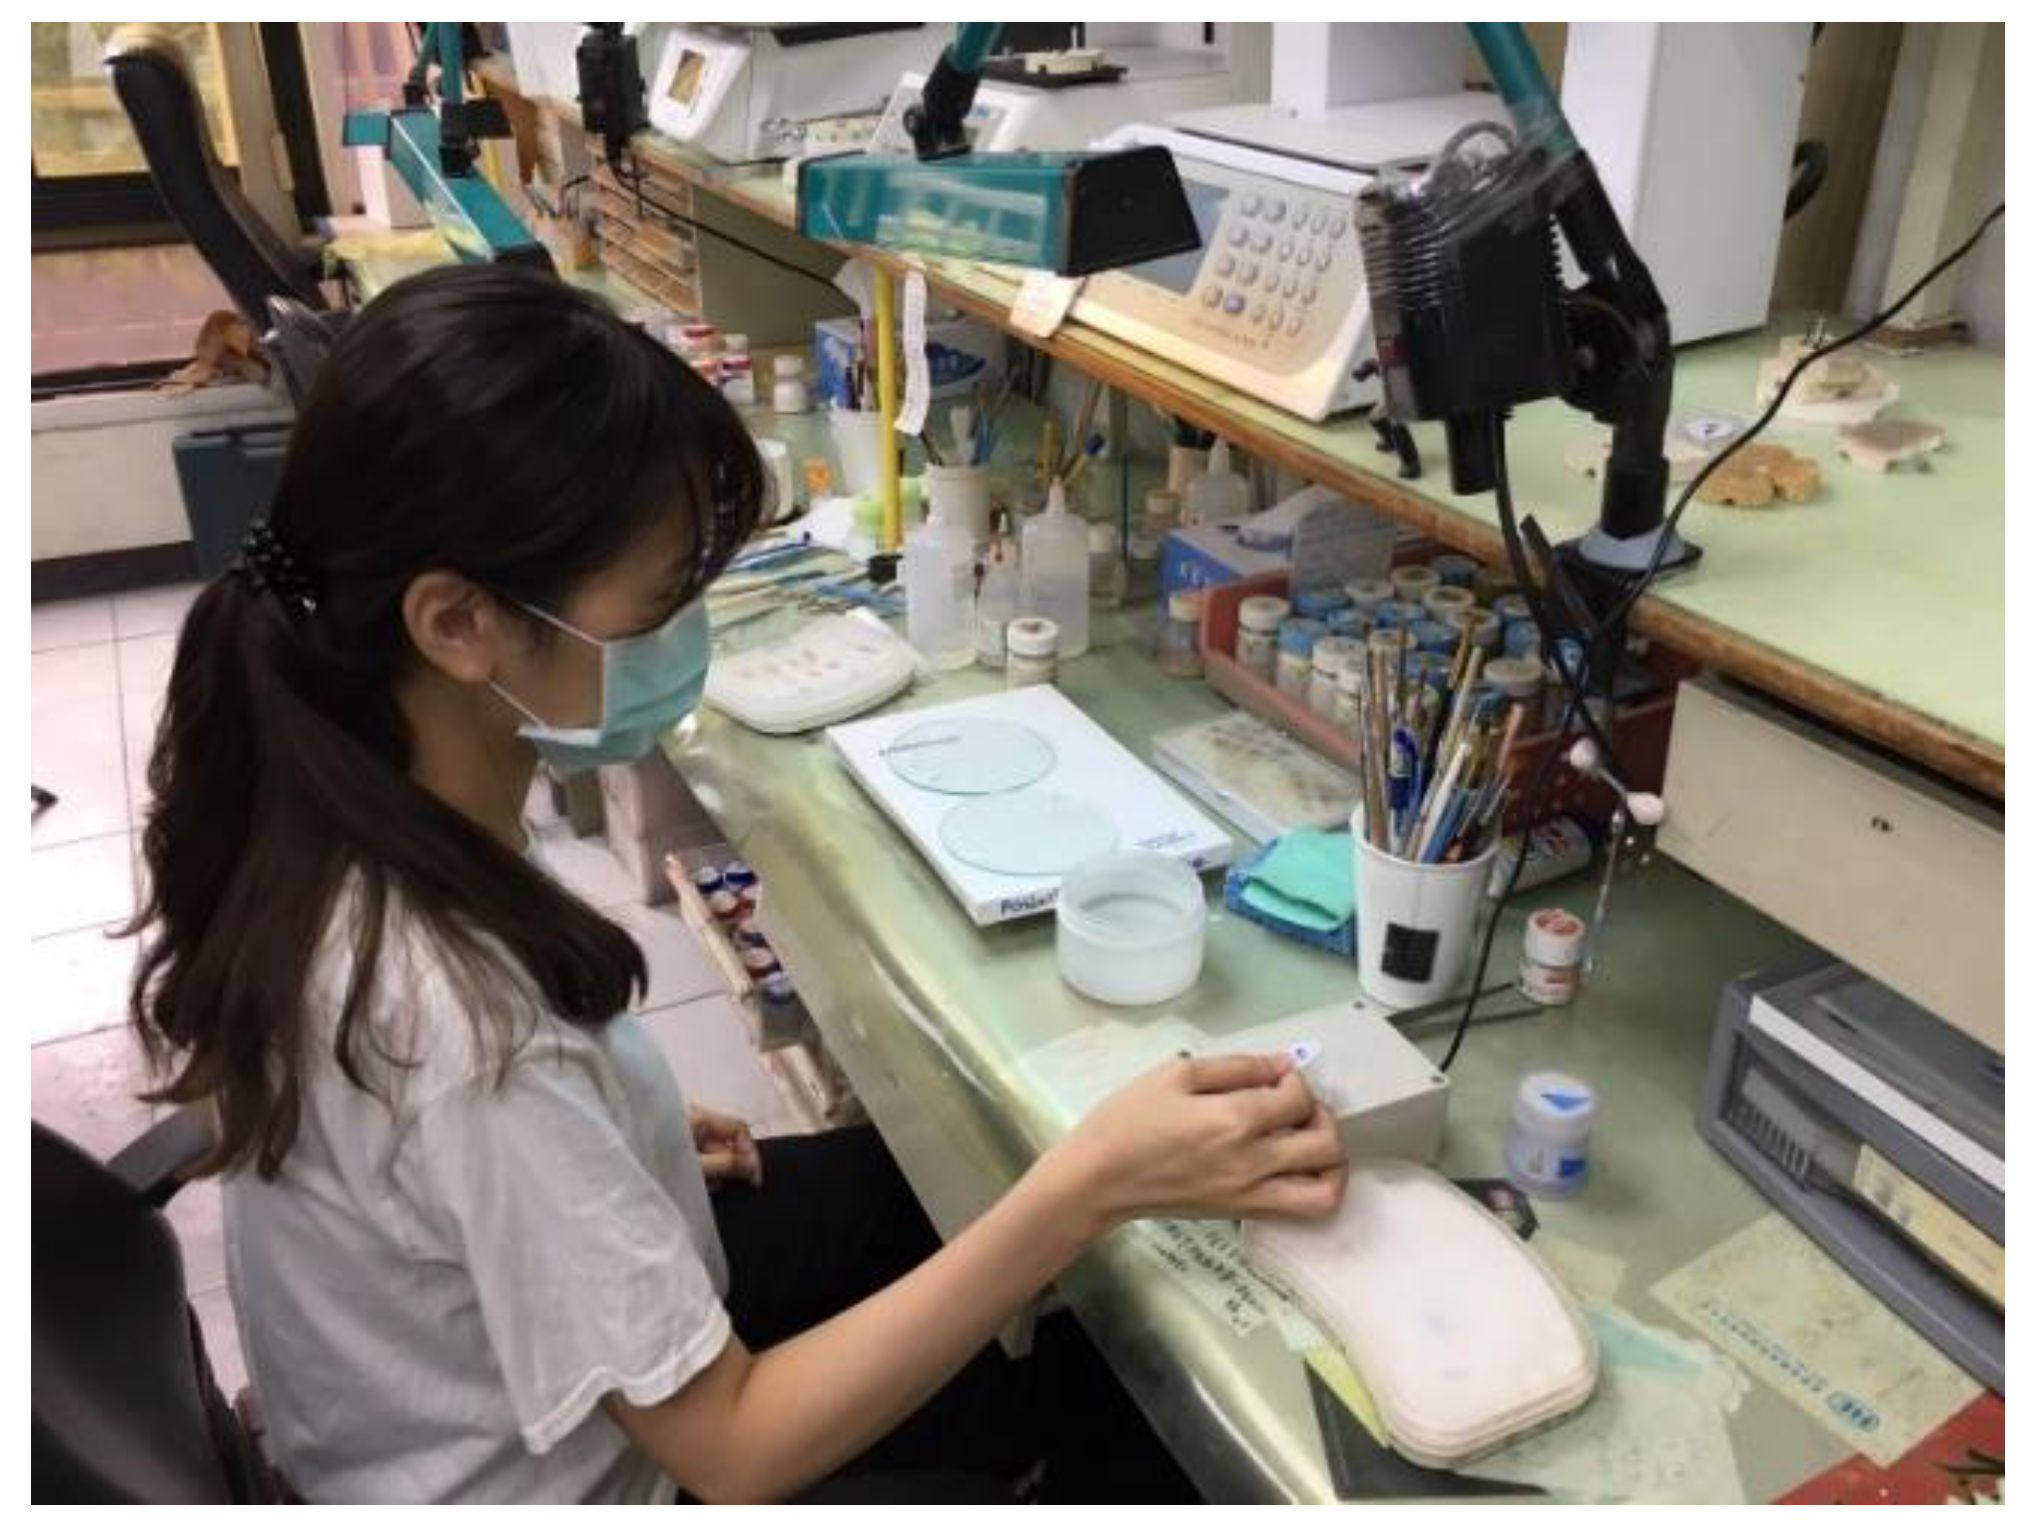
2.4. The Hardware Development

The hardware architecture of each station is shown in Figure 7. The Arduino UNO control board was used as the core to communicate with the 13.56 MHz high-frequency RFID reader through the SPI communication protocol. When the CDT started and ended his work, the corresponding tag was scanned. When the scan was complete, the controller sent a high-level electric potential to trigger the buzzer, giving a sound to inform the CDT that the data had been completed. Moreover, the controller transmitted the packed data to the Wi-Fi module through UART communication every 20 s, and then the packet was transmitted to the ThingSpeak website for storage and display.
The control circuit block is shown in Figure 8. The system power supply performed the conversion between AC and DC through the transformer. After conversion, the output voltage was 5 V. Then the LDO stepped down the 5 V to 3.3 V for the RFID Reader. The core of the control circuit was the Arduino UNO control board, in which the ATmega328P 8-bit microcontroller was the core. The buzzer was self-stimulating. When the output exceeded the high electrical potential level, it emitted a sound to inform the CDT about the status of the station. The Wi-Fi module was ESP8266, which supported 802.1 b/g/n communication protocols. It connected the RXD pin with D1 pin for data transmission and was mainly responsible for transmitting data of the CDT and the station to the cloud of ThingSpeak.

2.5. The Process of Decision Tree

Inferences of reasonable work hours were calculated by the method of decision tree with three steps: (1) data collection and preprocessing; (2) organization of process information; and (3) establishment of the decision tree model. In the first step, the data of denture manufacturing process collected by Thingspeak was preprocessed. The data included the serial number, start time point, end time point, product name, standard work hours, and CDT identity such as seniority, levels of techniques, and responsibility. Twelve days of information were collected and finally 265 documents were obtained. In the second step, the decision table (Table 1) of work hours for each denture process was established after data preprocessing in the first step. After the normalization of all parameters shown in Table 1, the information entropy (Info) of all samples set was calculated by Formula 1 to establish a decision tree model. Information entropy was a value that described the degree of information variability. Larger values indicated higher variability. Then, the information entropy of each parameter, calculated by Formula 2, was subsequently used by Formula 3 to get the information gain as shown in Table 2. The largest value was used as the root node. These steps were repeated to get nodes of each branch, subtree, and leaf. Finally, the whole decision tree model was established.
I n f o = j = 1 m p i l o g 2 p i
where m is the decision type and pi is the probability of the decision.
I n f o A = j = 1 v p j I n f o ( A j )  
where v is the type of the parameter, pj is probability of the parameter, and Info(Aj) is the information entropy of the parameter.
Gain ( A ) = Info I n f o A
The reasonable working hours for each process site are shown in Table 2. The maximum working time was 150 min in site D, and the minimum work time was 20 min in site C. Whether the decision tree model was overfitting was confirmed by comparing the working time calculated by the decision tree model with the real RFID-recorded working time shown in Table 2. If an overfitting phenomenon was confirmed, further training and adjustment of the decision tree model was needed after requiring more data.

3. Results and Discussions

The testing has been done in the Fu-Ji Dental Laboratory. After testing, the working sensing distance of the RFID reader was around 2–3 cm. The scanning and recording of the RFID could be completed within 2 s. The following section explains the actual implementation of the system, including the collection and analysis of experimental data and the usage of decision tree methods to discover the most significant factor that affects the reasonable working hours.

3.1. Data Collection

The CDT swipes the tag when she starts and ends working in the station (Figure 9). The data is transmitted to ThingSpeak via Wi-Fi. Only when the transmission is successfully done does the buzzer sounds. After ThingSpeak successfully receives the data, the data is presented as graphs shown in Figure 10. The upper left graph shows the serial number, which represents the number of swipes at the station and is recalculated if there is a break. The upper right graph shows the serial number of the product, representing the number of prostheses made. The lower left graph shows the standard working hours, recording the reasonable working hours of CDTs. The bottom right graph shows the CDT identification code, which records the information of CDT in the station.

3.2. The Experimental Results of Decision Tree

The information gain for each parameter by calculation is shown in Table 3. The gain was highest in both technical level and seniority, followed by working period and responsibility. It indicates that the level of techniques and seniority affect the reasonable working hours for manufacturing prostheses the most, followed by the working period, and responsibility affects the least. Based on this result, a decision tree model with reasonable working hours was constructed in Figure 11. When the level of techniques was low, more time would be spent for manufacturing prostheses. When the level of techniques was high, mostly the working hours would not exceed the reasonable working hours. When the level of techniques was intermediate, only in the morning the working hours would not exceed the reasonable working hours. In addition, the similar gain of technical level and seniority may be because, generally, a senior CDT has a higher technical level. It is not easy for a novice to have high levels of techniques.
When planning a prosthesis producing schedule, managers can know the number of prostheses that can be produced based on the prediction results of reasonable working hours from the decision tree. When there are large and urgent orders, the manager can check whether enough prostheses can be produced to fulfill the customer’s requirements by the current schedule. By this way, the production delay by erroneous decision making can be avoided, thus saving costs and labor.

4. Conclusions

This study was mainly conducted in Fu Chi Dental Laboratory. A total of 265 documents have been collected from the four stations. Four CDTs’ data, including seniority, level of techniques, and responsibility, have also been input into the system. A decision tree model has been developed to predict the reasonable working hours in four stations. From analyzing these 265 documents using our developed decision tree model, the level of techniques and seniority were demonstrated to influence the reasonable working hours in each station the most. This finding will help the manager to hire better qualified CDTs and arrange the prosthesis manufacturing schedule. However, due to the low number of the currently collected documents, the prediction accuracy of reasonable working hours might be affected. More documents are needed to increase the prediction accuracy. In addition, when more CDTs are included, the system needs to continuously collect processing data and perform further training to verify whether the actual working hours of each station is consistent with the predicted classification results to improve the prediction accuracy.
In the next step, we aim to improve system availability and prediction accuracy by the following directions:
(1)
The cloud server and website will be included to allow users to remotely operate the system by browsers on mobile equipment, which will better fit the commercial needs for dental laboratories.
(2)
More data will be collected to retrain the system and then improve the prediction accuracy of decision tree classification. Training and model evaluation will be conducted every three months. When the data reaches a big scale, data analysis will be done by using Spark’s big data computing platform to improve the efficiency of computing performance.
(3)
Whether the overfitting phenomenon of the decision tree model exists or not should be further tested by comparison between the real working time and the estimated reasonable working time. By this way, the decision tree model will be more optimized.
(4)
Artificial neural network and SVM support vector machine algorithm will be utilized to compare with the decision tree on the aspects of classification accuracy and application indications.

Author Contributions

Y.-J.C., Y.-S.L. and C.-J.Y. co-designed the research. F.-C.C. and Y.-C.C. performed the experiments. M.-H.C. provided analysis of the experimental data and evaluated the results. M.-H.C. and C.-J.Y. wrote the manuscript.

Acknowledgments

The authors would like to thank the Office of Research and Development in National Pingtung University of Science and Technology for financially supporting this research.

Conflicts of Interest

The authors declare no conflict of interest.

References

  1. Zhang, C.Y.; Zhou, W.K. 2017 Medical Device Industry Yearbook; Industrial Technology Research Institute of Taiwan: Hsinchu, Taiwan, 2017. [Google Scholar]
  2. Yen, C.W. Development Strategies for Medical Devices Industry: An Empirical Study of the Digital Dentistry Industry. Master’s Thesis, Department of Business Management, NSYSU, Kaohsiung, Taiwan, 2014. [Google Scholar]
  3. Executive Yuan. Taiwan Productivity 4.0 Initiative; Executive Yuan: Taipei, Taiwan, 2015. [Google Scholar]
  4. Lin, H.T. Implementation of Industry 4.0 Production Line for Intelligent Manufacture—A Case Study on Production Test Line of Notebooks. Master’s Thesis, Executive Master of Business Administration, THU, Taichung, Taiwan, 2015. [Google Scholar]
  5. Chen, S.Y. The Planning and Implementation of Product Data Management System in the Industry 4.0 Environment. Master’s Thesis, Graduate Institute of Industrial Management, NCU, Taoyuan, Taiwan, 2015. [Google Scholar]
  6. Yang, S.T. Introduce Industrial 4.0 and the Internet of Things (IoT) into Small Business FAB to Enhance Operation Efficiency—Plastic Injection FAB for Example. Master’s Thesis, Executive MBA Program, NSYSU, Kaohsiung, Taiwan, 2016. [Google Scholar]
  7. Tsai, M.J. Applying Object Oriented Design Structure Matrix to Design the Realtime Monitoring System of Industry 4.0. Master’s Thesis, Graduate Institute of Industrial Management, NCU, Taoyuan, Taiwan, 2016. [Google Scholar]
  8. Lian, K.Y.; Hsiao, S.J.; Sung, W.T. Intelligent multi-sensor control system based on innovative technology integration via ZigBee and Wi-Fi networks. J. Netw. Comput. Appl. 2013, 36, 756–767. [Google Scholar] [CrossRef]
  9. Chen, Y.Y. An RFID Information System for Logistic Management Based on SaaS Cloud Computing Architecture. Master’s Thesis, Institute of Manufacturing Information and Systems, NCKU, Tainan, Taiwan, 2011. [Google Scholar]
  10. Cheng, Y.J.; Chen, M.H.; Cheng, F.C.; Lin, K.P.; Yang, C.J. Enhance the processing and management efficiency of Dental Laboratory by the strategy of Productivity 4.0. In Proceedings of the 2017 IEEE International Conference on Applied System Innovation, IEEE-ICASI 2017, Sapporo, Japan, 13–17 May 2017; pp. 1098–1101. [Google Scholar]
  11. Gramajo, S.; Martínezc, L. A linguistic decision support model for QoS priorities in networking. Knowl.-Based Syst. 2012, 32, 65–75. [Google Scholar] [CrossRef]
  12. Castro, J.; Yera, R.; Martínezc, L. An empirical study of natural noise management in group recommendation systems. Decis. Support Syst. 2017, 94, 1–11. [Google Scholar] [CrossRef]
Figure 1. The whole scenario of this study.
Asi 01 00017 g001
Figure 2. The cloud framework diagram of this study.
Asi 01 00017 g002
Figure 3. The analysis diagram of the cloud system.
Asi 01 00017 g003
Figure 4. The flowchart of digital denture manufacturing.
Asi 01 00017 g004
Figure 5. The prosthesis.
Asi 01 00017 g005
Figure 6. The diagram of system architecture layer.
Asi 01 00017 g006
Figure 7. The hardware architecture of the process site.
Asi 01 00017 g007
Figure 8. The control circuit block.
Asi 01 00017 g008
Figure 9. The CDT record start/end working time by RFID card.
Asi 01 00017 g009
Figure 10. Data of the station from ThingSpeak.
Asi 01 00017 g010
Figure 11. The decision tree of reasonable working hours.
Asi 01 00017 g011
Table 1. Decision table of denture process hours.
CDT IDSeniorityTechnical LevelResponsibilityWorking HoursReasonable or not in Working Hours
CD-001Low (1)Low (1)High(3)Morning(1)NO
CD-002Low (1)Medium (2)Low(1)Morning (1)YES
CD-003High (3)High (3)High (3)Morning (1)YES
CD-004Medium (2)High (3)Medium(2)Morning (1)YES
CD-001Low (1)Low (1)High (3)Afternoon(2)NO
CD-002Low (1)Medium (2)Low (1)Afternoon (2)NO
CD-003High (3)High (3)High (3)Afternoon (2)YES
CD-004Medium (2)High (3)Medium (2)Afternoon (2)YES
CD-001Low (1)Low (1)High (3)Evening(3)NO
CD-002Low (1)Medium (2)Low (1)Evening (3)NO
CD-003High (3)High (3)High (3)Evening (3)YES
CD-004Medium (2)High (3)Medium (2)Evening (3)NO
Table 2. Reasonable working time of each process.
Procedure AProcedure BProcedure CProcedure D
Time (Minute)403020150
Table 3. The information gain of parameters.
SeniorityTechnical DegreeSense of ResponsibilityWorking Hours
Gain0.550.550.040.13

