Adaptive Neuro-Fuzzy Inference System Based Grading of Basmati Rice Grains Using Image Processing Technique


Centre of Studies in Resources Engineering, Indian Institute of Technology Bombay, Mumbai, India
Appl. Syst. Innov. 2018, 1(2), 19; https://doi.org/10.3390/asi1020019
Submission received: 10 April 2018
/
Revised: 5 June 2018
/
Accepted: 15 June 2018
/
Published: 20 June 2018
(This article belongs to the Special Issue Fuzzy Decision Making and Soft Computing Applications)
Abstract
:Grading of rice intents to discriminate broken and whole grain from a sample. Standard techniques for image-based rice grading using advanced statistical methods seldom take into account the domain knowledge associated with the data. In the context of a high product value basmati rice with an image based grading process, one ought to consider the physical properties of grain and the associated knowledge. In this present work, a model of quality grade testing and identification is proposed using a novel digital image processing and knowledge-based adaptive neuro-fuzzy inference system (ANFIS). The rationale behind adopting a grading system based on fuzzy rules relies on capabilities of ANFIS to simulate the behaviour of an expert in the characterization of rice grain using the physical properties of rice grains. The rice kernels are characterized with the help of morphological descriptors and geometric features which are derived from sample images of milled basmati rice. The predictive capability of the proposed technique has been tested on a sufficient number of training and test images of basmati rice grain. The proposed method outperforms with a promising result in an evaluation of rice quality with >98.5% classification accuracy for broken and whole grain as compared to standard machine learning technique viz. support vector machine (SVM) and K-nearest neighbour (KNN). The milling efficiency is also assessed using the ratio between head rice and broken rice percentage and it is 77.27% for the test sample. The overall results of the adopted methodology are promising in terms of classification accuracy and efficiency.
Keywords:
ANFIS; basmati rice; image processing; grading; quality assessment; fuzzy inference system1. Introduction
India is the leading exporter of the basmati rice (Oryza sativa) to the global market. The annual export of basmati rice was ∼4.05 million MT to the global market during the year 2015–2016 [1]. Basmati rice is a protracted slender grain variety of aromatic rice grown in the Indian sub-continent. It has a high product value due to its flavour, delicate texture, delightful fragrance, and softness. The length of basmati rice grain is longer than the width, and it grows even longer during cooking [2].
The high-value basmati rice grain has to go through several operations (such as threshing, handling, de-husking, milling and whitening of grains) starting from harvesting of paddy to final production of rice grains by means of several mechanical systems [3]. Thereby, the grade of the produced grain exclusively depends on the adjustment of the equipment used in the various mentioned operations. In general, in a rice milling facility, the quality grade of product is being monitored by visual inspection by experienced quality control personnel at 2–3 h intervals, rather utilizing a continuous operational measurement method. This means that the operator, based on his experience and proficiency with the processing machinery, assesses the quality grade of the product by mere visual inspection of rice grain appearance and making the required adjustments which are time-consuming and subjective.
Alternatively, image-based grading approaches are nondestructive and rapid. With suitable statistical or machine learning techniques, the image-based approaches are proven to be an efficient way to achieve automatic inspection and grade evaluation efficiently [4,5]. During last decade, researchers have investigated several techniques based on machine vision and digital image processing for quality assessment of rice kernels which are fast, non-destructive, accurate, and cost-effective as compared to traditional methods [6,7]. Image-based approaches have been applied for characterizing rice grains using either one of the morphological, colour, and textural features, or a combination. However, in order to find suitable rice grain descriptor and to improve the classification accuracy, it is imperative that some key features should be selected to describe grain feature exactly.
The marketing value of rice depends on its physical qualities after processing. Major axis/minor axis ratio of the rice kernel is reported as a key feature of basmati rice which might identify the adulteration of basmati rice with other rice varieties [8]. Vaingankar and Kulkarni [8] reported the major axis/minor axis ratio of 3.92–4.09 as an indicator of pure Basmati-370 variety. In the context of grading of rice, the percentage of the head or whole grain and broken grain is a most important factor which determines the milling efficiency. Till date, several studies reported improvement in classification accuracy of rice grain using machine vision and image processing techniques [9,10,11,12].
Pazoki et al. [13] illustrated that determining grain variety using a simple mathematical function is difficult because the grain has various morphologies, colours, and textures. Alternatively, artificial neural network (ANNs) techniques have been applied for grain quality control and discrimination of grain variety. Chen et al. [14] proposed a methodology to identify five corn varieties with the accuracy of more than 90% using pattern recognition techniques and neural networks. In a comparative analysis in [11] of artificial neural networks, support vector machines, decision trees and Bayesian Networks to classify milled rice samples, it has produced highest classification accuracy with ANN. Despite promising results, there are several problems might arise with ANN’s training and designing [15,16,17,18]. The assignment of the weights in ANN structure is one of the most important problems [19] which has a direct effect on its performance. Moreover, the uncertainties in ANN output is proven to be a challenging issue [20].
ANN optimization is limited in practice by a finite training sample and is accomplished through a stochastic training process which gives ANN the ability to avoid being trapped at local minima. On the contrary, this stochastic process makes ANN optimization empirical and subject to strong influence from statistical variations [20]. To overcome these issues with ANN, a hybrid approach with the fuzzy system has introduced. Fuzzy systems are quite good at handling uncertainties and can interpret the relationship between input and output by producing rules. Therefore, to increase the capability of Fuzzy and ANN, hybridization of ANN and fuzzy is usually implemented. Sabanci et al. [21] used ANFIS for wheat grain classification with 99.46% of classification accuracy. Zareiforoush et al. [22] coupled a fuzzy inference system (FIS) with image processing technique for a decision-support system for qualitative grading of milled rice. The results are reported with 89.8% agreement between the grading results obtained from the FIS system and those determined by the experts.
In the context of rice grading, some head grains are easily misclassified with broken grain due to the resemblance in single feature (e.g., eccentricity) extracted from digital images and are not deterministically separable. In such cases, fuzzy approach [23] is more convenient for discrimination of head and broken rice grains [24]. Shiddiq et al. [25] investigated the rice milling degree using colour features (RGB) with an adaptive network-based fuzzy inference model. It was reported an error of 3.55–5.62% in milling degree using this process. However, the morphological features can improve the efficiency in terms of classification. In this context, a grading system based on fuzzy rules can simulate the behaviour of an expert in the evaluation and classification of physical properties of rice grains for grading. In this present work, the predictive capacity of ANFIS is assessed for quality testing and identification of basmati rice based on morphological features. This has been motivated by the fact that well-documented knowledge regarding rice kernels are usually available [26,27]. This knowledge has been incorporated in forming the rules of the fuzzy inference system used to determine head and broken rice kernels. Moreover, the proposed ANFIS based classification method provides a rationale behind the knowledge of morphological features and their underlying dependencies with rice grains. Subsequently, the milling efficiency is estimated with broken grain and head grain ratio for test images. Furthermore, the proposed classification method is compared with standard data-driven machine learning techniques viz., support vector machine (SVM) and k-nearest neighbour (KNN) classifier.
2. Materials and Methods
The schematic workflow of the proposed ANFIS based grading of basmati rice grains is given in this section. Subsequently, the steps involved in the technique are detailed in the following subsections.
2.1. Sample Preparation
Basmati rice grains of different grades (Pusa basmati 1121), were used in this study. This variety of basmati rice possesses extra-long slender milled grains (∼9.0 mm), pleasant aroma, and an exceptionally high cooked kernel elongation ratio of ∼2.5 [28]. It is the most common Basmati rice variety in rice grain quality research for developing standard Basmati quality traits. The grades of the rice sample are based on the percentage of broken rice content (e.g., 5% broken rice).
The rice grain samples can be taken as heaped together or in a scattered arrangement for imaging. These arrangements are important which is likely due to the fact that the grain characterization method employs the visual attributes of grains obtained from image-processing techniques. Thus, the heaped grain images might attain certain disadvantages e.g., boundaries of grains not completely visible and distinguishable and noise appearing more prominent than the boundaries if grains are overlapping with each other [21]. Thereby, it is desirable to take samples in a scattered arrangement with a black background (it can improve the contrast of the image in the scattered configuration). Furthermore, it should be ensured that not too many rice grains are clustering in scattered configuration.
2.2. Imaging System and Image Acquisition
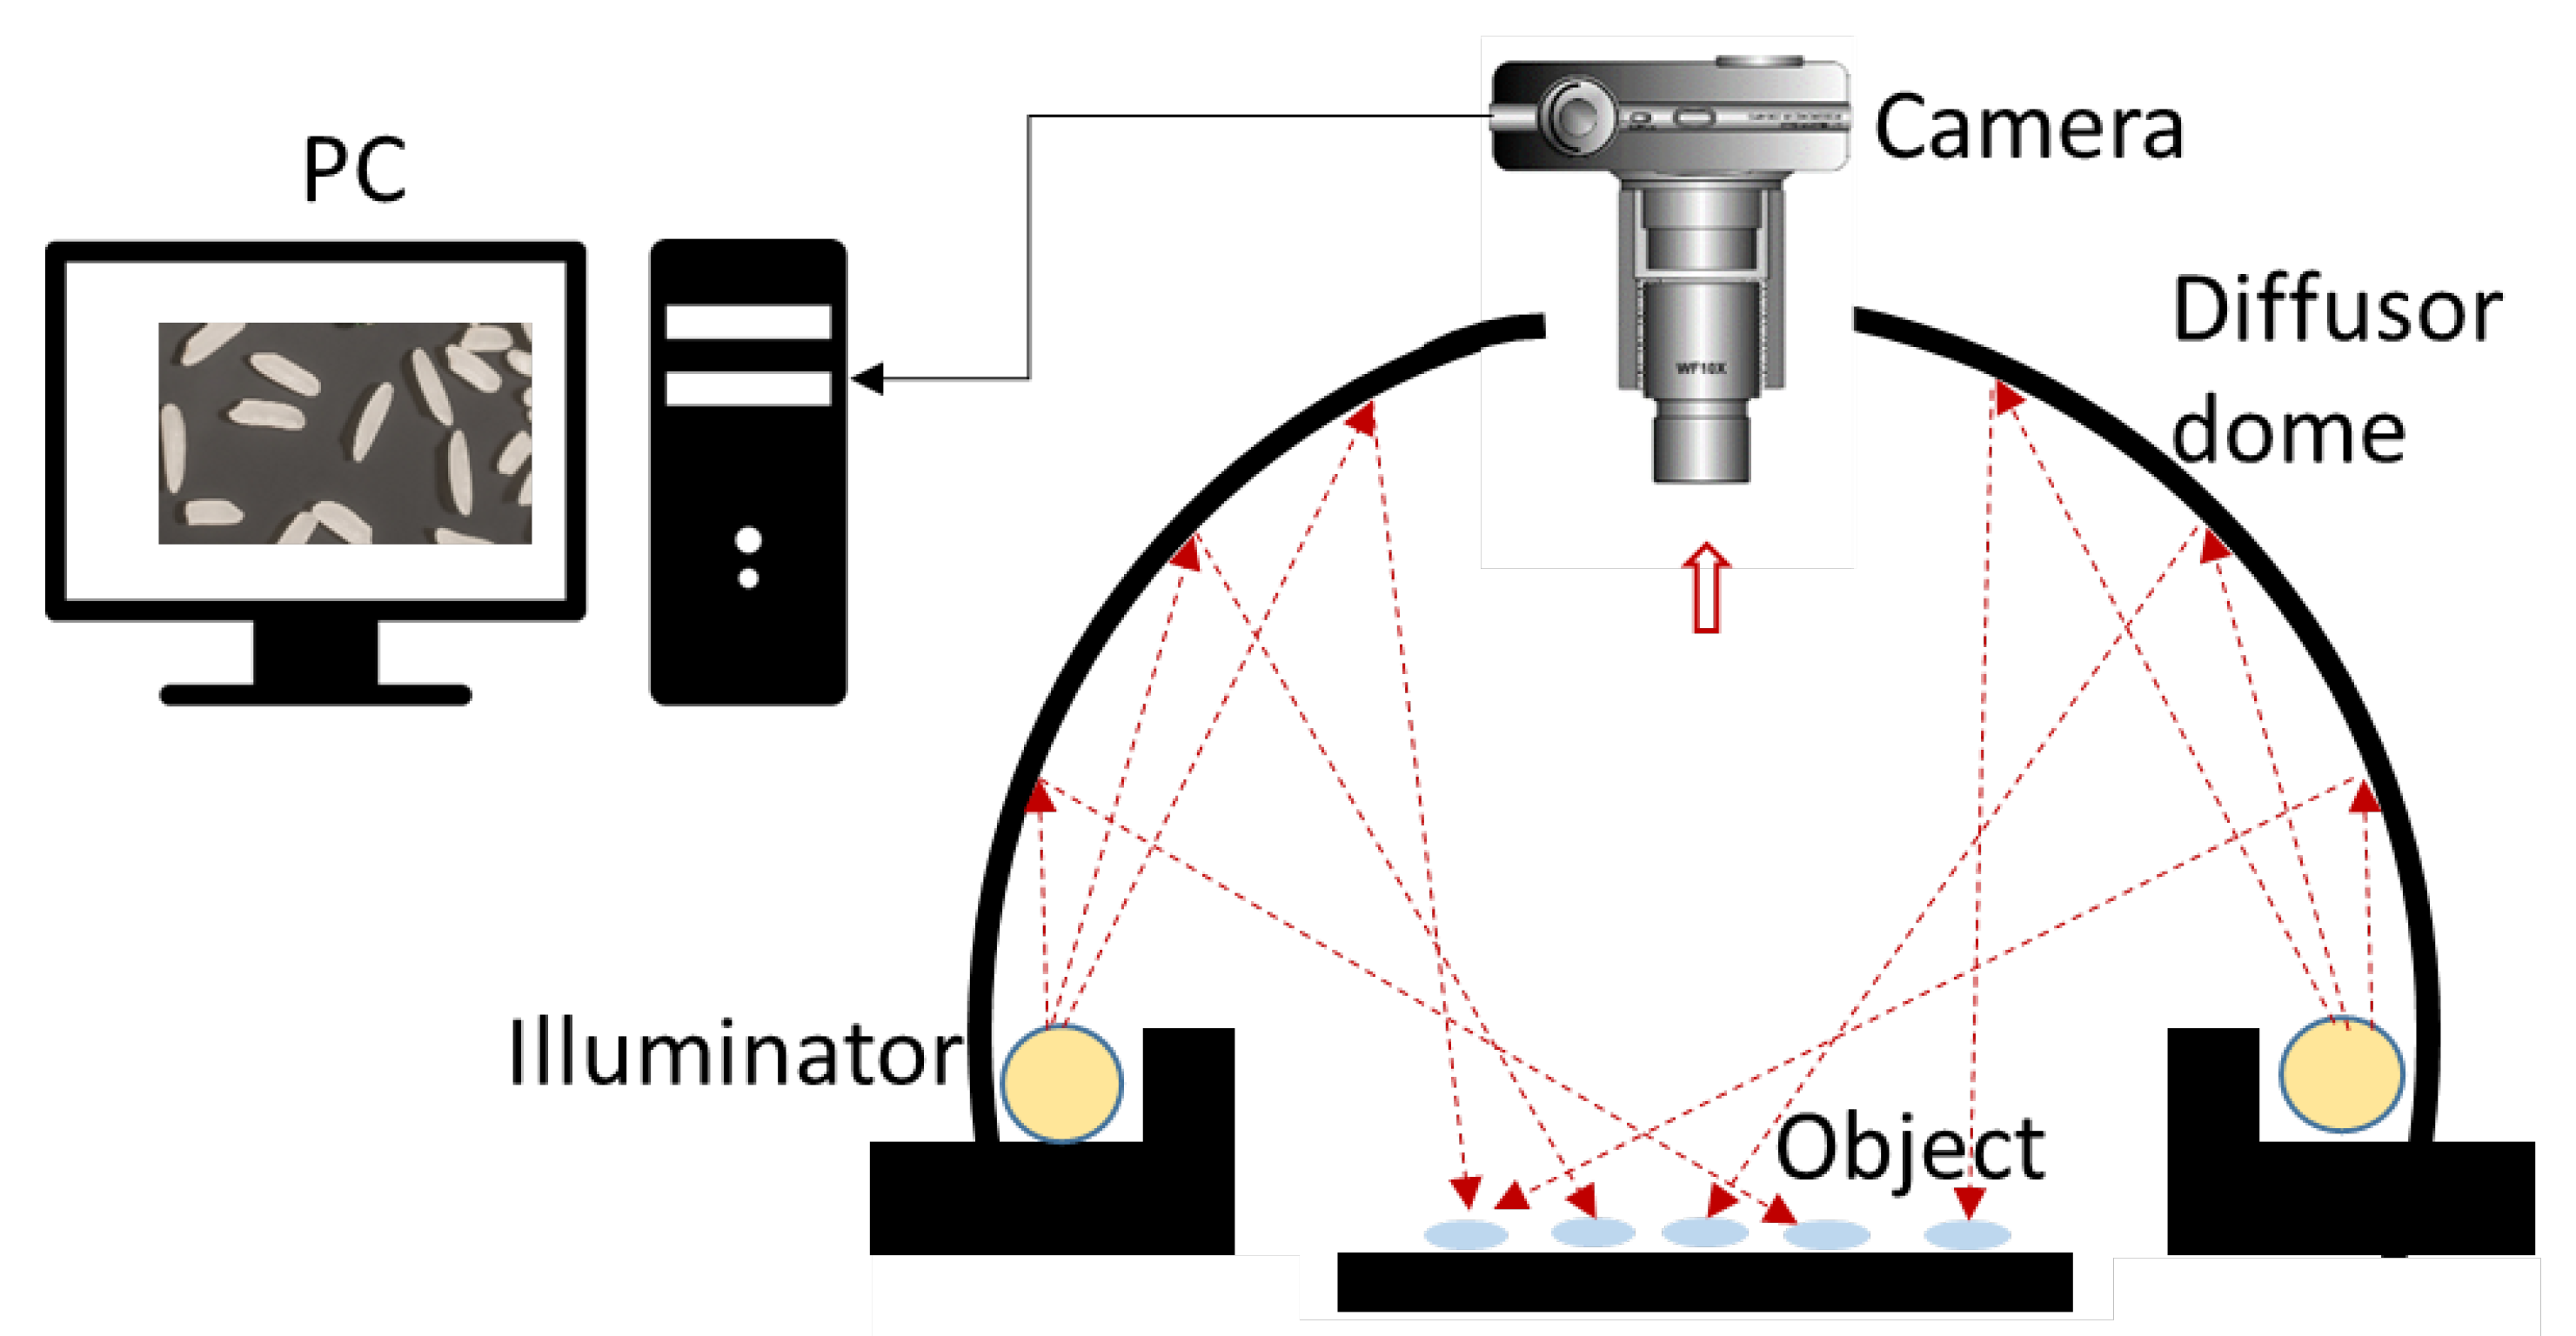
A schematic diagram of the image acquisition system is shown in Figure 1. Typically, a vision system consists of the illumination component to illuminate the sample under test; the camera to acquire an image; personal computer or microprocessor system to provide disk storage of images and computational capability.
In an image acquisition system, choosing the right lighting strategy remains a difficult problem because there is no specific guideline for integrating lighting and machine vision application. Despite this, some rules of thumb exist [29] which suggest that fluorescent bulbs are inherently more efficient and produce more intense illumination at specific wavelengths. Moreover, the fluorescent light provides a more even, uniform dispersion of light from the emitting surface [30]. A 25–40 kHz ring-shaped compact fluorescent light is used for illumination in this setup. Apart from the illuminant, the surface geometry is also important in the illumination design. In this present work, a diffuse illuminator is used to produce uniform lighting as shown in Figure 1. Such a setup is extremely useful for visual inspection of grains and oilseed with a success rate almost reaching 100% [31].
The system was enclosed in a dark chamber to prevent exposure to stray light. The digital camera (Canon EOS 1300D) was set in the manual mode for image acquisition with an ISO of 400 and a shutter of 1/30 s. The images were taken with a black background for basmati rice sample with different orientation and quality in a scattered arrangement for training and testing. Camera aperture and focus were adjusted to make individual grain boundaries distinguishable in the picture. A total of 40 images were acquired and saved in raw format, in which no adjustment (e.g., white balance) was applied.
2.3. Image Processing
The image processing was carried out with MATLAB to acquire the feature data. At first, the acquired RGB image was separated in single R, G and B channel in grayscale mode. Subsequently, each channel grey image was converted to a binary image using Otsu’s method [32]. This method converts the grayscale image to a binary image based on image clustering in accordance with a threshold value. This threshold value is optimally determined between 0 and 1 by Otsu’s method. The grey level is normalized from 0–255 to 0–1. The method then splits the normalized image into two classes having lower or higher grey level than the threshold value. Each pixel is set to white (1) if the grey level is higher than the threshold value, otherwise, it is set to black (0). Thus, the image segmentation considers the identification of objects within an image using an edge detection algorithm which identifies the boundaries of individual object and labels the centre of each object for further processing. Eventually, each grain’s position is fixed and it is tagged according to its position through a segmentation process.
The noise of each image is then eliminated using a morphological process. It is followed by morphological opening operation [33] were applied with ‘disk’ type structuring element using ‘imopen’ function followed by hole filling and clear borders. Morphological opening operations generally smooth the objects of the image. Opening operation eliminates thin protrusions of the objects. Opening operation eliminates the objects which cannot accommodate the structuring element completely. Thus it removes the noise from the image. Then, each object was labelled followed by counting the objects.
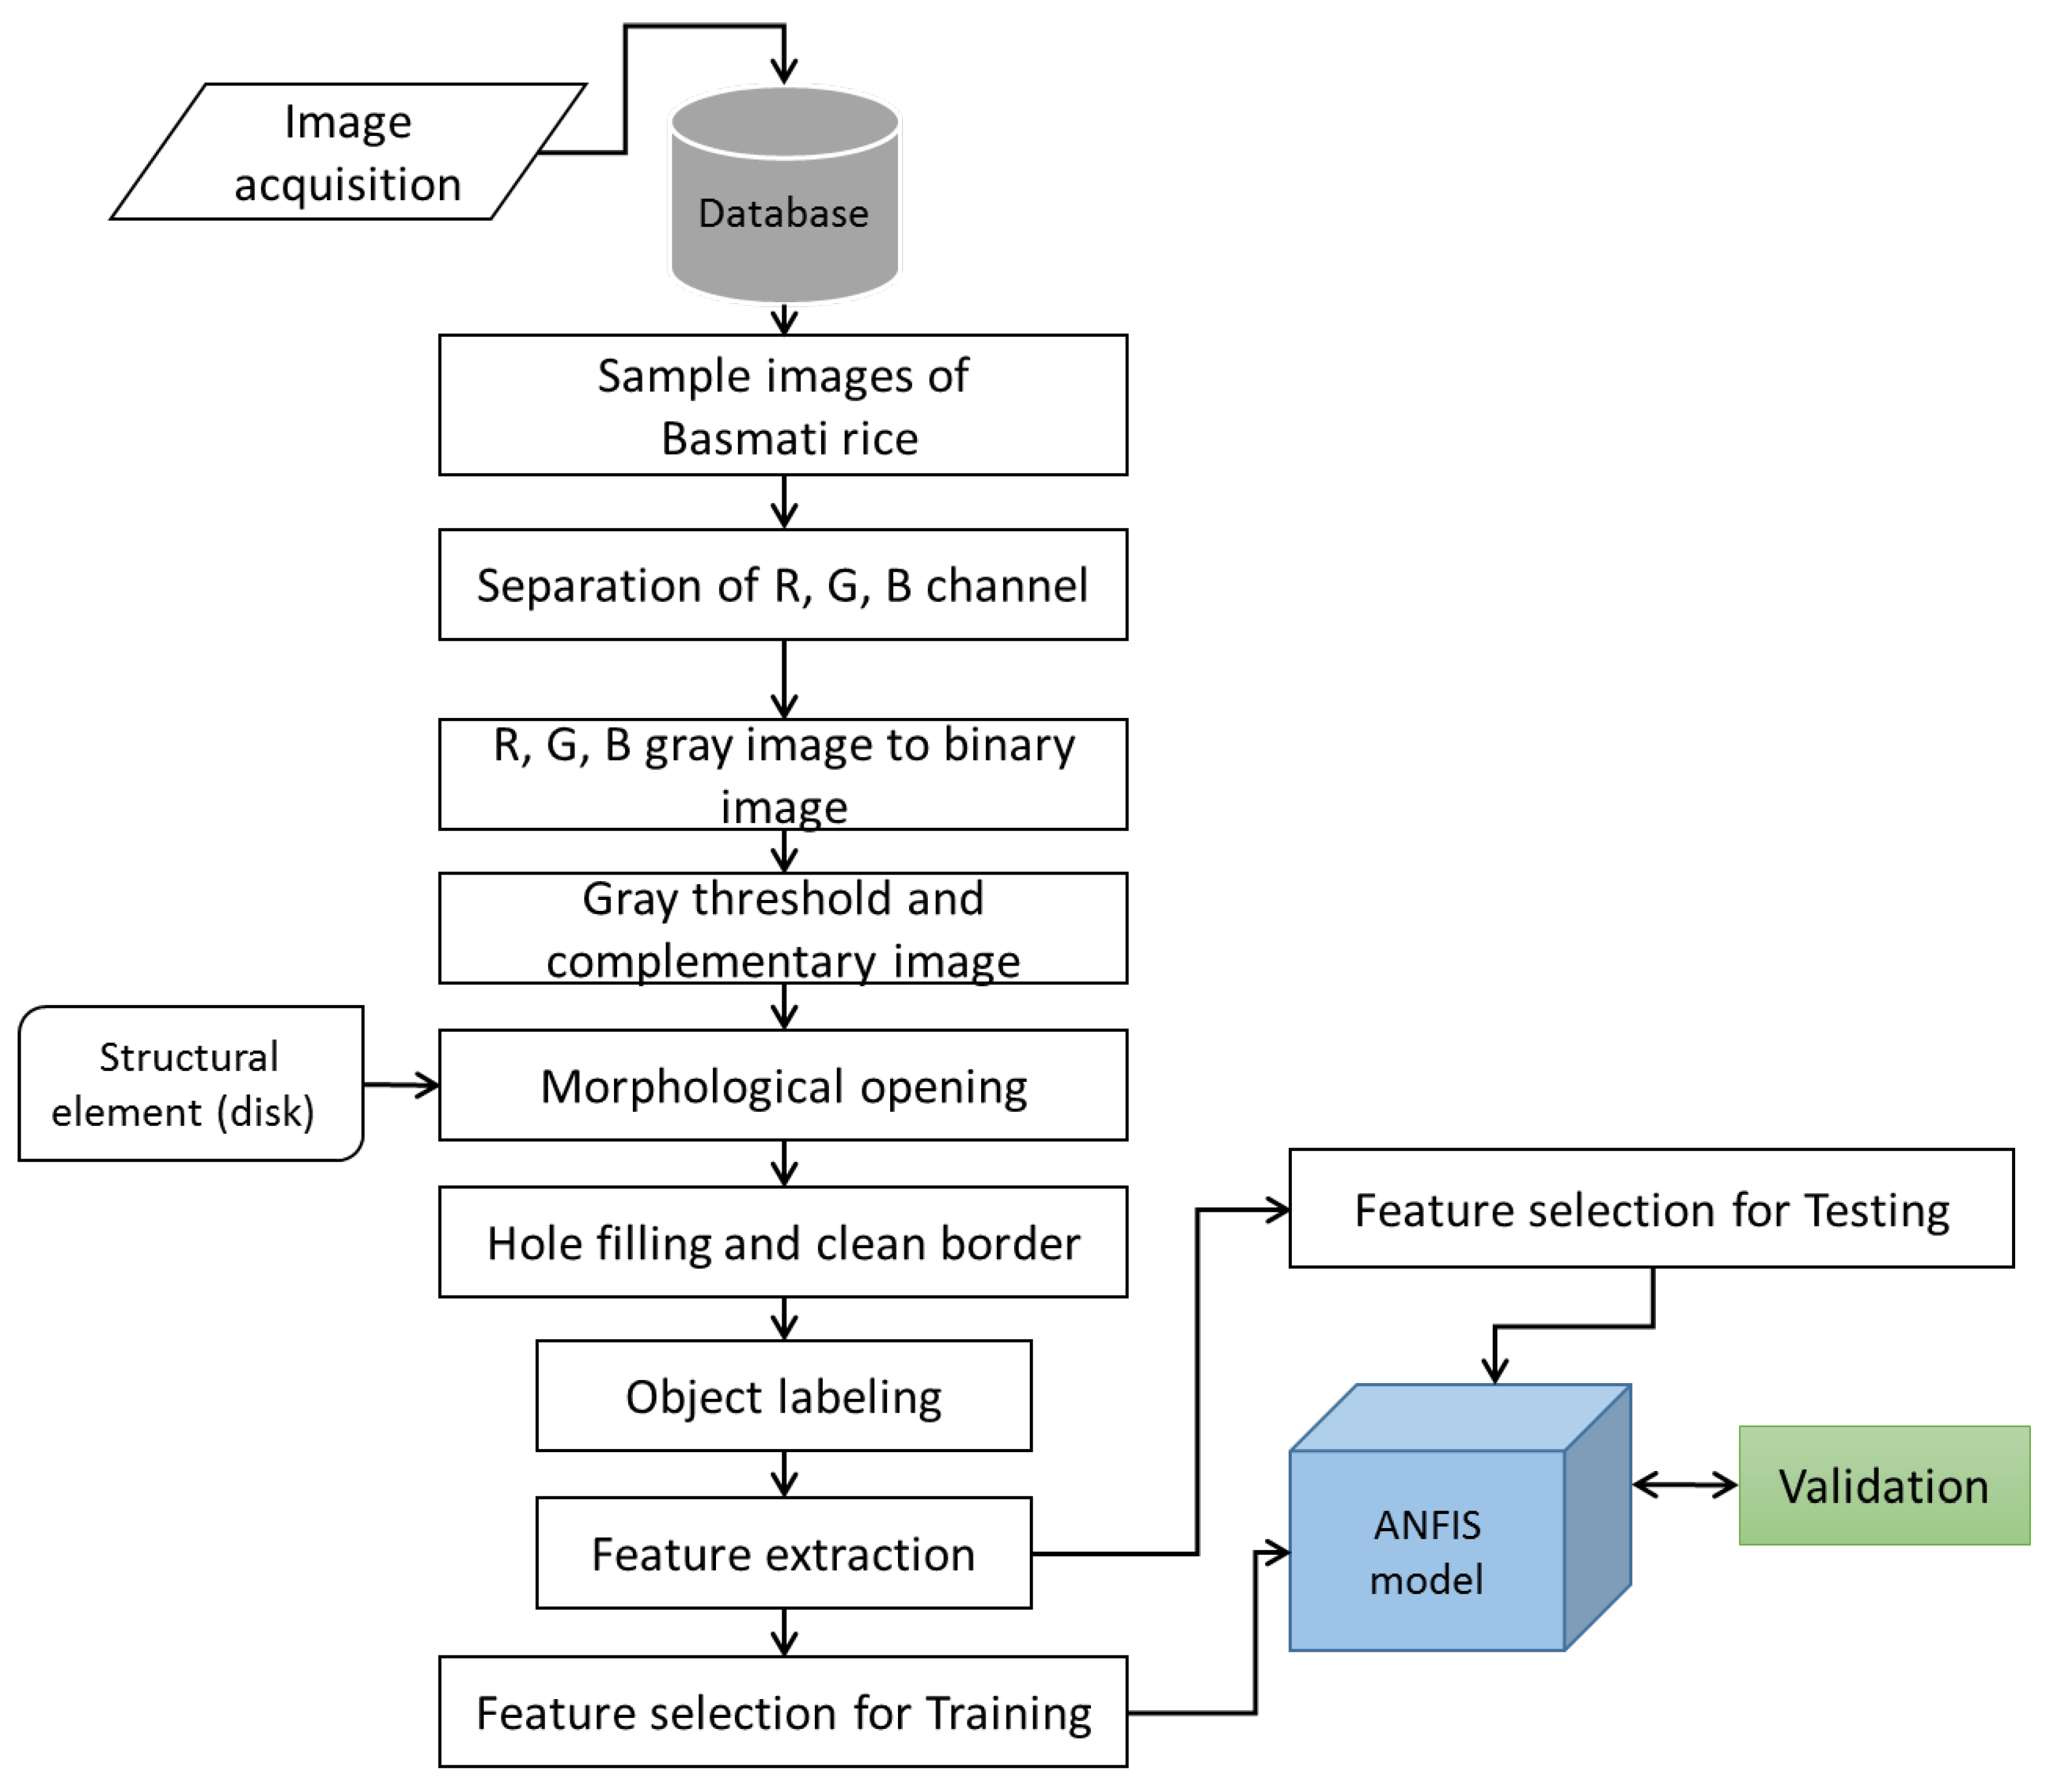
Feature extraction involves the retrieval of quantitative information from the segmented images. Here, extraction of parameters e.g., eccentricity, equivalent diameter, area, perimeter, major axis length and minor axis length have been carried out further with ‘regionprops’ function for differentiating head grain from broken grain. Aspect ratio i.e., major axis length/minor axis length was estimated from object feature set. The schematic processing chain is shown in Figure 2. The similar operation was conducted for other training images of basmati rice sample and for the test image too. Feature dataset for training as well as testing was created from the object properties and object class (Whole grain = 1 or broken grain = 0).
2.4. Features of Basmati Rice
To physical properties of the rice kernel is characterised using the morphological features. Rice grains are generally considered as an ellipse as shown in Figure 3. Based on this assumption of the object, the following morphological features as reported by Shantaiya and Ansari [34] are considered for the present study. The devised features are also reported to be promising in [35] as optimal morphological features for rice kernel identification using standard sequential forward (SFS) algorithm. These features are:
- Major axis length: It is the total number of pixels between the extreme points along the major axis of the rice kernel.
- Minor axis length: It measures the number of pixels between the extreme points of the along the minor axis of the rice kernel.
- Perimeter: It is the total number of pixels along the boundary of rice grain.
- Area: It is the total number of pixels in rice grain object.
- Aspect ratio (): It is the ratio of major axis length and minor axis length of the rice grain.
- Eccentricity: The eccentricity is calculated by a fraction of the number of pixels between the major axis length and foci of the ellipse containing the grain. The value of eccentricity ranges in between 0 to 1.
- Equivalent diameter: Equivalent diameter of rice grains is calculated as,
These parameters were extracted with image processing techniques as discussed in Section 2.3.
2.5. Fuzzy Inference System
A Fuzzy Inference System (FIS) incorporates the knowledge of an expert, during design a model in between input and output parameters. In FIS, the input-output relations are defined by a set of fuzzy rules, e.g., IF-THEN rules [36]. Fuzzy logic-reasoning involves the assignment of membership function to the input and output parameters; and the rule base which processes the fuzzy values of the inputs to fuzzy values of the outputs. The accurate selection of these membership function and the rules is one of the most critical stages in the FIS which needs expert knowledge. FIS consists of three segments viz. fuzzification, inference engine and defuzzifier. Fuzzification converts the numeric value of the input to a linguistic variable with the help of the membership functions e.g., triangular, trapezoidal, Gaussian, etc. The inference engine evaluates the degree of the membership function of the input variables (premise) to the fuzzy consequent part using the fuzzy IF-THEN rules. The conditional statement contains a premise, the if-part, and a conclusion, the then-part [37]. The knowledge involved in a fuzzy inference system contains a group of several rules [38]. At last, the defuzzifier converts the fuzzy output into a crisp value. The fuzzy inference engine is the core of FIS which can represent the human decision-making process [36].
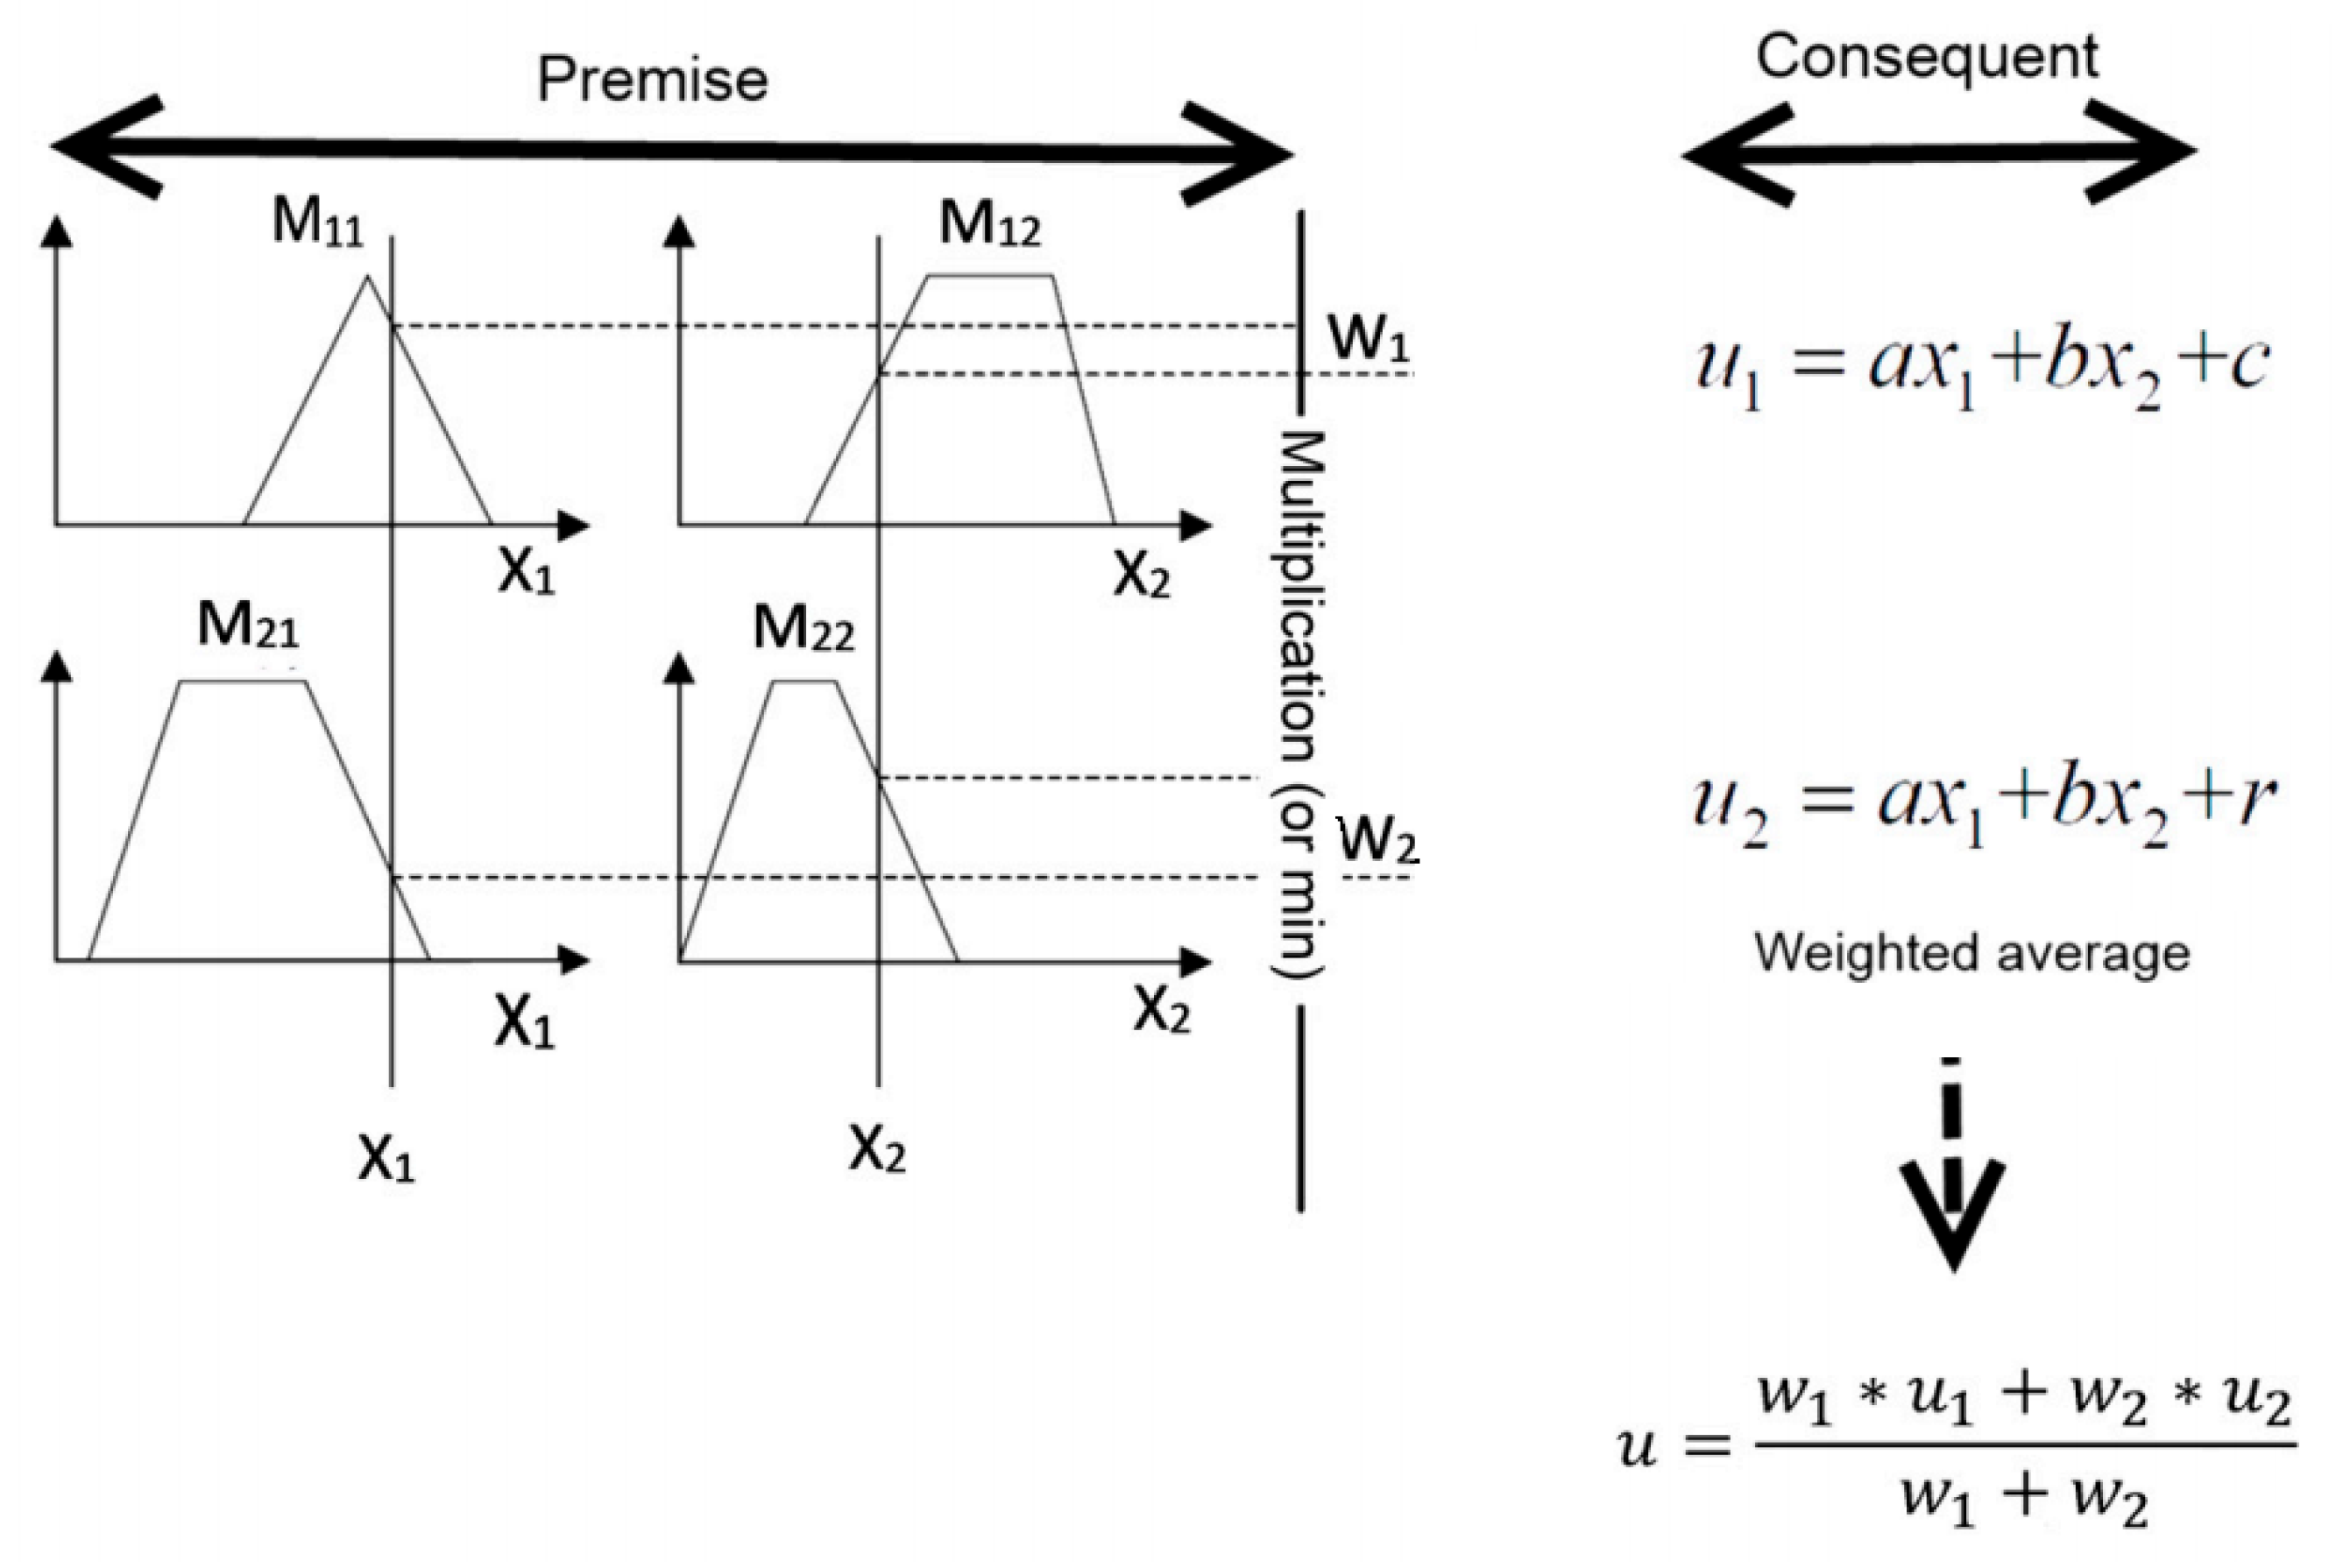
The Takagi-Sugeno (T-S) FIS has fuzzy inputs and a crisp output which is a linear combination of the inputs or constant. This method is computationally efficient and suitable to work with optimization and adaptive techniques [39]. The T-S method involves a systematic approach to generating fuzzy rules from a given input-output data set (Figure 4). It uses a membership function of the input variables for producing the consequent (then part). It uses the fuzzy rule: IF x is A y is B THEN z is where , and z are linguistic variables, A and B are fuzzy sets and is a mathematical function [39]. T-S FIS uses a weighted average to generate the crisp output.
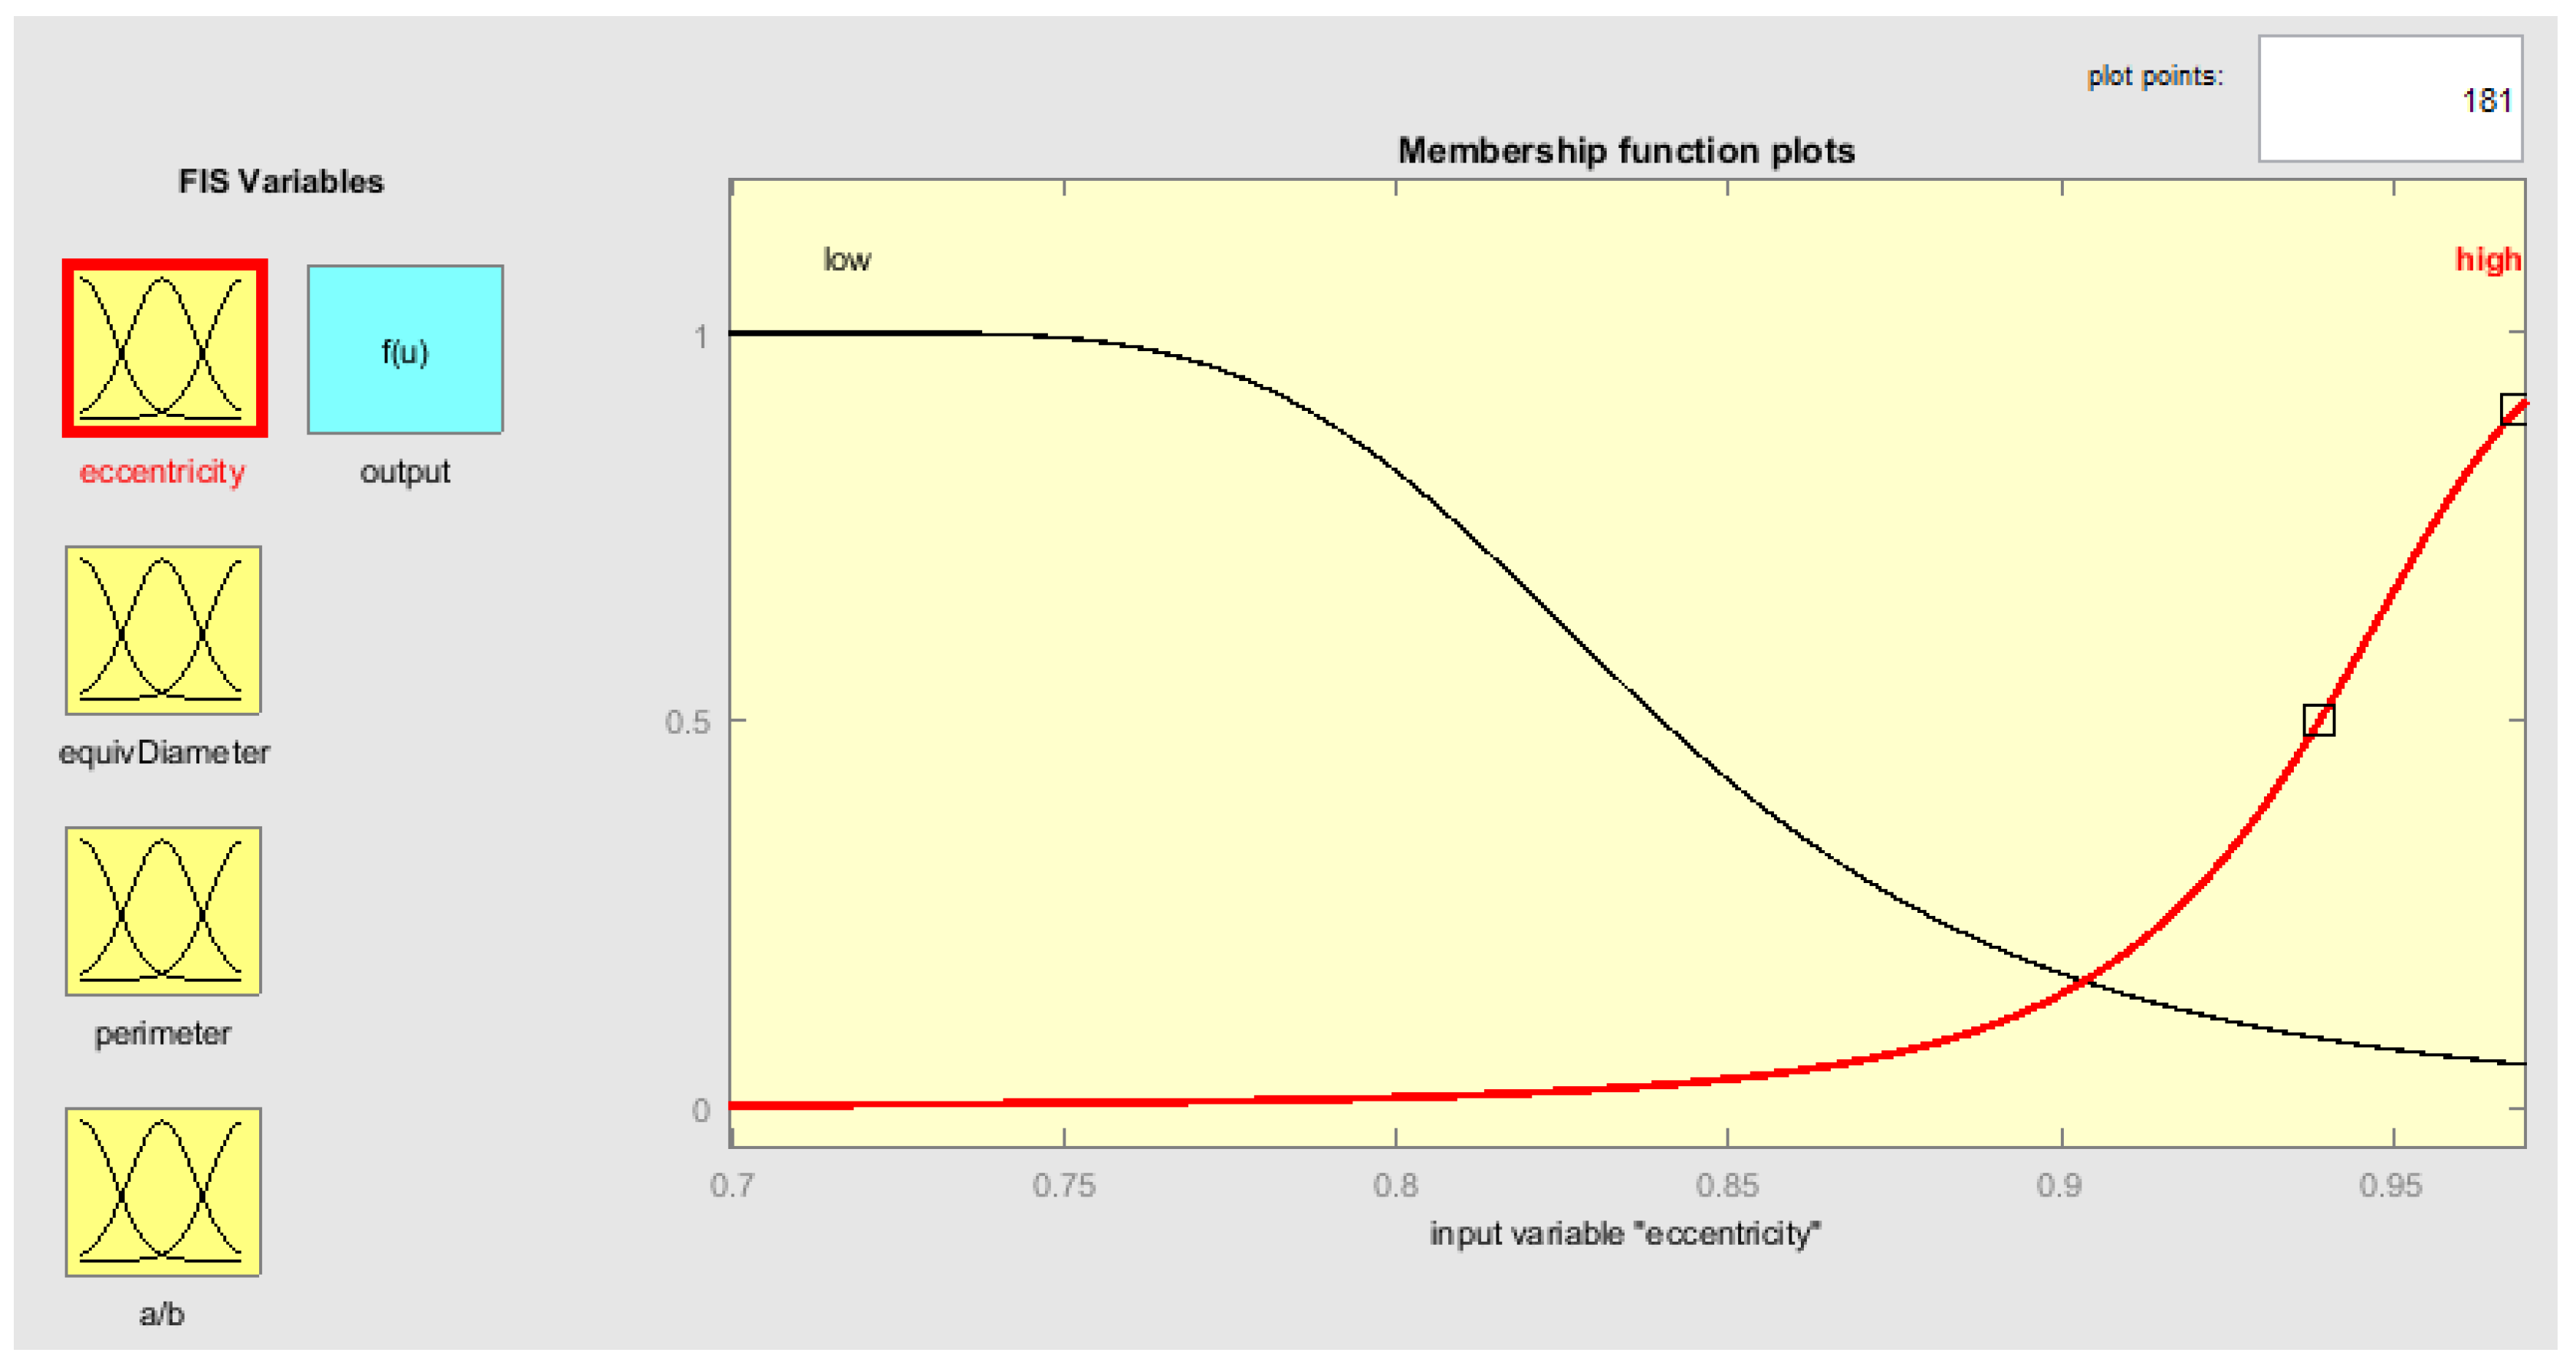
In this present work, zero order T-S was adopted for grading of basmati rice. The membership functions were taken as ‘gbellmf’ [40] for all inputs viz. eccentricity, equivalent diameter, perimeter and the major axis length/minor axis length (); the outputs were taken as constant (for whole grain, output = 1 and broken grain output = 0). An example of fuzzy membership function is shown in Figure 5. The rules of the T-S method were taken as follows:
- Rule 1: If (eccentricity is high) and (equivalent diameter is high) and (perimeter is high) and ( is high) then (output is Whole grain).
- Rule 2: If (eccentricity is low) and (equivalent diameter is low) and (perimeter is low) and ( is low) then (output is broken grain).
2.6. Adaptive Neuro-Fuzzy Inference System (ANFIS)
The adaptive neural network based fuzzy inference system (ANFIS) is a hybrid system. It includes both the advantages of the self-adaptability and learning competence of the neural network and the ability of the fuzzy system to take into account the prevailing uncertainty and imprecision of real systems. The neuro-fuzzy modeling approach is concerned with model extraction from numerical data which represents the dynamic behaviour of the scheme. With ANFIS method, an initial fuzzy model is generated with the help of the rules extracted from the input-output data. Next, the neural network is used to tune the rules of the initial fuzzy model to produce the final ANFIS model. The formulations and discussion of ANFIS architecture can be found in [41,42]. Unlike ANN, it has a higher capability in the learning process to adapt to its environment. Therefore, it can be used to automatically adjust the membership function’s parameters and reduce the rate of errors in the determination of rules in fuzzy logic.
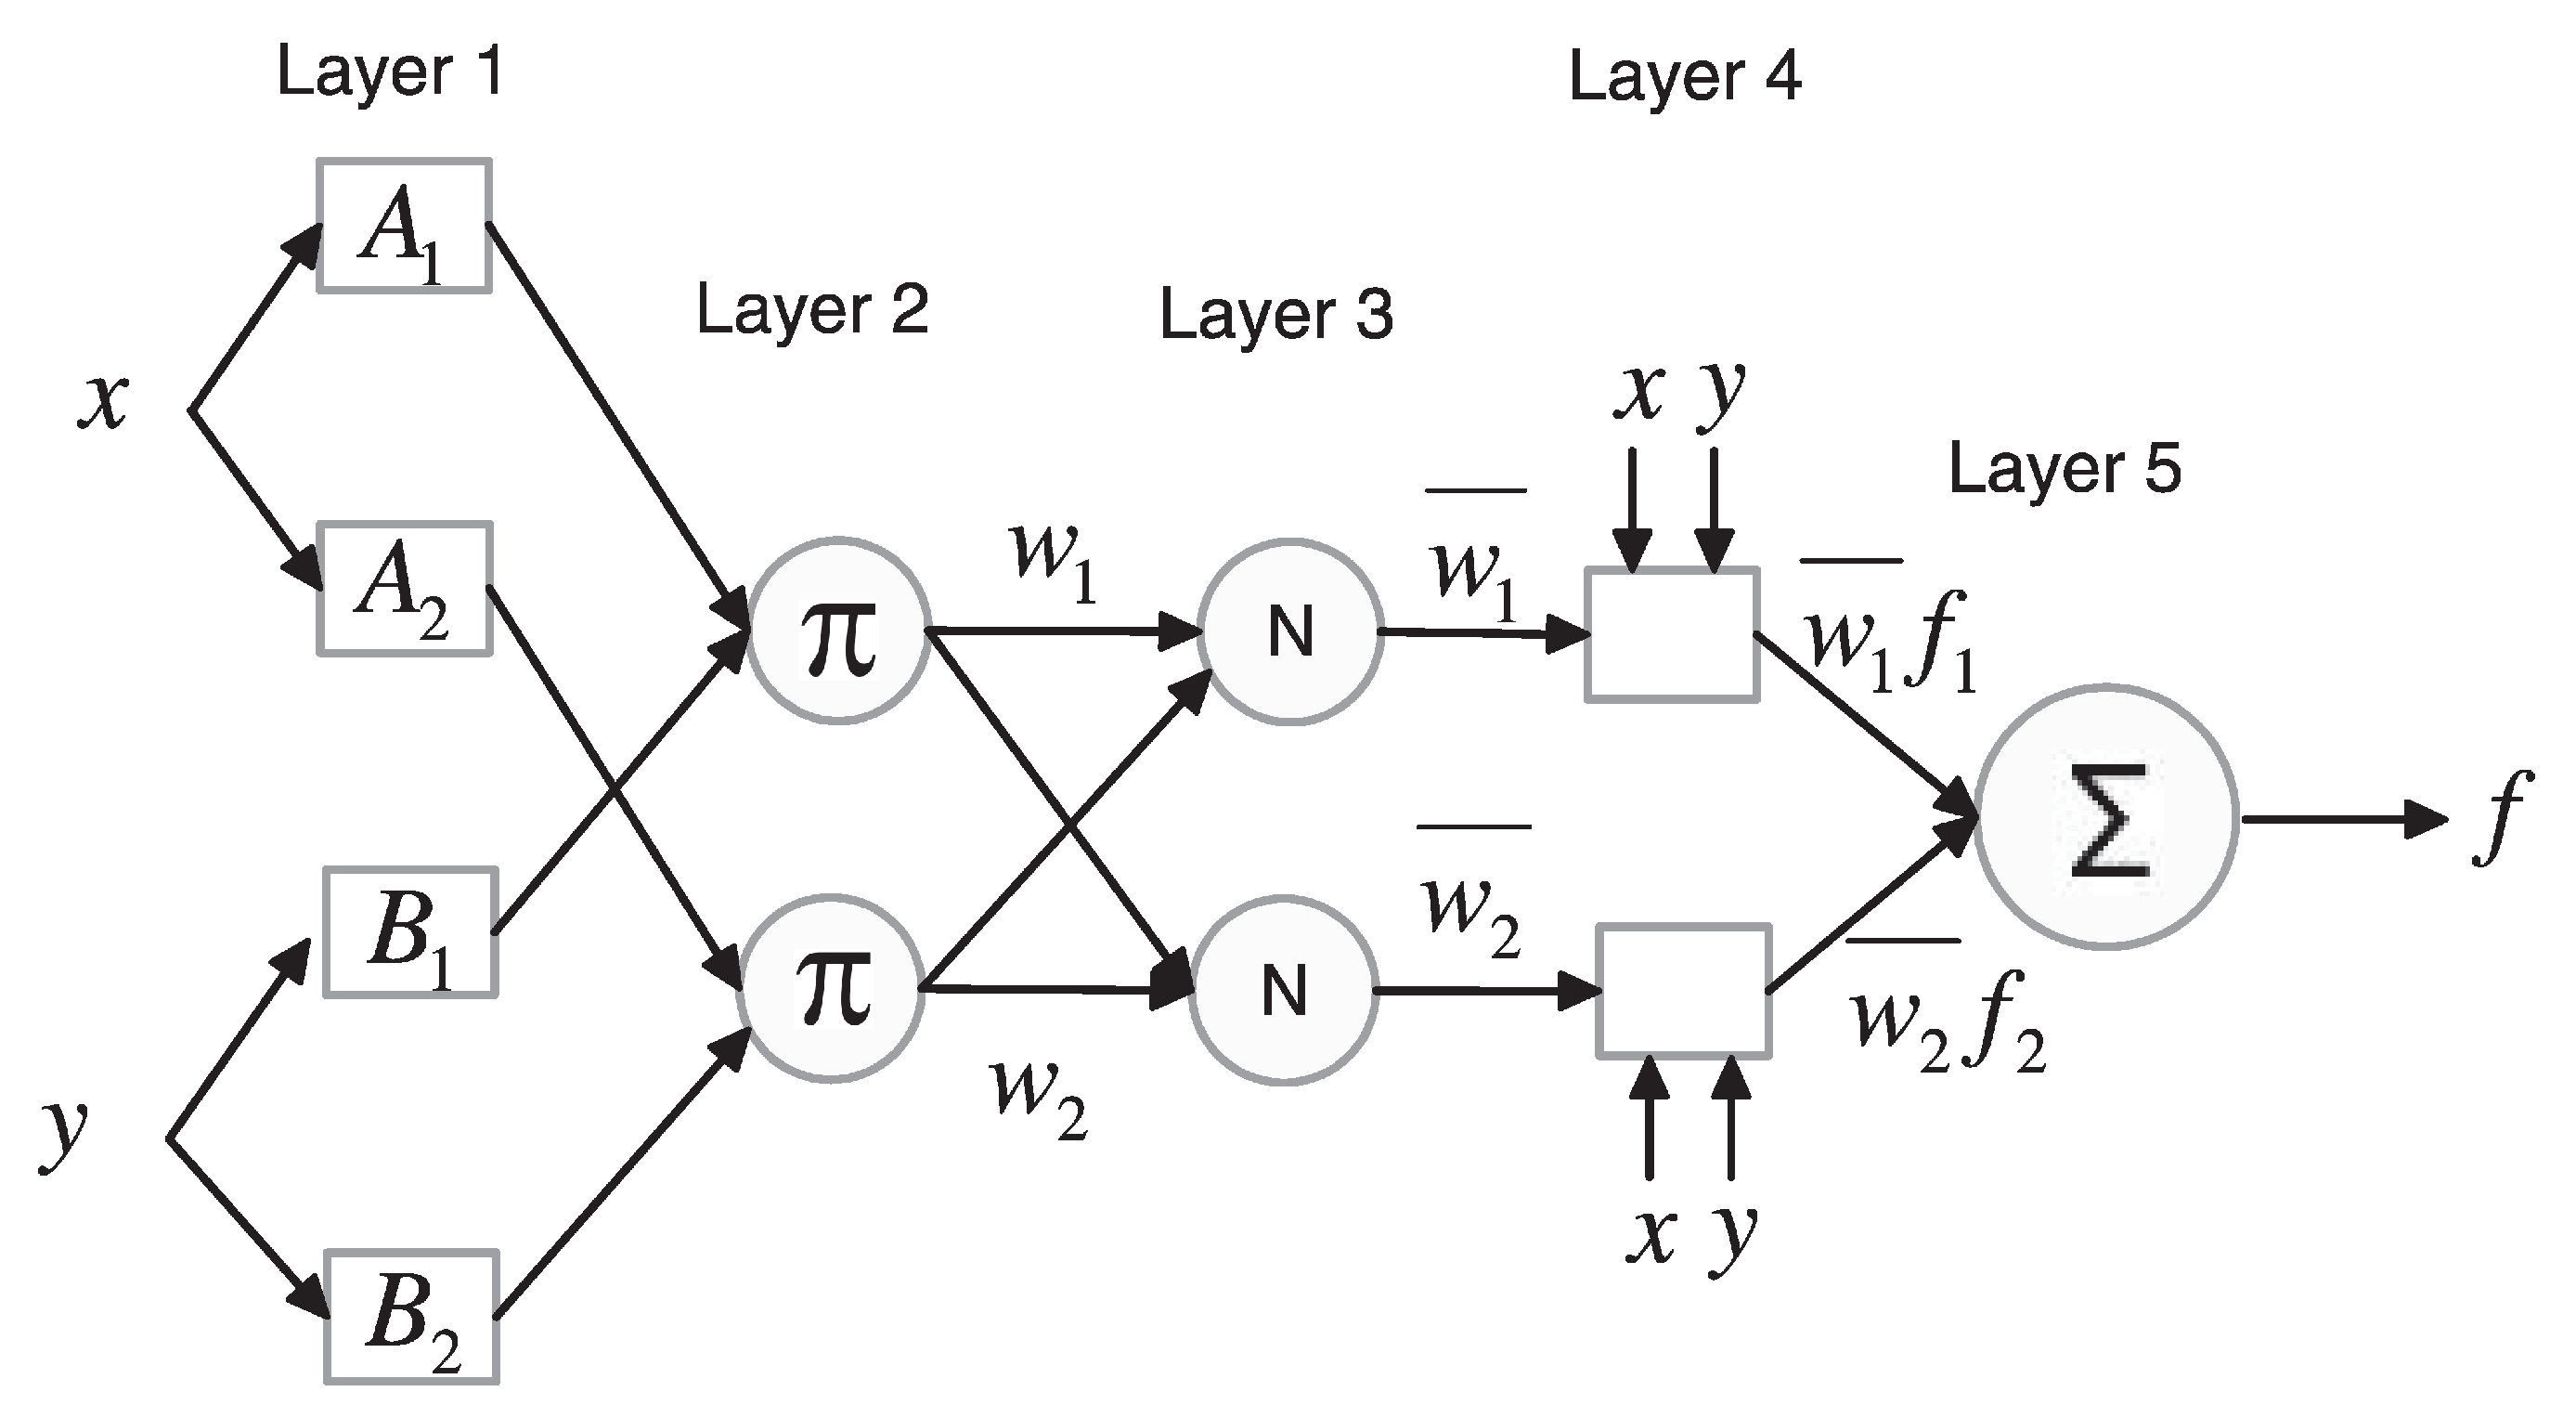
The ANFIS architecture shown in Figure 6 is an adaptive network that uses supervised learning algorithm and has a function similar to the model of Takagi-Sugeno fuzzy inference system as discussed in Section 2.5. Let’s assume that there are two inputs x and y, and one output f of the architecture. Two rules are used in the method of “If-Then” for Takagi–Sugeno model, as follows:
- Rule 1: If x is and y is Then .
- Rule 2: If x is and y is Then .
where , and , are the membership functions of each input x and y (premises), while , , and , , are linear parameters in the consequent part of Takagi–Sugeno fuzzy inference model. ANFIS architecture has five layers. The first and fourth layers contain an adaptive node, while the other layers are fixed nodes.
Layer 1: Each node adapts to a function parameter. The output from each node is a degree of membership value that is given by the input of the membership functions. For example, the membership function used in this study is a generalized bell membership function (c.f. Section 2.5).
where is the degree of membership functions for the fuzzy set , and are the parameters of a membership function which can change the shape of the membership function as shown in Figure 5.
Layer 2: Each node in this layer is fixed or non-adaptive and represented with a product operator . Each node in this layer represents the firing strength for each rule.
Layer 3: Each node in this layer is fixed or non-adaptive and labeled as N. It is normalizing the firing strength as .
Layer 4: Each node in this layer is an adaptive node with a node function defined as . The parameters in this layer are referred to as consequent parameters.
Layer 5: The single node in this layer is a fixed or non-adaptive node that computes the overall output as the summation of all incoming signals from previous nodes as .
In the ANFIS architecture, the first layer and the fourth layer contain the parameters which are tuned during the training phase. The number of training epochs, the membership functions and the number of fuzzy rules should be selected accurately while designing of ANFIS model [41], as it may lead system to overfit the data. This tuning is obtained with a hybrid algorithm combining the least-squares method and the gradient descent method with a mean square error method [44]. The training error, as well as test error, are also assessed using the rice grain sample data. A threshold was applied to the output of ANFIS to get a binary class of whole grain or broken grain.
2.7. Design of Experiment
The features (c.f. Section 2.4) were obtained form all the basmati rice sample images (in total 40 images) as discussed in aforementioned Sections. Among them, features obtained from 30 images were used to train the ANFIS and features derived from the remaining 10 images were used for testing. Subsequently, the classification accuracy was estimated with actual class of test data and ANFIS output results. Furthermore, the performance of ANFIS was compared with standard classification techniques of support vector machines (SVM) and K-nearest neighbours (KNN). The optimal margin and kernel parameters (radial basis function) for the Soft-margin SVM classifiers were determined using grid search and 10-fold cross-validation. Each image contains ∼15 rice kernels (objects). However, for representation we have kept only 1 image and have shown all image processing steps involved in result section (c.f. Section 3).
Furthermore, the effectiveness of morphological features was analyzed for a segmented test image (for each object). The histograms of individual feature can provide a rationale by relating the features to the physical properties derived from an image based technique associated with the grain class. In addition to the classification accuracy assessment, the milling efficiency (the ratio of broken grain and whole grain) was assessed using the broken grain and whole grain objects derived from a test image.
3. Results and Discussion
This section explains the results of the ANFIS based rice grading technique. The proposed morphological features are generated as detailed in Section 3.1 using the image processing technique which was performed using the steps described in Section 2.3. In Section 3.2, the ANFIS classification result using the features is analyzed and subsequently compared with the standard classification method. Furthermore, a histogram analysis of features are followed by estimation of the milling efficiency in Section 3.3 and Section 3.4.
3.1. Image Processing Outputs
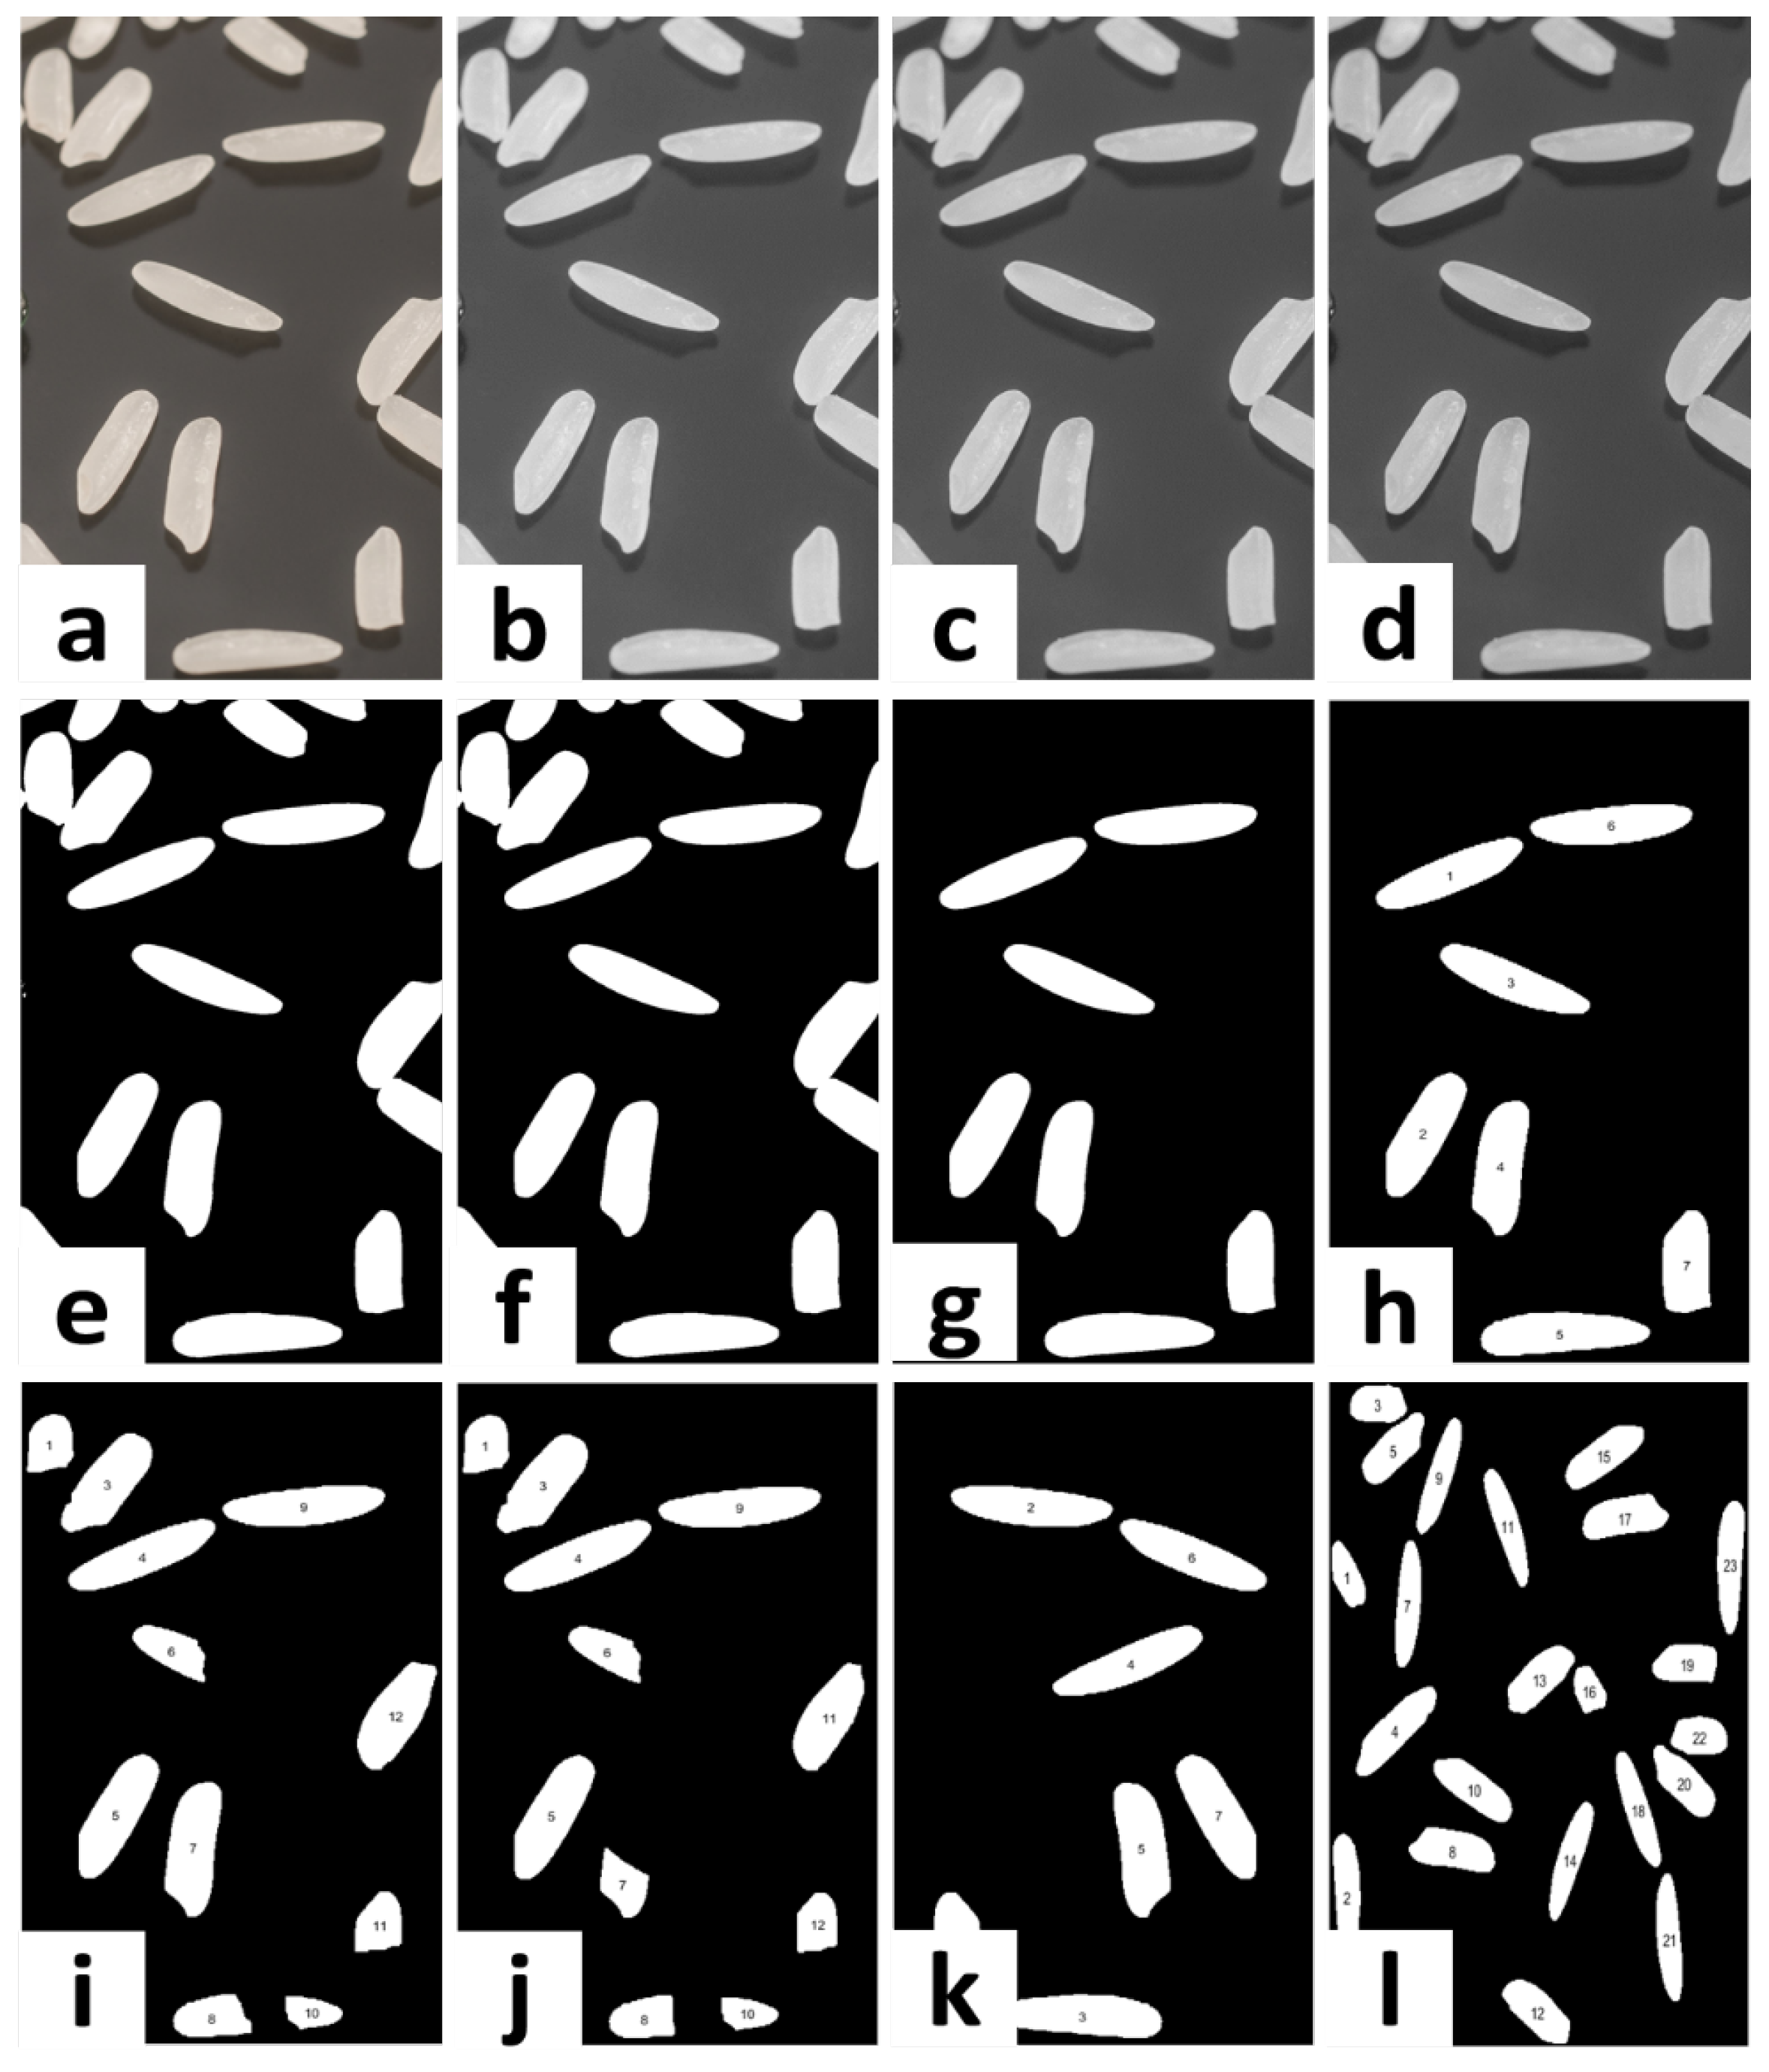
The sample images were processed as mentioned in Section 2.3. An example of the processed images is shown in Figure 7. These images were used for feature extraction which was utilized for a fuzzy model generation. The images are consisting of both whole and broken grain rice. After segmentation and morphological operations, each object of an individual image is labelled as shown in Figure 7h–l. The features associated with each object (e.g., Object 1 in Figure 7h) are stored with the associated objectID in a tuple. These data set are further being used in training and testing of the classifier.
3.2. Classification Performance
The features extracted from processed training images were used to build the ANFIS model. Test error was found to be on training data for 20 epochs during ANFIS training (Figure 8). The error was zero for test data after thresholding (threshold at 2) on ANFIS output. The results of training and testing are quite impressive as shown in Figure 8 and it is further analyzed in Table 1.
From Table 1 it is observed that for the majority of the objects (rice grains in test image) the ANFIS output threshold class is similar to actual class (i.e., 0 or 1). Therefore, the classification accuracy of ANFIS is 100%, as an actual class and ANFIS output class for the test objects are alike.
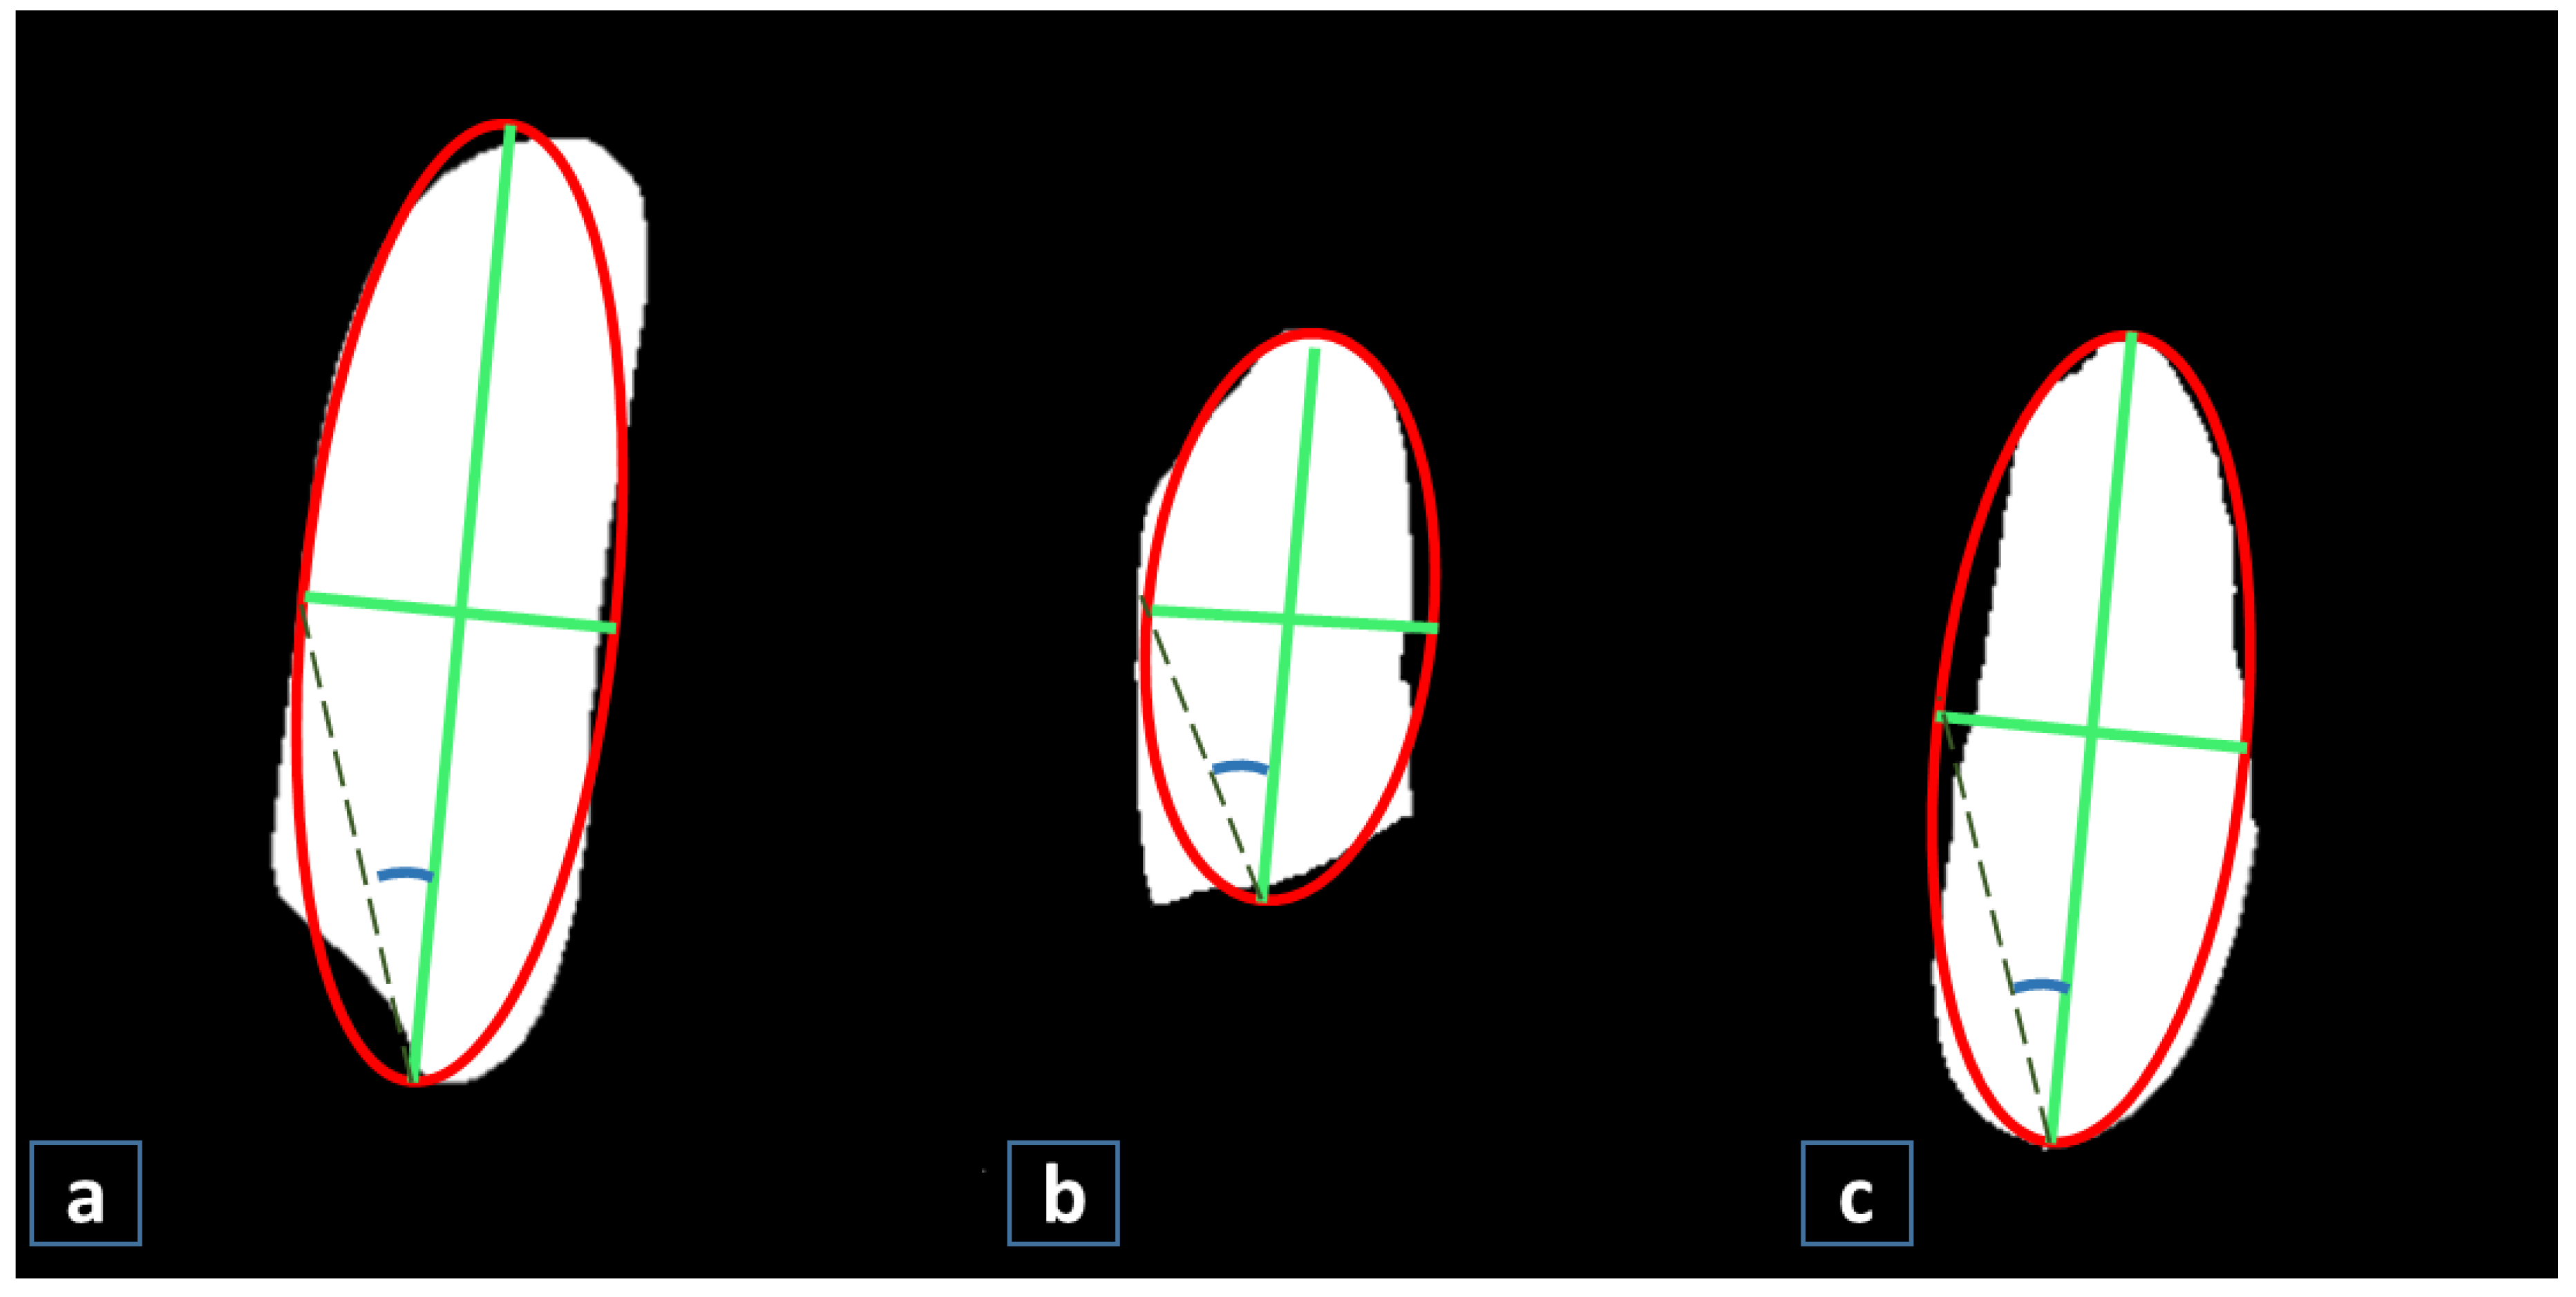
Here it is important to note that the proposed approach categorizes basmati rice grains into two categories: (1) whole grain and (2) broken grain. Perhaps the readers can imagine what happens with imperfect grains or the imperfect whole grain? For an imperfect grain, the morphological parameters are different from a whole grain. The present study considers a binary classification (‘whole grain’ , ‘broken grains or/and others’ ). The membership function is taken as ‘High’ and ‘Low’ (cf. Section 2.5). For an imperfect grain eccentricity will be ‘low’, () is ‘low’. Perimeter might be ‘medium’. However, in our case membership function is set to ‘High’ and ‘Low’. Therefore, it will be classified as ‘broken grain’. By virtue of these, imperfect grain anyhow is separated from ‘whole grain’, thus it is not affecting ‘milling efficiency’. Figure 9 illustrates a similar scenario which is analyzed from a test image. It is clearly showing a dissimilarity between grain physical parameters for three-grain types.
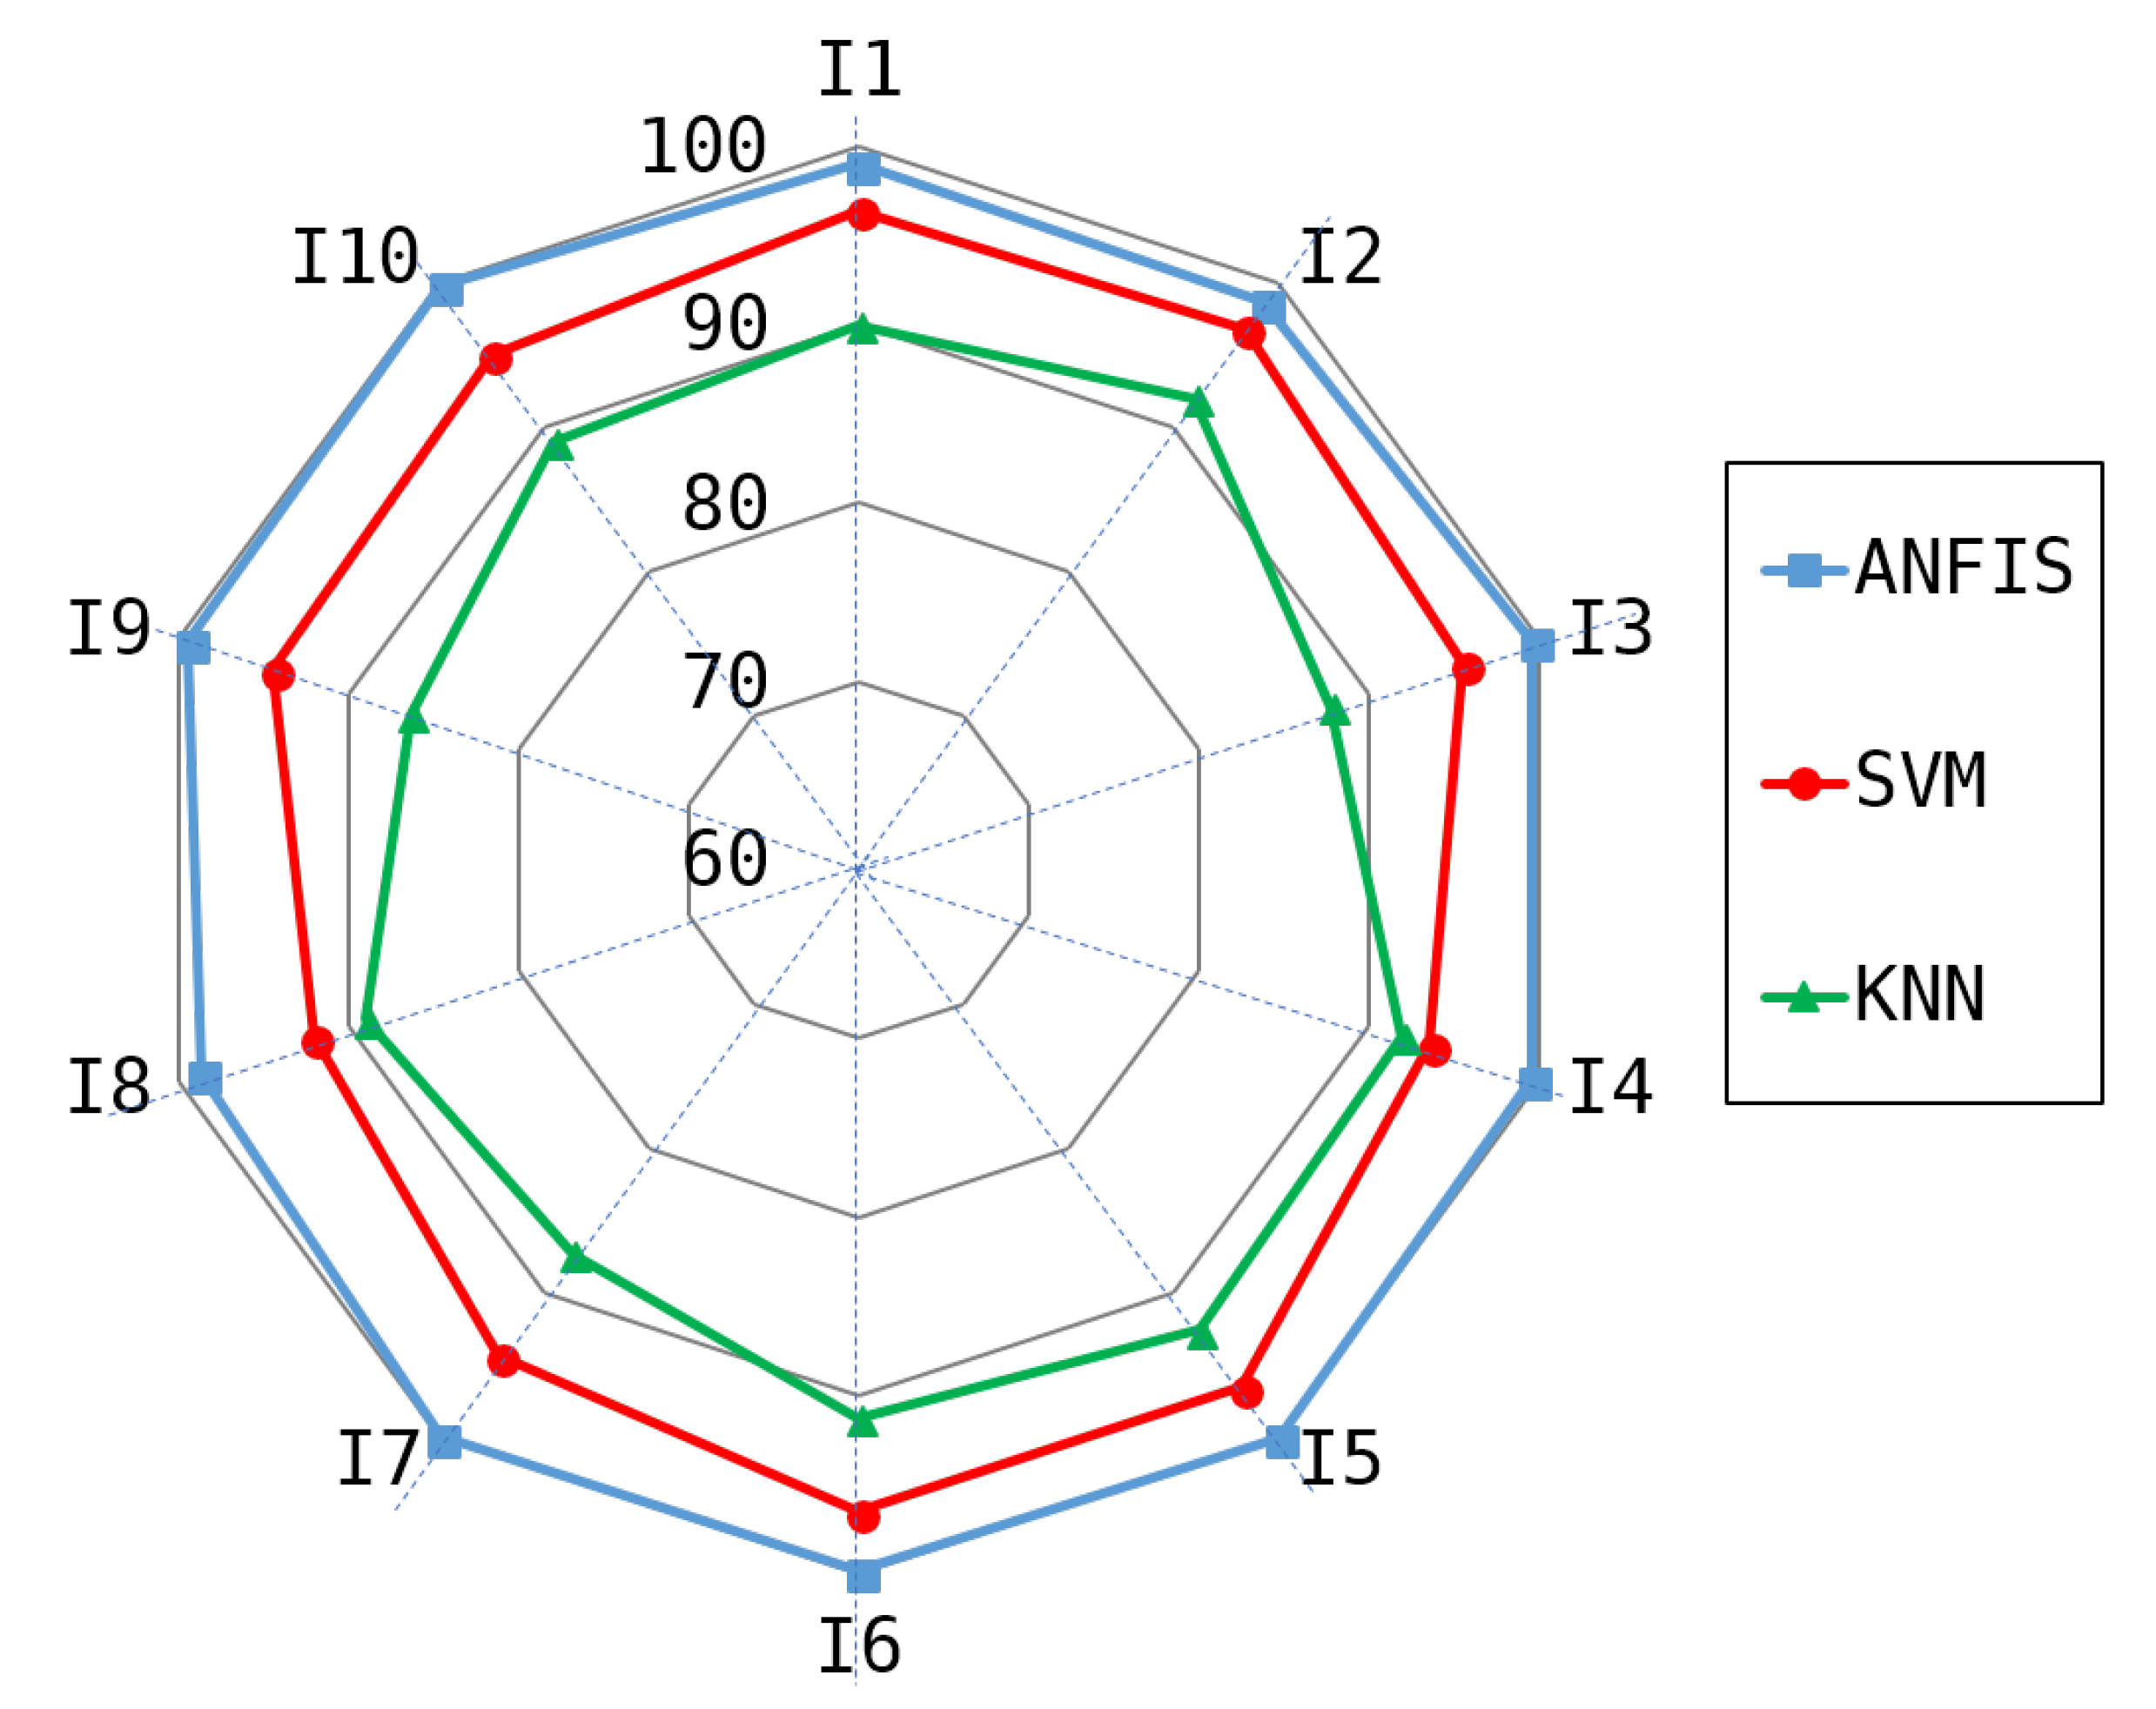
From the experimental results, it is observed that the ANFIS perform satisfactorily in evaluating the percentage of broken rice with an overall accuracy of >98.5%. However, the comparative analysis with the SVM and KNN are less favourable with accuracies <95% for 10 test images as shown in spider plot in Figure 10.
3.3. Histogram of Features in Testing Images
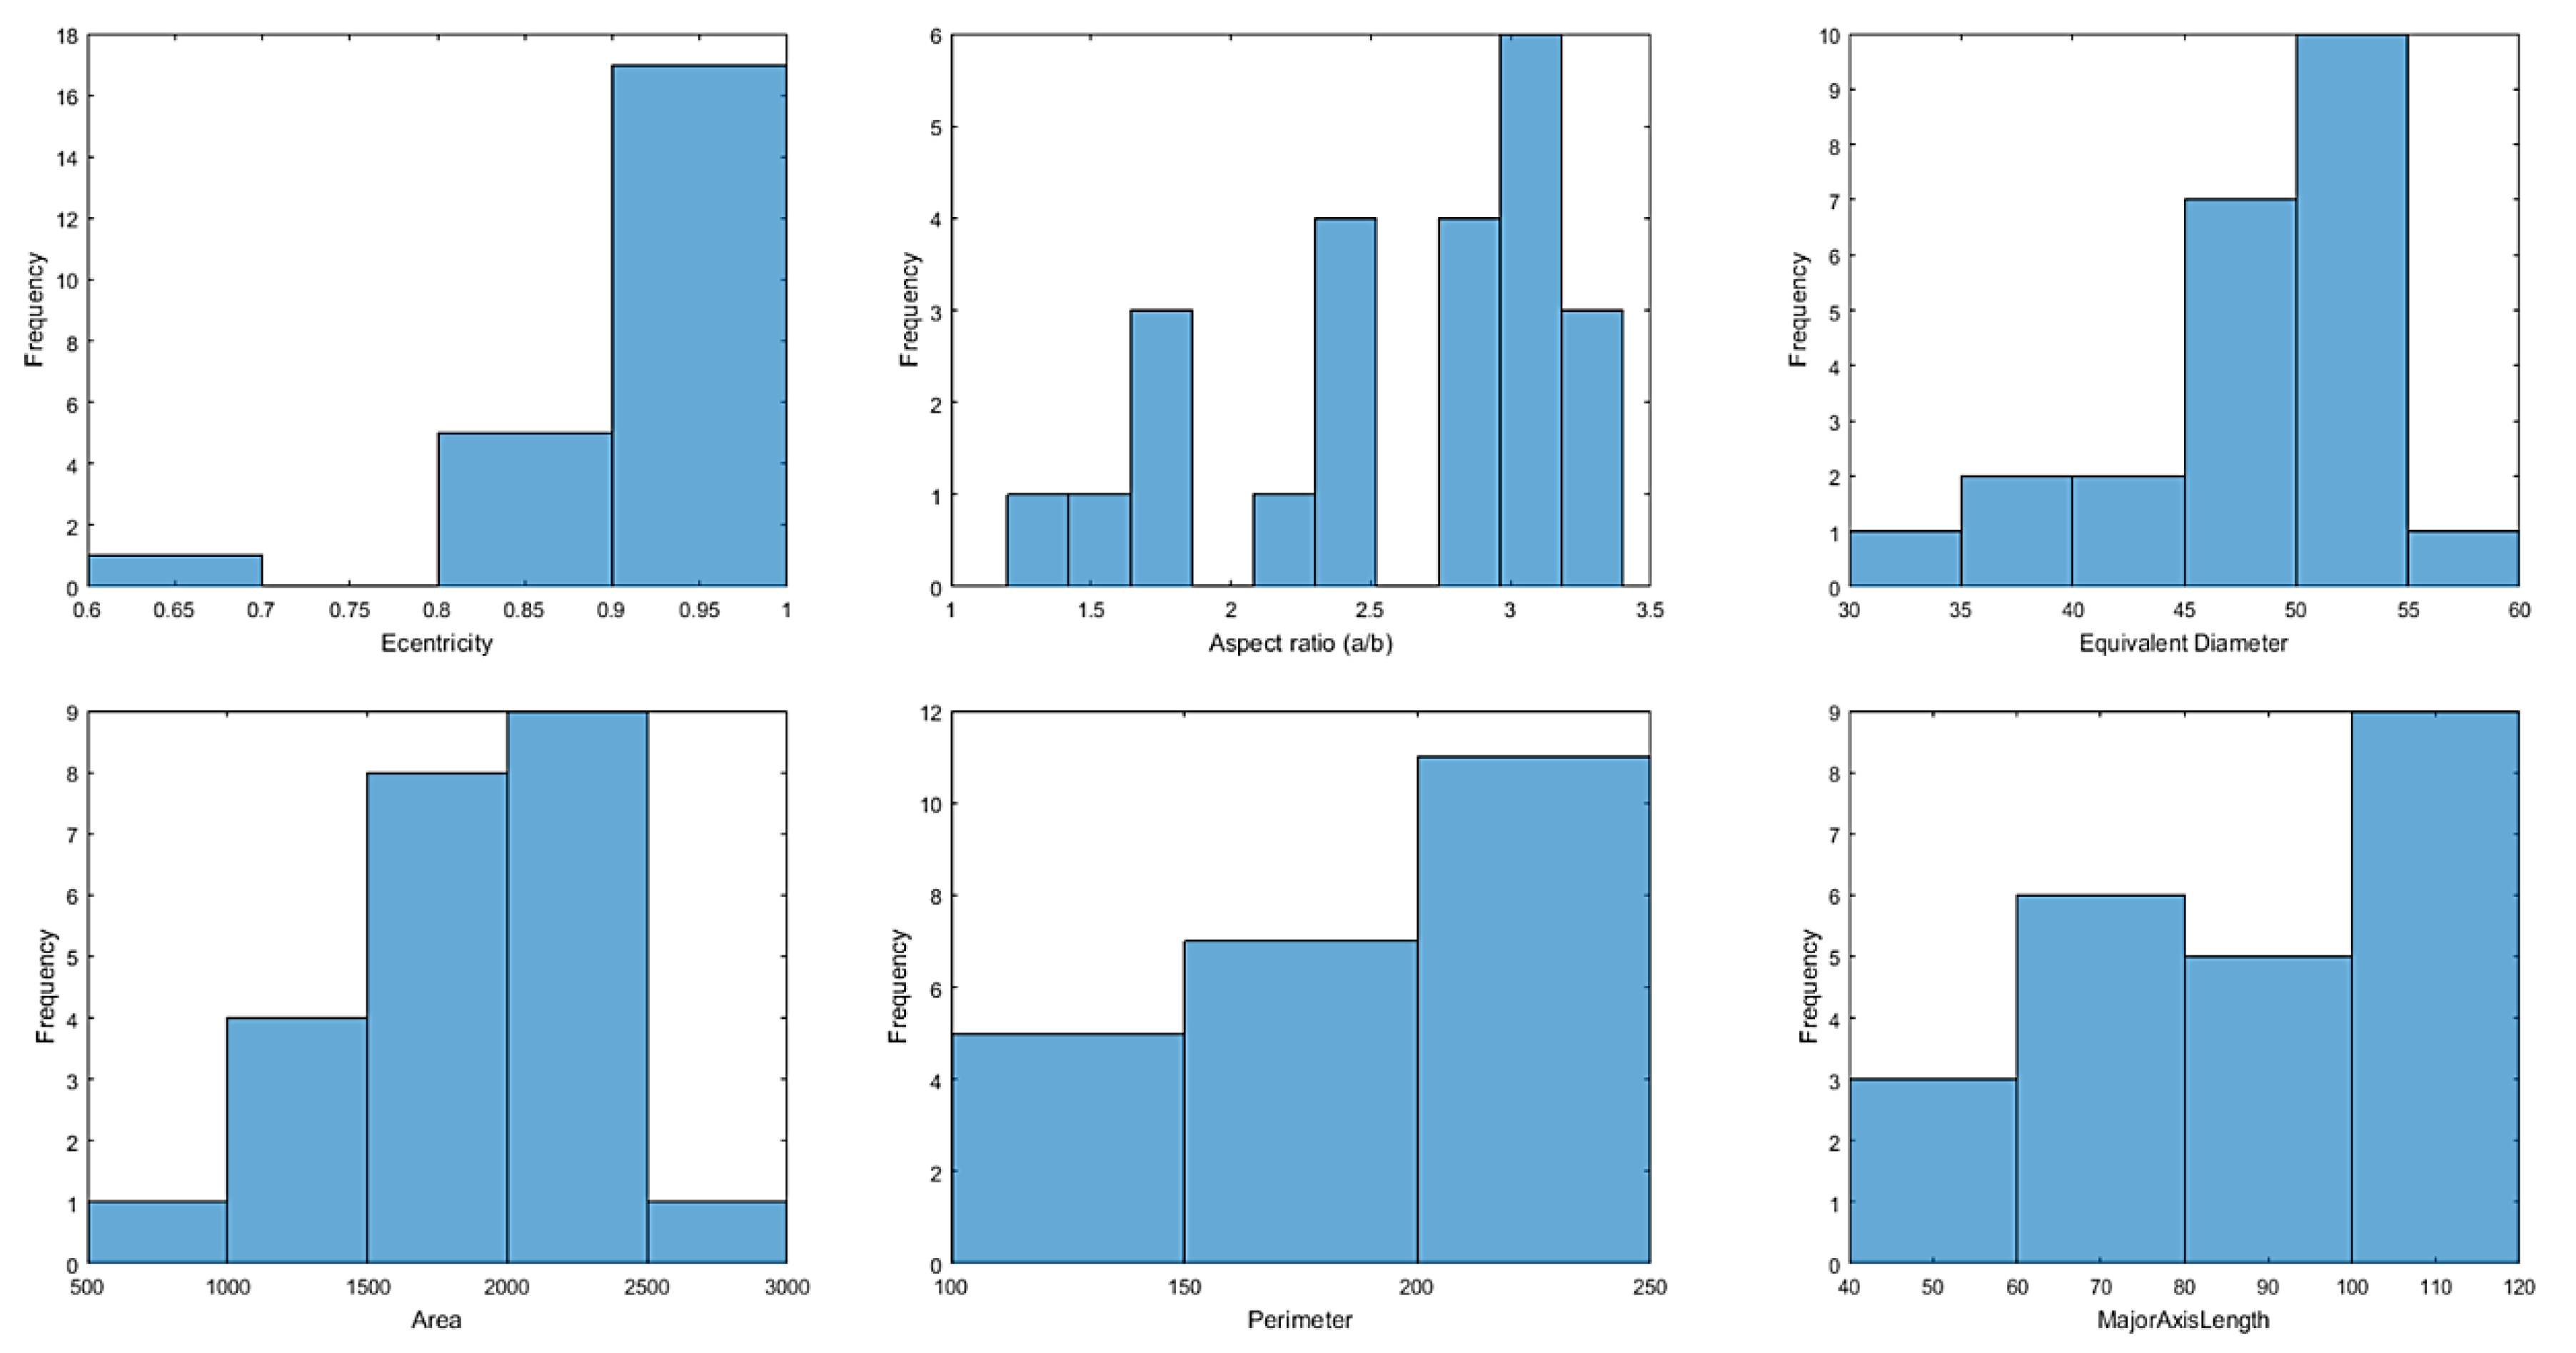
Histograms of feature extracted from the test image objects are shown in Figure 11. All the features are positively skewed representing a positive relation with basmati grain size (head grain). The occurrence of eccentricity >0.9 is found for more than 16 rice objects in the test image. The aspect ratio is >2.4 for more than 17 objects. Similar results are also shown in the case of area, perimeter and major axis length. The histogram images as shown in Figure 11, also exemplify the head grain and broken grain percentage in the test images.
3.4. Milling Efficiency
From the test image output results, the number of the whole grains out of 22 objects, whereas, the broken grain objectsare = 5 out of 22 objects. Therefore, the percentage of whole grain %. This milling efficiency () was found for a specific roller characteristic (rpm and gap between roller ∼0.5 mm) of the milling machine [45]. The milling efficiencies were evaluated in a similar way for the 10 test images. Subsequently, the average of all the 10 milling efficiencies was determined, which is ∼77.3% with a standard deviation () of 1.5. The milling efficiency () derived using the image-based method was in accordance with the manual calculation results (%).
4. Summary and Conclusions
Standard classification technique seldom incorporates domain knowledge associated with the physical properties of rice grain. Hence, a knowledge-based neuro-fuzzy classification technique was proposed in this study for grading of basmati rice grains. This technique takes into account the physical properties of grain devised from an image-based method to classify whole and broken grain.
A novel image processing technique was adopted for morphological feature extraction followed by ANFIS model building for discrimination of grains. The classification accuracy for the test images were >98.6%, which comparatively better than standard SVM and KNN classifier (<95%). Moreover, the proposed ANFIS classification results seem to be more reliable than the results obtained from SVM and KNN, since it deals with uncertainty in output. It is important to note that the standard technique does not take into account any domain knowledge associated with grain physical properties. In fact, the physical properties are essential for grain grading and characterization as analyzed in this study.
The milling efficiency was estimated in terms of percentage of whole grain or head grain and it was 77.27% for the test sample. However, the colour and texture based quality and grading was not considered during feature selection. The overall results of the adopted methodology were promising in terms of classification accuracy and efficiency. This work can be extended to discrimination of different rice varieties for determining the degree adulteration. Furthermore, the real-time image processing based grading can be addressed equally. This can be extended for optimization of milling machine parts characteristics during milling operation (roller parameter-speed, the gap between rollers) for process automation using micro-controller units.
Funding
This research received no external funding.
Acknowledgments
The author would like to thank Rice Processing Unit, Department of Postharvest Engineering, Bidhan Chandra Krishi Viswavidyalaya, India for providing sample images of basmati rice.
Conflicts of Interest
The authors declare no conflict of interest.
References
- All India Rice Exporters Association. Export Statistics of Basmati Rice. 2015. Available online: http://www.airea.net/page/58/statistical-data/export-statistics-of-basmati-rice/ (accessed on 10 April 2018).
- Bhattacharjee, P.; Singhal, R.S.; Kulkarni, P.R. Basmati rice: A review. Int. J. Food Sci. Technol. 2002, 37, 1–12. [Google Scholar] [CrossRef]
- Mandal, D. Concepts of Farm Machinery and Power; Narendra Publishing House: Delhi, India, 2016. [Google Scholar]
- Brosnan, T.; Sun, D.W. Improving quality inspection of food products by computer vision—A review. J. Food Eng. 2004, 61, 3–16. [Google Scholar] [CrossRef]
- Zheng, C.; Sun, D.W.; Zheng, L. Recent developments and applications of image features for food quality evaluation and inspection—A review. Trends Food Sci. Technol. 2006, 17, 642–655. [Google Scholar] [CrossRef]
- Cheng, F.; Ying, Y.B. Machine vision inspection of rice seed based on Hough transform. J. Zhejiang Univ. Sci. A 2004, 5, 663–667. [Google Scholar]
- Maheshwari, C.V.; Jain, K.R. Parametric quality analysis of indian Ponia Oryza Sativa SSP Indica (Rice). Int. J. Sci. Res. Dev. 2013, 1, 114–118. [Google Scholar]
- Vaingankar, N.M.; Kulkarni, P.R. A cooking quality parameter as an indicator of adulteration of Basmati rice. J. Sci. Food Agric. 1989, 48, 381–384. [Google Scholar] [CrossRef]
- Verma, B. Image processing techniques for grading & classification of rice. In Proceedings of the 2010 International Conference on Computer and Communication Technology (ICCCT), Allahabad, India, 17–19 September 2010; pp. 220–223. [Google Scholar]
- Zareiforoush, H.; Minaei, S.; Alizadeh, M.R.; Banakar, A. Potential applications of computer vision in quality inspection of rice: a review. Food Eng. Rev. 2015, 7, 321–345. [Google Scholar] [CrossRef]
- Zareiforoush, H.; Minaei, S.; Alizadeh, M.R.; Banakar, A. Qualitative classification of milled rice grains using computer vision and metaheuristic techniques. J. Food Sci. Technol. 2016, 53, 118–131. [Google Scholar] [CrossRef] [PubMed]
- Liu, J.; Tang, Z.; Xu, P.; Liu, W.; Zhang, J.; Zhu, J. Quality-related monitoring and grading of granulated products by weibull-distribution modeling of visual images with semi-supervised learning. Sensors 2016, 16, 998. [Google Scholar] [CrossRef] [PubMed]
- Pazoki, A.; Farokhi, F.; Pazoki, Z. Classification of rice grain varieties using two Artificial Neural Networks (MLP and Neuro-Fuzzy). J. Anim. Plant Sci. 2014, 24, 336–343. [Google Scholar]
- Chen, X.; Xun, Y.; Li, W.; Zhang, J. Combining discriminant analysis and neural networks for corn variety identification. Comput. Electron. Agric. 2010, 71, S48–S53. [Google Scholar] [CrossRef]
- Pamučar, D.; Ljubojević, S.; Kostadinović, D.; Đorović, B. Cost and risk aggregation in multi-objective route planning for hazardous materials transportation—A neuro-fuzzy and artificial bee colony approach. Expert Syst. Appl. 2016, 65, 1–15. [Google Scholar] [CrossRef]
- Lukovac, V.; Pamučar, D.; Popović, M.; Đorović, B. Portfolio model for analyzing human resources: An approach based on neuro-fuzzy modeling and the simulated annealing algorithm. Expert Syst. Appl. 2017, 90, 318–331. [Google Scholar] [CrossRef]
- Adhikari, R. A neural network based linear ensemble framework for time series forecasting. Neurocomputing 2015, 157, 231–242. [Google Scholar] [CrossRef]
- Ioannou, K.; Arabatzis, G.; Lefakis, P. Predicting the prices of forest energy resources with the use of Artificial Neural networks (ANNs). The case of conifer fuel wood in Greece. J. Environ. Protect. Ecol. 2009, 10, 678–694. [Google Scholar]
- Vishwakarma, M.D.D. Genetic algorithm based weights optimization of artificial neural network. Int. J. Adv. Res. Electr. Electron. Instrum. Eng. 2012, 1, 206–211. [Google Scholar]
- Jiang, Y. Uncertainty in the output of artificial neural networks. IEEE Trans. Med. Imaging 2003, 22, 913–921. [Google Scholar] [CrossRef] [PubMed]
- Sabanci, K.; Toktas, A.; Kayabasi, A. Grain classifier with computer vision using adaptive neuro-fuzzy inference system. J. Sci. Food Agric. 2017, 97, 3994–4000. [Google Scholar] [CrossRef] [PubMed]
- Zareiforoush, H.; Minaei, S.; Alizadeh, M.R.; Banakar, A. A hybrid intelligent approach based on computer vision and fuzzy logic for quality measurement of milled rice. Measurement 2015, 66, 26–34. [Google Scholar] [CrossRef]
- Mamdani, E.H. Application of fuzzy algorithms for control of simple dynamic plant. Proc. Inst. Electr. Eng. 1974, 121, 1585–1588. [Google Scholar] [CrossRef]
- Hosseinzadeh, B.; Esmaeili, Z.; Rostami, S.; Zareiforoush, H. Representing the Human Experts Judgment on Quality Indices of White Rice by Image Processing and Artificial Intelligence Techniques. Agric. Eng. Int. CIGR J. 2016, 18, 97–106. [Google Scholar]
- Shiddiq, D.M.; Nazaruddin, Y.Y.; Muchtadi, F.I.; Raharja, S. Estimation of rice milling degree using image processing and adaptive network based fuzzy inference system (ANFIS). In Proceedings of the 2011 2nd International Conference on Instrumentation Control and Automation (ICA), Bandung, Indonesia, 15–17 November 2011; pp. 98–103. [Google Scholar]
- Kamath, S.; Stephen, J.; Suresh, S.; Barai, B.; Sahoo, A.; Radhika Reddy, K.; Bhattacharya, K.R. Basmati rice: Its characteristics and identification. J. Sci. Food Agric. 2008, 88, 1821–1831. [Google Scholar] [CrossRef]
- Singh, R.K.; Khush, G.S. Aromatic Rices; International Rice Research Institute: Los Baños, Philippines, 2000. [Google Scholar]
- Singh, V.; Singh, A.K.; Mohapatra, T.; Ellur, R.K. Pusa Basmati 1121—A rice variety with exceptional kernel elongation and volume expansion after cooking. Rice 2018, 11, 19. [Google Scholar] [CrossRef] [PubMed]
- Sun, D.W. Computer Vision Technology for Food Quality Evaluation; Academic Press: Amsterdam, The Netherland, 2016. [Google Scholar]
- Abdullah, M.; Fathinul-Syahir, A.; Mohd-Azemi, B. Automated inspection system for colour and shape grading of starfruit (Averrhoa carambola L.) using machine vision sensor. Trans. Inst. Meas. Control 2005, 27, 65–87. [Google Scholar] [CrossRef]
- Paulsen, M. Using machine vision to inspect oilseeds. Int. News Fats Oils Relat. Mater. 1990, 1, 50–55. [Google Scholar]
- Otsu, N. A threshold selection method from gray-level histograms. IEEE Trans. Syst. Man Cybern. 1979, 9, 62–66. [Google Scholar] [CrossRef]
- Soille, P. Morphological Image Analysis: Principles and Applications; Springer Science & Business Media: Berlin/Heidelberg, Germany, 2013. [Google Scholar]
- Shantaiya, S.; Ansari, U. Identification of food grains and its quality using pattern classification. In Proceedings of the 12th IEEE International Conference on Communication Technology (ICCT), Nanjing, China, 11–14 November 2010; Volume 1114, p. 35. [Google Scholar]
- Mousavirad, S.; Tab, F.A.; Mollazade, K. Design of an expert system for rice kernel identification using optimal morphological features and back propagation Neural Network. Int. J. APpl. Inf. Syst. 2012, 3, 33–37. [Google Scholar]
- Camastra, F.; Ciaramella, A.; Giovannelli, V.; Lener, M.; Rastelli, V.; Staiano, A.; Staiano, G.; Starace, A. A fuzzy decision system for genetically modified plant environmental risk assessment using Mamdani inference. Expert Syst. Appl. 2015, 42, 1710–1716. [Google Scholar] [CrossRef]
- Cornelissen, A.; van den Berg, J.; Koops, W.; Grossman, M.; Udo, H. Assessment of the contribution of sustainability indicators to sustainable development: A novel approach using fuzzy set theory. Agric. Ecosyst. Environ. 2001, 86, 173–185. [Google Scholar] [CrossRef]
- Klir, G.; Yuan, B. Fuzzy Sets and Fuzzy Logic; Prentice Hall: Upper Saddle River, NJ, USA, 1995. [Google Scholar]
- Takagi, T.; Sugeno, M. Fuzzy identification of systems and its applications to modeling and control. In Readings in Fuzzy Sets for Intelligent Systems; Morgan Kaufman: San Mateo, CA, USA, 1993; pp. 387–403. [Google Scholar]
- Gulley, N. Fuzzy logic toolbox for use with MATLAB; MathWorks, Inc.: Natick, MA, USA, 1996. [Google Scholar]
- Jang, J.S. ANFIS: Adaptive-network-based fuzzy inference system. IEEE Trans. Syst. Man Cybern. 1993, 23, 665–685. [Google Scholar] [CrossRef]
- Walia, N.; Singh, H.; Sharma, A. ANFIS: Adaptive neuro-fuzzy inference system—A survey. Int. J. Comput. Appl. 2015, 123, 32–38. [Google Scholar] [CrossRef]
- Al-Hmouz, A.; Shen, J.; Al-Hmouz, R.; Yan, J. Modeling and simulation of an adaptive neuro-fuzzy inference system (ANFIS) for mobile learning. IEEE Trans. Learn. Technol. 2012, 5, 226–237. [Google Scholar] [CrossRef]
- Uçar, T.; Karahoca, A.; Karahoca, D. Tuberculosis disease diagnosis by using adaptive neuro fuzzy inference system and rough sets. Neural Comput. Appl. 2013, 23, 471–483. [Google Scholar] [CrossRef]
- Sharma, P.; Chakkaravarthi, A.; Singh, V.; Subramanian, R. Grinding characteristics and batter quality of rice in different wet grinding systems. J. Food Eng. 2008, 88, 499–506. [Google Scholar] [CrossRef]
Figure 1.
Schematic diagram of image acquisition system equipped with a camera, illumination source and geometry, and connected PC.
Figure 1.
Schematic diagram of image acquisition system equipped with a camera, illumination source and geometry, and connected PC.

Figure 2.
Schematic workflow for image processing.

Figure 3.
Rice grain properties.

Figure 4.
Takagi-Sugeno type FIS system with premise and consequent part.

Figure 5.
Membership function for Eccentricity feature.

Figure 6.
ANFIS architecture with input, hidden and output layer [43].
Figure 6.
ANFIS architecture with input, hidden and output layer [43].

Figure 7.
Image processing outputs. (a) Raw sample image (RGB); (b) Red channel image; (c) Green channel image; (d) Blue channel image; (e) Binary image; (f) Image after morphological opening; (g) Hole filled and border cleared image; (h) Labelled objects in training sample1 image; (i) Labelled objects in training sample 2 image; (j) Labelled objects in training sample 3 image; (k) Labelled objects in training sample 4 image; (l) Labelled objects in test sample image.

Figure 8.
Training and test error for sample images. During training, after 11 epochs the error significantly reduces. In test error plot, the blue dots are actual output, and the red stars are ANFIS output corresponding to each object.
Figure 8.
Training and test error for sample images. During training, after 11 epochs the error significantly reduces. In test error plot, the blue dots are actual output, and the red stars are ANFIS output corresponding to each object.

Figure 9.
Variations in features in between different grains. (a) Whole rice grain; (b) Broken rice grain; (c) Imperfect rice grain.
Figure 9.
Variations in features in between different grains. (a) Whole rice grain; (b) Broken rice grain; (c) Imperfect rice grain.

Figure 10.
Classification performance of ANFIS, SVM and KNN for 10 test image samples. I1-I10 represents the test image IDs.
Figure 10.
Classification performance of ANFIS, SVM and KNN for 10 test image samples. I1-I10 represents the test image IDs.

Figure 11.
Histogram of eccentricity, aspect ratio, equivalent diameter, area, perimeter and major axis length of test image objects.
Figure 11.
Histogram of eccentricity, aspect ratio, equivalent diameter, area, perimeter and major axis length of test image objects.


Table 1.
ANFIS results for test image for each rice object. Threshold is applied with rule: If (ANFIS output class > 2) Then (ANFIS output class thresholded = 0).
Table 1.
ANFIS results for test image for each rice object. Threshold is applied with rule: If (ANFIS output class > 2) Then (ANFIS output class thresholded = 0).
| Object Label | Actual Class | ANFIS Output Class | ANFIS Class Output Thresholded |
|---|---|---|---|
| 1 | 1 | 2.353 | 1 |
| 2 | 1 | 2.723 | 1 |
| 3 | 1 | 2.352 | 1 |
| 4 | 1 | 2.240 | 1 |
| 5 | 0 | 1.168 | 0 |
| 6 | 0 | 0.859 | 0 |
| 7 | 1 | 2.050 | 1 |
| 8 | 1 | 2.228 | 1 |
| 9 | 1 | 2.973 | 1 |
| 10 | 0 | 1.073 | 0 |
| 11 | 1 | 2.971 | 1 |
| 12 | 1 | 2.231 | 1 |
| 13 | 1 | 1.992 | 1 |
| 14 | 1 | 2.309 | 1 |
| 15 | 0 | 0.841 | 0 |
| 16 | 0 | 0.959 | 0 |
| 17 | 1 | 3.189 | 1 |
| 18 | 1 | 2.183 | 1 |
| 19 | 1 | 2.251 | 1 |
| 20 | 1 | 2.347 | 1 |
| 21 | 1 | 3.184 | 1 |
| 22 | 1 | 2.182 | 1 |
© 2018 by the author. Licensee MDPI, Basel, Switzerland. This article is an open access article distributed under the terms and conditions of the Creative Commons Attribution (CC BY) license (http://creativecommons.org/licenses/by/4.0/).
Share and Cite
MDPI and ACS Style
Mandal, D. Adaptive Neuro-Fuzzy Inference System Based Grading of Basmati Rice Grains Using Image Processing Technique. Appl. Syst. Innov. 2018, 1, 19. https://doi.org/10.3390/asi1020019
AMA Style
Mandal D. Adaptive Neuro-Fuzzy Inference System Based Grading of Basmati Rice Grains Using Image Processing Technique. Applied System Innovation. 2018; 1(2):19. https://doi.org/10.3390/asi1020019
Chicago/Turabian StyleMandal, Dipankar. 2018. "Adaptive Neuro-Fuzzy Inference System Based Grading of Basmati Rice Grains Using Image Processing Technique" Applied System Innovation 1, no. 2: 19. https://doi.org/10.3390/asi1020019