In-Situ Kinetic Investigation of Calcium Aluminate Formation


1
Department of Materials Science and Engineering, University of Tennessee, Knoxville, TN 37996, USA
2
Center for Materials Processing, University of Tennessee, Knoxville, TN 37996, USA
*
Author to whom correspondence should be addressed.
Ceramics 2018, 1(1), 175-197; https://doi.org/10.3390/ceramics1010016
Submission received: 3 August 2018
/
Revised: 20 August 2018
/
Accepted: 20 August 2018
/
Published: 28 August 2018
Abstract
:Rapid in-situ non-ambient X-ray diffraction represents a powerful tool for characterizing the evolution of crystalline materials in real time. The calcium aluminate system and formation of Ca12Al14O33 (C12A7) is particularly sensitive to processing conditions. This report characterizes the kinetic pathways to thermodynamic equilibrium as a function of atmosphere (ambient, dry, and vacuum) and reactant heterogeneity (as-received, milled, and sol-gel reactants). When reactants are heterogenous (as-received and milled), intermediary phases of Ca3Al2O6 (C3A) and CaAl2O4 (CA) are observed as the route to C12A7 formation and Ca5Al6O14 (C5A3) is only observed as a decomposition product of C12A7. When reactants are heterogenous, C12A7 is only thermodynamically favorable under ambient conditions due to the stability provided by hydration. When reactants are homogenous (sol-gel), direct crystallization of C12A7 from an amorphous precursor is observed at low temperature regardless of atmosphere defining C12A7 as the kinetic equilibrium. These findings accurately define the heterogenous formation pathways and report for the first time the formation of C12A7 under a carbon-free vacuum environment.
1. Introduction
Ca12Al14O33, the mineral mayenite or C12A7, crystallizes in a clathrate structure where a positively-charged framework is balanced by occluded anionic species. The high interconnectivity of the cages in the clathrate structure leads to high occluded anion mobility. The functionality of the structure is derived from the mobility and diversity of occluded chemical species leading to a wide range of applications [1,2]. The C12A7 structure, occluded anion speciation, lattice parameter, and kinetic formation are all heavily correlated to processing conditions [3,4,5]. Current thermodynamic studies of C12A7 present a thermodynamic equilibrium-derived inference on the kinetics of phase formation. With the thermodynamic phase equilibria defined, an in situ kinetic structural investigation of C12A7 is warranted to better understand the proposed kinetic pathways to thermodynamic equilibrium. With this knowledge, careful control of synthesis can lead to optimization of material properties for a wide variety of applications.
C12A7 thermodynamic phase equilibria is well characterized, and through characterization of these end points inferences of the kinetic pathways were made [6,7]. Thermodynamic equilibria of calcium aluminate formation via solid state synthesis (SSS) reactants CaCO3 and Al2O3 identify C5A3 (Ca5Al6O14) and C3A (Ca3Al2O6) as the first phases to form, followed by aluminum rich phases—for example CA (CaAl2O4)—regardless of starting reactant stoichiometry; this leads to the suggestion that the diffusion of Ca is the kinetic pathway to the equilibrium [6]. Tian et al. characterized an onion-like microstructure structure where Al2O3 particles are at the core and layers of progressively higher Ca containing calcium aluminate phases consecutively surround the core through to the surface [6]. More specifically, for C12A7 stoichiometry the synthesis pathway is dependent on the heterogeneity of starting reactants and two formation pathways—(1) C5A3 + C3A and (2) C3A + CA—are observed in high homogeneity and low homogeneity cases, respectively [7]. The C5A3 and C3A pathway is predicted to be the low temperature pathway for C12A7 formation as reactant homogeneity increases via wet chemistry/sol-gel techniques. C12A7 thermodynamic phase equilibria also changes with process environment. C12A7 is precluded from the thermodynamic CaO-Al2O3 binary phase diagram under dry atmospheres and only appears when moisture is present, indicating metastability under elevated temperature conditions in inert, dry oxidative, or reducing atmospheres [2]. Thermodynamic studies have thoroughly characterized the phase equilibria, but a kinetic characterization and confirmation of the proposed kinetic pathway to equilibrium is missing.
The historical characterization of phase equilibria has adopted a thermodynamic approach. The technique dubbed ‘cook and look’ involves heating at a temperature for an extended period of time, quenching to retain the phase assemblage, and then structurally characterizing the results. This characterizes the thermodynamic equilibria well but information on the kinetic pathway is lost. The kinetic transformation can be captured by quenching the sample at various process durations and temperatures to ‘freeze in the evolving phases’; however, this requires Edisonian experimental procedures, and only provides a single snapshot of the behavior. If the sampling rate is not high enough full kinetic pathways could be missed. While quenching works to freeze diffusive transformations, non-diffusive phase transformations behavior may be lost during the quench due to the fast transformation rates.
With the advances in computational modeling and instrumentation software and hardware, the precise and high-resolution structural determination of kinetic pathways is now possible in a laboratory setting. In situ non-ambient high-temperature X-ray diffraction (HTXRD) provides a characterization method that can probe the kinetics of phase transformations in real time by rapidly collecting diffraction patterns during heating. This allows for identification of metastable and non-equilibrium phases and formation pathways. Until recently this type of characterization required travel to a synchrotron X-ray or time-of-flight neutron source to collect diffraction data at the intervals needed to capture fast kinetic transitions. Lab XRD has evolved to where an area detector can continuously monitor a large enough region of °2θ, where several key phase diffraction maxima are located, dynamically replacing point detectors and leading to large increases in measurement of diffracted intensity as a function of °2θ.
The Malvern PANalytical Empyrean diffractometer (PANalytical, Almelo, The Netherlands) equipped with an Anton Paar HTK1200N high temperature furnace and PIXcel3d area detector provides stable controllable sample environmental modification and rapid data collection. Rapid data collection on heating captures dynamic and static phase transformations. A combination of isothermal and non-isothermal data collection, normally acquired through thermal analysis characterization, can be used to derive information about the activation energy, type of kinetic process, limitations in kinetic transformations, and modes of structural transformation.
Specifics of the kinetic transformation can be determined by analyzing the integrated peak area, or phase fraction determined through Rietveld refinement if multiple phases coexist, to track the evolution of crystallization as a function of time or temperature. This parameter, frequently denoted , is analyzed as a function of time at a constant temperature in an isothermal characterization, or time and temperature in a non-isothermal characterization. To properly identify the limiting kinetics of the phase transformations, the development of a master plot allows for direct comparison of the rate of reaction to various kinetic models [8].
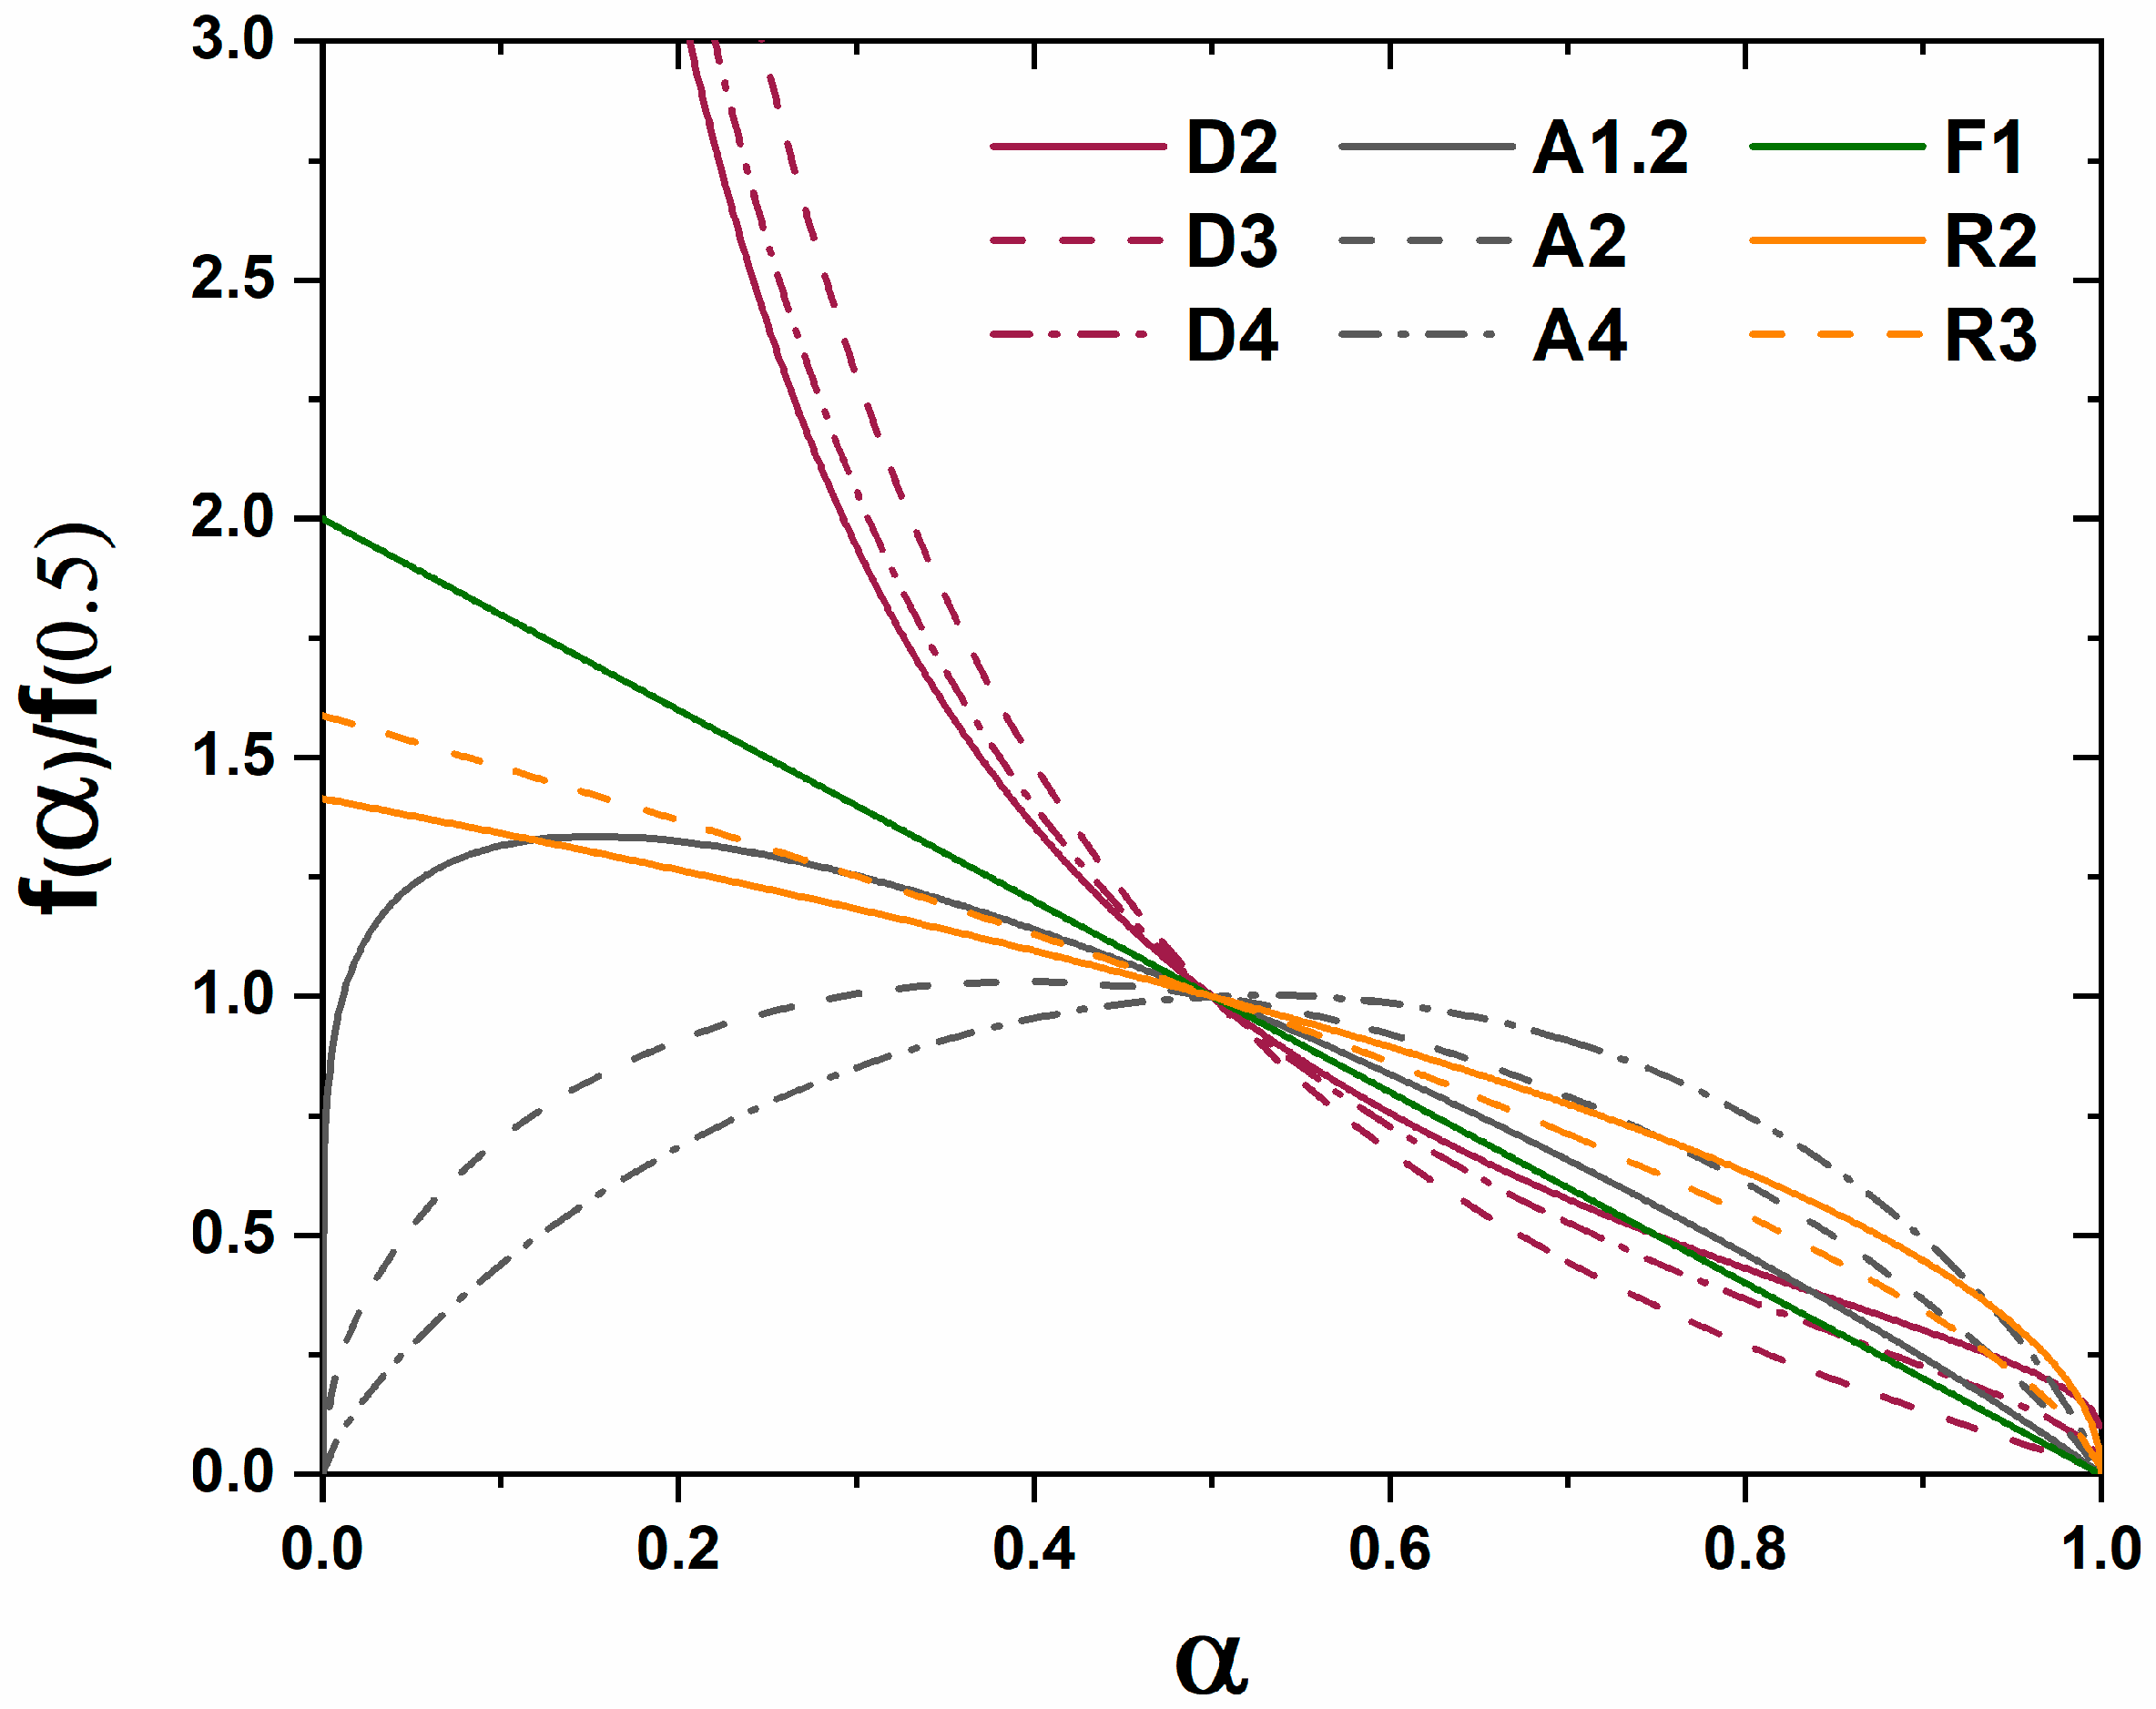
A master plot is a diagram which graphically represents an analytical expression for the rate of transformation vs. transformed fraction for diffusion, phase boundary, and random nucleation and growth kinetic models [8]. When experimental data are superimposed on the diagram the type of kinetic transformation can be elucidated based on the correlation of experimental data to the analytical expression of the theoretical models. Gotor et al. redefined a method for creating master plots which can be applied universally to the analysis of solid state kinetic transformations regardless of the temperature dependence of the characterization [8]. The original application was mass loss and controlled rate thermal analysis techniques, but with the advent of kinetic HTXRD analysis the methods can be reinterpreted for X-ray characterization. For isothermal characterization only a single isothermal vs. time curve is needed to identify the kinetic model which best characterizes the kinetic transformation. For a linear non-isothermal temperature vs. time dependence (isochronal), an vs. temperature curve and the activation energy of the transition is needed to utilize the master plot. Activation energy can be derived from thermal analysis characterization or through multiple isothermal characterization and implementation of methods such as the Kissinger method [9]. For a non-linear non-isothermal temperature vs. time dependence the relationship between temperature and time, α as a function of temperature, and activation energy must be known [8].
The functions for diffusion, grain boundary, and homogenous nucleation and growth kinetic transformations are represented in Table 1. The master plot is created by plotting and the experimental data . The master plot of vs. is shown Figure 1.
The homogenous nucleation and growth kinetic model is known as the Johnson-Mehl-Avrami-Kolmogorov (JMAK) model. The kinetics of this transformation have three distinct processes: the first is homogenous random nucleation, followed by nuclei growth, and nuclei impingement. The most widely used form of the model is a special JMAK case which assumes that nucleation occurs randomly and homogeneously and that the growth rate is constant with respect to time and transformed fraction (Equation (1)) [10]. k, described in Equation (2), represents a temperature-dependent rate constant dependent on the growth mode factor, m, dimensionality, d, dimensionality of growth, fd, system entropy, effective attempt frequency, kb Boltzmann constant, and particle growth rate. n, described in Equation (3), represents the JMAK exponent which is dependent on the dimensionality and the growth mode [11].
Conventional analysis involves determining these two values (k and n) through data fitting and deriving information about the kinetic transformation dimensionality, growth mode, and activation energy. Table 2 demonstrates the analysis of JMAK exponent for different kinetic models.
In the case of heterogeneous kinetic transformations, commonly referred to as diffusion controlled transformations, the mobility of constituents in the system controls the transformation rate. In homogeneous reactions the growth of the new phase is expected to occur non-preferentially, whereas in heterogenous reactions the nucleation and growth occurs at preferred non-homogenous interfaces. In heterogeneous systems the constituents are separated into their own particles, normally individual oxides in solid state synthesis reactions, and long diffusion pathways are required to reach and grow the nucleating phase. The kinetics of these reactions are dependent on constituent mobility; for oxides this include anion and cation mobility, and mobility can be limited by lattice defects and microstructural voids [12]. As the diffusion-based kinetic reactions continue the growing phase will further separate the two reactant phases leading to a decay of the reaction rate. When the reactant particles are spherical, three-dimensional diffusion will occur; α, given by Equation (4), is analytically derived from the radius of the reactant particle, R, and the thickness of the product layer, x [12].
Geometric contraction models assume that nucleation of the transformed phase occurs on the surface of the reactant phase and growth is controlled by the consumption of the bulk phase. In general, the reaction rate is governed by Equation (5) where r is radius at time t, r0 is the untransformed particle radius, and is the reaction rate constant. The reaction rate can be expressed for special cases such as 2D cylinder (contracting area) or 3D spherical (contracting volume) growth [12]. For the spherical case, α is given by Equation (6). The particle size is incorporated in the rate constant in both the contracting volume and geometric models (diffusion models) indicating a change in the reactant particle sizes will alter the transformation reaction rate [12].
A physical representation of the three kinetic models is shown in Figure 2. With the tool of in situ XRD, this study characterizes the kinetic pathways of a C12A7 stochiometric reactant mixture as a function of reactant homogeneity, atmosphere humidity, and oxidizing/reducing conditions. The kinetic transformations observed with HTXRD are analyzed applying the master plot method. This study aims to determine the effect of reactant heterogeneity on the kinetic formation pathway of C12A7, identify the thermodynamic phase equilibrium as a function of process atmosphere, and elucidate the role of C5A3 in the calcium aluminate phase space.
2. Materials and Methods
Three different reactant mixtures were characterized to identify changes in kinetic formation as a function of reactant homogeneity. Solid state synthesis (SSS) reactants were analyzed both with the reactant materials in the as-received state resulting in a high heterogeneity mixture, and with the as-received reactant subject to ball milling to reduce the particle size resulting in a lower heterogeneity mixture. A polymer assisted sol-gel reactant mixture was used to characterize the case of atomic level homogeneity.
A high heterogeneity reactant mixture was derived from the standard solid-state synthesis precursors of CaCO3 and Al2O3 powders. The powders were dried in a vacuum drying oven at 37 torr and 200 °C for 24 h before being measured into stoichiometric amounts and thoroughly mixed in a vibratory mill. The starting particle size of as-received reactants is in the order of 10 µm for CaCO3 and ≤100 nm for Al2O3.
A lower heterogeneity reactant mixture was prepared by ball milling the as-received CaCO3 to decrease the particle size to ≤200 nm. The reactant powder mix was milled in a Pulversette 7 premium high energy planetary ball mill in an yttria stabilized zirconia (YSZ) bowl with 1 mm YSZ milling media and isopropanol alcohol. Process parameters consisted of a 0.5 h milling step at 900 rpm followed by a 0.5 h hold and repeated six times.
An atomically homogenous reactant mixture was prepared through the polymer assisted (PA) synthesis route utilizing polyvinyl alcohol (PVA) [13]. A 4:1 cation to PVA ratio was chosen and the appropriate mass of PVA (molecular mass of 20,000–30,000) was dissolved in deionized (DI) water and allowed to age for 24 h. Ca(NO3)2·4H2O and Al(NO3)3·9H2O were used as cation sources and were measured from 1 molar stock solutions whose molarities were determined through inductively coupled plasma spectroscopy (ICP). Stoichiometric amounts of nitrate solutions were extracted and combined with the PVA solution under vigorous stirring. The solution was aged for 1 h before solvent evaporation was performed at a solution temperature of 90 °C. When approximately 15% of the solvent volume remained, the solution exhibited bubbling before returning to a steady state. Powder was continually scraped off the bottom and sides of the beaker after this step until the solution was completely converted to a yellow powder. This powder was then ground in a YSZ mortar and pestle and calcined to 600 °C to remove moisture and organic components. The obtained white powder is the homogenous non-carbonaceous reactant for the kinetic investigations; carbon has been shown to act as a templating anion, and oxidation of residual carbon species removes this possibility in the current investigations [5,14,15].
In situ non-ambient high-temperature X-ray diffraction (HTXRD) experiments were performed on a Malvern PANalytical Empyrean diffractometer utilizing an Anton Paar HTK 1200N high temperature furnace sample stage and a PIXcel3D area detector with 255 active channels and ~3° 2θ of coverage. Samples were heated to either 1100 or 1200 °C with a ramp rate of 300 °C/h under flowing compressed air (~120 ppm H2O), static ambient atmosphere, or high vacuum (8 × 10⁻⁵ torr); in the case of PA sol-gel reactants, the ramp rate was decreased to ~150 °C/h to yield more transformation resolution due to the rapid kinetics of formation. Data were collected both rapidly (<2 min per pattern) and continuously during the furnace ramp. A small 2θ range of 27.5–37° 2θ captures the amorphous hump of the sol-gel reactant mixture, high-intensity peaks for all phases Ca5Al6O14 (C5A3), C3Al2O6 (C3A), CaAl2O4 (CA), CaCO3, Al2O3, and CaO, and five characteristic peaks of C12A7. Reported temperature is the sample temperature, not the set temperature, and was measured by a thermocouple directly below the sample. Instrumental setup and collection specifics are summarized in supplementary information (Table S1); incident and diffracted beam optics were optimized for intensity over resolution. For data collection, all reactant mixtures were pressed into 13 mm pellets with a thickness of 2 mm and placed in the sample holder. Experimental characterization is summarized in Table 3.
Following the method previously employed in HTXRD characterization of amorphous citrate sol-gel formation [16], phase matching was performed utilizing the International Centre for Diffraction Data (ICDD) PDF-4+ 2018 database. Rietveld refinement was performed using the Malvern PANalytical HighScore Plus software package [17]. Lattice parameters, background, scale factors, surface sample displacement, phase fractions, and profile parameters relevant to crystallite size determination were refined. During the formation of the C12A7 phase from an amorphous reactant mixture, pseudo-Voight peak fitting was used to determine the change in peak area relating to an increase in the concentration of C12A7 relative to the amorphous content. Crystallite size was determined through pseudo-Voigt profile fitting and is documented in the HighScore Plus software package as being calculated using Equations (7) and (8), which describe crystallite size and size variance, respectively [17]. Wi and Wstd are coefficients used to describe peak width for a given reflection and the standard, respectively, and refers to the variance of those values.
Instrumental broadening was characterized with NIST (National Institute of Standards and Technology) standard SRM 640e (Si), and the refined values were used during the HTXRD Rietveld refinements.
3. Results
The comprehensive characterization of reactant homogeneity and synthesis atmosphere through HTXRD leads to a 3 × 3 matrix of characterization. For simplicity, the results will be subdivided by atmosphere with analysis of reactant homogeneity contained in that subsection. The subsection organization follows the order SSS as-received, SSS milled, PVA isochronal, and PVA isothermal. Kinetic analysis is only performed in situations where isothermal phase evolution is observed.
3.1. Ambient Processing Atmosphere
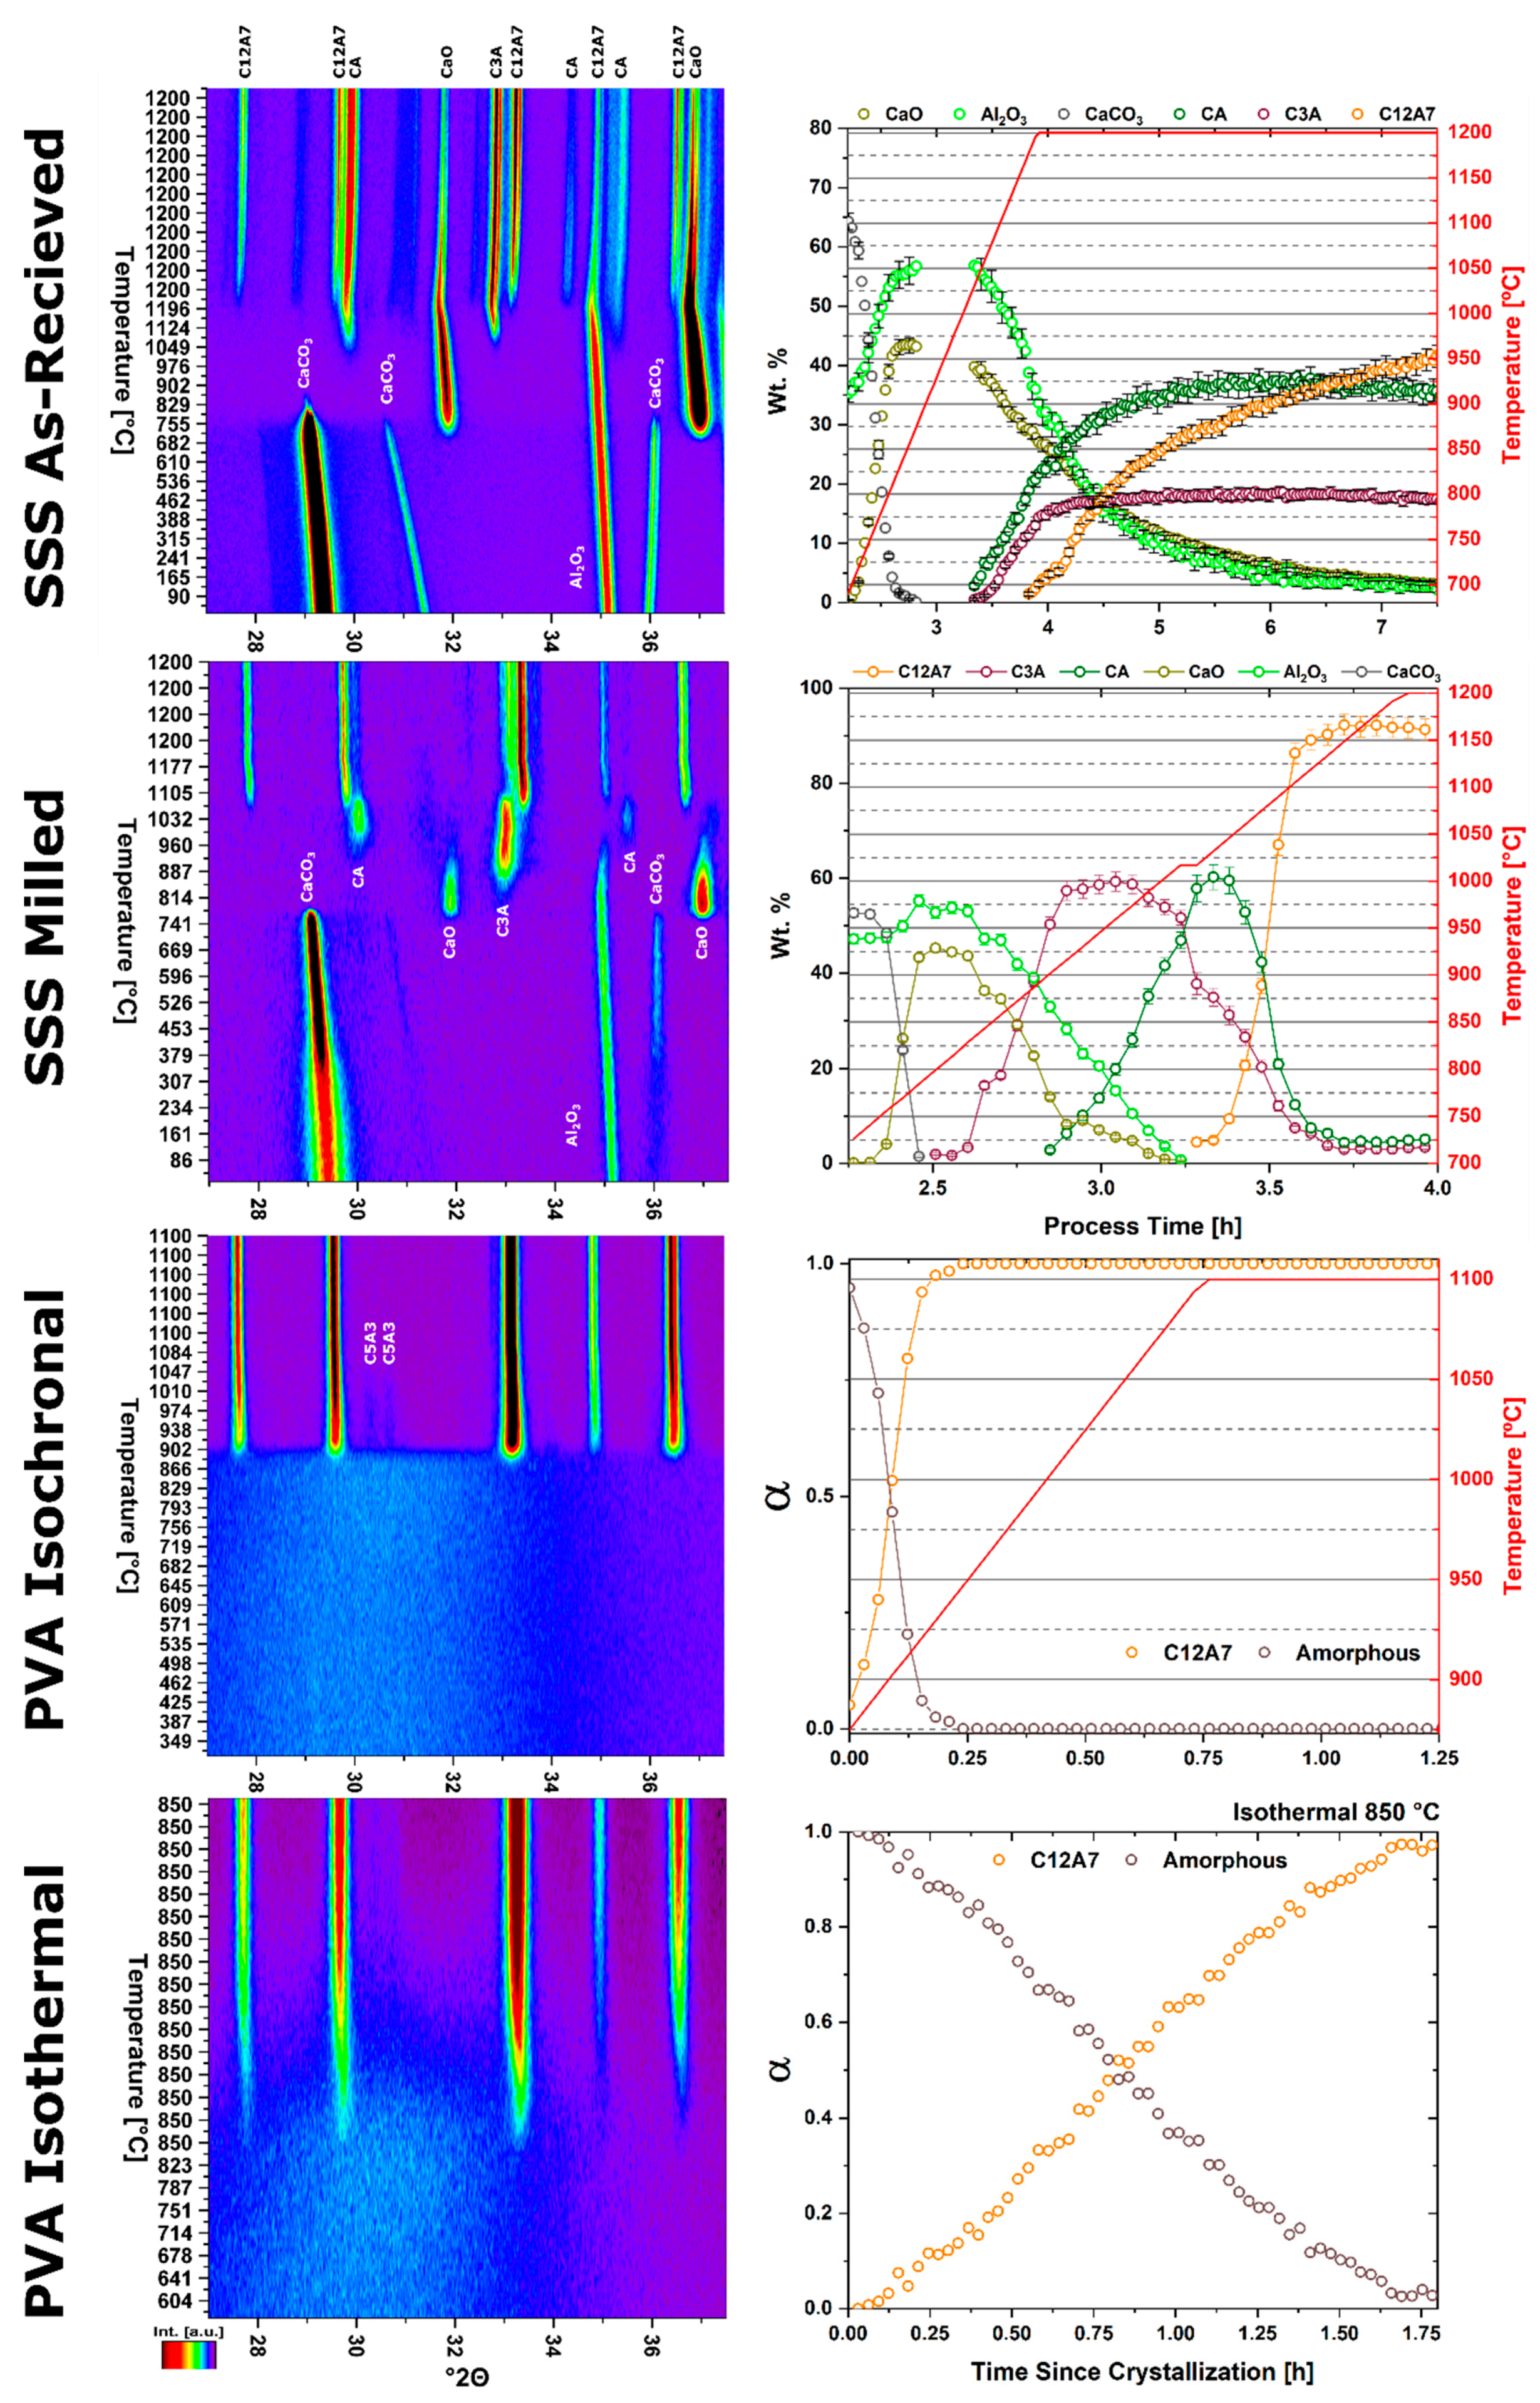
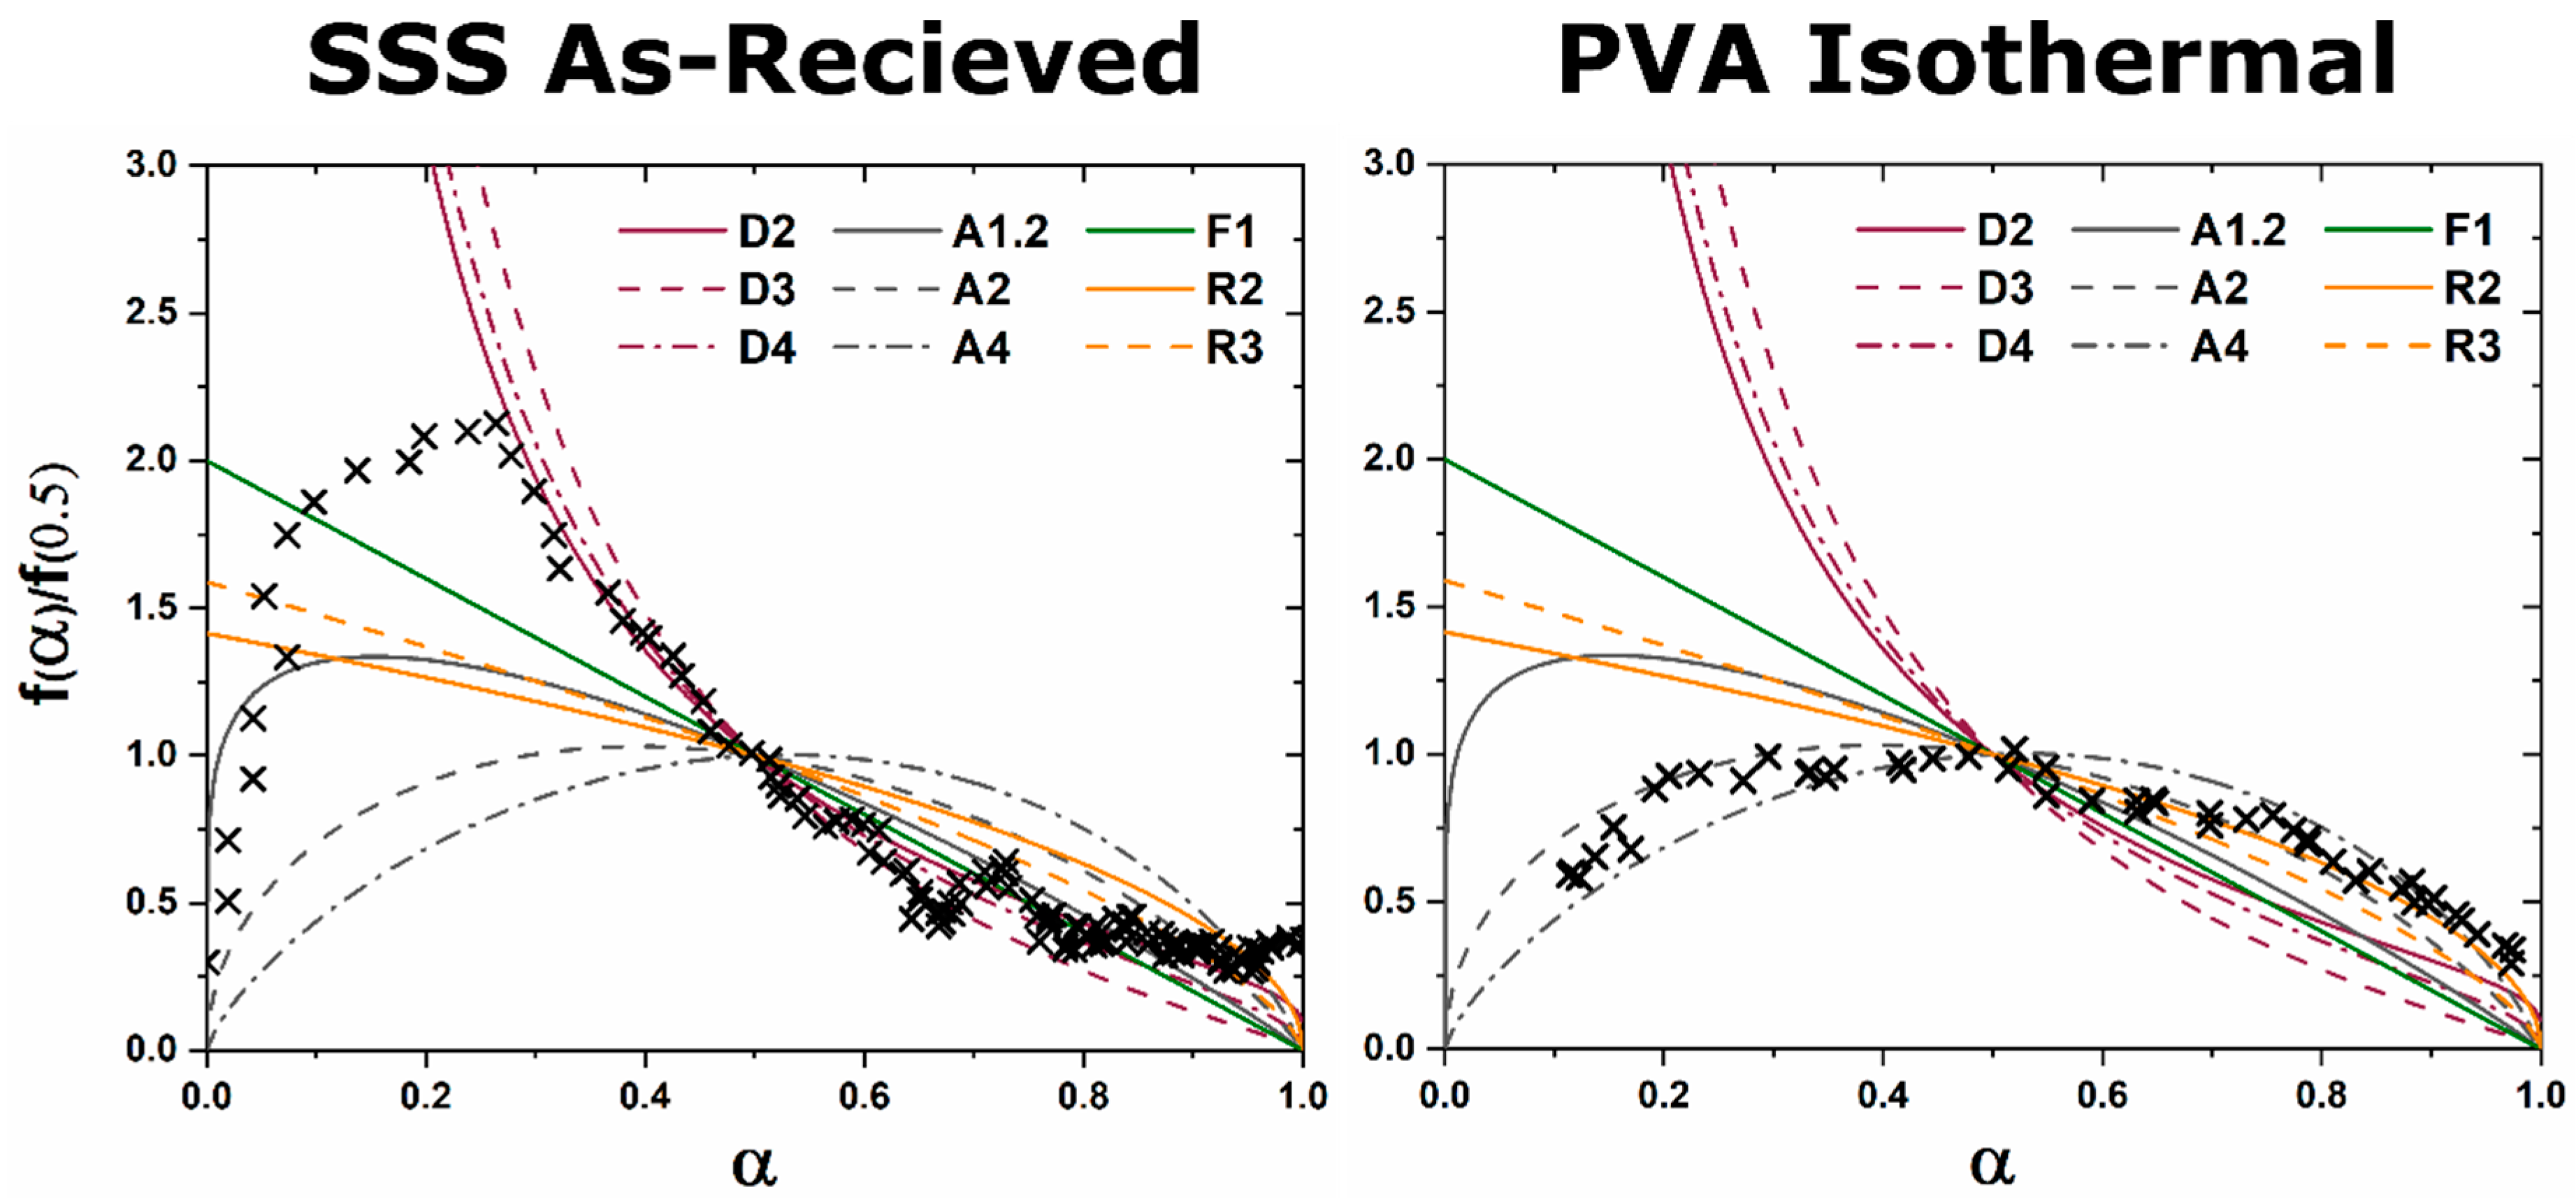
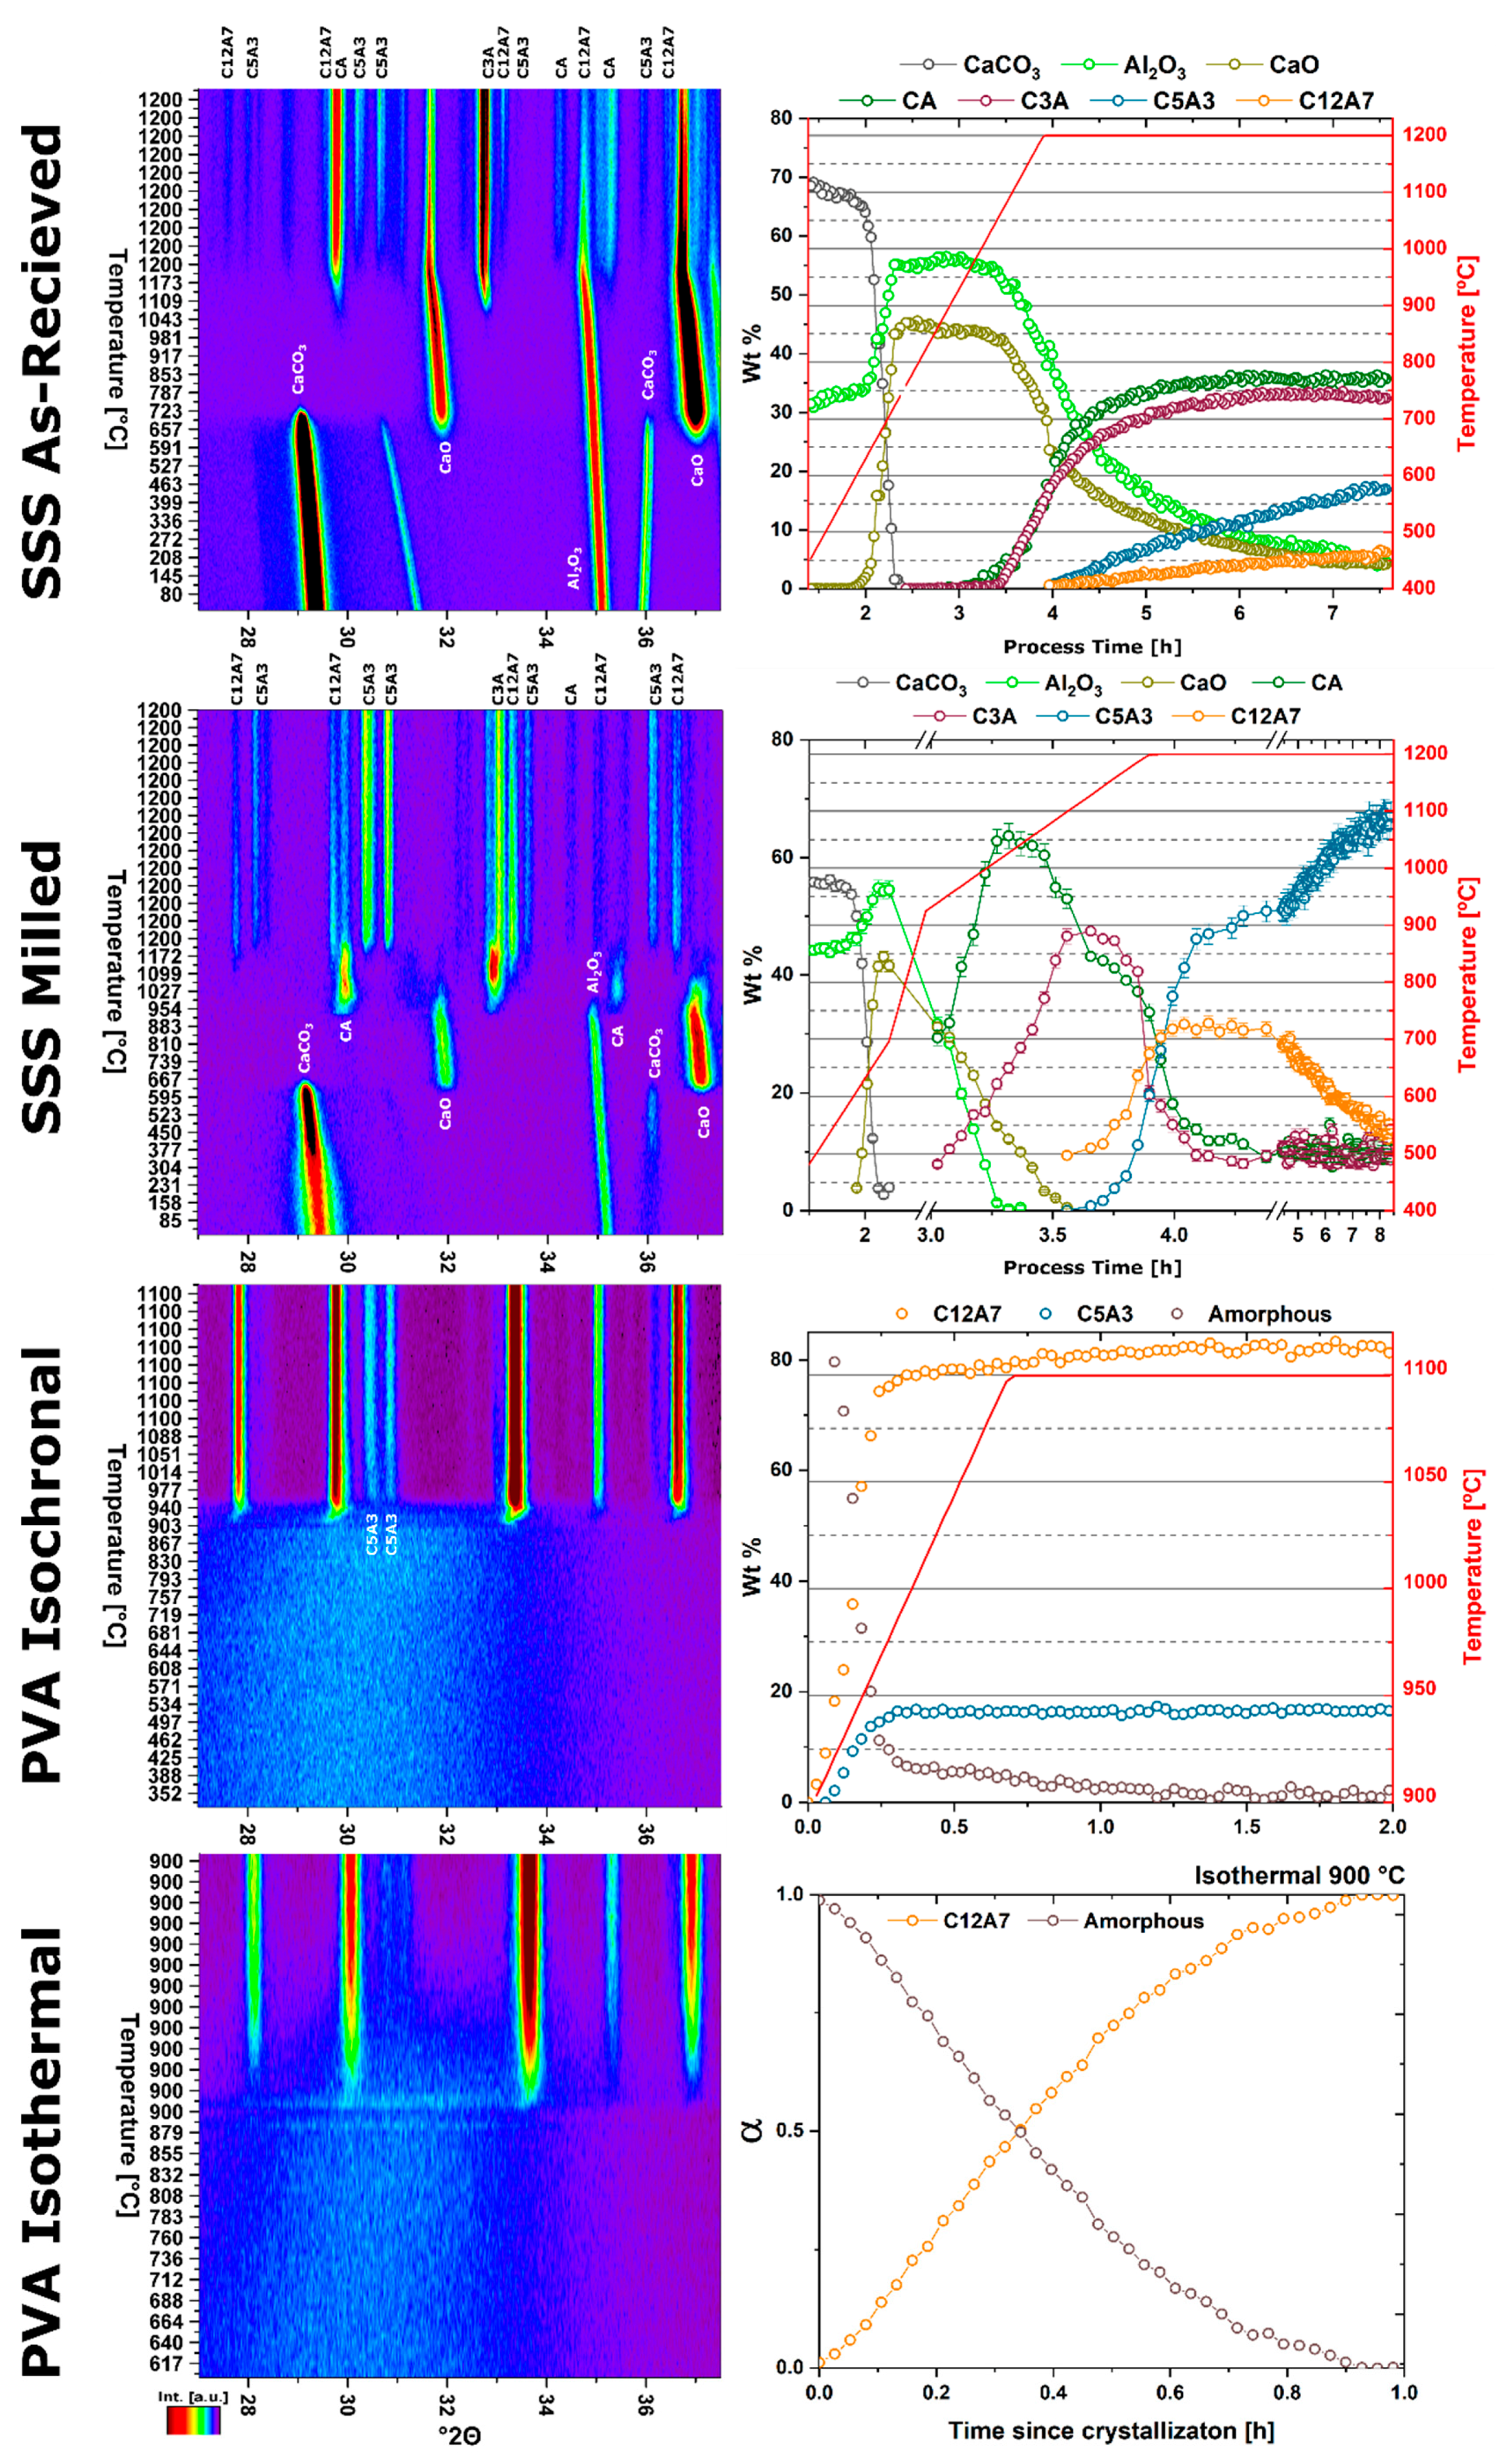
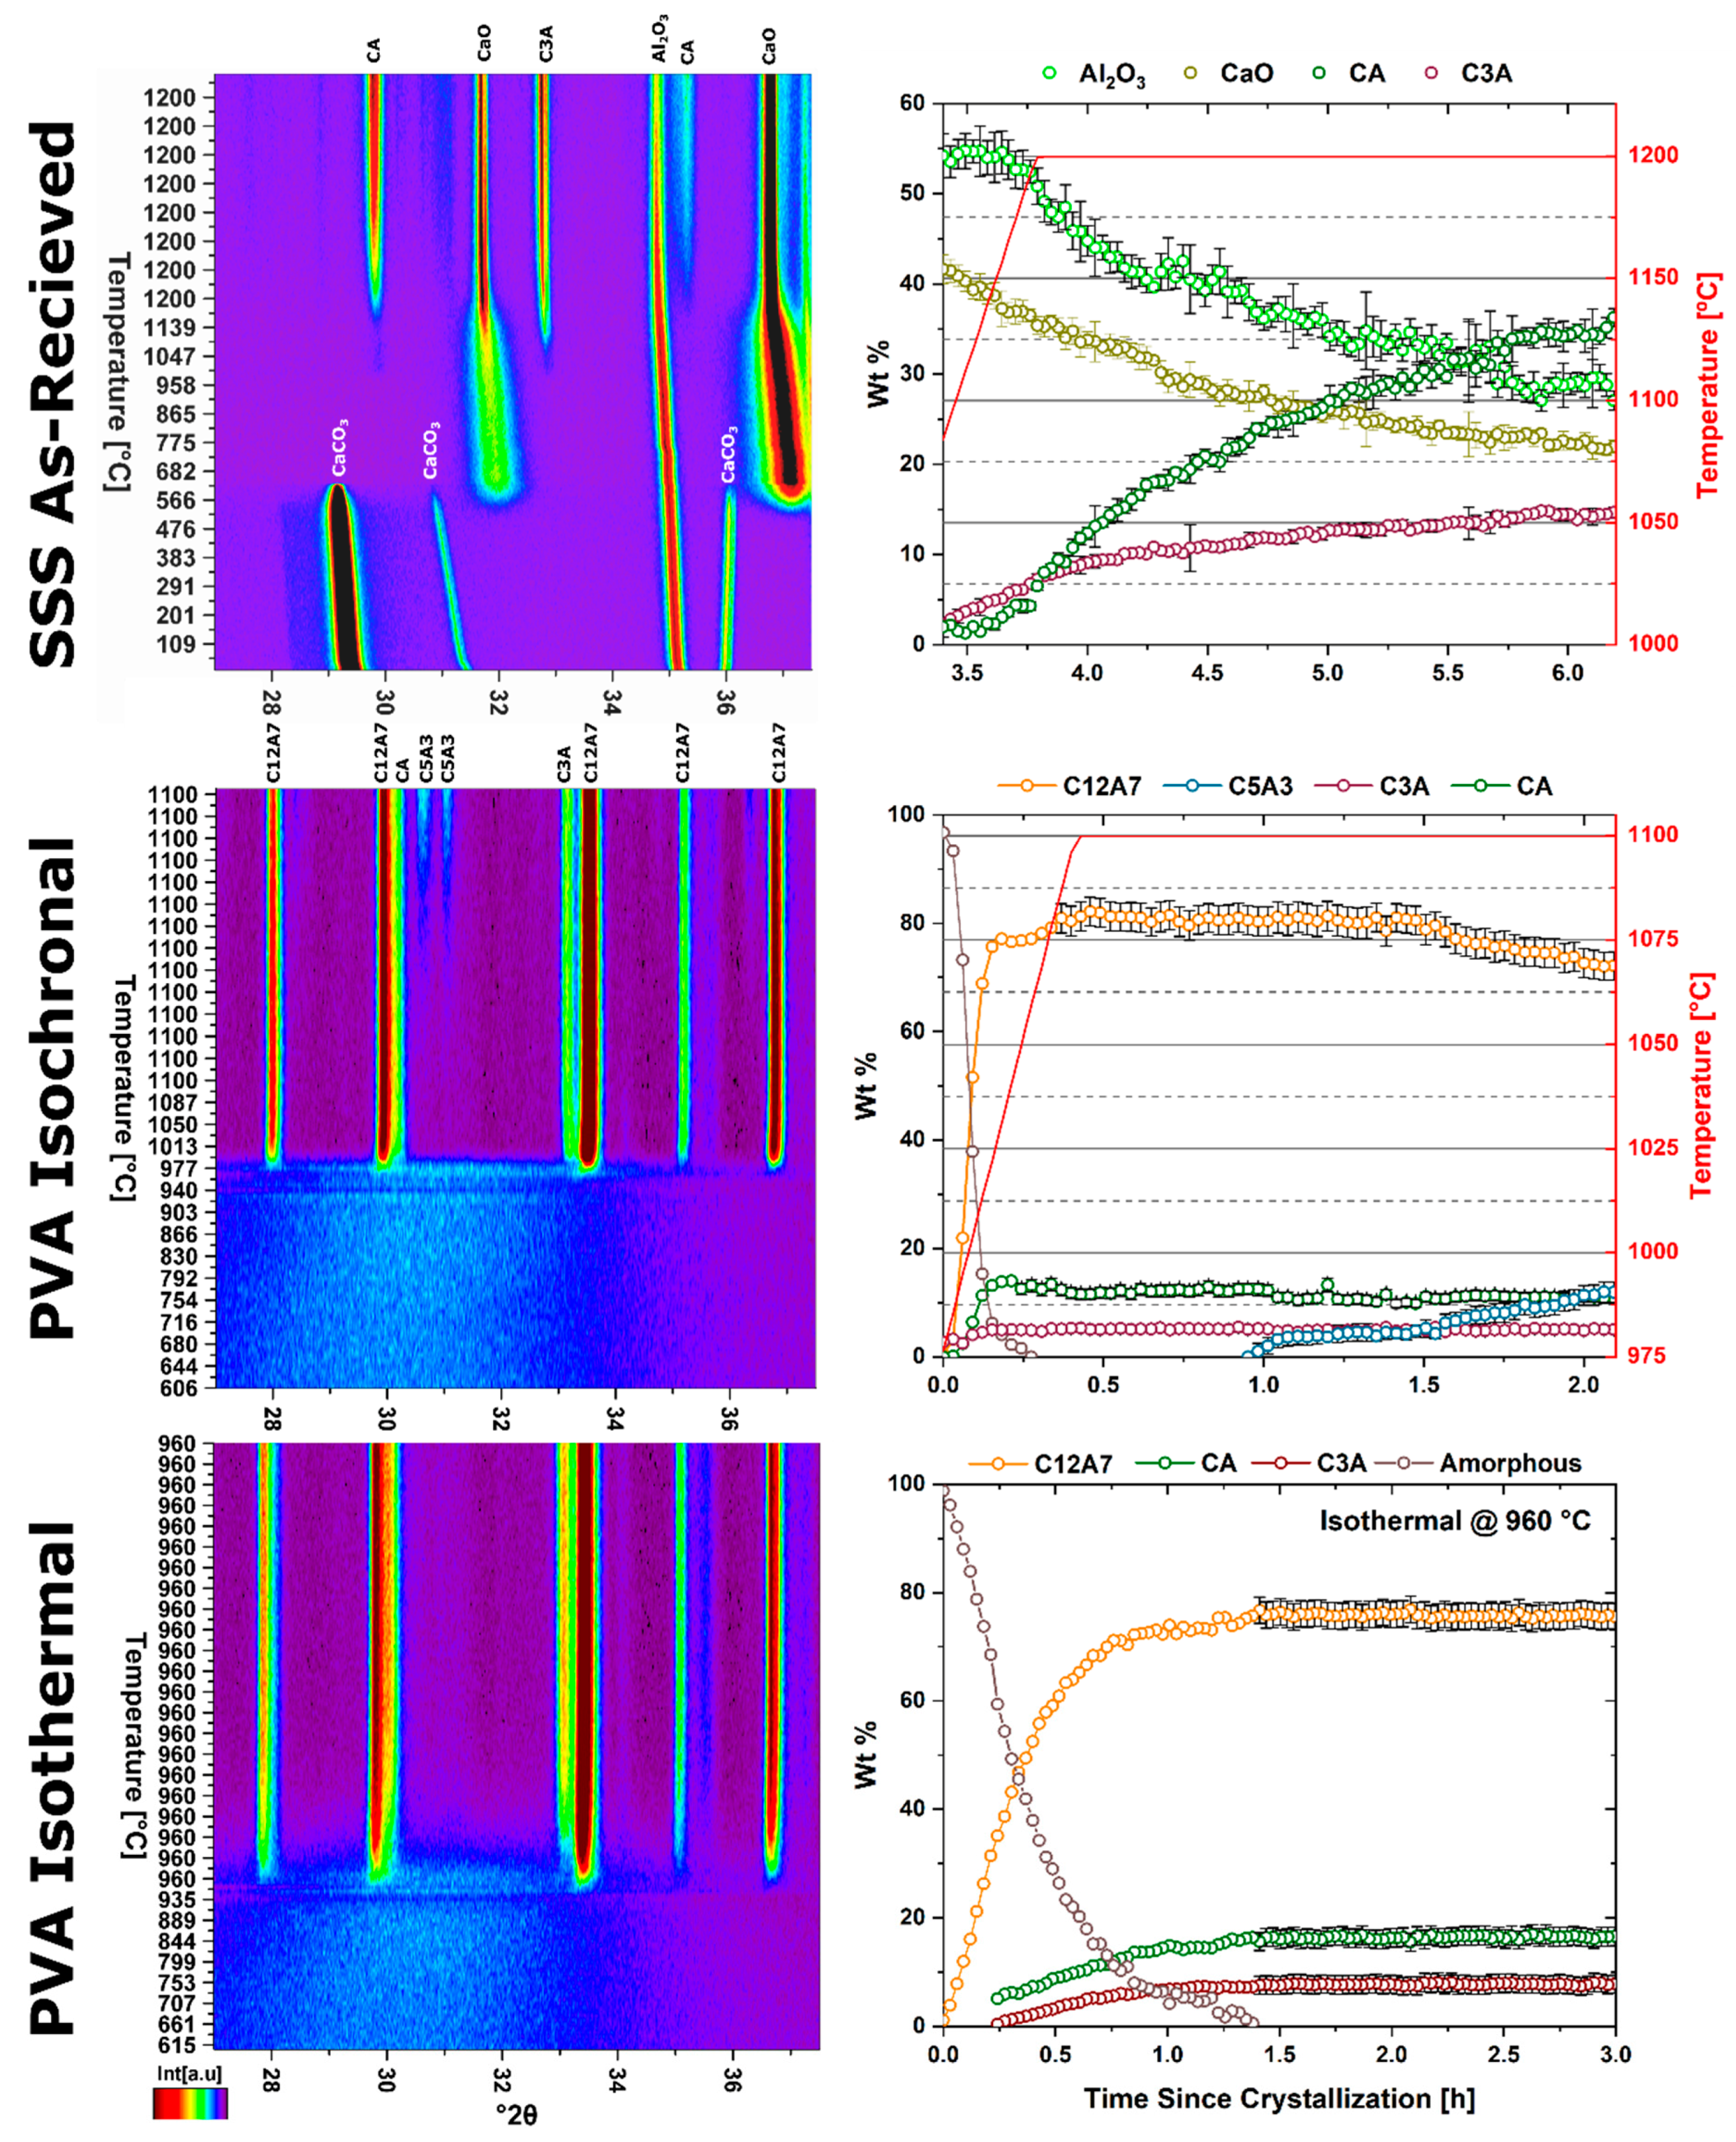
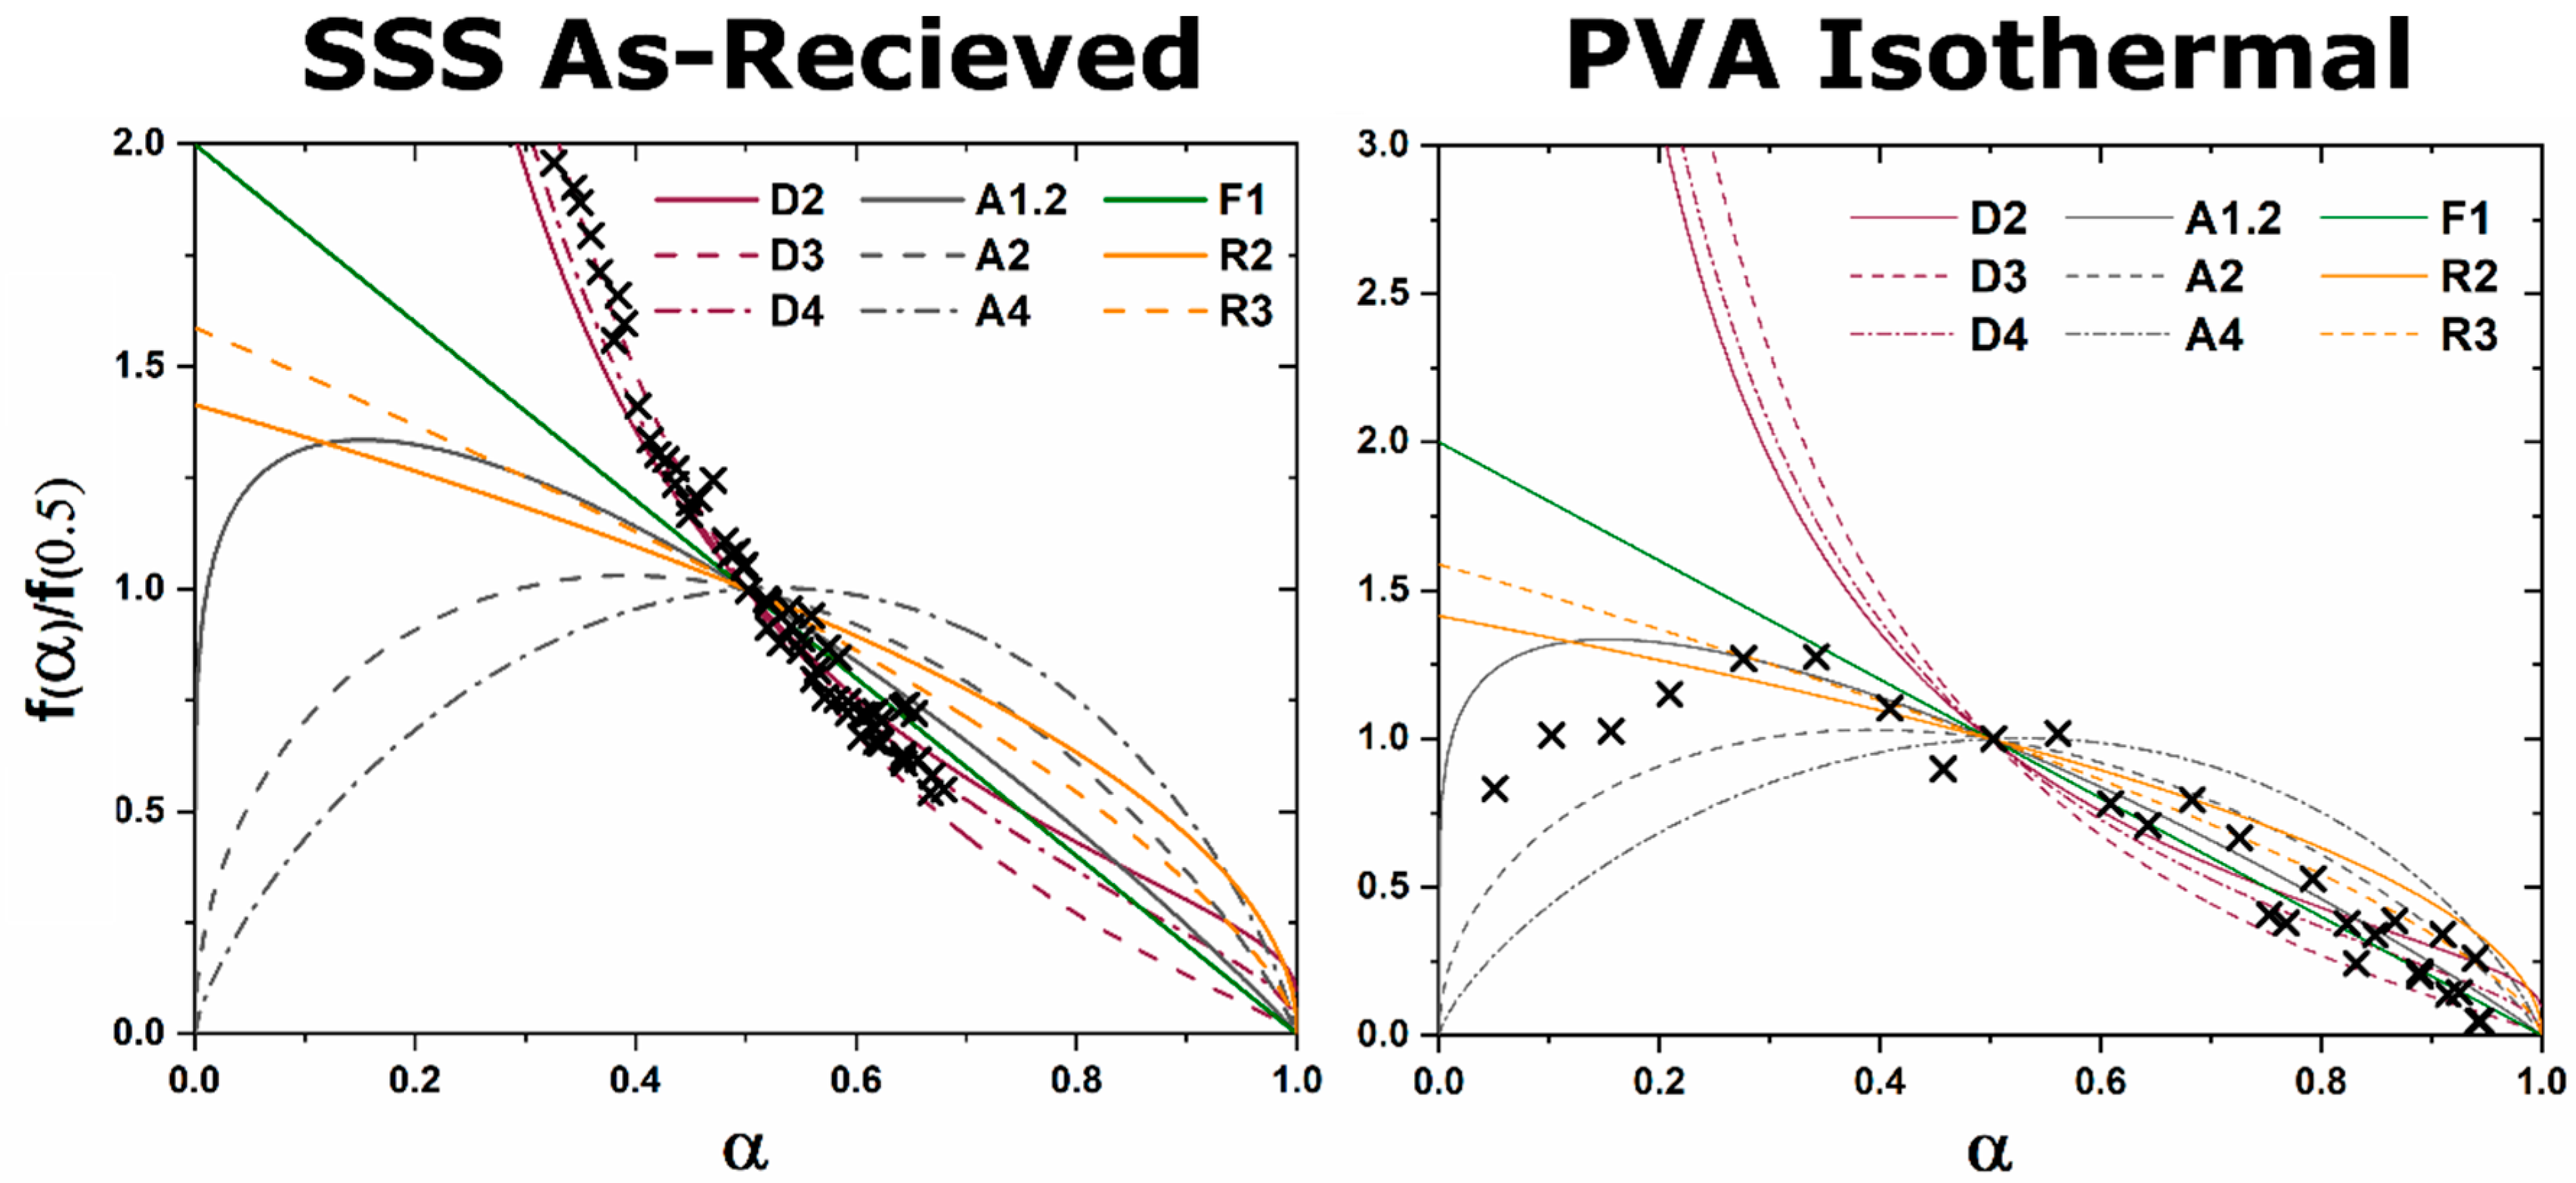
In the case of high heterogeneity, SSS as-received, the pathway towards the phase equilibria assemblage progresses through four distinct regions; these regions are CaCO3 decomposition to CaO, CaO and Al2O3 phase equilibria, C3A and CA phase formation, and finally C12A7 formation (Figure 3). The decomposition transformation of CaCO3 to CaO initializes at 680 °C and completes by 880 °C. Equilibrium of the CaO and Al2O3 phase remains until 980 °C when the formation of CA followed by C3A at 1025 °C is observed. The transformation continues as time and temperature are increased. C12A7 formation is observed at 1180 °C, before the complete conversion of CaO and Al2O3 to C3A and CA, and the formation continues at a processing dwell temperature of 1200 °C. C3A wt% reaches a maximum amount correlated with the presence of rapid C12A7 formation while CA formation continues. The isothermal master plot of C12A7 formation for SSS as-received reactants shows a clear multi-type transformation behavior, Figure 4. During the initial stages of the transformation the rate of C12A7 formation displays a JMAK-type behavior with an initial acceleration of the reaction rate. As the process continues, a diffusion-based transformation mode is observed with an exponential decay of the reaction rate. The high heterogeneous reactant phase equilibria agrees with previously-characterized thermodynamic equilibrium and the type of kinetic transformation changes as the availability of reactants decreases; no C5A3 formation was observed at any point during the HTXRD experiment [6,7].
In the case of low heterogeneity, a change in the energy needed for phase formation and the rate of formation are altered, but the same phase evolution pathway is observed (Figure 3). CaCO3 to CaO decomposition initializes at 750 °C and completes by 800 °C with an increased reaction rate compared to that observed before a reduction in CaCO3 particle size. C3A phase formation is observed to be concurrent with CaCO3 decomposition at 785 °C followed by CA phase formation at 915 °C. C3A and CA phase formation continues at the expense of all remaining Al2O3 and CaO. C12A7 phase formation is not observed until 1000 °C after Al2O3 and CaO reactants are consumed and formation occurs at the expense of C3A and CA. The formation of C12A7 is rapid with formation completed by 1125 °C within 0.5 h of the start of the transformation. Single phase C12A7 is not observed and an equilibrium between C3A, CA, and C12A7 is observed with no change with extended process time of up to 12 h, albeit the concentration of C12A7 is increased to approximately 90 wt%. No kinetic analysis can be performed as C12A7 formation occurs completely during the isochronal heating, but the lack of complete C12A7 formation suggests a diffusion limited process. The synthesis utilizing milled starting reactants follows the expected thermodynamic equilibrium and a clear benefit to the reduction of particles size in the kinetic transformation rate to this equilibrium is observed; no C5A3 is observed at any point during the HTXRD experiment. In agreement to the SSS as-received, a decrease in the transformation temperature and an increase in the rate of formation is observed with milling of the reactant mixture. The milling decreases the particle size of the CaCO3 and subsequently decreases the reactant heterogeneity.
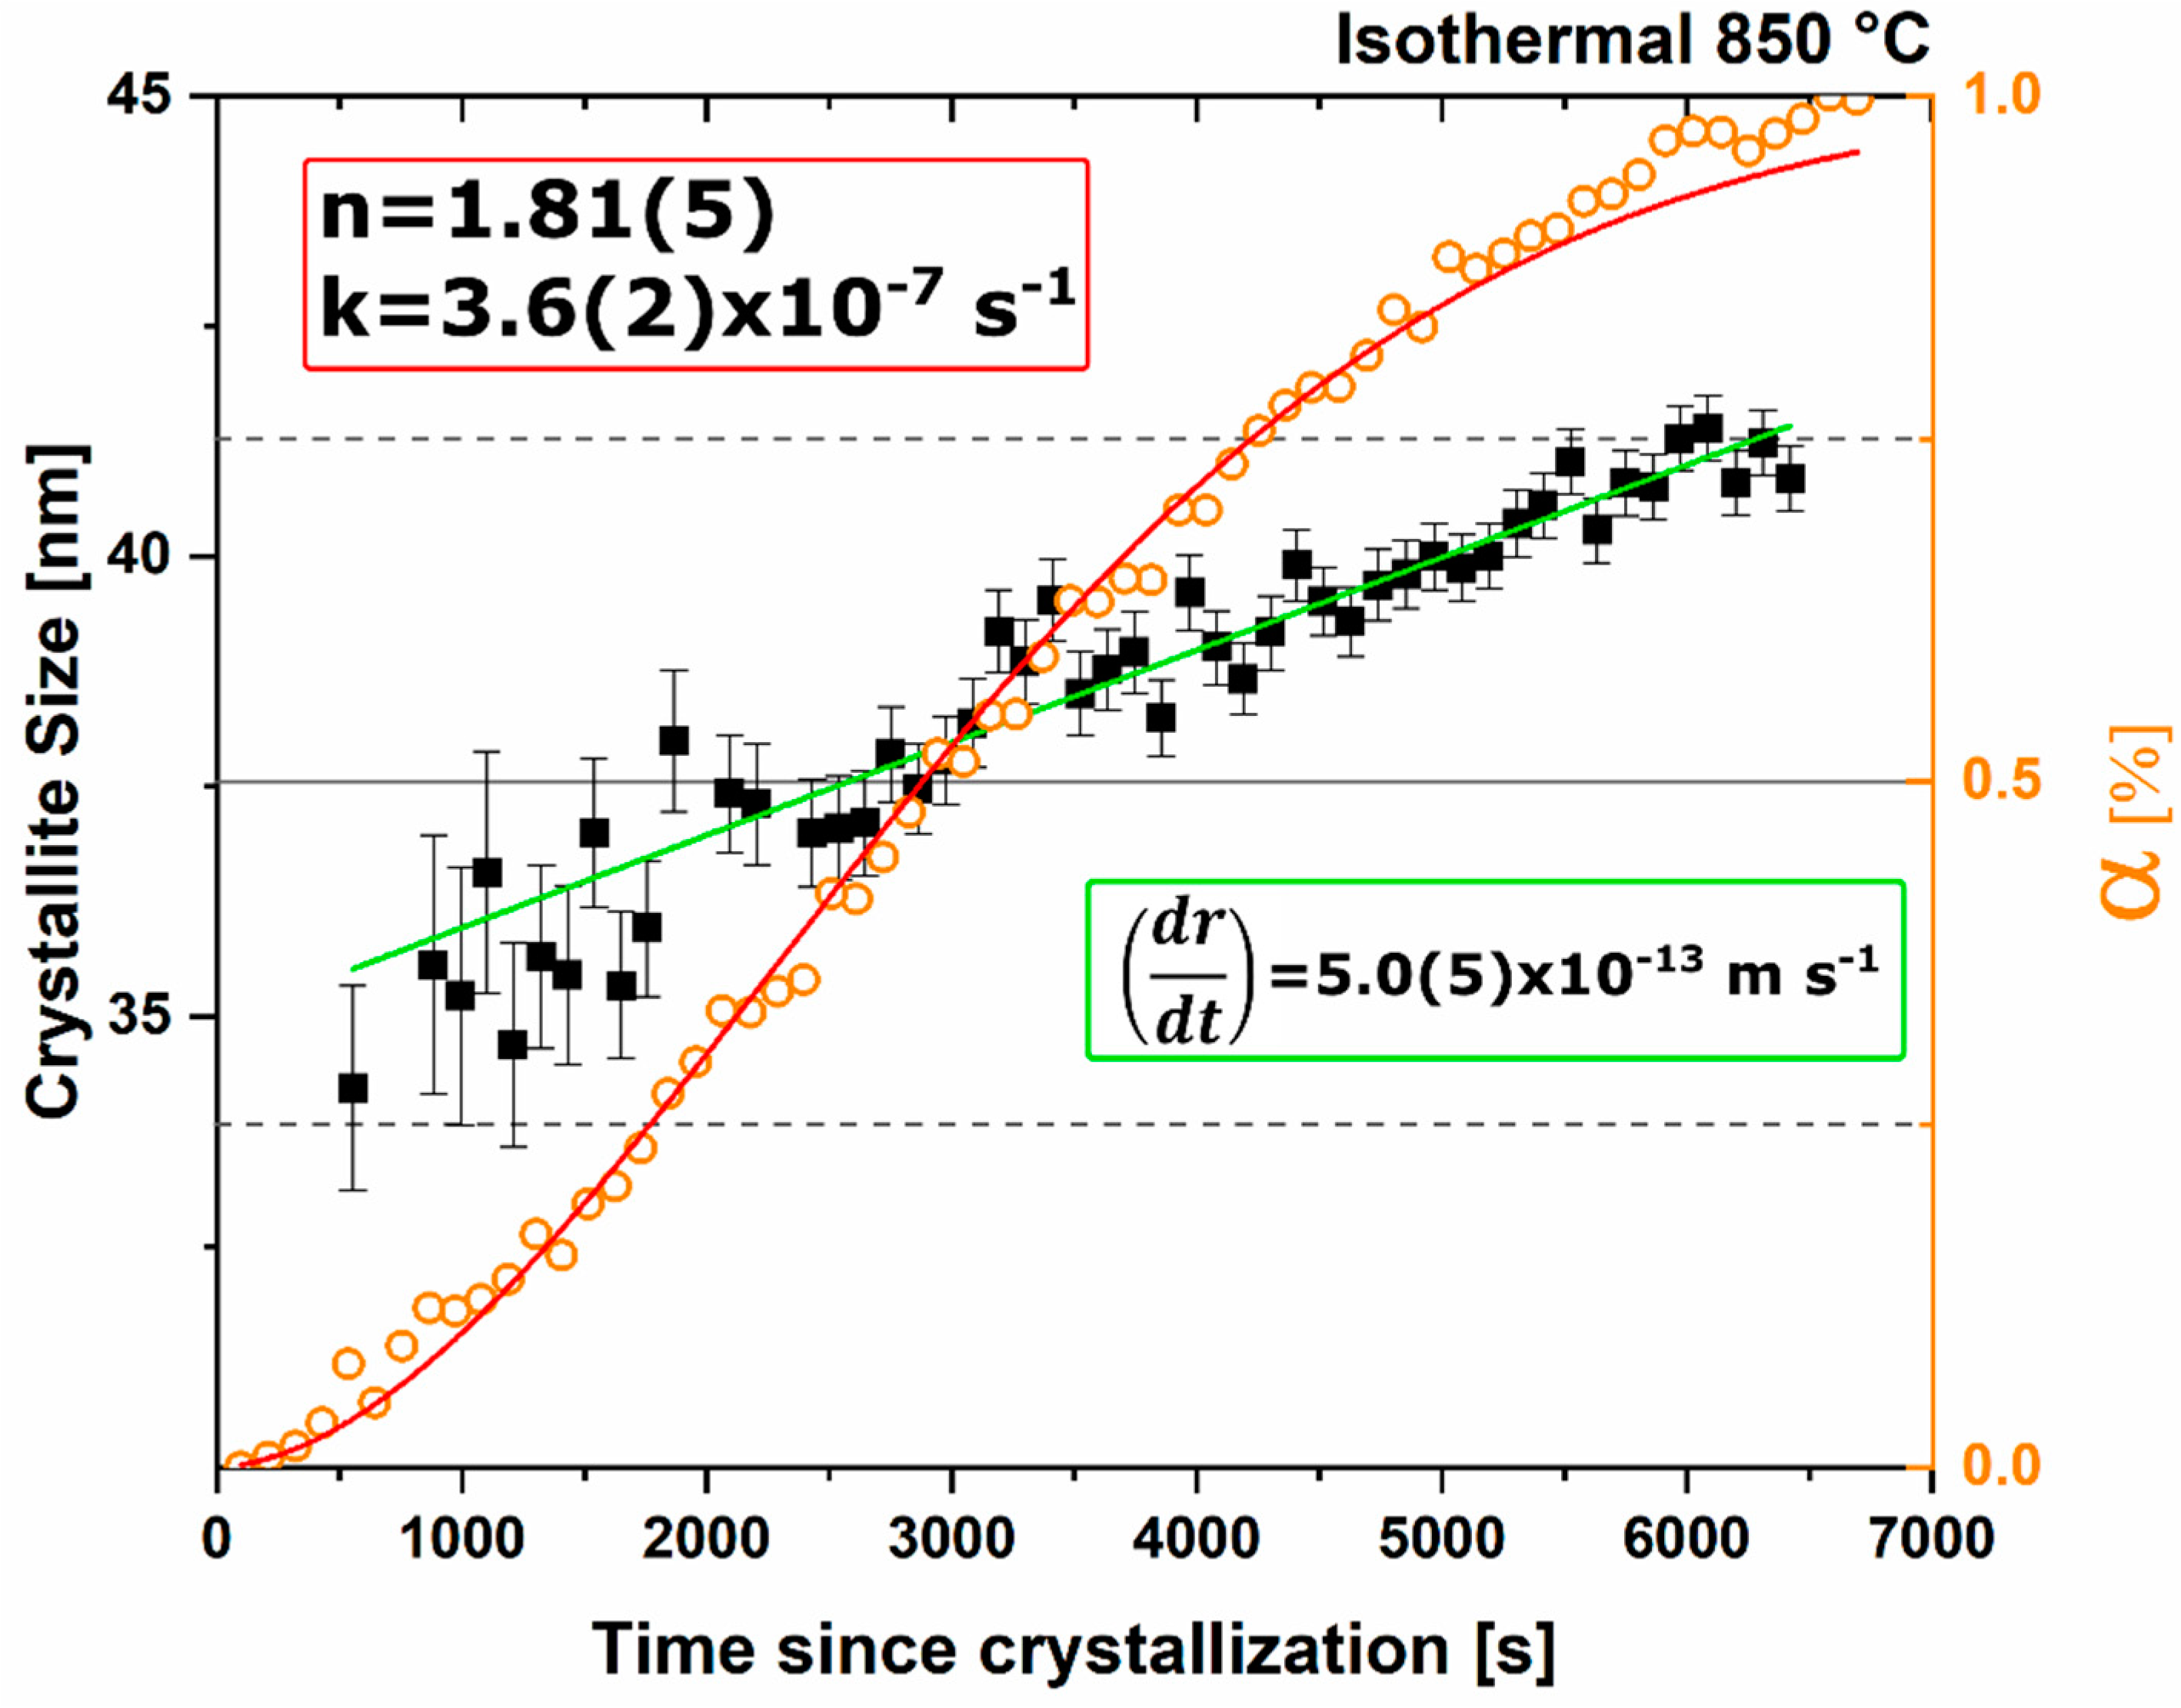
The polymer assisted sol-gel reactant removes heterogeneity by providing homogeneity at the atomic level. During isochronal characterization of powder previously calcined to 600 °C, an amorphous background is observed up to 850 °C after which direct and rapid formation of the C12A7 phase is observed completing by 950 °C after a transformation time of 0.3 h (Figure 3). During the formation of C12A7, the characteristic peaks of C5A3 are qualitatively observed until approximately 1050 °C. The net height of the C5A3 peaks above the background is less than three times the standard deviation of the background noise indicating that the peaks are not statistically significant; C5A3 is observed momentarily and is below the resolution of phase quantification. During isothermal characterization the process temperature is held at 850 °C (Figure 3). As in the isochronal case, C12A7 formation occurs instantaneously and full phase formation is observed after a processing time of approximately 2 h. During the formation of C12A7, C5A3 characteristic peaks are barely discernable with net intensity even less than in the isochronal case. A comparison of the rate of reaction for the isothermal investigation (Figure 4) clearly demonstrates a JMAK-type transformation. Fitting the Avrami equation (Equation (1)) an n value of 1.81(5) and a rate constant, k, of 3.6(2) × 10−7 s−1 was determined (Figure 5). Determination of crystallite size elucidates a slow growth rate as a function of process time with an increase of approximately 7 nm, from 35 to 42 nm, was observed after 2 h leading to a growth rate of 5.0(5) × 10−13 m/s. Larger errors in crystallite size are observed initially due to the errors in fitting the peak shape that emerged on top of the amorphous background. As the reactant mixture moves to atomic homogeneity deviation from thermodynamic studies is observed with direct statistically phase pure C12A7 formation accompanied by a decrease in formation temperature from 1000 and 1180 °C observed when utilizing milled and as-received solid-state reactants, respectively, to 850 °C for the homogenous PA sol-gel reactant mixture.
3.2. Dry-Air
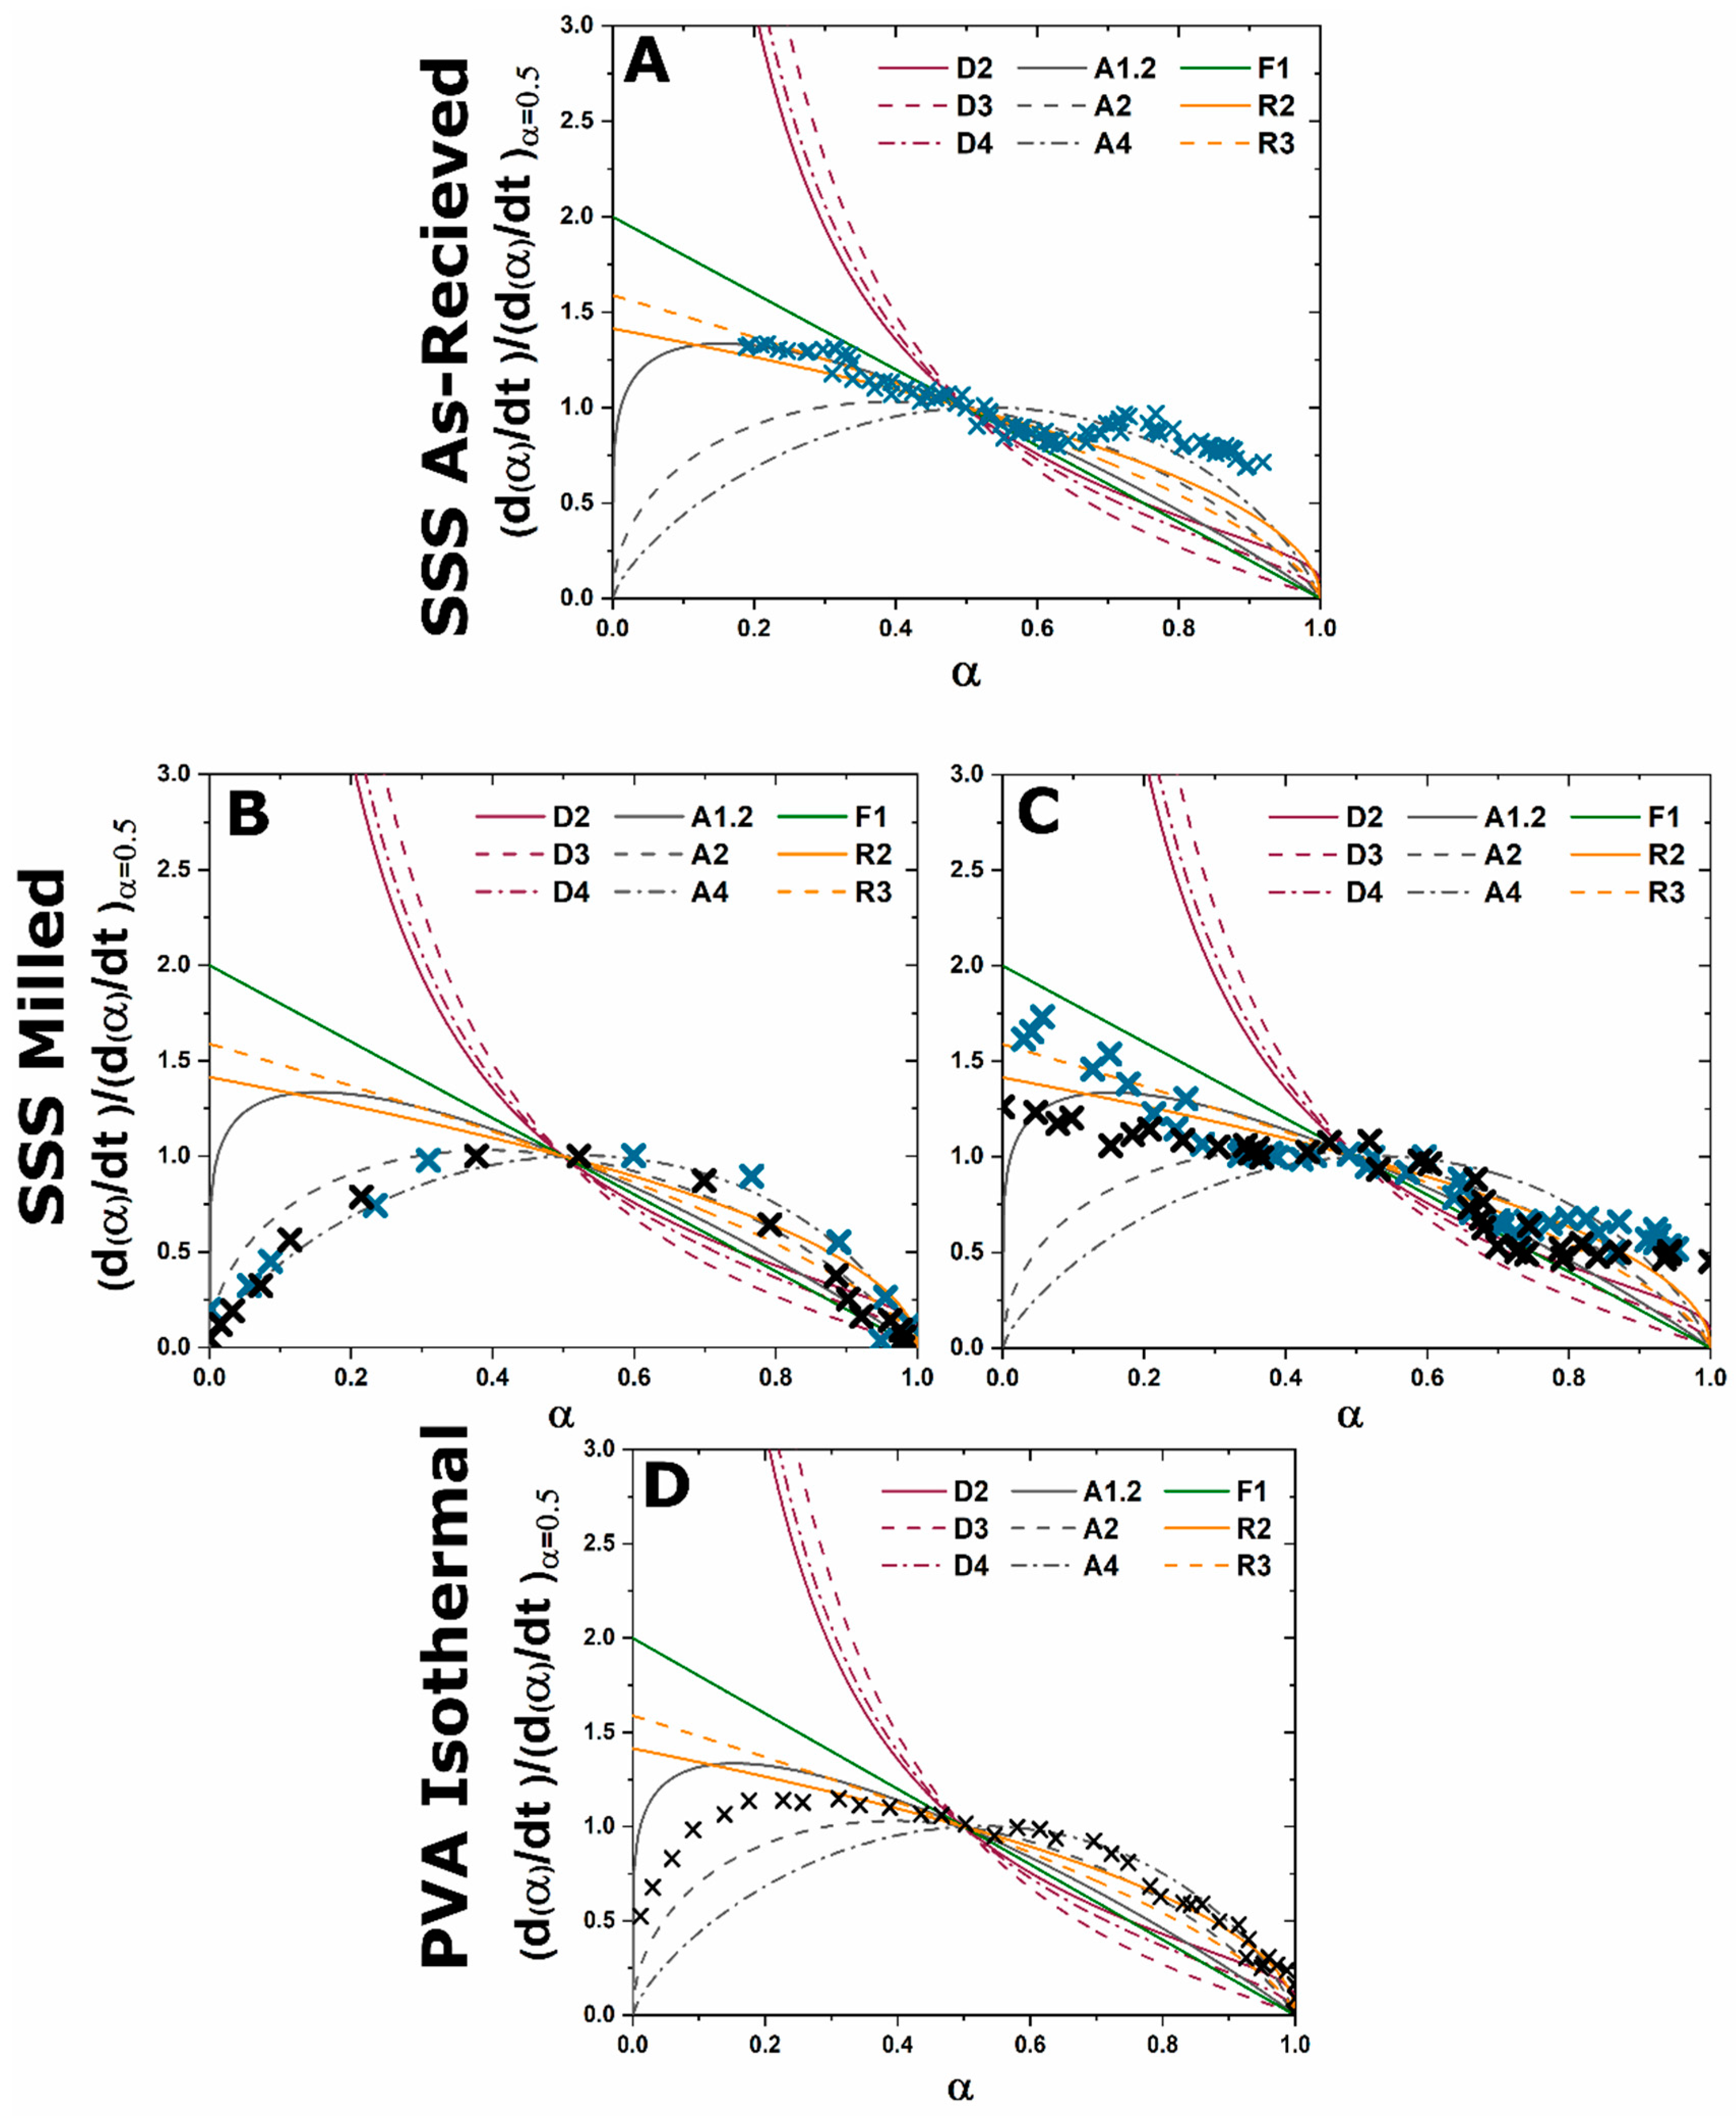
With high heterogenous reactants, C12A7 formation deviates from the behavior observed during ambient conditions; while all four phases are still observed, the presence of an additional phase C5A3 and the ultimate thermodynamic phase equilibria is altered (Figure 6). The CaCO3 decomposition is observed starting at 580 °C and completes by 760 °C. CaO and Al2O3 are observed until 1025 °C where formation of C3A and CA is observed with equivalent rates at the expense of CaO and Al2O3. Once process temperature reaches 1200 °C C5A3 and C12A7 formation is observed with the rate of C5A3 formation occurring more rapidly than C12A7; C3A and CA phase concentration continues to increase during this regime and only CaO and Al2O3 exhibit a decrease in wt%. Isothermal master plot characterizing the rate of the formation transformation of C5A3 from as-received solid-state reactants demonstrate a linear decrease in rate correlated with a phase boundary-controlled process and not a diffusion or JMAK-type transformation (Figure 7A). The transformation appears to reach an equilibrium value after 4 h with the complete reaction of CaO and Al2O3; C3A and CA phase evolution is stagnant and C5A3 and C12A7 formation exhibits a decreasing rate. The presence of C5A3 is observed under dry conditions, however, formation does not occur until 1200 °C concurrent with the formation of C12A7. This represents a change in thermodynamic equilibrium to C5A3 under dry conditions as compared to humid conditions.
With low reactant heterogeneity phase formation pathways are the same, however, the temperatures of formation and the rate of formation increase with respect to as-received SSS reactants. This is the same behavior observed under ambient atmosphere, albeit with the formation of C5A3 (Figure 6). CaCO3 decomposition is observed starting at 600 °C and completes by 700 °C. In a dry atmosphere, C3A phase formation does not occur concurrently and a phase assemblage of CaO and Al2O3 is observed. C3A phase formation is observed starting at 925 °C concurrent with CA formation and continues rapidly at the expense of CaO and Al2O3 with the rate of CA formation higher than C3A formation; maximum CA content is observed at 1050 °C while C3A maximum concentration does not occur until 1125 °C. The C12A7 (024) characteristic peak is initially obscured by the C3A peak, however, C12A7 and C5A3 phase formation is observed by 1100 °C at the expense of C3A and CA. The rate and concentration of C12A7 phase formation is initially greater than that of C5A3, however, once at 1200 °C the C5A3 phase formation continues increasing while the C12A7 wt% plateaus. As the process continues for 4 h C5A3 wt% continues increasing at the expense of C12A7.
Isothermal master plots indicate the rate of formation of the C12A7 and C5A3 phases have an increasing then decreasing sigmoidal character consistent with JMAK-type transformations (Figure 7B). After this initial formation, ~50 wt% C5A3 and ~30 wt% C12A7, the decomposition of C12A7 and further formation of C5A3 have a different rate dependence with a linear decreasing reaction rate as would be characteristic with phase boundary-controlled transformation (Figure 7C). The phase boundary-controlled transformation is similar to the formation rate dependency observed with as-received solid-state reactants under a dry atmosphere. The decrease in reactant heterogeneity displays an increase in the rate of kinetic transformation to the thermodynamic equilibria which at 1200 °C under dry atmospheric conditions is dominated by C5A3.
When the starting reactant has atomic homogeneity, the formation of C12A7 is observed directly from the amorphous background at 900 °C (Figure 6). Under isochronal characterization the formation of C12A7 is rapid just as in the ambient atmosphere, however, an increase in the onset temperature by 50 °C is observed. C5A3 phase formation is higher under dry conditions isochronally and statistically quantifiable, however, the formation only occurs during the initial stage of crystalline phase formation and no formation kinetics are observed during an isothermal dwell at 1100 °C for 1.5 h. Under isothermal conditions, C12A7 is the predominant phase to form with full formation observed after only 1 h. This is approximately half the time observed under ambient conditions (Figure 6). Under isothermal conditions at 900 °C, C5A3 phase formation is negligible and statistically insignificant for quantification.
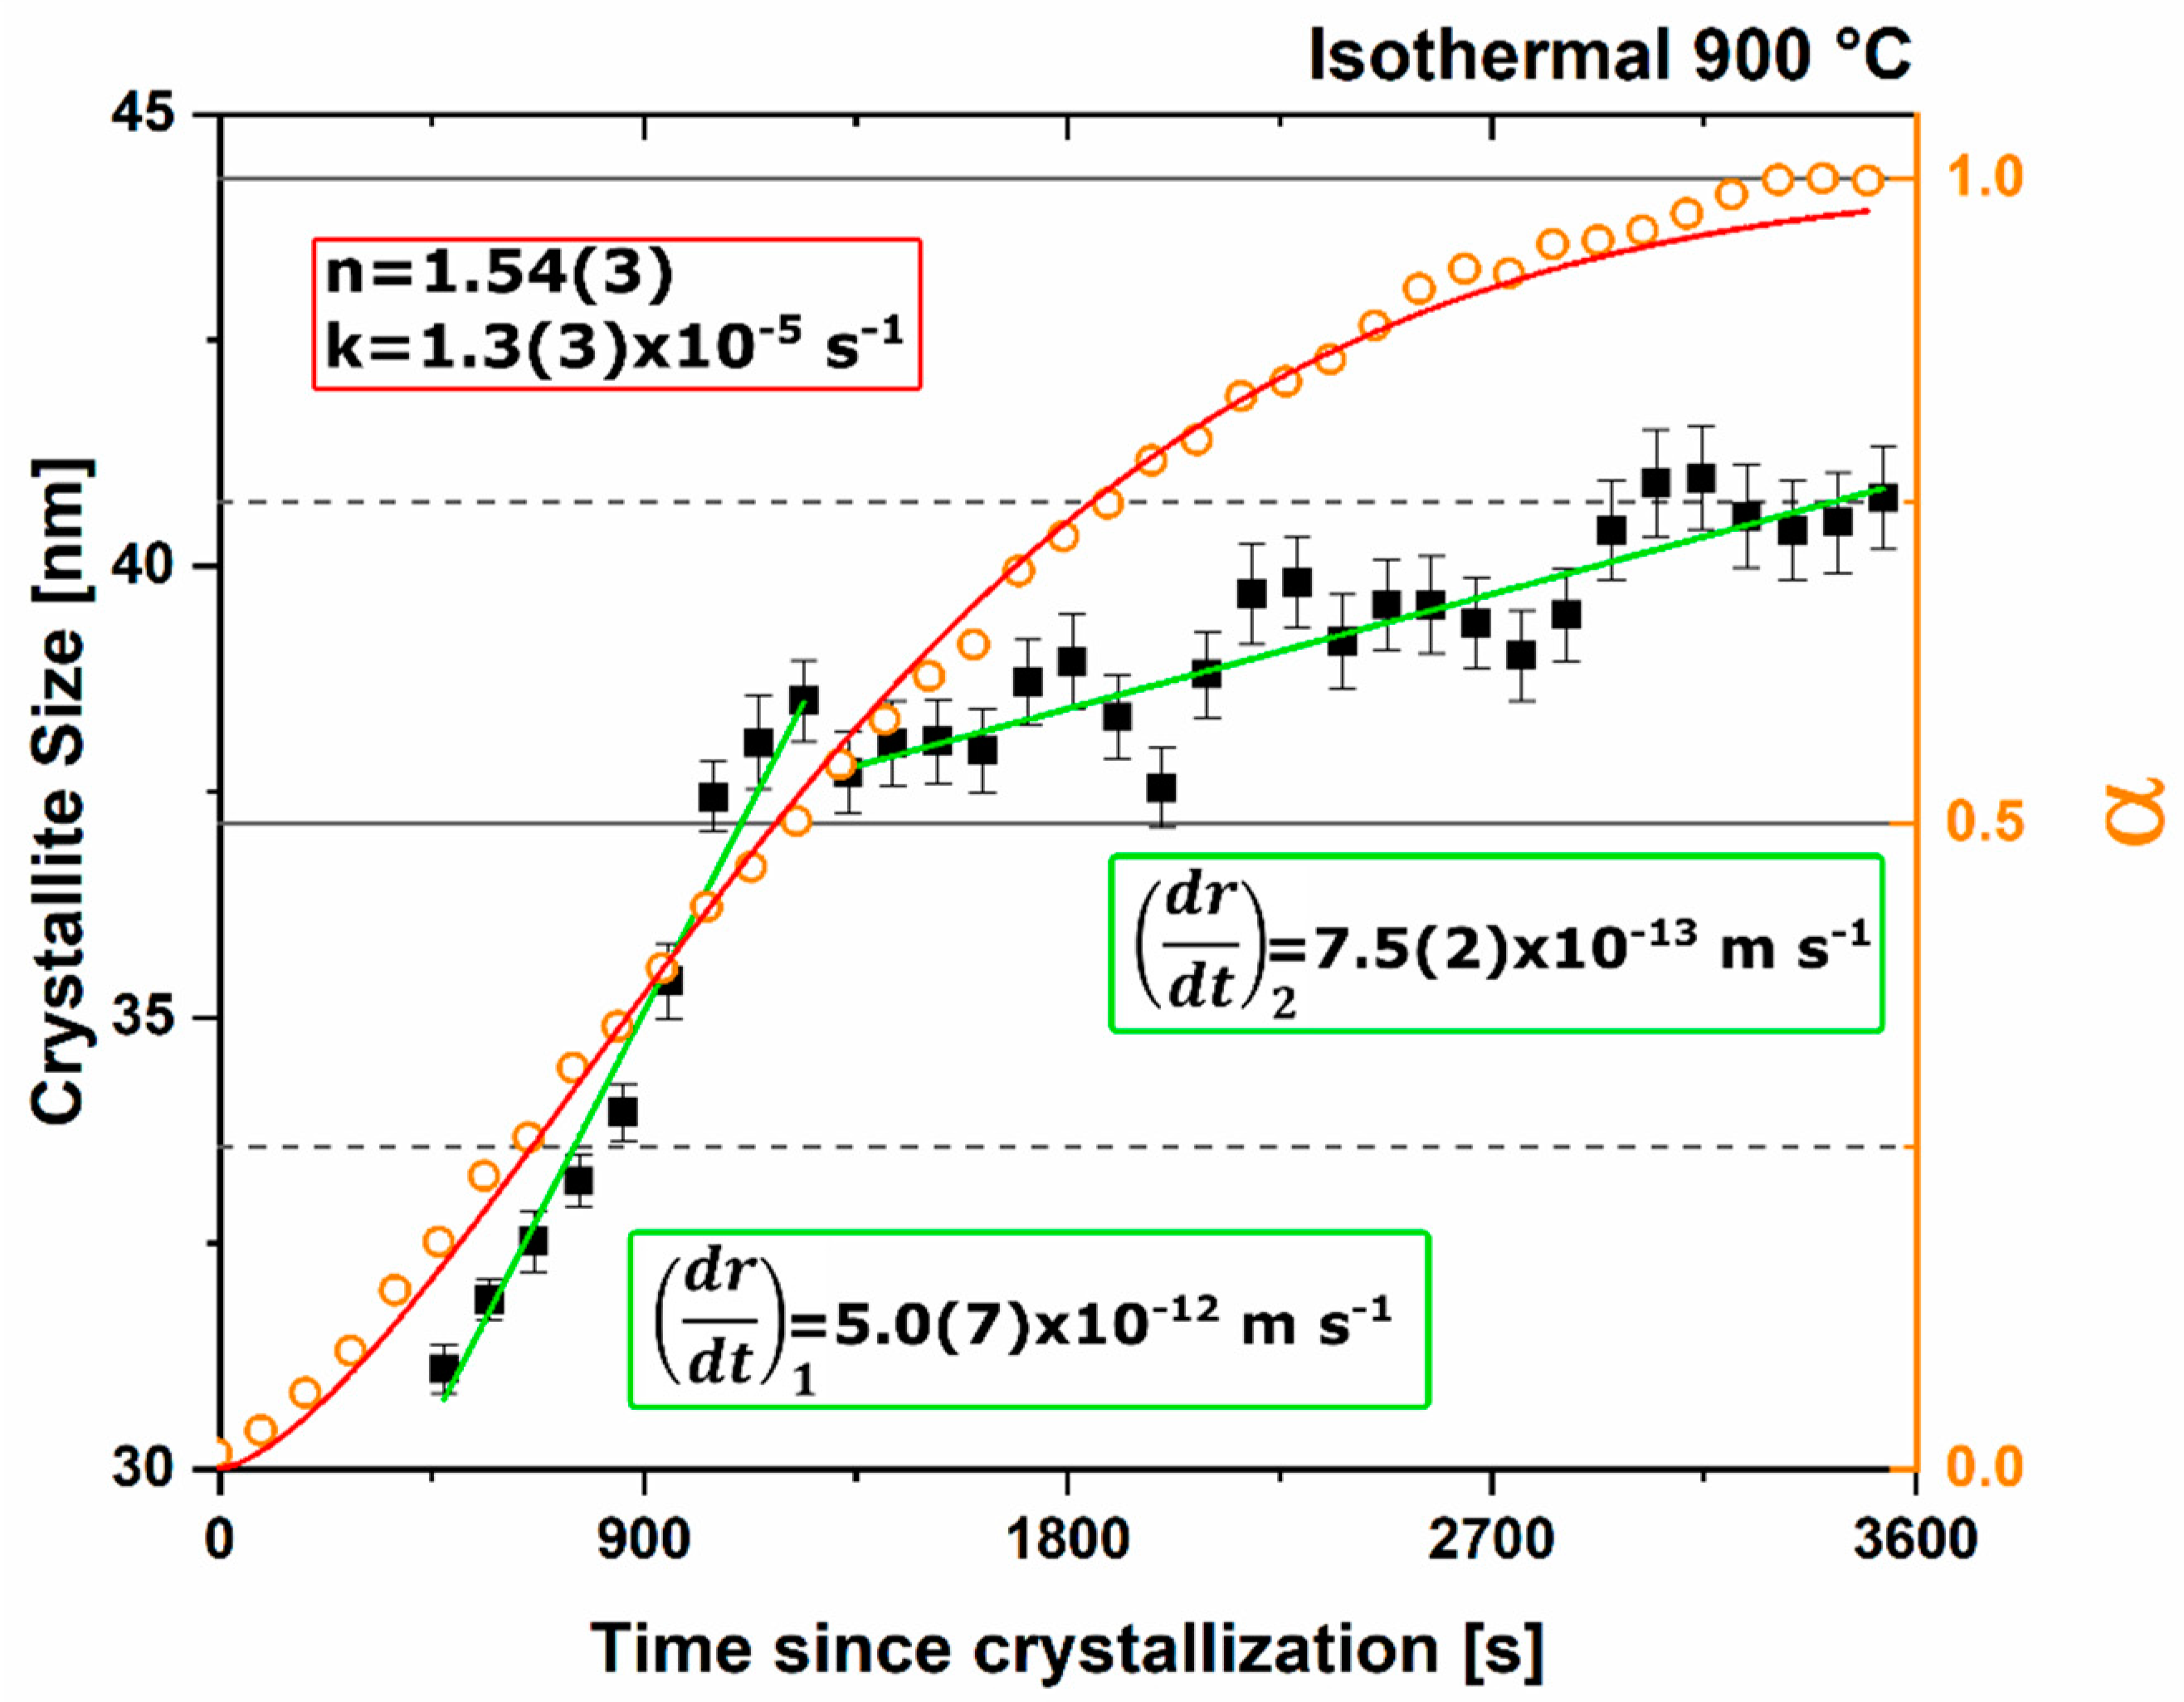
An isothermal master plot characterizing the rate of formation for C12A7 synthesized using the PVA sol-gel method in dry conditions demonstrates a clear JMAK behavior and fitting to the Avrami equation determines an n value of 1.54(3) and a rate constant, k, of 1.3(3) × 10−5 s−1 (Figure 7D and Figure 8). This constitutes a decrease in the n parameter by ~15% and an increase of two orders of magnitude in the rate of reaction. Microstructural evolution demonstrates a clear two stage transformation not observed under ambient conditions; compare Figure 8 to Figure 5. Initially, for low levels of formation, rapid isothermal coarsening of crystallite size from 32 to 38 nm is observed at a rate of 5.0(4) × 10−12 m/s, followed by a slow increase from approximately 38 to 42 nm over a 2 h isothermal dwell with a rate of 7.2(3) × 10−13 m/s. The latter rate is equivalent to the rate observed under ambient conditions. With atomic homogeneity statistically phase pure C12A7 formation is observed when isothermally characterized at 900 °C and when isochronally characterized C12A7 and C5A3 formation occurs, however, an equilibrium is reached with no further increase in C5A3 during a dwell at 1100 °C.
3.3. Vacuum
With high heterogeneous reactants, as-received SSS, the same phase evolution as in wet and dry atmospheres is observed initially, however, in the fourth and fifth stages the presence of C12A7 and C5A3 formation, respectively, do not occur (Figure 9). CaCO3 decomposition is observed starting at 500 °C. The exact end temperature is unknown as the furnace was isothermally held at 600 °C to protect vacuum stability during the decomposition and evolution of CO2 gas. The CaO and Al2O3 phase equilibrium is maintained until 990 °C where C3A and CA phase formation is observed. C3A demonstrates a quicker initial formation, however, the rate of CA formation increases and after 2 h of processing at the maximum temperature the CA wt% is 70% of the theoretical maximum CA concentration and C3A is only 30% of the theoretical maximum C3A concentration if all CaO and Al2O3 were expended. A clear equilibrium is observed with the reaction rates plateauing. No C12A7 or C5A3 formation is observed during the isothermal dwell at 1200 °C in a high vacuum environment. The C3A formation occurs rapidly initially but approaches a maximum value before 1200 °C. CA phase formation continues with the largest increase in wt% observed at 1200 °C. Isothermal master plots characterize of the rate of CA formation during this isothermal segment and reveal a clear exponential decay of reaction rate characteristic of diffusion-based transformations (Figure 10). Under vacuum conditions, the thermodynamic equilibria favor C3A and CA phase formation, however, diffusion-based kinetics is the main impediment to full CaO and Al2O3 reaction to form C3A and CA. Milled SSS reactant studies were unable to be performed under vacuum conditions due to the rapid evolution of CO2 gas during CaCO3 decomposition and vacuum level instability.
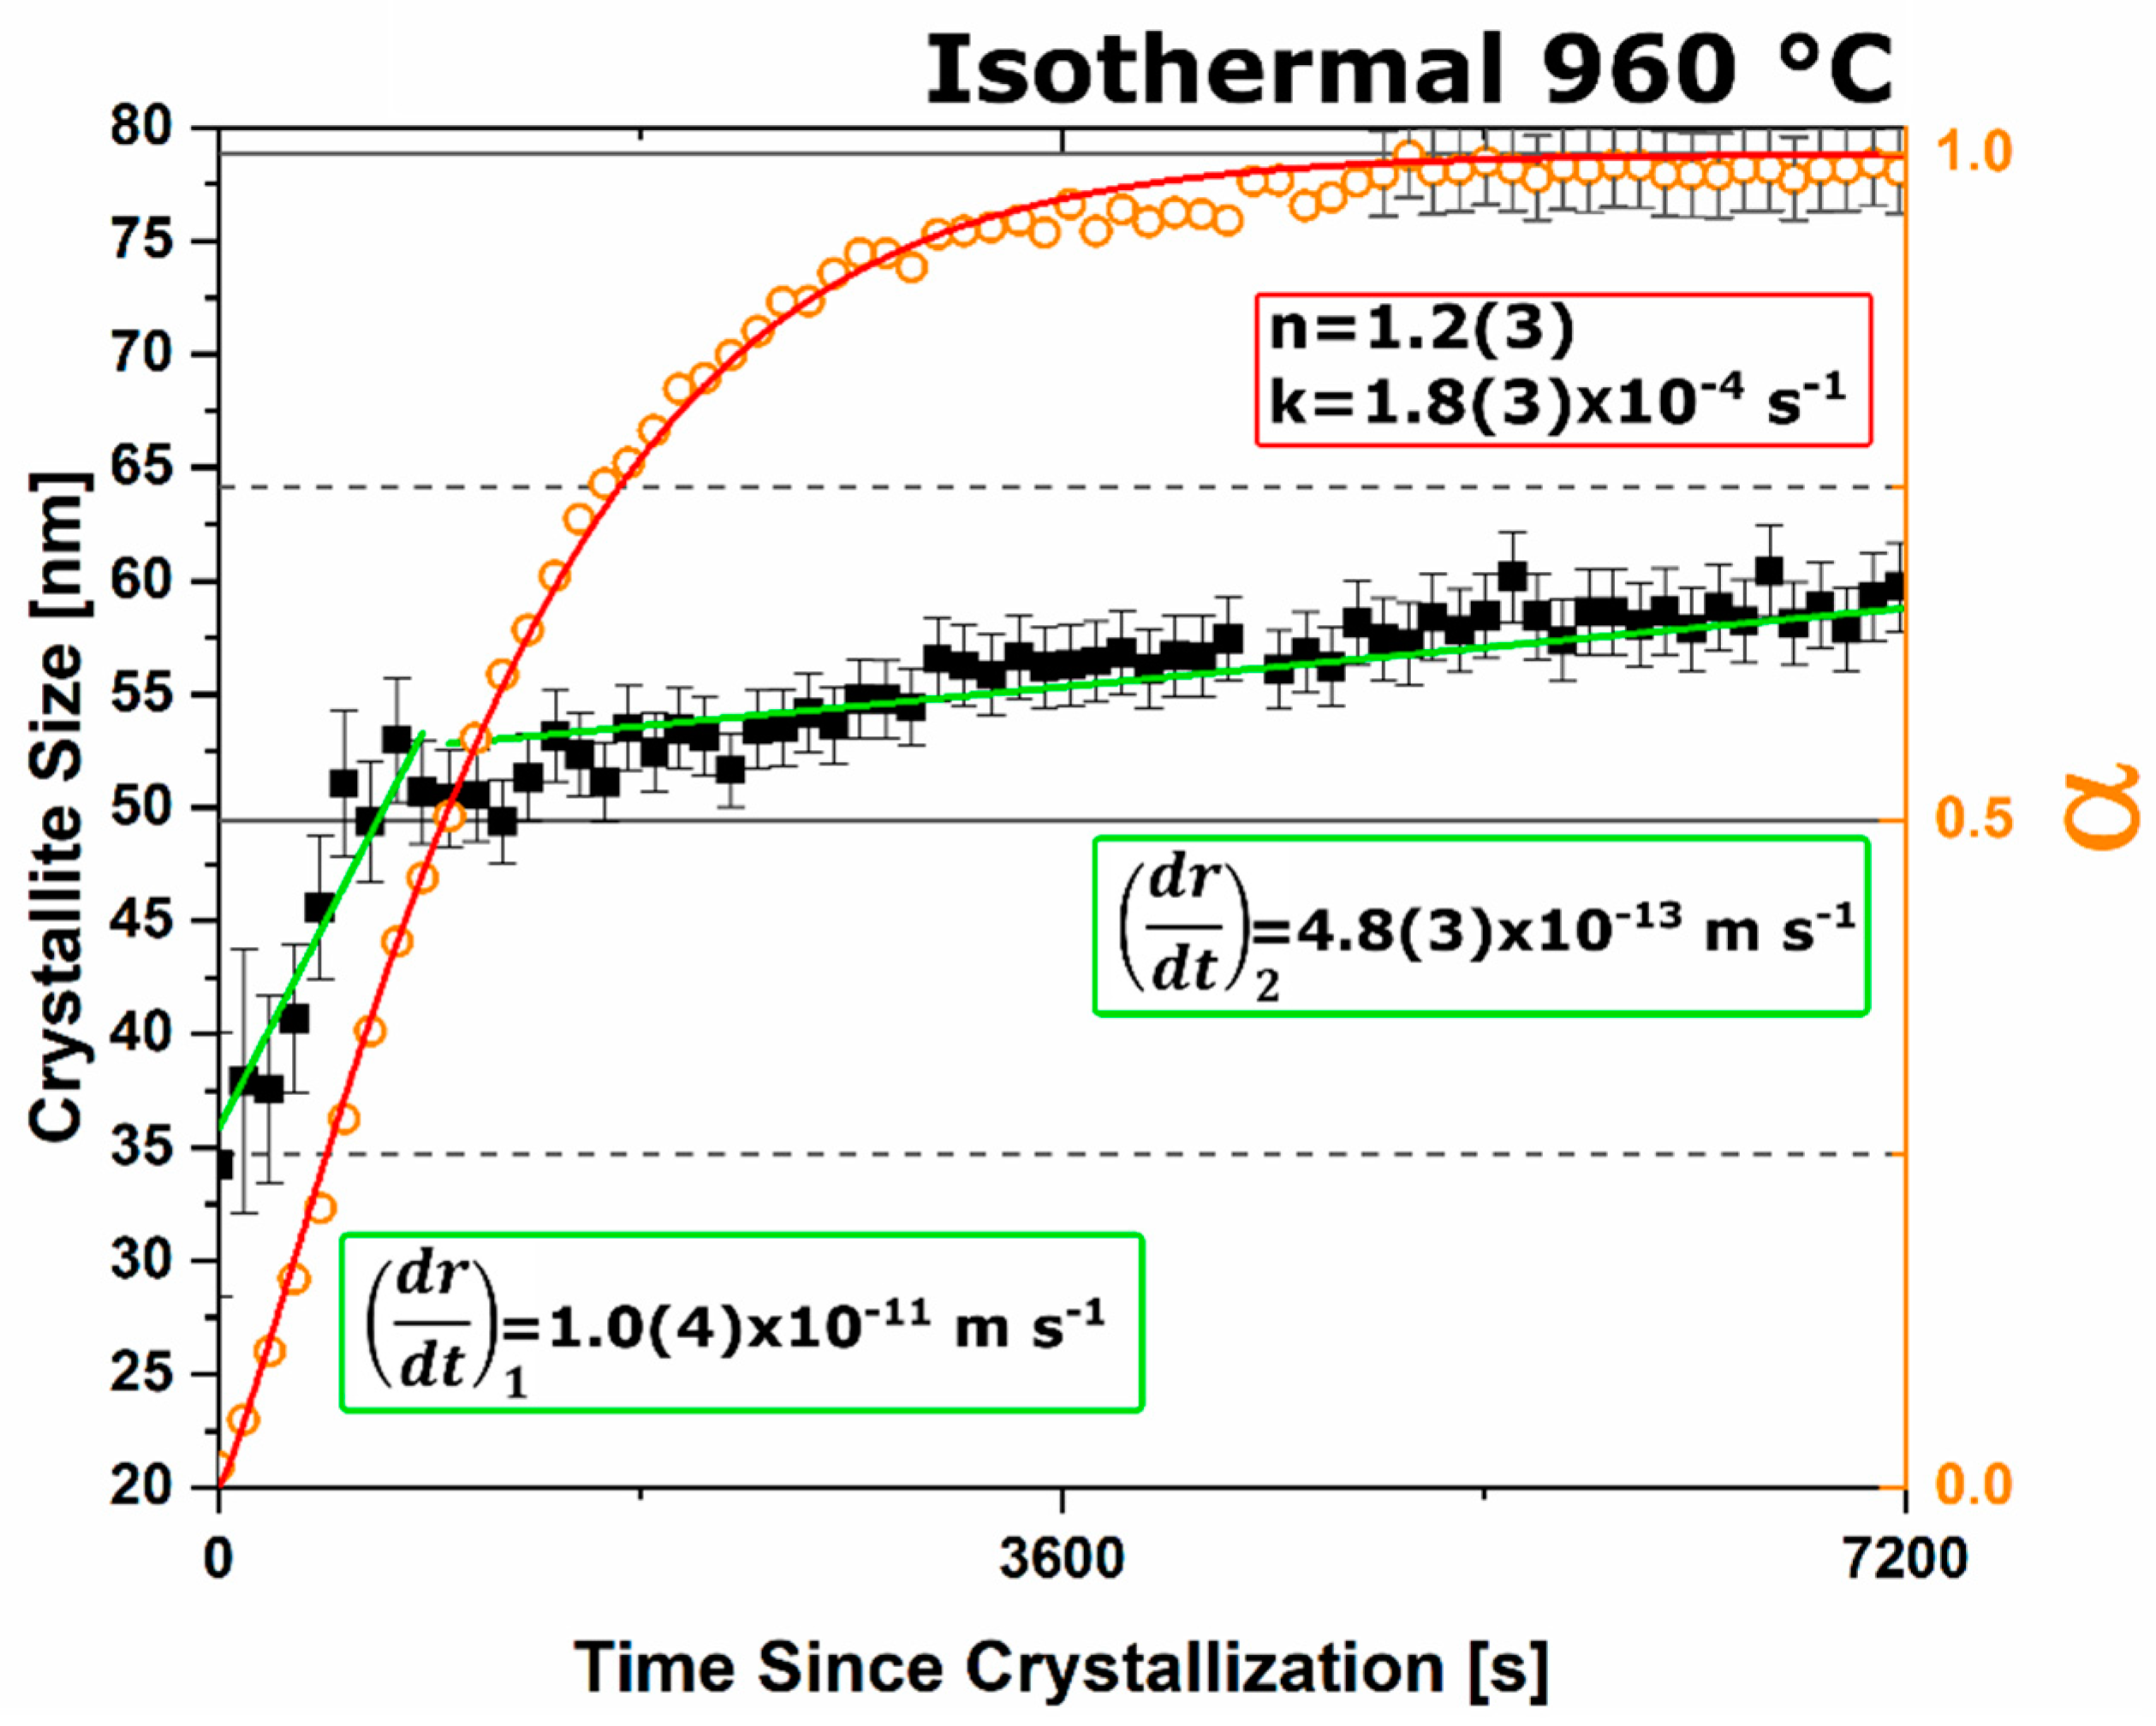
When atomic reactant homogeneity is achieved with the sol-gel reactants, C12A7 phase formation is observed directly from the amorphous precursor at 960 °C (Figure 9). This is an increase in the onset temperature of C12A7 formation by 60 and 110 °C in dry and ambient atmospheres, respectively. C3A and CA phase formation occurs concurrently with C12A7, but the rate of phase formation of C12A7 mirrors that observed under ambient and dry conditions, albeit at a higher temperature. As the isochronal characterization continues with an isothermal dwell at 1100 °C C5A3 formation at the expense of C12A7 is observed as process time is extended. Under isothermal conditions at the onset of formation, 960 °C, the C3A and CA phase formations are initially delayed and no C5A3 formation at the expense of C12A7 is observed at these temperatures (Figure 9). The isothermal master plot of C12A7 formation indicates the rate of reaction correlates reasonably well with a JMAK type kinetic transformation consistent with previous characterizations under dry and ambient atmospheres, Figure 10. Fitting α to the Avrami equation an n value of 1.2(3) and a rate constant, k, of 1.8(3) × 10−4 s−1 is determined, Figure 11.
This demonstrates a further decrease in the n exponent and an order of magnitude increase in the rate constant compared to those observed under dry conditions. Microstructural evolution demonstrates a two-stage growth process (Figure 11) similar to that observed for dry conditions. Initially, for low levels of crystallization, rapid coarsening of crystallite size from approximately 35 to 52 nm is observed at a rate of 1.0(4) × 10−11 m/s, followed by a slow increase from approximately 52 to 57 nm over a 2 h isothermal dwell with a rate of 4.8(3) × 10−13 m/s. The first stage rate of crystallization and the increase in size is higher than under dry conditions; this is likely correlated to the increase in isothermal characterization temperature. The second stage growth rate is similar in magnitude to that observed under dry and ambient conditions with a limited increase in crystallite size of approximately 7 nm from approximately 51 to 58 nm. Under vacuum conditions, direct formation of C12A7 is observed with secondary phases (<20 wt%) at 960 °C and eventual phase instability leads to decomposition at 1100 °C.
4. Discussion
The change in reactant homogeneity has no effect on the thermodynamic equilibrium. Given sufficient time for the kinetics and diffusion to occur, all systems should reach the same final state for a specified temperature. The change produced by altering reactant homogeneity alters the kinetic behavior and pathway to that final state. Characterization of stoichiometrically C12A7 reactant mixtures as a function of reactant homogeneity and processing atmosphere leads to changes in C12A7 formation, elucidates the atmosphere dependent thermodynamic equilibrium and role of C5A3 in the calcium aluminate system, and defines the low temperature kinetic equilibrium of C12A7 regardless of the thermodynamic equilibrium.
4.1. Kinetics Pathways of Formation
The kinetic pathway toward C12A7 equilibrium displays changes in the rate of reaction and a decrease in temperature; the following discussion pertains to ambient atmosphere characterization. Large reactant heterogeneity exists when the CaCO3 particles are orders of magnitude larger than the Al2O3 particles. In this case, the kinetic pathway demonstrates evolution through off-C12A7 stoichiometry phases C3A and CA with the latter Al-rich phase showing a larger concentration. C12A7 formation is not observed until approximately 1200 °C and the system approaches an equilibrium of C3A, CA, and C12A7. No three-phase region exists in the thermodynamic phase diagram indicating the system is not yet at equilibrium, and, with increased process time, reaction of C3A + CA to C12A7 should occur. The kinetic characterization shows clear diffusion-type behavior as the diffusion pathways are long and grow longer with continued formation of C12A7. This is typical behavior for solid-state reaction synthesis and results in the need of the iterative process of firing, grinding, and pressing usually implemented to disrupt this long diffusion pathway and facilitate reaction of the off-stoichiometry phases.
The alternative to grinding after the initial reaction is milling the initial starting reactants to lower the degree of mixture heterogeneity. In this study the reactants are milled until both CaCO3 and Al2O3 reactants have particle sizes on the order of 100 nm. This reduction in heterogeneity, when compared to the high heterogenous as-received reactants, leads to a reduction in the formation temperature by 15% to approximately 1000 °C with most of the formation occurring above 1050 °C. The kinetic pathway follows the same route through off-stoichiometric C3A and CA phases, however, the rate of formation of these phases and C12A7 is drastically increased. The ultimate C12A7 concentration of >90 wt% is achieved after 0.5 h. A non-equilibrium state of C3A, CA, and C12A7 is observed but the concentration of C12A7 has more than doubled. The type of kinetic transformation cannot be determined as the formation occurs in a non-isothermal region, but under dry conditions a JMAK-type kinetic formation is observed that can be assumed to be the type of kinetic transformation under ambient conditions as well. This indicates that nucleation and growth of the C12A7 phase, rather than long-range diffusion, is the limiting factor in phase formation.
If the highly-heterogenous solid-state reactant mixture represents the extreme of heterogeneity, an amorphous sol-gel reactant represents the opposite extreme, where atomic level homogeneity eliminates reactant heterogeneity. The formation temperature of C12A7 reduces 30% from the heterogeneous extreme to 850 °C with C12A7 being the first and only crystalline phase to form. Previously, thermodynamic studies have proposed the pathway through C5A3 and C3A to be the low temperature formation pathway [6,7]. For homogeneous reactants, this pathway is not present. At these low temperatures, diffusion does not readily occur and kinetically favorable phases, which are often disordered, lower-density phases, will form [18]. In the calcium aluminate system C3A (ρtheoretical = 3.064 g/cm3), C5A3 (ρtheoretical = 3.067 g/cm3), and CA (ρtheoretical = 2.94 g/cm3) are all ordered higher-density phases while C12A7 (ρtheoretical = 2.68 g/cm3) forms a disordered clathrate structure with a large amount of crystallographic void space [19,20,21,22]. Therefore, there is no precursor crystalline phase and C12A7 is the only favorable phase to form at low temperature. The kinetic formation of C12A7 under these conditions exhibits JMAK-type behavior with an n value approaching 2; however, the existence of a non-uniform growth rate (best observed under dry and vacuum conditions) invalidates physical representation of the n value. The lack of diffusion-driven thermodynamic behavior leads to a slowly evolving microstructure with crystallite size of ~40 nm.
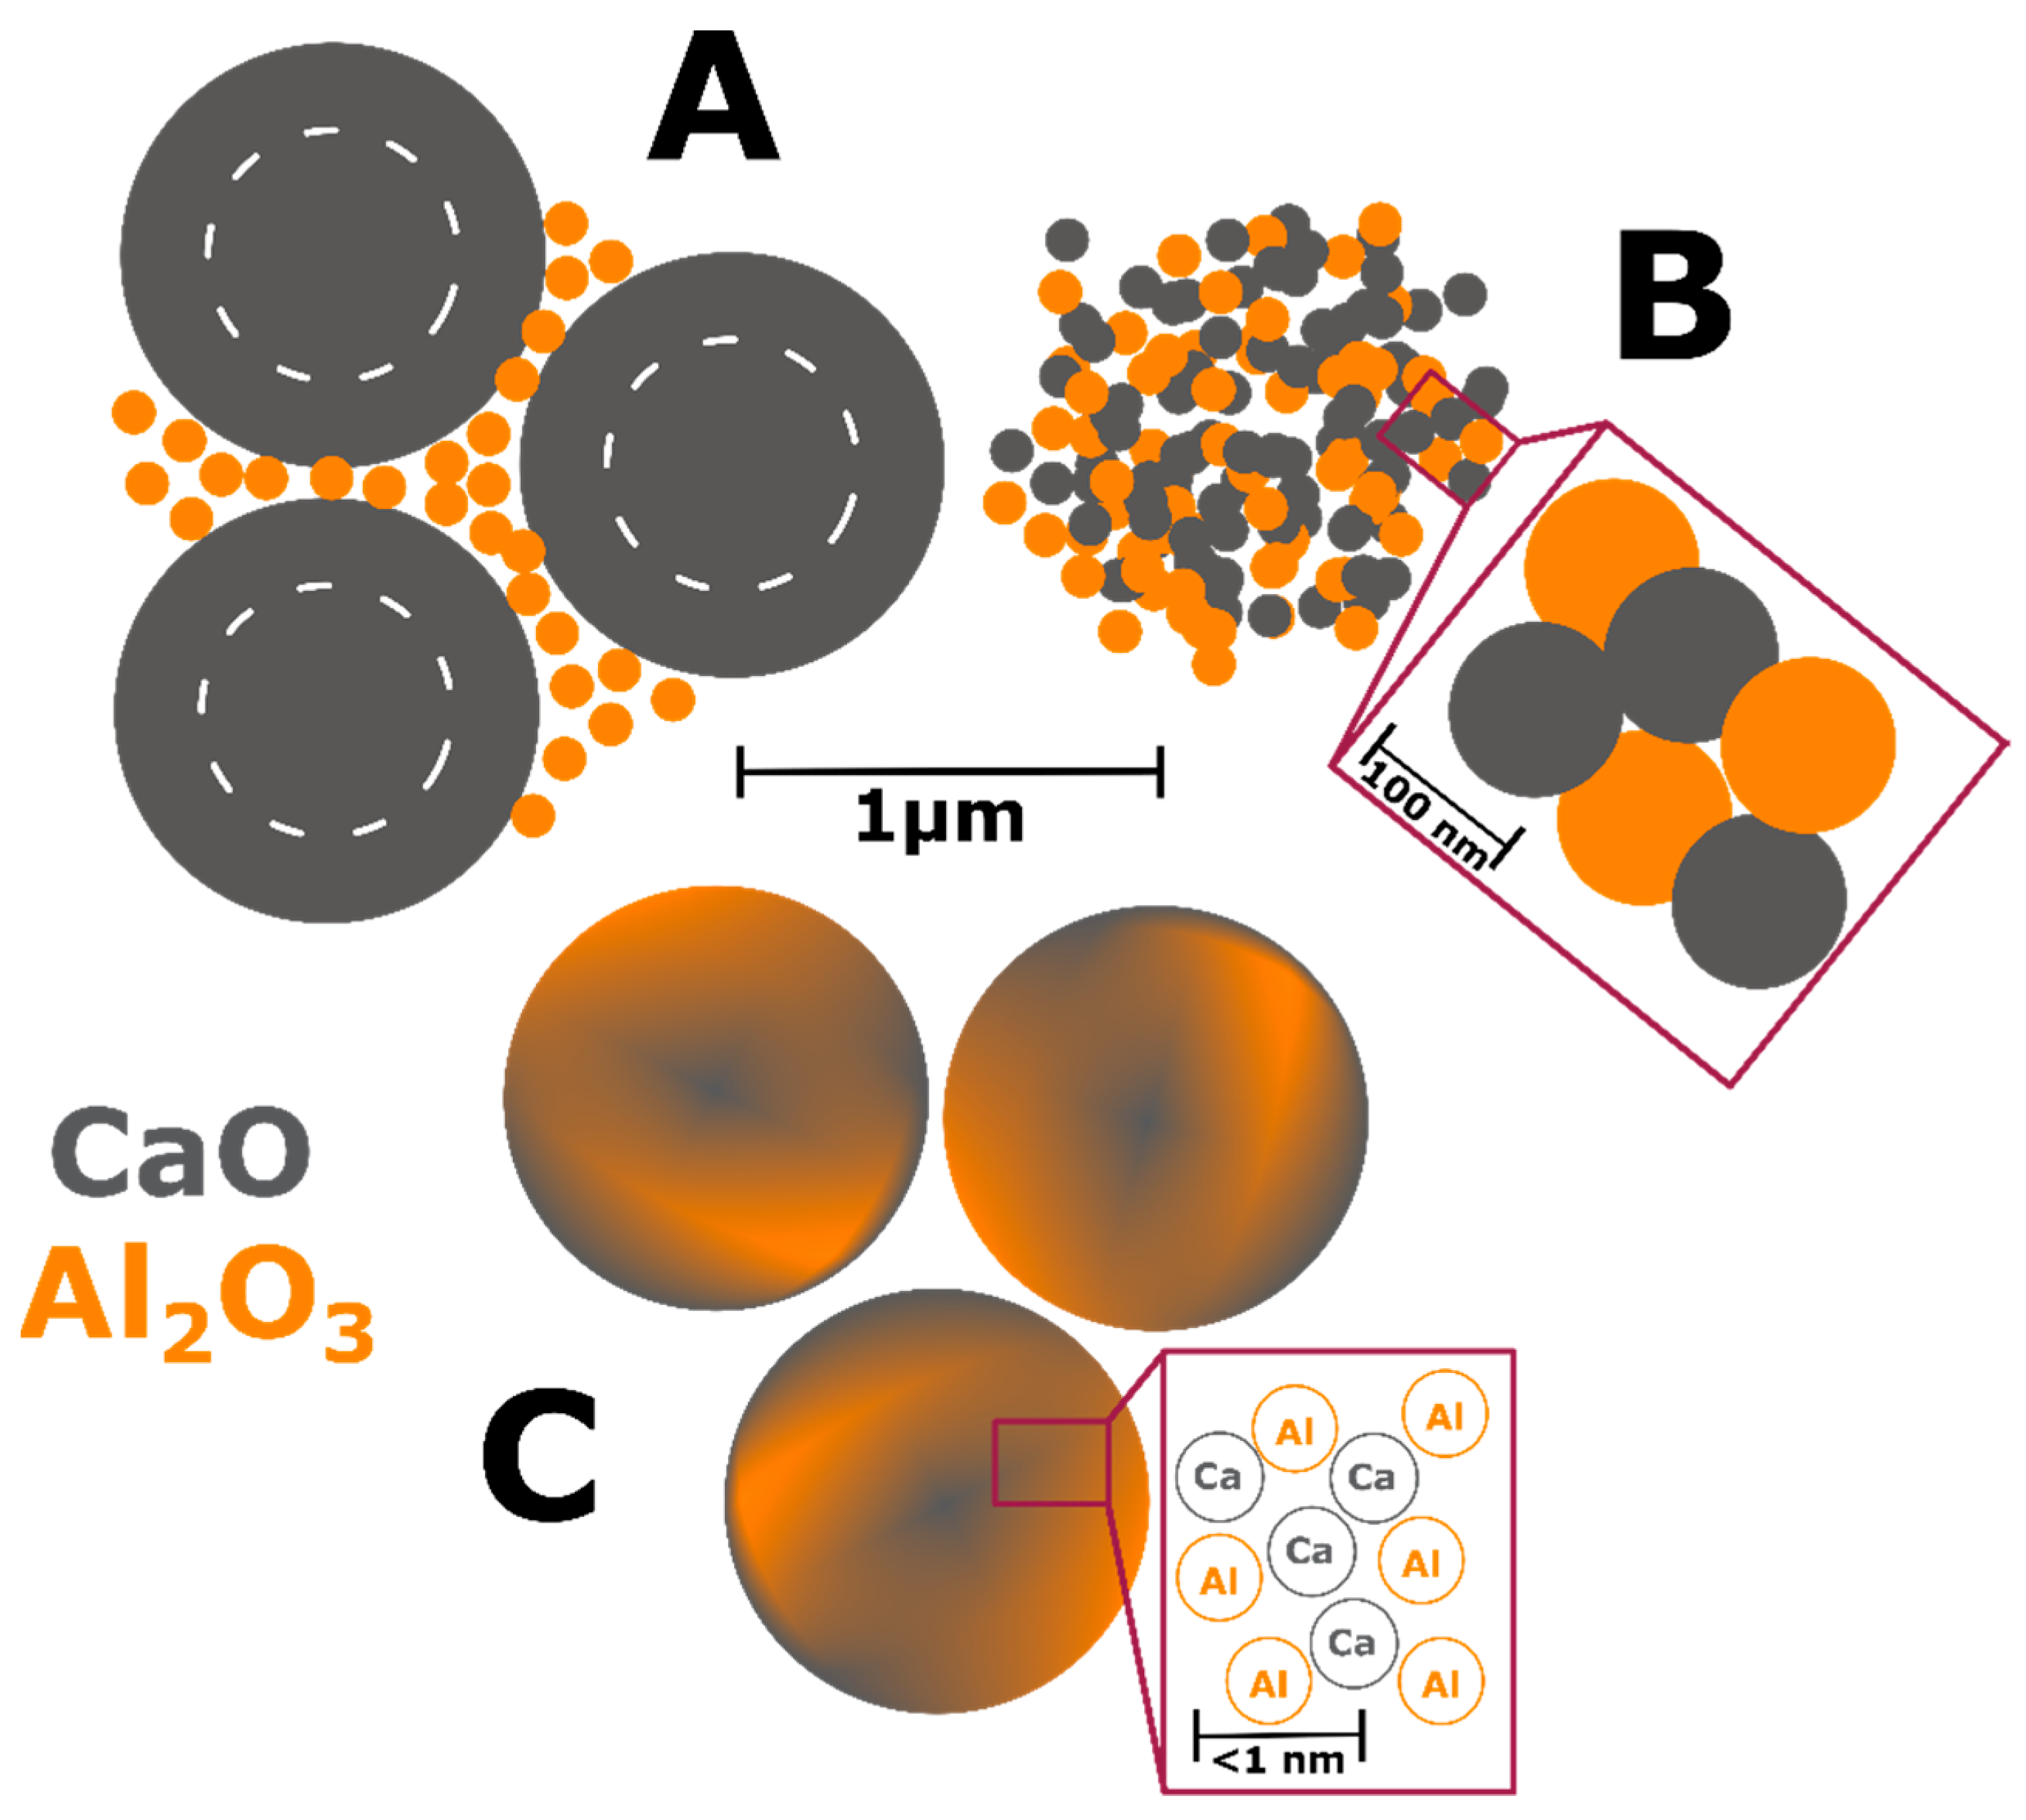
A physical relationship between reactant homogeneity and the observed behavior is shown in Figure 12. In the heterogenous reactant case (Figure 12A) a large portion of the Ca stoichiometry is trapped at the center of the large CaCO3 particles and is essentially blind to the ensuing reactions after decomposition to CaO. This leads to local Al-rich regions and highly reactive Al2O3 particles due to their higher surface area explaining the preferential formation of the aluminum-rich CA phase. The long distance to the Ca stoichiometry limits the reaction yielding diffusion-limited kinetic behavior.
When the particle size is reduced as in Figure 12B, both reactants have equivalent surface area and reactivity leading to high nucleation and growth of the thermodynamically-favored C12A7 phase. The shorter diffusion pathways change the limiting kinetic behavior from the availability of stoichiometry to the nucleation, growth, and impingement of nucleates; this is a process that requires less energy, lowering the formation temperature and accelerating the reaction.
When reactant heterogeneity is removed, and atomic homogeneity is achieved as in Figure 12C, formation of C12A7 requires the diffusion of atoms on the order of single atomic spacings. The kinetic behavior is also controlled by the nucleation, growth, and impingement of nuclei giving the observed JMAK behavior. The controlling kinetic process in C12A7 formation is dependent on reactant heterogeneity and diffusion of cationic/anionic pairs, indicating a microstructural and processing behavior which varies as the reactant mixture changes. The intrinsic behavior of the system without microstructural influence is revealed if diffusion is not required. Under these conditions, C12A7 is the only phase to form as it is the most disordered and lowest density calcium aluminate phase and kinetically favorable to form at low temperatures.
4.2. C12A7 Atmospheric Effects on Thermodynamic Stability
The role of process atmosphere has a significant, systematic effect on the stability and occluded anion chemistry of the C12A7 structure and, by correlation, its properties and application. C12A7 is the thermodynamically-favorable structure under humid, ambient conditions. Furthermore, the literature thoroughly establishes that the C12A7 structure is thermodynamically unfavored in non-humid atmospheres (e.g., dry or vacuum conditions) at elevated temperatures (>1050 °C). This includes both thermodynamically-calculated phase diagrams and experimental results [2,4]. The kinetic characterization for dry (~150 ppm H2O) and vacuum atmospheres reported herein supports the instability of C12A7 under non-humid atmospheres but details a formation pathway contrary to that reported in thermodynamic studies. Under dry conditions the formation of C12A7 occurs but it is only an intermediary phase en route to the final C5A3 thermodynamic equilibrium. Under vacuum conditions no C12A7 forms and, by correlation, no C5A3 leading to a C3A and CA thermodynamic equilibrium.
With heterogenous reactants under a dry atmosphere the formation pathways remain the same as under ambient conditions, albeit with an additional step in the kinetics related to the decomposition of C12A7 to the thermodynamically-favored phase C5A3. When heterogeneity is high, C12A7 formation and C5A3 formation occurs slowly due to the diffusive nature of the formation process. As the reactants are milled and heterogeneity is decreased, the formation of C12A7 and C5A3 initially occur with JMAK-type kinetic behavior leading to rapid phase formation. The formation of C5A3 follows the formation of C12A7 with an increase in temperature supporting the decomposition of C12A7 to C5A3 formation mechanism. Comparison of the extended behavior at 1200 °C confirms this reaction; a linearly decreasing rate is observed, consistent with a particle conversion process. Initially JMAK-type behavior is observed as C5A3 nucleates on the outside of the C12A7 particles. As the formation process proceeds, the inward conversion of the C12A7 particle leads to a change in the limiting kinetic process, Figure 13.
With heterogenous reactants under a vacuum atmosphere only the high-heterogeneity characterization was performed to protect vacuum integrity. No C5A3 formation from C12A7 was observed. The combined long-diffusion pathways and lack of atmospheric oxygen further precludes C12A7 formation, with oxygen as the occluded anion, which prevents the kinetic decomposition and transformation to C5A3. C5A3 itself does not appear to form from C3A and CA, indicating it is only favorable to form through the kinetic pathway with C12A7 as an intermediary phase.
This represents a shift in the understanding of the C12A7 phase space where C5A3 and C3A are currently reported as the low temperature formation routes to C12A7 and to calcium aluminates in general [6,7]. In these kinetics studies C5A3 was never observed as an intermediary product to C12A7 formation regardless of atmosphere and reactant homogeneity. C5A3 is only a product that is formed through the decomposition of C12A7. This is a discrepancy when considering thermodynamic studies of calcium aluminate formation, however, review of the relevant literature shows that a misclassification of the C12A7 as C5A3 has led to the dialog where C5A3 and C3A are the intermediary phases; this justification is provided in the supplementary information [6,7]. When this correction is made the results from the thermodynamic studies support the observed kinetic behavior and C5A3 should be considered a decomposition product of C12A7 and not an intermediary phase in the formation of calcium aluminates. The presence of C5A3 indicates a lack of sufficient moisture to stabilize the C12A7 structure after formation at elevated temperatures above 1050 °C.
4.3. C12A7 Atmospheric Effects on Kinetic Stability
Thermodynamic equilibrium drives the system kinetics to the lowest free energy phase; however, the process inherently requires the diffusion of cationic and anionic species in ionic materials. When in a temperature regime where this diffusion is sluggish, the thermodynamic equilibrium may not be achieved due to sluggish kinetics and instead a new kinetic equilibrium exists. The kinetic equilibrium is characterized by phases favored by limited diffusion. As the reactant mixture heterogeneity is removed and atomic level homogeneity is achieved diffusion is no longer the limit to formation and C12A7 is observed as the first crystalline phase at a temperature 30% lower than with heterogenous reactants. C12A7 is the kinetically-favored phase to form under ambient conditions and as the atmosphere is changed C12A7 is still the predominant phase to form regardless of the thermodynamic equilibrium characterized at higher temperatures.
Under dry and vacuum environments C12A7 is still the first crystalline phase to form from the amorphous precursor, but the formation temperature is increased from 850 °C under humid environments to 900 and 960 °C for dry conditions and under a vacuum, respectively. This change in temperature also comes with a change in the evolution of the microstructure and fitted JMAK behavior. The change in temperature indicates a change in the activation energy for C12A7 formation indicating a change in the formation process as a function of atmosphere. Initially hydration and the hydroxide occluded anion play a role in the formation kinetics. When this moisture is removed, the increase in temperature indicates that the formation of just oxygen occupied cages has a higher activation energy. The further increase in temperature with the removal of oxygen partial pressure can be characterized by a change in the occluded anion source from the atmosphere to purely the reactant mixture. This process requires solid-state rather than atmosphere-solid interface diffusion leading to the higher observed formation temperature correlated to a higher activation energy.
The change in the source of the anionic species leads to the observed change of the fitted kinetic parameters. A two-stage nuclei-growth behavior is observed under dry and vacuum conditions where rapid growth is observed for the first 50% of the transformation followed by a slower growth rate that is equivalent to the growth rate under ambient humid atmospheric conditions. The change is the removal of moisture and the lack of hydroxide occupied cages. In C12A7 the rate of diffusion for vs. is higher allowing for rapid diffusion of oxygen [4,23]. The diffusion within ionic materials requires the co-diffusion of cation and anionic species. With this change in occluded anion mobility the extra framework oxygen can quickly diffuse to the growing particle interface, which facilitates the diffusion of only cationic species, rather than the combined diffusion of anionic and cationic species, to lead to further growth. In the presence of rapid diffusion of oxygen to the surface of the C12A7 particle, only the diffusion of cationic species is required. Control over the change in occluded anion through processing conditions will aid in the application of C12A7 where either or are desired; this is especially true in catalytic applications where oxygen mobility, and by correlation catalytic efficiency, is limited by the presence of the slow hydroxyl species [4,24,25].
This is the first report of crystallization of C12A7 in a non-carbonaceous vacuum environment and is achieved by limiting the expression of the thermodynamic equilibrium in favor of the kinetic equilibrium; this raises the issue of the source of the occluded anion which has historically been correlated to the atmosphere. The decomposition of PVA results in an amorphous low C content precursor which is white in color after calcining at 600 °C. The PVA reactant consists of Ca-O and Al-O complexes with no long-range order and when viewed stoichiometrically CaO and Al2O3 requires no additional oxygen to reach oxy-C12A7 stoichiometry.
When diffusion pathways are short this extra oxygen could be used to template the cages and form C12A7 without the addition of atmospheric oxygen. This observation represents a fundamental shift in the perception that no template anion is present in reducing non-oxidizing atmospheric conditions [3]. The compromise for sourcing the stabilizing anion from the reactant mixture is the needed increase in energy to promote diffusion which leads to a formation temperature 110 °C higher than under a humid environment; this also enters an energy regime where the thermodynamic equilibrium can be expressed leading to the concurrent formation of C3A and CA. When atomic homogeneity exists, the short diffusion pathways allows for reactant mixture occluded oxygen to template the C12A7 structure under vacuum conditions.
5. Conclusions
In situ rapid XRD data provide insight into the kinetics of solid-state phase transformations and represents a valuable tool to further understand the evolution of materials toward thermodynamic equilibrium. Through this characterization a new understanding of the evolution of phase formation and thermodynamic and kinetic stability of various calcium aluminates, and especially C12A7, formation has been presented.
The kinetics and process variables for calcium aluminate formation are directly related to the physical heterogeneity of the reactant mixture. By decreasing reactant heterogeneity, the rate of reaction and the temperature of phase formation can be controlled. When reactant homogeneity is eliminated, C12A7 no longer requires intermediary crystalline phases and forms directly form the reactant mixture. It was previously understood that C5A3 and C3A, along with C3A and CA, were preferred formation pathways to C12A7 and that C5A3 and C3A are the initial intermediary phases to all calcium aluminates. In situ kinetic studies highlight that this is not the case and that C3A and CA, and direct crystallization to C12A7, are the formation pathways under heterogenous and homogeneous conditions, respectively. C5A3 is a decomposition product of C12A7 and is only observed to form through a kinetic pathway related to a particle conversion transformation.
The thermodynamic equilibrium for a Ca:Al ratio of 12:14, given enough time for all kinetic processes to complete, is as follows:
- (1)
- Ambient Conditions: C12A7
- (2)
- Dry (≤150 ppm H2O) Conditions: C5A3 through C12A7 particle conversion process
- (3)
- Vacuum Conditions: C3A and CA
The thermodynamic equilibrium is contrasted by the kinetic equilibrium observed at temperatures below 1000 °C with a homogeneous reactant mixture. C12A7 is the predominate phase (≥80 wt%) to form under ambient, dry, and vacuum conditions. When the temperature is raised, the thermodynamic equilibrium ultimately results with decomposition of C12A7 to C5A3 under dry and vacuum conditions; the rate of decomposition is higher under vacuum conditions. The presence of C12A7 formation under vacuum conditions demonstrates that the anion source is not solely derived from the process atmosphere but also from the reactant mixtures. This is the first reported formation of C12A7 under vacuum conditions due to the favorable kinetic conditions. With the correlation of reactant heterogeneity and process atmosphere understood, synthesis and processing of calcium aluminates, including the highly functional C12A7, can be better controlled for desired micro- and atomic structured products.
Supplementary Materials
The following are available online at https://www.mdpi.com/2571-6131/1/1/16/s1.
Author Contributions
Conceptualization, J.R.S.; Investigation, J.R.S.; Resources, C.R.; Data Curation, J.R.S. and C.R.; Writing-Original Draft Preparation, J.R.S.; Writing-Review & Editing, C.R.; Project Administration, C.R.
Funding
This research was supported by funding from the State of Tennessee and Tennessee Higher Education Commission (THEC) through their support of the Center for Materials Processing. XRD characterization was performed at the Joint Institute for Advanced Materials (JIAM) Diffraction Facility, located at the University of Tennessee, Knoxville.
Conflicts of Interest
The authors declare no conflict of interest.
References
- Feizi, E.; Ray, A.K. 12CaO·7Al2O3 Ceramic: A Review of the Electronic and Optoelectronic Applications in Display Devices. J. Disp. Technol. 2016, 12, 451–459. [Google Scholar] [CrossRef]
- Liao, S.; Yao, R.; Chen, X.; Wang, G.; Zheng, F. Characteristics, Thermodynamics, and Preparation of Nanocaged 12CaO·7Al2O3 and Its Derivatives. Int. J. Appl. Ceram. Technol. 2016, 13, 844–855. [Google Scholar] [CrossRef]
- Kim, S.W.; Hosono, H. Synthesis and properties of 12CaO·7Al2O3 electride: Review of single crystal and thin film growth. Philos. Mag. 2012, 92, 2596–2628. [Google Scholar] [CrossRef]
- Eufinger, J.; Schmidt, A.; Lerch, M.; Janek, J. Novel anion conductors—Conductivity, thermodynamic stability and hydration of anion-substituted mayenite-type cage compounds C12A7:X (X = O, OH, Cl, F, CN, S, N). Phys. Chem. Chem. Phys. 2015, 17, 6844–6857. [Google Scholar] [CrossRef] [PubMed]
- Salasin, J.R.; Schwerzeler, S.E.; Mukherjee, R.; Keffer, D.J.; Sickafus, K.E.; Rawn, C.J. Direct Synthesis and Structural Characterizaiton of Electride C12A7 formation in a Carbonaceous Vacuum Enviroment. Acta Mater. 2018. in submission. [Google Scholar]
- Tian, Y.; Pan, X.; Yu, H.; Tu, G. Formation mechanism of calcium aluminate compounds based on high-temperature solid-state reaction. J. Alloys Compd. 2016, 670, 96–104. [Google Scholar] [CrossRef]
- Ruszak, M.; Witkowski, S.; Pietrzyk, P.; Kotarba, A.; Sojka, Z. The role of intermediate calcium aluminate phases in solid state synthesis of mayenite (Ca12Al14O33). Funct. Mater. Lett. 2011, 4, 183–186. [Google Scholar] [CrossRef]
- Gotor, F.J.; Criado, J.M.; Malek, J.; Koga, N. Kinetic Analysis of Solid-State Reactions: The Universality of Master Plots for Analyzing Isothermal and Nonisothermal Experiments. J. Phys. Chem. A 2000, 104, 10777–10782. [Google Scholar] [CrossRef]
- Kissinger, H.E. Variation of Peak Temperature with Heating Rate in Differential Thermal Analysis. J. Res. Natl. Bur. Stand. 1956, 57, 217–221. [Google Scholar] [CrossRef]
- Jena, A.K.; Chaturvedi, M.C. Phase Transformations in Materials; Gernot, K., Ed.; Prentice Hall: Upper Saddle River, NJ, USA, 1991; p. 724. [Google Scholar]
- Fotsing, E.R. Phase Transformation Kinetics and Microstructure of Carbide and Diboride Based Ceramics Day of the Oral Examination. Ph.D. Thesis, Technische Universitat Clausthal, Clausthal-Zellerfeld, Germany, 2005. [Google Scholar]
- Khawam, A.; Flanagan, D.R. Solid-State Kinetic Models: Basics and Mathematical Fundamentals. J. Phys. Chem. B 2006, 110, 17315–17328. [Google Scholar] [CrossRef] [PubMed]
- Lee, S.-J.; Benson, E.A.; Kriven, W.M. Preparation of Portland Cement Components by Poly(vinyl alcohol) Solution Polymerization. J. Am. Ceram. Soc. 1999, 82, 2049–2055. [Google Scholar] [CrossRef]
- Kim, S.; Miyakawa, M.; Hayashi, K.; Sakai, T.; Hirano, M.; Hosono, H. Simple and Efficient Fabrication of Room Temperature Stable Electride: Melt-Solidification and Glass Ceramics. J. Am. Chem. Soc. 2005, 127, 1370–1371. [Google Scholar] [CrossRef] [PubMed]
- Jiang, D.; Zhao, Z.; Mu, S.; Phaneuf, V.; Tong, J. Simple and Efficient Fabrication of Mayenite Electrides from a Solution-Derived Precursor. Inorg. Chem. 2007, 56, 11702–11709. [Google Scholar] [CrossRef] [PubMed]
- Salasin, J.R.; Schwerzeler, S.E.; Koehler, M.R.; Keffer, D.J.; Rawn, C.J. The Effect of Process Parameters on the Amorphous Citrate Sol-gel Synthesis of Cu-doped Ca12Al14O33. Materialia 2018. in submission. [Google Scholar]
- Degen, T.; Sadki, M.; Bron, U.K.E.; Nénert, G. The HighScore suite. Powder Diffr. 2014, 29, S13–S18. [Google Scholar] [CrossRef] [Green Version]
- Van Bael, M.K.; Hardy, A.; Mullens, J. Aqueous Precursor Systems. In Chemical Solution Deposition of Functional Oxide Thin Films; Schneller, T., Waser, R., Eds.; Springer: Vienna, Austria, 2013; pp. 93–140. [Google Scholar]
- Gfellar, F. Mayenite Ca12Al14O33: From Minerals to the first stable electride crystals. In Highlights in Mineralogical Crystallography; Thomas, A., Rosa, D., Eds.; De Gruyter: Berlin, Germany, 2016. [Google Scholar]
- Eremin, N.N.; Grechanovsky, A.E.; Marchenko, E.I. Atomistic and Ab Initio Modeling of CaAl2O4 High-Pressure Polymorphs under Earth’s Mantle Conditions. Cryst. Rep. 2016, 61, 432–443. [Google Scholar] [CrossRef]
- Jeevaratnam, J.; Glasser, F.P.; Glasser, L.S.D. Anion Substitution and Structure of 12CaO·7Al2O3. J. Am. Ceram. Soc. 1964, 47, 105–106. [Google Scholar] [CrossRef]
- Mondal, P.; Jeffery, A.J.W. The Crystal Structure of Tricalclium Aluminate, Ca3Al2O6. Acta Cryst. Sect. B 1975, 31, 689–696. [Google Scholar] [CrossRef]
- Hayashi, K.; Hirano, M.; Hosono, H. Thermodynamics and Kinetics of Hydroxide Ion Formation in 12CaO·7Al2O3. J. Phys. Chem. B 2005, 109, 11900–11906. [Google Scholar] [CrossRef] [PubMed]
- Ruszak, M.; Marek, A.E.; Ae, I.; Witkowski, S.; Marcin, A.E.; Ae, W.; Ae, A.K.; Sojka, Z. Selective N2O Removal from the Process Gas of Nitric Acid Plants over Ceramic 12CaO·7Al2O3 Catalys. Catal. Lett. 2008, 126, 72–77. [Google Scholar] [CrossRef]
- Intiso, A.; Cucciniello, R.; Castiglione, S.; Proto, A.; Rossi, F. Environmental Application of Extra-Framework Oxygen Anions in the Nano-Cages of Mayenite. In Advances in Bionanomaterials; Piotto, S., Rossi, F., Eds.; Springer: Berlin, Germany, 2018; pp. 131–139. [Google Scholar]
Figure 1.
master plot. Recreated from [8].
Figure 1.
master plot. Recreated from [8].

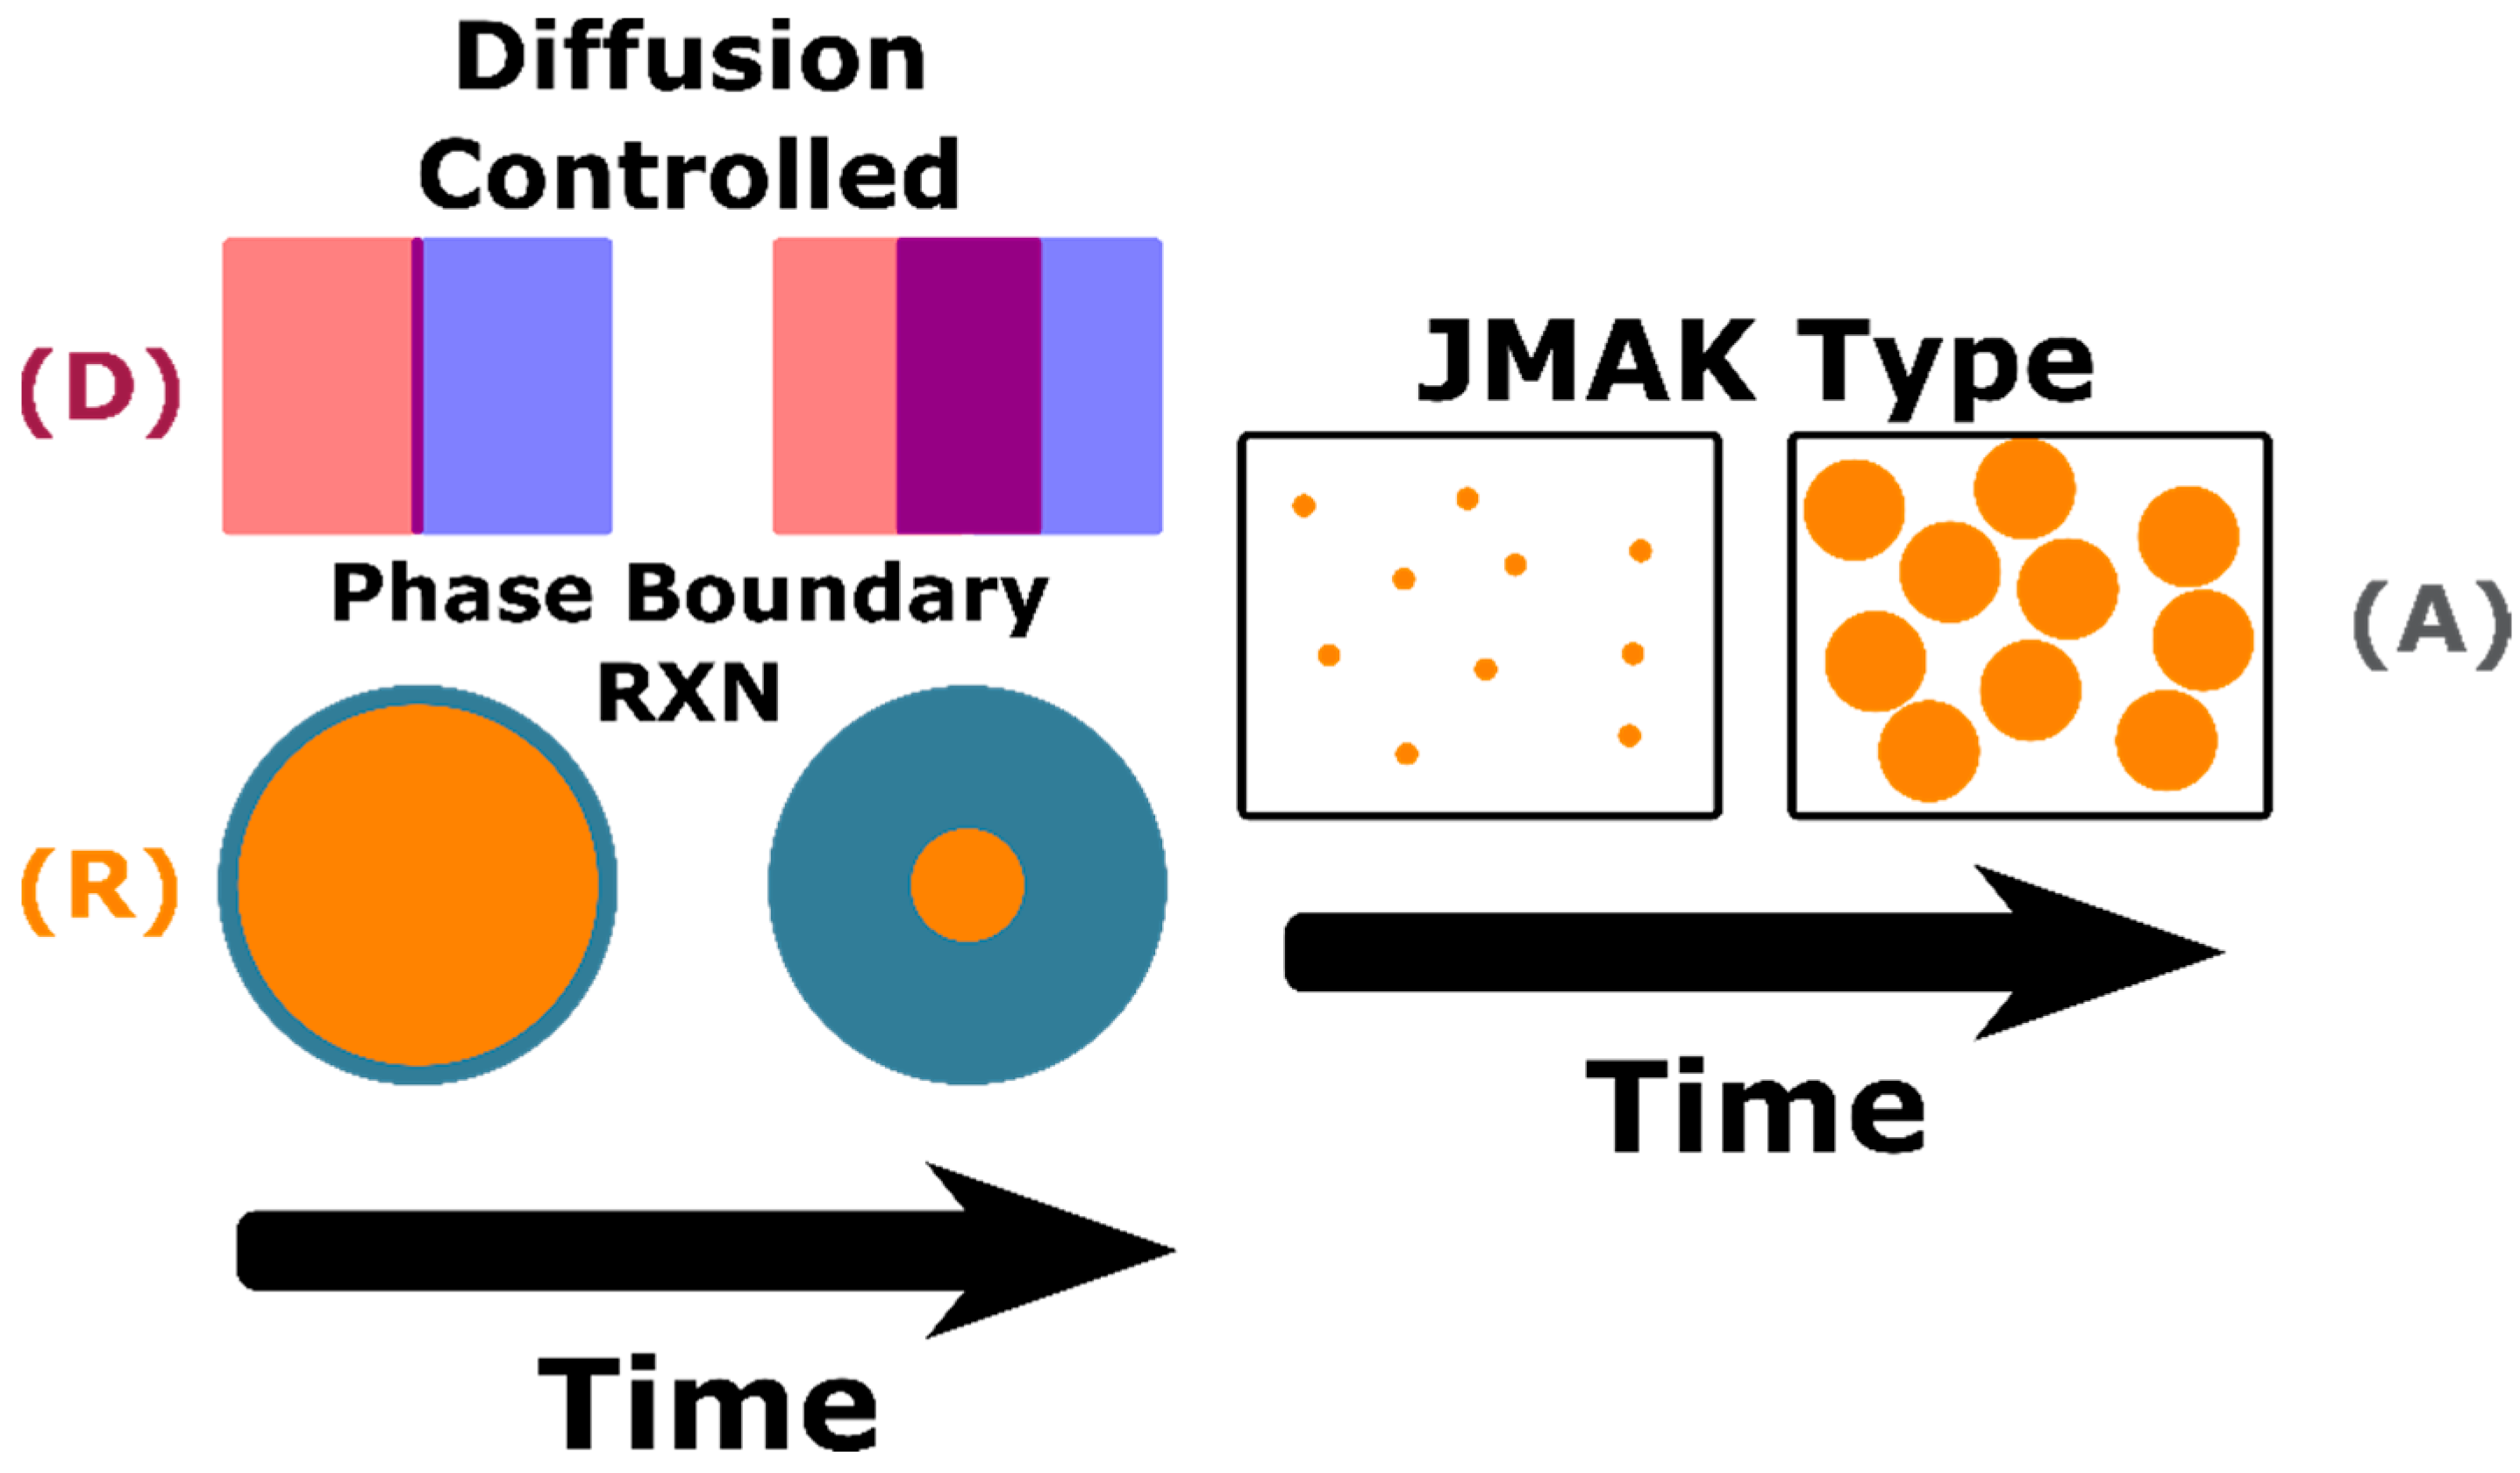
Figure 2.
Physical representation of JMAK, heterogenous diffusion, and geometric contraction kinetic transformations. RXN is an abbreviation for reaction.
Figure 2.
Physical representation of JMAK, heterogenous diffusion, and geometric contraction kinetic transformations. RXN is an abbreviation for reaction.

Figure 3.
HTXRD data showing peak evolution (left) and quantitative phase determination (right) of high heterogeneous as-synthesized SSS, low heterogenous milled SSS, and homogenous PVA (isochronal and isothermal) reactants under ambient conditions.
Figure 3.
HTXRD data showing peak evolution (left) and quantitative phase determination (right) of high heterogeneous as-synthesized SSS, low heterogenous milled SSS, and homogenous PVA (isochronal and isothermal) reactants under ambient conditions.

Figure 4.
Isothermal master plot of C12A7 formation from as-received solid-state reactants (left) and PVA reactants (right).
Figure 4.
Isothermal master plot of C12A7 formation from as-received solid-state reactants (left) and PVA reactants (right).

Figure 5.
For the isothermal PVA investigation under ambient conditions the fit of the Avrami model to α (orange markers) is observed in red with an n value of 1.81(5) and rate constant of 3.6(2) × 10−7 s−1, and the change of microstructural crystallite size (black markers) shows a linear relationship (green trend line), yielding a radial growth rate of 5.0(5) × 10−13 m/s.

Figure 6.
HTXRD data showing peak evolution (left) and quantitative phase determination (right) of high heterogenous as-synthesized SSS, low heterogenous milled SSS, homogeneous PVA (isochronal and isothermal) reactants under dry conditions.
Figure 6.
HTXRD data showing peak evolution (left) and quantitative phase determination (right) of high heterogenous as-synthesized SSS, low heterogenous milled SSS, homogeneous PVA (isochronal and isothermal) reactants under dry conditions.

Figure 7.
(A) Isothermal master plot of C5A3 formation (blue markers) from as-received solid-state reactants (top), (B) initial C12A7/C5A3 formation (middle left) and (C) later C12A7 decomposition and C5A3 formation (middle right) from milled solid-state reactants, and (D) PVA reactants (bottom) under dry conditions.

Figure 8.
For the isothermal PVA investigation under dry conditions the fit of the Avrami model to α (orange markers) is observed in red with an n value of 1.54(3) and rate constant of 1.3(3) × 10−5 s−1, and the change of microstructural crystallite size (black markers) shows a clear two stage growth mechanism with linear relationships (green trend lines), yielding a radial growth rates of 5.0(7) × 10−12 m/s and 7.5(2) × 10−13 m/s for the first and second growth stages, respectively.

Figure 9.
HTXRD data showing peak evolution (left) and quantitative phase determination (right) of high heterogenous as-synthesized SSS and PVA (isochronal and isothermal) reactants under vacuum conditions.
Figure 9.
HTXRD data showing peak evolution (left) and quantitative phase determination (right) of high heterogenous as-synthesized SSS and PVA (isochronal and isothermal) reactants under vacuum conditions.

Figure 10.
Isothermal master plot of CA formation from as-received solid-state reactants (left) and C12A7 formation from PVA reactants (right) under vacuum conditions.
Figure 10.
Isothermal master plot of CA formation from as-received solid-state reactants (left) and C12A7 formation from PVA reactants (right) under vacuum conditions.

Figure 11.
For the isothermal PVA investigation under vacuum conditions the fit of the Avrami model to α (orange markers) is observed in red with an n value of 1.2(3) and rate constant of 1.8(3) × 10−4 s−1, and the change of microstructural crystallite size (black markers) shows a clear two stage growth mechanism with linear relationships (green trend lines), yielding a radial growth rate of 1.0(4) × 10−11 m/s and 4.8(3) × 10−13 m/s for the first and second growth stages, respectively.

Figure 12.
Schematic of reactant homogeneity with Ca species in gray and Al species in orange. High heterogenous solid-state reactants (A), low heterogeneity milled solid state reactants (B), and amorphous atomically homogeneity polymer assisted sol-gel reactants (C). The white circles in the high heterogenous reactant particles demonstrate the blind region of stoichiometry whose diffusion pathways are too long to effectively play a role in the phase formation reactions.

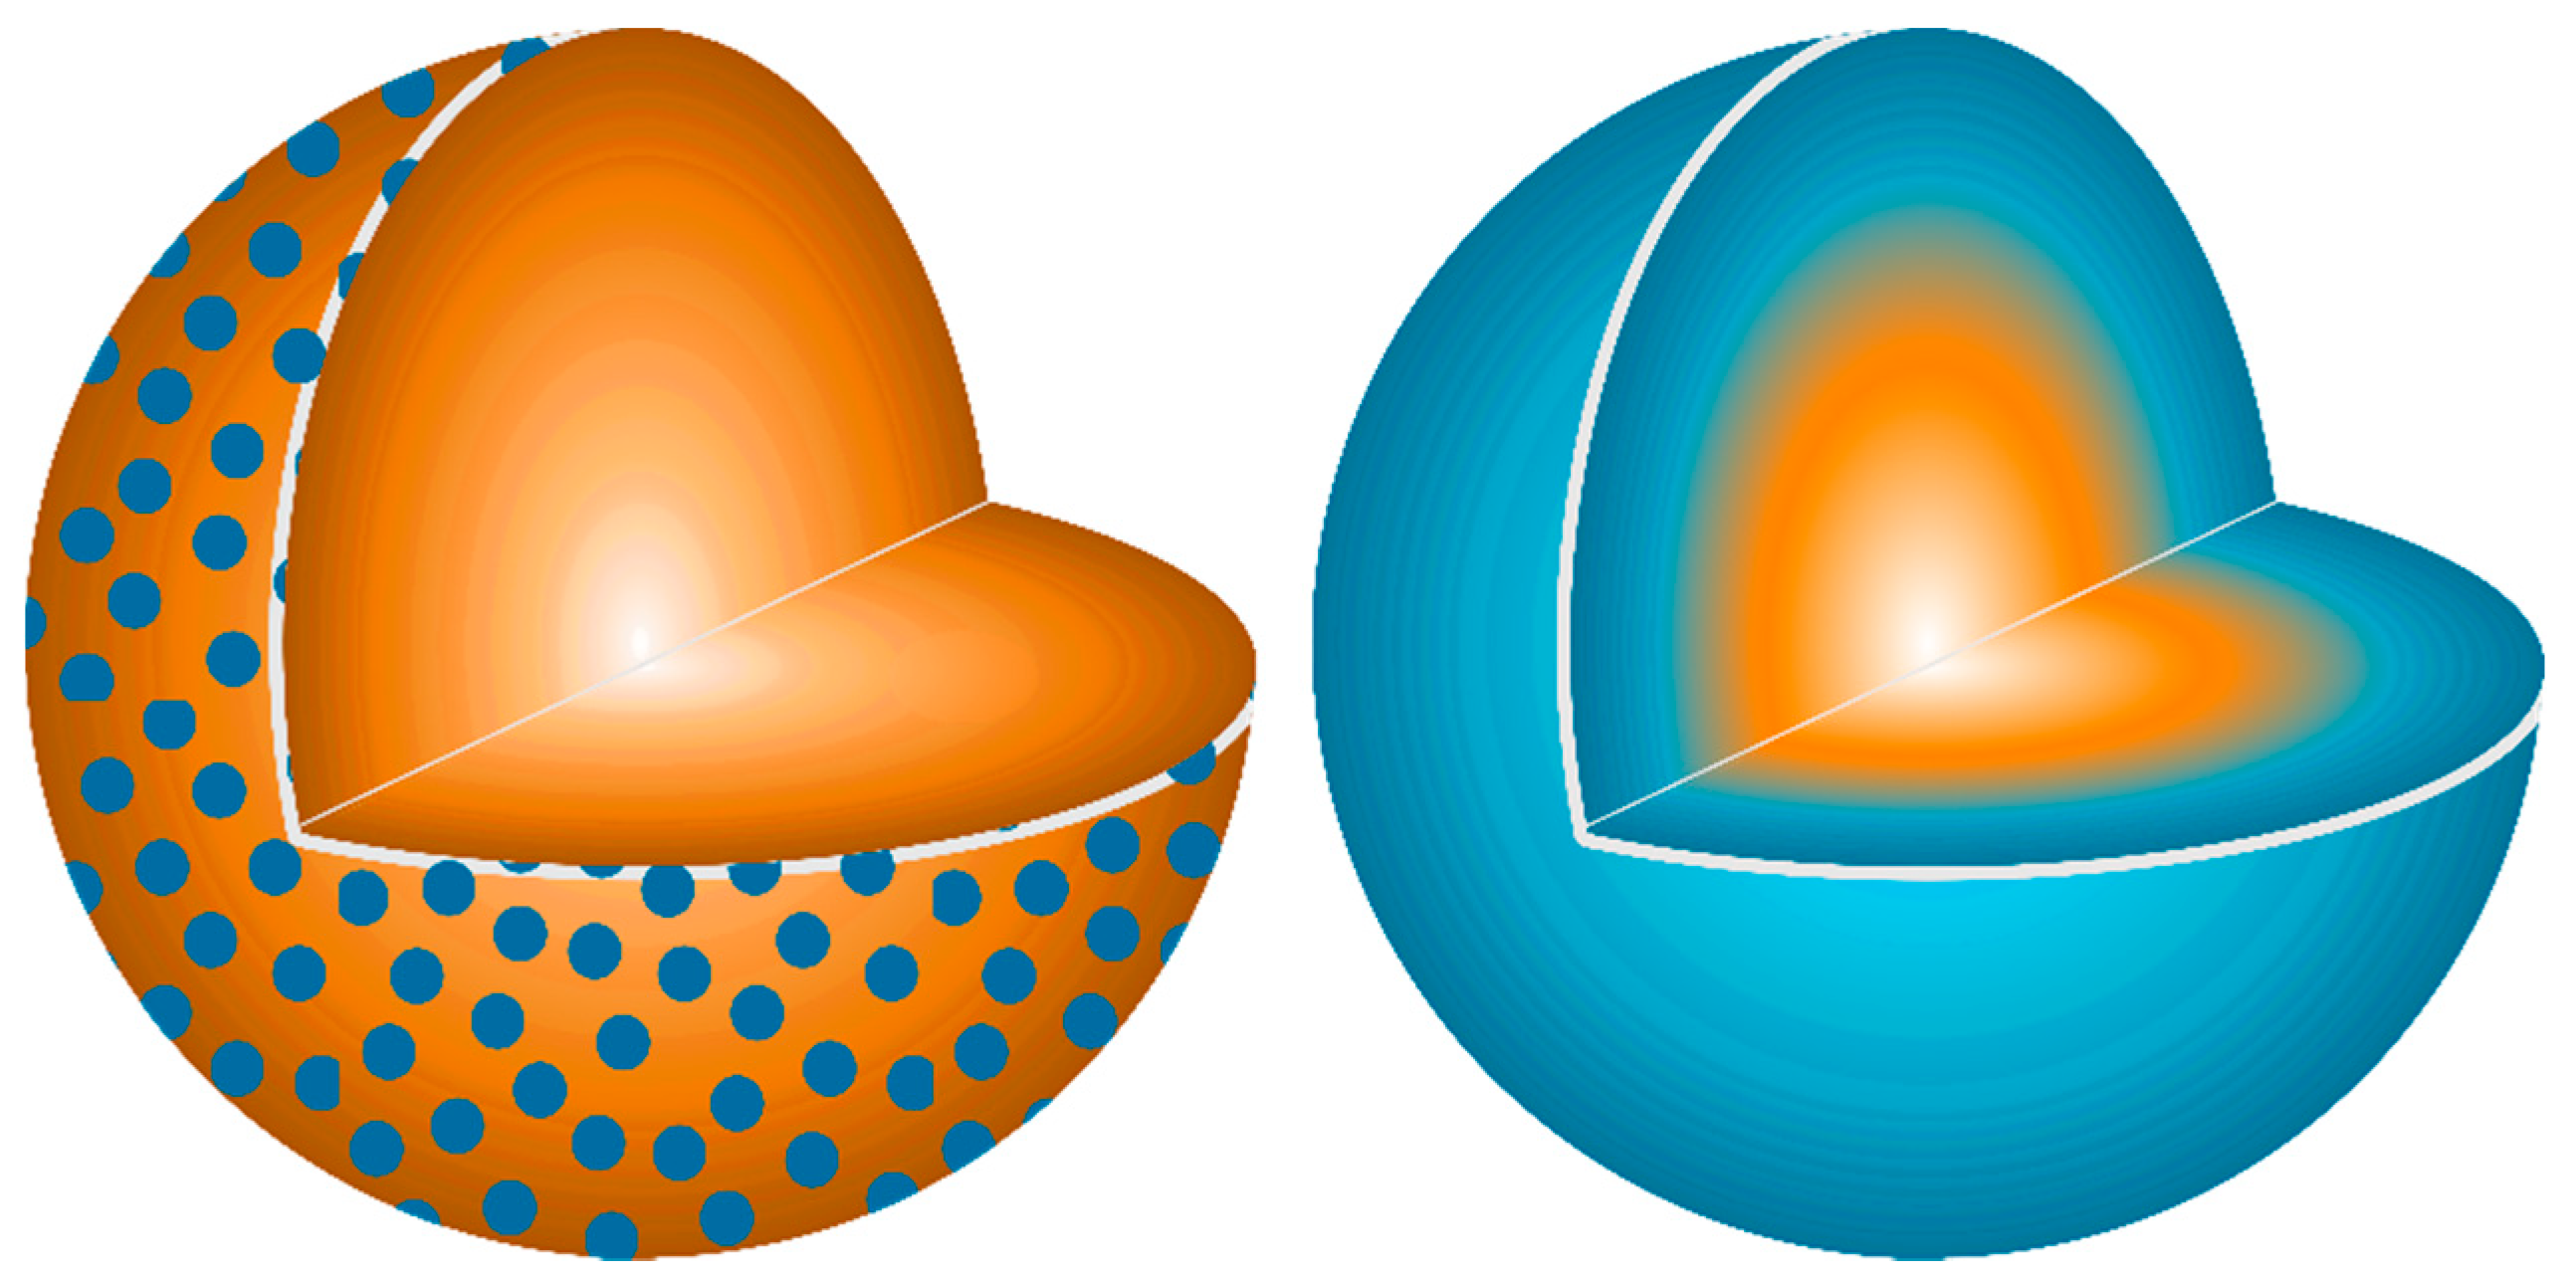
Figure 13.
Schematic representation of JMAK nucleation (left) and particle conversion (right) of C12A7 to C5A3 (observed under dry conditions). As the transformation proceeds with increased time the kinetic formation proceeds from nucleation to particle conversion.
Figure 13.
Schematic representation of JMAK nucleation (left) and particle conversion (right) of C12A7 to C5A3 (observed under dry conditions). As the transformation proceeds with increased time the kinetic formation proceeds from nucleation to particle conversion.


Table 1.
representing the main models for solid-state kinetic transformations. Recreated from [8].
Table 1.
representing the main models for solid-state kinetic transformations. Recreated from [8].
| Kinetic Mechanism | Symbol | |
|---|---|---|
| Phase Boundary Controlled (2D) | R2 | |
| Phase Boundary Controlled Reaction (3D) | R3 | |
| Unimolecular decay law (instantaneous nucleation and 1D growth) | F1 | |
| Random nucleation and growth (JMAK model) | Am | |
| 2D diffusion | D2 | |
| 3D diffusion (Jander equation) | D3 | |
| 3D diffusion (Ginstein-Brounshtein equation) | D4 |
Table 2.
Analysis of JMAK exponent for all possible growth scenarios. Reproduced and updated from Fotsing [11].
Table 2.
Analysis of JMAK exponent for all possible growth scenarios. Reproduced and updated from Fotsing [11].
| Dimensionality | Nucleation Model | Interface Controlled Transformation (m = 1) | Diffusion Controlled Transformation (m = 2) |
|---|---|---|---|
| 3-D (d = 3) | Site Saturation | 3 | 1.5 |
| Continuous Nucleation | 4 | 2.5 | |
| Decreasing Nucleation | 3–4 | 1.5–2.5 | |
| 2-D (d = 2) | Site Saturation | 2 | 1 |
| Continuous Nucleation | 3 | 2 | |
| Decreasing Nucleation | 2–3 | 1–2 | |
| 1-D (d = 1) | Site Saturation | 1 | 0.5 |
| Continuous Nucleation | 2 | 1.5 | |
| Decreasing Nucleation | 1–2 | 0.5–1.5 |
Table 3.
HTXRD characterization experimental information as a function of reactant homogeneity and process atmosphere. Characterization type is described in matrix style and denotes the type of data collection (isochronal during ramping or isothermal at ultimate temperature) and ultimate process temperature.
| Process Atmosphere | ||||
|---|---|---|---|---|
| Reactant Mixture | Ambient | Dry | Vacuum | |
| High Heterogeneity (SSS Reactants) | Isochronal to 1200 °C followed by isothermal dwell | Isochronal to 1200 °C followed by isothermal dwell | Isochronal to 1200 °C followed by isothermal dwell | |
| Low Heterogeneity (Milled SSS Reactants) | Isochronal to 1200 °C followed by isothermal dwell | Isochronal to 1200 °C followed by isothermal dwell | ||
| Atomically Homogenous (Calcined Sol-gel Reactants) | Isochronal to 1100 °C followed by isothermal dwell + Isochronal to 850 °C followed by Isothermal dwell | Isochronal to 1100 °C followed by isothermal dwell + Isochronal to 900 °C followed by Isothermal dwell | Isochronal to 1100 °C followed by isothermal dwell + Isochronal to 960 °C followed by Isothermal dwell | |
© 2018 by the authors. Licensee MDPI, Basel, Switzerland. This article is an open access article distributed under the terms and conditions of the Creative Commons Attribution (CC BY) license (http://creativecommons.org/licenses/by/4.0/).
Share and Cite
MDPI and ACS Style
Salasin, J.R.; Rawn, C. In-Situ Kinetic Investigation of Calcium Aluminate Formation. Ceramics 2018, 1, 175-197. https://doi.org/10.3390/ceramics1010016
AMA Style
Salasin JR, Rawn C. In-Situ Kinetic Investigation of Calcium Aluminate Formation. Ceramics. 2018; 1(1):175-197. https://doi.org/10.3390/ceramics1010016
Chicago/Turabian StyleSalasin, John Robert, and Claudia Rawn. 2018. "In-Situ Kinetic Investigation of Calcium Aluminate Formation" Ceramics 1, no. 1: 175-197. https://doi.org/10.3390/ceramics1010016